Optimizing Evaluation Systems for Industrial Land Inefficiency: A Pattern-Sensitive Framework Integrating Expert Knowledge and Machine Learning

Abstract
1. Introduction
2. Literature Review
3. Materials and Methods
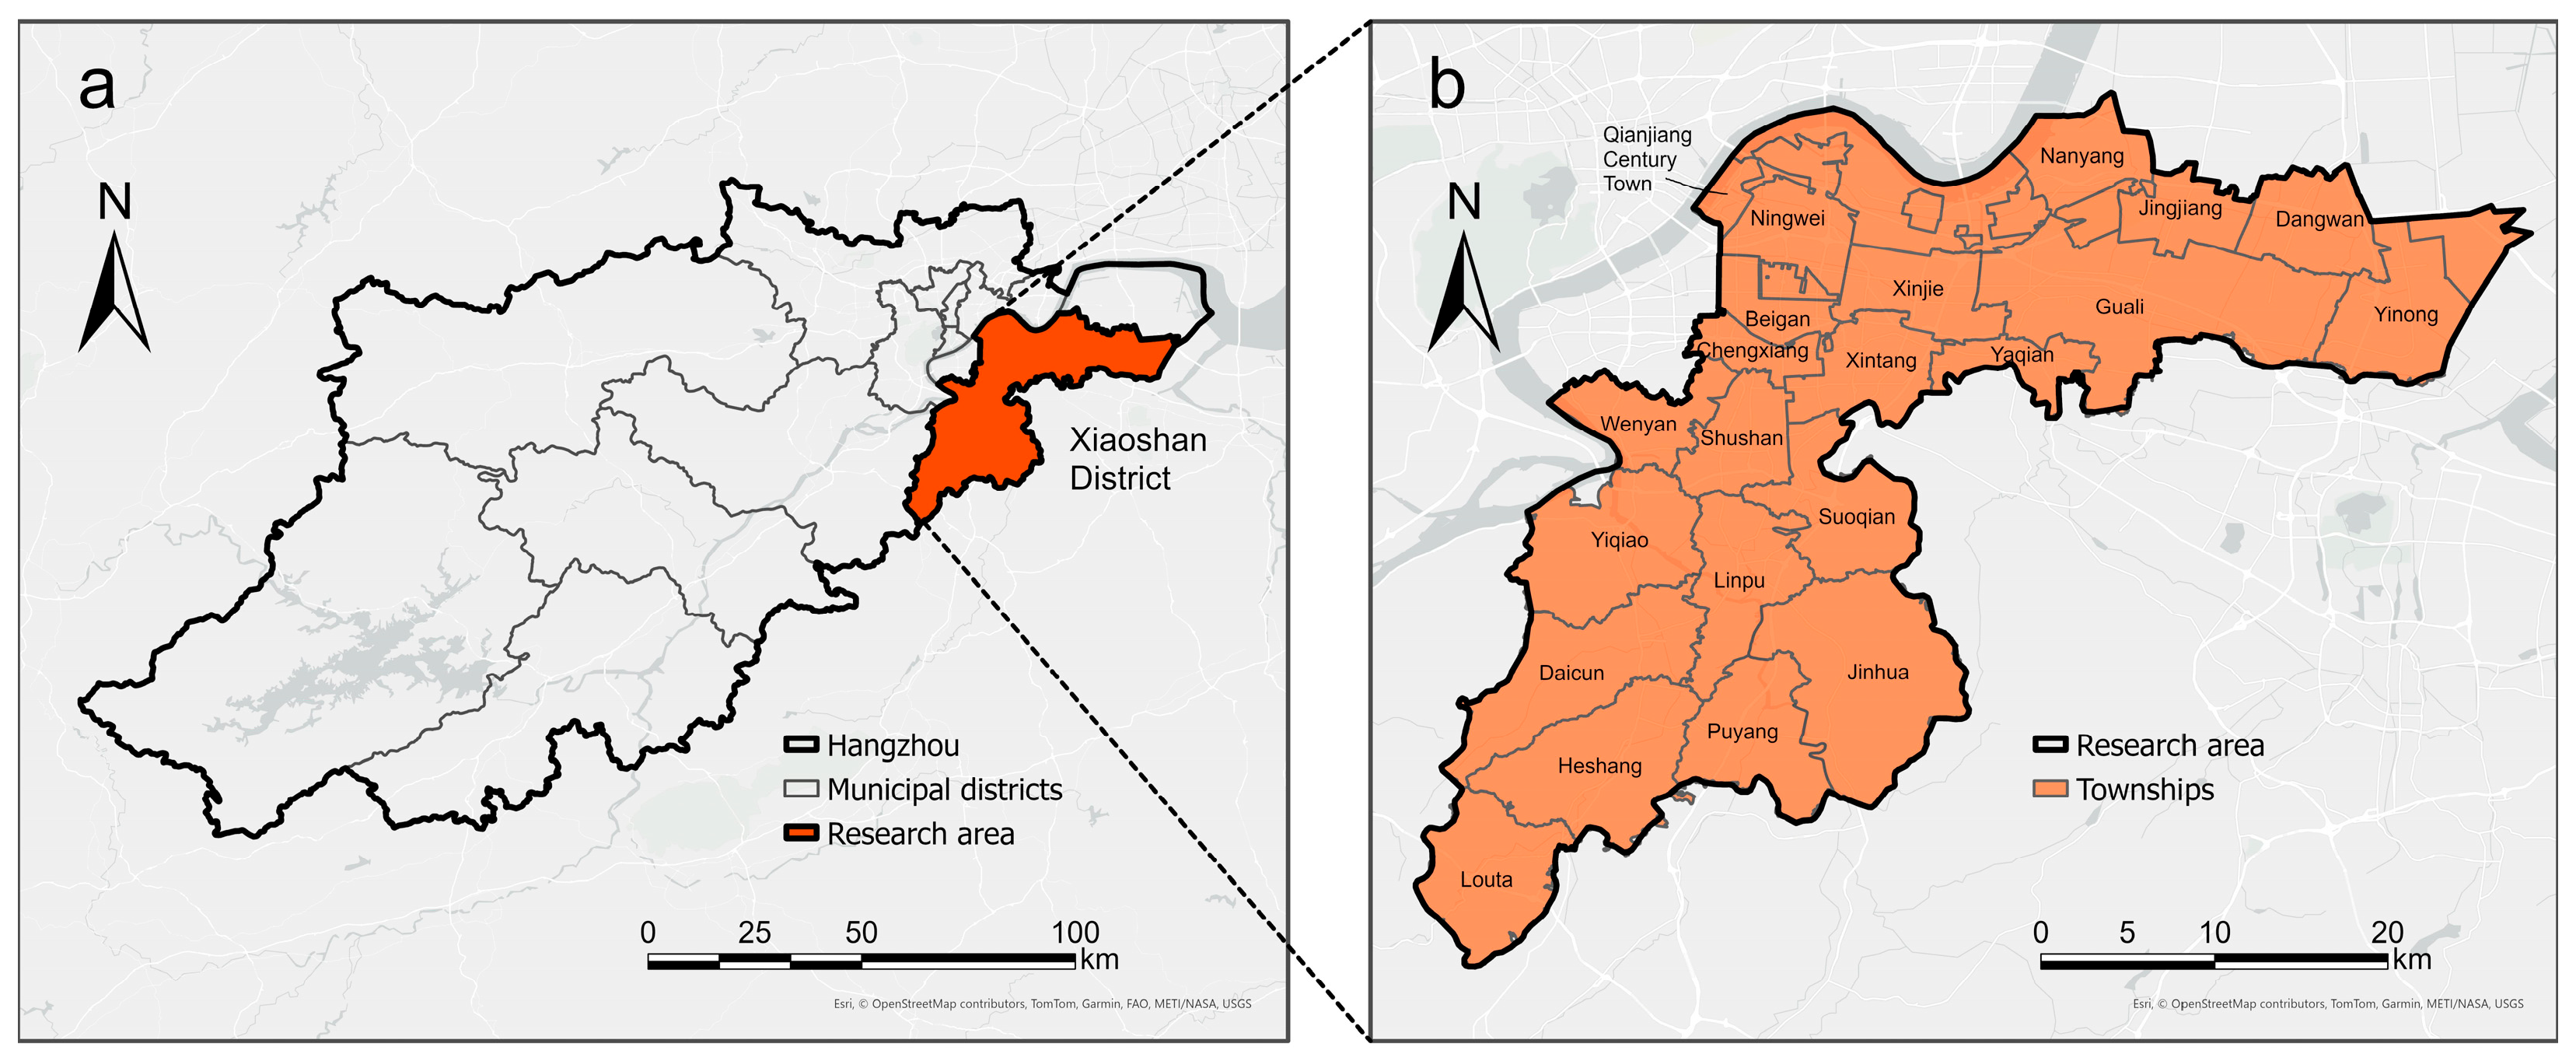
3.1. Research Area
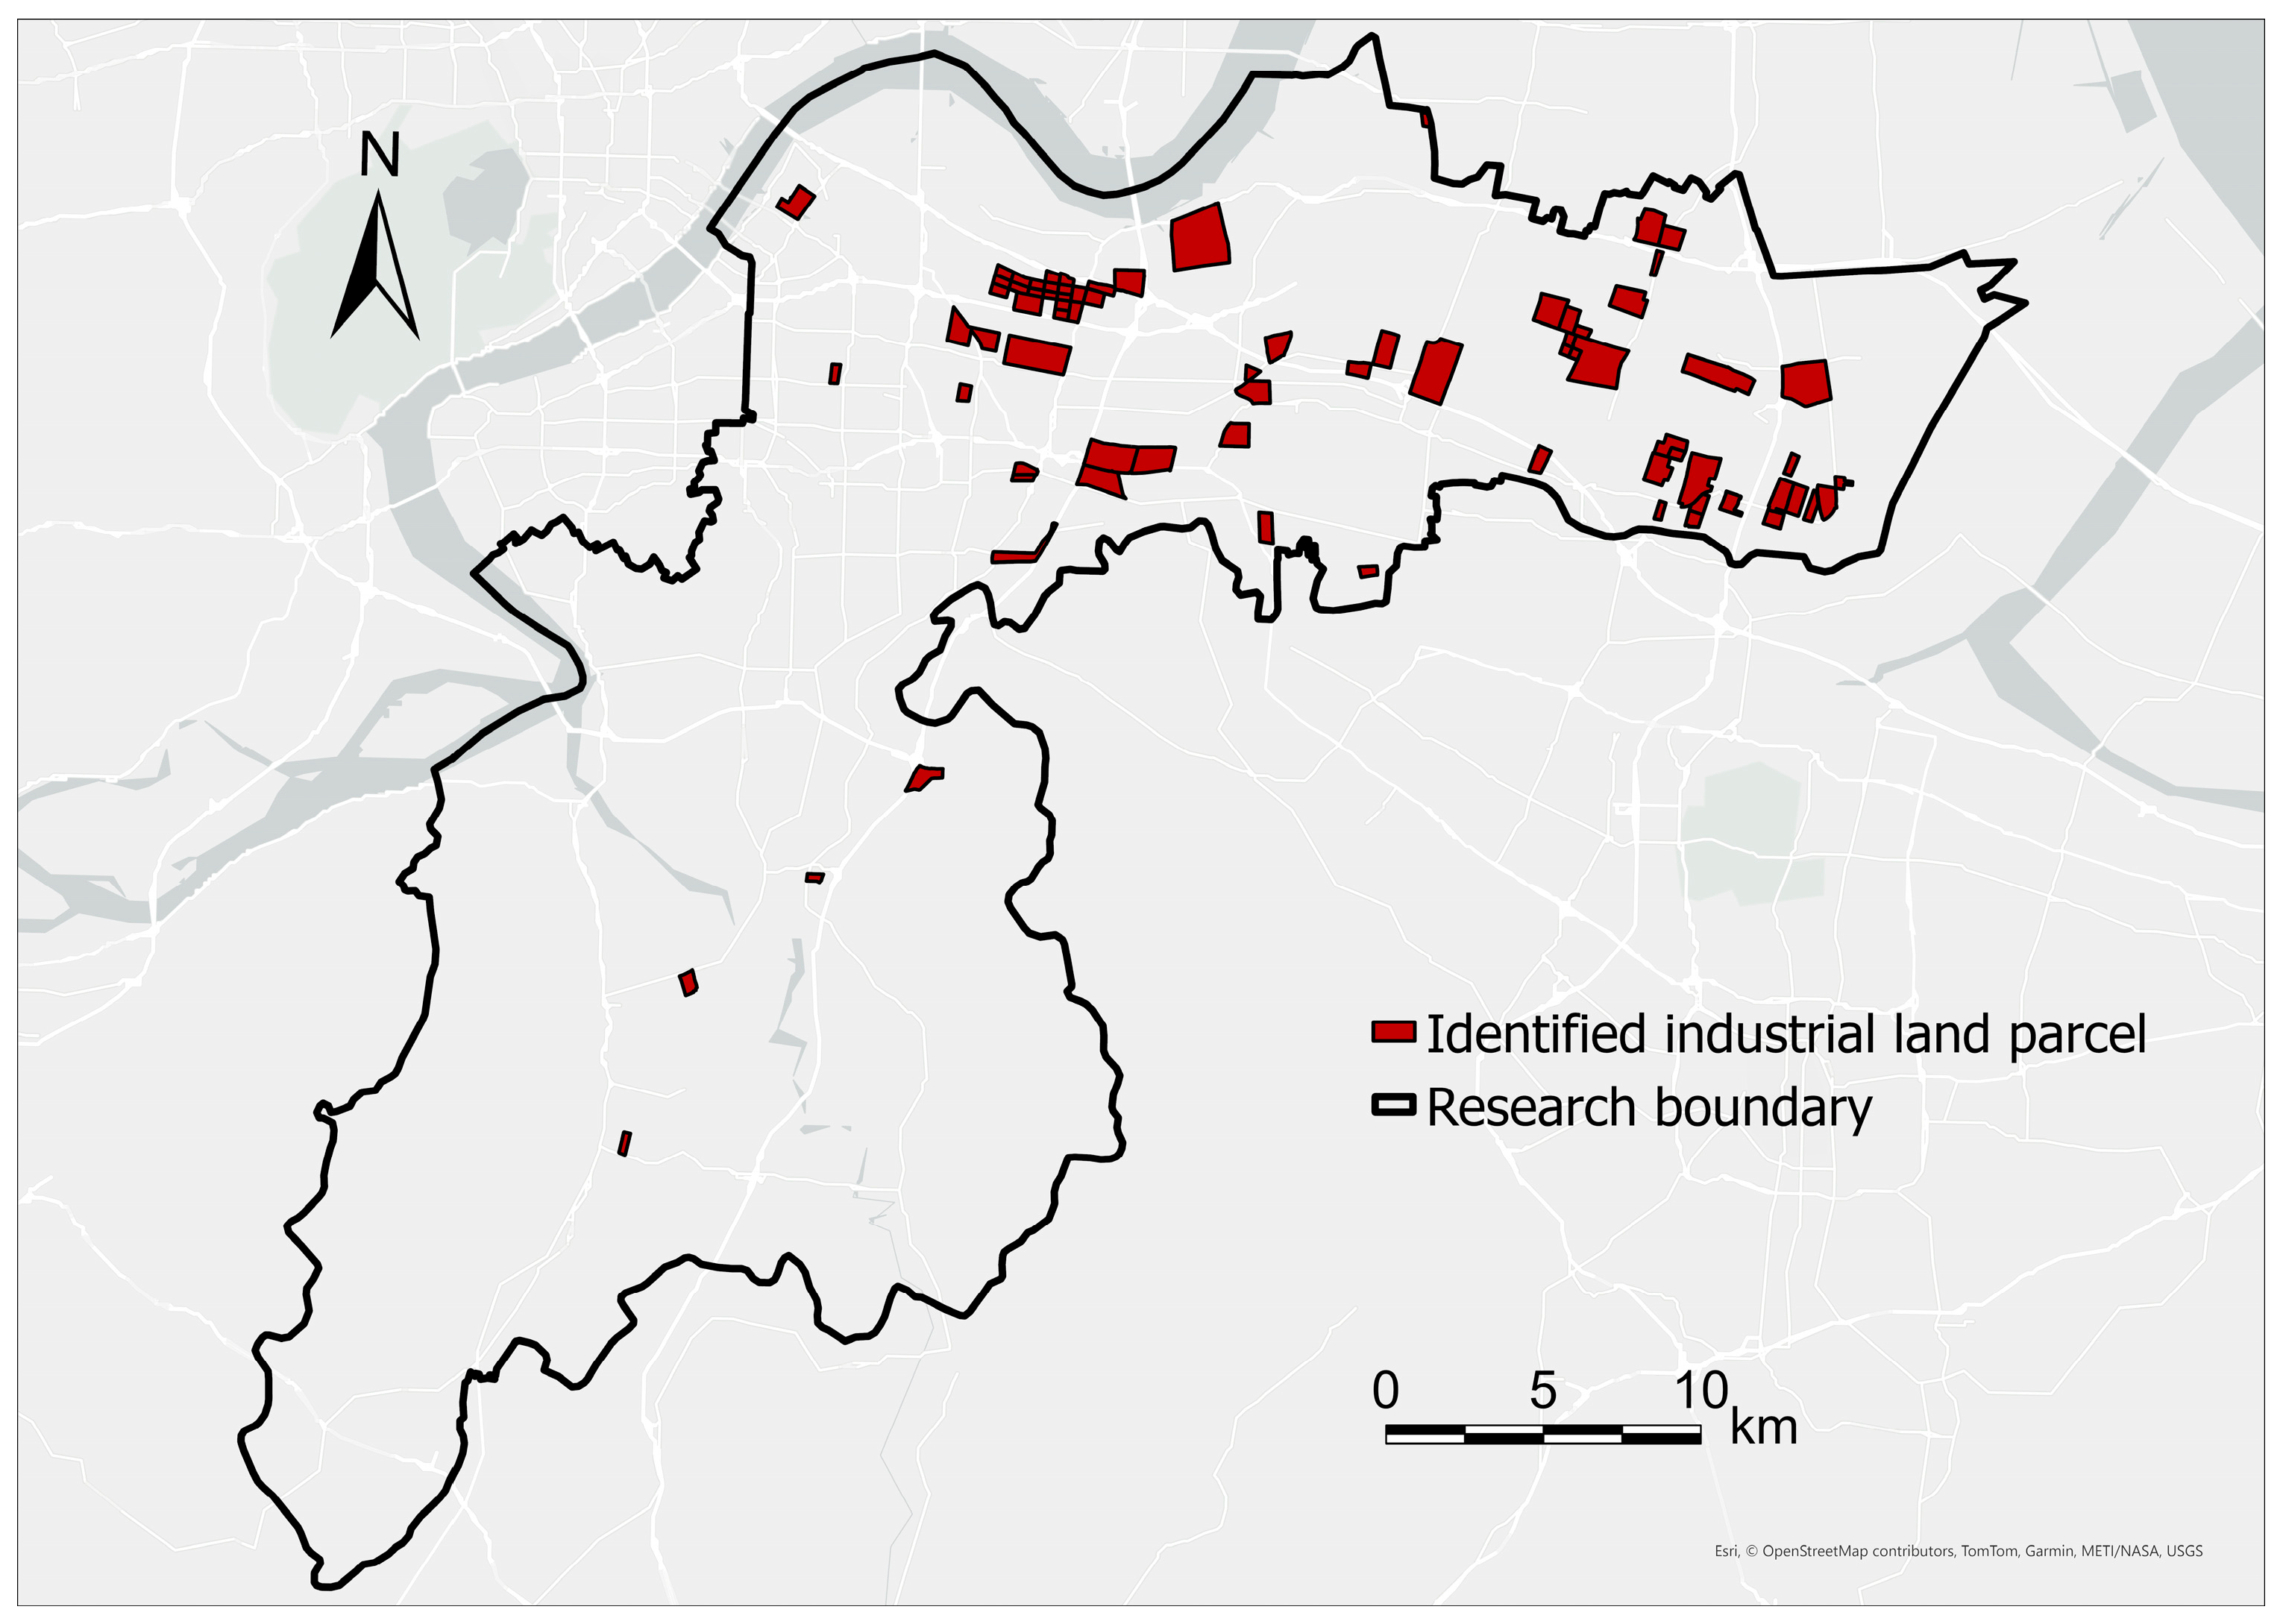
3.2. Industrial Land Identification and Land Use Inefficiency Indicator
3.3. Preliminary Selection of the Evaluation System

| Dimensions | Description | Indicators | Data Source |
|---|---|---|---|
| Intrinsic Parcel Attributes | Inadequate land use intensity | Floor Area Ratio (FAR) ↓ | FAR of each parcel is calculated based on 3D-GloBFP (3D Global Building Footprints), which is a global dataset providing the height of individual buildings for the year 2020, created by integrating multi-source remote sensing data with advanced machine learning techniques [43]. |
| Low economic contribution and development potential | Benchmark Land Price (BLP) ↓ | Hangzhou Municipal Bureau of Land and Resources. | |
| Low intensity of human and economic activity | Nighttime Light (NTL) ↓ | 2022 and 2023 annual average VIIRS nighttime lights data from the Earth Observation Group (EOG), a temporally consistent product with a 15 arc-second resolution derived from monthly cloud-free composites [44]. | |
| High degree of parcel irregular shape fragmentation | Landscape Shape Index (LSI) ↑ | Shape Index (SHAPE) metric calculated by Fragstats v4.2.1 software, which measures the regularity of a polygon’s shape by averaging its edge curvature | |
| Surrounding Environmental Attributes | Inadequate planning and functional mix (work–life balance) | Residential & Industrial Land Use Mix (RIM) ↓ | The Shannon entropy of residential and industrial POI from Amap, both for 2022 and 2023 |
| Remoteness and poor access to regional centers | Network Distance to Regional Centers (NDC) ↑ | The network distance from each study parcel to regional centers (Qianjiang Century City and Xiaoshan Old Town), based on OpenStreetMap (OSM) road network data for 2022 and 2023 | |
| Low traffic accessibility from inefficient road network layout | Road Betweenness Centrality (RBC) ↓ | The betweenness centrality of each road node was calculated using Gephi 0.10.1 software based on the corrected OSM road networks for 2022 and 2023, and the average centrality value within each parcel was computed after spatial interpolation. | |
| Insufficient provision of regional infrastructure | Infrastructure POI Kernel Density (IKD) ↓ | The kernel density of Amap POIs of related to urban infrastructure (e.g., public utilities, charging stations, gas stations, and other energy facilities), both for 2022 and 2023 |
3.4. Analytic Hierarchy Process and Random Forest
3.5. Pattern-Sensitive Segmentation and Indicator Weight Optimization
- Model Fitting. A dedicated linear regression model is fitted to the data points within each current cluster . The model parameters are adapted by minimizing the sum of squared residuals within the cluster:
- Sample Reassignment. For every data point in the entire dataset, its prediction error with respect to each cluster’s regression model is calculated. The point is then reassigned to the cluster that yields the minimum error, updating its segment :
| Algorithm 1 Framework for Segmented Weight Optimization |
, , , . , . |
| Phase 1: Data Segmentation using Labeled Data |
| . do . repeat . . until cluster assignments converge . |
| . end for . |
| Phase 2: Per-Segment Weight Optimization with Data Augmentation |
| . . do . , . . . , . . for a set number of training steps do . . end for [k]. [k]. end for , end procedure |
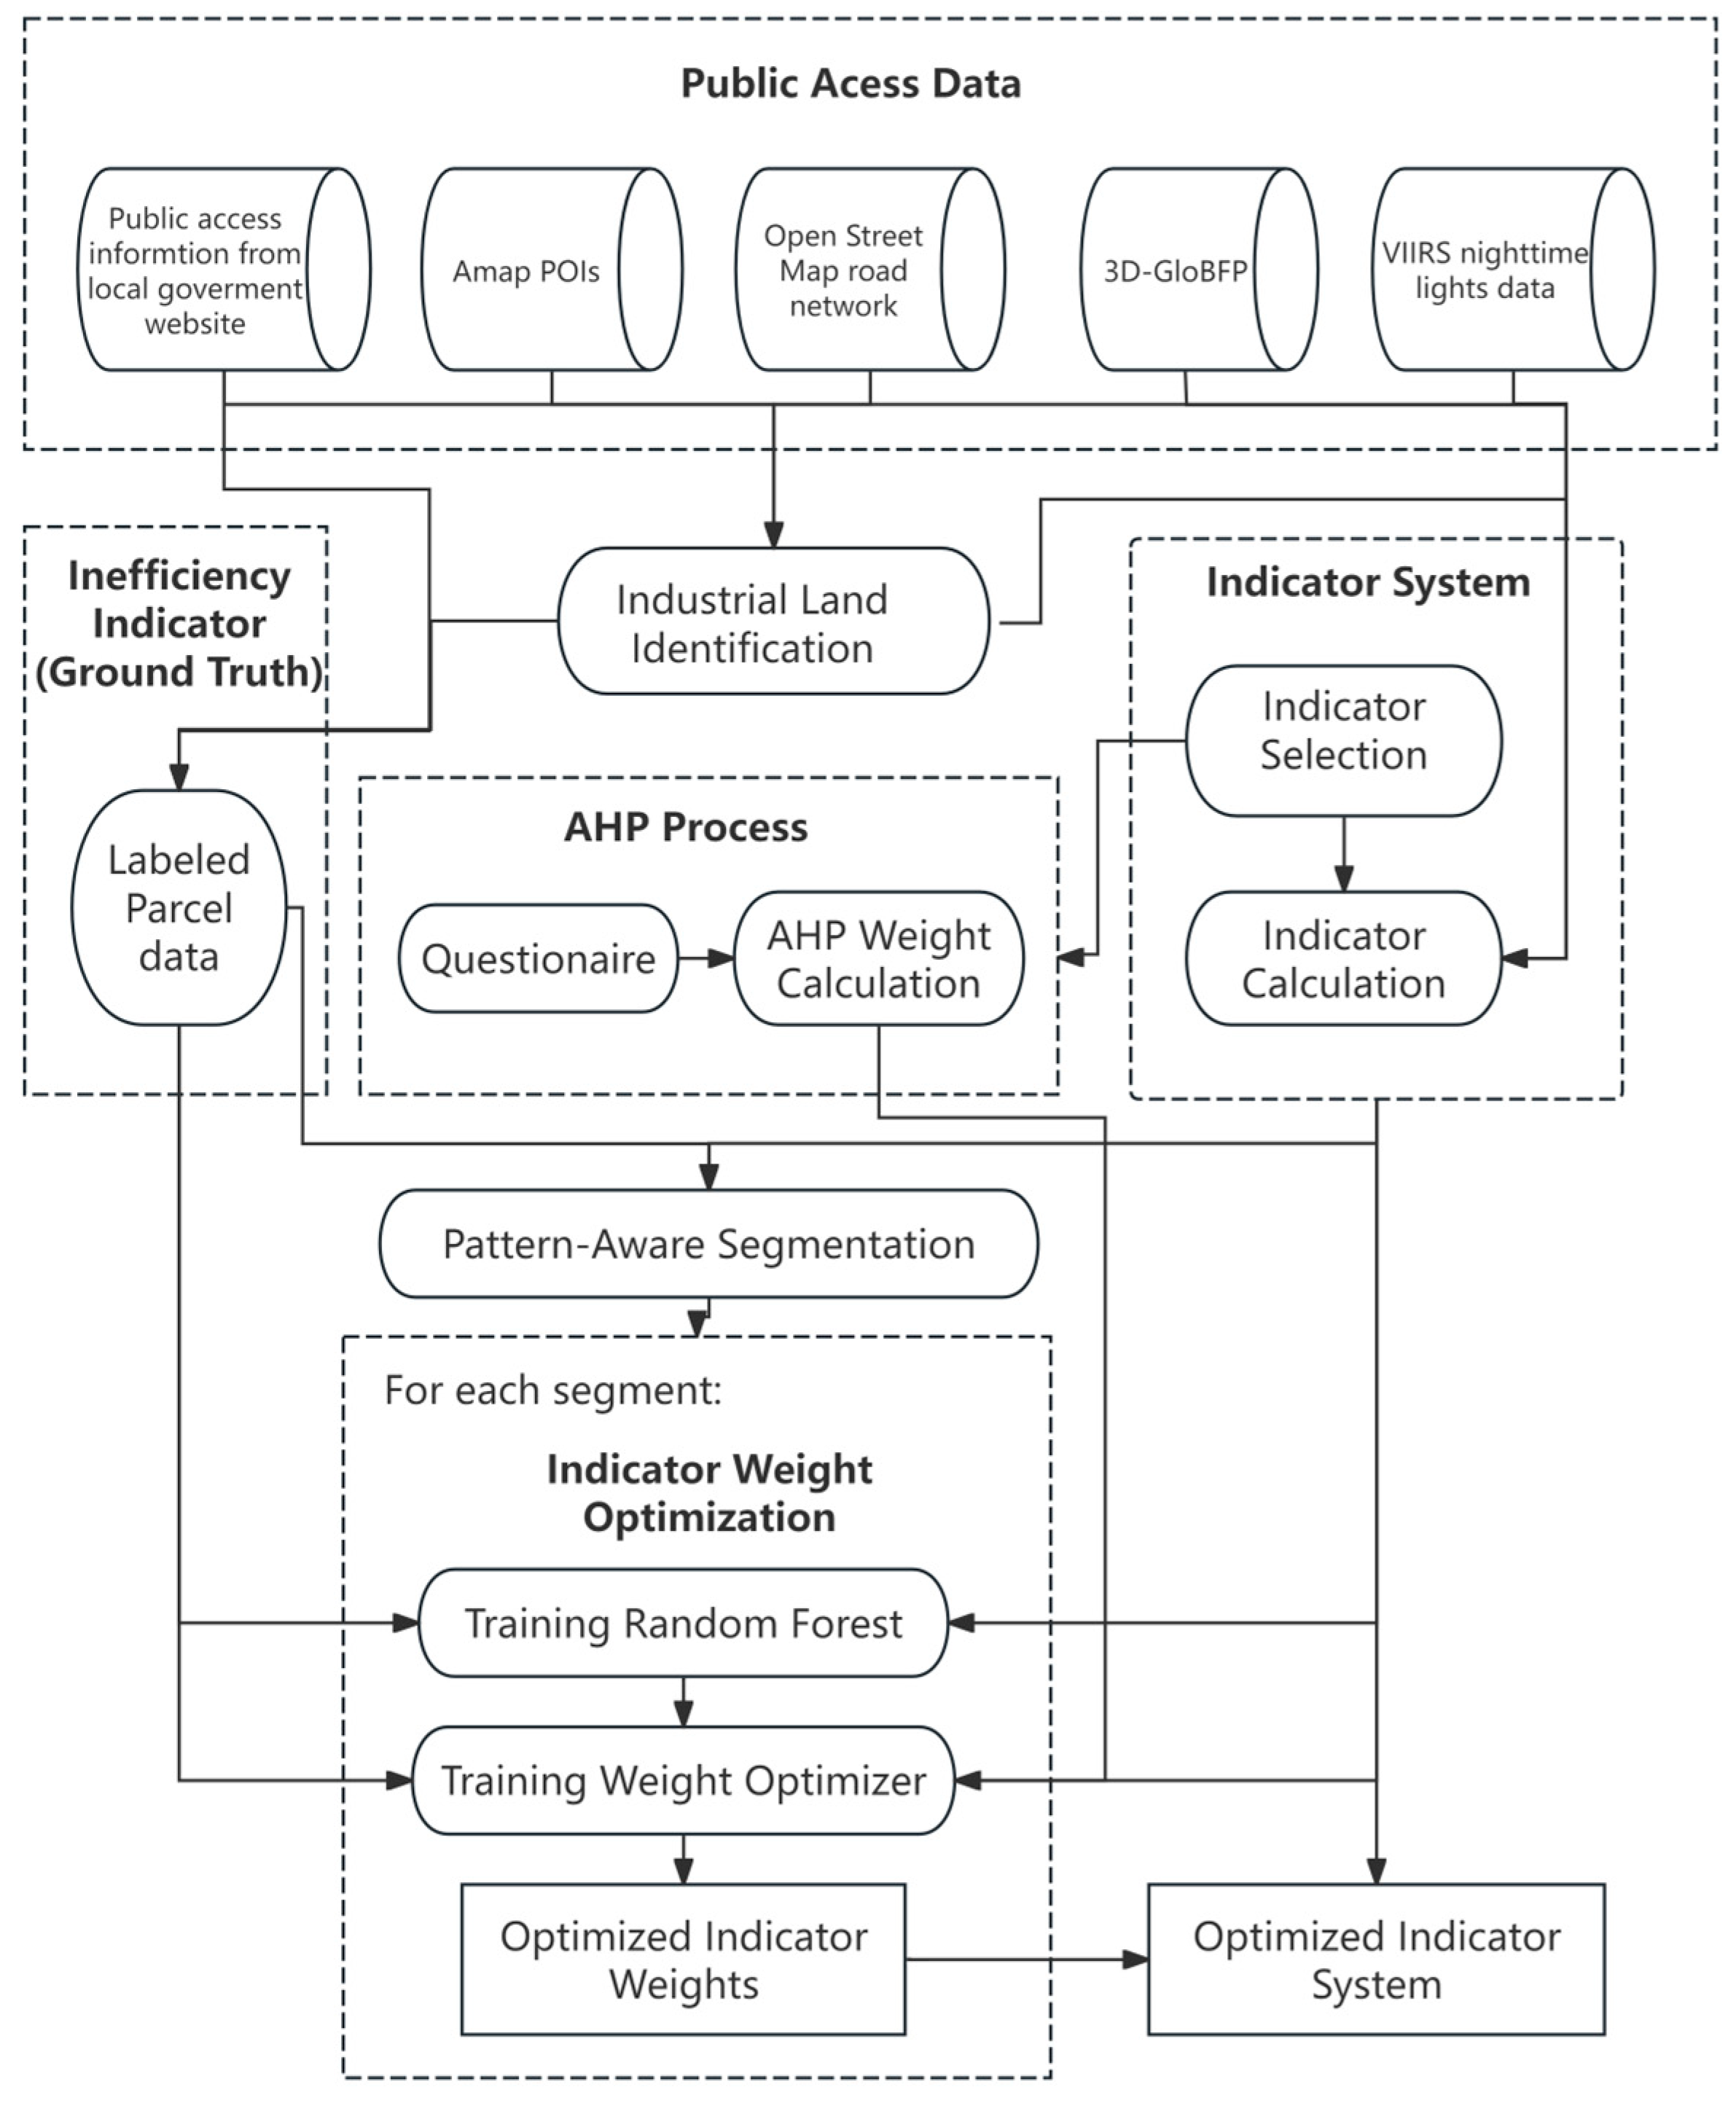
- Training the Random Forest (RF) model. The RF model is first trained on the labeled parcel data of the segment k (), where it captures the local data distribution from this limited dataset.
- Training the weight optimizer. To address limited labeled data, we employ a data augmentation strategy. Synthetic attribute vectors () are generated and merged with the original labeled features to construct an augmented input matrix (). Corresponding target values () are subsequently obtained by feeding into the pre-trained Random Forest (). A linear weight optimizer (), initialized with expert-derived weights (), is then trained on to fit . This optimization minimizes a composite loss function () comprising a Pearson correlation-based objective for target alignment and a regularization term to constrain deviations from expert-derived weights.
4. Results
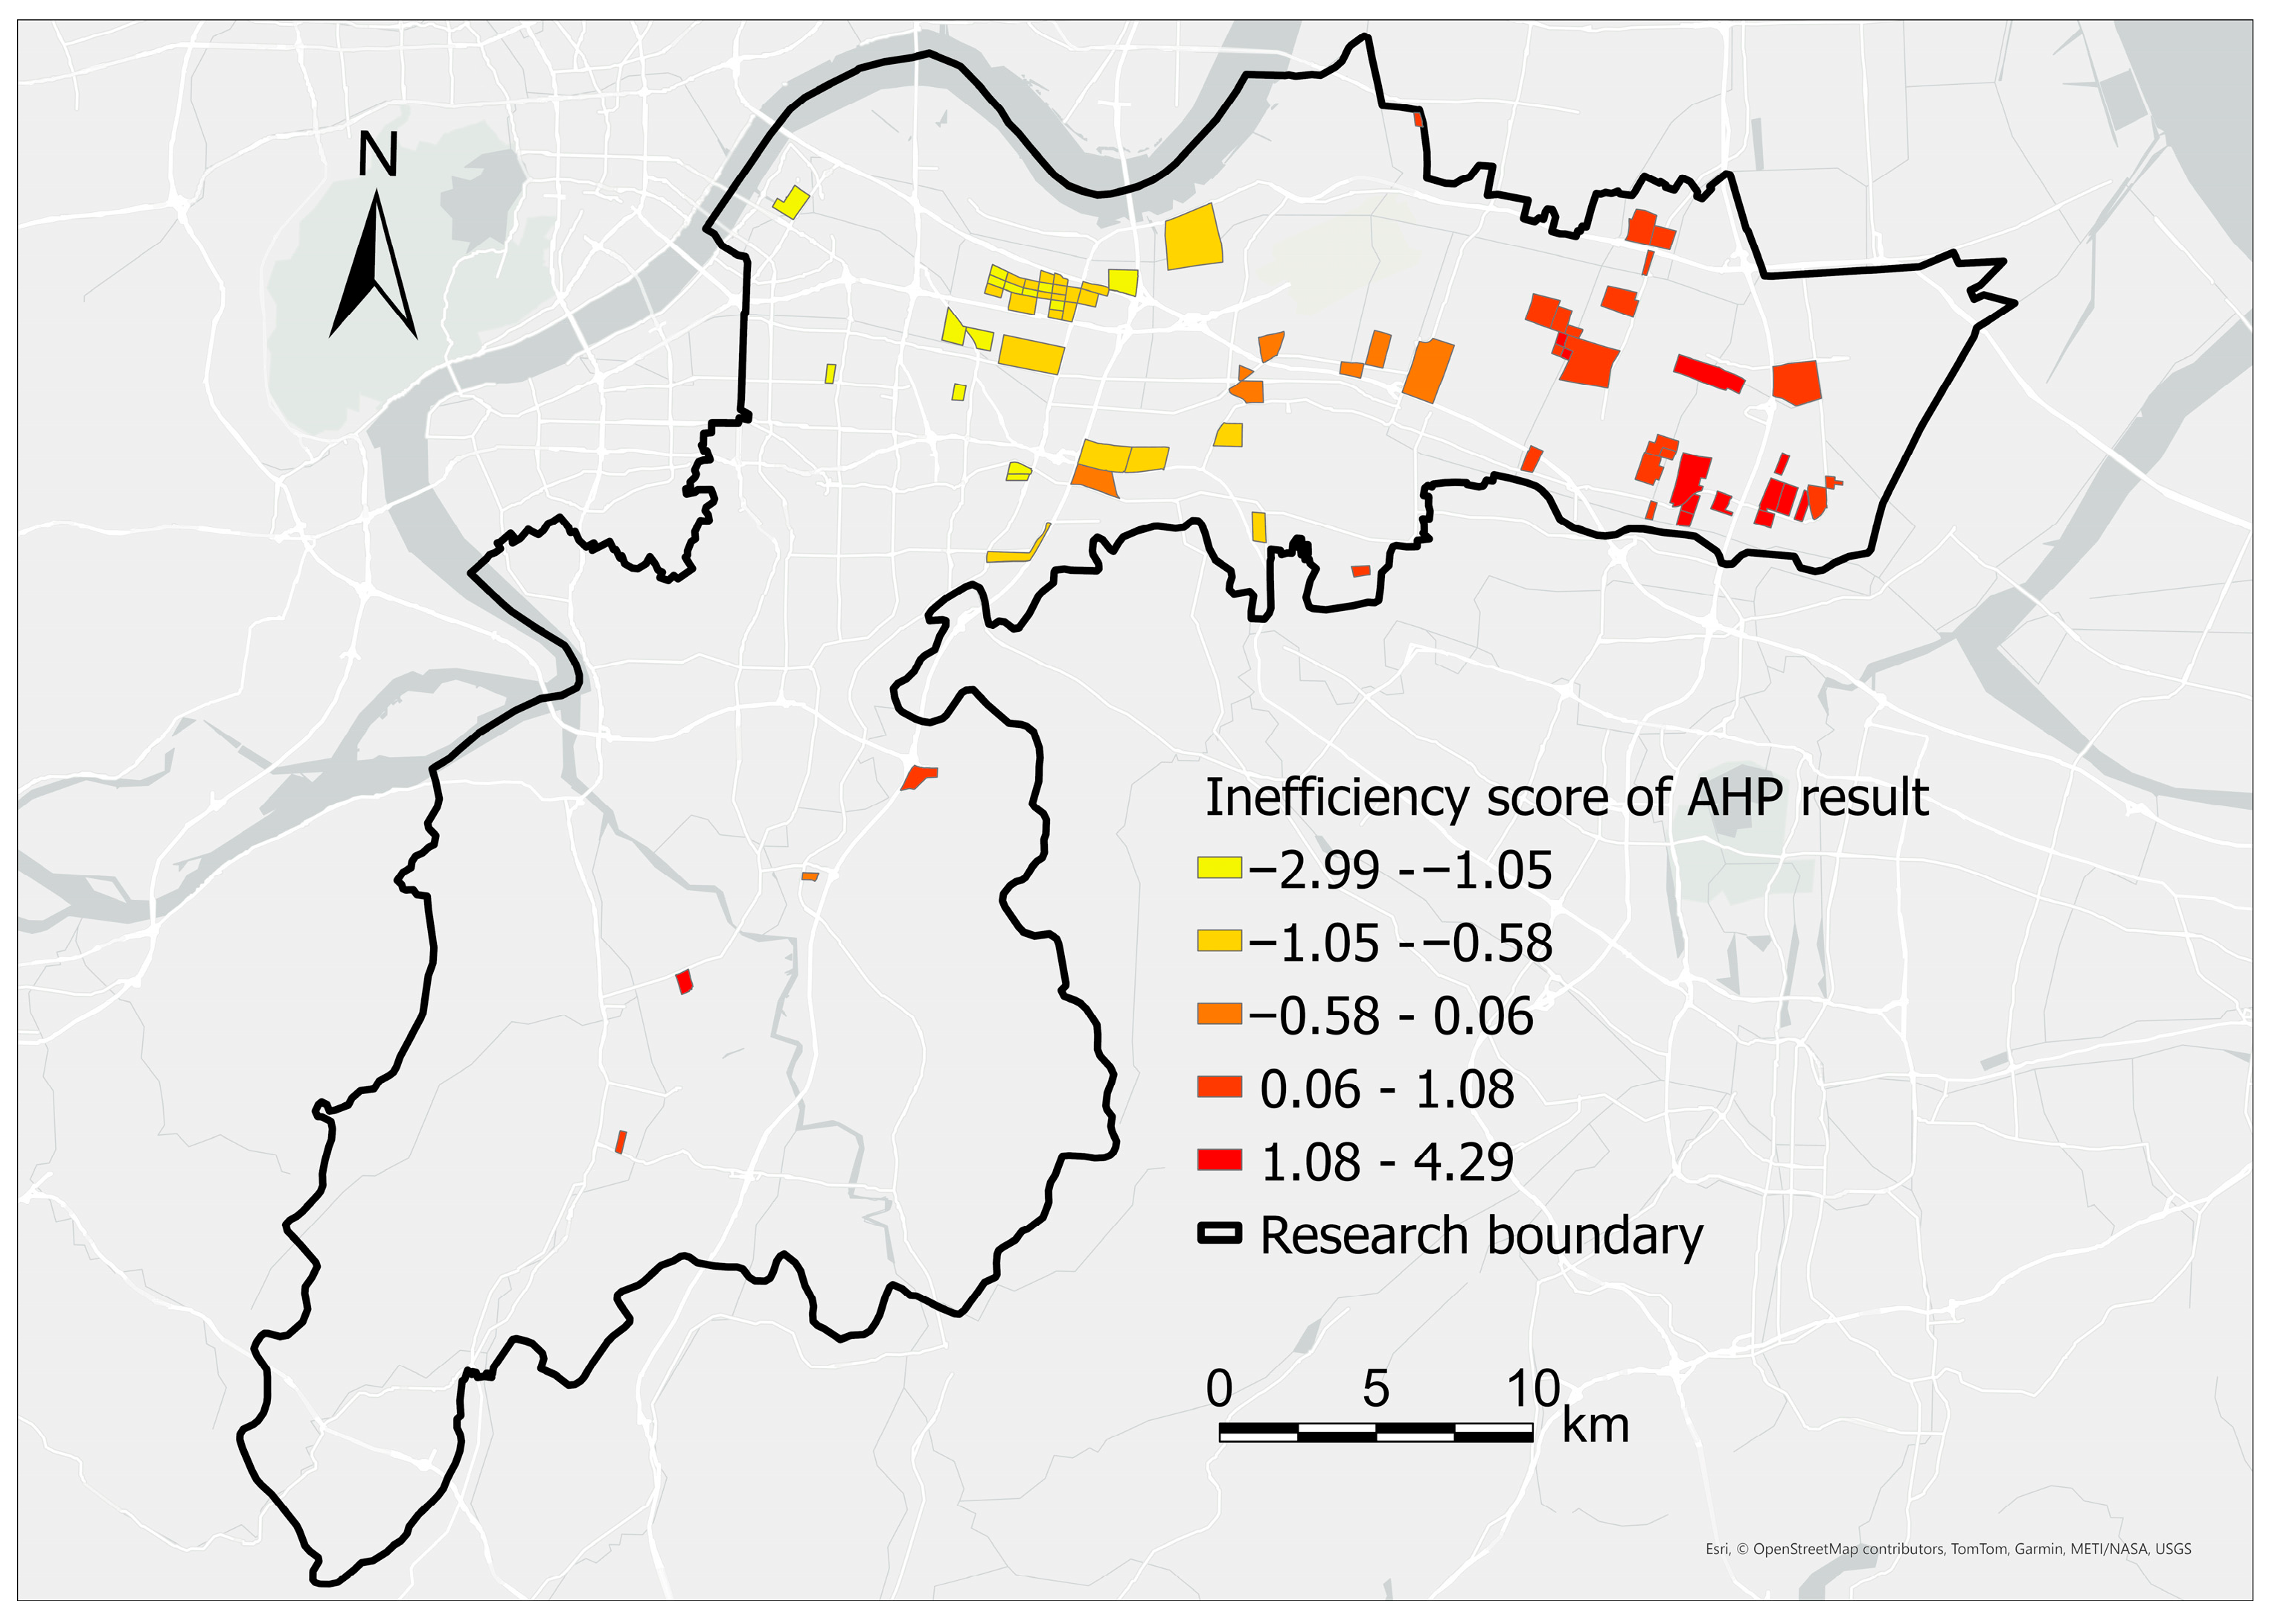
4.1. AHP Result
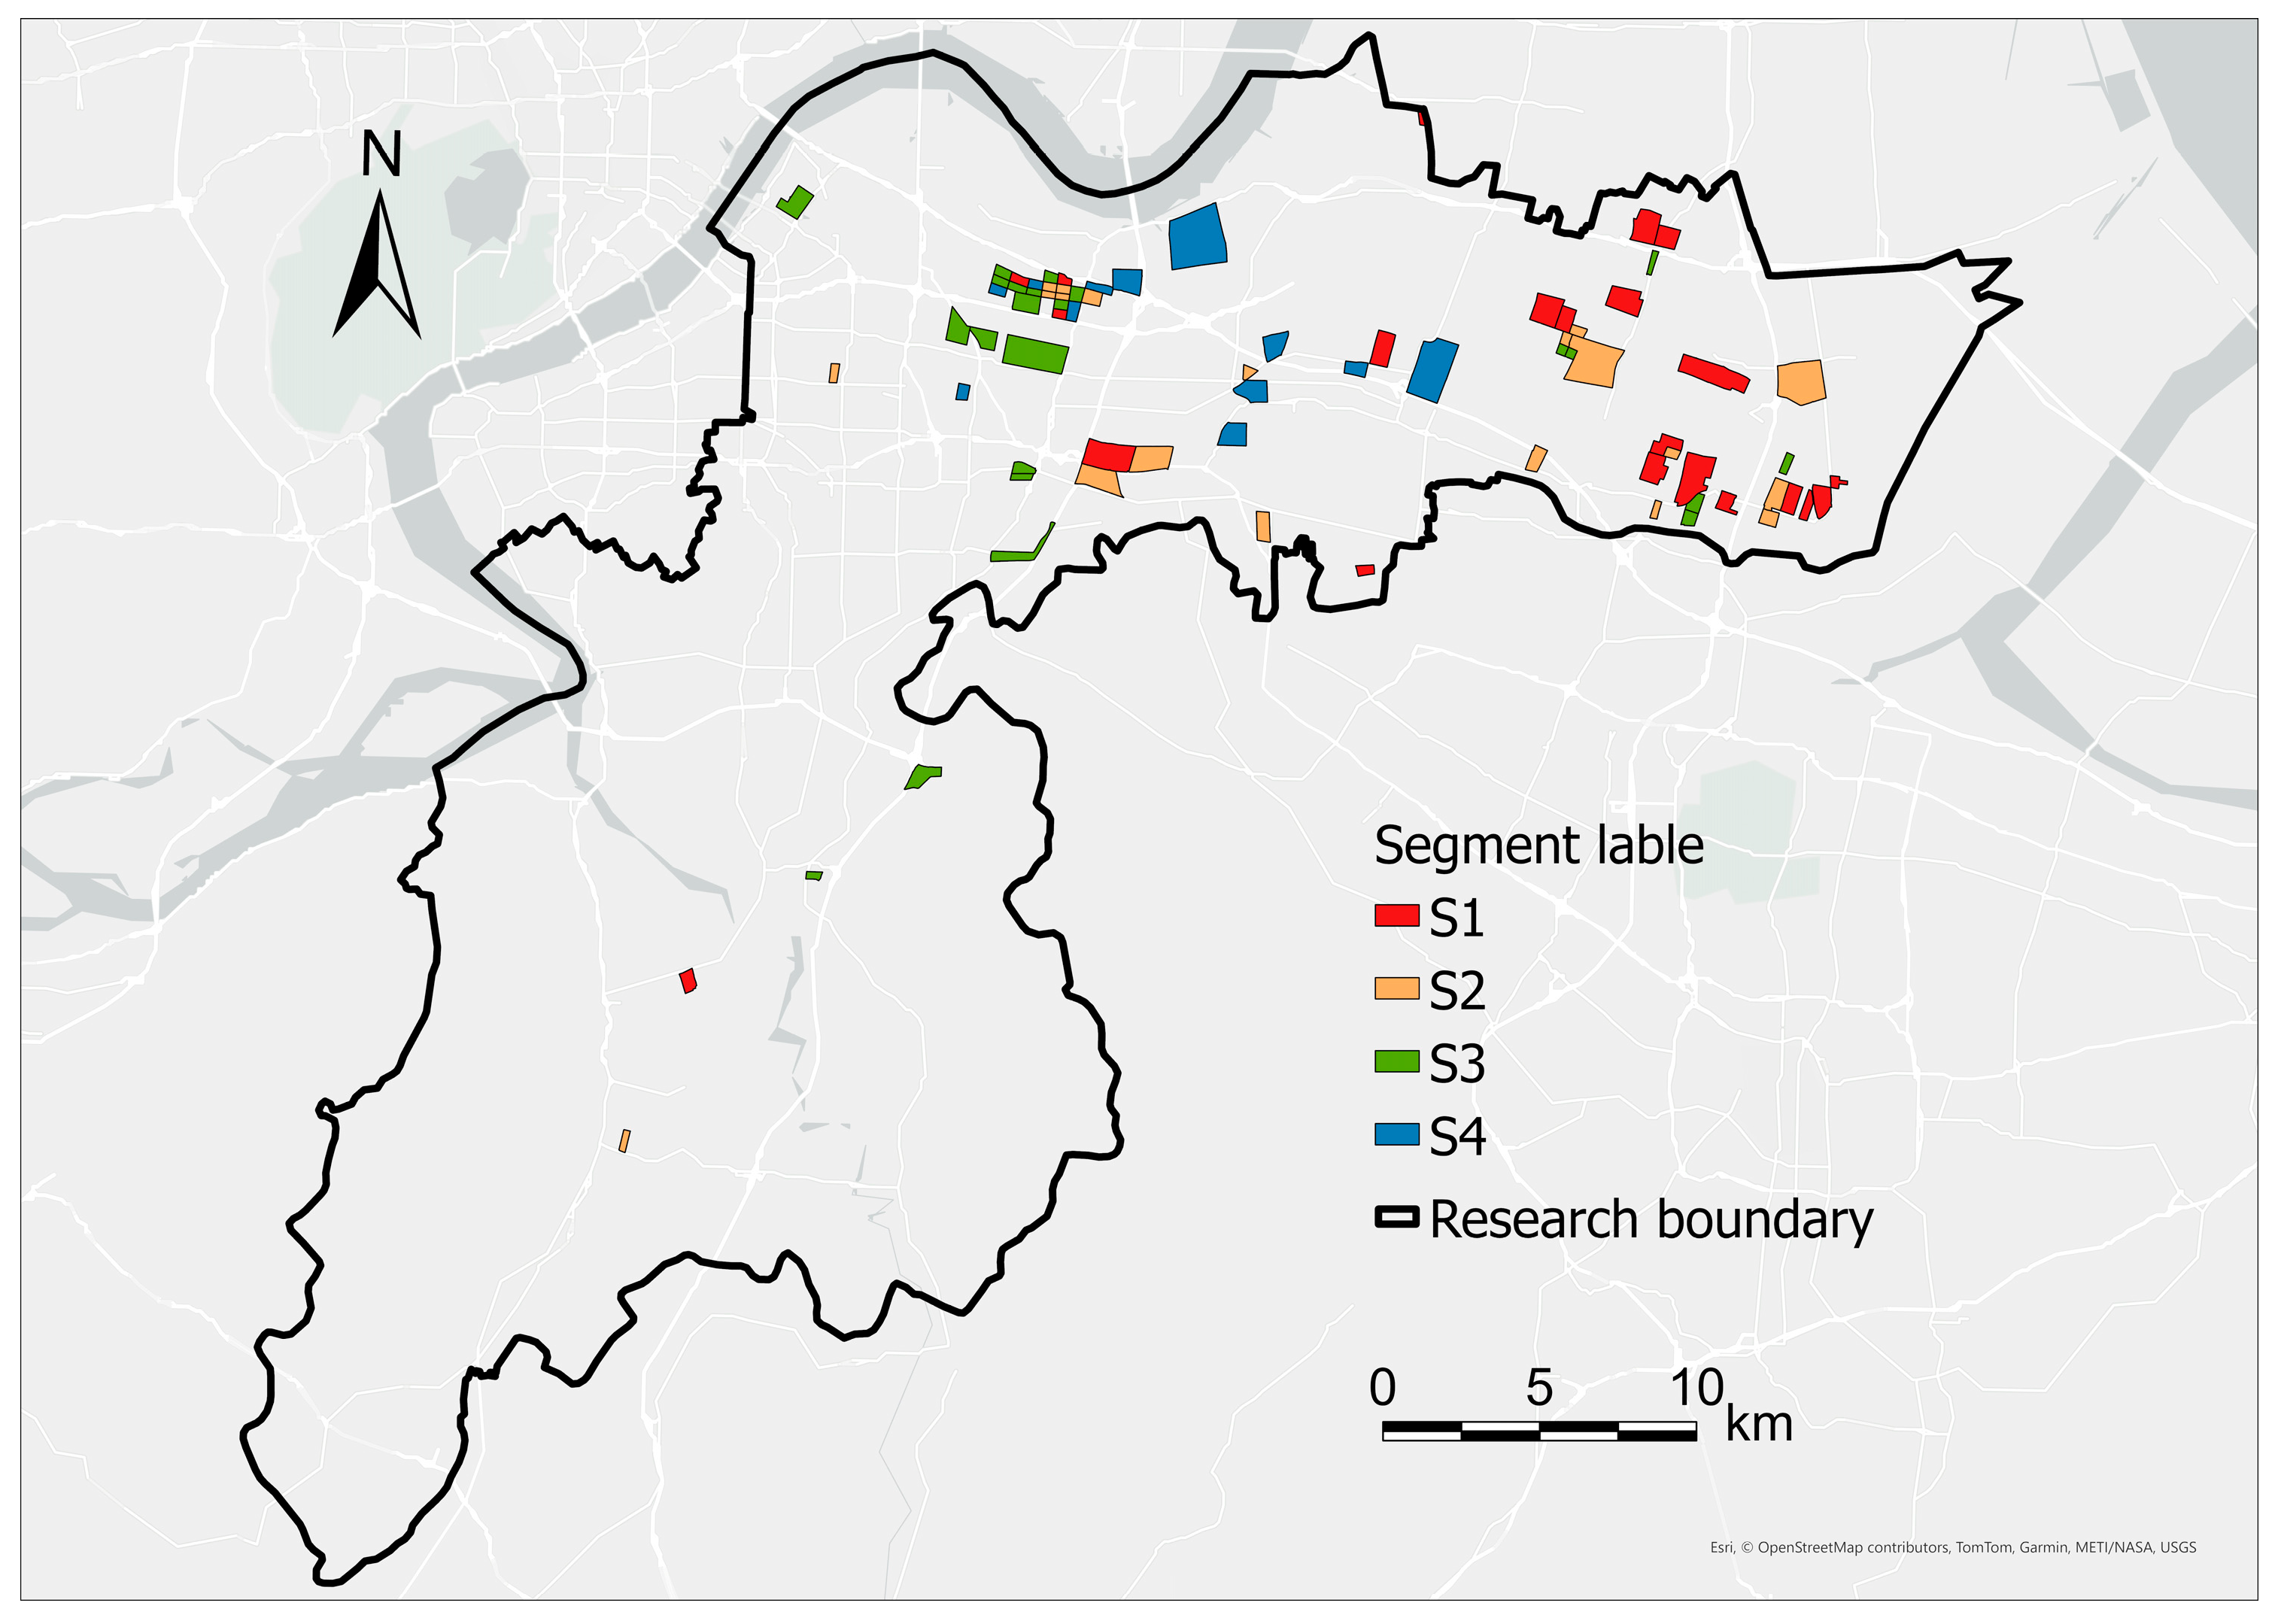
4.2. Pattern-Sensitive Segmentation
4.3. Indicator Weight Optimization
4.4. Comparative Analysis of Weight Optimization Results
4.5. Spatial Distribution of Industrial Inefficiency Score
4.6. Verifying the Temporal Generalization of the Optimized Weights
5. Discussion
6. Conclusions
Author Contributions
Funding
Data Availability Statement
Acknowledgments
Conflicts of Interest
Abbreviations
| 3D-GloBFP | 3D Global Building Footprints |
| AHP | Analytic Hierarchy Process |
| BLP | Benchmark Land Price |
| CR | Consistency Ratio |
| DEA | Data Envelopment Analysis |
| EOG | Earth Observation Group |
| EWM | Entropy Weight Method |
| FAR | Floor Area Ratio |
| FD | Frequency Density |
| IKD | Infrastructure POI Kernel Density |
| LSI | Landscape Shape Index |
| MCDA | Multi-Criteria Decision Analysis |
| MCDM | Multi-Criteria Decision-Making |
| NDC | Network Distance to Regional Centers |
| NTL | Nighttime Light |
| OSM | OpenStreetMap |
| POI | Points of Interest |
| RBC | Road Betweenness Centrality |
| RF | Random Forest |
| RIM | Residential & Industrial Land Use Mix |
| SFA | Stochastic Frontier Analysis |
| SHAPE | Shape Index |
| SSE | Sum of Squared Errors |
| TOPSIS | Technique for Order Preference by Similarity to Ideal Solution |
| VIIRS | Visible Infrared Imaging Radiometer Suite |
Appendix A. Expert Consultation Questionnaire
- Significantly More Important: The left indicator is critical compared to the right.
- Slightly More Important: The left indicator is moderately favored.
- Equally Important: Both indicators contribute equally.
- Slightly Less Important: The right indicator is moderately favored.
- Significantly Less Important: The right indicator is critical compared to the left.
| X | Significantly More Important | Slightly More Important | Equally Important | Slightly Less Important | Significantly Less Important | Y |
| Dimension A (Intrinsic Parcel Attributes) | Dimension B (Surrounding Environmental Attributes) |
| X | Significantly More Important | Slightly More Important | Equally Important | Slightly Less Important | Significantly Less Important | Y |
| Indicator A2 | Indicator A1 | |||||
| Indicator A3 | Indicator A1 | |||||
| Indicator A3 | Indicator A2 | |||||
| Indicator A4 | Indicator A1 | |||||
| Indicator A4 | Indicator A2 | |||||
| Indicator A4 | Indicator A3 |
| X | Significantly More Important | Slightly More Important | Equally Important | Slightly Less Important | Significantly Less Important | Y |
| Indicator B2 | Indicator B1 | |||||
| Indicator B3 | Indicator B1 | |||||
| Indicator B3 | Indicator B2 | |||||
| Indicator B4 | Indicator B1 | |||||
| Indicator B4 | Indicator B2 | |||||
| Indicator B4 | Indicator B3 |
| 1 | The mu is a Chinese unit of area, equivalent to approximately 666.67 square meters (m2) or 1/15 of a hectare (ha). The term “Benefit-per-Mu” is a direct translation of the official Chinese policy name “mǔ chǎn xiào yì”, a key metric that evaluates economic output per unit of land. |
References
- Liu, Y.; Zhang, Z.; Zhou, Y. Efficiency of construction land allocation in China: An econometric analysis of panel data. Land Use Policy 2018, 74, 261–272. [Google Scholar] [CrossRef]
- Jiang, L.; Deng, X.; Seto, K.C. The impact of urban expansion on agricultural land use intensity in China. Land Use Policy 2013, 35, 33–39. [Google Scholar] [CrossRef]
- Liu, Y.; Yan, B.; Wang, Y.; Zhou, Y. Will land transfer always increase technical efficiency in China?—A land cost perspective. Land Use Policy 2019, 82, 414–421. [Google Scholar] [CrossRef]
- Liu, S.; Xiao, W.; Li, L.; Ye, Y.; Song, X. Urban land use efficiency and improvement potential in China: A stochastic frontier analysis. Land Use Policy 2020, 99, 105046. [Google Scholar] [CrossRef]
- Zhang, J.; Xu, R.; Chen, J. Does industrial land marketization reform facilitate urban land use efficiency? Int. Rev. Econ. Financ. 2024, 96, 103609. [Google Scholar] [CrossRef]
- Jun, H. Efficiency Evaluation Research on Intensive Utilization of Land Resources in Hubei Province. In Proceedings of the 2015 International Conference on Software Engineering and Information System (SEIS 2015), Wuhan, China, 7–8 November 2015. [Google Scholar]
- Bi, X. Review and Prospect of Research on Urban Land Use Efficiency. In Proceedings of the 2016 6th International Conference on Management, Education, Information and Control (MEICI 2016), Guangzhou, China, 28–29 May 2016. [Google Scholar]
- Song, W.; Cao, S.; Du, M.; Lu, L. Distinctive roles of land-use efficiency in sustainable development goals: An investigation of trade-offs and synergies in China. J. Clean. Prod. 2023, 382, 134889. [Google Scholar] [CrossRef]
- Zhong, X.; Li, Y. Mediating Effect and Suppressing Effect: Intermediate Mechanism of Urban Land Use Efficiency and Economic Development. Land 2023, 12, 1148. [Google Scholar] [CrossRef]
- Tu, F.; Yu, X.; Ruan, J. Industrial land use efficiency under government intervention: Evidence from Hangzhou, China. Habitat Int. 2014, 43, 1–10. [Google Scholar] [CrossRef]
- Chen, W.; Chen, W.; Ning, S.; Liu, E.; Zhou, X.; Wang, Y.; Zhao, M. Exploring the industrial land use efficiency of China’s resource-based cities. Cities 2019, 93, 215–223. [Google Scholar] [CrossRef]
- Huang, D.; Wan, W.; Dai, T.; Liang, J. Assessment of industrial land use intensity: A case study of Beijing economic-technological development area. Chin. Geogr. Sci. 2011, 21, 222–229. [Google Scholar] [CrossRef]
- Li, D.; Yang, L.; Lin, J.; Wu, J. How industrial landscape affects the regional industrial economy: A spatial heterogeneity framework. Habitat Int. 2020, 100, 102187. [Google Scholar] [CrossRef]
- Xie, R.; Yao, S.; Han, F.; Zhang, Q. Does misallocation of land resources reduce urban green total factor productivity? An analysis of city-level panel data in China. Land Use Policy 2022, 122, 106353. [Google Scholar] [CrossRef]
- Wang, D.; Huang, X.; Shi, L.; Yang, H.; Sun, W. The identification and efficiency evaluation of industrial parcels by integrating multi-source spatial data in Shenzhen, South China. GISci. Remote Sens. 2024, 61, 2344405. [Google Scholar] [CrossRef]
- Jiang, X.; Lu, X.; Liu, Q.; Chang, C.; Qu, L. The effects of land transfer marketization on the urban land use efficiency: An empirical study based on 285 cities in China. Ecol. Indic. 2021, 132, 108296. [Google Scholar] [CrossRef]
- Liu, J.; Hou, X.; Wang, Z.; Shen, Y. Study the effect of industrial structure optimization on urban land-use efficiency in China. Land Use Policy 2021, 105, 105390. [Google Scholar] [CrossRef]
- Kong, W.; Huang, J.; Niu, L.; Chen, S.; Zhou, J.; Zhang, Z.; Guo, S. Innovative framework for identification and spatiotemporal dynamics analysis of industrial land at parcel scale with multidimensional attributes. Cities 2025, 162, 105958. [Google Scholar] [CrossRef]
- Sun, F. Evaluation Method of Intensive Use of Downtown Land. Appl. Mech. Mater. 2014, 651–653, 1151–1157. [Google Scholar] [CrossRef]
- Lin, S.-H.; Wang, D.; Huang, X.; Zhao, X.; Hsieh, J.-C.; Tzeng, G.-H.; Li, J.-H.; Chen, J.-T. A multi-attribute decision-making model for improving inefficient industrial parks. Environ. Dev. Sustain. 2021, 23, 887–921. [Google Scholar] [CrossRef]
- Pan, H.; Yang, T.; Jin, Y.; Dall’Erba, S.; Hewings, G. Understanding heterogeneous spatial production externalities as a missing link between land-use planning and urban economic futures. Reg. Stud. 2021, 55, 90–100. [Google Scholar] [CrossRef]
- Qiu, Y.; Sheng, J.; He, X. Evaluation Model of Urban Land Use Efficiency Based on Super-Efficiency-DEA. In Proceedings of the 2016 4th International Conference on Sensors, Mechatronics and Automation (ICSMA 2016), Ningbo, China, 7–8 December 2016. [Google Scholar]
- Zhang, L.; Zhang, L.; Xu, Y.; Zhou, P.; Yeh, C.-H. Evaluating urban land use efficiency with interacting criteria: An empirical study of cities in Jiangsu China. Land Use Policy 2020, 90, 104292. [Google Scholar] [CrossRef]
- Hu, Y.; Li, J.; Liu, Z. On Rural Agriculture Technical Efficiency in the Mountainous Area in the West of China with Stochastic Frontier Analysis. In Proceedings of the 3rd International Institute of Statistics and Management Engineering Symposium; Aussino Academic Publishing House (AAPH): Sydney, Australia, 2010; pp. 801–805. [Google Scholar]
- Jiang, H. Spatial-temporal differences of industrial land use efficiency and its influencing factors for China’s central region: Analyzed by SBM model. Environ. Technol. Innov. 2021, 22, 101489. [Google Scholar] [CrossRef]
- Liu, S.; Lin, Y.; Ye, Y.; Xiao, W. Spatial-temporal characteristics of industrial land use efficiency in provincial China based on a stochastic frontier production function approach. J. Clean. Prod. 2021, 295, 126432. [Google Scholar] [CrossRef]
- Song, Y.; Yeung, G.; Zhu, D.; Xu, Y.; Zhang, L. Efficiency of urban land use in China’s resource-based cities, 2000–2018. Land Use Policy 2022, 115, 106009. [Google Scholar] [CrossRef]
- Chu, F.; Diao, Z. Study of Urban Circle Land Use Efficiency Based on Data Envelopment Analysis. In Proceedings of the 5th International Conference on Product Innovation Management, Wuhan, China, 25–27 July 2010. [Google Scholar]
- Yi, R.; Ma, Z. A DEA Method Applied to Describing Economic Efficiency of Urban Land Utilizing in China. In Proceedings of the International Conference on Urbanization and Land Reservation Research, Tianjin, China, 15–17 September 2009; pp. 222–228. [Google Scholar]
- Li, H.; Qu, J.; Wang, D.; Meng, P.; Lu, C.; Zeng, J. Spatial-Temporal Integrated Measurement of the Efficiency of Urban Land Use in Yellow River Basin. Sustainability 2021, 13, 8902. [Google Scholar] [CrossRef]
- Cui, Y.; Niu, Y.; Ren, Y.; Zhang, S.; Zhao, L. A Model to Analyze Industrial Clusters to Measure Land Use Efficiency in China. Land 2024, 13, 1070. [Google Scholar] [CrossRef]
- Niu, L.; Jiang, M. Analysis on Industrial Land Efficiency of Central Yunnan Economic Zone Based on Big-data. In Proceedings of the 2016 International Conference on Robots & Intelligent System (ICRIS), Haikou, China, 15–16 June 2016. [Google Scholar]
- Zhou, L.; Shi, Y.; Cao, X. Evaluation of Land Intensive Use in Shanghai Pilot Free Trade Zone. Land 2019, 8, 87. [Google Scholar] [CrossRef]
- Yu, Q.; Hou, L.; Li, Y.; Chai, C.; Yang, K.; Liu, J. Pipeline Failure Assessment Based on Fuzzy Bayesian Network and AHP. J. Pipeline Syst. Eng. Pract. 2023, 14, 04022059. [Google Scholar] [CrossRef]
- Tian, Y.; Zhou, D.; Jiang, G. A new quality management system of admittance indicators to improve industrial land use efficiency in the Beijing–Tianjin–Hebei region. Land Use Policy 2021, 107, 105456. [Google Scholar] [CrossRef]
- Qi, Y.; Lin, R.; Zhu, D. Impact of rising industrial land prices on land-use efficiency in China: A study of underpriced land price. Land Use Policy 2025, 151, 107490. [Google Scholar] [CrossRef]
- Tu, F.; Zou, S.; Ding, R. How do land use regulations influence industrial land prices? Evidence from China. Int. J. Strateg. Prop. Manag. 2021, 25, 76–89. [Google Scholar] [CrossRef]
- Liu, S.; Liu, W.; Zhou, Y.; Wang, S.; Wang, Z.; Wang, Z.; Wang, Y.; Wang, X.; Hao, L.; Wang, F. Analysis of Economic Vitality and Development Equilibrium of China’s Three Major Urban Agglomerations Based on Nighttime Light Data. Remote Sens. 2024, 16, 4571. [Google Scholar] [CrossRef]
- Gao, X.; Zhang, A.; Sun, Z. How regional economic integration influence on urban land use efficiency? A case study of Wuhan metropolitan area, China. Land Use Policy 2020, 90, 104329. [Google Scholar] [CrossRef]
- Li, C.; Gao, X.; He, B.; Wu, J.; Wu, K. Coupling Coordination Relationships between Urban-industrial Land Use Efficiency and Accessibility of Highway Networks: Evidence from Beijing-Tianjin-Hebei Urban Agglomeration, China. Sustainability 2019, 11, 1446. [Google Scholar] [CrossRef]
- Lin, Q.; Luo, X.; Lin, G.; Yang, T.; Su, W. Impact of relocation and reconstruction policies on the upgrading of urban industrial structure in old industrial districts. Front. Environ. Sci. 2022, 10, 1002993. [Google Scholar] [CrossRef]
- Yang, Y.; Liu, Y.; Chen, Q.; Du, S. The Influence of “Industry–City–Innovation” Functional Mixing on the Innovative Development of Sci-Tech Parks Under the Background of Urbanization. Sustainability 2025, 17, 3715. [Google Scholar] [CrossRef]
- Che, Y.; Li, X.; Liu, X.; Wang, Y.; Liao, W.; Zheng, X.; Zhang, X.; Xu, X.; Shi, Q.; Zhu, J.; et al. 3D-GloBFP: The first global three-dimensional building footprint dataset. Earth Syst. Sci. Data 2024, 16, 5357–5374. [Google Scholar] [CrossRef]
- Elvidge, C.D.; Zhizhin, M.; Ghosh, T.; Hsu, F.C.; Taneja, J. Annual time series of global VIIRS nighttime lights derived from monthly averages: 2012 to 2019. Remote Sens. 2021, 13, 922. [Google Scholar] [CrossRef]
- Zhu, J. The impact of industrial land use policy on industrial change. Land Use Policy 2000, 17, 21–28. [Google Scholar] [CrossRef]
- Sun, Y.; Ma, A.; Su, H.; Su, S.; Chen, F.; Wang, W.; Weng, M. Does the establishment of development zones really improve industrial land use efficiency? Implications for China’s high-quality development policy. Land Use Policy 2020, 90, 104265. [Google Scholar] [CrossRef]




| Indicators | Problem Addressed by the Indicator | Weights |
|---|---|---|
| FAR | Inadequate land use intensity | 25.00% |
| BLC | Low economic contribution and development potential | 49.72% |
| NTL | Low intensity of human and economic activity | 17.17% |
| LSI | High degree of parcel irregular shape fragmentation | 8.11% |
| Indicators | Problem Addressed by the Indicator | Weights |
|---|---|---|
| RIM | Inadequate planning and functional mix (work–life balance) | 33.43% |
| NDC | Remoteness and poor access to regional centers | 13.06% |
| RBC | Low traffic accessibility from inefficient road network layout | 17.13% |
| IKD | Insufficient provision of regional infrastructure | 36.38% |
| Indicators | Problem Addressed by the Indicator | Weights | Ranks |
|---|---|---|---|
| FAR | Inadequate land use intensity | 18.04% | 2 |
| BLP | Low economic contribution and development potential | 35.88% | 1 |
| NTL | Low intensity of human and economic activity | 12.39% | 3 |
| LSI | High degree of parcel irregular shape fragmentation | 5.85% | 6 |
| RIM | Inadequate planning and functional mix (work–life balance) | 9.31% | 5 |
| NDC | Remoteness and poor access to regional centers | 3.64% | 8 |
| RBC | Low traffic accessibility from inefficient road network layout | 4.77% | 7 |
| IKD | Insufficient provision of regional infrastructure | 10.13% | 4 |
| SSE | |
|---|---|
| 2 | 12.434123 |
| 3 | 6.9906654 |
| 4 | 4.458191 |
| 5 | 15.245002 |
| Segment | Model | Pearson_corr | Pearson_p | Spearman_corr | Spearman_p | Kendall_corr | Kendall_p |
|---|---|---|---|---|---|---|---|
| S1 | AHP | −0.83 | 0.0000 | −0.56 | 0.0064 | −0.39 | 0.0118 |
| EWM-AHP | −0.84 | 0.0000 | −0.56 | 0.0070 | −0.38 | 0.0140 | |
| HBN-AHP | −0.73 | 0.0001 | −0.57 | 0.0059 | −0.42 | 0.0058 | |
| Global training | −0.48 | 0.0241 | −0.49 | 0.0221 | −0.35 | 0.0228 | |
| Our algorithm | 0.71 | 0.0002 | 0.44 | 0.0394 | 0.33 | 0.0309 | |
| S2 | AHP | −0.68 | 0.0011 | −0.64 | 0.0026 | −0.47 | 0.0030 |
| EWM-AHP | −0.69 | 0.0008 | −0.65 | 0.0021 | −0.49 | 0.0018 | |
| HBN-AHP | −0.63 | 0.0030 | −0.56 | 0.0103 | −0.36 | 0.0164 | |
| Global training | −0.58 | 0.0068 | −0.60 | 0.0053 | −0.41 | 0.0111 | |
| Our algorithm | 0.82 | 0.0000 | 0.72 | 0.0003 | 0.56 | 0.0004 | |
| S3 | AHP | −0.64 | 0.0009 | −0.54 | 0.0074 | −0.34 | 0.0219 |
| EWM-AHP | −0.65 | 0.0008 | −0.57 | 0.0048 | −0.35 | 0.0189 | |
| HBN-AHP | −0.58 | 0.0040 | −0.63 | 0.0012 | −0.43 | 0.0043 | |
| Global training | −0.88 | 0.0000 | −0.82 | 0.0000 | −0.59 | 0.0000 | |
| Our algorithm | 0.66 | 0.0006 | 0.60 | 0.0025 | 0.45 | 0.0026 | |
| S4 | AHP | 0.51 | 0.0880 | 0.54 | 0.0709 | 0.33 | 0.1526 |
| EWM-AHP | 0.70 | 0.0113 | 0.70 | 0.0114 | 0.55 | 0.0138 | |
| HBN-AHP | 0.01 | 0.9745 | 0.05 | 0.8854 | 0.06 | 0.8168 | |
| Global training | 0.39 | 0.2063 | 0.33 | 0.2969 | 0.27 | 0.2496 | |
| Our algorithm | 0.72 | 0.0082 | 0.70 | 0.0106 | 0.53 | 0.0161 |
| Segment | Model | FAR | RBC | BLP | NTL | LSI | RIM | IKD | NDC |
|---|---|---|---|---|---|---|---|---|---|
| S1 | Our algorithm | 9.42% | 19.18% | 18.21% | 8.95% | 18.89% | 20.40% | 20.39% | −15.44% |
| S2 | 13.76% | −2.90% | 20.99% | 7.45% | 11.28% | 21.84% | 31.03% | −3.46% | |
| S3 | 5.61% | −9.19% | 27.31% | 17.15% | 22.05% | 24.88% | 5.43% | 6.76% | |
| S4 | 18.10% | 11.22% | 23.42% | 1.88% | 15.50% | 13.55% | 13.06% | 3.27% | |
| All segments | AHP | 18.04% | 4.77% | 35.88% | 12.39% | 5.85% | 9.31% | 10.13% | 3.64% |
| Segment | Model | Pearson_corr | Pearson_p | Spearman_corr | Spearman_p | Kendall_corr | Kendall_p |
|---|---|---|---|---|---|---|---|
| S1 | AHP | −0.83 | 0.0000 | −0.58 | 0.0050 | −0.38 | 0.0140 |
| EWM-AHP | −0.83 | 0.0000 | −0.60 | 0.0031 | −0.41 | 0.0069 | |
| HBN-AHP | −0.13 | 0.5786 | −0.22 | 0.3172 | −0.19 | 0.3056 | |
| Our Algorithm | 0.66 | 0.0008 | 0.31 | 0.1652 | 0.23 | 0.1439 | |
| S2 | AHP | −0.66 | 0.0015 | −0.59 | 0.0058 | −0.46 | 0.0038 |
| EWM-AHP | −0.67 | 0.0012 | −0.60 | 0.0049 | −0.45 | 0.0047 | |
| HBN-AHP | −0.08 | 0.7294 | −0.12 | 0.6274 | −0.10 | 0.6143 | |
| Our Algorithm | 0.64 | 0.0023 | 0.39 | 0.0923 | 0.24 | 0.1458 | |
| S3 | AHP | −0.62 | 0.0017 | −0.53 | 0.010 | −0.32 | 0.0335 |
| EWM-AHP | −0.63 | 0.0014 | −0.51 | 0.0123 | −0.33 | 0.0292 | |
| HBN-AHP | 0.17 | 0.4408 | 0.10 | 0.6616 | 0.08 | 0.6511 | |
| Our Algorithm | 0.59 | 0.0032 | 0.54 | 0.0083 | 0.36 | 0.0162 | |
| S4 | AHP | 0.50 | 0.0975 | 0.50 | 0.0952 | 0.33 | 0.1526 |
| EWM-AHP | 0.45 | 0.1387 | 0.42 | 0.1745 | 0.30 | 0.1969 | |
| HBN-AHP | 0.47 | 0.1240 | 0.46 | 0.1334 | 0.40 | 0.1013 | |
| Our Algorithm | 0.58 | 0.0492 | 0.47 | 0.1108 | 0.30 | 0.1969 |
Disclaimer/Publisher’s Note: The statements, opinions and data contained in all publications are solely those of the individual author(s) and contributor(s) and not of MDPI and/or the editor(s). MDPI and/or the editor(s) disclaim responsibility for any injury to people or property resulting from any ideas, methods, instructions or products referred to in the content. |
© 2026 by the authors. Licensee MDPI, Basel, Switzerland. This article is an open access article distributed under the terms and conditions of the Creative Commons Attribution (CC BY) license.
Share and Cite
Cai, W.; Zhang, X.; Huang, F.; Zhang, M. Optimizing Evaluation Systems for Industrial Land Inefficiency: A Pattern-Sensitive Framework Integrating Expert Knowledge and Machine Learning. Land 2026, 15, 805. https://doi.org/10.3390/land15050805
Cai W, Zhang X, Huang F, Zhang M. Optimizing Evaluation Systems for Industrial Land Inefficiency: A Pattern-Sensitive Framework Integrating Expert Knowledge and Machine Learning. Land. 2026; 15(5):805. https://doi.org/10.3390/land15050805
Chicago/Turabian StyleCai, Wei, Xin Zhang, Fengjue Huang, and Mingyu Zhang. 2026. "Optimizing Evaluation Systems for Industrial Land Inefficiency: A Pattern-Sensitive Framework Integrating Expert Knowledge and Machine Learning" Land 15, no. 5: 805. https://doi.org/10.3390/land15050805
APA StyleCai, W., Zhang, X., Huang, F., & Zhang, M. (2026). Optimizing Evaluation Systems for Industrial Land Inefficiency: A Pattern-Sensitive Framework Integrating Expert Knowledge and Machine Learning. Land, 15(5), 805. https://doi.org/10.3390/land15050805