Article

Spatial Differentiation of Potential Drivers of Grassland Degradation Across Urban Functional Zones in Inner Mongolia


1
College of Geographical Science, Inner Mongolia Normal University, Hohhot 010022, China
2
Academician Expert Workstation for Ecological Security and Disaster Risk Reduction, Inner Mongolia Normal University, Hohhot 010022, China
3
Key Laboratory of Resources and Environmental Information Systems, Inner Mongolia Autonomous Region, Hohhot 010022, China
4
College of Resources and Environment, University of Chinese Academy of Sciences, Beijing 100049, China
*
Author to whom correspondence should be addressed.
Land 2026, 15(5), 776; https://doi.org/10.3390/land15050776
Submission received: 20 February 2026 / Revised: 26 April 2026 / Accepted: 28 April 2026 / Published: 3 May 2026

Abstract

Against the backdrop of global warming, grassland degradation (GD) in arid and semi-arid regions has become a critical issue constraining ecosystem stability and socio-ecological resilience. This study aims to reveal the spatial differentiation of drivers of GD across four functional zones in Inner Mongolia—resource-oriented (RO), center-service-oriented (CSO), agro-pastoral-oriented (APO), and ecological-oriented (EO)—at the county level, using grassland conversion processes as a structural proxy. The results show that land cover changed in 19.29%, 18.69%, 17.28%, and 4.67% of the RO, CSO, APO, and EO regions, respectively, with GR mainly occurring in the RO region, while GD was more prevalent in the other zones. Drivers of GD exhibit significant variations across functional zones. In the RO zone, land use change is primarily associated with human disturbance. In the CSO and APO zones, it is associated with human activities, climatic factors, and urbanization. In the EO zone, the identified drivers show strong spatial heterogeneity, with urbanization, grazing intensity, and climate change emerging as key associated factors in the Hulunbuir, Xilingol, and Arxar regions. Overall, the results reveal a spatial gradient in the relative importance of anthropogenic pressure and climatic stress, with broader implications for adaptive and place-specific dryland governance under ongoing warming and increasing aridification.

Graphical Abstract

1. Introduction

Grasslands are core components of terrestrial ecosystems [1], serving multiple functions such as regulating climate, maintaining carbon cycle balance, mitigating natural disasters, protecting biodiversity, and providing economic and cultural value [2,3,4,5]. However, grassland ecosystems have faced increasingly severe risks of degradation, with approximately 49.25% of global grasslands already considered degraded [6]. GD is defined as the process through which the structure, function, and species composition of grassland ecosystems change under the combined effects of climate change and human activity [7]. GD manifests as increased soil erosion [8] and decreases in biodiversity [9]. GD not only threatens ecosystem stability and biodiversity but also has long-term and profound negative impacts on global economic development and human well-being [9].
Current methods for monitoring GD primarily include field surveys and remote sensing. Field surveys involve collecting samples to obtain ecosystem parameters, providing a reliable basis for subsequent analysis [10]. However, they are time-consuming and labor-intensive, making them difficult to apply at large scales [11]. With advances in satellite observation, vegetation indices have become a key tool for assessing GD [12]. Previous studies have primarily relied on vegetation indices such as the Normalised Difference Vegetation Index (NDVI), vegetation cover (FVC) [13,14,15], net primary productivity (NPP) [16] and leaf area index (LAI) [17] to quantify the dynamic characteristics of vegetation. Furthermore, some studies define GD through land use/land cover conversion processes [18,19,20], i.e., the transition of grassland to non-grassland types. In this study, we adopt this method to provide an operational definition of GD, focusing primarily on the structural degradation of ecosystems. It should be noted that whilst this method is suitable for large-scale, long-term remote sensing analyses, it struggles to characterise functional degradation processes that do not involve a change in land class. Consequently, the findings of this paper should be understood as a characterisation of structural degradation in grasslands.
GD is a multifactorial and complex environmental problem driven by the interplay between climatic variability and anthropogenic disturbances [21]. In this study, these influencing factors are collectively referred to as “degradation drivers”. Aspects of climate change, such as reduced precipitation and frequent droughts, shorten the growing season of vegetation and diminish plant productivity, accelerating the GD process [22]. Concurrently, unsustainable land use practices such as prolonged overgrazing [23] and excessive land clearing [24] disrupt and reduce vegetation cover and promote soil degradation. In addition to these direct drivers of GD, rapid urban expansion adversely affects grasslands through multiple pathways. In addition to these direct drivers, urbanization not only acts as an external disturbance but also reorganizes land–resource interactions through socio-ecological feedback mechanisms, thereby structurally shaping GD pathways. Specifically, urban expansion and industrial restructuring jointly influence land-use patterns through feedback processes: urban construction and industrial land expansion directly encroach upon grassland resources, while resource exploitation and industrial agglomeration further promote population inflow and infrastructure expansion, resulting in sustained pressure on grasslands [25]. Meanwhile, as urbanization progresses, the development of secondary and tertiary industries exerts sustained impacts on vegetation productivity and community structure through pathways such as resource extraction, land development, and tourism activities [26,27]. However, differences in developmental stages and dominant functions across cities lead to pronounced spatial differentiation in these feedback mechanisms, resulting in distinct pathways of influence on grassland ecosystems.
Although the drivers of GD in urban contexts have been examined, most studies have focused on single urban types or on individual case studies. For instance, Teng et al. [28] found that the GD in Wuhai City was mainly driven by mining expansion and land use conversion. Furthermore, differences in the drivers of GD among dominant land use types were identified by comparing pastoral and nonpastoral areas [29]. However, differences in developmental stages and dominant functions across cities lead to pronounced spatial heterogeneity in their impacts on grassland ecosystems. Consequently, there remains a lack of analytical frameworks capable of identifying and comparing the hierarchical relationships among multiple drivers across urban functional zones, particularly at the county scale where integrated quantitative analyses of multi-factor mechanisms are still limited. To address this gap, this study adopts an urban functional perspective by classifying the study area into different functional zones. “Functional zones” are defined as spatial units characterized by dominant socio-economic functions [30]. At the county level, multiple variables (e.g., population, livestock numbers, and GDP per capita) are integrated to construct a multi-factor analytical framework for identifying the dominant drivers of GD across functional zones, thereby providing a scientific basis for region-specific and targeted management strategies.
Existing approaches for quantifying large-scale GD drivers mainly employ statistical methods, including logistic regression [31], principal component analysis [32], and correlation analysis [33]. In addition, residual trend analysis [34] has been used to distinguish the relative contributions of climate change and human activities to GD. These approaches are widely used for driver identification and attribution analysis. However, most conventional methods assume that driving factors can be totally ordered across space, typically by linearly ranking or quantifying their contributions to identify dominant drivers. In multidimensional socio-ecological systems, driving factors often act on different dimensions and are not always directly comparable. Imposing a total-order framework may obscure this incomparability and the associated ecological trade-offs. Partial Order Theory (POT) is a multi-criteria analytical approach commonly used for the comparison and evaluation of complex systems [35]. Unlike traditional regression or machine learning methods, POT does not assume linear relationships or specific distributional patterns and avoids predefined weighting schemes, thereby reducing subjectivity in multi-indicator analysis [36]. However, it should be noted that POT may be sensitive to indicator selection, and its complexity may increase as the number of indicators grows. Despite these limitations, POT is particularly suitable for this study, as it allows for the comparison of multiple drivers without requiring predefined weights and can reveal hierarchical relationships among factors across spatial scales. By constructing partial-order relations, POT provides a flexible analytical framework for examining complex driver interactions in GD research.
Inner Mongolia is a crucial ecological barrier to the arid and semiarid northern regions in China [37]. However, Inner Mongolia is extremely sensitive to global climate change because of its unique geographical position and fragile ecological environment [38]. Accelerated agricultural, pastoral, and urbanisation processes have exacerbated the ecological issue in Inner Mongolia, such as GD and sandstorms, seriously impacting regional food security and socioeconomic development [39]. The aims of this study were to (1) characterize the dynamic patterns of land-use change across functional zones in Inner Mongolia from 2000 to 2023; (2) quantify the spatiotemporal patterns and evolutionary trends of GD and grassland restoration (GR) across four functional zones; and (3) To examine whether the dominance hierarchy of GD drivers is structurally influenced by urban functional differentiation. Based on multi-factor partial order ranking, dominant drivers are identified for each functional zone, and the restructuring effects of urban functional differentiation on driver hierarchy are further analyzed to provide theoretical support for differentiated management.

2. Data and Methods

2.1. Study Area

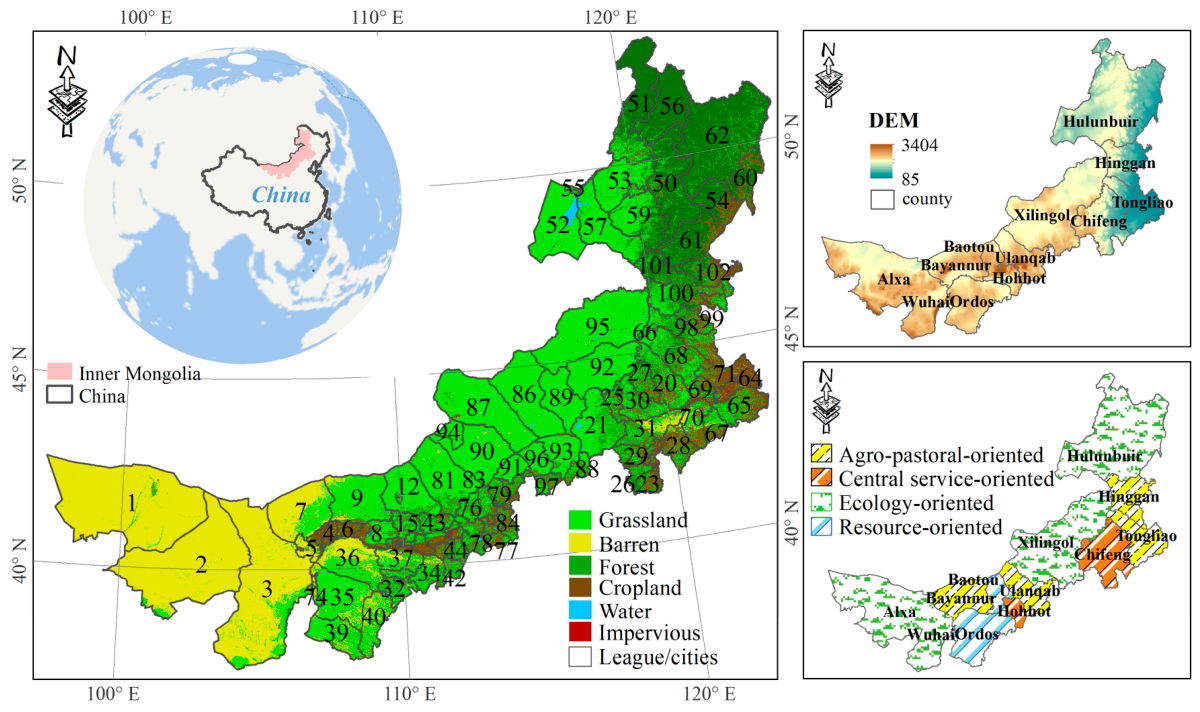
Inner Mongolia is located in the midlatitude inland area in China (34°24′–53°23′ N, 97°12′–126°04′ E), covering an area of approximately 1.18 × 10⁶ km2. The region comprises 12 prefecture-level cities and 103 counties (Figure 1). Inner Mongolia is characterised by a temperate continental climate with pronounced seasonal and spatial variations. The mean annual temperature ranges from −3 to 11 °C, gradually decreasing from the southwest to the northeast. This region represents the largest ecological functional zone in northern China, with grasslands accounting for 47.3% of the total area in 2023. This paper adopts the classification proposed by Wang [40], dividing the study area into four urban dominant functional zones: resource-oriented (RO), central service-oriented (CSO), agro-pastoral-oriented (APO), and ecological-oriented (EO) (Figure 1). The classification follows a functional zoning framework established in previous studies, in which cities are categorized according to their dominant socio-economic functions based on industrial structure, resource endowment, and ecological characteristics [41]. Given that these structural characteristics generally evolve slowly over medium- to long-term timescales, the functional classification is treated as constant over the study period (2000–2023). Although some regions may experience certain functional adjustments during development, the dominant functional orientation generally remains stable at the macro scale.
(1) The RO zones include Baotou, Ordos, and Wuhai. The industrial structure of these regions is characterized by a high proportion of mining, energy production, and heavy industries [42]. According to the Inner Mongolia Statistical Yearbook, the GDP of Ordos increased from CNY 18.38 billion in 2000 to CNY 584.99 billion in 2023, ranking first among the three cities. Similarly, Baotou, which relies on steel and rare earth processing industries, experienced substantial economic growth, with GDP increasing from CNY 27.71 billion to CNY 426.39 billion over the same period. Wuhai, although the smallest prefecture-level city in terms of area, also showed steady growth driven by coal, electricity, and chemical industries, with GDP rising from CNY 3.89 billion to CNY 71.31 billion between 2000 and 2023.
(2) The CSO zones include Hohhot and Chifeng. Hohhot, as the capital of the Inner Mongolia Autonomous Region, and Chifeng, as a major population and service center in eastern Inner Mongolia, exhibit economic structures dominated by the tertiary sector. According to the Inner Mongolia Statistical Yearbook, the population of Hohhot increased from 2.10 million in 2000 to 3.60 million in 2023, with the tertiary sector contributing 60.4% of its GDP. Chifeng maintained a population between 3.7 and 4.44 million during 2000–2023, and the tertiary industry accounted for 46.5% of its total GDP.
(3) The APO zones include Bayannur, Ulanqab, Tongliao, and Hinggan League. These regions are characterized by a strong reliance on primary industries, particularly agriculture and animal husbandry. According to the Inner Mongolia Statistical Yearbook, the total output value of animal husbandry in Tongliao and Hinggan League reached CNY 22.26 billion and CNY 14.34 billion, respectively, in 2023. Bayannur, supported by the Hetao Irrigation District, depends heavily on agriculture, with the primary industry accounting for 26.7% of GDP and generating an agricultural output value of CNY 29.59 billion in 2023. Ulanqab exhibits a mixed agro-pastoral structure, with the primary industry accounting for 20.0% of its GDP, and a total agro-pastoral output value of CNY 28.32 billion in 2023.
(4) The EO zones include Hulunbuir, Xilingol League, and Alxa League. These regions are characterized by a high proportion of ecological land, including forests, grasslands, and desert ecosystems. According to relevant datasets and previous studies, approximately 90.3% of Hulunbuir’s area is classified as ecological space. Hulunbuir exhibits relatively high ecosystem service values within the region, while Xilingol League, as a typical grassland pastoral area, also shows comparatively high ecosystem service values. In contrast, Alxa League, located in an arid desert region, is dominated by bare land and exhibits relatively fragile ecological conditions.

2.2. Organising and Preprocessing Data

The data used in this study included datasets on land use and factors driving land use change. The data sources and descriptions are detailed in Table 1.
Land use data were obtained from the China Land Cover Dataset (CLCD) [43]. This dataset was produced basefrom335,709 Landsat scenes using the Google Earth Engine platform and provides annual land cover information for China from 1985 to 2023. A high overall land use classification accuracy of 79.31% was achieved with the CLCD [44]. The classification scheme proposed by Gong et al. [43] is adopted in the CLCD [43]. The original classes were reclassified into six categories based on the ecological characteristics of and analytical needs in the study area: grassland, barren land, forest (including shrubland), cropland, water (merging snow/ice and wetlands), and impervious land.
GD arises from the interactions of multiple driving factors across temporal and spatial scales, and its drivers can be broadly categorized into natural and anthropogenic factors [45]. Climate change, as a fundamental driver, regulates grassland productivity and ecosystem stability by altering hydrothermal conditions and ecological processes [46]. In contrast, human activities, especially overgrazing and inappropriate land use (e.g., grassland reclamation, urban expansion, and mining), serve as direct drivers of GD by exacerbating ecological disturbance processes [47,48,49]. Based on the above understanding and informed by established analytical frameworks of GD drivers in the literature [18,20,35], this study selects relevant indicators from multiple dimensions, including climatic factors, human activities, and socio-economic development, to construct an indicator system that captures the key driving mechanisms of GD. Based on this framework and considering the specific conditions of the study area, a total of 12 indicators were selected and categorized into four groups (Table 1). Socio-economic data obtained from the Statistical Yearbooks were originally reported at the county level. To ensure spatial consistency with other raster-based environmental variables, these data were spatialized using the inverse distance weighting (IDW) interpolation method in ArcGIS 10.8, generating continuous raster surfaces for subsequent spatial matching and overlay analysis. Urbanization-related factors were processed by calculating Euclidean distances to generate their corresponding spatial distribution rasters. Subsequently, all raster datasets were standardized to a spatial resolution of 1 × 1 km2, projected onto the WGS_1984_Albers coordinate system, and aligned to ensure consistent row and column dimensions.

2.3. Methods

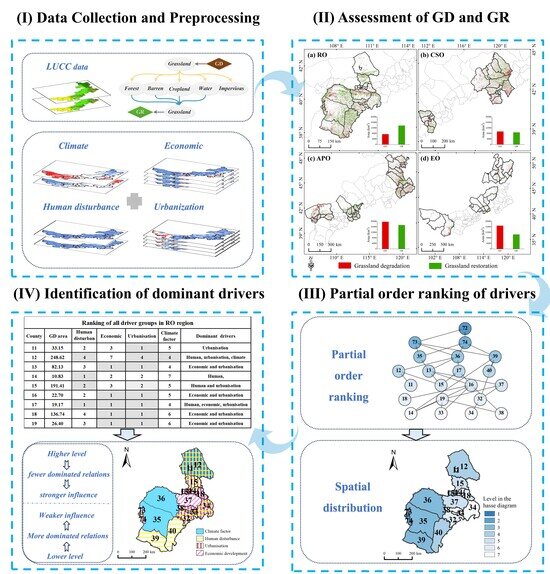
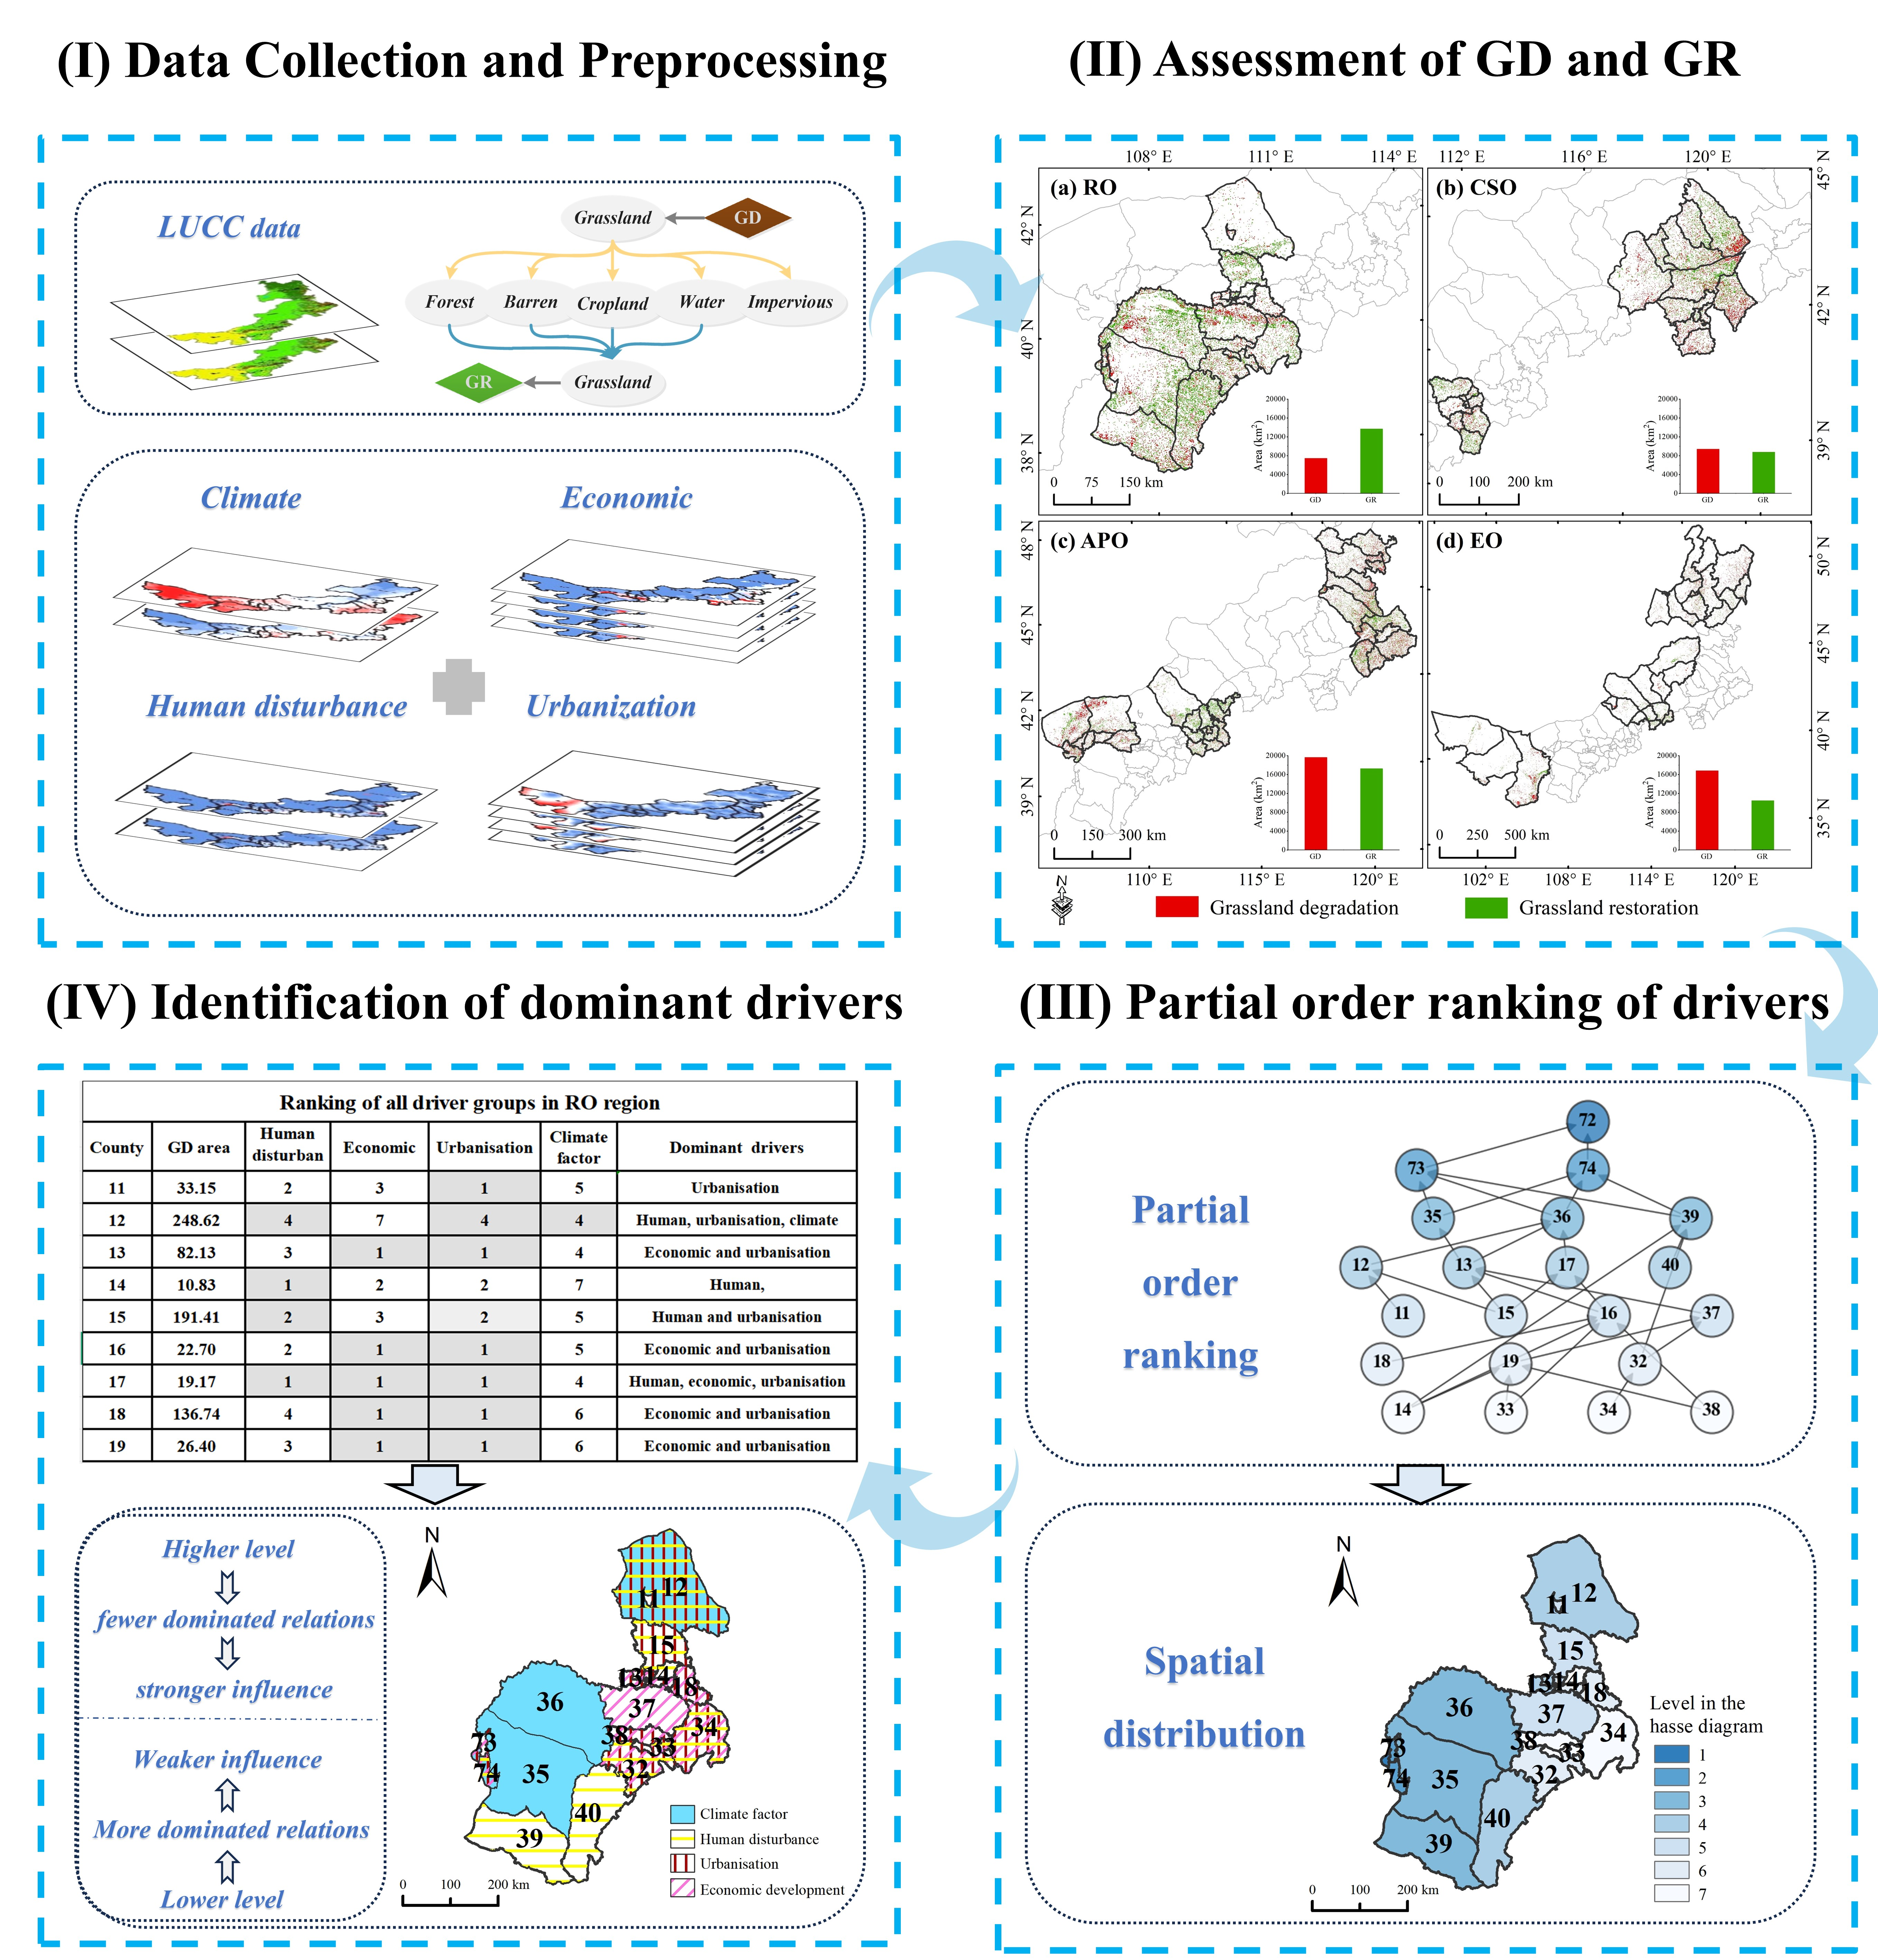
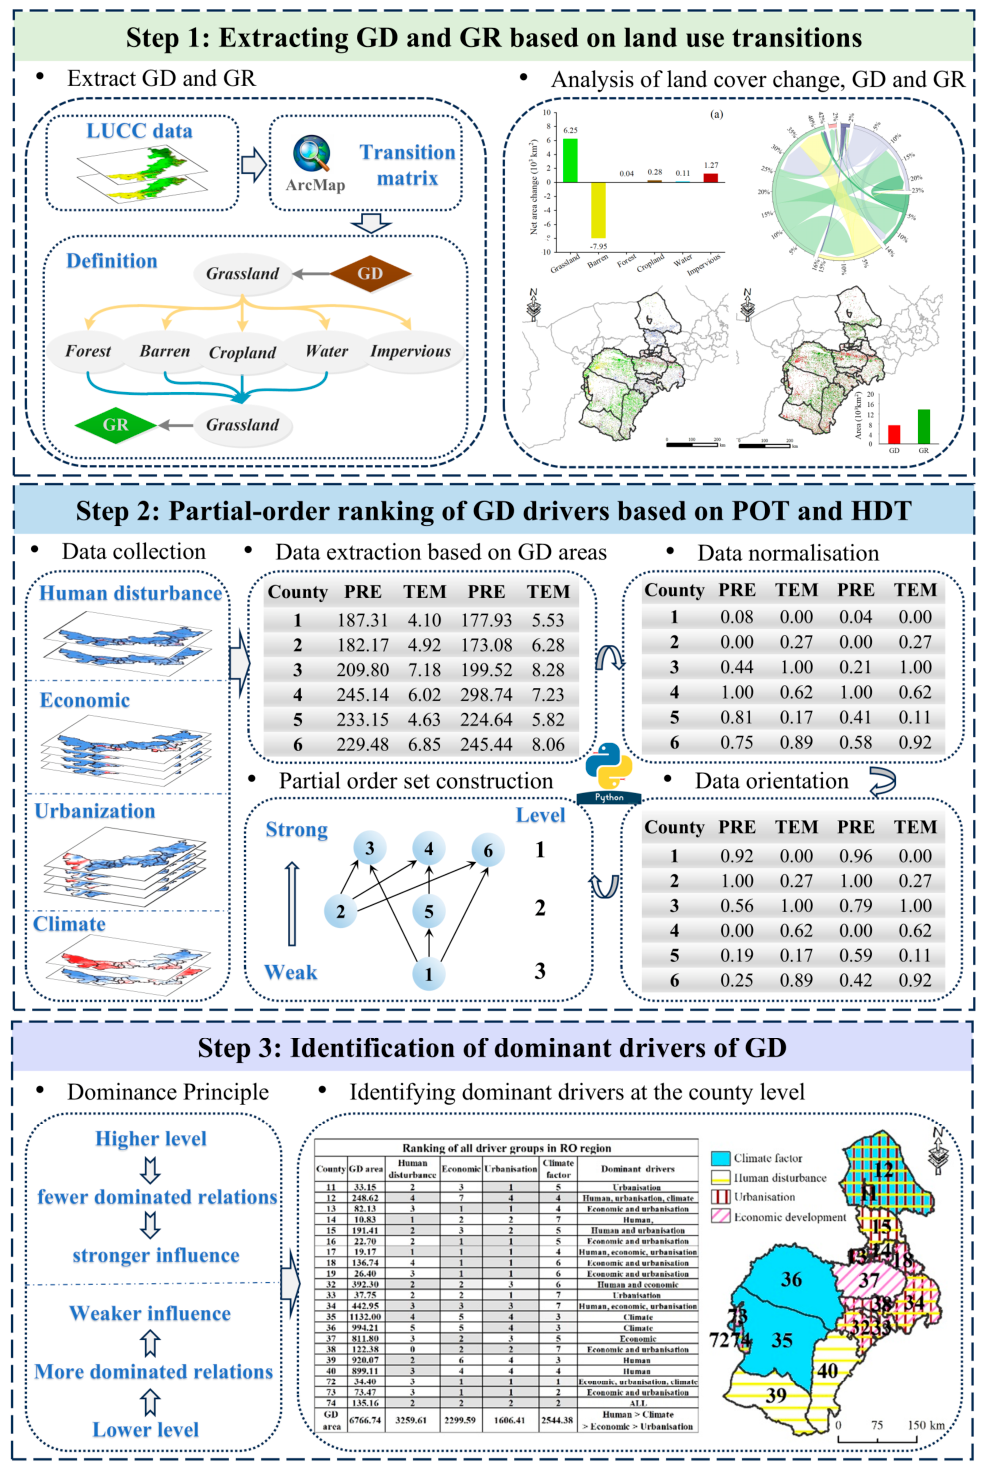
A three-step integrated analytical framework was developed, comprising GD and GR extraction, driving factor ranking, and identifying the main drivers (Figure 2). Firstly, the areas experiencing GD and GR were extracted based on land use transitions. Secondly, the four categories of driving factors were ranked using the POT and the Hasse diagram technique (HDT). A partial-order ranking procedure is illustrated using the effect of climatic factors on the RO cities as an example. This process was carried out under four steps. (i) Extracting driving factors in geographical locations with GD as input data, (ii) normalising the data, (iii) orientation processing, and (iv) forming a partial-order structure. Finally, based on the dominance principle of the partial-order structure, the main county level driving factors were recognized in the different urban functional zones.

2.3.1. Definition of GD and GR

GD is a multidimensional process that may manifest as structural degradation of the vegetation, quality degradation of plant and soil attributes, and functional degradation of ecosystem processes and services [50]. Bardgett et al. [2] pointed out that the conversion of grasslands into other land use types is a key manifestation of GD at the global scale. Monitoring GD based on LUCC can reflect the sources, rates, and extent of degradation, thereby revealing its dynamic evolution trends [35]. As a result, LUCC-based approaches have been widely used to identify GD at the regional scale [19,20]. However, LUCC does not fully capture degradation that occurs without a cover transition, such as declines in productivity, shifts in species composition or forage quality, and deterioration of soil organic matter, nutrient status, or other regulating functions. Accordingly, the results should be interpreted primarily as evidence of structural degradation/restoration.
Based on the above definition, GD is defined as a decrease in grassland cover or its conversion into other land use types (e.g., cropland, forest, barren, or water) in this study. Conversely, GR refers to an increase in grassland cover or the conversion of other land use types (such as cropland, forest, barren, or water) into grassland (Figure 2, step 1).

2.3.2. Partial Order Theory (POT)

The foundation of POT lies in the concept of comparison [51]. Partial-order relations allow for more complex data structures and retain the information of all compared elements compared with total ranking methods, [36]. POT is widely used in multivariate analysis to explore the hierarchical relationships among objects, prioritise variables, and assess system complexity. Let X = {a, b, c, …} be a set of objects of interest, where a, b, and c represent the elements being compared [52]. In this paper, the term “objects” refers to the county-level administrative units in Inner Mongolia.

2.3.3. Hasse Diagram Technique (HDT)

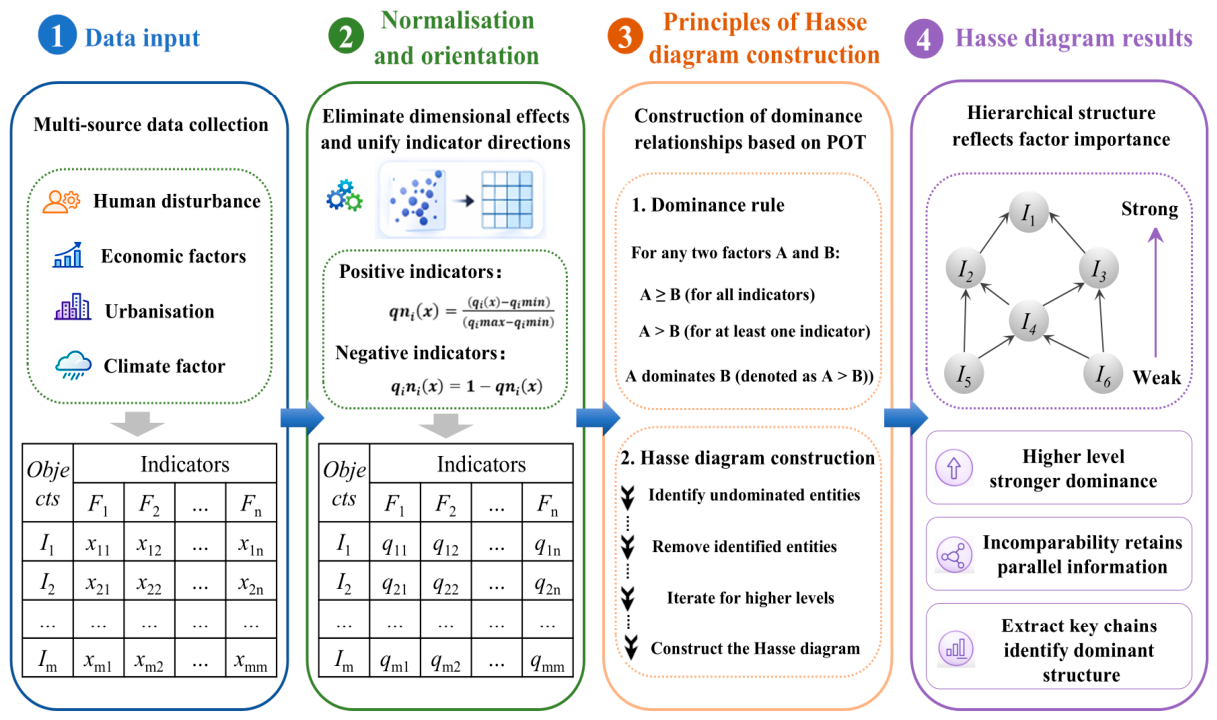
HDT is a graphical tool used to visualise the partial order relationships among objects characterised by multiple indicators. Various software tools are available to construct Hasse diagrams, such as WHASSE [53], PRORANK [54], POSAC [55], DART [56], and PyHasse [57]. Python (version 3.11) libraries such as Networkx (version 3.2.1) and Matplotlib (version 3.7.1) were used to construct and visualise the partial-order structures. As shown in Figure 2 is the workflow of the process of evaluating and ranking the evaluation objects using the HDT within a multicriteria decision-making framework that contains these 4 main steps.
(1)
Data input
Initially, the values of 12 driving factors were extracted for each county based on the spatial averages of areas identified as experiencing GD (Figure 3). Specifically, for each county, all raster pixels classified as degraded were aggregated, and the mean value of each driving factor was calculated to represent the regional conditions. Subsequently, for each combination of functional zone and driving factor group, an indicator matrix was constructed to represent the relationships between counties and driving factors. This resulted in 16 partial-order sets (4 functional zones × 4 factor groups) for subsequent analysis.
(2)
Normalisation and orientation
Before applying partial order theory, all driving factors were standardised and oriented to eliminate scale differences and ensure consistent effect directions. Before applying POT, all driving factors were standardised and oriented to eliminate scale differences and ensure consistent effect directions. Different factors have different strengths of influences on GD and these influences can be either positive or negative; thus, orientation processing was required to ensure consistency [18]. Larger indicator values in human disturbance and economic factor groups indicate stronger human or economic activity, which increase the risk of GD. These factors were defined as positive and normalised to the [0, 1] range. Smaller values for the urbanisation factors reflect closer proximity to disturbance sources, implying a stronger negative impact on grasslands. Urbanisation factors were thus defined as negative indicators and were normalised to [1, 0]. Within the climate factor group, precipitation positively contributes to grassland recovery and was therefore treated as a negative indicator [1, 0], whereas rising temperature tends to exacerbate GD and was defined as a positive indicator [0, 1]. Negative indicators were directionally transformed using Equation (2).
q n i x = q i x q i m i n q i m a x q i m i n
q i n i x = 1 q n i x
where qni represents the value of the ith indicator for the nth object; qimax and qimim denote the maximum and minimum values of the ith indicator, respectively.
(3)
Construction principles of partial order structures and hasse diagrams
Within the framework of partial order theory, a partial order structure among regions is constructed based on dominance relationships. Specifically, if region A is greater than or equal to region B across all indicators within a given group of driving factors, and strictly greater in at least one indicator, then region A is considered to dominate region B (Figure 3). Based on this principle, a hasse diagram is constructed to represent the dominance structure [35]. First, all regions that are not dominated by any other regions are identified and assigned to the first level. These regions are then removed from the set, and the remaining regions are re-evaluated to identify those that are not dominated, which are assigned to the second level. This process is iteratively repeated until all regions are classified into their respective hierarchical levels.
(4)
Structural interpretation of HDT using climatic drivers as a case study
The Hasse diagram in Step 2 in Figure 2 illustrates the partial-order structure of climatic factors influencing GD, using six counties in the RO zone as an example. Each node represents a county, and the directed edges between nodes indicate their partial-order relationships with respect to climatic driving factors. Nodes 3, 4, and 6 are located at the top level and are identified as maximal elements, suggesting that the GD in these counties was most strongly affected by climatic factors. In contrast, node 1 is positioned at the bottom and was thus identified as the minimal element, indicating node 1 had the weakest influence among the climatic factors on GD. The directional edge between nodes indicates their comparability under this driving factor dimension, forming a chain. Six chains were identified: {11, 13}, {12, 13}, {11, 15}, {15, 14}, {12, 14}, {11, 16}, and {12, 16}. The number of nodes contained in the longest chain defined the levels of the Hasse diagram, in which three levels were identified.

2.3.4. Identification of Dominant Drivers of GD

In the partial-order analysis, each group of driving factors within different urban functional zones was ranked separately, and corresponding hasse diagrams were constructed to derive the hierarchical structure of regions under different driving factors. This identification was based on the comparison of normalised indicator values across regions. Based on this structure, dominant driving factors were identified according to the hierarchical positions of regions within each factor group. In general, regions located at higher levels are less dominated by others, indicating a stronger influence of the corresponding driving factor on GD. By comparing the hierarchical positions of the same region across different driving factor groups, the dominant driving factor was determined. Accordingly, a driving factor was defined as dominant if it corresponded to the highest hierarchical level for a given region, whereas factors associated with the same level were regarded as jointly dominant. This rule-based approach ensures reproducibility and avoids subjective interpretation.

3. Results

3.1. GD and GR in Different Functional Zones

3.1.1. Land Cover Dynamics and Transition Patterns

From 2000 to 2023, all four urban functional zones experienced varying degrees of land use structural adjustment, with clear differences in both transformation intensity and dominant transition pathways.
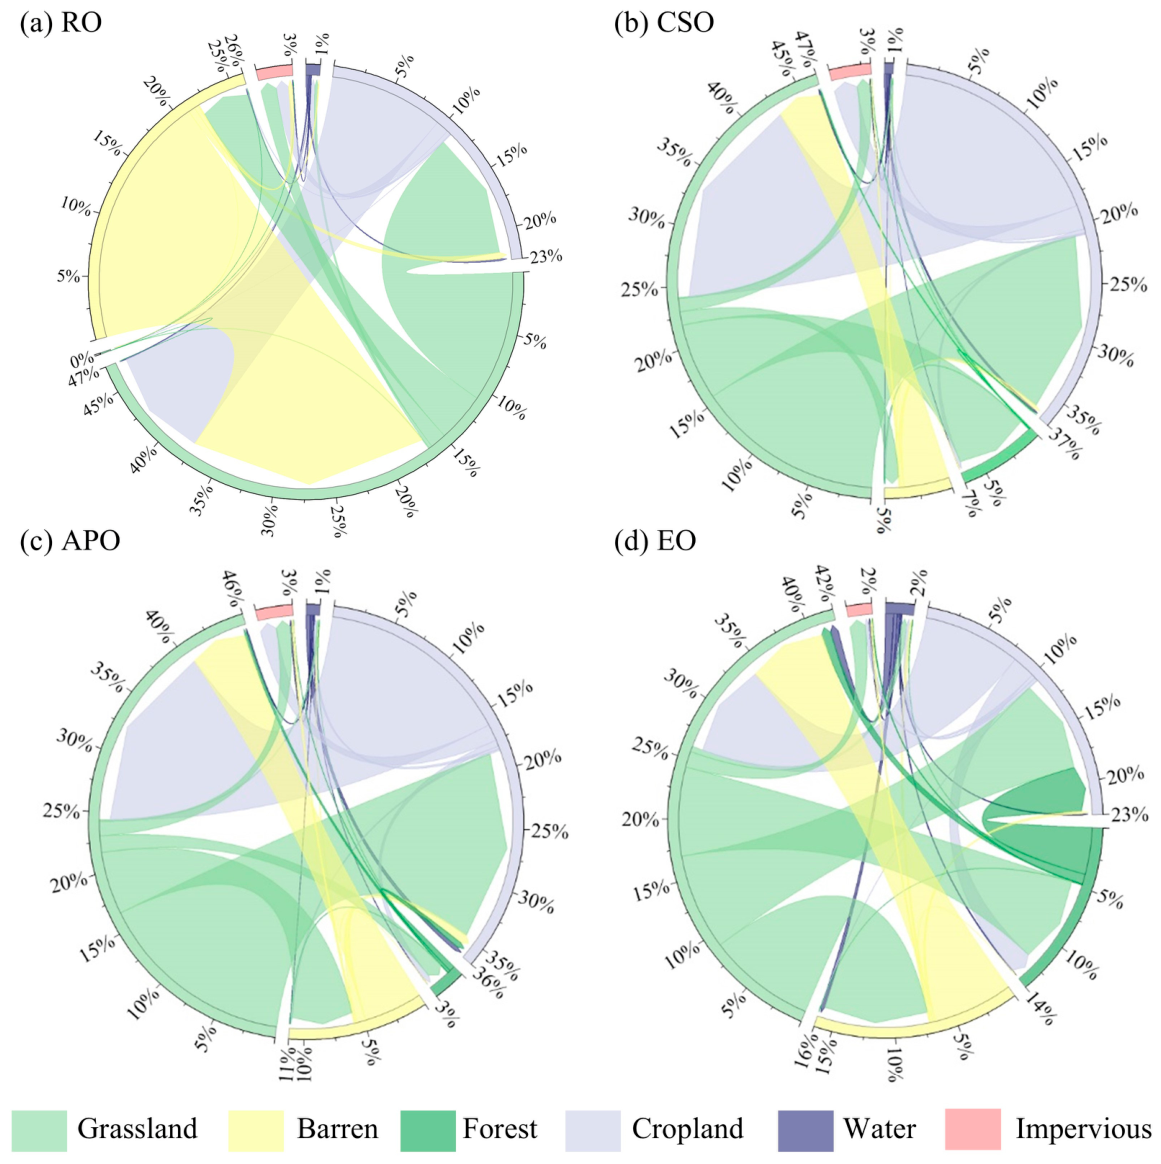
Based on the total area of each functional zone, the proportion of land conversion was highest in the RO zone, reaching 19.3% (22,407.4 km2), followed by the CSO and APO zones at 18.7% (19,451.6 km2) and 17.3% (40,355.9 km2), respectively. In contrast, the EO zone exhibited the lowest conversion proportion at only 4.7% (32,300.7 km2), indicating a relatively stable land use structure (Table 2; Figure 4a–d).
In terms of dominant change directions, the RO zone is characterized by net grassland restoration, with a net increase of 6247.1 km2, mainly driven by conversions from barren land and cropland; The CSO zone is characterized by the simultaneous expansion of forest and impervious areas. Forest increase was mainly derived from grassland conversion, while impervious surfaces expanded markedly, with 428.71 km2 of grassland and 779.81 km2 of cropland converted into impervious land; The APO zone exhibited the most pronounced land use change, with the largest total conversion area among all zones, reaching 40,355.9 km2. Grassland experienced a net decrease of approximately 2396.0 km2, mainly converted into barren land and cropland, while impervious increased by 2320 km2, primarily originating from grassland and cropland conversion; In contrast, the EO zone exhibited the lowest proportion of land conversion and relatively moderate overall changes. However, grassland still experienced a net decrease of 6350 km2, primarily converted into barren land, forest land, and cropland. Meanwhile, forest land increased by 2980 km2, mainly derived from grassland conversion.

3.1.2. Spatial Characteristics of GD and GR

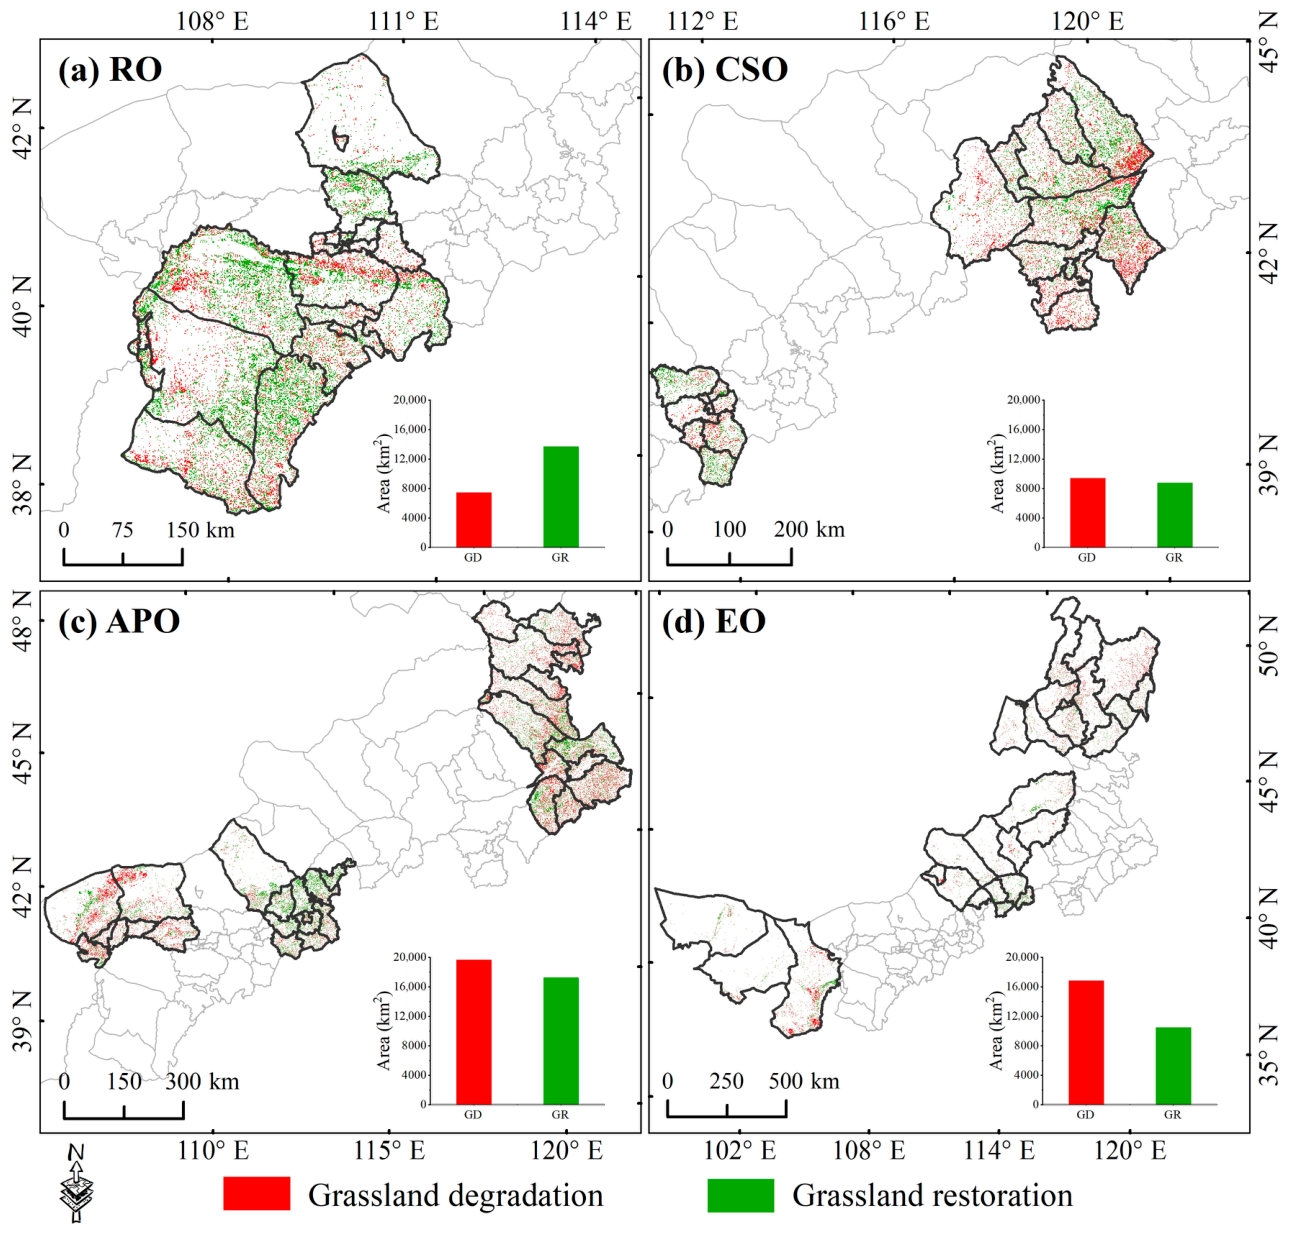
The area and proportion of GD and GR across functional zones are presented in Table 3, and their spatial distribution patterns are shown in Figure 5. All comparisons between GD and GR are descriptive and based on aggregated spatial data at the functional zone level, and no inferential analysis was performed.
During 2000–2023, grassland dynamics in the RO zone were characterized by a higher proportion of GR relative to GD. Restored areas accounted for 6.9% (13,696.2 km2) of the total area, exceeding the proportion of GD (3.8%, 7449.9 km2). GR was mainly concentrated in areas where key ecological projects were implemented, such as Hangjin Banner and Uxin Banner, while degradation primarily occurred in parts of Dalate Banner (Figure 5a). In the CSO zone, GD and GR accounted for 4.9% (9404.2 km2) and 4.5% (8768.1 km2) of the total area, respectively. GD mainly concentrated in the Ar Horqin Banner and Aohan Banner in Chifeng City, whereas GR was more scattered with no notable clustering (Figure 5b); In the APO zone, a GD-dominated pattern was observed, with GD and GR accounting for 4.5% (19,651.1 km2) and 3.9% (17,253.1 km2) of the total area, respectively. The GD areas spatially concentrated in the northern part of Bayannur (Urat Middle Banner and Urat Rear Banner) and were widely distributed in Tongliao and the Hinggan League (Figure 5c); In the EO zone, grassland changes remained relatively stable, with GD and GR accounting for 1.2% (16,845.5 km2) and 0.8% (10,495.2 km2) of the total area, respectively. Degraded grassland was mainly distributed in the southern part of the Alxa Left Banner, whereas GD was more scattered in the Xilingol League and Hulunbuir (Figure 5d).
Overall, grassland dynamics across functional zones exhibit clear differences in structural trajectories and the balance between restoration and degradation. The RO zone shows a higher proportion of GR relative to GD, whereas the APO zone is characterized by a higher proportion of GD. The CSO zone represents an intermediate pattern, while the EO zone exhibits relatively low transformation intensity. These results reflect the spatial heterogeneity of grassland structural changes across Inner Mongolia.

3.2. Major Drivers Ranking of GD in Different Functional Zones

Hasse diagrams of the four groups of factors driving GD were constructed for different urban functional zones in Inner Mongolia. We analysed the maximal elements, minimal elements, levels, and chains within the Hasse diagrams, identifying the GD response intensity to different driving factors in different regions. Maximal and minimal elements represent counties that are most strongly and most weakly influenced by the driving factors, respectively. Levels indicate the relative strength and hierarchical structure of different driving factors, while chains describe the ordered relationships among drivers, reflecting their relative influence and gradient variations in the GD process.
Dominant drivers were identified by comparing the normalized values of each factor between 2000 and 2023. Specifically, within each individual partial order structure, a driver was considered dominant in each county if its values in both years were consistently higher than those of other drivers. This dominance assignment is exclusive, meaning that only one dominant driver is identified for each county within each partial order structure. The spatial patterns were then derived by mapping the positions of counties in the Hasse diagram back to geographic space, so that the hierarchical structure of the diagram could be translated into spatial differences in driver influence.

3.2.1. RO Cities

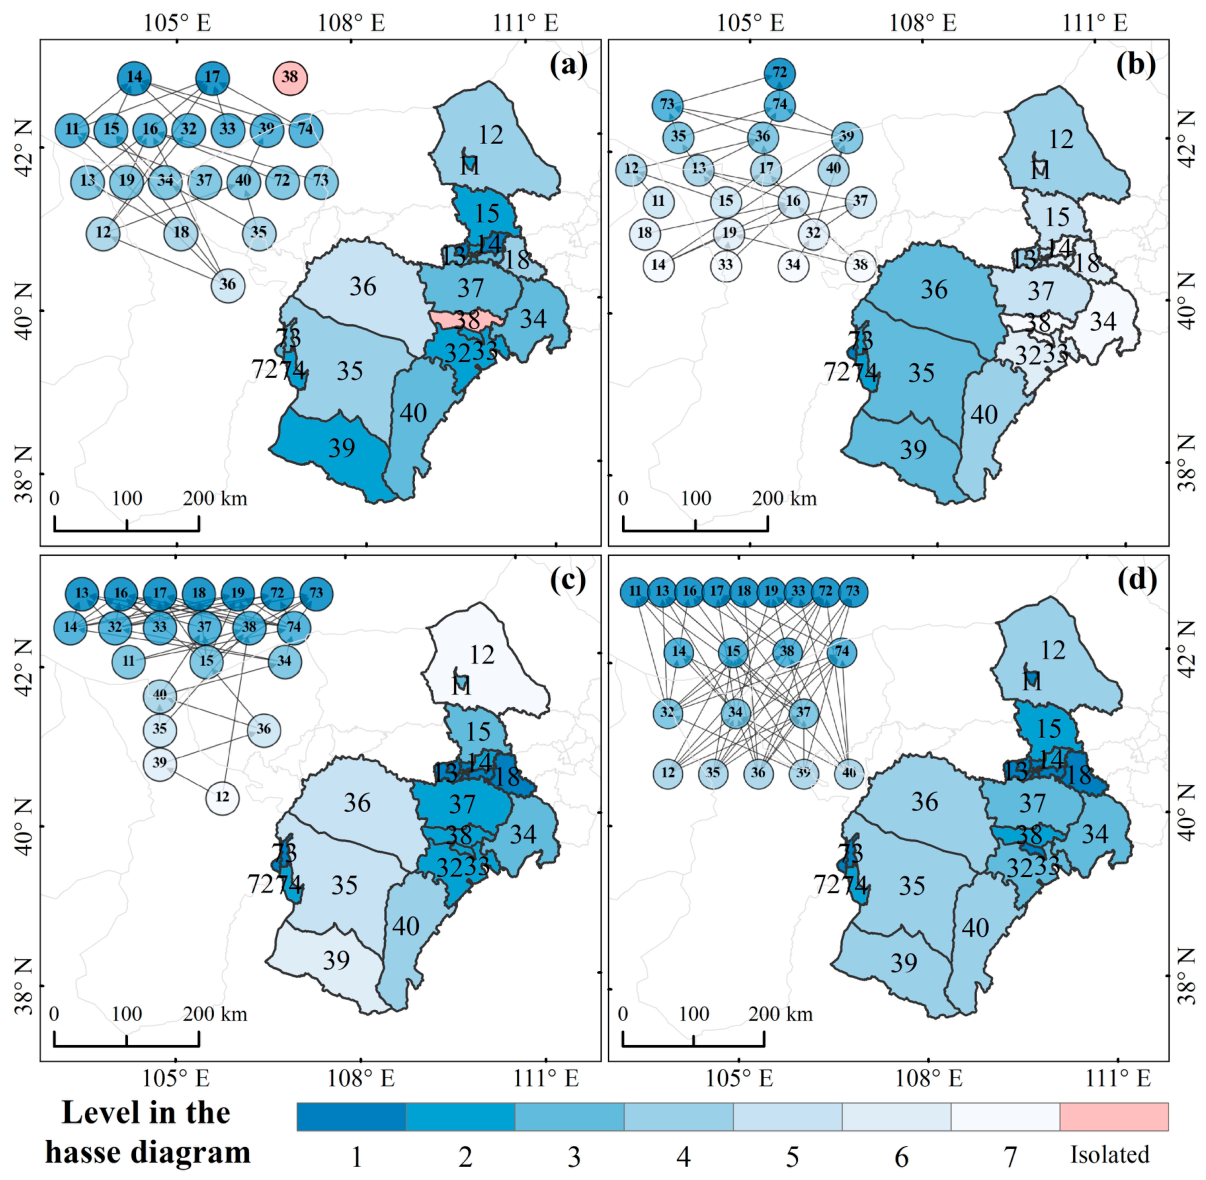
Based on this criterion, in the RO cities, GD was dominated by grazing intensity and population density in 62% and 24% of the counties, respectively (highlighted in yellow and pink in Table S2a). In the Hasse diagram, eight grazing-intensity-dominated chains were further identified: {35, 34, 15, 14}, {35, 40, 39, 14}, {36, 11, 14}, {36, 15, 14}, {36, 12, 32, 14}, {36, 12, 40, 39, 14}, {37, 11, 14}, and {74, 14}, along which grazing intensity gradually increased. Spatially, the regions strongly affected by human disturbance were mainly concentrated in the southern part of Baotou, which showed a strong clustering pattern (Figure 6a). The influence of climatic factors on GD decreased from west to east (Figure 6b). Counties 72, 73, and 74 were located at the top two levels of the Hasse diagram, indicating GD was strongly impacted by climatic factors. These areas are situated in the arid zone of Wuhai. In comparison, counties 14, 33, 34, and 38 were positioned at the bottom levels, being distributed across southern Baotou and eastern Ordos. The GD in 62% of the counties was mainly driven by primary industry (highlighted in yellow in Table S2c). Several primary-industry-dominated chains were identified, including {35, 40, 34, 14, 13}, {35, 40, 34, 32, 13}, {35, 40, 37, 13}, {35, 40, 34, 74, 13}, {35, 40, 34, 14, 72}, {35, 40, 34, 32, 72}, and {35, 40, 34, 74, 72}, with their spatial influence mainly concentrated in the central region (Figure 6c). In the urbanisation factor group, the Hasse diagram exhibited a four-level structure. Spatially, the impacts of urbanisation were most pronounced in the core urban areas in southern Baotou (Figure 6d).

3.2.2. CSO Cities

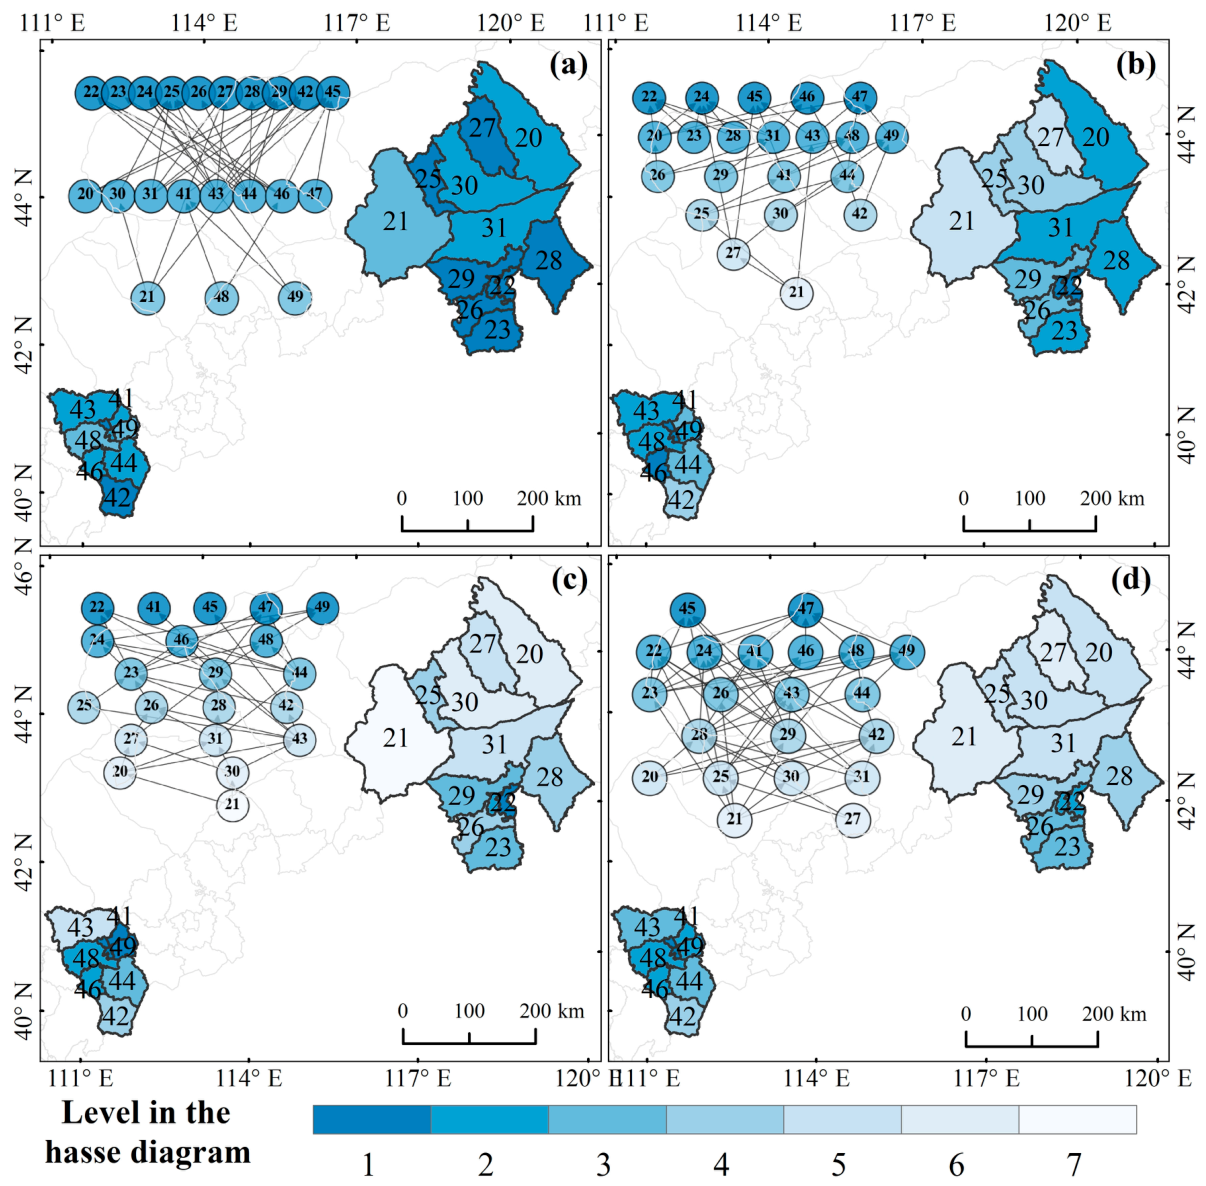
In the CSO zone, the partial-order analysis indicated that grazing intensity was the dominant factor influencing GD in 76% of the counties (highlighted in yellow in Table S3a), followed by population density in 20% of the counties (highlighted in pink). Spatially, high-level nodes mainly concentrated in southern Hohhot and southern Chifeng (Figure 7a). For the climatic factors, the Hasse diagram exhibited a six-level structure. However, spatial effects of the climatic factors were relatively dispersed, with no notable clustering based on visual interpretation (Figure 7b). Of the economic factors, the GD in 81% of counties was influenced by primary industry, with a strong spatial clustering pattern mainly in southern Chifeng and central Hohhot (Figure 7c). For the urbanisation factors, the GD in 48% and 19% of the counties was primarily influenced by proximity to rural settlements and transportation accessibility, respectively (highlighted in yellow and green in Table S3d, respectively). Spatially, counties located in the top two levels concentrated in central Hohhot, indicating the urbanisation-driven effects were strongest in this area. The lower-level counties were mainly distributed in the southeastern part of the CSO zone, where the urbanisation effects on GD were relatively weak (Figure 7d).

3.2.3. APO Cities

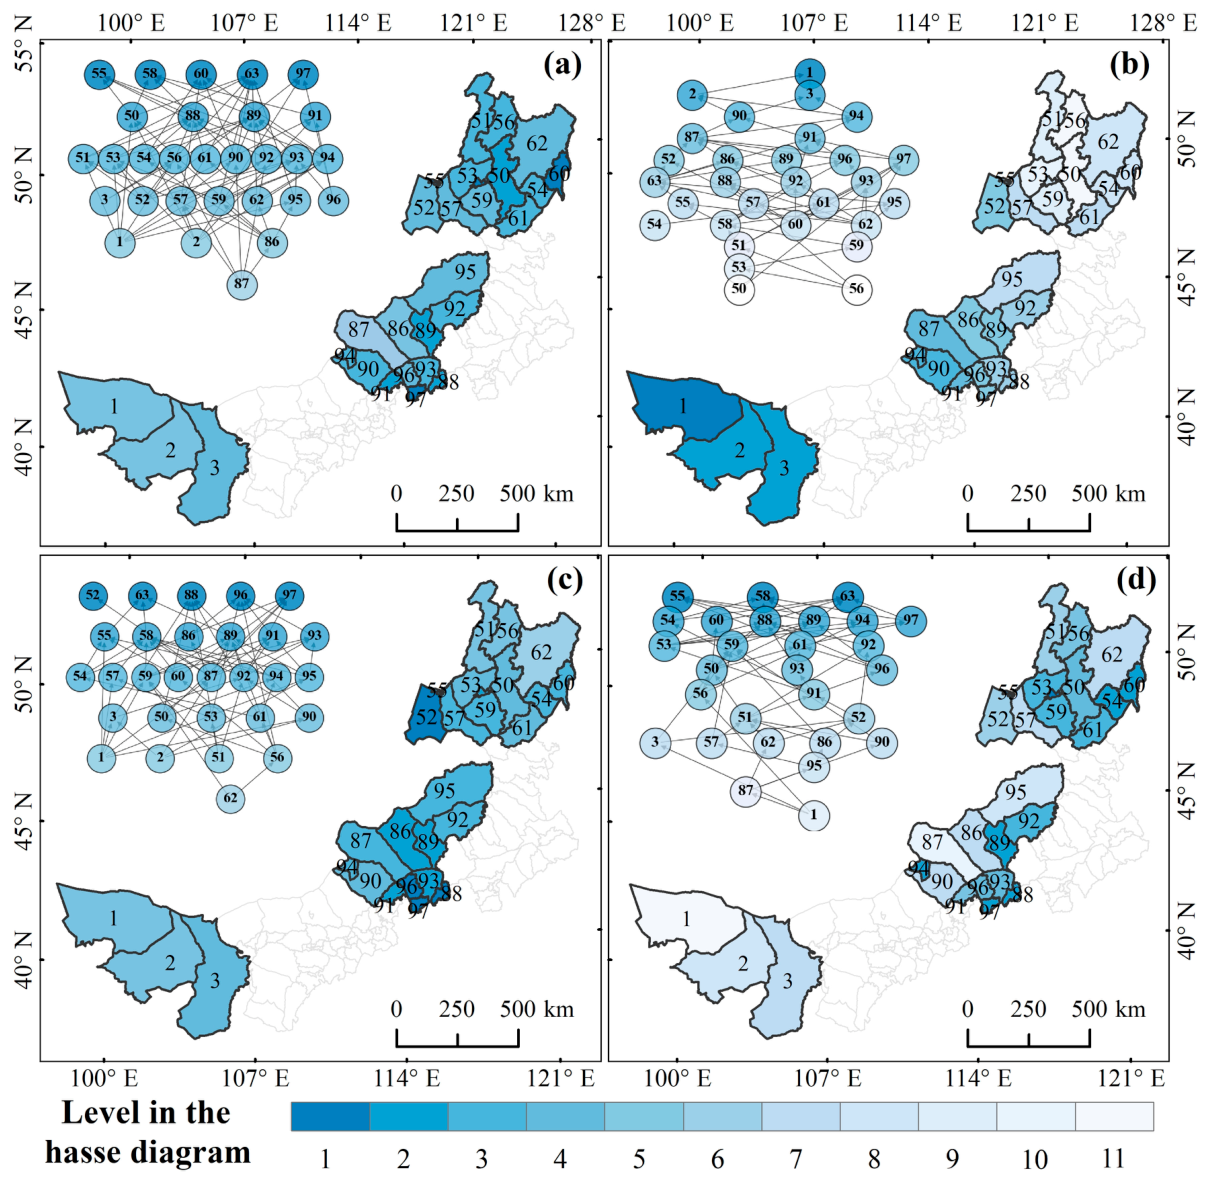
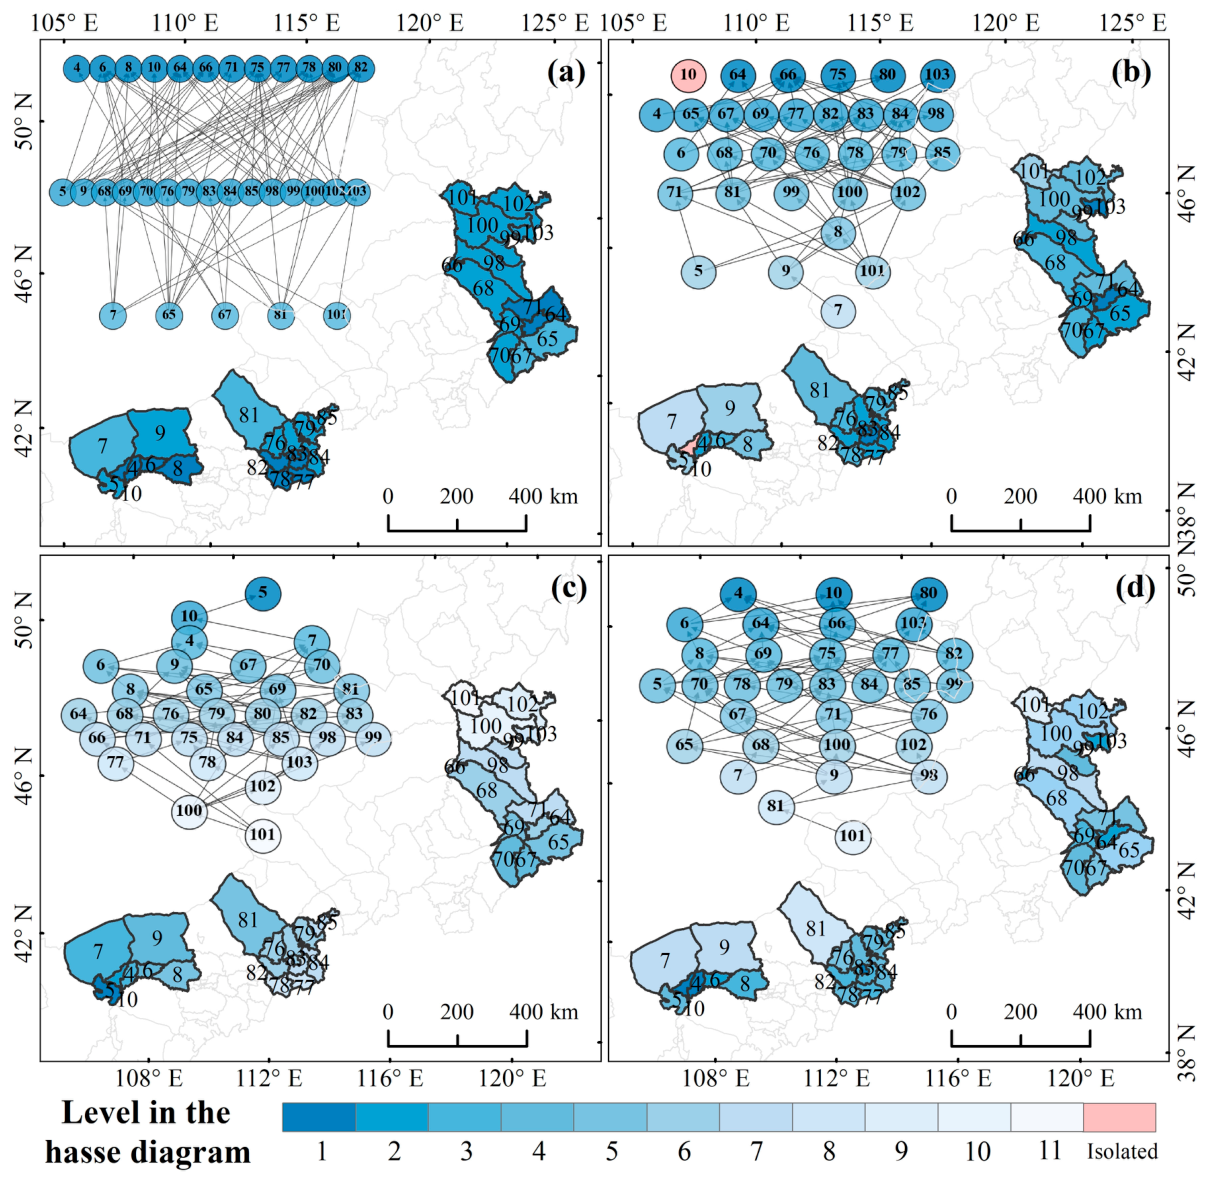
In the APO zone, the Hasse diagram of the urbanisation factor group exhibited a three-level structure, indicating relatively strong overall effects of these factors on GD (Figure 8a). The GD in approximately 75% of counties was primarily influenced by the proximity to rural settlements (highlighted in yellow in Table S4a); the GD in a few counties (e.g., 6, 66, and 103) was mainly influenced by the proximity to mining areas. Of the human disturbance factors, grazing intensity remained the dominant driver of GD in this zone (Figure 8b), suggesting that traditional pastoral pressures continued to affect grassland ecosystems. The influence of climatic factors on GD showed a spatial gradient, with effects appearing to weaken from west to east and from arid to humid zones based on visual inspection of the spatial distribution (Figure 8c). For the economic factors, although the GD area influenced by primary industry declined during 2000–2023, primary industry overall maintained a dominant role in influencing GD. Spatially, the regions in which GD was more strongly affected by economic factors were mainly concentrated in the Hetao Irrigation District in southern Bayannur and Ulanqab (Figure 8d).

3.2.4. EO Cities

In the EO zone, the Hasse diagram of urbanisation factors showed that counties 55, 58, 60, 63, and 97 were located at the highest levels of the partial-order structure (Figure 9a). The GD in these counties was most strongly driven by urbanisation, and the counties were mainly distributed in Hulunbuir. The indicator values suggest that the level of urbanisation was relatively high in most counties, indicating a noticeable influence of urbanisation on GD. Proximity to urban and rural settlements was the primary factor driving GD (Table S5a). The partial-order structure of climatic factors showed that the high-level counties were concentrated in the desert areas of western Alxa League, whereas low-level counties were mostly distributed in the eastern zone (Figure 9b). For human disturbance factors, grazing intensity was the major driver of GD, and the effect of population density on GD was still relatively weak. Two grazing-intensity-dominated chains were identified: {1, 87, 52} and {2, 87, 52}. Spatially, different patterns were observed, with grazing intensity strongly impacting the northeast and central areas and weakly affecting the southern and western parts of the EO zone (Figure 9c). The Hasse diagram showed that counties 55, 58, and 63 were positioned at the highest levels, indicating economic factors strongly influenced GD. GD was weakly affected by economic factors in most other counties. Spatially, areas in which economic factors strongly impacted GD mainly concentrated in central Hulunbuir and southern Xilingol League (Figure 9d).
Overall, the dominant drivers of GD exhibit clear cross-zone differentiation. Human disturbance and urbanisation play major roles in the RO and APO zones, while the CSO zone reflects a combined influence of human disturbance and climatic factors. In contrast, the EO zone shows more spatially heterogeneous patterns, with multiple drivers coexisting across different regions.

3.3. Identification of Main GD Drivers in Functional Zones in Inner Mongolia

Dominant drivers at both the county and regional scales were identified based on the partial-order ranking results of all driving factors (see Section 2.3.4). At the county scale, dominance was determined by the position of each factor within the Hasse hierarchy, with factors at the highest level identified as dominant; when multiple factors shared the same level, they were considered co-dominant. At the regional scale, these results were aggregated by calculating the total GD area associated with each driver to assess their overall influence (Tables S6–S9).
Table 4 presents a synthesis of the dominant drivers of GD across functional zones by reporting the number of affected counties and the associated GD area, thereby enabling a direct comparison of their relative influence.
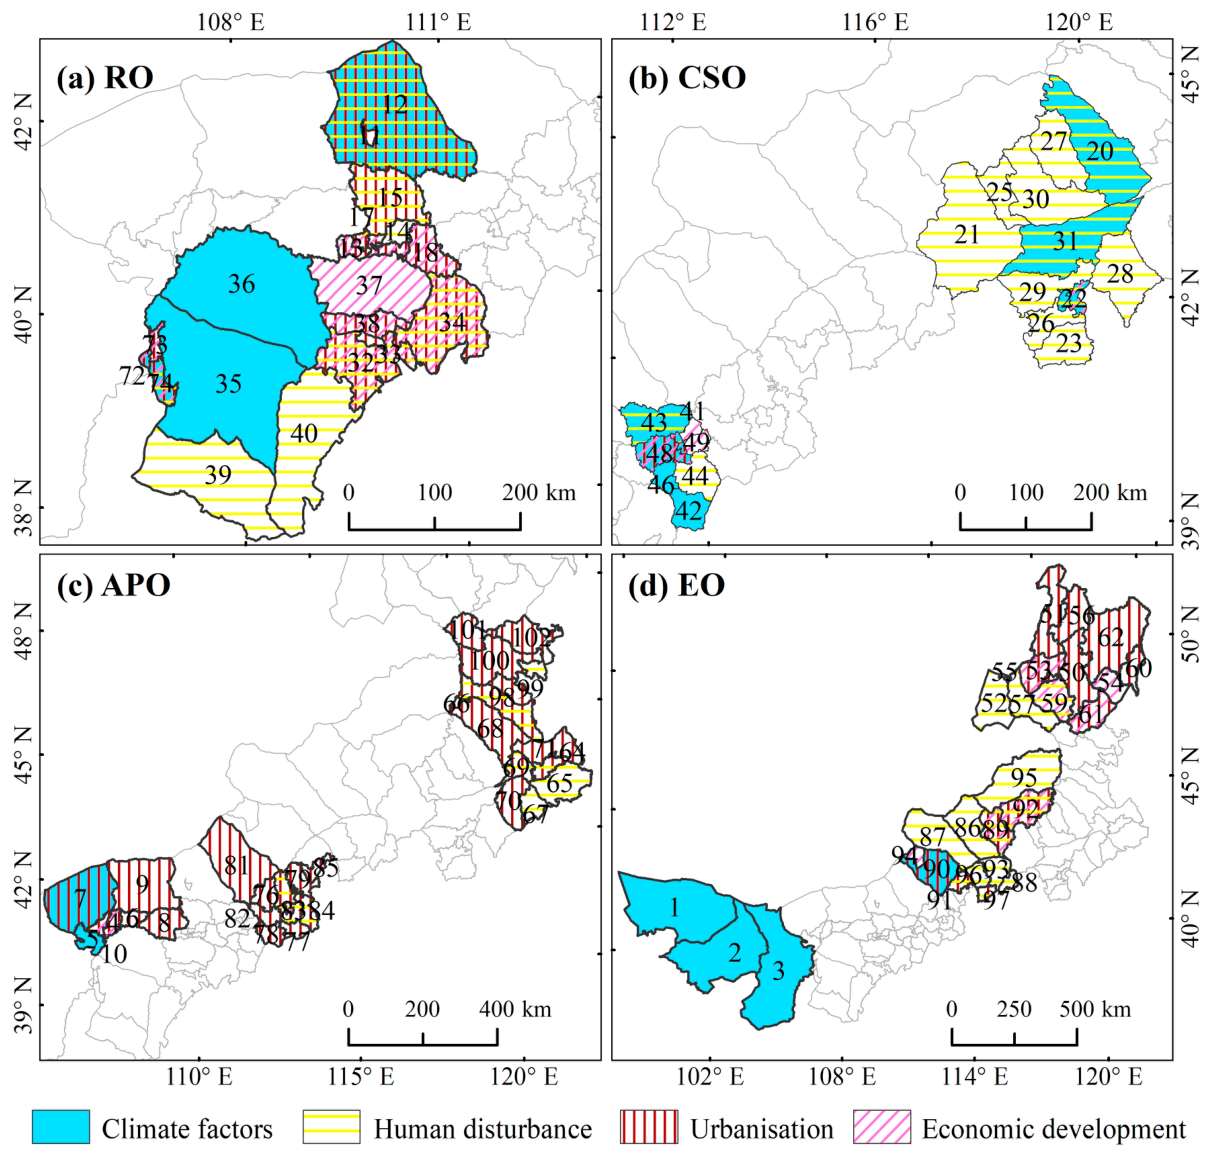
In the RO zone, human disturbance was the dominant driver, affecting nine counties and accounting for 33.6% of the total GD area (3259.6 km2), mainly concentrated in eastern and southern Ordos and northern Baotou (Figure 10a). Climatic factors ranked second, contributing 26.2% of the total GD area (2544.4 km2) and primarily distributed in the arid western and northern zones. Economic and urbanisation factors accounted for 23.7% (2299.6 km2) and 16.5% (1606.4 km2) of the total GD area, respectively, mainly influencing central urban areas.
In the CSO zone, human disturbance and climatic factors were the primary drivers, accounting for 67.3% (7691.1 km2) and 26.6% (3043.5 km2) of the total GD area, respectively. Human disturbance was widely distributed across Chifeng, while climatic factors were more prominent in Hohhot (Figure 10b). In contrast, economic and urbanisation factors contributed relatively small proportions, accounting for 4.1% and 2.0% of the total GD area, respectively.
The APO zone exhibited the largest GD extent, with urbanisation and human disturbance as the dominant drivers, accounting for 63.6% (15,206.6 km2) and 22.5% (5389.0 km2) of the total GD area, respectively. Climatic and economic factors contributed smaller proportions, accounting for 11.9% (2842.0 km2) and 2.0% (486.8 km2), respectively. Spatially, urbanisation effects were widespread across Ulanqab, Tongliao, and Hinggan League (Figure 10c).
In the EO zone, urbanisation and climatic factors accounted for 39.3% (6759.0 km2) and 24.1% (4143.7 km2) of the total GD area, respectively, followed by human disturbance (20.6%) and economic factors (16.0%). GD in eastern Hulunbuir and northern Xilingol was influenced by multiple drivers, whereas GD in western Alxa was primarily associated with climatic factors (Figure 10d).
Overall, the dominant drivers of GD exhibit clear cross-zone differentiation, with human disturbance and urbanisation playing major roles in the RO and APO zones, a combined influence of human and climatic factors in the CSO zone, and more spatially heterogeneous multi-driver interactions in the EO zone.

4. Discussion

4.1. Comparative Assessment of Contributions of Driving Factors to GD

The partial-order analysis indicated that the spatial mechanisms driving GD widely differed with the urban functional zone. The underlying causes were explored through considering the natural and socioeconomic characteristics in each region. It should be noted that the partial-order framework identifies dominance relationships and structured associations among driving factors, rather than establishing direct causal attribution.
In the RO region, grassland dynamics were characterized by a higher proportion of GR relative to GD, indicating a greater extent of grassland gain (i.e., conversion into grassland). Previous studies have shown that although ecological restoration programs can increase grassland area, such changes may be influenced by policy-driven interventions and short-term management practices, and therefore do not necessarily reflect genuine recovery of ecosystem functioning [58]. In addition, the expansion of grassland in some areas may also be linked to land abandonment driven by rural labor outmigration, representing a form of passive restoration [59]. However, from a mechanistic perspective, human disturbance, especially grazing intensity, remains the dominant driver of grassland degradation. The number of livestock in Ordos has substantially increased since 2000 [60]. Vegetation cover and productivity decline when the grazing pressure exceeds the carrying capacity of grassland, accelerating soil erosion and desertification processes [61]. Climate factors ranked second in influencing GD, exerting a stronger influence on western banners and counties. Changes in climate factors primarily alter regional water budgets through precipitation and temperature variations, inhibiting vegetation growth [62,63]. In arid and semiarid zones, precipitation influences productivity more than temperature, with water scarcity being the key constraint for the recovery of vegetation [16]. Reduced or unstable precipitation limits herbaceous plant growth and recovery, leading to the decreased productivity of grassland ecosystems [16]. In eastern Ordos and Baotou City, economic development and urbanisation constituted the dominant local drivers of GD. The economy in Ordos is highly reliant on coal mining and use [64], with coal extraction volumes exhibiting exponential growth since 2000 [65]. The expansion of infrastructure, such as roads, mining areas, and urban land, has contributed to grassland occupation and increased landscape fragmentation. However, the observed net grassland gain in the RO zone should be interpreted with caution, as it may also reflect policy-driven land reclassification, land abandonment, or short-term land-use dynamics, rather than genuine ecological recovery.
The CSO zone was predominantly influenced by human disturbance and climatic factors, with the former more strongly affecting Chifeng City and the latter more strongly affecting Hohhot City. Chifeng City has experienced sustained growth in livestock numbers, the effects of which, when compounded by the effects of population pressure and urban land expansion, have contributed to the prolonged high-intensity use of grasslands. Chifeng hosts the largest livestock inventory in Inner Mongolia, averaging over 16 million sheep per year [66]. Despite the relatively high carrying capacity of the grassland in the region, overgrazing has been associated with localised overexploitation and vegetation degradation [66]. In contrast, Hohhot lies within the arid–semiarid transition zone of central–western China and has more recently experienced a warming and drying trend [67]. This trend has intensified evapotranspiration and created soil moisture deficits, constraining vegetation growth and establishing a climate-dominated GD pathway. Consequently, the adaptive capacity and resilience of grassland ecosystems to the intensification of climate change must be enhanced through contemporary ecological management strategies.
Within the APO region, the grassland ecosystems are fragile and subject to intense human activity. Accelerated urbanisation was identified as the primary driver of GD in areas such as Tongliao, Ulanqab, and Xing’an League. Since the implementation of the Western Development Strategy in 2001, resource-based industries, such as coal and power generation, have rapidly expanded within the region, promoting a sustained population concentration in urban centres as well as driving land development and spatial expansion [66,67]. This urbanisation process has impacted grassland ecosystems through multiple pathways: the expansion of urban construction land has been associated with the occupation of substantial areas of high-quality grassland, leading to a sharp reduction in grassland coverage and ecological function degradation [68]; rural settlements and the expansion of agricultural land have continuously encroached upon grassland margins, subjecting grassland spaces to persistent pressures through encroachment and fragmentation. The construction of transport infrastructure such as roads and railways has further fragmented contiguous grassland landscapes, reducing ecological connectivity and weakening the self-repair capacity of the system.
The mechanisms driving GD in the EO zone widely differed with region. The partial-order ranking results indicated that the GD process in Hulunbuir City was primarily driven by urbanisation. Since 2000, the rapid expansion of open-cast coal mining has led to the extensive removal of surface vegetation, reducing grassland coverage and accelerating degradation [69]. Moreover, the expansion of road networks has markedly intensified grassland fragmentation, diminishing landscape connectivity and ecological resilience in pastoral areas [70]. In contrast, the Alxa League, situated in an arid zone, has an extremely vulnerable ecosystem owing to high temperatures and water scarcity. Here, GD was more strongly driven by climate change, which is consistent with prior findings [69]. Extensive natural grasslands have sustained long-term pastoral production in these zones [71]. However, long-term surveys and remote sensing monitoring indicate that nearly half of the southwestern Xilingol League suffers from overgrazing [72]. Overgrazing not only reduces vegetation cover but also disrupts the grassland community structure and regenerative capacity, accelerating soil desertification and erosion. This was the primary driver of GD in this region [66].
Overall, the four functional zones reflect not only the spatial heterogeneity of driving factors, but also represent distinct transformation pathways of grassland systems. From a social–ecological systems perspective, the RO zone can be characterised as a pastoral-pressure-driven regime, in which increasing livestock numbers gradually exceed the ecological carrying capacity, leading to vegetation degradation, elevated soil erosion risk, and reduced system stability; The CSO zone represents a mixed transitional regime, where human disturbances and a warming–drying trend jointly drive a shift from use-pressure dominance to increasing climatic constraints; The APO zone can be classified as an urban-expansion-driven regime, in which resource development and infrastructure construction reshape grassland spatial structures through land occupation and fragmentation, transforming pastoral landscapes into urban–industrial mosaics; In contrast, the EO zone can be regarded as a climate-constrained regime (with local anthropogenic amplification), where water limitation and temperature variability define ecological vulnerability, while local development activities further intensify this vulnerability. These findings indicate that GD is not a linear process driven by a single factor, but rather a multi-pathway evolutionary process shaped by the coupled effects of natural constraints, land-use intensity, and institutional factors. This conceptualisation provides a more integrated understanding of the mechanisms underlying GD and the trajectories of system transformation.

4.2. Region-Specific Management Strategies for Mitigating GD

The partial-order dominance results provide a basis for developing differentiated management strategies tailored to different dominance regimes. Specifically, in areas characterised by a single dominant driver, management may primarily target the leading constraint. In contrast, in co-dominance regimes, where multiple drivers jointly influence grassland degradation, single-factor interventions are unlikely to be sufficient, and more integrated management approaches are required.
In human-disturbance-dominant regimes, management may prioritise restoring the grass–livestock balance and reducing direct pressure on vegetation and soils. Grazing intensity could be adjusted through rotational grazing, seasonal rest, carrying-capacity-based stocking regulation, and, where necessary, short- to medium-term enclosure or fallow measures [73]. Ecological compensation and livelihood-support policies may further reduce incentives for herd expansion and improve the feasibility of sustained pressure reduction [74].
In climate-dominant regimes, management should place greater emphasis on drought adaptation and ecological resilience. Water-saving technologies, soil-moisture conservation measures, and the restoration of degraded patches with native drought-tolerant grasses and shrubs could be prioritised to buffer vegetation against increasing water stress [75,76]. Meanwhile, remote sensing and field observations could be integrated into drought monitoring and early warning systems, allowing grazing intensity, forage allocation, and restoration schedules to be adjusted in response to climatic variability [77].
In urbanisation-dominant regimes, the principal task is to limit further encroachment and fragmentation of ecological land. This may involve strengthening land-use regulation, delineating urban development boundaries, and constraining the expansion of construction land, mining sites, roads, and associated infrastructure into ecologically vulnerable grasslands [78]. Within already disturbed landscapes, restoration efforts could focus on fragmented patches, ecological corridors, and buffer zones, while adjacent grazing pressure may still need to be regulated to prevent secondary degradation [79].
In co-dominance regimes, however, management should move beyond sector-specific responses. For example, where grazing pressure and climate stress are jointly dominant, stocking-rate adjustment should be coupled with drought contingency planning, reserve forage, and dynamic monitoring of rainfall and vegetation conditions [76]. Where urbanisation co-dominates with human disturbance or climate stress, land-use regulation should be coordinated with grazing management and ecological restoration to avoid merely shifting degradation across space [80]. Thus, the practical value of the partial-order analysis lies not only in identifying which drivers matter most, but also in distinguishing where targeted intervention is likely to be effective and where cross-sector, adaptive governance is necessary.

4.3. Implications of Partial Order Theory

Drivers of land use change are dynamic and synergistic, exhibiting a hierarchical structure, and spatial heterogeneity [81,82]. Combining POT with the HDT offers a nonparametric multiple-indicator ranking method based on relative relationships. This approach is well-suited for identifying dominant driving mechanisms within complex multifactor contexts. Compared with other driver analysis methods, the principal advantages of PDT–HDT include the following: Firstly, POT does not rely on artificially assigned indicator weights or predefined scoring criteria. Instead, it constructs a ranking system based on the relative relationships among data points, thereby avoiding biases associated with linear assumptions and subjective weighting [36]. Secondly, POT accommodates multidimensional heterogeneous data, handling situations in which some indicators are incomparable, while fully preserving the ranking information of all comparison objects [36]. Finally, the partial-order analysis visually represents the dominance relationships and hierarchical structures among the factors through Hasse diagrams. This facilitates the identification of dominant factors and their relative positions in different regions, revealing ranking disparities among areas [20]. This characteristic is valuable for spatial zoning management and differentiated policy formulations in GD governance [18].

4.4. Study Limitations and Future Work

The present study still has several limitations that warrant further refinement in future research.
First, the identification of GD and GR in this study is primarily based on land-use transitions. Although this approach can effectively capture structural changes in grassland systems at broad spatial scales, it remains insufficient to fully reflect degradation processes in terms of ecosystem quality and function. Some forms of functional degradation may occur without obvious land-use conversion. Therefore, future research could adopt a multidimensional perspective by incorporating indicators related to structure, quality, and function, in order to more comprehensively characterise grassland degradation processes.
Second, some socioeconomic variables were derived from county-level statistical data and were spatialised using the IDW method to enable integration with raster-based natural variables. However, administrative statistics are inherently discrete and boundary-dependent, and their interpolation into continuous raster surfaces may introduce artificial spatial gradients across county boundaries, potentially smoothing abrupt local differences or exaggerating spatial continuity. Therefore, future research could explore more appropriate spatialisation approaches for administrative data, such as zone-based analysis or multi-scale aggregation, and incorporate cross-validation using multi-source data to improve the reliability of the results.
Finally, although the POT and HDT can effectively reduce the subjectivity associated with artificially assigned weights in traditional ranking methods, they still exhibit certain limitations in multidimensional ecosystem analyses. Among these, one of the most fundamental issues is the widespread presence of “incomparability” within the partial-order structure. From the perspective of POT, incomparability does not simply imply a failure of the method to produce a ranking but rather reflects the multidimensional trade-offs that are inherently embedded in complex socio-ecological systems. Different driving factors may exhibit relative advantages under different dimensions, meaning that no single factor can consistently dominate all others across the entire indicator space. Under such conditions, forcing a single linear ranking may obscure the genuine differences among driving mechanisms and oversimplify the complex synergies and trade-offs among climate change, human activities, economic development, and urbanisation. Nevertheless, the existence of incomparability also introduces certain limitations for result interpretation and practical decision-making. Because partial-order analysis cannot easily produce a unique and stable total-order structure, clear priority relationships may not always be established among some driving factors. As a result, the identified patterns often reflect only “relative dominance” or “co-dominance” relationships, rather than an absolute priority ranking, thereby increasing the complexity of ecological management and resource allocation to some extent.
This incomplete certainty may be further influenced by factors such as classification errors, indicator system construction, and spatial scale. Because partial-order relationships are established through relative comparisons among multidimensional indicators, the dominance relationships among driving factors are inherently condition-dependent. First, this study identifies grassland degradation and restoration processes based on land-use transitions; therefore, the results are, to some extent, dependent on the classification accuracy of the CLCD. Misclassification among grassland, cropland, barren land, and other land-cover types may lead to erroneous identification of degradation or restoration transitions, thereby further affecting the relative dominance relationships among driving factors; Second, the partial-order results exhibit a certain sensitivity to the construction of the indicator system. Different indicator selections may alter the relative advantages of driving factors, thereby affecting the hierarchical relationships within the partial-order structure. In particular, when strong correlations or conflicts exist among multidimensional indicators, a larger number of incomparable relationships may emerge, thereby reducing the stability and interpretability of the identified dominance patterns; In addition, the partial-order results exhibit clear scale dependency. Different spatial scales or aggregation schemes may alter the spatial correspondence between natural and socioeconomic variables, causing the same driving factor to exhibit different dominance characteristics across scales. Therefore, future research could further incorporate sensitivity analysis, uncertainty quantification, and multi-scale comparative analyses to systematically evaluate the stability and robustness of the partial-order structure, thereby improving the reliability and interpretability of the results.

5. Conclusions

Using LUCC data and a multifactor partial-order ranking framework, this study identified the dominant drivers of GD across four functional zones in Inner Mongolia from 2000 to 2023. Land-use transitions accounted for 19.3%, 18.7%, 17.3%, and 4.7% of the total area in the RO, CSO, APO, and EO zones, respectively. GR was concentrated primarily in RO, whereas GD constituted the dominant change signal in CSO and APO; EO remained comparatively stable. The partial order ranking results indicate that grassland change in this dryland system is not governed by a single factor, but by the combined effects of human activities and climate. Specifically, climatic constraints become increasingly dominant in the arid western regions, whereas anthropogenic influences, particularly human disturbance and urbanisation, play a stronger role in areas characterised by intensive human activity, rapid socio-economic development, and elevated ecological pressure. Overall, the study reveals a pronounced climate-sensitivity gradient across functional zones, whereby the relative influence of aridity and anthropogenic pressure shifts systematically in space.
These spatial differences provide important insights into dryland ecosystem vulnerability under ongoing warming and aridification. Climate-dominated zones are likely to face persistent or even intensified degradation risks and may approach threshold-like shifts in ecosystem functioning under extreme conditions. In contrast, areas primarily influenced by urbanisation and human disturbance may experience multiple pressures associated with landscape fragmentation and reduced ecological resilience. Therefore, the present findings may support the development of more context-specific and place-based grassland management strategies. It should be noted that, constrained using LUCC observations and the partial-order framework, the results primarily reflect dominant associations among driving factors rather than strict causal relationships. Future research could extend this framework from attribution analysis to prospective risk assessment. Integrating climate projections would help evaluate how different driver regimes may evolve under future warming. In addition, multi-scale validation could improve the reliability of degradation and restoration identification. Coupling this framework with process-based models would further enable the explicit representation of feedback among water limitation, land-use pressure, and ecosystem responses, thereby enhancing its applicability to vulnerability assessment and adaptive management in dryland regions.

Supplementary Materials

The following supporting information can be downloaded at: https://www.mdpi.com/article/10.3390/land15050776/s1, Table S1: The land use classification system of CLCD; Table S2: Input values for the hasse diagrams of GD drivers in resource-oriented cities from 2000 to 2023; Table S3: Input values for the hasse diagrams of GD drivers in central service-oriented cities from 2000 to 2023; Table S4: Input values for the hasse diagrams of GD drivers in agro-pastoral-oriented cities from 2000 to 2023; Table S5: Input values for the hasse diagrams of GD drivers in ecology-oriented cities from 2000 to 2023; Table S6: Ranking of all driver groups in RO from 2000 to 2023; Table S7: Ranking of all driver groups in CSO cities from 2000 to 2023; Table S8: Ranking of all driver groups in APO cities from 2000 to 2023; Table S9: Ranking of all driver groups in EO cities from 2000 to 2023.

Author Contributions

Conceptualization, B.; methodology, Y.M.; software, Y.M.; validation, C.A.; writing—original draft preparation, Y.M.; writing—review and editing, Y.H. and R.G.; supervision, C.H.; project administration, B.; funding acquisition, B. All authors have read and agreed to the published version of the manuscript.

Funding

This work was supported by the National Natural Science Foundation of China Youth Fund [Grant No. 42301362]; Scientific Research Innovation Capability Support Project for Young Faculty [No grant number]; the First-Class Discipline Scientific Research Special Project [Grant No. ylxkzx-nsd-028]; the National Natural Science Foundation of China Regional Fund [Grant No. 42261048]; the 2023 Young Scientific and Technological Talent Development Program (Young Scientific Talent) [Grant No. njyt23017]; Open Fund Project of State Key Laboratory of Resources and Environmental Information System, Institute of Geographic Sciences and Natural Resources Research, Chinese Academy of Sciences [No grant number]; the 2023 Ministry of Human Resources and Social Security’s Talent Sponsorship Program for Studying Abroad [No grant number]; the Central Guidance Funds for Local science and technology Development projects: Intelligent Ecological Decision-Making: Integrating AI and Partial Order Theory for Land Use Optimization [Grant No. 2025ZY0049]; and the First-Class Discipline Scientific Research Special Project [Grant No. YXKZX-NSD-002]. High-Level Talent Introduction Research Project of the Inner Mongolia Autonomous Region (2021) (No grant number).

Data Availability Statement

The datasets used in this study were obtained from multiple publicly available sources. Land cover data were derived from the China Land Cover Dataset (CLCD) at a 30 m spatial resolution, available via Zenodo (https://doi.org/10.5281/zenodo.4417809, accessed on 2 January 2026); Population density and economic indicators, including total population, primary, secondary, and tertiary industry outputs as well as gross domestic product (GDP), were obtained from the Inner Mongolia Statistical Bureau (http://tj.nmg.gov.cn/, accessed on 4 January 2026); Grazing intensity data were sourced from Figshare (https://doi.org/10.6084/m9.figshare.26195684, accessed on 10 January 2026); Patial proximity variables, including distances to urban areas, rural settlements, and mining sites, were obtained from the Resource and Environment Science and Data Center (http://www.resdc.cn/, accessed on 15 January 2026), while transportation accessibility data were derived from the Harvard Dataverse (https://dataverse.harvard.edu/, accessed on 15 January 2026); Climate variables, including precipitation and temperature, were acquired from the National Tibetan Plateau Data Center (https://data.tpdc.ac.cn/, accessed on 20 January 2026). The processed datasets generated during the current study are available from the corresponding author upon reasonable request.

Conflicts of Interest

The authors declare no conflicts of interest.

Abbreviations

The following abbreviations are used in this manuscript:
GDGrassland degradation
GRGrassland restoration
CSOCenter-service-oriented
APOAgro-pastoral-oriented
POTPartial-order theory
PDPopulation density
GIGrazing intensity
PIPrimary industry
SISecondary industry
TITertiary industry
GDPGross domestic product
PUAProximity to urban areas
PRSProximity to rural settlements
PMSProximity to mining sites
TATransportation accessibility
PREPrecipitation
TEMTemperature

References

  1. Sun, J.; Wang, Y.; Piao, S.; Liu, M.; Han, G.; Li, J.; Liang, E.; Lee, T.M.; Liu, G.; Wilkes, A.; et al. Toward a Sustainable Grassland Ecosystem Worldwide. Innovation 2022, 3, 100265. [Google Scholar] [CrossRef] [PubMed]
  2. Bardgett, R.D.; Bullock, J.M.; Lavorel, S.; Manning, P.; Schaffner, U.; Ostle, N.; Chomel, M.; Durigan, G.; Fry, E.L.; Johnson, D.; et al. Combatting Global Grassland Degradation. Nat. Rev. Earth Environ. 2021, 2, 720–735. [Google Scholar] [CrossRef]
  3. Ding, L.; Li, Z.; Shen, B.; Wang, X.; Xu, D.; Yan, R.; Yan, Y.; Xin, X.; Xiao, J.; Li, M.; et al. Spatial Patterns and Driving Factors of Aboveground and Belowground Biomass over the Eastern Eurasian Steppe. Sci. Total Environ. 2022, 803, 149700. [Google Scholar] [CrossRef]
  4. Liu, Y.-F.; Meng, L.-C.; Huang, Z.; Shi, Z.-H.; Wu, G.-L. Contribution of Fine Roots Mechanical Property of Poaceae Grasses to Soil Erosion Resistance on the Loess Plateau. Geoderma 2022, 426, 116122. [Google Scholar] [CrossRef]
  5. Wang, H.; Yan, S.; Liang, Z.; Jiao, K.; Li, D.; Wei, F.; Li, S. Strength of Association between Vegetation Greenness and Its Drivers across China between 1982 and 2015: Regional Differences and Temporal Variations. Ecol. Indic. 2021, 128, 107831. [Google Scholar] [CrossRef]
  6. Lark, T.J.; Spawn, S.A.; Bougie, M.; Gibbs, H.K. Cropland Expansion in the United States Produces Marginal Yields at High Costs to Wildlife. Nat. Commun. 2020, 11, 1234567890. [Google Scholar] [CrossRef]
  7. An, R.; Zhang, C.; Sun, M.; Wang, H.; Shen, X.; Wang, B.; Xing, F.; Huang, X.; Fan, M. Monitoring Grassland Degradation and Restoration Using a Novel Climate Use Efficiency (NCUE) Index in the Tibetan Plateau, China. Ecol. Indic. 2021, 131, 108208. [Google Scholar] [CrossRef]
  8. Li, Y.; Han, X.; Li, B.; Li, Y.; Du, X.; Sun, Y.; Li, Q.; Bezemer, T.M. Soil Addition Improves Multifunctionality of Degraded Grasslands through Increasing Fungal Richness and Network Complexity. Geoderma 2023, 437, 116607. [Google Scholar] [CrossRef]
  9. Wang, S.; Dai, E.; Jia, L.; Wang, Y.; Huang, A.; Liao, L.; Cai, L.; Fan, D. Assessment of Multiple Factors and Interactions Affecting Grassland Degradation on the Tibetan Plateau. Ecol. Indic. 2023, 154, 110509. [Google Scholar] [CrossRef]
  10. Wang, S.; Jia, L.; Cai, L.; Wang, Y.; Zhan, T.; Huang, A.; Fan, D. Assessment of Grassland Degradation on the Tibetan Plateau Based on Multi-Source Data. Remote Sens. 2022, 14, 6011. [Google Scholar] [CrossRef]
  11. Zhang, G.; Yan, J.; Zhu, X.; Ling, H.; Xu, H. Spatio-Temporal Variation in Grassland Degradation and Its Main Drivers, Based on Biomass: Case Study in the Altay Prefecture, China. Glob. Ecol. Conserv. 2019, 20, e00723. [Google Scholar] [CrossRef]
  12. Li, T.; Li, S.; Li, P.; Huang, J.; Wang, J.; Ochir, A.; Yang, M.; Wang, T.; Shun Chan, F.K. Spatiotemporal Variability in Drivers of Grassland Degradation and Recovery under Economic Transformation in Mongolia. J. Environ. Manag. 2025, 393, 127097. [Google Scholar] [CrossRef]
  13. Chen, J.; Huang, R.; Luo, L.; Yi, S.; Qin, Y.; Qi, W.; You, H.; Han, X.; Zhou, G. A Multi-Tiered Representativeness Framework Mitigating Spatial Scale Effects in FVC Validation: UAV-Based Assessment of Global Products in Qinghai-Tibetan Plateau Alpine Grasslands. Int. J. Appl. Earth Obs. Geoinf. 2025, 143, 104794. [Google Scholar] [CrossRef]
  14. Zhang, X.; Liu, Y.; Sun, M.; Hong, J.; Zhu, Q.; Lu, X.; Wang, X. Soil Moisture and Livestock Jointly Drive Grassland Degradation Mitigation Based on Sensitivity Analysis. Agric. Water Manag. 2025, 319, 109822. [Google Scholar] [CrossRef]
  15. Zheng, H.; Huang, Y.; Zhang, W.; Song, C.; Zhang, Q.; Sun, W.; Yu, Y.; Yu, L.; Li, H.; Zhang, C.; et al. The Implementation of Ecological Protection in Inner Mongolia Has Slowed down Grassland Degradation. Fundam. Res. 2025, 5, 2719–2730. [Google Scholar] [CrossRef]
  16. Xue, H.; Chen, Y.; Dong, G.; Li, J. Quantitative Analysis of Spatiotemporal Changes and Driving Forces of Vegetation Net Primary Productivity (NPP) in the Qimeng Region of Inner Mongolia. Ecol. Indic. 2023, 154, 110610. [Google Scholar] [CrossRef]
  17. Zhang, N.; Li, Z.; Feng, Y.; Li, X.; Tang, J. Development and Application of a Vegetation Degradation Classification Approach for the Temperate Grasslands of Northern China. Ecol. Indic. 2023, 154, 110857. [Google Scholar] [CrossRef]
  18. Batunacun; Wieland, R.; Lakes, T.; Yunfeng, H.; Nendel, C. Identifying Drivers of Land Degradation in Xilingol, China, between 1975 and 2015. Land Use Policy 2019, 83, 543–559. [Google Scholar] [CrossRef]
  19. Hu, Y.; Nacun, B. An Analysis of Land-Use Change and Grassland Degradation from a Policy Perspective in Inner Mongolia, China, 1990–2015. Sustainability 2018, 10, 4048. [Google Scholar] [CrossRef]
  20. Li, X.; An, C.; Batunacun; Feng, Y.; Liu, K.; Mei, Y. Partial Order Ranking of the Key Drivers of Grassland Conversion in the Urban–Grassland Interface: A Case Study of the Hohhot–Baotou–Ordos Region. Appl. Sci. 2025, 15, 5906. [Google Scholar] [CrossRef]
  21. Shi, S.; Yu, J.; Wang, F.; Wang, P.; Zhang, Y.; Jin, K. Quantitative Contributions of Climate Change and Human Activities to Vegetation Changes over Multiple Time Scales on the Loess Plateau. Sci. Total Environ. 2021, 755, 142419. [Google Scholar] [CrossRef]
  22. Hou, Q.; Ji, Z.; Yang, H.; Yu, X. Impacts of Climate Change and Human Activities on Different Degraded Grassland Based on NDVI. Sci. Rep. 2022, 12, 15918. [Google Scholar] [CrossRef]
  23. Briske, D.D.; Zhao, M.; Han, G.; Xiu, C.; Kemp, D.R.; Willms, W.; Havstad, K.; Kang, L.; Wang, Z.; Wu, J.; et al. Strategies to Alleviate Poverty and Grassland Degradation in Inner Mongolia: Intensification vs Production Efficiency of Livestock Systems. J. Environ. Manag. 2015, 152, 177–182. [Google Scholar] [CrossRef]
  24. Dai, G.S.; Ulgiati, S.; Zhang, Y.S.; Yu, B.H.; Kang, M.Y.; Jin, Y.; Dong, X.B.; Zhang, X.S. The False Promises of Coal Exploitation: How Mining Affects Herdsmen Well-Being in the Grassland Ecosystems of Inner Mongolia. Energy Policy 2014, 67, 146–153. [Google Scholar] [CrossRef]
  25. Seto, K.C.; Güneralp, B.; Hutyra, L.R. Global Forecasts of Urban Expansion to 2030 and Direct Impacts on Biodiversity and Carbon Pools. Proc. Natl. Acad. Sci. USA 2012, 109, 16083–16088. [Google Scholar] [CrossRef]
  26. Chen, J.; John, R.; Zhang, Y.; Shao, C.; Brown, D.G.; Batkhishig, O.; Amarjargal, A.; Ouyang, Z.; Dong, G.; Wang, D.; et al. Divergences of Two Coupled Human and Natural Systems on the Mongolian Plateau. BioScience 2015, 65, 559–570. [Google Scholar] [CrossRef]
  27. Chen, J.; John, R.; Shao, C.; Fan, Y.; Zhang, Y.; Amarjargal, A.; Brown, D.G.; Qi, J.; Han, J.; Lafortezza, R.; et al. Policy Shifts Influence the Functional Changes of the CNH Systems on the Mongolian Plateau. Environ. Res. Lett. 2015, 10, 085003. [Google Scholar] [CrossRef]
  28. Teng, Y.; Miaomiao, X.; Huihui, W.; Yan, C.; Feng, L. Land Use Transition in Resource-Based Cities and Its Impact on Habitat Quality: A Case of Wuhai City. Acta Ecol. Sin. 2022, 42, 7941–7951. [Google Scholar] [CrossRef]
  29. Chen, K.; Yang, C.; Bai, L.; Chen, Y. Effects of Natural and Human Factors on NDVI Variation in Inner Mongolia Based on the Geographical Detector Model. Acta Ecol. Sin. 2021, 41, 4295–4305. [Google Scholar]
  30. Jing, Y.; Sun, R.; Chen, L. A Method for Identifying Urban Functional Zones Based on Landscape Types and Human Activities. Sustainability 2022, 14, 4130. [Google Scholar] [CrossRef]
  31. Li, S.; Verburg, P.H.; Lv, S.; Wu, J.; Li, X. Spatial Analysis of the Driving Factors of Grassland Degradation under Conditions of Climate Change and Intensive Use in Inner Mongolia, China. Reg. Environ. Change 2012, 12, 461–474. [Google Scholar] [CrossRef]
  32. Lyu, X.; Li, X.; Dang, D.; Dou, H.; Gong, J. A New Method for Grassland Degradation Monitoring by Vegetation Species Composition Using Hyperspectral Remote Sensing. Ecol. Indic. 2020, 114, 106310. [Google Scholar] [CrossRef]
  33. Yan, Z.; Gao, Z.; Sun, B.; Ding, X.; Gao, T.; Li, Y. Global Degradation Trends of Grassland and Their Driving Factors since 2000. Int. J. Digit. Earth 2023, 16, 1661–1684. [Google Scholar] [CrossRef]
  34. He, C.; Tian, J.; Gao, B.; Zhao, Y. Differentiating Climate- and Human-Induced Drivers of Grassland Degradation in the Liao River Basin, China. Environ. Monit. Assess 2014, 187, 4199. [Google Scholar] [CrossRef]
  35. Mei, Y.; Batunacun; An, C.; Wu, Y.; Bao, Y.; Liu, K.; Feng, Y.; Hu, Y.; Hai, C.; Nendel, C. Identifying the Dominant Drivers of Grassland Degradation in Inner Mongolia, China. Ecol. Indic. 2025, 179, 114161. [Google Scholar] [CrossRef]
  36. Brüggemann, R.; Patil, G.P. Partial Order and Hasse Diagrams. In Ranking and Prioritization for Multi-Indicator Systems: Introduction to Partial Order Applications; Springer: New York, NY, USA, 2011; pp. 13–23. [Google Scholar]
  37. Dou, H.; Li, X.; Li, S.; Dang, D.; Li, X.; Lyu, X.; Li, M.; Liu, S. Mapping Ecosystem Services Bundles for Analyzing Spatial Trade-Offs in Inner Mongolia, China—ScienceDirect. J. Clean. Prod. 2020, 256, 120444. [Google Scholar] [CrossRef]
  38. Li, D.; Wu, S.; Liu, L.; Zhang, Y.; Li, S. Vulnerability of the Global Terrestrial Ecosystems to Climate Change. Glob. Change Biol. 2018, 24, 4095–4106. [Google Scholar] [CrossRef]
  39. Van Loon, A.F.; Stahl, K.; Di Baldassarre, G.; Clark, J.; Rangecroft, S.; Wanders, N.; Gleeson, T.; Van Dijk, A.I.; Tallaksen, L.M.; Hannaford, J.; et al. Drought in a Human-Modified World: Reframing Drought Definitions, Understanding, and Analysis Approaches. Hydrol. Earth Syst. Sci. Discuss. 2016, 20, 3631–3650. [Google Scholar] [CrossRef]
  40. Wang, Y.; Yang, Y. Analysis of the Heterogeneous Coordination between Urban Development Levels and the Ecological Environment in the Chinese Grassland Region (2000–2020): A Case Study of the Inner Mongolia Autonomous Region. Land 2024, 13, 951. [Google Scholar] [CrossRef]
  41. Chen, Z.; Wang, F.; Li, S.; Feng, Y.; Chen, J. Classification of County Leading Function Types and Pattern Recognition of Its Spatial Structure Based on Multi-Source Data. J. Geo-Inf. Sci. 2021, 23, 2215–2231. [Google Scholar]
  42. Yang, W.; Xia, B.; Li, Y.; Qi, X.; Zhang, J. Prediction and Scenario Simulation of Carbon Emissions Peak of Resource-Based Urban Agglomeration with Industrial Clusters—Case of Hubaoe Urban Agglomeration Inner Mongolia Autonomous Region, China. Energies 2024, 17, 5521. [Google Scholar] [CrossRef]
  43. Gong, P.; Wang, J.; Yu, L.; Zhao, Y.; Zhao, Y.; Liang, L.; Niu, Z.; Huang, X.; Fu, H.; Liu, S.; et al. Finer Resolution Observation and Monitoring of Global Land Cover: First Mapping Results with Landsat TM and ETM+ Data. Int. J. Remote Sens. 2013, 34, 2607–2654. [Google Scholar] [CrossRef]
  44. Yang, J.; Huang, X. The 30 m Annual Land Cover Dataset and Its Dynamics in China from 1990 to 2019. Earth Syst. Sci. Data 2021, 13, 3907–3925. [Google Scholar] [CrossRef]
  45. Du, Z.; Cong, N.; Zhao, G.; Zheng, Z.; Wang, D.; Wang, X.; Cai, M.; Guo, Y.; Zhang, Y. Divergent Responses of Vegetation and Soil Characteristics to Grassland Degradation in the Qinghai-Tibet and Inner Mongolia Plateaus. CATENA 2025, 257, 109146. [Google Scholar] [CrossRef]
  46. Mganga, K.Z.; Nyariki, D.M.; Musimba, N.K.R.; Amwata, D.A. Determinants and Rates of Land Degradation: Application of Stationary Time-Series Model to Data from a Semi-Arid Environment in Kenya. J. Arid. Land 2018, 10, 1–11. [Google Scholar] [CrossRef]
  47. Feng, H.; Zhou, J.; Zhou, A.; Su, D.; Han, X.; Xiong, R. Co-Evolution Mechanism of Grassland Degradation and Its Belowground Habitat under the Influence of Coal Mining Activities. CATENA 2024, 241, 107997. [Google Scholar] [CrossRef]
  48. Vorovencii, I. Changes Detected in the Extent of Surface Mining and Reclamation Using Multitemporal Landsat Imagery: A Case Study of Jiu Valley, Romania. Environ. Monit. Assess. 2021, 193, 30. [Google Scholar] [CrossRef] [PubMed]
  49. Batunacun; Nendel, C.; Hu, Y.; Lakes, T. Land-use Change and Land Degradation on the Mongolian Plateau from 1975 to 2015—A Case Study from Xilingol, China. Land Degrad. Dev. 2018, 29, 1595–1606. [Google Scholar] [CrossRef]
  50. Zhu, Q.; Chen, H.; Peng, C.; Liu, J.; Piao, S.; He, J.-S.; Wang, S.; Zhao, X.; Zhang, J.; Fang, X.; et al. An Early Warning Signal for Grassland Degradation on the Qinghai-Tibetan Plateau. Nat. Commun. 2023, 14, 6406. [Google Scholar] [CrossRef]
  51. Hilckmann, A.; Bach, V.; Bruggemann, R.; Ackermann, R.; Finkbeiner, M. Partial Order Analysis of the Government Dependence of the Sustainable Development Performance in Germany’s Federal States. In Partial Order Concepts in Applied Sciences; Fattore, M., Bruggemann, R., Eds.; Springer International Publishing: Cham, Switzerland, 2017; pp. 219–228. [Google Scholar]
  52. Carlsen, L.; Bruggemann, R. Partial Ordering and Metrology Analyzing Analytical Performance. In Partial Order Concepts in Applied Sciences; Fattore, M., Bruggemann, R., Eds.; Springer International Publishing: Cham, Switzerland, 2017; pp. 49–70. [Google Scholar]
  53. Brüggemann, R.; Bücherl, C.; Pudenz, S.; Steinberg, C.E.W. Application of the Concept of Partial Order on Comparative Evaluation of Environmental Chemicals. Acta Hydrochim. Hydrobiol. 1999, 27, 170–178. [Google Scholar] [CrossRef]
  54. Voigt, K.; Brüggemann, R.; Pudenz, S. A Multi-Criteria Evaluation of Environmental Databases Using the Hasse Diagram Technique (ProRank) Software. Environ. Model. Softw. 2006, 21, 1587–1597. [Google Scholar] [CrossRef]
  55. Borg, I.; Shye, S. Facet Theory: Form and Content; Sage Publications, Inc.: Thousand Oaks, CA, USA, 1995. [Google Scholar]
  56. Manganaro, A.; Ballabio, D.; Consonni, V.; Mauri, A.; Pavan, M.; Todeschini, R. Chapter 9 The DART (Decision Analysis by Ranking Techniques) Software. In Data Handling in Science and Technology; Elsevier: Amsterdam, The Netherlands, 2008; Volume 27, pp. 193–207. [Google Scholar]
  57. Restrepo, G.; Brüggemann, R.; Voigt, K. Towards a New and Advanced Partial Order Program: Pyhasse; Multicriteria Ordering and Ranking: Partial Orders, Ambiguities and Applied Issues; Springer: Berlin/Heidelberg, Germany, 2008; pp. 11–33. [Google Scholar]
  58. Wang, Z.; Fu, B.; Wu, X.; Li, Y.; Feng, Y.; Wang, S.; Wei, F.; Zhang, L. Vegetation Resilience Does Not Increase Consistently with Greening in China’s Loess Plateau. Commun. Earth Environ. 2023, 4, 336. [Google Scholar] [CrossRef]
  59. Crawford, C.L.; Yin, H.; Radeloff, V.C.; Wilcove, D.S. Rural Land Abandonment Is Too Ephemeral to Provide Major Benefits for Biodiversity and Climate. Sci. Adv. 2022, 8, eabm8999. [Google Scholar] [CrossRef]
  60. Ma, Q.; Long, Y.; Jia, X.; Wang, H.; Li, Y. Vegetation Response to Climatic Variation and Human Activities on the Ordos Plateau from 2000 to 2016. Environ. Earth Sci. 2019, 78, 709. [Google Scholar] [CrossRef]
  61. Donovan, M.; Monaghan, R. Impacts of Grazing on Ground Cover, Soil Physical Properties and Soil Loss via Surface Erosion: A Novel Geospatial Modelling Approach. J. Environ. Manag. 2021, 287, 112206. [Google Scholar] [CrossRef]
  62. Mu, S.J.; Chen, Y.Z.; Li, J.L.; Ju, W.M.; Odeh, I.O.A.; Zou, X.L. Grassland Dynamics in Response to Climate Change and Human Activities in Inner Mongolia, China between 1985 and 2009. Rangel. J. 2013, 35, 315. [Google Scholar] [CrossRef]
  63. Zhang, M.; Zhang, F.; Guo, L.; Dong, P.; Cheng, C.; Kumar, P.; Johnson, B.A.; Chan, N.W.; Shi, J. Contributions of Climate Change and Human Activities to Grassland Degradation and Improvement from 2001 to 2020 in Zhaosu County, China. J. Environ. Manag. 2023, 348, 119465. [Google Scholar] [CrossRef]
  64. Li, J.; Ma, Z.; Sun, H.; Chen, W. Driving Factor Analysis and Dynamic Forecast of Industrial Carbon Emissions in Resource-Dependent Cities: A Case Study of Ordos, China. Environ. Sci. Pollut. Res. 2023, 30, 92146–92161. [Google Scholar] [CrossRef] [PubMed]
  65. Zeng, X.; Liu, Z.; He, C.; Ma, Q.; Wu, J. Quantifying Surface Coal-Mining Patterns to Promote Regional Sustainability in Ordos, Inner Mongolia. Sustainability 2018, 10, 1135. [Google Scholar] [CrossRef]
  66. Li, M.; Wang, J.; Li, K.; Liu, Y.; Ochir, A.; Davaasuren, D. Assessment of Grazing Livestock Balance on the Eastern Mongolian Plateau Based on Remote Sensing Monitoring and Grassland Carrying Capacity Evaluation. Sci. Rep. 2024, 14, 32151. [Google Scholar] [CrossRef] [PubMed]
  67. Wu, J.; Zhang, Q.; Li, A.; Liang, C. Historical Landscape Dynamics of Inner Mongolia: Patterns, Drivers, and Impacts. Landsc. Ecol. 2015, 30, 1579–1598. [Google Scholar] [CrossRef]
  68. Yan, X.; Li, J.; Shao, Y.; Hu, Z.; Yang, Z.; Yin, S.; Cui, L. Driving Forces of Grassland Vegetation Changes in Chen Barag Banner, Inner Mongolia. GISci. Remote Sens. 2020, 57, 753–769. [Google Scholar] [CrossRef]
  69. Han, C.; Gao, Z.; Wu, Z.; Huang, J.; Liu, Z.; Zhang, L.; Zhang, G. Restoration of Damaged Ecosystems in Desert Steppe Open-pit Coal Mines: Effects on Soil Nematode Communities and Functions. Land Degrad. Dev. 2021, 32, 4402–4416. [Google Scholar] [CrossRef]
  70. Bennett, V.J. Effects of Road Density and Pattern on the Conservation of Species and Biodiversity. Curr. Landsc. Ecol. Rep. 2017, 2, 1–11. [Google Scholar] [CrossRef]
  71. Du, F.; Shi, S.; Du, Y. Factors on Commissioned Grazing Behavior of Herdsman in Inner Mongolia Pastoral Regions. Pratacultural Sci. 2016, 33, 2136–2143. [Google Scholar]
  72. Qu, Y.; Zhao, Y.; Ding, G.; Chi, W.; Gao, G. Spatiotemporal Patterns of the Forage-Livestock Balance in the Xilin Gol Steppe, China: Implications for Sustainably Utilizing Grassland-Ecosystem Services. J. Arid Land 2021, 13, 135–151. [Google Scholar] [CrossRef]
  73. Xiong, D.; Shi, P.; Zhang, X.; Zou, C.B. Effects of Grazing Exclusion on Carbon Sequestration and Plant Diversity in Grasslands of China—A Meta-Analysis. Ecol. Eng. 2016, 94, 647–655. [Google Scholar] [CrossRef]
  74. Ouyang, W.; Ju, F.; Han, J.; Gai, Z.; Zhang, B. The Impact of Grassland Ecological Compensation Policy on Overgrazing Behavior of Herdsmen with Non-Pastoral Employment: Evidence from Inner Mongolia, China. Front. Sustain. Food Syst. 2025, 9, 1605850. [Google Scholar] [CrossRef]
  75. Liu, Y.; Ding, Z.; Chen, Y.; Yan, F.; Yu, P.; Man, W.; Liu, M.; Li, H.; Tang, X. Restored Vegetation Is More Resistant to Extreme Drought Events than Natural Vegetation in Southwest China. Sci. Total Environ. 2023, 866, 161250. [Google Scholar] [CrossRef] [PubMed]
  76. Wang, Y.; Cui, J.; Miao, B.; Li, Z.; Wang, Y.; Jia, C.; Liang, C. Evaluating Performance of Multiple Machine Learning Models for Drought Monitoring: A Case Study of Typical Grassland in Inner Mongolia. Land 2024, 13, 754. [Google Scholar] [CrossRef]
  77. Li, X.; Jia, H.; Wang, L. Remote Sensing Monitoring of Drought in Southwest China Using Random Forest and eXtreme Gradient Boosting Methods. Remote Sens. 2023, 15, 4840. [Google Scholar] [CrossRef]
  78. Ma, S.; Wang, H.-Y.; Zhang, X.; Wang, L.-J.; Jiang, J. A Nature-Based Solution in Forest Management to Improve Ecosystem Services and Mitigate Their Trade-Offs. J. Clean. Prod. 2022, 351, 131557. [Google Scholar] [CrossRef]
  79. Chen, H.; Shao, L.; Zhao, M.; Zhang, X.; Zhang, D. Grassland Conservation Programs, Vegetation Rehabilitation and Spatial Dependency in Inner Mongolia, China. Land Use Policy 2017, 64, 429–439. [Google Scholar] [CrossRef]
  80. Anguelovski, I.; Brand, A.L.; Connolly, J.J.T.; Corbera, E.; Kotsila, P.; Steil, J.; Garcia-Lamarca, M.; Triguero-Mas, M.; Cole, H.; Baró, F.; et al. Expanding the Boundaries of Justice in Urban Greening Scholarship: Toward an Emancipatory, Antisubordination, Intersectional, and Relational Approach. Ann. Am. Assoc. Geogr. 2020, 110, 1743–1769. [Google Scholar] [CrossRef]
  81. Batunacun. Scenario Analysis of Ecosystem Service Changes—A Case Study of Ordos. Ph.D. Thesis, Institute of Geographical Science and Natural Resources Research, Chinese Academy of Sciences, Beijing, China, 2020. [Google Scholar]
  82. Batunacun. Modelling Land Use and Land Cover Change on the Mongolia Plateau. Ph.D. Thesis, Humboldt University, Berlin, Germany, 2019. [Google Scholar]
Figure 1. Overview of study area: land cover, topography, and functional zonation. Numbers (1–97) represent administrative units (counties/cities) in the study area. Note, RO: 11. Bayan Obo, 12. Darhan Muminggan, 13. Jiuyuan, 14. Shiguai, 15. Guyang, 16. Qingshan, 17. Kundulun, 18. Tumd R., 19. Tumd L., 32. Ejin Horo, 33. Kangbashi, 34. Jungar, 35. Otog, 36. Hanggin, 37. Dalad, 38. Dongsheng, 39. Otog F., 40. Wushen, 72. Wuda, 73. Haibowan, 74. Hainan; CSO: 20. Ar Horchin, 21. Hexigten, 22. Yuanbaoshan, 23. Ningcheng, 24. Hongshan, 25. Linxi, 26. Harqin, 27. Bairin L., 28. Aohan, 29. Songshan, 30. Bairin R., 31. Ongniud, 41. Xincheng, 42. Qingshuihe, 43. Wuchuan, 44. Horinger, 45. Huimin, 46. Tokto, 47. Yuquan, 48. Tumd L., 49. Saihan; APO: 4. Linhe, 5. Dengkou, 6. Wuyuan, 7. Ulad B., 8. Ulad F., 9. Ulad M., 10. Hanggin B., 64. Horqin, 65. Horqin LB, 66. Holingol, 67. Kulun, 68. Jarud, 69. Kailu, 70. Naiman, 71. Horqin LM, 75. Chahar RF, 76. Chahar RM, 77. Fengzhen, 78. Liangcheng, 79. Shangdu, 80. Jining, 81. Siziwang, 82. Zhuozi, 83. Chahar RB, 84. Xinghe, 85. Huade, 98. Horqin RM, 99. Tuquan, 100. Horqin RF, 101. Arxan, 102. Jalaid, 103. Ulanhot; EO: 1. Ejina, 2. Alxa R., 3. Alxa L., 50. Yakeshi, 51. Ergun, 52. Xin Barag R., 53. Xin Barag, 54. Arong, 55. Manchuria, 56. Genhe, 57. Xin Barag L., 58. Hailar, 59. Evenk, 60. Morin Dawa Daur, 61. Zalantun, 62. Oroqen, 63. Jalai Nur, 86. Abaga, 87. Sonid L., 88. Duolun, 89. Xilinhot, 90. Sonid R., 91. Xianghuang, 92. Ujimqin W., 93. Zhenglan, 94. Erenhot, 95. Ujimqin E., 96. Zhengxiangbai, 97. Taibus.
Land 15 00776 g001
Figure 2. Framework for identifying dominant drivers of GD using partial-order theory (POT) and the Hasse diagram technique (HDT). LUCC, land use and land cover change. Note: Numbers in Step 3 represent the corresponding administrative units (counties) used to identify dominant drivers.
Land 15 00776 g002
Figure 3. Construction of Hasse diagram based on partial order theory.
Land 15 00776 g003
Figure 4. Land use transitions in four city functional zones from 2000 to 2023.
Land 15 00776 g004
Figure 5. Spatiotemporal patterns and areas of GD and GR in different city functional zones from 2000 to 2023.
Land 15 00776 g005
Figure 6. Hasse diagrams and spatial mapping of GD drivers in RO cities: (a) human disturbances, (b) climate factors, (c) economic factors, and (d) urbanization. Note: Color gradients represent the hierarchical levels in the Hasse diagram. Darker shades indicate higher levels (stronger influence), while lighter shades indicate lower levels (weaker influence).
Land 15 00776 g006
Figure 7. Hasse diagrams and spatial mapping of GD driver in CSO cities: (a) human disturbances, (b) climate factors, (c) economic factors, and (d) urbanisation.
Land 15 00776 g007
Figure 8. Hasse diagrams and spatial mapping of GD drivers in APO cities: (a) urbanisation, (b) human disturbances, (c) climate factors, and (d) economic factors.
Land 15 00776 g008
Figure 9. Hasse diagrams and spatial mapping of GD drivers in EO cities: (a) urbanisation, (b) climate factors, (c) human disturbances, and (d) economic factors.
Land 15 00776 g009
Figure 10. Spatial distribution of dominant drivers of GD across functional zones (2000–2023). Colors and patterns represent different categories of dominant drivers, including climatic factors (blue), human disturbance (yellow horizontal lines), urbanisation (red vertical lines), and economic development (pink diagonal lines). Overlapping patterns indicate the coexistence of multiple dominant drivers. Numbers denote county identifiers.
Land 15 00776 g010
Table 1. Summary of groups of factors driving GD and restoration. Note: “Orientation” indicates the direction of indicator normalization. [0, 1] denotes a positive orientation, where higher values correspond to lower levels of grassland degradation, whereas [1, 0] denotes a negative orientation, where higher values correspond to higher levels of grassland degradation.
Drivers GroupIndicatorsUnitTemporal
Coverage
Data SourcesOrientation
Land coverChina Land Cover Dataset (CLCD)——2000–2023http://doi.org/10.5281/zenodo.4417809; (accessed on 2 January 2026)——
Human
disturbance
Population density (PD)person/km22000–2023http://tj.nmg.gov.cn/; (accessed on 4 January 2026)[0, 1]
Grazing intensity (GI)SU ha−12000–2023https://doi.org/10.6084/m9.figshare.26195684; (accessed on 10 January 2026)
Economic
factors
Primary industry (PI)CNY/km22000–2023http://tj.nmg.gov.cn/; (accessed on 4 January 2026)[0, 1]
Secondary industry (SI)
Tertiary industry (TI)
Gross domestic product (GDP)
UrbanisationProximity to urban areas (PUA)m2000–2023http://www.resdc.cn/; (accessed on 15 January 2026)[1, 0]
Proximity to rural settlements (PRS)
Proximity to mining sites (PMS)
Transportation accessibility (TA)https://dataverse.harvard.edu/; (accessed on 15 January 2026)
http://download.geofabrik.de/; (accessed on 15 January 2026)
Climate factorPrecipitation (PRE)mm2000–2023https://data.tpdc.ac.cn/; (accessed on 20 January 2026)[1, 0]
Temperature (TEM)°C[0, 1]
Table 2. Net land use change and total land conversion across functional zones from 2000 to 2023 (km2). Note: Net change values for each land use category (Grassland–Impervious) represent differences between 2000 and 2023, with positive values indicating gains and negative values indicating losses. “Conversion area” denotes total land transitions. Proportion (%) is calculated relative to the total zone area.
ZoneGrasslandBarrenForestCroplandWaterImperviousConversion AreaConversion Proportion (%)
RO6247.1−7947.342.7282.6106.01268.822,407.419.3
CSO−635.2−1145.92525.6−1874.7−144.51274.519,451.618.7
APO−2396.0−388.3981.2−295.7−220.52319.640,355.917.3
EO−6349.01386.02982.0972.9−268.51275.232,300.74.7
Table 3. GD and GR area and their proportions relative to total area across functional zones from 2000 to 2023 (km2).
ZoneGD Area (km2)GR Area (km2)GD (%)GR (%)
RO7449.913,696.23.86.9
CSO9404.28768.14.94.5
APO19,651.117,253.14.53.9
EO16,845.510,495.21.20.8
Table 4. Dominant factors driving GD and counties affected by GD by different functional regions.
Functional ZoneDriversAffected
Counties
County ID(s)GD AreaProportion of GD Area (%)
ROHuman912, 14, 15, 17, 32, 34, 39, 40, 743259.633.6
Climate512, 35, 36, 72, 742544.426.2
Economic1213, 16–19, 32, 34, 37, 38, 72–742299.623.7
Urbanisation1411–13, 15–19, 33, 34, 38, 72–741606.416.5
CSOHuman1620–31, 42–457691.167.3
Climate920, 22, 24, 31, 43, 45–483043.526.6
Economic622, 41, 45, 47–49466.34.1
Urbanisation345, 47, 48228.52.0
APOUrbanisation284, 6–10, 64, 66, 68–85, 98–10215,206.663.6
Human1164–67, 69, 75, 80, 83, 84, 98, 1035389.022.5
Climate25, 72842.011.9
Economic34, 10, 80486.82.0
EOUrbanisation1550, 51, 53, 55, 56, 58, 60–63, 89–92, 976759.039.3
Climate41–3, 904143.724.1
Human1452, 57, 59, 63, 86–89, 91–93, 85–973550.120.6
Economic1053–55, 58, 59, 61, 63, 89, 92, 942747.816.0
Disclaimer/Publisher’s Note: The statements, opinions and data contained in all publications are solely those of the individual author(s) and contributor(s) and not of MDPI and/or the editor(s). MDPI and/or the editor(s) disclaim responsibility for any injury to people or property resulting from any ideas, methods, instructions or products referred to in the content.