Article

Geographic Diffusion and Spatial Justice of Outdoor Music Festivals in China: Driving Mechanisms and Collaborative Governance Strategies

1
College of Economics and Management, Nanjing Forestry University, Nanjing 210037, China
2
International School of Cultural Tourism, Hangzhou City University, Hangzhou 310015, China
*
Author to whom correspondence should be addressed.
Land 2026, 15(5), 746; https://doi.org/10.3390/land15050746
Submission received: 31 March 2026 / Revised: 23 April 2026 / Accepted: 24 April 2026 / Published: 28 April 2026

Abstract

Outdoor music festivals (OMFs) increasingly operate as a form of temporary land use that activates urban stock land, yet how such land-use reconfigurations unfold across uneven urban–rural geographies remains insufficiently examined. Taking China’s OMFs from 2013 to 2024 as a case, this study applies the Geodetector model within a spatial justice framework to analyze fifteen indicators organized along the distributional, procedural, and recognition dimensions. The results show a pronounced “market-sinking” trend accompanied by westward expansion, and the seasonal clustering gradually moderated. The three dimensions jointly shape OMFs’ diffusion through distinguishable pathways, with the procedural dimension exhibiting the highest explanatory power through institutional steering and industrial coordination, followed by the recognition dimension through demographic foundations and digital visibility, and the distributional dimension through material and infrastructural accessibility; interaction detection further indicates that their joint presence produces amplified effects. These mechanisms align with international land-use and territorial-governance studies, while reflecting the state-led coordination distinctive to China. The findings point to an emerging form of collaborative co-creation in which governmental, market, and community actors jointly shape the spatial production of cultural events, extending the classical core–periphery account and informing debates on the territorial governance of event spaces in non-metropolitan regions.

1. Introduction

Outdoor music festivals (OMFs), conceptualized as large-scale cultural phenomena integrating artistic performance with destination marketing, have emerged as a pivotal frontier for culture-tourism synergy [1,2]. From a land management perspective, OMFs function as a form of temporary land use (TLU) that elastically activates urban stock land, including industrial heritage sites, municipal parks, and suburban wastelands [3]. This process of spatial activation challenges rigid land-use patterns, providing a laboratory for territorial governance and the realization of development rights in peripheral areas. According to data from the China Association of Performing Arts, the box office revenue for OMFs (exceeding 2000 attendees) reached RMB 20.17 billion in 2023, a remarkable 373.6% increase from 2019. Amidst this unprecedented boom, a notable spatial phenomenon has emerged: the geographic restructuring of host locations. The host landscape of OMFs is rapidly expanding from first-tier megacities such as Beijing and Shanghai to second-, third-, and fourth-tier inland cities [4]. This profound “geographic diffusion” not only reshapes the national cultural consumption landscape but also provides a new pathway for non-core cities to stimulate local economic vitality, optimize land-use structures, and achieve culture-led urban regeneration [5,6].
Despite this rapid spatial evolution, existing research on OMFs remains largely confined to micro-level or localized analyses. Previous academic attention has primarily focused on micro-psychological factors, such as audience motivation [7], or evaluations of short-term socio-economic impacts on local communities [8]. More importantly, emerging studies show that OMFs are not merely commercial products but cultural events characterized by multi-stakeholder value co-creation, involving local governments, enterprises, and attendees [6]. However, quantitative studies addressing the macro-level spatiotemporal evolution patterns of OMFs on a national scale remain scarce. Furthermore, traditional cultural geography heavily relies on the “core-periphery” model, which assumes cultural industries must inevitably cluster in metropolitan centers, proving insufficient to explain why China’s lower-tier markets are now overcoming geographic barriers to host mega-events [9]. This conventional perspective is insufficient to explain the emerging spatiotemporal patterns of OMFs, leaving a significant research gap regarding why China’s lower-tier markets can currently overcome geographic barriers to successfully host mega-events.
The geographic diffusion of OMFs cannot be adequately explained by market forces alone; rather, it is shaped by the interplay of material infrastructure, institutional steering, and cultural and symbolic recognition [10]. originating from inquiries into how spatial resources are distributed, provides an analytical perspective for understanding how spatial disparities arise and evolve [11]. Within this tradition, mega-events are conceptualized as a process of “spatial production” mobilizing capital, land infrastructure, and cultural-symbolic identity, wherein resource redistribution and rights negotiation constitute central concerns [12,13]. Against the backdrop of pronounced regional inequalities in China, the pursuit of spatial justice is not an abstract ideal but a tangible orientation of contemporary urban development, particularly in cities outside the metropolitan core [14]. Spatial justice theory distinguishes three analytical dimensions—distributional justice, procedural justice, and recognition justice—which address the allocation of material and land-based resources, the institutional processes that shape stakeholder participation, and the social validation of cultural identities, respectively [15]. These three dimensions correspond closely to the factors that plausibly drive the geographic diffusion of OMFs, providing a coherent lens through which the observed patterns can be explained. On this basis, the present study employs spatial justice as an analytical framework for examining why and how OMFs have diffused across Chinese cities in the observed manner [4,10]. Yet how the three dimensions jointly shape festival geographies at the macro scale remains insufficiently examined in existing OMF research, particularly through city-level indicators that can systematically represent the three dimensions.
Drawing upon city-level panel data on outdoor music festivals (OMFs) in China from 2013 to 2024, this study aims to elucidate their spatiotemporal evolution patterns and systematically explore the multi-dimensional mechanisms driving this geographic diffusion. To this end, the study operationalizes the spatial justice framework into an indicator system encompassing institutional steering, material foundations, and symbolic recognition, and employs a geographical detector model to quantify the statistical associations between these multi-dimensional factors and the spatial distribution of host cities. This study advances the literature by reconceptualizing the “core–periphery” model through a spatial justice framework, operationalizing this approach into a quantitative system for evaluating event spatial dynamics. Furthermore, it bridges these empirical insights with land management, illustrating how integrating temporary land use (TLU) and participatory planning transforms short-term festival traffic into enduring urban spatial resilience [16].

2. Materials and Methods

This study follows a “phenomenon-mechanism-strategy” logical framework. Section 3 uses spatiotemporal indices to depict the geographic diffusion and temporal agglomeration of China’s outdoor music festivals. Section 4 employs a geographical detector model within a “spatial justice” framework to reveal how distributional, procedural, and recognition justice synergistically drive this market diffusion. Based on these empirical findings, Section 5 proposes targeted spatial governance strategies for emerging host cities. To support this analysis, this section details the data acquisition and core methodologies.

2.1. Research Data

The dataset for this study comprises 918 valid samples of outdoor music festivals (OMFs) hosted across mainland China, spanning from 1 January 2013 to 31 December 2024. The selection of this time frame (2013–2024) ensures a robust longitudinal analysis, beginning with the market’s transition toward systematic industry reporting in 2013 and concluding with the critical post-pandemic recovery phase (2023–2024). This scope allows the study to capture both the long-term driving mechanisms and the most recent structural reconfigurations of the OMF market.
To ensure data comprehensiveness and scholarly rigor, a triangulation strategy was employed by cross-referencing industry records from the China Association of Performing Arts (CAPA), official announcements from organizers and host cities (e.g., Sina Weibo), and transactional data from major ticketing platforms such as Damai. This multi-source verification protocol effectively minimized omission biases associated with single-channel data collection. The OMFs were strictly limited to those held in outdoor public spaces with attendance exceeding 2000 participants. This threshold is aligned with the official statistical standards defined by the China Association of Performing Arts (CAPA) for large-scale outdoor performances. For recurring festival brands, each occurrence in a specific city and year was treated as an independent spatial production unit to precisely characterize the annual redistribution of cultural resources and the dynamic geographic diffusion of cultural capital [17].
To support the quantitative analysis of the driving mechanisms underlying OMF evolution, this study constructed a multi-source database. Macroeconomic, infrastructure, and industrial data associated with the distributional dimension (X1–X6) and procedural dimension (X7, X9–X11), as well as demographic indicators for recognition justice (X12–X13), were primarily extracted from the China City Statistical Yearbook (2013–2024) and various provincial or municipal statistical bulletins. Longitudinal consistency was maintained by adjusting all monetary values to constant prices and utilizing linear interpolation for infrequent missing values. Regarding policy intensity (X8) within the procedural dimension, a thematic content analysis was conducted on official documents retrieved from local government portals. A total of 1103 government policy documents were screened and analyzed. The quantification process utilized a weighted frequency method, in which provincial-level policies were assigned higher weight coefficients than municipal-level ones. Indicators of digital visibility for the recognition dimension were generated through big data mining: online search attention (X14) was derived from the Baidu Index and normalized against regional internet penetration rates. The online sentiment index (X15) was constructed by collecting over 500,000 user-generated content (UGC) posts from platforms including Xiaohongshu V10.92.0 and Damai V6.10.0 using Python 3.9. These data were processed using a BERT-based deep learning model for sentiment classification, enabling the precise calculation of annual positive sentiment ratios for each host city [18].

2.2. Research Methods

2.2.1. Spatiotemporal Evolution Measurement Indices

This study introduces the Seasonal Concentration Index (Tm), Geographic Concentration Index (G), and Primacy Index (P) to evaluate the degree of uneven agglomeration of resources in spatial and temporal dimensions [19].
Tm is used to measure the unevenness in the distribution of music festivals across different months within a year. The formula is:
T m = i = 1 n ( M i 8.33 ) 2 / 12
where Mi represents the proportion of music festivals held in the ith month to the annual total. A higher Tm value suggests a stronger temporal agglomeration effect.
The G and P indices are utilized to evaluate the degree of spatial concentration and monopoly of host cities at the national level:
G = 100 × i = 1 n N i S 2
G ¯ = 100 × n ( N ¯ S ) 2
P = N 1 N 2
where Ni is the number of festivals in the i-th city, and S is the national total. G ¯ represents the geographic concentration index when music festival brands are evenly distributed across n cities. N1 and N2 are the number of festivals in the top two ranking cities, respectively. The synergistic decline of G and p values provides direct mathematical support for confirming the “downward diffusion” of the music festival market.

2.2.2. Geographical Detector

Geographical detection is a spatial statistical method used to detect spatial heterogeneity and identify the underlying driving factors [20]. The core principle is that, if an independent variable significantly influences a dependent variable, its spatial distributions should exhibit similarity [21]. This study employs factor and interaction detection within a geographical detector to analyze the influencing factors and their interrelationships with the spatial distribution of music festival host cities. The factor detection formula is as follows:
q = 1 h = 1 L N h σ h 2 N σ 2 = 1 S S W S S T
S S W = h = 1 L N h σ h 2
S S T = N σ 2
where h = 1, …, L represents the stratification (classification or partitioning) of variable Y or factor X; Nh and N are the number of units in stratum h and the entire region, respectively; σ h 2 and σ 2 are the variances of Y in stratum h and the entire region, respectively; SSW is the within-stratum sum of variances, and SST is the total variance of the entire region. The q statistic ranges from [0 to 1]. A larger q value indicates more pronounced spatial heterogeneity in Y. If stratification is generated by the independent variable X, a higher q value suggests that X has a stronger explanatory power over attribute Y. In extreme cases, q = 1 indicates that factor X completely controls the spatial distribution of Y, whereas q = 0 indicates no relationship between X and Y.
Interaction detection evaluates the synergistic amplification effect when two indicators are combined. By comparing the single-factor q-values with the interactive q-value, it identifies whether they exhibit bi-factor enhancement or non-linear enhancement. This module provides the core quantitative basis for distilling synergistic governance strategies across multi-dimensional spatial factors.
In this study, the analysis was performed using GeoDetector Software (Excel-based version, 2015; http://www.geodetector.cn, accessed on 23 March 2025) under Microsoft Excel 2019 on Windows 10. The dependent variable (Y, the cumulative number of OMFs hosted by each city during 2013–2024) and the fifteen independent variables (X1–X15) were compiled into a city-level cross-sectional matrix, from which the factor detector and interaction detector modules were executed sequentially.
Because Geodetector requires categorical inputs, all fifteen continuous variables were discretized prior to analysis. The Natural Breaks (Jenks) method was adopted for its ability to minimize within-class variance while maximizing between-class variance, which is well-suited to the skewed distributions typical of socioeconomic and digital indicators. To determine the appropriate number of strata, a sensitivity analysis was conducted across five classification methods (equal interval, quantile, standard deviation, natural breaks, geometrical interval) and five stratum counts (four to eight). Natural Breaks with five strata yielded the highest mean q-value and remained stable under minor perturbations of the stratum count, and was therefore adopted throughout. The stratification was implemented in ArcGIS 10.8 using the Classify tool, and the resulting categorical codes (1–5) were used as inputs to the Geodetector software [22].
Although the original dataset is constructed as a city-level panel from 2013 to 2024, the variables were aggregated into multi-year averages (or cumulative totals) prior to the Geodetector analysis. This cross-sectional transformation was explicitly employed to smooth out short-term fluctuations (e.g., constraints during public health events) and accurately capture the structural, long-term multi-dimensional factors driving the spatial distribution of OMFs.

3. Analysis of the Spatiotemporal Evolution Pattern of the China Music Festival

3.1. Temporal Characteristics

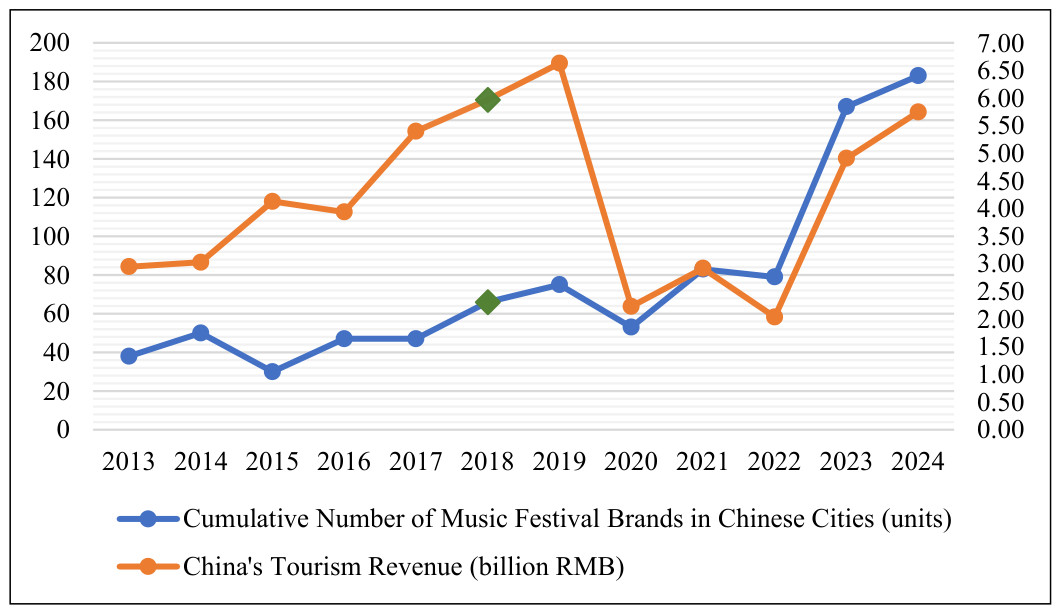
According to the statistical data from 2013 to 2024 (Figure 1), the number of outdoor music festivals hosted in Chinese cities shows a significant overall upward trend. The introduction of the culture and tourism integration policy in 2018 served as a crucial turning point, driving the market toward maturity. Before this, music festivals primarily existed as independent cultural events, often showing a developmental trajectory distinct from the macro cultural tourism industry. Following the policy implementation, festivals began to deeply integrate local tourism resources, aligning their development trends and significantly enhancing the cross-regional tourism consumption effect. Although public health controls between 2020 and 2022 restricted population mobility and kept event numbers below expectations, the market experienced explosive growth in 2023 after all restrictions were lifted. Festivals quickly became an important channel for the public to release negative emotions and seek psychological comfort.
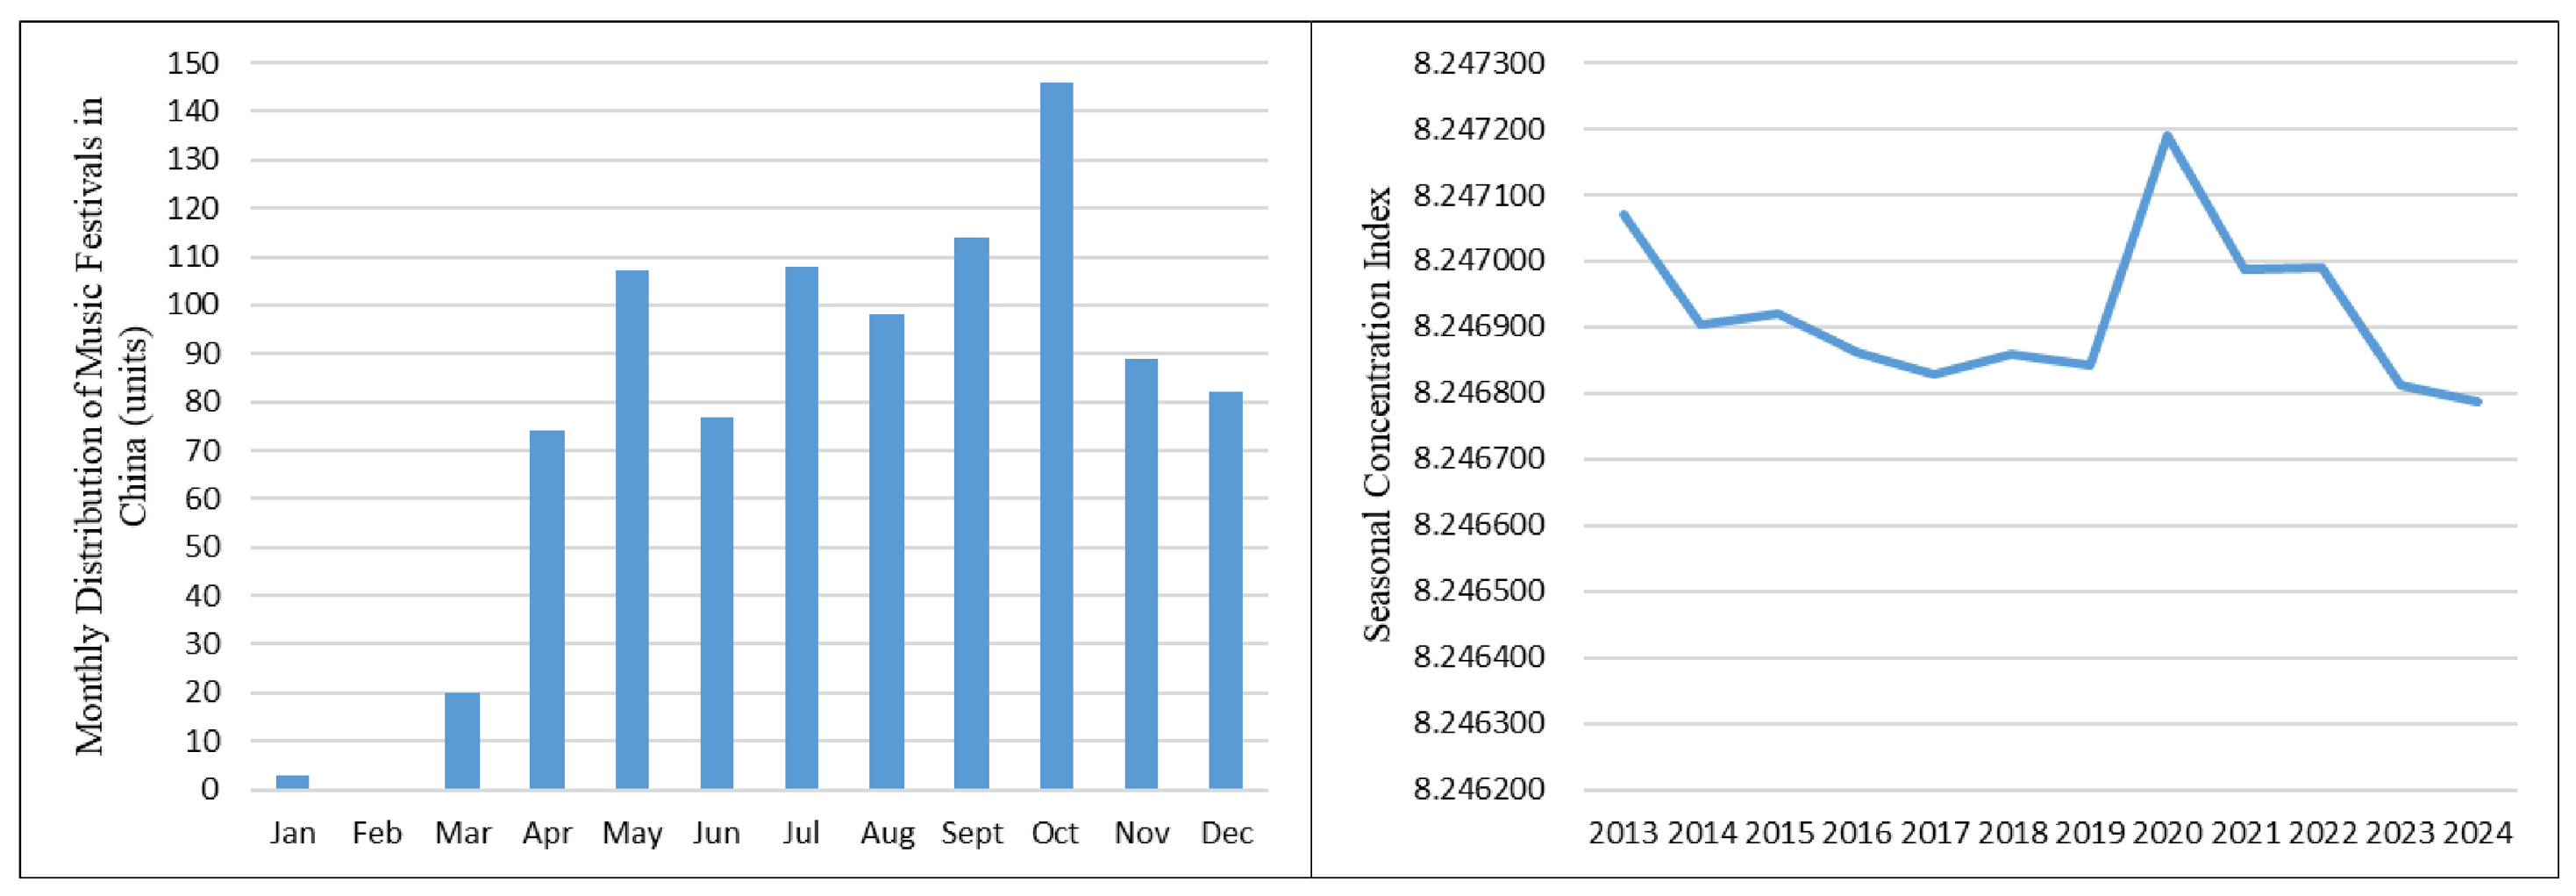
Regarding the monthly temporal distribution (Figure 2), music festivals exhibit strong seasonal clustering. The annual seasonal concentration index (Tm) remained consistently above 8.24 between 2013 and 2023. Constrained by harsh winter temperatures and the typical urban population outflow during the Spring Festival, January to March constitutes a clear market freeze period. Conversely, benefiting from the massive holiday tourist flows during the May Day and National Day Golden Weeks, May and October represent the annual peak periods for hosting festivals. Furthermore, the graduation season in June, the summer vacation in July and August, and the New Year celebrations in December heavily unleash the consumption potential of the youth demographic. Notably, except for 2020, when events were passively concentrated due to the pandemic, the seasonal concentration index has shown a gradual downward trend in recent years. This indicates that the scheduling of music festivals is increasingly evolving toward a balanced year-round distribution.
It is important to note from a methodological perspective that while the Seasonal Concentration Index (Tm) exhibits a numerically narrow range of variation, the axis scaling in Figure 2 is specifically calibrated to visualize these structural micro-trends. Although the absolute differences appear small, the consistent downward trajectory observed in recent years—excluding the 2020 pandemic anomaly—carries significant implications. It indicates that the scheduling of music festivals is progressively breaking away from extreme holiday clustering, evolving toward a more balanced, year-round distribution. This “de-seasonalization” enhances the temporal efficiency of land use in host cities.

3.2. Spatial Evolution and Differentiation Characteristics

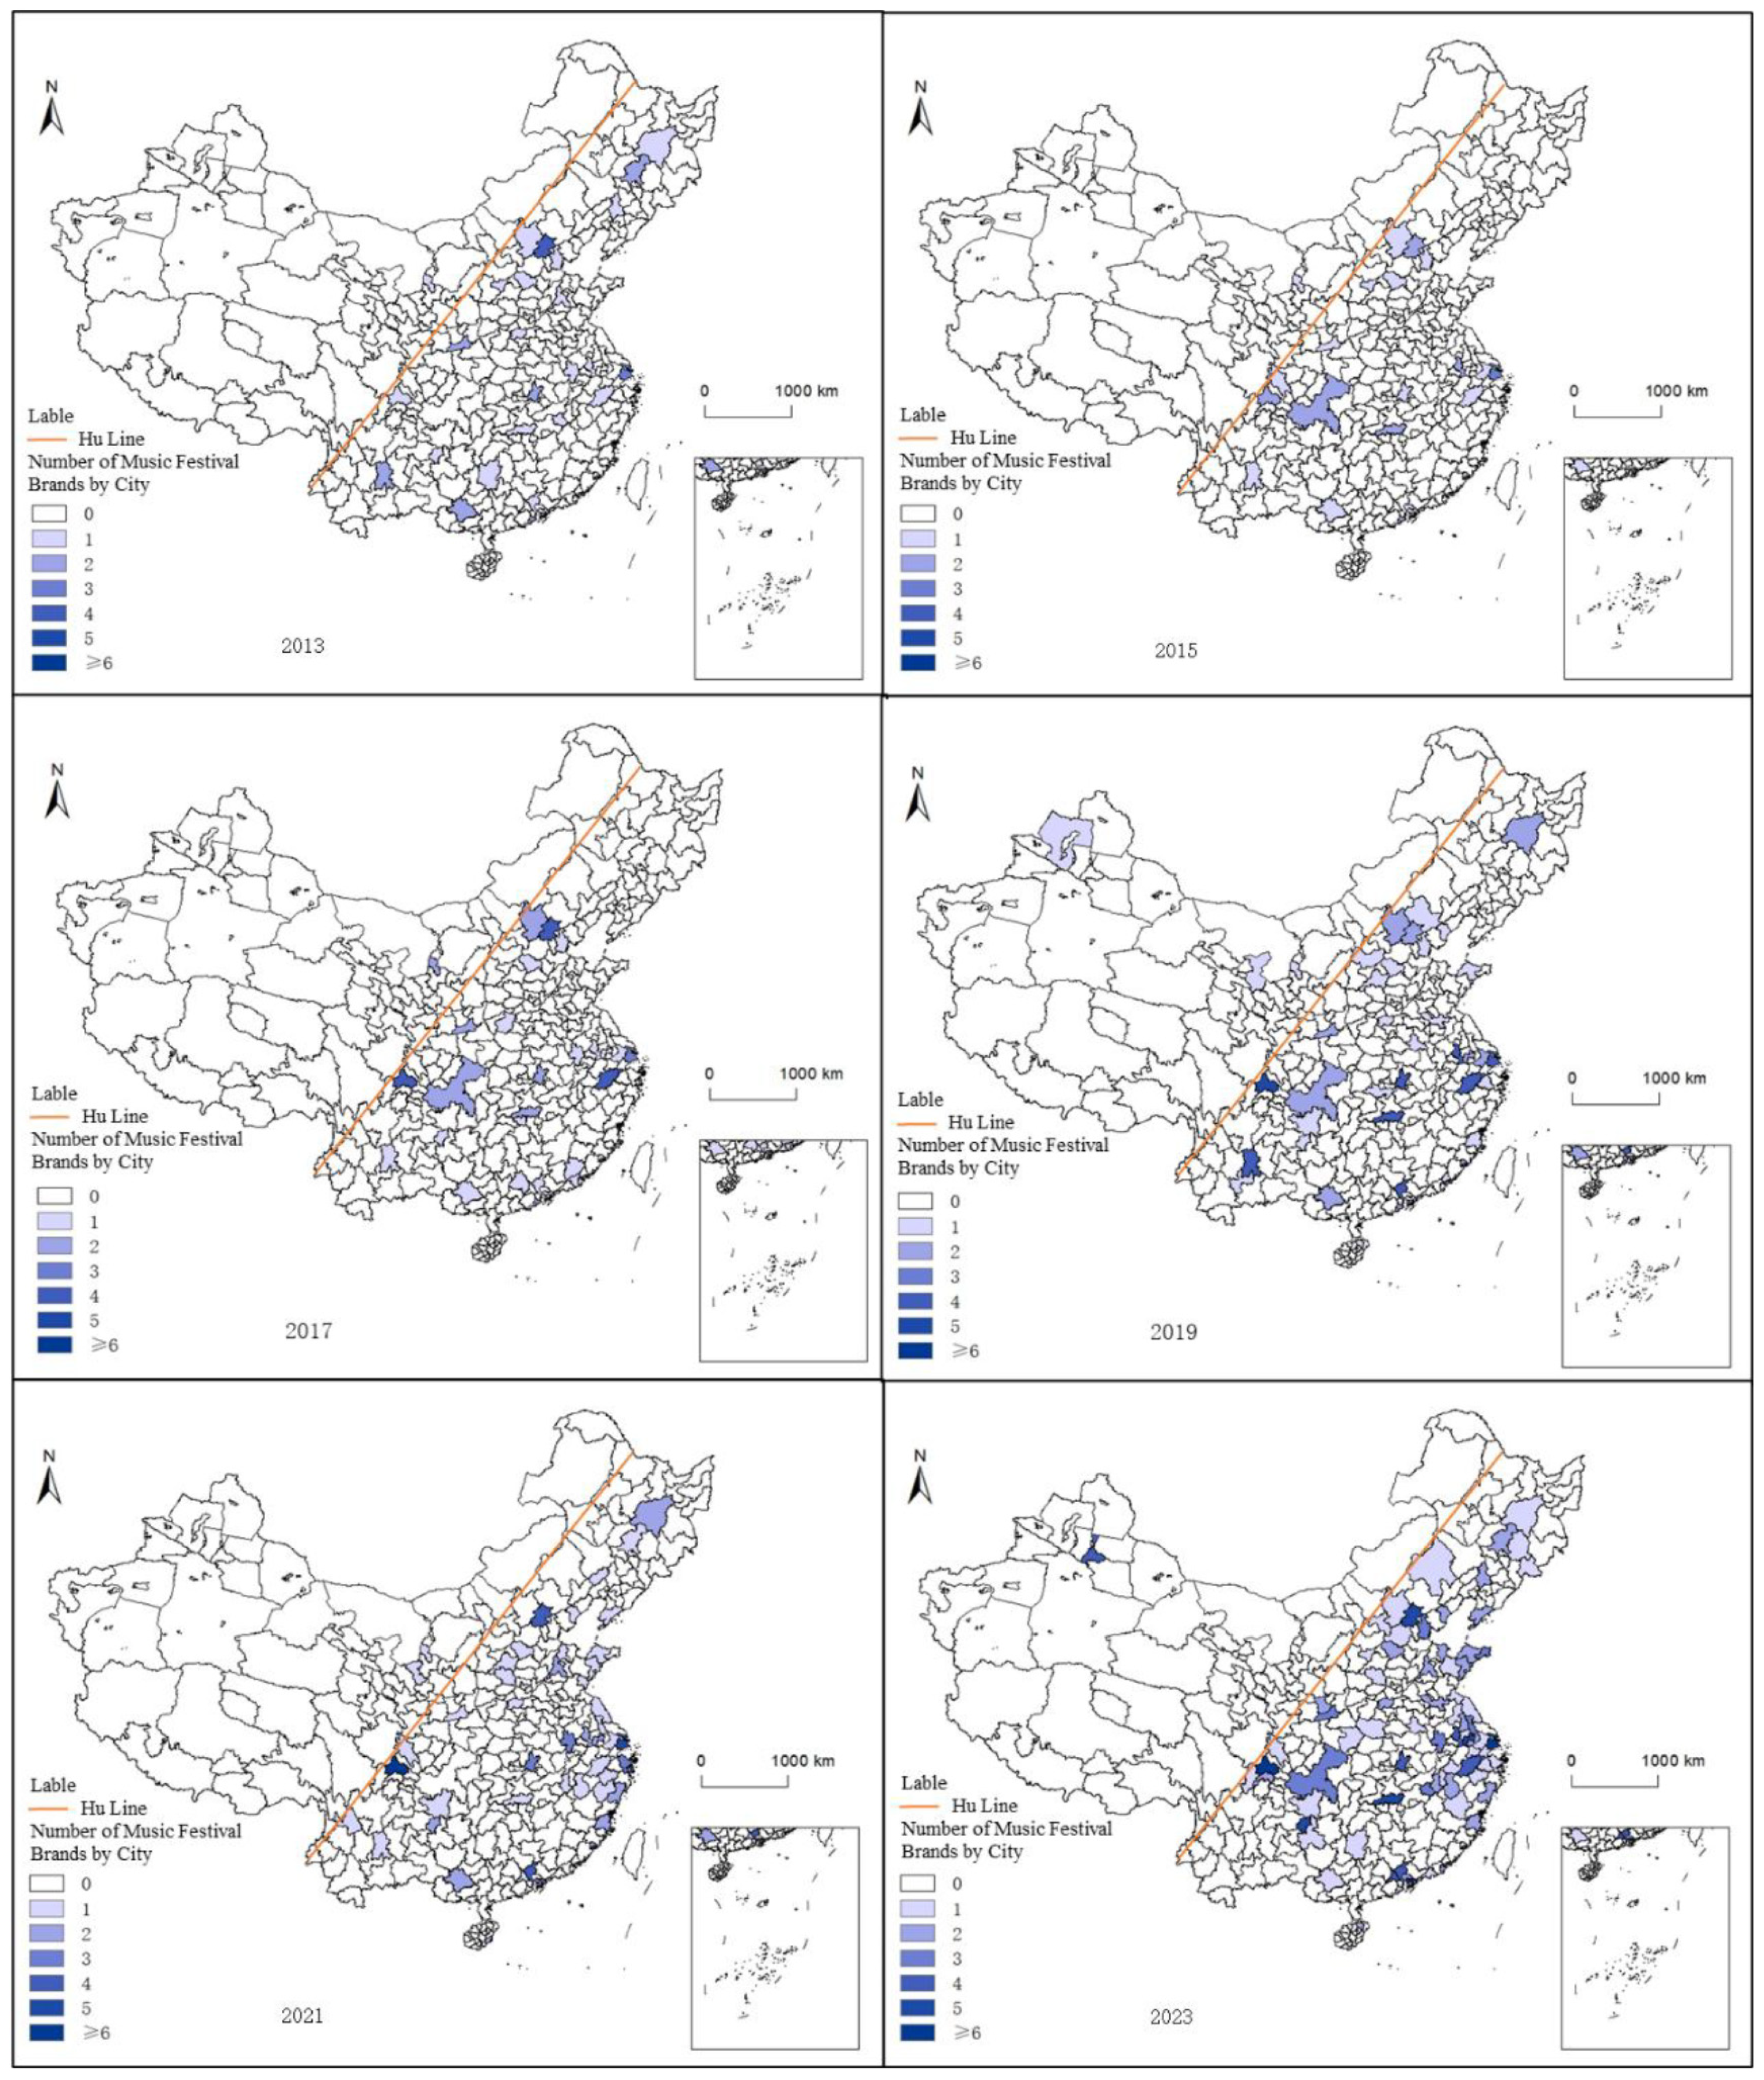
In terms of spatial evolution trajectories, the geographic landscape of Chinese music festivals is undergoing a profound downward diffusion and restructuring (Figure 3). ArcGIS spatial visualization clearly illustrates that host locations have rapidly spread from early high concentrations in first-tier megacities like Beijing and Shanghai to new first-tier, second-tier, and even third- and fourth-tier cities. After more than a decade of market expansion, five core clusters have formed nationwide: the eastern clusters represented by Beijing-Tianjin-Hebei, the Yangtze River Delta, and the Pearl River Delta, along with the mid-western clusters represented by Wuhan, Changsha, Chengdu, and Chongqing. A more critical finding is that, as the scale of events in northwestern cities like Xi’an, Yinchuan, and Urumqi expands annually, the geographic distribution of music festivals has historically broken the traditional constraints of the Heihe–Tengchong Line. This line, also known as the Hu Line, is a diagonal demarcation first proposed by the Chinese geographer Hu Huanyong in 1935 that separates the densely populated eastern half of China from the sparsely populated and less developed western half. The extension of OMFs across this line thus indicates that festival activity is beginning to reach regions that have long lain outside the country’s main cultural-economic corridors. They are now emerging as new engines driving the development of Western inland cities.
The calculation results of the geographic concentration index (G) and the primacy index (P) in Table 1 provide concrete quantitative evidence of this spatial downward trend. Between 2013 and 2024, the G value showed an overall downward trend, consistently ranging between 13.30 and 23.09. This is far below the extreme value of 100, indicating that the spatial distribution of host cities is trending toward dispersion. Concurrently, the gap between the G value and the ideal uniform distribution value G ¯ continues to narrow, and the primacy index remains at a persistently low level. This demonstrates that the top-ranked hosting cities have not formed an absolute monopolistic advantage. The synergistic changes in these indices fully confirm that the market influence of Chinese music festivals is continuously penetrating and diffusing nationwide, with spatial equilibrium steadily improving.

4. Influencing Factors of the Spatiotemporal Evolution of Music Festival Host Cities

The spatiotemporal analysis in the preceding sections reveals a significant “downward diffusion” of OMFs from megacities to second- and third-tier cities, accompanied by a strategic breakthrough of the Heihe–Tengchong Line. This geographic transition provides an empirical basis for re-examining OMFs through the lens of spatial justice. Given the pronounced regional disparities across China, the three-dimensional spatial justice framework introduced earlier offers a productive perspective for organizing the analysis of factors underlying such diffusion. Accordingly, this section develops an indicator system comprising 15 variables across the distributional, procedural, and recognition dimensions (Table 2) to examine the multi-dimensional factors driving the geographic diffusion of OMFs and, in turn, reshaping the spatial pattern of cultural resources across Chinese cities.

4.1. Variable Selection

4.1.1. Dimensional Framework and Indicator Selection

The spatial justice framework provides the theoretical basis for examining the factors shaping the spatiotemporal evolution of OMFs along its three dimensions—distributional, procedural, and recognition [23,24]. Drawing on the prior empirical studies, each dimension is operationalized through two primary indicators and further specified by fifteen operational indicators [25,26], as summarized in Table 2.
The first dimension, the distributional dimension (X1–X6), pertains to the material and economic conditions underpinning a city’s capacity to attract and host OMFs, corresponding to the distributional basis of spatial justice in cultural production. Following Harvey’s proposition that distributional justice is ultimately grounded in the allocation of material resources and the capacity of places to benefit from them [10]. It comprises two primary-indicator categories. The first, economic and consumption capacity, includes per capita disposable income (X1), cultural expenditure (X2), and the tertiary industry’s GDP share (X3). These variables characterize the economic foundation enabling a city to sustain cultural events. The second category, infrastructure and carrying capacity, comprises infrastructure investment (X4), green space ratio (X5), and highway density (X6), which represent the physical prerequisites for accommodating large-scale OMFs and mitigating geographic isolation. Collectively, these indicators constitute the material conditions that drive OMFs to diffuse into non-core cities, thereby reshaping the distributional pattern of festival resources across regions.
The second dimension, the procedural dimension (X7–X11), shifts analytical attention from outcomes to the institutional and industrial conditions shaping where and how OMFs are produced across cities, corresponding to the procedural basis of spatial justice in culture-led urban development [27]. Following Fraser’s insistence that justice must account for the institutional procedures through which resources are allocated [15], procedural conditions in the context of OMFs diffusion manifest through two complementary channels: the vertical, top-down procedural channel of state-led steering, and the horizontal, cross-sectoral procedural channel of inter-organizational collaboration. The two primary indicators of this dimension operationalize these channels respectively. The institutional steering includes cultural fiscal expenditure (X7) and policy intensity (X8), which capture the intensity of state-led engagement in attracting OMFs and addressing regional imbalances in cultural resource allocation. The industrial collaboration capacity comprises the number of cultural employees (X9), cultural and entertainment enterprises (X10), and domestic tourist arrivals (X11), indicating the local industrial base and stakeholder network capable of sustaining OMFs. Collectively, these indicators constitute the institutional and industrial conditions that drive OMFs to diffuse into non-core cities through policy-led and industry-enabled pathways.
The third dimension, the recognition dimension (X12–X15), concerns the demographic and symbolic conditions shaping a host city’s cultural visibility and identity, corresponding to the recognition basis of spatial justice in the digital era [28]. Drawing on Fraser’s argument that recognition requires the social validation of cultural identities [14] and on recent work linking digital platforms to the recognition of place-based cultural expressions, this dimension is operationalized through the demographic substrate that sustains cultural legibility and the digital articulation through which such legibility is observed and amplified. The demographic foundation comprises the share of youth population (X12) and the proportion of highly educated residents (X13), representing the human-capital base sustaining urban cultural consumption and festival appeal. The digital visibility comprises online search attention (X14) and the online sentiment index (X15), capturing the cognitive and affective dimensions of a host city’s presence in the digital public sphere. Collectively, these indicators constitute the demographic and symbolic conditions that drive OMFs to diffuse toward cities whose cultural identity is gaining prominence within the national cultural landscape.
To conduct the Geographical Detector, the dependent variable (Y) is defined as the cumulative number of OMFs hosted by each prefecture-level city during 2013–2024 (unit: events), aggregated from the 918 verified festival records. The fifteen independent variables (X1–X15) are organized along the three analytical dimensions of the spatial justice framework, and their operational definitions, measurement units, and data sources are summarized in Table 2. All normalized indices (X8, X14, X15) are dimensionless values bounded within defined numerical ranges, as specified in Table 2.

4.1.2. Data Sources and Processing of Key Indicators

The socioeconomic and infrastructure data (X1–X7, X9–X13) were primarily extracted from the China City Statistical Yearbook (2013–2024) and various provincial and municipal statistical bulletins. To ensure data consistency, all monetary values were adjusted to constant prices, and missing values for specific years were interpolated using linear trend methods. For the three complex indicators requiring advanced computation, X8, X14, and X15, specific data mining and processing protocols were implemented to ensure academic rigor and replicability.
Policy Intensity for Cultural-Tourism Industry (X8) was quantified through thematic content analysis of official government documents. To ensure rigorous reproducibility and address the complexities of spatial governance, data were retrieved from local government portals using a structured Boolean search strategy (Table 3). The search matrix was designed around three interconnected concepts: Event Type, Spatial and Land Context, and Policy Governance. To ensure replicability, an ordinal scoring rubric was applied based on the administrative hierarchy and policy enforceability [29]. Specifically, provincial-level strategic directives were assigned a weight of 3, municipal-level implementation guidelines a weight of 2, and sector-specific notices a weight of 1. The cumulative annual score for each city constitutes its localized policy intensity index, reflecting the institutional steering capacity in land-use and cultural resource allocation. For instance, in 2023, Chengdu achieved a policy intensity score of 5, comprising one provincial-level strategic directive (weight = 3) and one municipal implementation guideline (weight = 2).
Online Search Attention for Music Festivals (X14) serves as a proxy for active market demand and was derived from the Baidu Index platform [30]. Given Baidu’s dominance in the Chinese search market, we collected daily search volume data using “Music Festival (音乐节)” as the primary keyword for each host city. To control for demographic and digital divide biases, the raw search volume was normalized by dividing it by the annual number of active internet users in the respective host city, yielding a standardized per capita search attention metric. As an illustration, Nanjing recorded an aggregated raw search volume of 45,000 in 2024, which normalized to a per capita search attention metric of 0.0052 after adjusting for its local active internet user base. By contrast, Xian’s search attention is 0.0072, which is higher than Nanjing in 2024.
Online Sentiment Index (X15) was developed to capture the “emotional visibility” aspect of recognition through User-Generated Content (UGC) [31]. We utilized Python-based web scrapers to collect over 500,000 reviews and posts from social media platforms, including Xiaohongshu and Damai, spanning the study period. To ensure validity, two independent coders manually annotated a 5000-post subset (Cohen’s Kappa = 0.85) to train the model. Evaluated on a standard 80/20 train-test split, the model achieved an overall accuracy of 88.5% and a macro F1-score of 0.87. Each post was classified as positive, neutral, or negative, with texts scoring below a 0.6 confidence threshold subject to secondary manual verification. The index was calculated as the annual ratio of validated positive sentiments to total mentions. For example, Wuhu yielded a sentiment index of 0.82 in 2019, derived from 12,300 positive mentions out of 15,000 valid posts regarding its local music festivals. This data has shown a significant increase compared to the 0.60 figure from 2015.
S e n t i m e n t   I n d e x i , t = P o s i t i v e   S e n t i m e n t s i , t T o t a l   m e n t i o n s i , t

4.2. Factor Detection

Table 4 details the factor detection results, reporting the explanatory power (q value) of the 15 indicators for the spatial diffusion of OMFs in China. Statistical analyses confirm that all 15 selected indicators passed the significance test at the 1% level (p < 0.01) [20]. Notably, the five highest-ranking factors are highway density (X6, q = 0.5992), Government Expenditure on Culture, Tourism, Sports, and Media (X7, q = 0.5930), Number of Cultural Employees (X9, q = 0.5481), Number of Cultural and Entertainment Enterprises (X10, q = 0.5131), and the Online Sentiment Index (X15, q = 0.4377) This results suggests that transportation infrastructure, fiscal support for culture, the local cultural-industry base, and positive digital attention together constitute the most salient factors associated with the emergence of non-core cities as OMFs host locations.
Aggregated by dimension, the mean q values rank as follows: Procedural Justice (0.4529) > Recognition Justice (0.3417) > Distributional Justice (0.3216). The procedural dimension exhibits the highest explanatory power, indicating that the spatial decentralization of OMFs toward second- and third-tier cities in China is not driven primarily by spontaneous market dynamics, but is closely associated with local institutional steering and industrial collaboration [32]. The recognition dimension ranks second, reflecting the strong dependence of the OMFs market on the digital validation and cultural consumption of youth demographics [5,15]. Although Distributional Justice shows the lowest mean q value, its internal indicator of highway density (X6) holds the highest single explanatory power. This suggests that material and infrastructural conditions remain a foundational factor [33]. A well-developed transportation network not only underpins the distributional basis of festival accessibility but also strengthens urban carrying capacity and operational safety for large-scale cultural events [34].

4.3. Interaction Detection

The interaction detection module examines the joint effects of different variable combinations on the spatial distribution of OMFs. As shown in Table 5, the interaction between any two indicators exceeds their individual effects, exhibiting either bi-factor enhancement or a nonlinear enhancement without exception. The absence of independent or mutually weakening variables indicates that the spatiotemporal diffusion of OMFs cannot be attributed to any single factor; it is associated with the systematic co-action of factors across the three dimensions of the spatial justice framework [14,29].
Within this multi-factor configuration, the coupling between indicators of the recognition and procedural dimensions produces a pronounced amplification effect. The interaction between online search attention (X14) and cultural employees (X9) or cultural enterprises (X10) yields the strongest nonlinear enhancements with q values of 0.6989 and 0.6884. This pattern suggests that the digital visibility gained by peripheral cities becomes most consequential for OMFs diffusion when supported by a substantive local industrial base; in the absence of such industrial foundations, online attention is unlikely to translate into sustained offline cultural production [35].
The interaction between distributional justice and recognition justice further highlights the role of human-capital conditions in activating material foundations. The interactions of the proportion of highly educated residents (X13) with the tertiary industry’s GDP share (X3) and infrastructure investment (X4) also yield substantial nonlinear enhancements (q = 0.6704 and 0.6702, respectively). This pattern suggests that a population with higher cultural literacy not only sustains the consumption base for OMFs but also amplifies the effect of a city’s economic and infrastructural conditions, thereby broadening the pool of cities capable of participating in the geographic diffusion of OMFs and enhancing their adaptive capacity during economic and spatial transitions [10].
Finally, the interaction between procedural and distributional dimensions points to a practical configuration underlying diffusion. The interaction between government expenditure (X7) and highway density (X6) reaches a q value of 0.6612, indicating that fiscal steering exerts the strongest effect when paired with adequate transportation accessibility. In summary, the interaction results show that the geographic diffusion of OMFs is associated with the joint operation of the three dimensions of the spatial justice framework work [11].

5. Discussion and Implications

5.1. The Spatiotemporal Evolution and Mechanisms of OMFs

The geographic distribution of outdoor music festivals (OMFs) in China from 2013 to 2024 exhibits a pronounced “market-sinking” trend accompanied by westward expansion. The geographic concentration index (G) declined continuously from 23.0940 to 13.3069, while the primacy index (P) remained at a consistently low level. These indices jointly indicate a weakening concentration of OMFs in first-tier megacities and their extension into second- and third-tier inland cities, including host locations west of the Heihe–Tengchong Line. In temporal terms, although hosting activity continued to cluster around May and October, the seasonal concentration index (Tm) exhibited a gradual downward trend, signaling a progressive diffusion of festival activity across the calendar year. The 2018 cultural-tourism integration policy marked an important inflection point in this process, tying OMFs more closely to regional tourism circuits and encouraging non-core cities to take on hosting roles [4]. This spatio-temporal pattern represents the observable form of a spatial production process through which OMFs, as a distinctive category of cultural resource, are becoming accessible [6,10]. Rather than a purely market-driven process, the spatio-temporal diffusion of OMFs is shaped by multi-dimensional factors and can be interpreted, through the spatial justice framework, as reflecting a structural reconfiguration of how material, institutional, and symbolic conditions are distributed across host cities [36].
The factor detection results reveal distinct patterns of influence across the three dimensions of the spatial justice framework. Within the procedural dimension, government expenditure on culture and tourism exhibits the highest explanatory power, indicating that institutional steering is closely associated with the extension of OMFs into non-core cities. Under China’s culture-tourism governance arrangement, fiscal subsidies, venue coordination, and administrative clearance reduce the entry barriers that would otherwise restrict mega-events to metropolitan locations, such that lower-tier cities with stronger fiscal and policy support appear more likely to translate policy intent into hosting activity [37]. The co-existing effects of cultural employees and cultural enterprises indicate that procedural influence is not confined to state action alone; a functioning local industrial network—of stage technicians, promoters, and venue operators—appears equally relevant, as it supplies the operational continuity that festival production requires. Within the distributional dimension, highway density emerges as the single most influential indicator, reflecting the importance of transportation accessibility in enabling inland cities to draw on wider regional catchments; in its absence, even well-funded hosting efforts struggle to attract sufficient visitor flows [38]. Other distributional factors provide the underlying economic and environmental conditions that sustain such accessibility over time. Within the recognition dimension, the online sentiment index and online search attention jointly indicate that symbolic visibility is increasingly associated with festival diffusion, as prospective audiences increasingly rely on digital word-of-mouth to select destinations; the demographic indicators, in turn, capture the youthful and culturally active population that both generates and responds to such visibility [9]. Taken together, the three dimensions appear to operate not as competing explanations but as complementary lines of influence along which factors associated with OMFs diffusion are structured.
The interaction detection results further suggest that the spatio-temporal evolution of OMFs is shaped by the joint influence of factors across the three dimensions. All pairwise interactions produce either bi-factor or nonlinear enhancement, with the strongest effects arising between procedural and distributional factors—particularly government expenditure combined with highway density (X7 × X6, q = 0.6612)—and between recognition and procedural factors, where digital attention reinforces the offline industrial base (X14 × X9, q = 0.6989; X14 × X10, q = 0.6884). A further pattern along the distributional–recognition axis shows that the presence of an educated and culturally active population is associated with stronger effects of material conditions on OMF diffusion. These cross-dimensional interactions suggest that the spatial production of OMFs is consistent with a configuration in which institutional, material, and symbolic conditions co-occur and mutually amplify at the city level. Interpreted through the spatial justice framework, this configuration can be understood as an emerging form of collaborative co-creation—one in which the pursuit of spatial justice in China’s land use strategy is approached not through top-down redistribution alone, but through the joint involvement of governmental, market, and public actors in concrete hosting projects [39]. This reading suggests a potentially viable direction for small and medium-sized cities, particularly in western inland regions, to engage with festival-based cultural production [40,41].

5.2. Collaborative Governance Strategies for OMFs

In response to the spatio-temporal evolution of OMFs identified in this study, emerging host cities should move beyond top-down event management and develop an integrated framework of land-use governance capable of coordinating the allocation, reuse, and co-production of event-related spaces [42]. Transforming short-term festival activity into more sustained spatial engagement for second- and third-tier cities requires aligning land-use planning with participatory processes that engage local governments, cultural enterprises, and community residents in the collaborative allocation and adaptive development of land resources. First, land-use planning for OMFs should embrace adaptive, multi-functional spatial allocation to ease seasonal pressure and avoid the creation of idle infrastructure. While transportation accessibility remains a central condition for OMFs diffusion, the pronounced seasonal concentration of festival activity raises concerns about the spatial and fiscal efficiency of single-purpose venue construction [43]. Non-core cities should instead adopt Temporary Land Use (TLU) strategies and participatory planning processes—involving urban planners, event organizers, and residents—to co-design multi-functional event spaces [44]. Adapting suburban green spaces, industrial heritage sites, and other underutilized parcels allows cities to accommodate peak festival crowds while maintaining these sites as accessible public spaces during off-seasons. This strategy aligns closely with broader international findings on urban regeneration, which demonstrate that designing socio-spatial contexts through targeted urban infill and adaptive land use significantly enhances neighborhood liveability and social conviviality [44]. Such adaptive arrangements align the territorial management of cultural events with considerations of more equitable land allocation.
Second, public–private collaboration should be extended into the land development process itself, so as to support the local cultural ecosystem and mitigate homogeneous inter-city competition. Lower-tier markets frequently experience repetitive competition in festival programming [45], and financial subsidies alone are unlikely to secure longer-term economic benefits, given the strong synergy between governmental investment and local cultural enterprises [2]. Cities should therefore establish cross-sector partnerships and implement flexible, mixed-use zoning policies that lower land-entry barriers for grassroots art collectives, start-ups, and cultural practitioners. Anchoring regional cultural symbols within festival-led land regeneration projects [46] helps channel external capital toward place-specific cultural production, such that the spatial production of OMFs can pursue a logic of collaborative co-creation rather than displacement-driven redevelopment.
Third, the territorial governance of event spaces should incorporate youth-led activation of underutilized urban stock land, channeling digital cultural attention toward more durable forms of spatial engagement. Because highly educated youth substantially amplify the digital visibility of host cities, urban governance should treat this group as active participants in urban space rather than as transient festival consumers [47]. Local governments can reserve adjacent vacant or underused parcels around principal festival venues for youth-led spatial co-production—including creative markets, temporary cultural programs, and community workshops [48,49]—supported by dedicated land-use provisions and streamlined administrative procedures. Beyond the immediate economic spillover, incorporating such music-centric and collaborative activities functions as a catalyst for long-term community vitality. As observed in international contexts, music-based frameworks play a crucial role in fostering positive psychological engagement and human flourishing [50]. Such arrangements can help link ephemeral online attention with more sustained forms of local cultural engagement, offering non-core cities a participatory pathway through which to reposition themselves within China’s evolving national territorial landscape.

6. Conclusions and Future Research

6.1. Conclusions

This study investigates the spatio-temporal evolution of outdoor music festivals (OMFs) in China between 2013 and 2024 and examines the multi-dimensional mechanisms that shape this process. Drawing on city-level panel data and applying the Geodetector model within a spatial justice analytical framework, the analysis addresses how the cultural resources once concentrated in metropolitan centers have extended to encompass a wider range of Chinese cities. Three contributions follow from this inquiry.
Theoretically, the study extends the classical core–periphery account by showing that the geographic decentralization of OMFs is not a purely market-driven process but emerges within configurations involving multiple urban actors—governmental, market, and public—in which institutional, material, and symbolic conditions are jointly present across the distributional, procedural, and recognition dimensions. Interpreted through the spatial justice framework, such configurations can be read as expressions of cities’ orientation toward more equitable cultural development opportunities, with spatial justice serving as the analytical lens through which the joint influence of these multi-dimensional conditions on diffusion can be systematically examined. By shifting attention from static structural distributions to active production processes, the study offers a new theoretical perspective on how non-core regions can be repositioned—analytically and potentially in practice—within uneven land and cultural resources.
Methodologically, the study operationalizes the three-dimensional spatial justice framework into a system of 15 city-level indicators and applies the Geodetector model to examine both single-factor and interactive effects. By capturing how cities mobilize land-based, infrastructural, institutional, and symbolic resources in combination, the indicator system translates a largely normative theoretical framework into a replicable empirical design and provides a transferable analytical template for studying the spatial production of other cultural resources.
Substantively, the study identifies collaborative co-creation as the characteristic modality through which the pursuit of spatial justice is operationalized in China’s cultural geography, and carries direct implications for land-use planning and the territorial governance of event spaces. These patterns offer direct implications for land-use planning and the territorial governance of event spaces. Territorial governance must move beyond top-down resource redistribution toward a model of collaborative land resource development co-produced by governmental, market, and public actors.

6.2. Limitations and Future Research

While this study elucidates macro-level diffusion mechanisms, several avenues remain for extending the present inquiry. Our findings operate at the level of structural configuration and do not, on their own, establish whether such configurations translate into equitable cultural access, durable developmental outcomes, or substantive reconfiguration of core–periphery structures—questions that require modes of evidence beyond city-level panel data. First, incorporating micro-geographic data such as Points of Interest, mobile signaling, and venue-level land-use records would enable finer-grained examination of how collaborative planning reshapes spatial configurations around festival sites and whether structural shifts translate into improved cultural access for specific communities. Second, ethnographic fieldwork and case-based institutional analysis would complement the macro-level findings by documenting how governmental, market, and public actors negotiate in practice around specific hosting projects. Third, as OMFs continue to extend into peri-urban and rural areas, integrating an environmental-justice dimension—alongside longitudinal tracking of host cities—would broaden the spatial-justice framework and help assess whether the observed diffusion patterns correspond to durable developmental trajectories or more temporary phases of cultural-market expansion. Together, these directions would deepen understanding of how the pursuit of spatial justice is operationalized through coordinated multi-actor engagement in the governance of cultural-event spaces.

Author Contributions

Conceptualization, M.Q. and H.Z.; data curation, M.Q.; formal analysis, M.Q. and H.Z.; funding acquisition, H.Z.; investigation, M.Q. and H.Z.; methodology, M.Q.; project administration, M.Q.; software, M.Q.; supervision, H.Z.; validation, M.Q.; visualization, M.Q.; writing—original draft, M.Q.; writing—review and editing, M.Q. and H.Z. All authors have read and agreed to the published version of the manuscript.

Funding

This research was funded by the National Natural Science Foundation of China, grant numbers 42401267 and 42471263.

Institutional Review Board Statement

The study was conducted in accordance with the Declaration of Helsinki and approved by the Institutional Review Board of Nanjing Forestry University (protocol code njfu-8027311, approved on 26 June 2025).

Informed Consent Statement

Informed consent was obtained from all subjects involved in the study.

Data Availability Statement

The data presented in this study are available on request from the corresponding author. Restrictions apply to the raw data due to commercial confidentiality and privacy protection of platform user information. If there are relevant research needs, the data can be obtained by sending an email to Mengyuan Qiu (qiumengyuan@njfu.edu.cn). Please indicate the purpose of the research and the statement of data confidentiality in the email.

Acknowledgments

We sincerely thank the editor and anonymous reviewers for their insightful and valuable comments, which significantly improved our manuscript.

Conflicts of Interest

The authors declare no conflicts of interest.

References

  1. Getz, D.; Page, S.J. Progress and prospects for event tourism research. Tour. Manag. 2016, 52, 593–631. [Google Scholar] [CrossRef]
  2. Richards, G. Creativity and tourism: The state of the art. Ann. Tour. Res. 2011, 38, 1225–1253. [Google Scholar] [CrossRef]
  3. Chen, T.L.; Yen, Y.S. Exploring the role of temporary use in promoting urban sustainability—A case study in Taipei City, Taiwan. Cities 2025, 165, 106208. [Google Scholar] [CrossRef]
  4. Gibson, C.; Gordon, A. Rural cultural resourcefulness: How community music enterprises sustain diversity in rural Australia. J. Rural Stud. 2018, 63, 259–270. [Google Scholar] [CrossRef]
  5. Rățulea, G.G.; Csesznek, C.; Borcoman, M.; Sorea, D. Cultural landscape as a resource for urban regeneration in Rupea (Romania). Land 2023, 12, 1985. [Google Scholar] [CrossRef]
  6. Quinn, B. Arts festivals and the city. Urban Stud. 2005, 42, 927–943. [Google Scholar] [CrossRef]
  7. Crompton, J.L.; McKay, S.L. Motives of visitors attending festival events. Ann. Tour. Res. 1997, 24, 425–439. [Google Scholar] [CrossRef]
  8. Gursoy, D.; Kim, K.; Uysal, M. Perceived impacts of festivals and special events by organizers: An extension and validation. Tour. Manag. 2004, 25, 171–181. [Google Scholar] [CrossRef]
  9. Pratt, A.C. Creative cities: The cultural industries and the creative class. Geogr. Ann. Ser. B 2008, 90, 107–117. [Google Scholar] [CrossRef]
  10. Harvey, D. Social Justice and the City; University of Georgia Press: Athens, GA, USA, 2010; pp. 23–40. [Google Scholar]
  11. Soja, E.W. The city and spatial justice. Space Justice 2009, 1, 1–5. [Google Scholar]
  12. Gotham, K.F. Theorizing urban spectacles: Festivals, tourism and the transformation of urban space. City 2005, 9, 225–246. [Google Scholar] [CrossRef]
  13. de Jong, A.; Humbracht, M.; Sjölander-Lindqvist, A.; Taylor, S.; Figueora-Domecq, C.; Cortes-Romero, N. Justice in tourism geographies. Tour. Geogr. 2025, 27, 1534–1556. [Google Scholar] [CrossRef]
  14. Fainstein, S.S. The Just City; Cornell University Press: Ithaca, NY, USA, 2014; Volume 18, pp. 1–18. [Google Scholar]
  15. Fraser, N. From redistribution to recognition? Dilemmas of justice in a ‘post-socialist’ age. New Left Rev. 1995, 212, 68–93. [Google Scholar] [CrossRef]
  16. Chelleri, L.; Schuetze, T.; Salvati, L. Integrating resilience with urban sustainability in neglected neighborhoods: Challenges and opportunities of transitioning to decentralized water management in Mexico City. Habitat Int. 2015, 48, 122–130. [Google Scholar] [CrossRef]
  17. Kirilenko, A.P.; Stepchenkova, S.O.; Kim, H.; Li, X. Automated sentiment analysis in tourism: Comparison of approaches. J. Travel Res. 2018, 57, 1012–1025. [Google Scholar] [CrossRef]
  18. Ellison, G.; Glaeser, E.L. Geographic concentration in U.S. manufacturing industries: A dartboard approach. J. Political Econ. 1997, 105, 889–927. [Google Scholar] [CrossRef]
  19. Wang, J.F.; Li, X.H.; Christakos, G.; Liao, Y.L.; Zhang, T.; Gu, X.; Zheng, X.Y. Geographical detectors-based health risk assessment and its application in the neural tube defects study of the Heshun Region, China. Int. J. Geogr. Inf. Sci. 2010, 24, 107–127. [Google Scholar] [CrossRef]
  20. Wang, J.; Xu, C. Geographic Detector: Principles and Prospects. Acta Geogr. Sin. 2017, 72, 116–134. [Google Scholar]
  21. Wang, J.F.; Hu, Y. Environmental Health Risk Detection with GeogDetector. Environ. Model. Softw. 2012, 33, 114–115. [Google Scholar] [CrossRef]
  22. Guo, Y.; Wu, Z.; Zheng, Z.; Li, X. An optimal multivariate-stratification geographical detector model for revealing the impact of multi-factor combinations on the dependent variable. GISci. Remote Sens. 2024, 61, 2422941. [Google Scholar] [CrossRef]
  23. Moroni, S. Towards just planning: On the relationship between procedural and distributive justice in local development actions. Plan. Theory 2020, 19, 251–275. [Google Scholar] [CrossRef]
  24. Paddison, B.; Hall, J. Tourism policy, spatial justice and COVID-19: Lessons from a tourist-historic city. J. Sustain. Tour. 2023, 31, 895–912. [Google Scholar] [CrossRef]
  25. Esmaeili, M.; Sheydayi, A.; Jamalabadi, F. A systematic review of qualitative and quantitative content analysis applications in urban planning research: Proposing a mixed method approach. J. Urban Plan. Dev. 2025, 151, 04025020. [Google Scholar] [CrossRef]
  26. Uwayezu, E.; De Vries, W.T. Indicators for measuring spatial justice and land tenure security for poor and low income urban dwellers. Land 2018, 7, 84. [Google Scholar] [CrossRef]
  27. Jones, R.; Moisio, S. Regions and the search for spatial justice: A question of capacity? Reg. Stud. 2025, 59, 35–42. [Google Scholar] [CrossRef]
  28. Rastegar, R.; Ruhanen, L. The injustices of rapid tourism growth: From recognition to restoration. J. Sustain. Tour. 2022, 30, 2686–2704. [Google Scholar]
  29. Wang, J.; Sun, Q.; Zou, L. Spatial-temporal evolution and driving mechanism of rural production-living-ecological space in Pingtan islands, China. Habitat Int. 2023, 137, 102833. [Google Scholar] [CrossRef]
  30. Ma, X.; Yang, Z.; Zheng, J. Analysis of spatial patterns and driving factors of provincial tourism demand in China. Sci. Rep. 2022, 12, 2260. [Google Scholar] [CrossRef]
  31. Wen, Y.; Liang, Y.; Zhu, X. Sentiment analysis of hotel online reviews using the BERT model and ERNIE model—Data from China. PLoS ONE 2023, 18, e0275382. [Google Scholar] [CrossRef]
  32. Zhang, F.; Wu, F. City-regional governance under state entrepreneurialism in China. Urban Stud. 2023, 60, 2039–2056. [Google Scholar] [CrossRef]
  33. Feitosa, F. Operationalizing spatial justice in urban planning: Bridging theory with practice. Urban Res. Pract. 2024, 17, 720–736. [Google Scholar] [CrossRef]
  34. Müller, M. The mega-event syndrome: Why so much goes wrong in mega-event planning and what to do about it. J. Am. Plan. Assoc. 2015, 81, 6–17. [Google Scholar] [CrossRef]
  35. Markusen, A.; Gadwa, A. Arts and culture in urban or regional planning: A review and research agenda. J. Plan. Educ. Res. 2010, 29, 379–391. [Google Scholar] [CrossRef]
  36. Wang, J.F.; Zhang, T.L.; Fu, B.J. A measure of spatial stratified heterogeneity. Ecol. Indic. 2016, 67, 250–256. [Google Scholar] [CrossRef]
  37. He, S.; Wu, F. China’s emerging neoliberal urbanism: Perspectives from urban redevelopment. Antipode 2009, 41, 282–304. [Google Scholar] [CrossRef]
  38. Lin, G.C.S. Reproducing spaces of Chinese urbanisation: New city-based and land-centred urban transformation. Urban Stud. 2007, 44, 1827–1855. [Google Scholar] [CrossRef]
  39. Gretzel, U.; Sigala, M.; Xiang, Z.; Koo, C. Smart tourism: Foundations and developments. Electron. Mark. 2015, 25, 179–188. [Google Scholar] [CrossRef]
  40. Colomb, C. Pushing the urban frontier: Temporary uses of space, city marketing, and the creative city discourse in 2000s Berlin. J. Urban Aff. 2012, 34, 131–152. [Google Scholar] [CrossRef]
  41. Meerow, S.; Newell, J.P.; Stults, M. Defining urban resilience: A review. Landsc. Urban Plan. 2016, 147, 38–49. [Google Scholar] [CrossRef]
  42. Smith, A. ‘Borrowing’ public space to stage major events: The Greenwich Park controversy. Urban Stud. 2014, 51, 247–263. [Google Scholar] [CrossRef]
  43. Ahern, J. From fail-safe to safe-to-fail: Sustainability and resilience in the new urban world. Landsc. Urban Plan. 2011, 100, 341–343. [Google Scholar] [CrossRef]
  44. Grodach, C. Cultural economy planning in creative cities: Discourse and practice. Int. J. Urban Reg. Res. 2013, 37, 1747–1765. [Google Scholar] [CrossRef]
  45. Elshater, A.; Abusaada, H.; Tarek, M.; Afifi, S. Designing the socio-spatial context urban infill, liveability, and conviviality. Built Environ. 2022, 48, 341–363. [Google Scholar] [CrossRef]
  46. Fu, D.; Chen, T.; Lang, W. Evolutionary Patterns and Mechanism Optimization of Public Participation in Community Regeneration Planning: A Case Study of Guangzhou. Land 2025, 14, 1394. [Google Scholar] [CrossRef]
  47. Lew, A.A. Tourism planning and place making: Place-making or placemaking? Tour. Geogr. 2017, 19, 448–466. [Google Scholar] [CrossRef]
  48. Santisteban, M.; Quintas-Soriano, C.; Castro, A.J. Co-Creating Resilient Cities: Community Engagement for Inclusive and Sustainable Urban Planning. Land 2023, 12, 1528. [Google Scholar]
  49. van Blerk, L.; Hunter, J.; Shand, W.; Prazeres, L. Creating stories for impact: Co-producing knowledge with young people through story mapping. Area 2023, 55, 99–107. [Google Scholar] [CrossRef]
  50. Roseth, N.E. PROSPERing in music: A positive education framework for flourishing. Music Educ. J. 2026, 112, 40–47. [Google Scholar] [CrossRef]
Figure 1. Annual number of OMFs and the development of the cultural-tourism industry in China, 2013–2024. Note: A green box in the figure marks the year when the national cultural and tourism integration policy was officially proposed and issued.
Land 15 00746 g001
Figure 2. The monthly distribution and seasonal concentration index of OMFs during 2013–2024.
Land 15 00746 g002
Figure 3. The spatial evolution of OMFs in China, 2013–2024. Note: This figure is based on the standard map with approval number GS (2024) 0650.
Land 15 00746 g003
Table 1. Spatial concentration of OMF host cities in China, 2013–2024.
YearGeographic Concentration IndexPrimacy Index
G G ¯
201321.700640.90871.3333
201418.973732.48641.3333
201523.094050.20621.5000
201623.014242.48222.0000
201721.593438.08751.0000
201821.640731.55821.1667
201918.523326.93991.2500
202019.517131.55821.6667
202117.666123.01121.4000
202217.946122.54162.0000
202314.004813.98151.2857
202413.306912.41051.1429
Table 2. Influencing factors of the spatio-temporal evolution of the OMFs.
VariableDimensionPrimary IndicatorSecondary IndicatorUnit
YDependent VariableFestival DistributionNumber of OMFs in Host CityUnits
X1Distributional DimensionEconomic and Consumption
Capacity
Per Capita Disposable Income RMB
X2Education, Culture, and Entertainment Expenditure RMB
X3GDP Share of Tertiary Industry in Host City%
X4Infrastructure and Carrying CapacityInfrastructure Investment 10,000 RMB
X5Green Space Ratio in Host City%
X6Density of Classified Highways in Host Citykm/km2
X7Procedural DimensionInstitutional SteeringGovernment Expenditure on Culture, Tourism, Sports, and Media 10,000 RMB
X8Policy Intensity for the Cultural Tourism Industry Score
X9Industrial Collaboration CapacityNumber of Employees in Culture, Sports, and Entertainment IndustriesPerson
X10Number of Cultural and Entertainment EnterprisesUnits
X11Number of Domestic Tourist Arrivals in Host City10,000 person-times
X12Recognition DimensionDemographic FoundationProportion of Population Aged 20–34%
X13Proportion of Highly Educated Population %
X14Digital VisibilityOnline Search Attention for Music Festivals Normalized Index
X15Online Sentiment Index Ratio (0–1)
Table 3. Boolean search strategy and keyword matrix for X8.
Concept CategoryBoolean LogicChinese Search TermsEnglish Translation
Event Type(A1 OR A2…)音乐节;户外演出;大型演艺活动;节事活动Music festival; Outdoor performance; Large-scale cultural events; Festival events
Spatial and Land ContextAND (B1 OR B2…)文旅融合;临时用地;空间激活;公共空间利用;工业遗址/文创园区Cultural-tourism integration; Temporary land use; Spatial activation; Public space utilization; Industrial heritage; Creative parks
Policy and GovernanceAND (C1 OR C2…)规划;空间治理;扶持/补贴;指导意见;审批管理Planning; Spatial governance; Support/Subsidy; Guiding opinions; Approval management
Table 4. Factor detection result.
VariableX1X2X3X4X5X6X7X8X9X10X11X12X13X14X15
q0.24640.23330.13320.33600.38170.59920.59300.27870.54810.51310.33140.29820.25990.37100.4377
p0.00000.00000.00010.00000.00000.00000.00000.00000.00000.00000.00000.00000.00000.00000.0000
Table 5. Interactive detection result.
X1X2X3X4X5X6X7X8X9X10X11X12X13X14
X20.1647
X30.24430.2046
X40.18380.18800.2427
X50.50590.38860.47170.5460
X60.52460.38800.51510.49390.6057
X70.61500.61370.49370.65120.60420.6612
X80.36040.34010.36400.41920.48340.54460.5872
X90.63280.60630.62950.65330.62780.66420.65580.6074
X100.56340.52700.53760.53760.54730.61190.66310.53250.5981
X110.52200.34460.45060.52730.57340.53960.60300.51430.57780.5329
X120.37150.27140.32990.40050.52600.49450.56590.41260.62220.55270.5029
X130.66410.58090.67040.67020.63740.62110.64310.59220.67660.64760.64910.5783
X140.55480.56470.58450.61490.61810.63270.64650.49660.69890.68840.47900.56690.6516
X150.26050.21470.24090.29070.46980.44850.55110.28610.58530.49190.38350.24780.53870.3729
Disclaimer/Publisher’s Note: The statements, opinions and data contained in all publications are solely those of the individual author(s) and contributor(s) and not of MDPI and/or the editor(s). MDPI and/or the editor(s) disclaim responsibility for any injury to people or property resulting from any ideas, methods, instructions or products referred to in the content.