Article

Telecoupled Resource Use: Roadside Woodfuel Trade in Urbanizing Benin

by
Youness Boubou
1,†,
David Tonnan Amos Akankossi
1,2,†,
Luc Hippolyte Dossa
2 and
Andreas Buerkert
1,*
1
Organic Plant Production and Agroecosystems Research in the Tropic and Subtropics, Faculty of Organic Agricultural Sciences, University of Kassel, 37213 Witzenhausen, Germany
2
Faculty of Agricultural Sciences, University of Abomey-Calavi, Abomey-Calavi 01 BP 526, Benin
*
Author to whom correspondence should be addressed.
These authors contributed equally to this work.
Land 2026, 15(5), 734; https://doi.org/10.3390/land15050734
Submission received: 10 March 2026 / Revised: 11 April 2026 / Accepted: 22 April 2026 / Published: 26 April 2026
(This article belongs to the Section Land – Observation and Monitoring)

Abstract

Rapid urbanization and population growth in West Africa are intensifying pressure on natural resources and reconfiguring telecoupled supply chains, especially for essential household fuels like charcoal and firewood, here collectively referred to as woodfuel, that link urban consumers to distant production landscapes. However, these cross-regional linkages remain poorly understood. This study, therefore, investigates how urban dynamics structure telecoupled woodfuel flows in Benin, based on quantitative and qualitative surveys of roadside charcoal and firewood traders along the country’s major long-distance roads RNIE#2 and RNIE#3. Collected data included sources, destinations, quantities, pricing, and organizational aspects, combined into a system analysis of fuelwood trading across sending, receiving, and corridor (spillover) areas. Results show consumers growing reliance on charcoal, which in our study amounted to 35,770 t year−1 (97% of the total surveyed flow) to urban areas. Roadside trading depends heavily on connectivity, traffic, and regional trade links, with RNIE#2 emerging as the main corridor, channeling 30,960 t year−1 (84% of the total surveyed flow). Contrary to assumptions that woodfuel sources reflect vegetation density, distances to reported sources were short, with supply shadows averaging 11.3 km (SD = 14.5). Urban demand shapes woodfuel flows by concentrating most trade in major cities—especially the Cotonou–Porto-Novo area, which received 83% (28,770 t year−1) of charcoal and 84% (850 t year−1) of firewood traded along the surveyed flow axes of Benin, with market reach distances varying between 1 and 390 km.

1. Introduction

Across Africa, rapid population growth and urbanization have severe implications for the use of natural resources, particularly woodfuel [1,2]. Woodfuel still constitutes a pivotal source of energy on the continent, covering 80% of households’ energy needs, and the demand is likely to increase during the next decades [3,4]. In urban areas, charcoal is preferred as it is easy to transport and produces less smoke compared with the cheaper firewood predominating in rural areas [5,6]. In contrast with other sources of energy, such as liquefied petroleum gas, electricity, or kerosene, which are imported and require costly infrastructures for transfer and storage, woodfuel is more available and affordable for low-income populations throughout Sub-Saharan Africa [7]. Woodfuel trading also supports many livelihoods and thus reduces rural poverty, given its stable market demand [8,9]. In addition, charcoal value chains in West and Central Africa are often largely informal, which facilitates market participation but also weakens regulation, tax capture, and incentives for sustainable management [10]. On the other hand, production and consumption patterns of woodfuel may have severe environmental and social consequences. Woodfuel consumption significantly contributes to forest degradation [11], biodiversity loss [12,13], indoor air pollution and subsequent health problems [14,15].
At an estimated population growth rate of 80% between 2020 and 2030 and expanding needs for human well-being, per capita and total woodfuel demands are increasing throughout Africa [1,16,17]. As urbanization (49% of the African population is living in cities in 2024) funnels the woodfuel flow to the cities [1,18], traditional woodfuel chains are undergoing major transformation. Shifted consumption hubs from scattered rural points to centralized urban locations will likely change the length of the supply chain, and actor networks may expand. This will likely affect the distribution of net profits among actors. Production areas may shift towards primary forests as the availability of wood on the outskirts of urban areas is decreasing, and because of a preference for hardwood with higher energy density.
In Benin, roadside charcoal and firewood vending is a widespread activity [19], particularly along the two major north–south trade routes linking the country’s main cities (Figure 1 and Figure 2). These roadside vendors function as wholesalers within the woodfuel supply chain, connecting rural production areas to urban markets. Because their activity responds quickly to changes in urban demand and rural supply, these vendor sites provide useful indicators of the direction and intensity of woodfuel flows. Viewed from a telecoupling perspective, these flows reflect socioeconomic and environmental interactions operating across distance. In the present case, rural production areas can be understood as source areas, urban consumption centers as receiving areas, and the major road corridors and intermediate trading locations as corridors or spillover spaces through which woodfuel, people, and market signals circulate. This perspective makes it possible to interpret the roadside woodfuel trade not as an isolated local activity, but as part of a spatially connected system linking distant supply and demand [20]. This study aims to assess the effects of urbanization on the woodfuel supply chain centered around roadside vending in Benin by analyzing its structural characteristics and identifying key drivers of supply and demand through spatial analysis. Four hypotheses were formulated: (i) charcoal constitutes the primary component of the woodfuel flow; (ii) the prevalence of roadside woodfuel vending differs between major roads; (iii) woodfuel supply is influenced by vegetation density in the source areas, whereby higher tree density is enhancing availability; and (iv) urban woodfuel demand is dominant and increasingly met by suppliers from distant rural locations.

2. Materials and Methods

2.1. Study Area

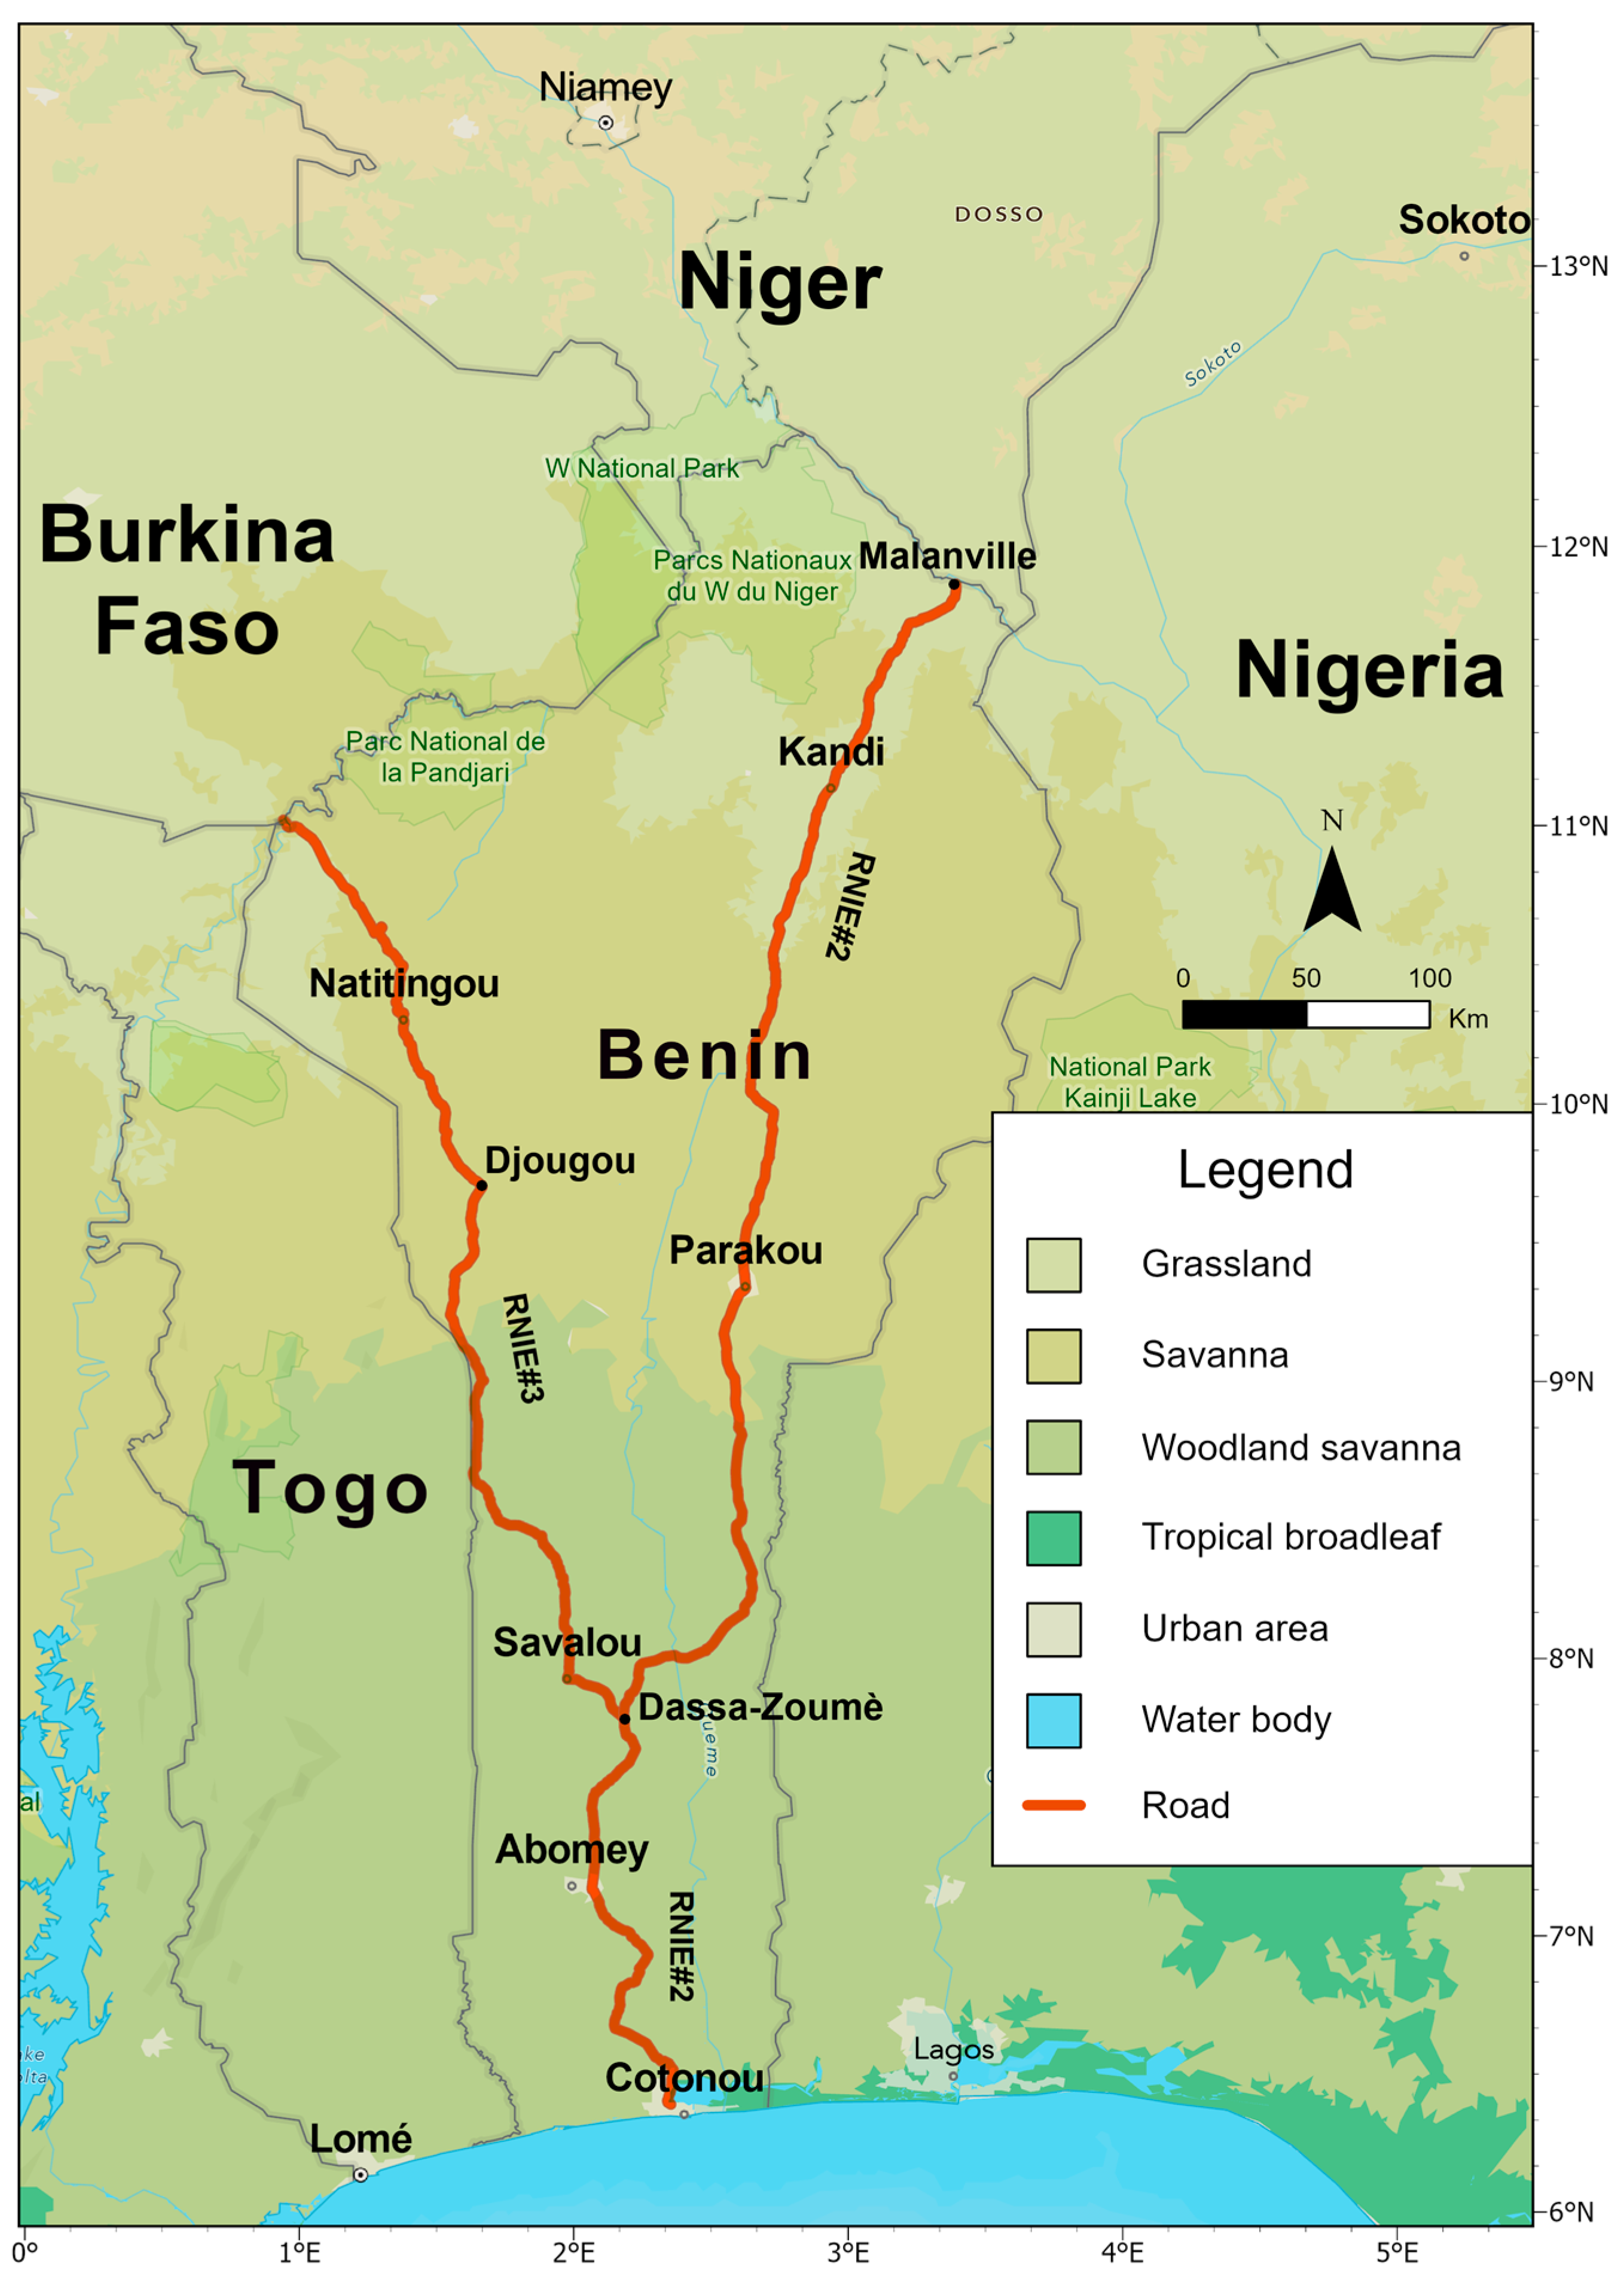
The West African country of Benin stretches between 6.0° and 12.5° N, and 0.5° and 4.0° E, reaching from the humid sub-equatorial zone at the southern coast to the Sudanian savanna zone in the north. It is bordered to the northwest by Burkina Faso and Niger, to the east by Nigeria, and to the west by Togo (Figure 2). While the country’s official capital is Porto-Novo, Cotonou is its largest city, its chief port, and its economic capital. The southern part of Benin is home to more than two-thirds of its total population, concentrated in a quarter of the country’s area. Nearly half of Benin’s population is urban and is clustered between Porto-Novo and Cotonou. Towards the north, the savanna vegetation increases, and the population diminishes; some areas north of the market town of Parakou are only inhabited by Fulani nomads [21]. Benin’s two major inland trade and transport roads are the national interstate roads of Malanville–Cotonou (#RNIE2) with 750 km, and Natitingou–Dassa (RNIE#3) with 450 km (Figure 2).
Figure 2. Location of different biomes and the two major trade axes in Benin, West Africa. ArcGIS Pro v.3.1 [22]; Basemap: Esri, USGS.
Land 15 00734 g002
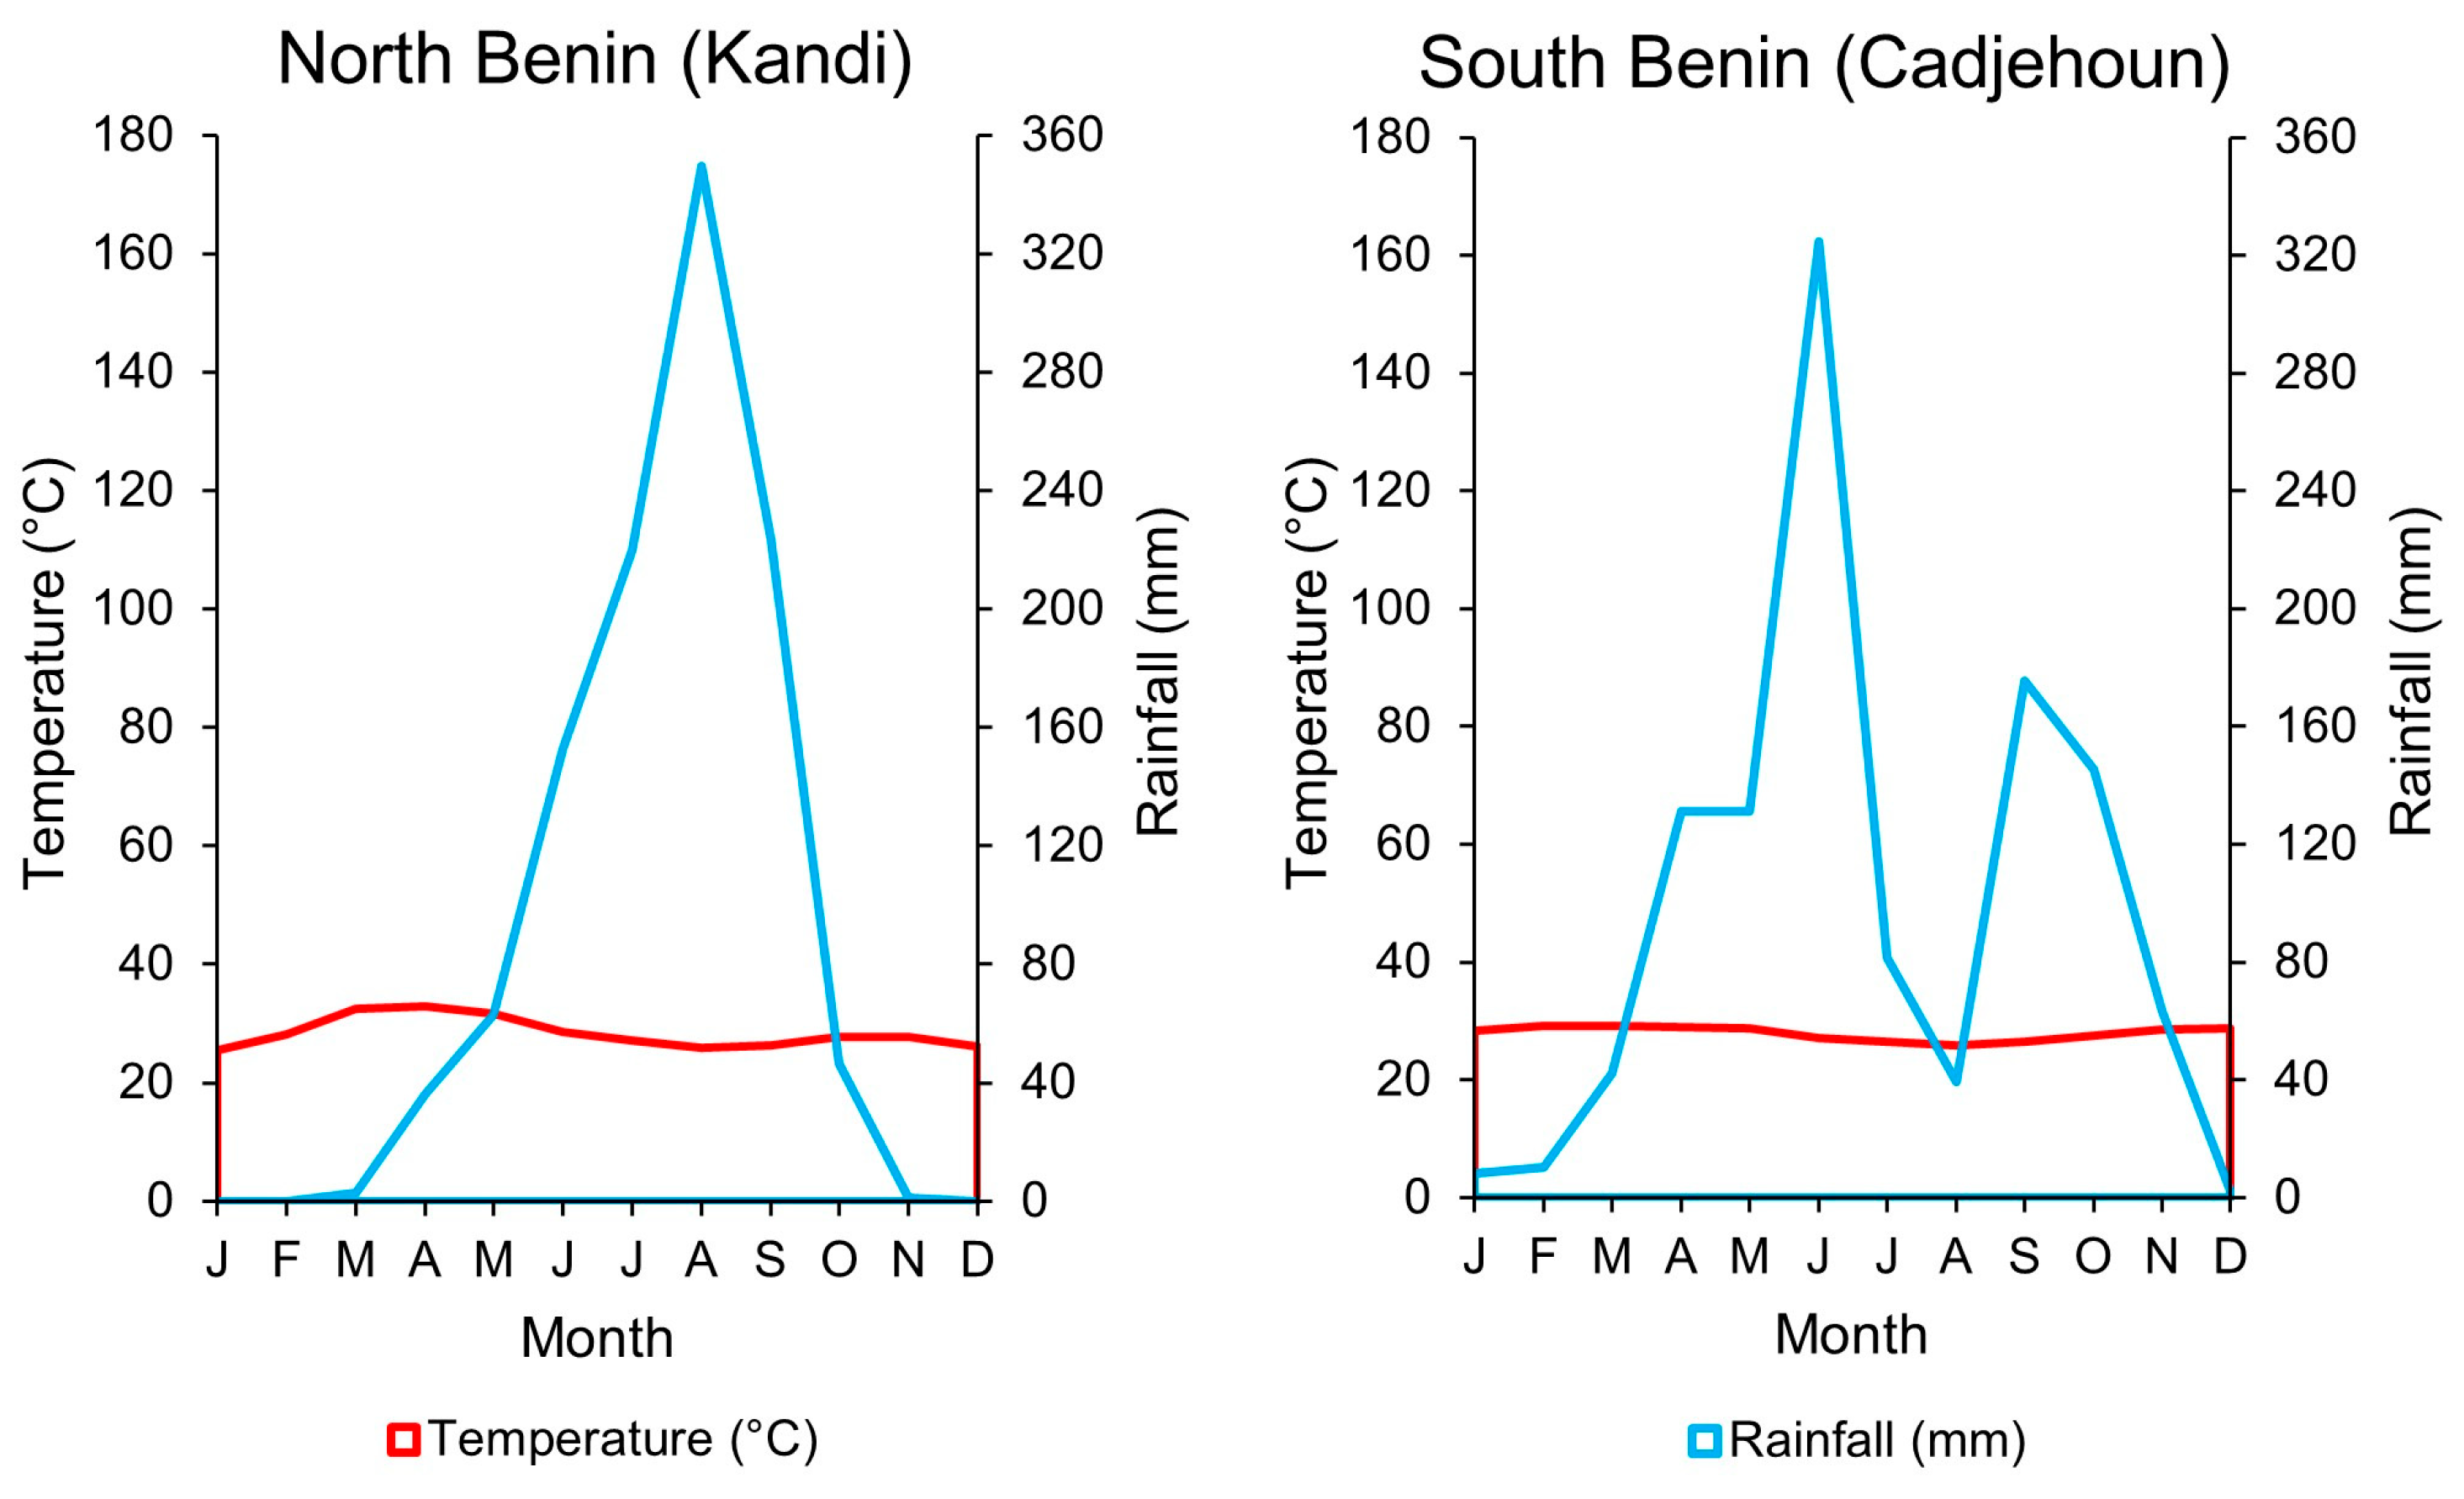
Benin’s humid sub-equatorial zone at the southern coast is characterized by a bimodal rainfall pattern from April to July and from September to November, with an average of 1200 mm year−1, while the Sudanian savanna zone in the north has a monomodal rainfall from June to September with an average of 1000 mm year−1 (Figure 3). This climatic variation explains the diversity of vegetation throughout the country, which is dominated by a savanna mosaic. It comprises mangroves and swampy savannas in the south, gallery forests, open forests, and dense semi-deciduous rainforests in the center, and dense dry forests and tree/shrub savannas in the north (Figure 2) [23]. Forest cover is around 28% of the total land area, equivalent to 3,135,150 hectares (ha) in 2020, down from 4,835,150 hectares (ha) in 1990. Some forests line the banks of rivers or cover protected areas such as the Reserve du W du Niger and Pendjari National Park [24].

2.2. Data Collection

To quantify the flow of charcoal and firewood transiting through roadside vending points, the survey was designed as a systematic field inventory. All visible traders operating on both sides of the two main roads during the survey period were approached, with the aim of achieving full coverage of the roadside vending segment along RNIE#2 and RNIE#3. The resulting dataset is therefore representative of the roadside vending segment along these two corridors during the survey period but does not represent the entire national woodfuel economy. A small number of traders declined to participate. However, these cases were few and did not alter the overall spatial coverage of the survey (Supplementary material). RNIE#2 was covered during a fortnight in July 2023, followed by a one-week coverage of RNIE#3 in August 2023. This survey design captured regional differences under contrasting North–South seasonal conditions. During the survey periods, data were collected from Monday to Saturday between 8:00 am and 6:00 pm using a questionnaire deployed in the KoboCollect v. 2023.1.2 [26] application. The questions allowed to record the geographical location of the points of sale (POSs), the sources and putative destinations of the traded products, the average weight of a charcoal bag and of a firewood pile, the number of charcoal bags and firewood piles stored at the points of sale at the time of the survey and on average traded per month, and complementary general information about the surveyed traders. A second 10-day survey took place in February 2025 to account for seasonal variations in woodfuel supply and demand during the dry season, which affects both northern and southern regions of Benin, particularly the number and geographical positions of charcoal POSs, and to record price variations of charcoal between different actors of the supply chain at different distances from Cotonou. The geographical coordinates of the POSs were recorded using a hand-held Global Positioning System (GPS) Garmin eTrex 32x (Garmin International Inc., Olathe, KS, USA). The weights were determined by a hanging scale HCN 100K200IP (Kern & Sohn GmbH, Balingen, Germany) with a precision of 0.2 kg.

2.3. Data Processing and Analysis

Traders of both charcoal and firewood were duplicated to two entries, each representing a single product. In total, 1098 entries were recorded. Entries with missing values were excluded only for the specific variable concerned, while the remaining available variables were retained for analysis (Table 1).
To visualize the flow of charcoal and firewood along both roads, location and weighted kernel density maps of the sources, POSs, and destinations were generated. The weight applied to the kernel density maps corresponds to the total quantity of wood-equivalent charcoal and firewood traded in metric tons per year. The quantity was estimated using the number of bags of charcoal or piles of firewood traded per month multiplied by their respective weights, and a carbonization rate of 20% for charcoal [27].
To determine the supply shadow (the distance between the source and the POS) and the market reach (the distance between the POS and the final destination) of charcoal and firewood, linear distances between the sources, the POSs, and the destinations were computed from recorded geographical coordinates. In case a trader sourced from or distributed to multiple locations, an average distance was calculated. Distances were analyzed following a latitude gradient. This latitude-based approach was used as a simple regional proxy for Benin’s broad north–south socio-ecological gradient, while the distinction between RNIE#2 and RNIE#3 captured differences in corridor function, connectivity, and traffic intensity. The spatial analysis was therefore designed to characterize the organization of woodfuel flows along the two major trade corridors rather than to provide a formal comparison between administrative or ecological zones.
Spatial data of Benin and neighboring countries were downloaded in a vector format from the Humanitarian Data Exchange database [28]. All spatial data were processed using the Quantum Geographic Information System software QGIS v.3.22 [29]. Statistical analyses and data plotting were carried out using Microsoft Excel [30].

3. Results

3.1. Marketing Chain

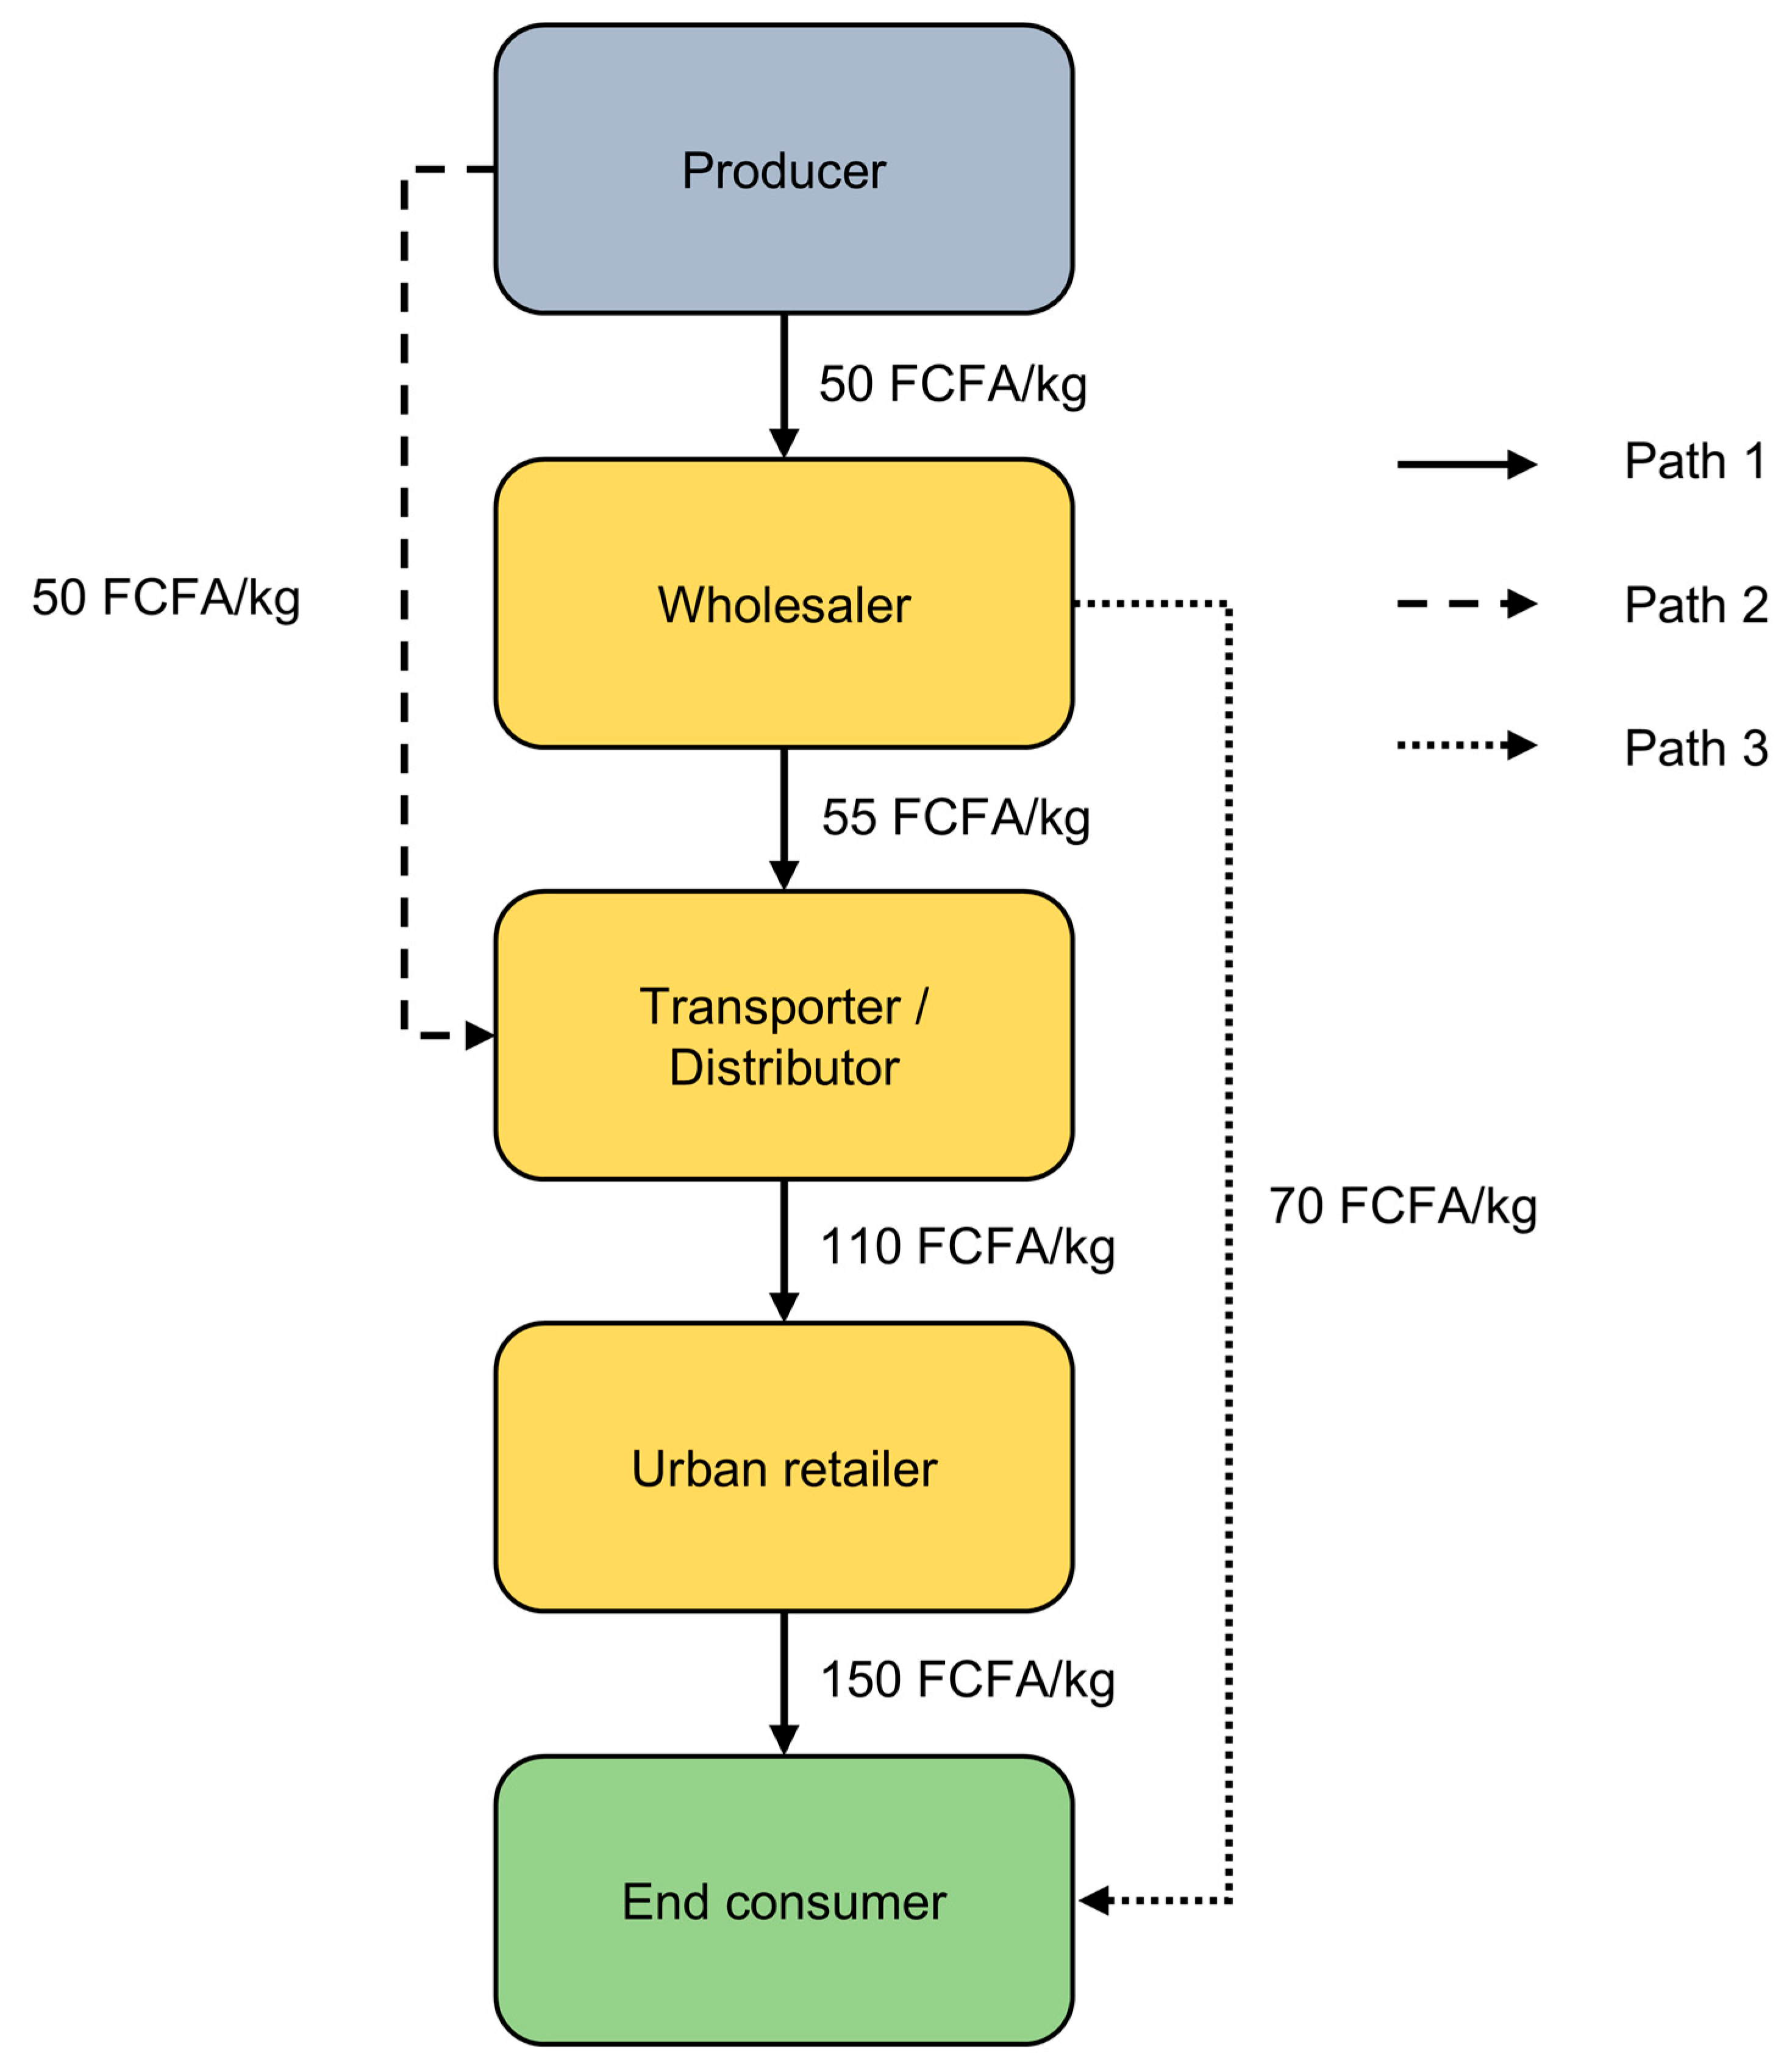
The charcoal and firewood supply chain centered on roadside vending in Benin comprises producers, traders, and end consumers. Producers produce charcoal or cut firewood and pack it into bags or piles, ready to be shipped. Traders can be classified into first-tier traders (wholesalers), second-tier traders (distributors), and third-tier traders (urban retailers). First-tier traders are generally located along Benin’s main roads and get products from the producers. Second-tier traders are mostly distributors who collect bags of coal or piles of firewood from first-tier traders (Path 1) or from producers (Path 2), and supply them to third-tier traders in towns. While end consumers are typically supplied by urban retailers (Path 1), those who have means of transport may source a few bags of coal or piles of firewood from first-tier traders on their return from a trip along these roads. The present study focuses on this first-tier roadside trader segment, while the three-tier scheme serves as a conceptual representation of the wider supply chain (Path 3; Figure 1 and Figure 4).

3.2. Points of Sale

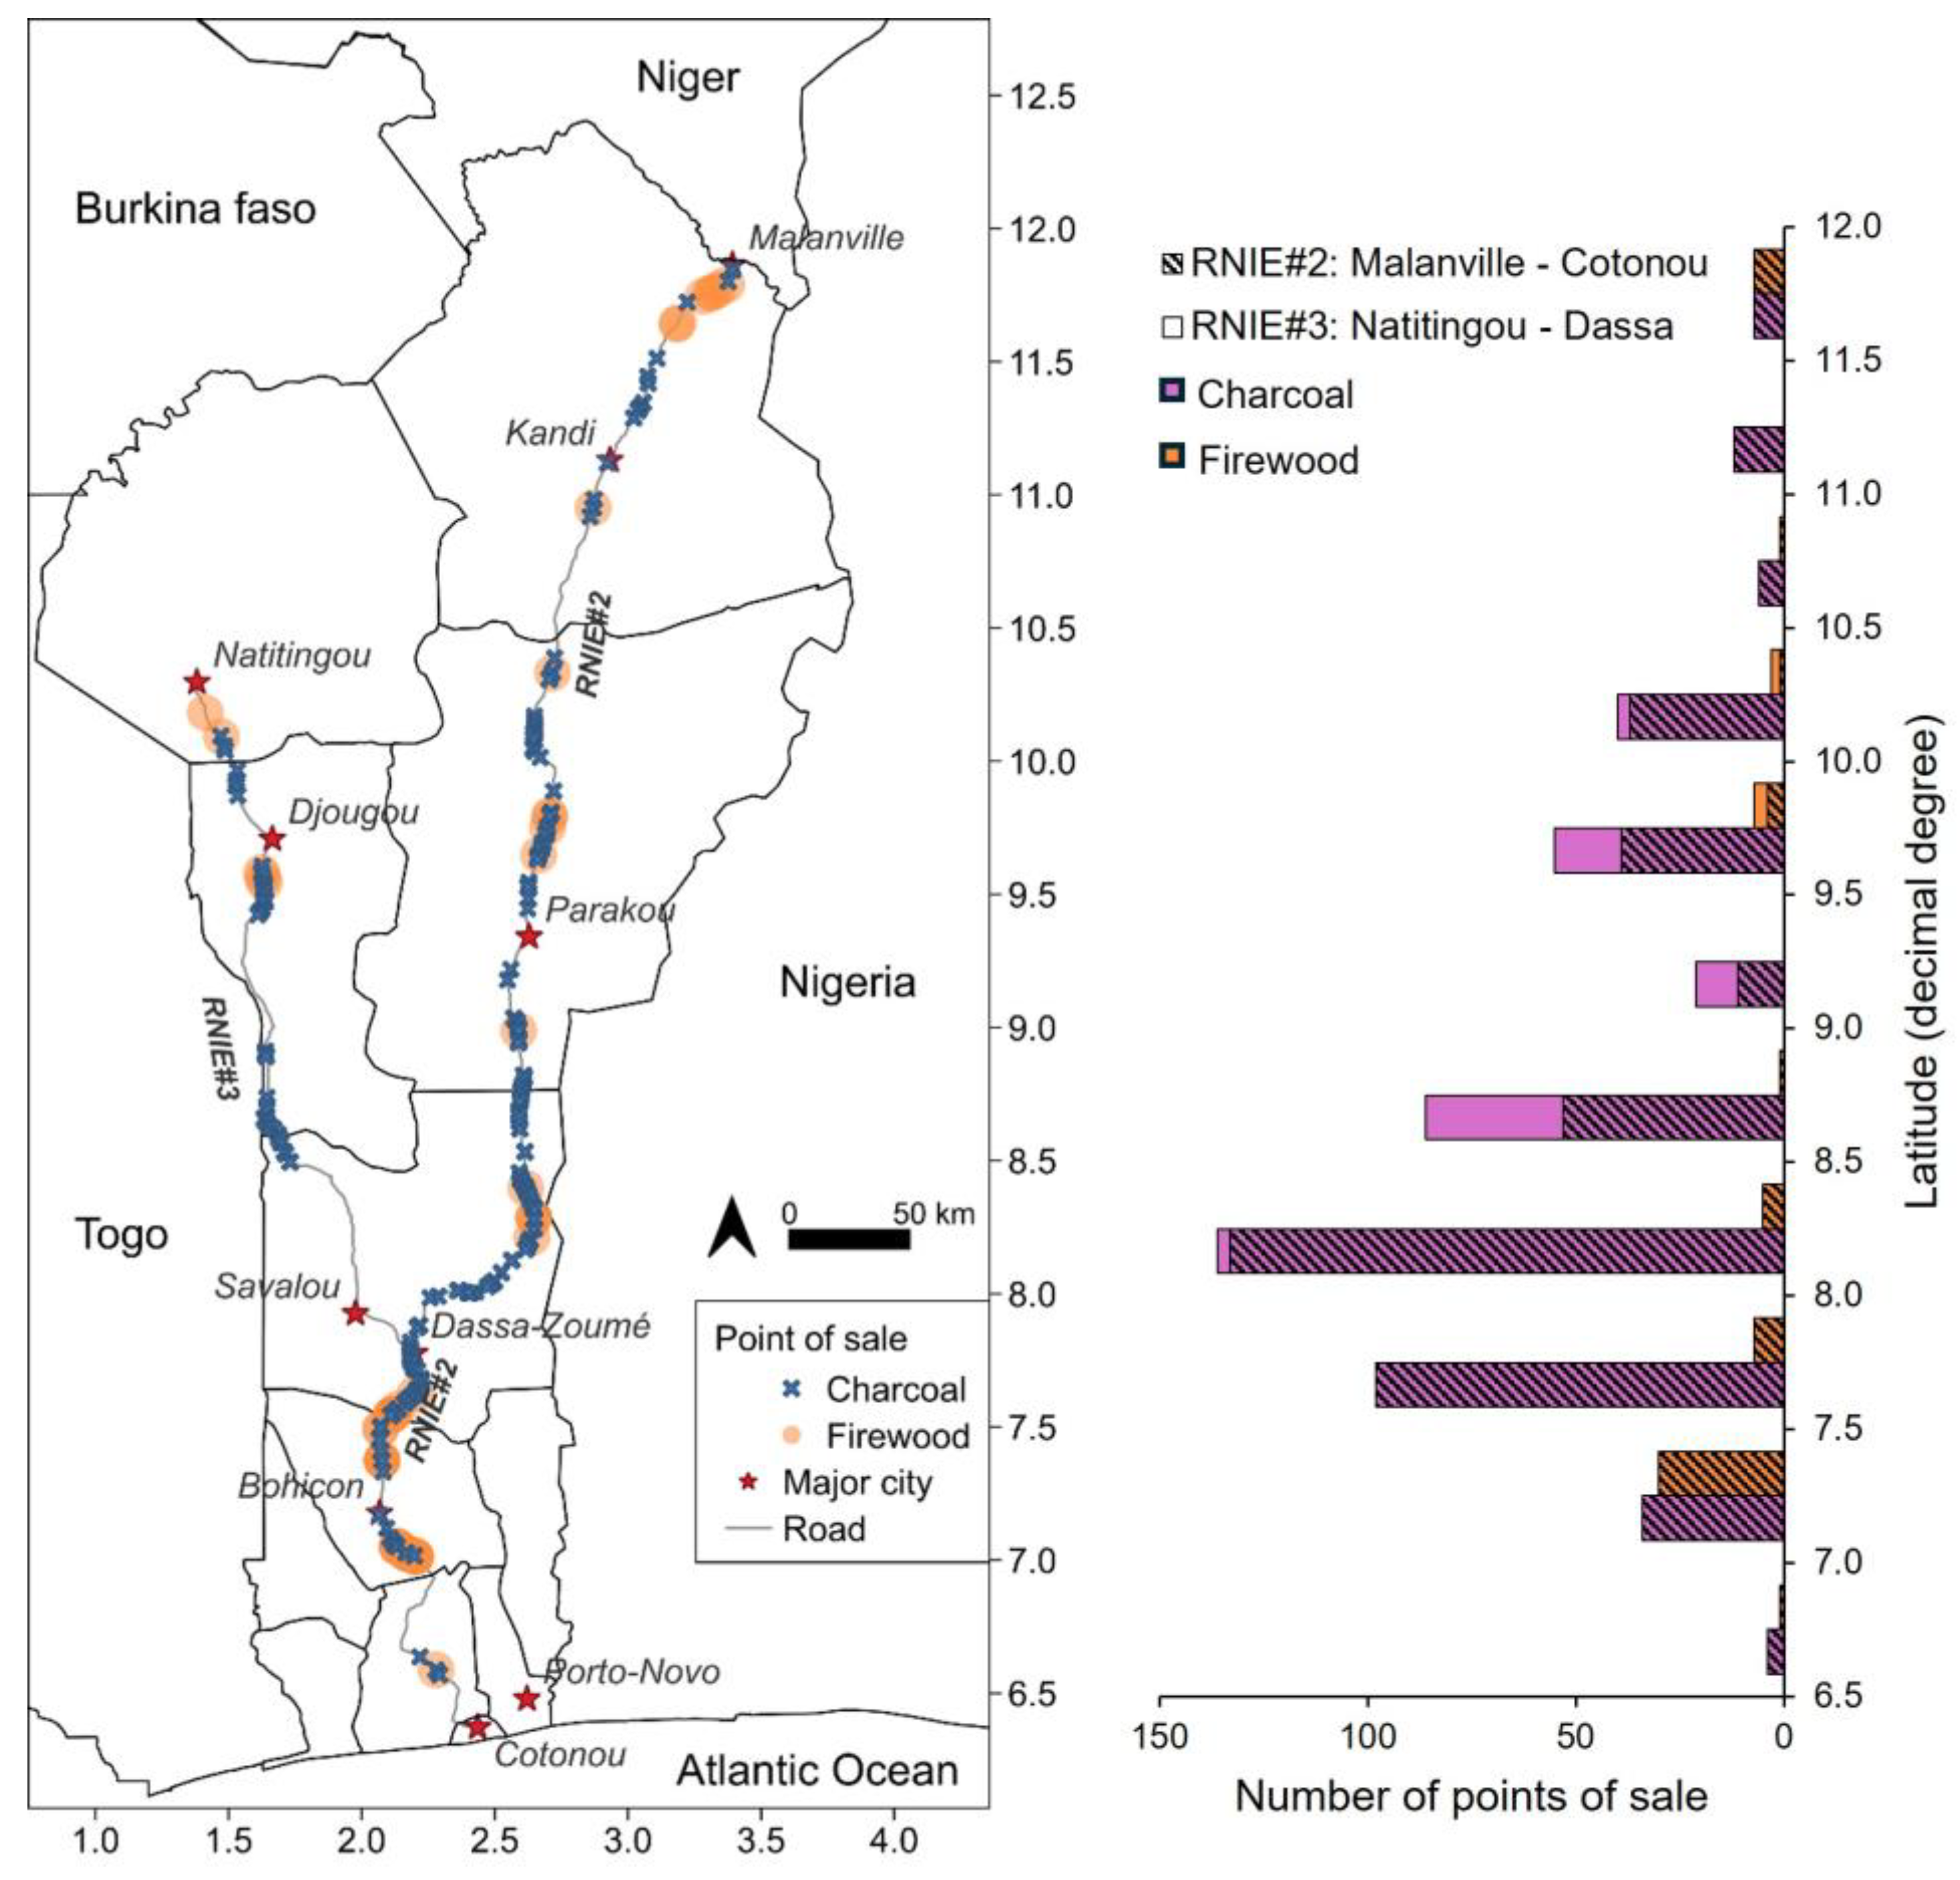
The data indicate major differences in the spatial distribution of charcoal and firewood POSs along both roads, with charcoal ones outnumbering firewood ones. Overall, POSs of both products were more prevalent along RNIE#2 than RNIE#3.
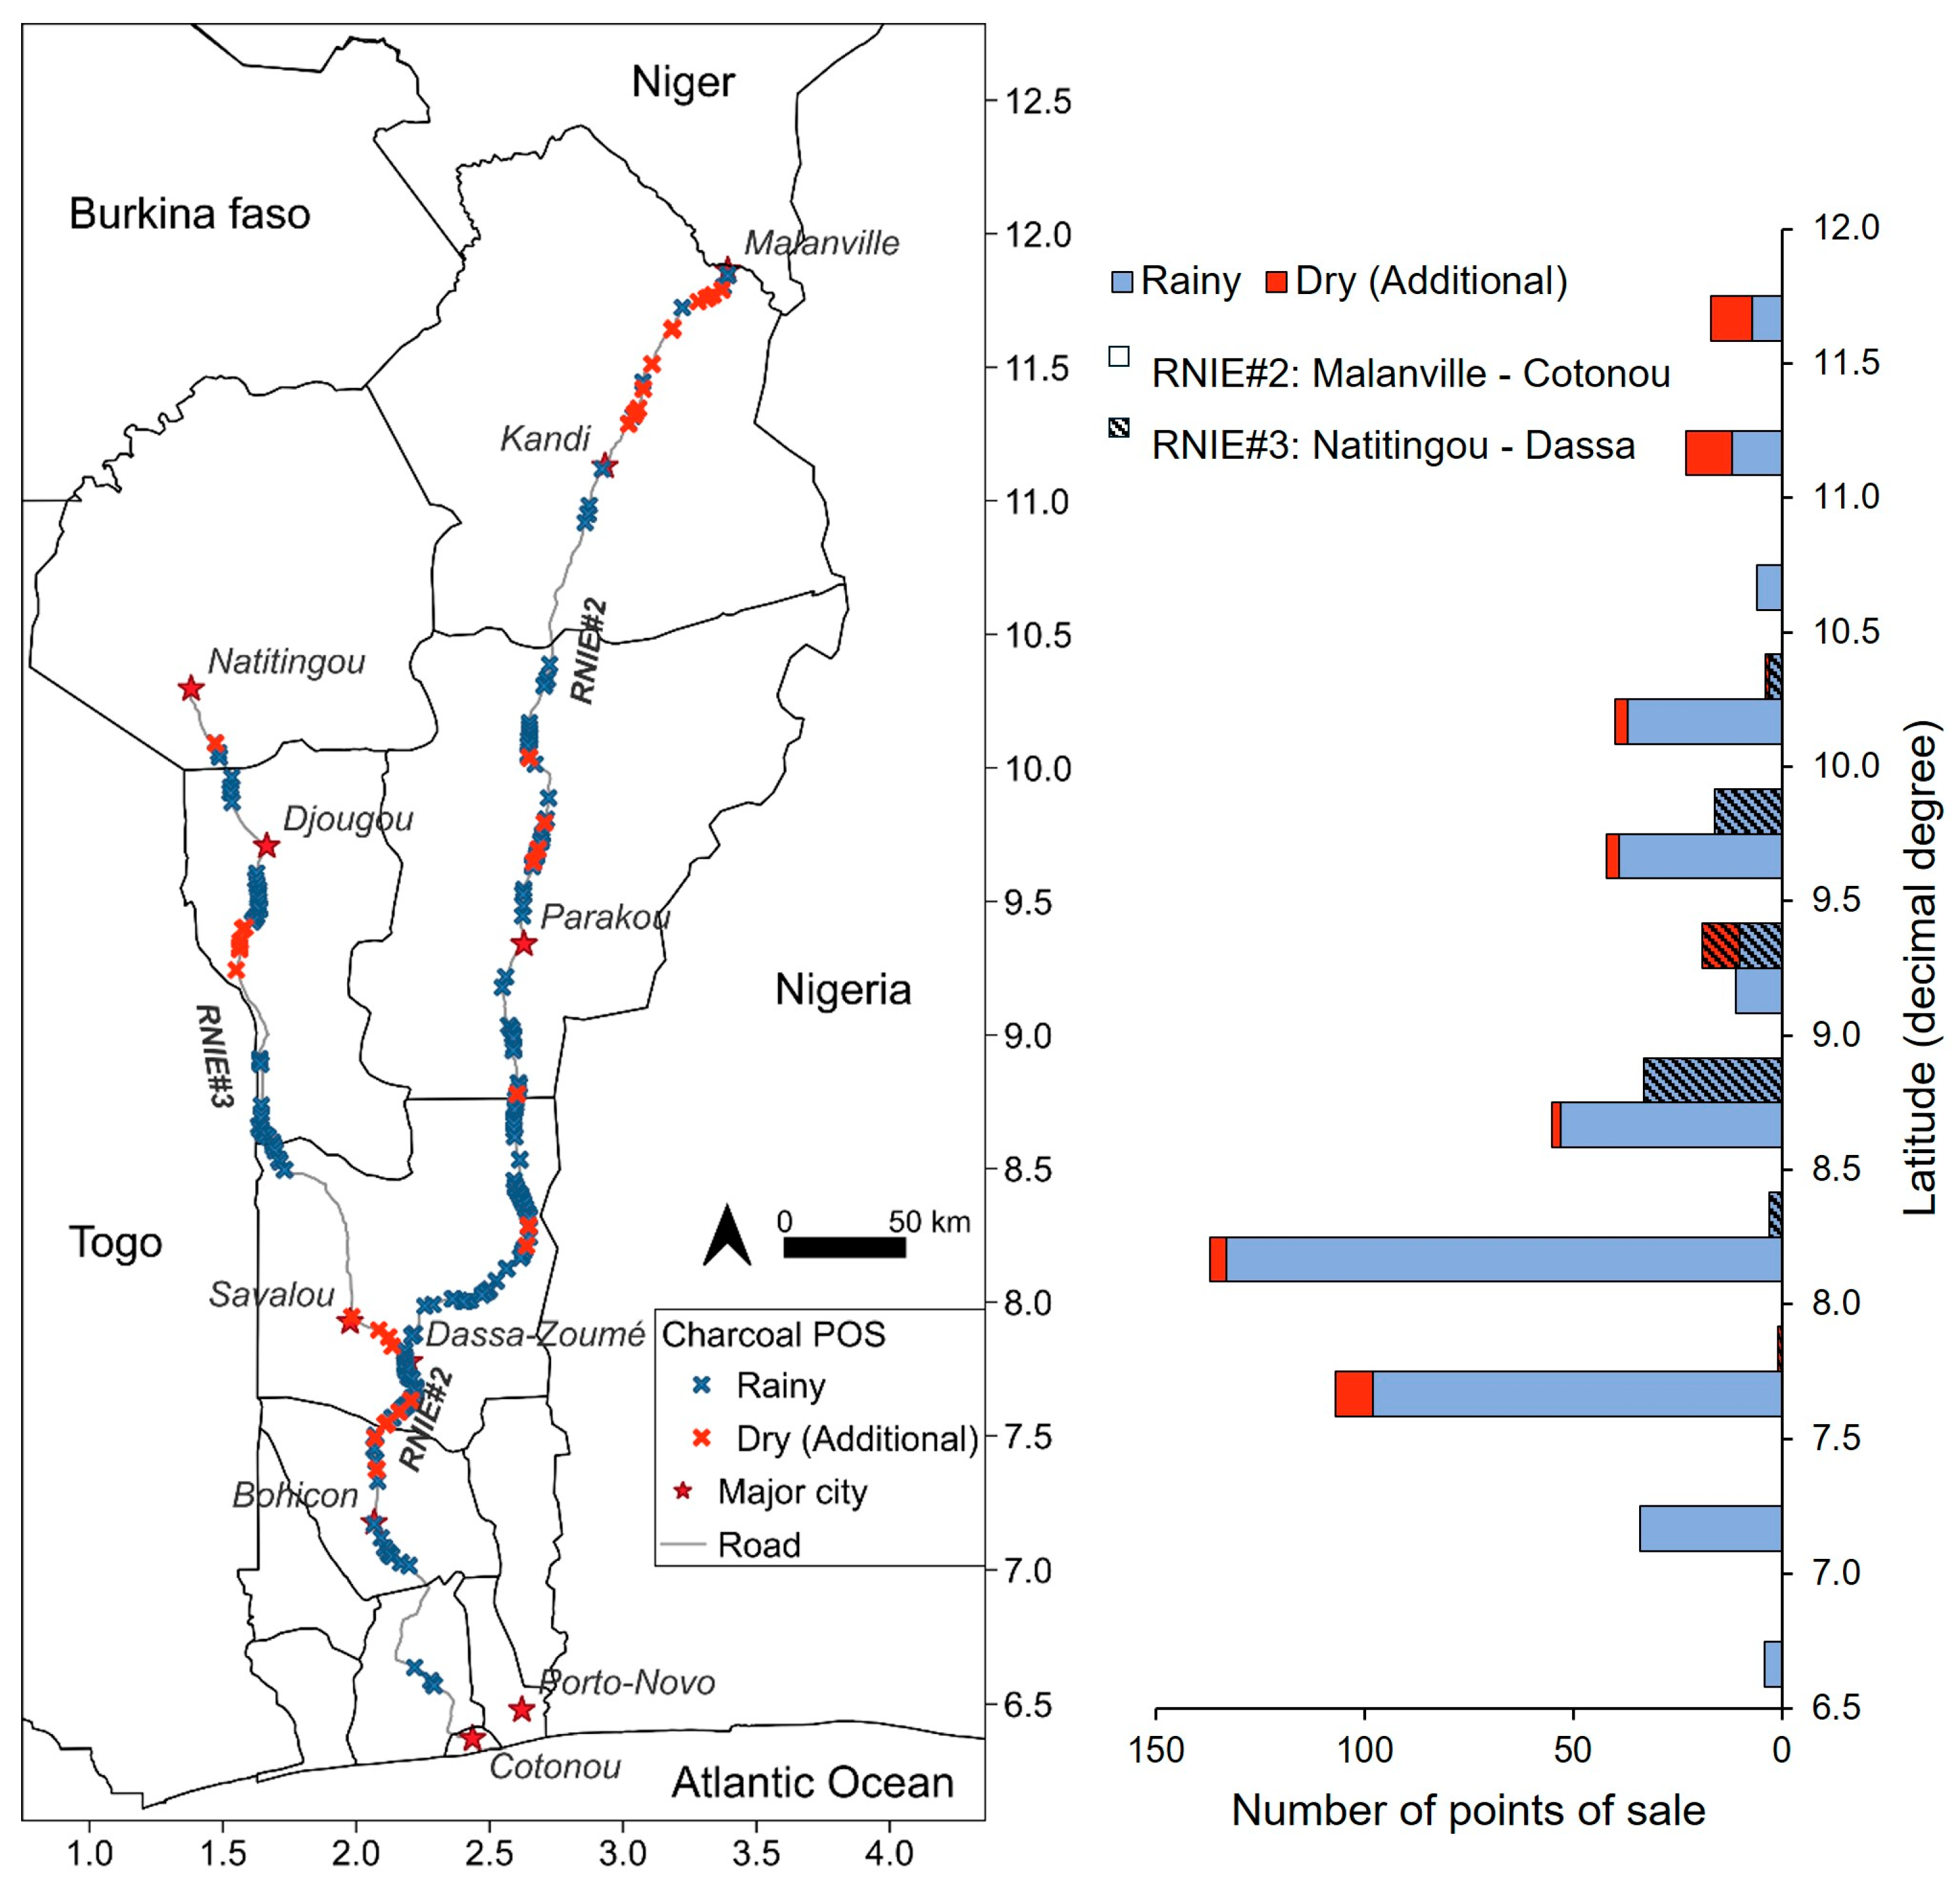
A total of 561 POSs were recorded, whereby 88% occurred along RNIE#2 and 12% along RNIE#3. Given the different lengths of both roads, the average number of POSs per distance unit of 10 km was 7 and <1, respectively. Overall, 89% of the POSs traded charcoal, while 11% traded firewood; this pattern was consistent for both roads. 87% of the POSs traded charcoal on RNIE#2 compared with 13% on RNIE#3, and 92% of the POSs traded firewood on RNIE#2 compared with only 8% on RNIE#3 (Figure 5).
For charcoal POSs, the concentration was highest on RNIE#2 between 8.0° and 8.5° N with 133 points, while in RNIE#3, it peaked between 8.5° and 9.0° N with 33 points. Charcoal was rarely traded between latitudes 6.5° to 7.0° N and 10.5° to 11.0° N. For firewood, the highest concentration of POS on RNIE#2 was between 7.0° and 7.5° N with 30 points, while on RNIE#3 it peaked between 9.5° and 10.0° N with 3 points. Firewood was rarely traded between latitudes 6.5° to 7.0° N, 8.5° to 9.5° N, and 10.0° to 11.5° N (Figure 5).
The number of charcoal POS grew by 11% (53 points) during the dry season compared with the rainy season. This increase occurred mainly on RNIE#2 with 79%, and on RNIE#3 with only 21% (Figure 6).

3.3. Traded Quantities

The data show a larger annual traded quantity of wood-equivalent charcoal and firewood on RNIE#2 compared with RNIE#3, and a larger annual traded amount of wood-equivalent charcoal compared with firewood.
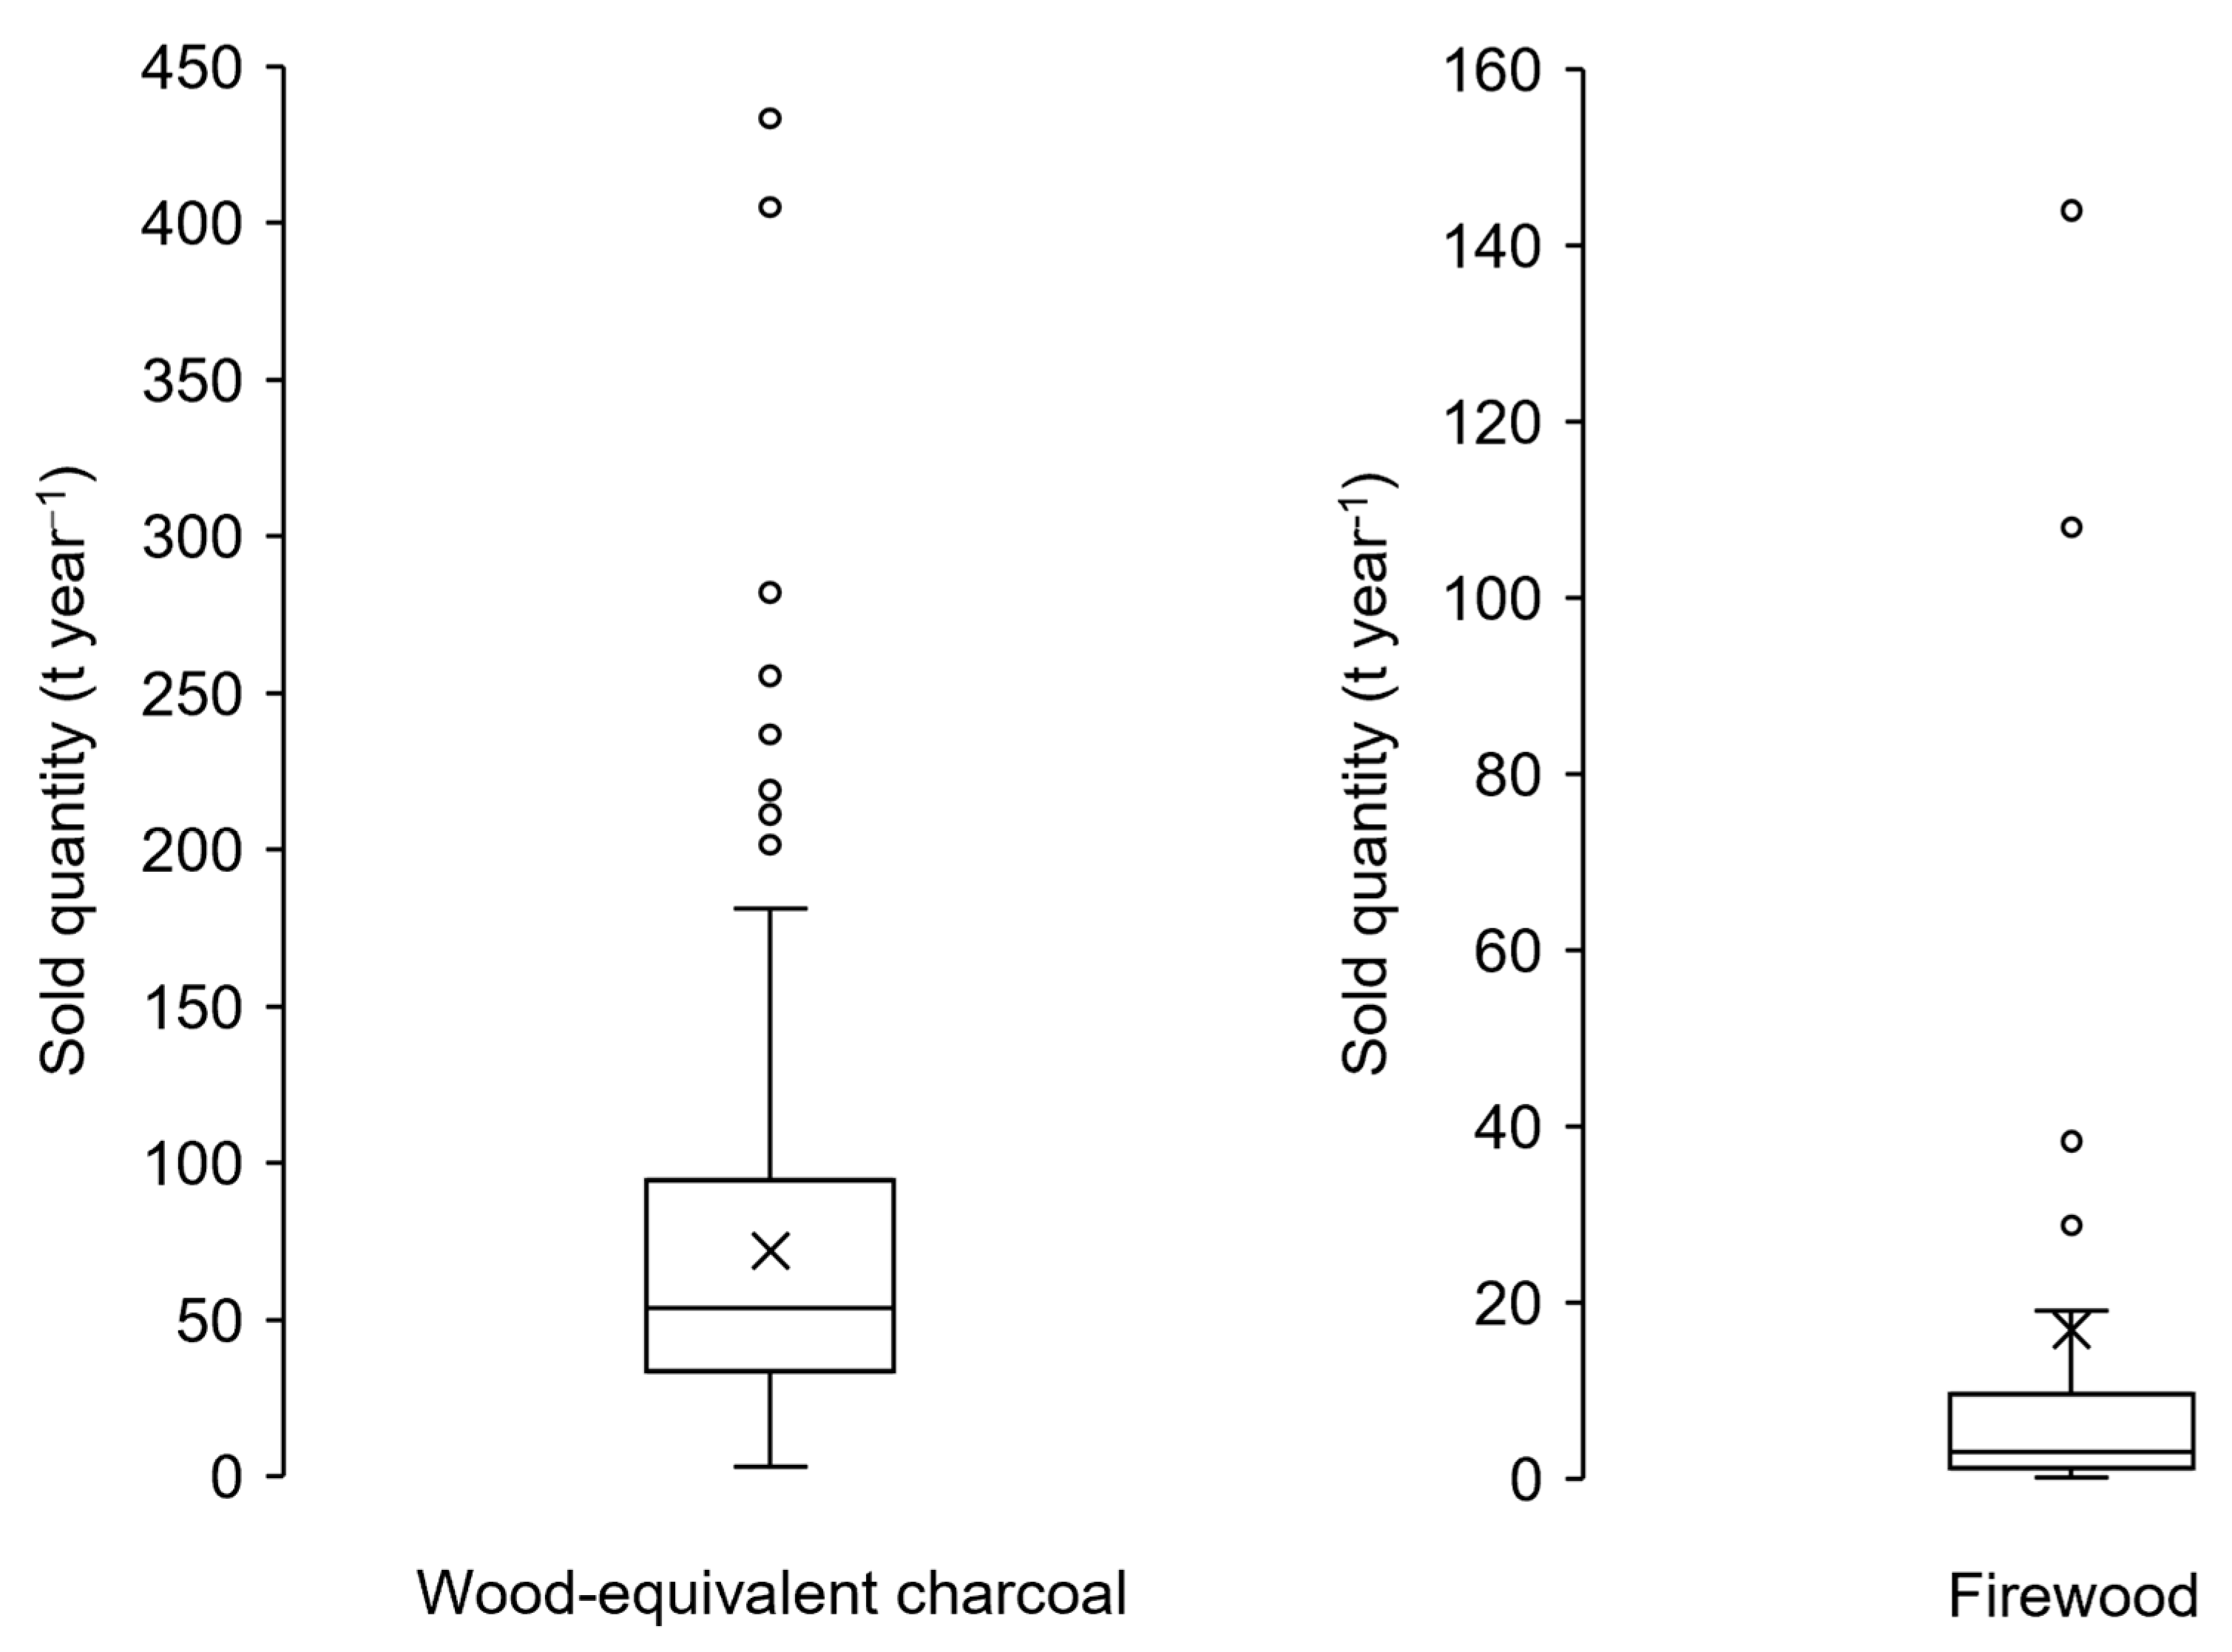
Roadside traders typically supplied charcoal in small (2%), medium (5%), and large bags (93%), and firewood in small (64%) and large (36%) piles. On average, a trader supplied 72.0 t year−1 (SD = 58.1) of wood-equivalent charcoal, and 16.9 t year−1 (SD = 36.9) of firewood. Two groups of large charcoal traders were identified, the first one (n = 3) supplied between 400 and 450 t year−1 and were situated between 7.0 ° and 8.5° N, and the second group (n = 19) supplied between 200 and 300 t year−1 at scattered locations. Similarly, for firewood, two groups of large traders located next to each other at 7.0° N were identified. The first one (n = 5) supplied between 100 and 160 t year−1 on side-by-side POSs over 3 km distance, and the second one (n = 4) supplied between 20 and 40 t year−1 (Figure 7).
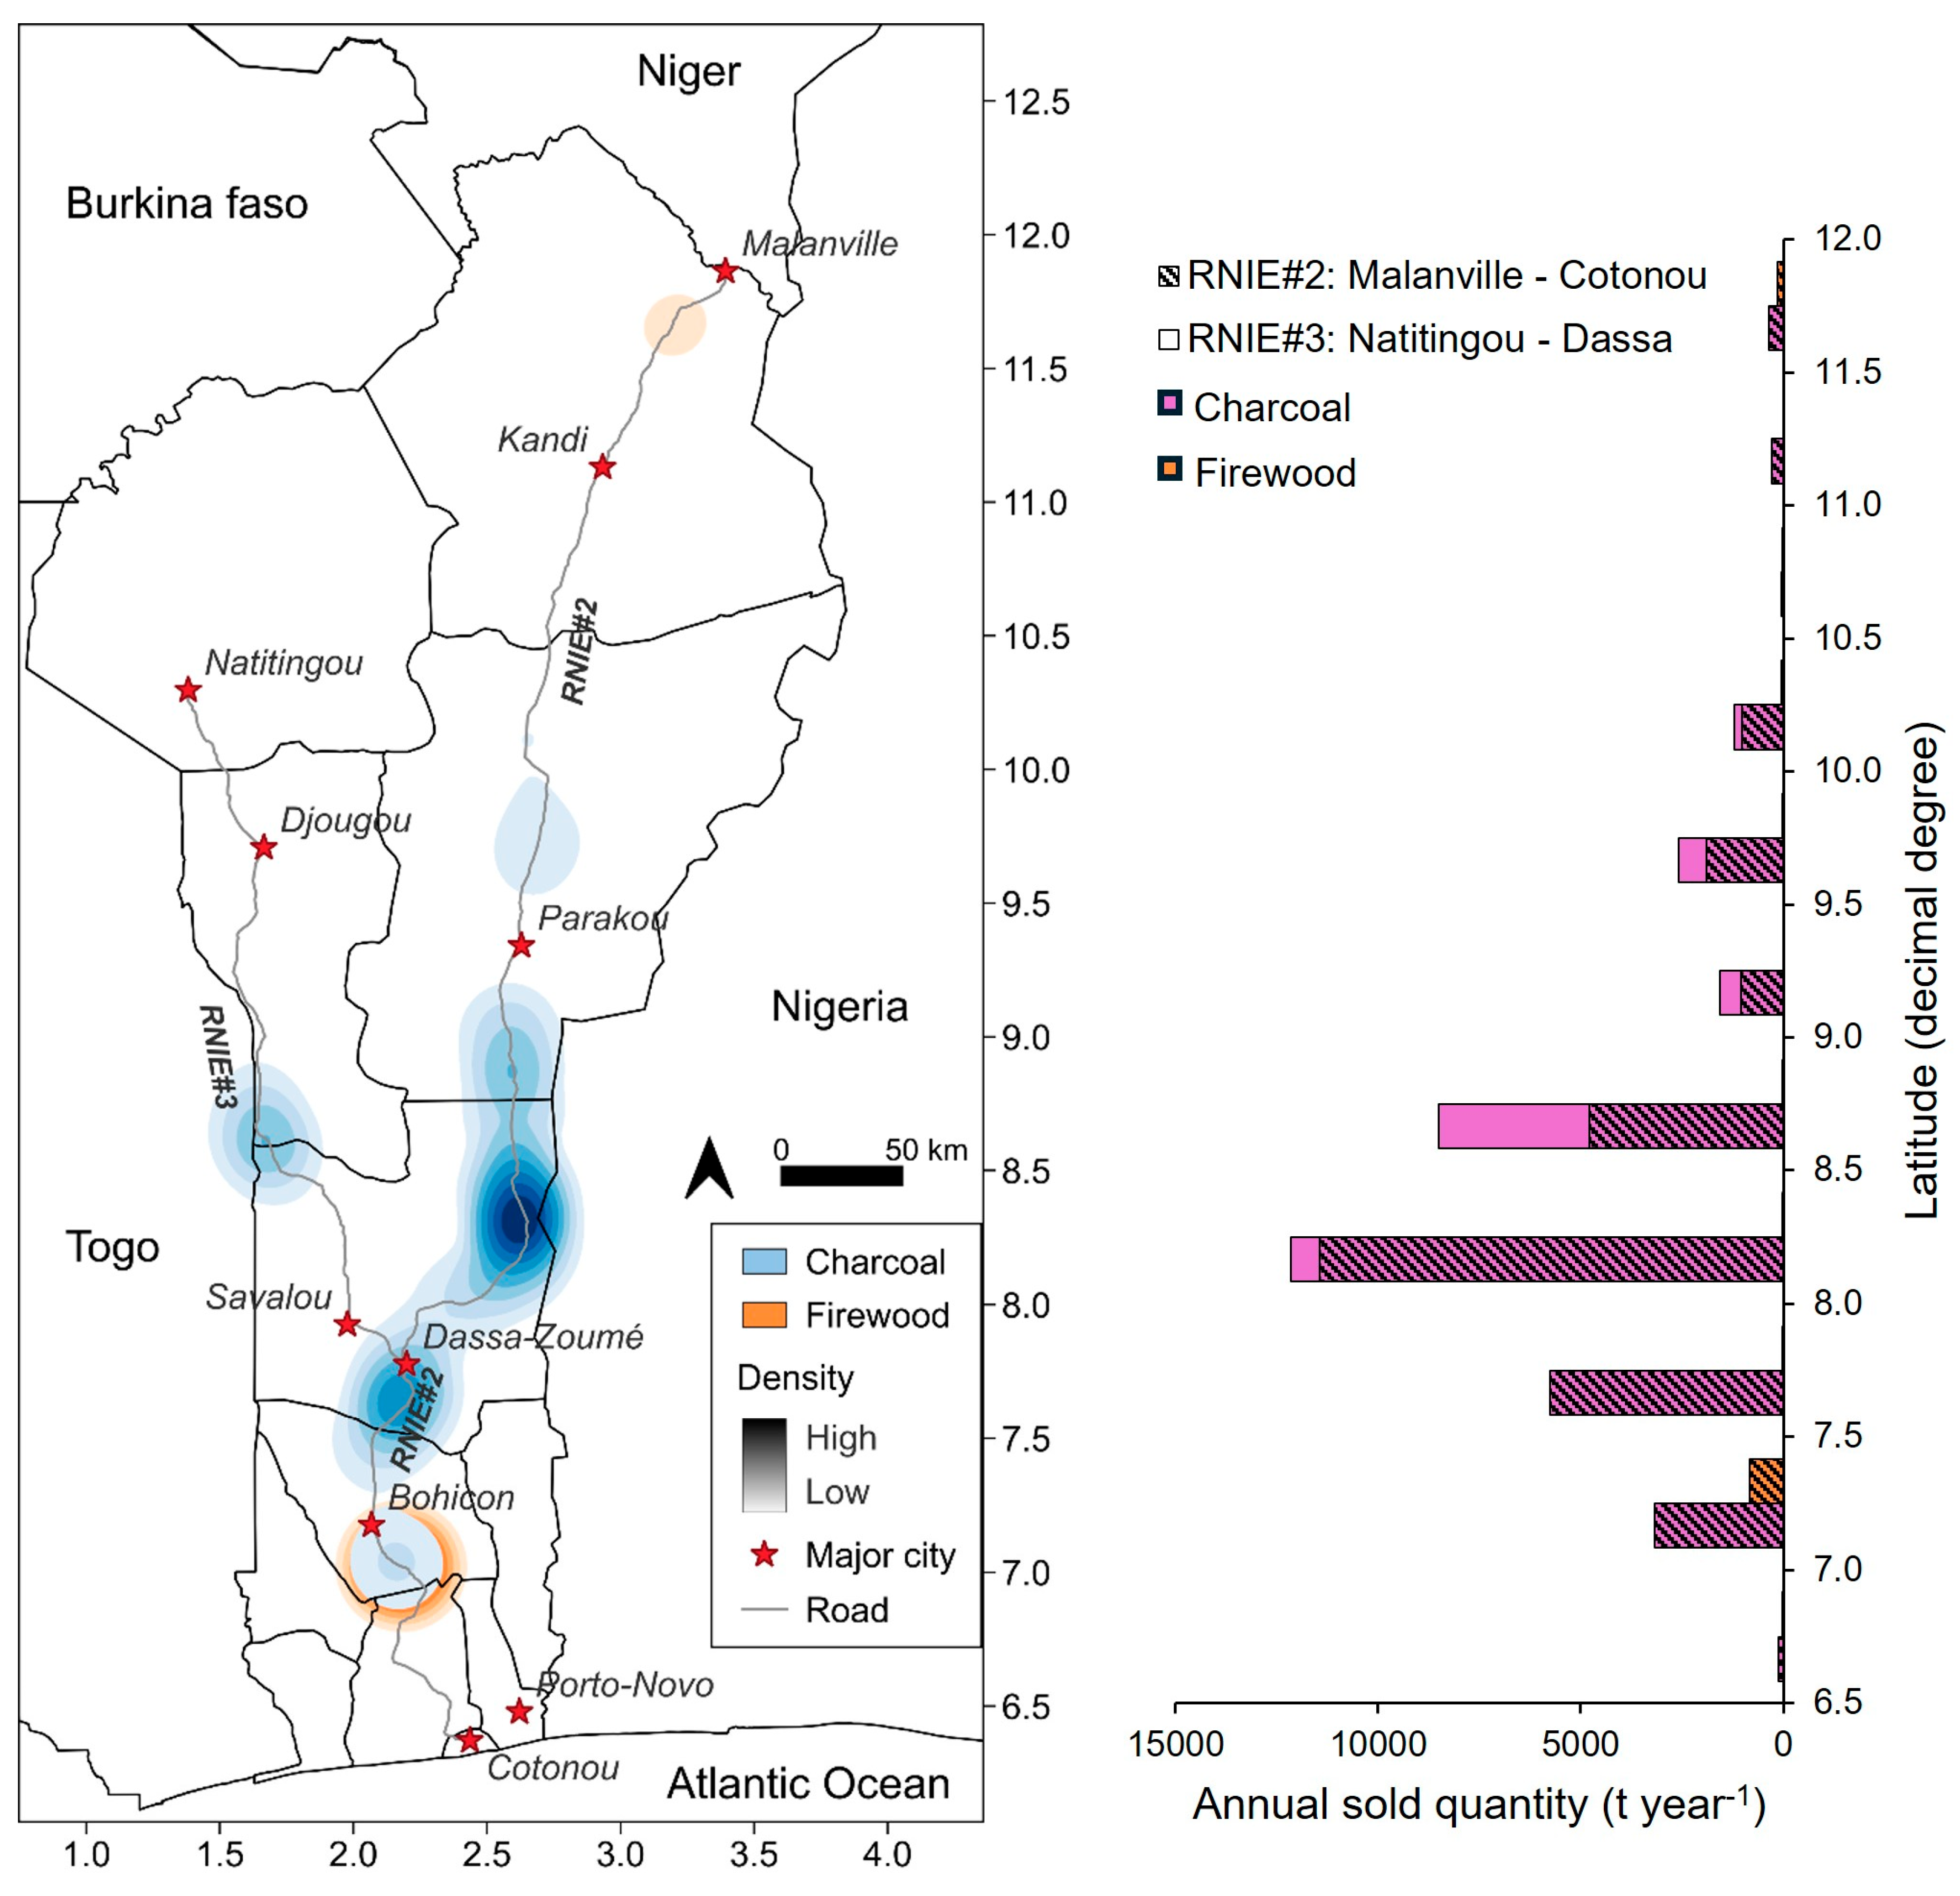
Overall, 30,956 t year−1 of firewood and wood-equivalent charcoal were traded on RNIE#2 compared with 5845 t year−1 in RNIE#3. 35,770 t year−1 of wood-equivalent charcoal were traded compared with 1031 t year−1 of firewood. The traded wood-equivalent charcoal on RNIE#2 amounted to 29,932 t year−1 compared with 5838 t year−1 on RNIE#3, and the traded firewood on RNIE#2 amounted to 1024 t year−1 compared with 7 t year−1 on RNIE#3 (Figure 8).
Charcoal POSs along RNIE#2 located in Central and Southern Benin between 7.0° and 9.0° N accounted for 84% (25,169 t year−1) of the annual traded quantity along this axis, and those located between 9.5° and 10.5° N accounted for 10% (2912 t year−1). Charcoal POSs along RNIE#3 between 8.5° and 9.0° N accounted for 64% (3710 t year−1) of the annual traded quantity along the axis, while the second concentration zone extending from 9.0° to 10.0° N accounted for 21% (1209 t year−1). Firewood POSs along RNIE#2 located between 7.0° and 7.5° N accounted for 80% (821 t year−1) of the annual traded quantity along this axis, while those located at 11.5° to 12° N accounted for 13% (137 t year−1). Firewood POSs along RNIE#3 between 9.5° and 10.0° N accounted for 60% (4 t year−1) of the annual traded quantity along this axis (Figure 8).

3.4. Sources and Destinations

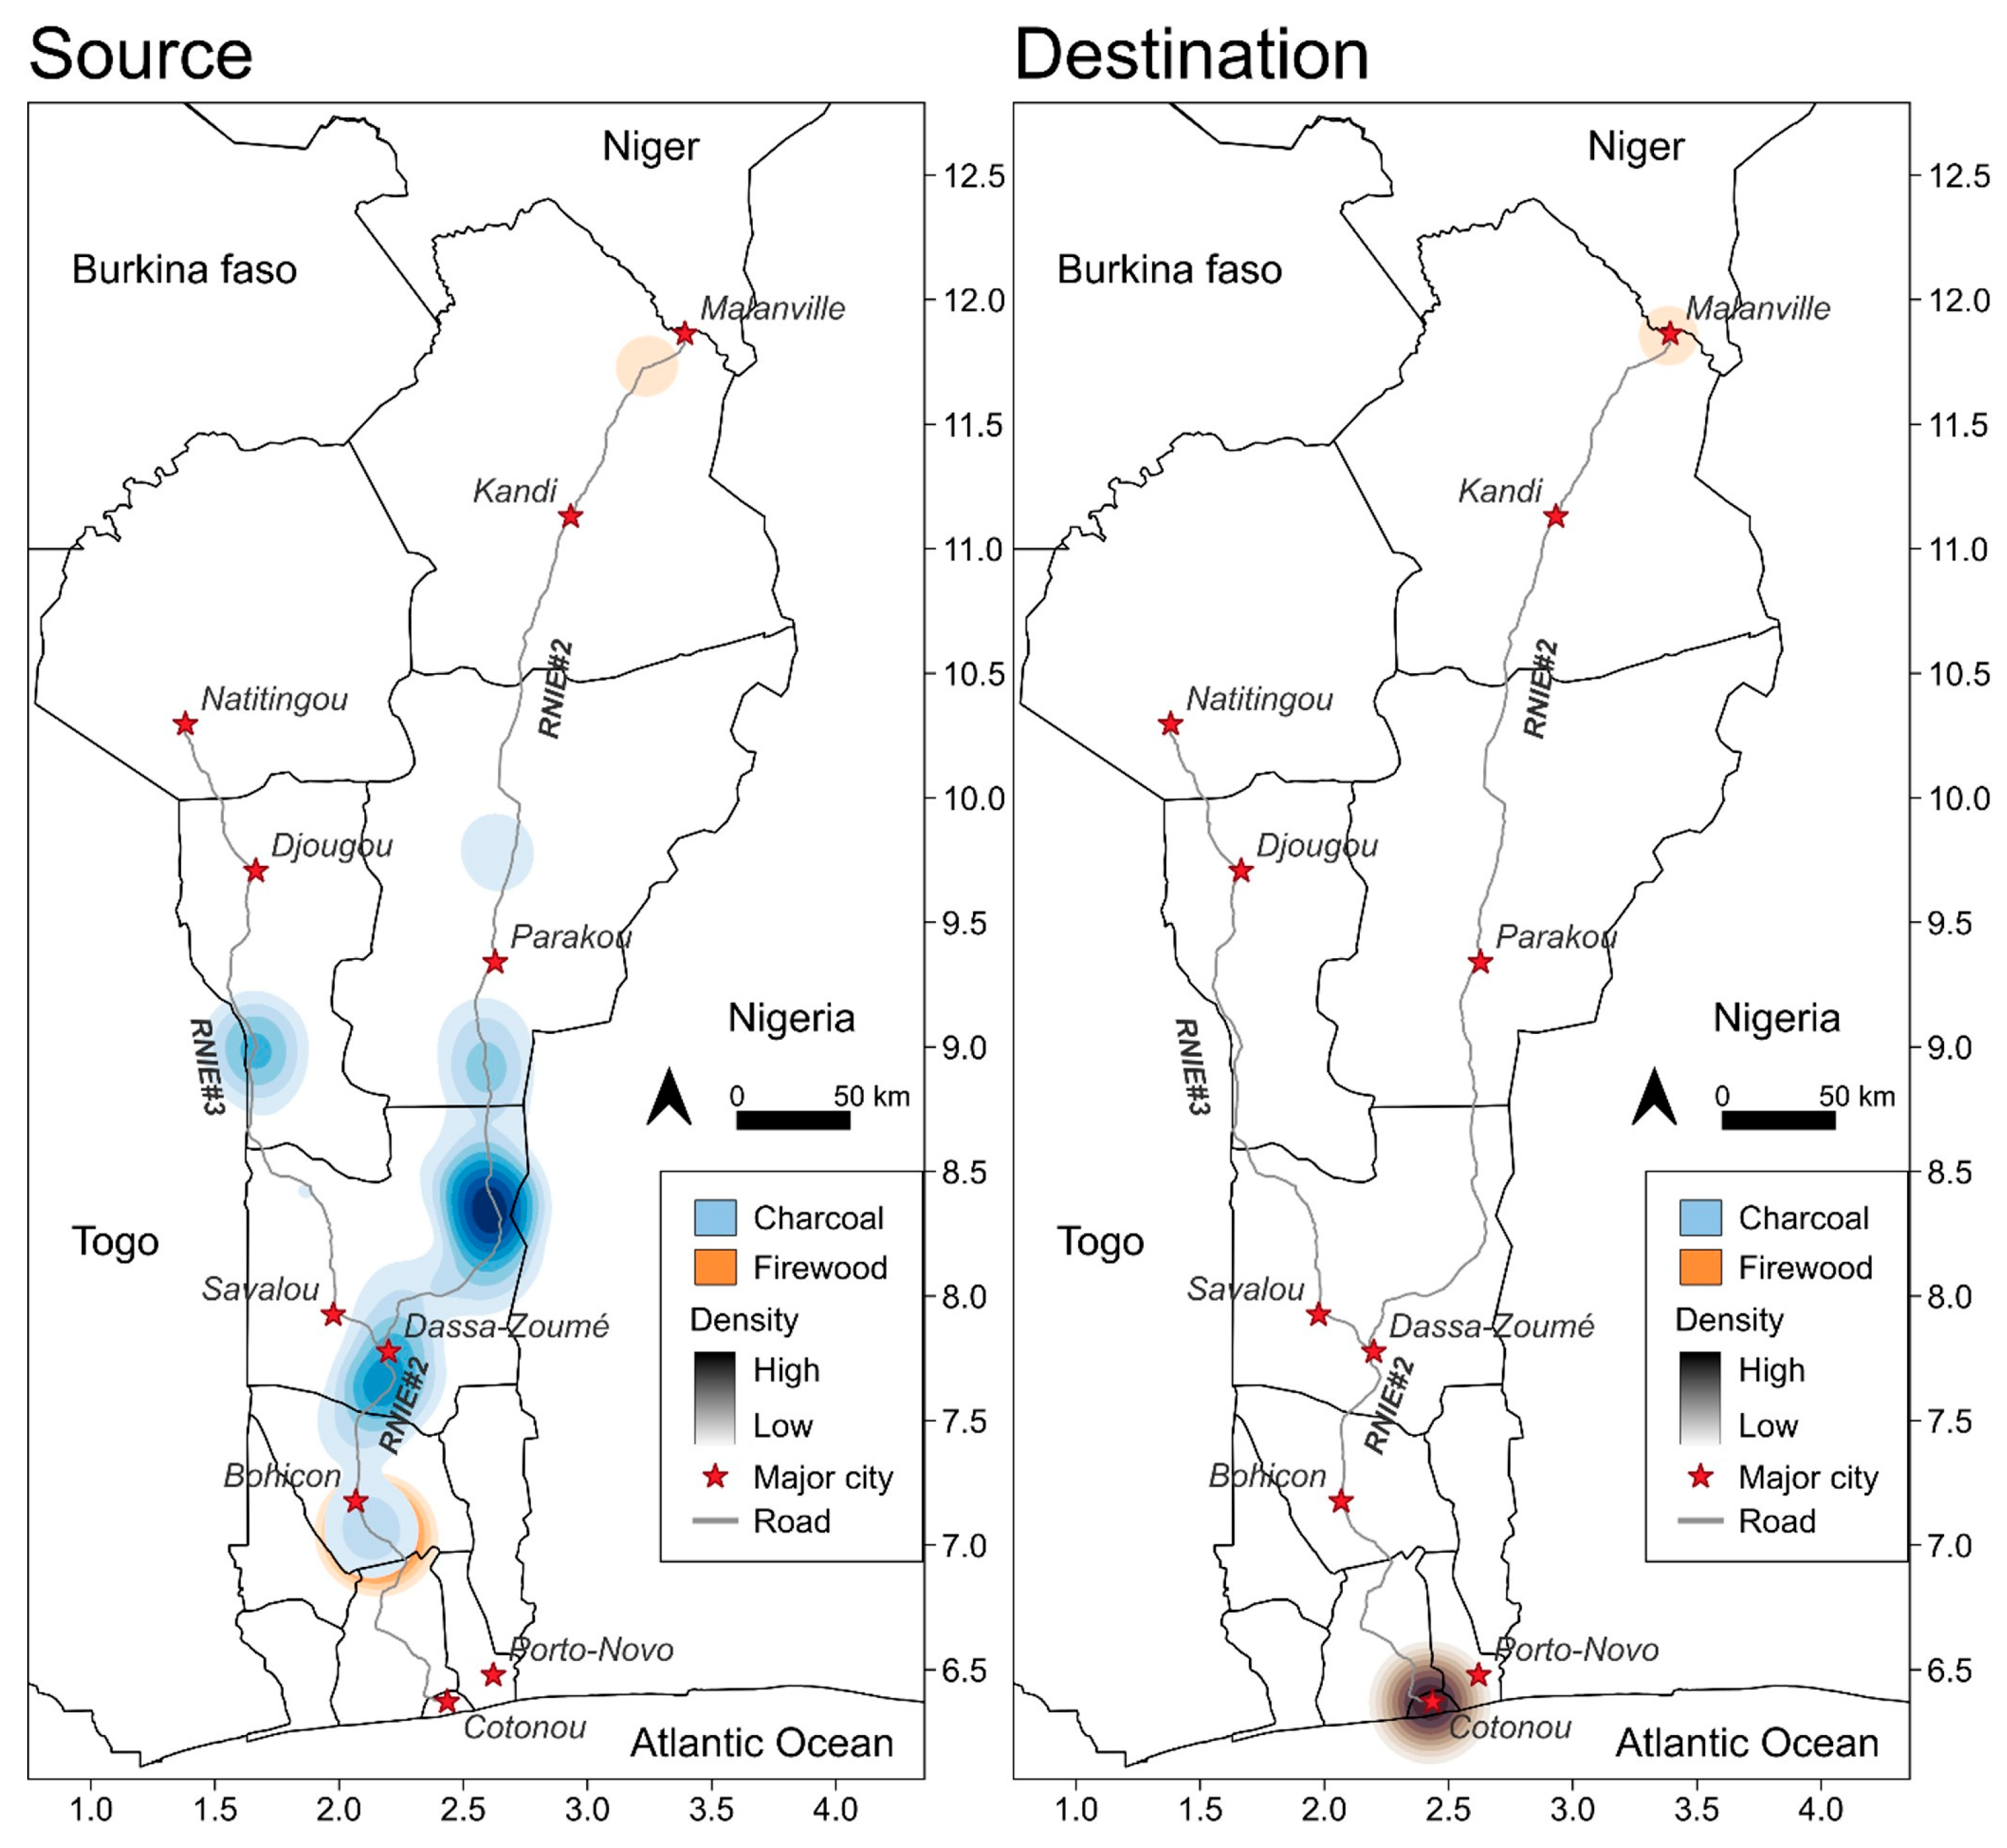
Most of the charcoal traded along Benin’s two main roads was sourced from Central and Southern Benin between 7.0° and 9.0° N and was mainly destined to the Cotonou–Porto-Novo metropolitan region, with 83% (28,772 t year−1) of the total traded wood-equivalent quantity, and the city of Parakou with 9%. Firewood sources were concentrated next to the city of Bohicon (Zoukou and Zogbodomey) between 7.0° and 7.5° N with 79% of the total traded firewood quantity, and the city of Malanville (Guéné) between 11.5° and 12.0° N with 11%. Their destinations were the Cotonou–Porto-Novo metropolitan region with 84% (851 t year−1) of the total traded quantity, and the city of Malanville with 12%. Secondary destinations for charcoal were towns and villages close to the POSs (Figure 9).

3.5. Supply Shadow and Market Reach

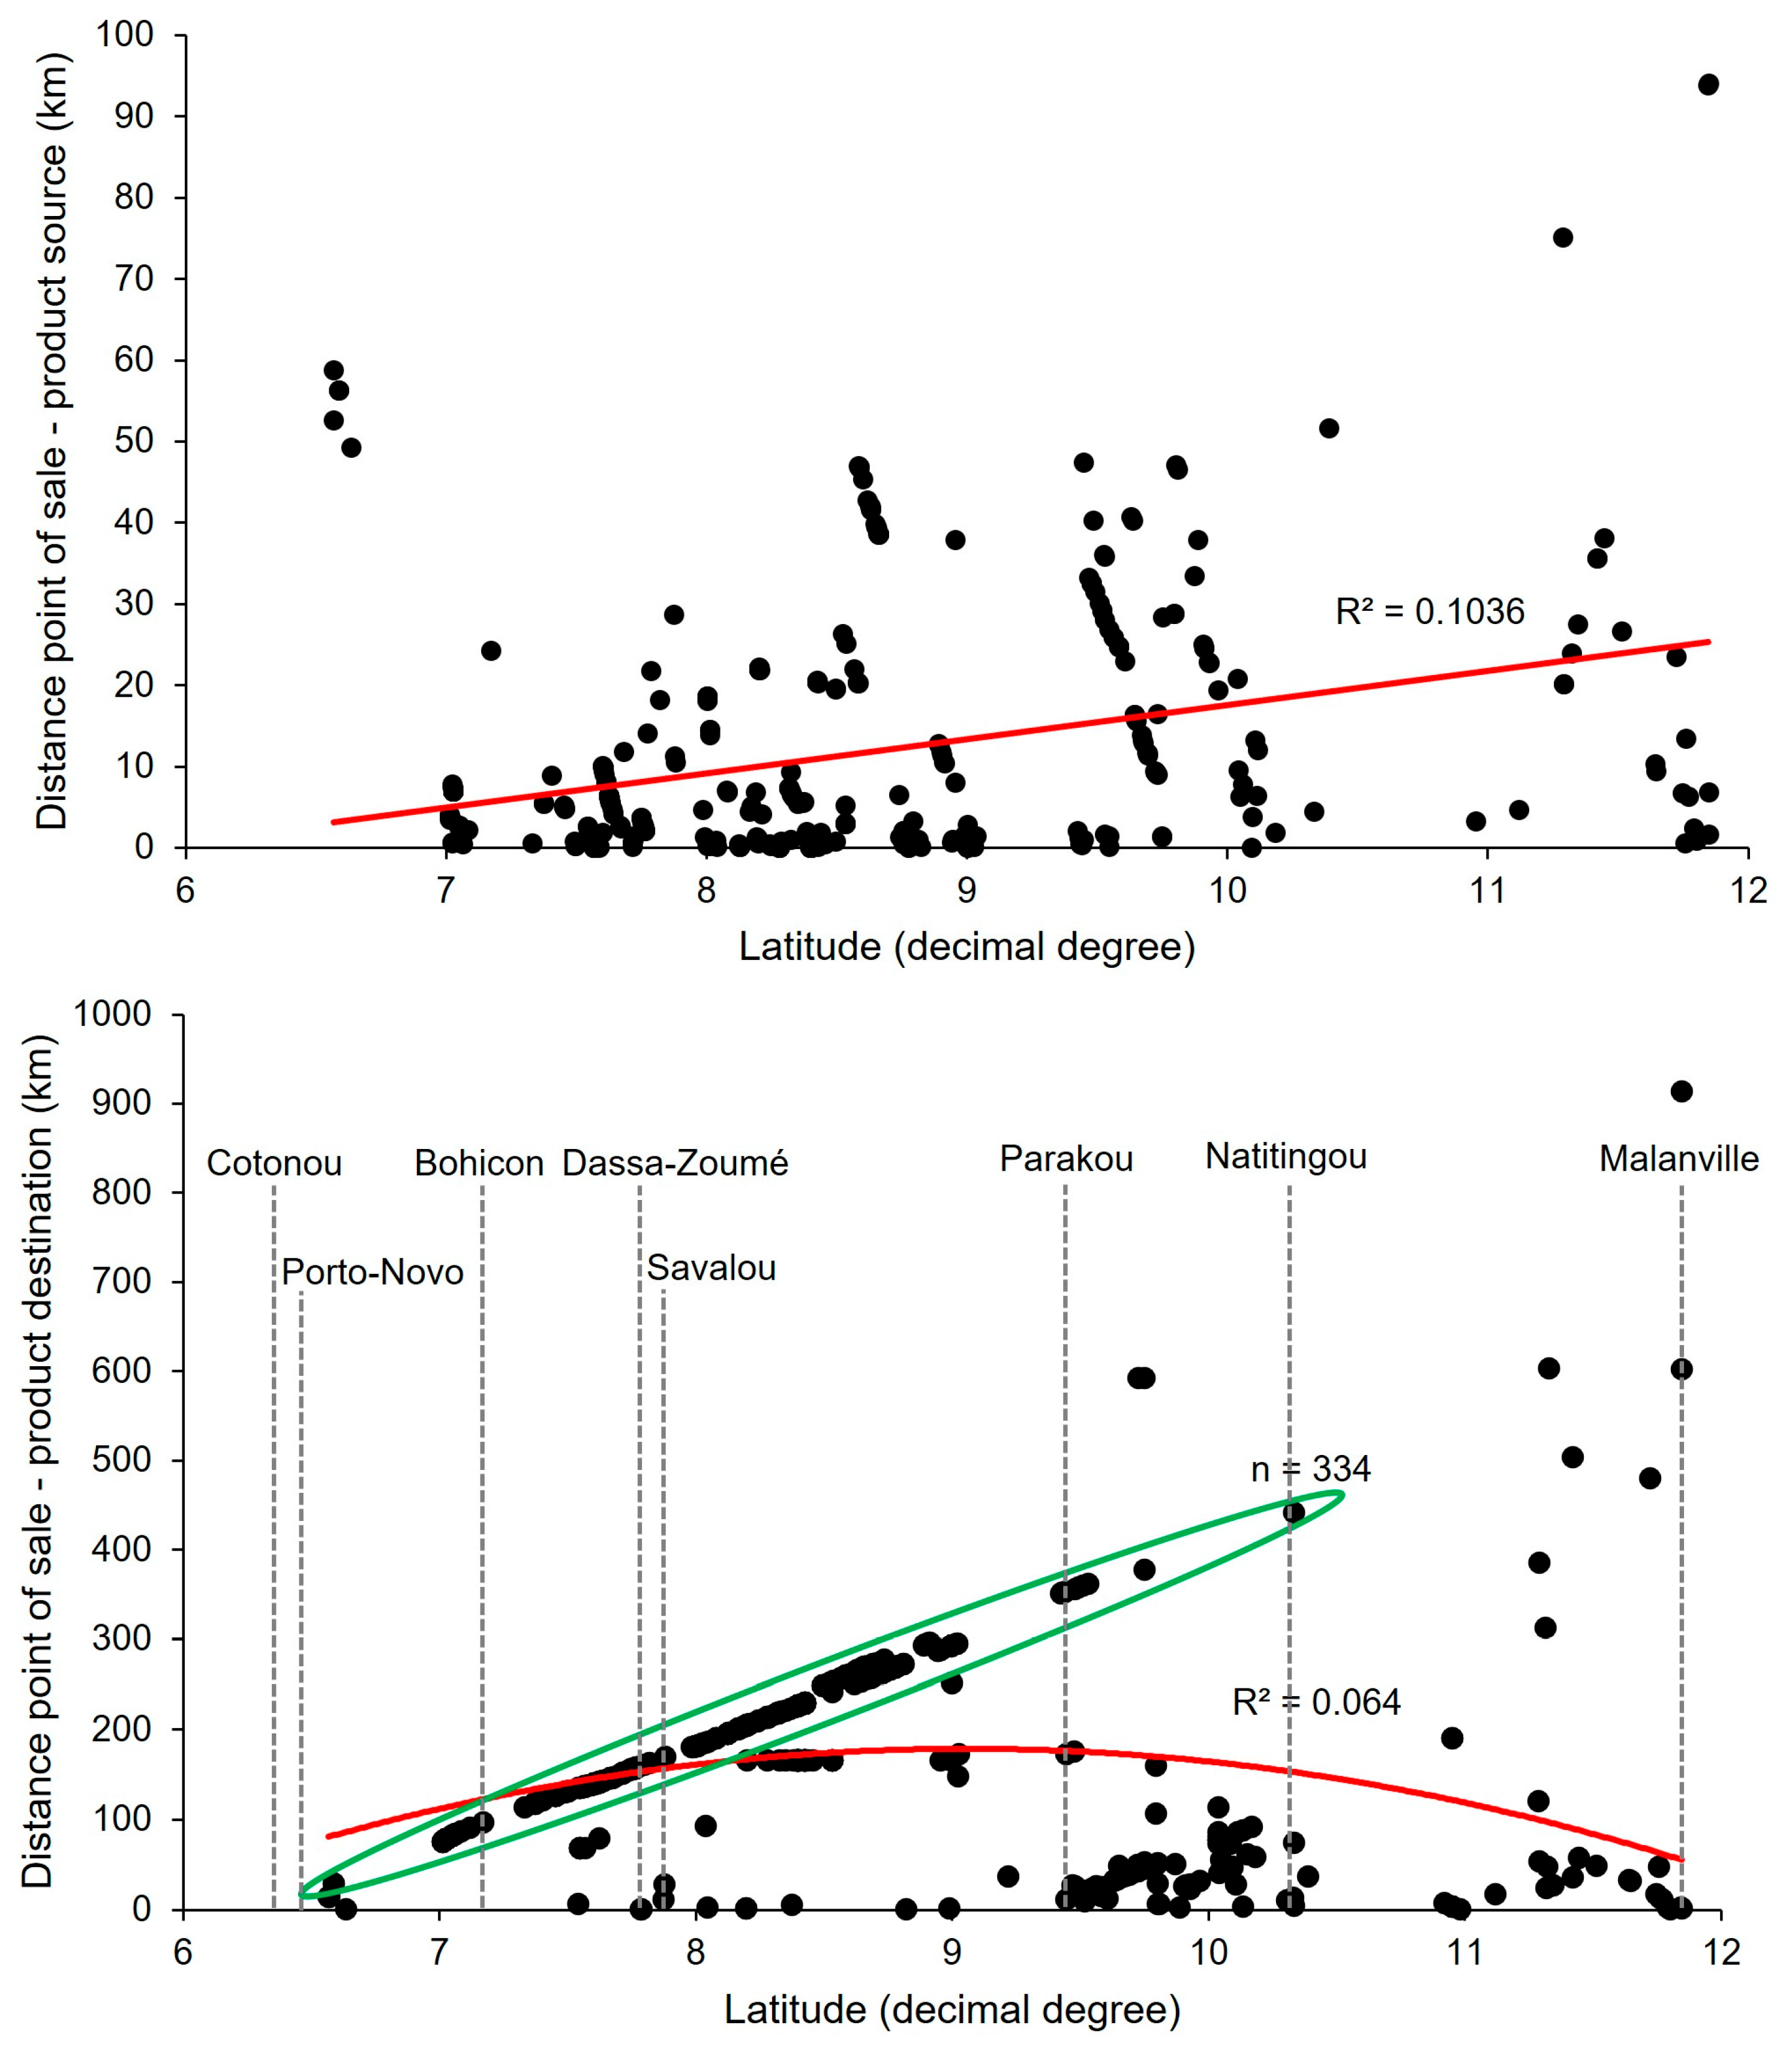
The data indicate that the supply shadow ranged between <1 and 45 km with an average of 11.3 km (SD = 14.5). The outliers (n = 15) represent POSs sourcing from distances up to 95 km. A linear model was fitted to the data and yielded a very weak positive correlation, which highlights the gradual increase in the supply shadow across the latitude gradient (Figure 10).
The market reach ranged between <1 and 390 km with an average of 155.0 km (SD = 103.9). The outliers (n = 8) portrayed POSs supplying to destinations up to 915 km, whereby Niger was a destination for 7 POSs. A 2nd degree polynomial model yielded a very weak positive correlation, which highlights the low distance shadow of the destinations in the north and south of the country compared with a relatively higher distance shadow in the center. The latitude at the vertex of the polynomial (9.0° N) hereby indicates the transition point where the primary destination shifted from the Cotonou–Porto-Novo metropolitan region to central and northern cities of Benin, such as Parakou, Kandi, and Malanville. A subset of the data (n = 334) aligned to a linear model represents a proportion of the POSs supplying to the Cotonou–Porto-Novo metropolitan region (Figure 10).
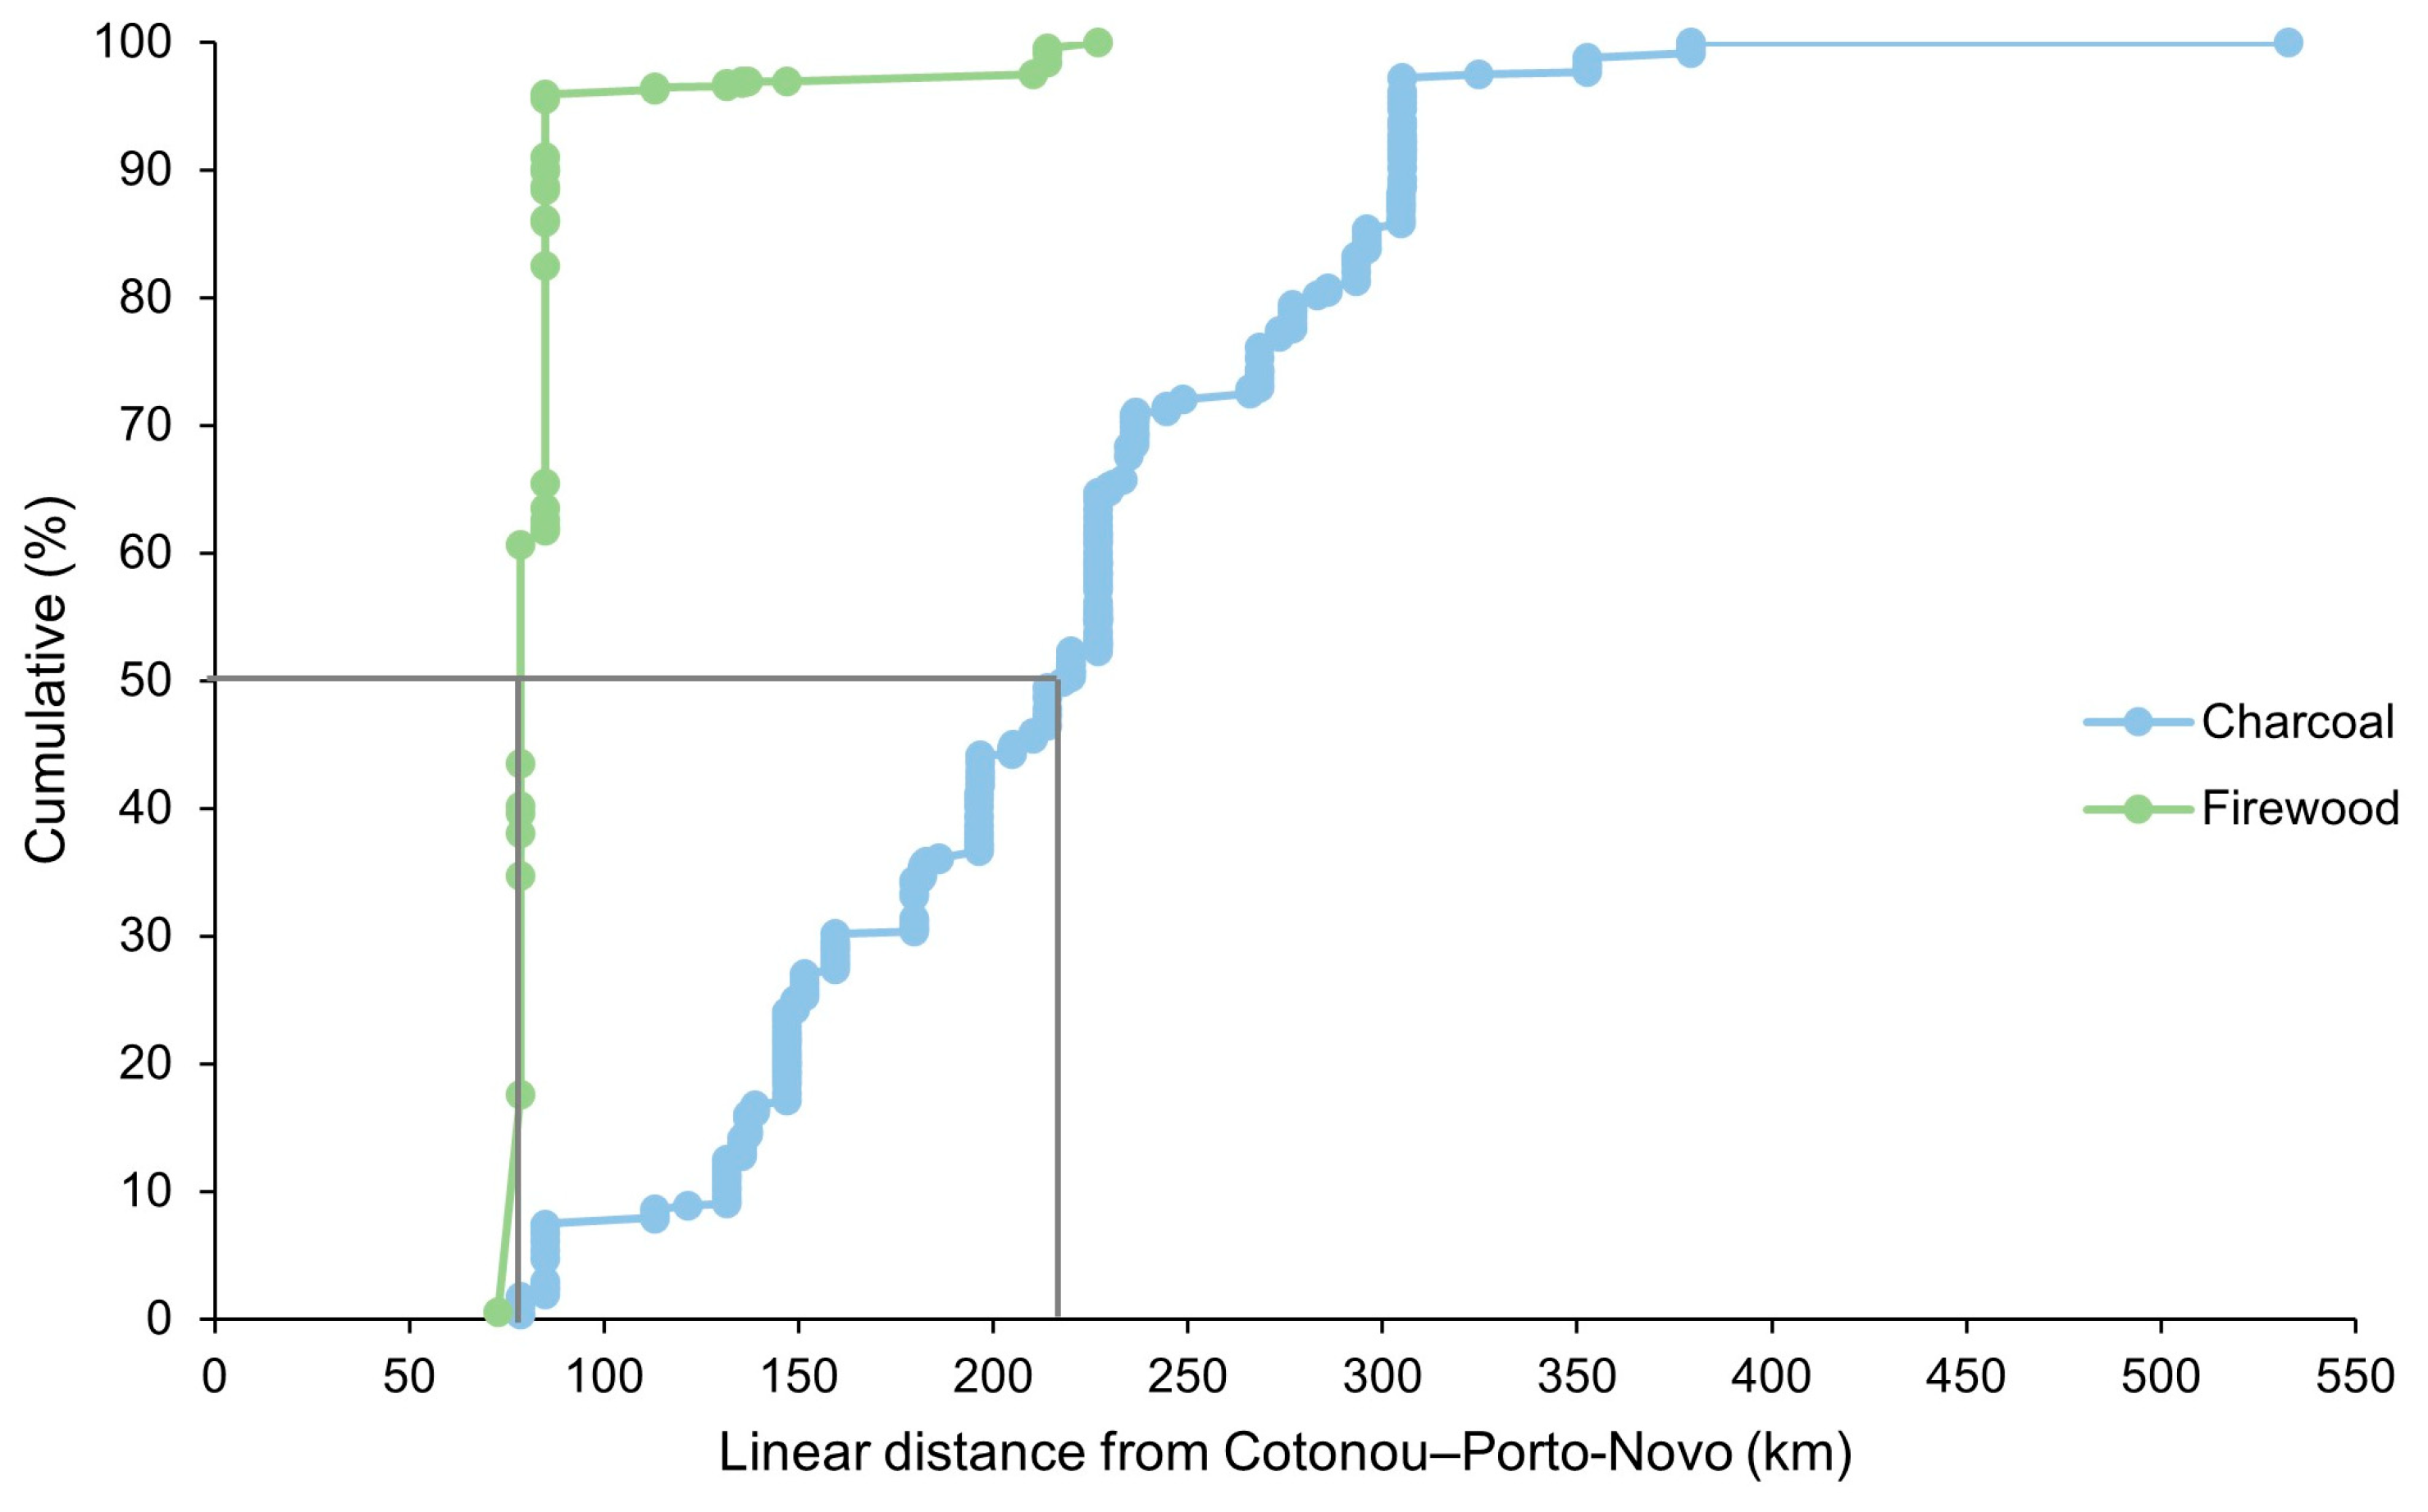
While half of the firewood was sourced from locations at a radius <70 km, about half of the charcoal supplied to the Cotonou–Porto-Novo metropolitan region was sourced from locations at a radius <220 km (Figure 11).

4. Discussion

The findings on the number of woodfuel POSs and traded volumes support the first and second hypotheses stating that charcoal is the dominant form of woodfuel traded, and that the prevalence of roadside vending differs between major roads. Across the entire study area, and on each road considered individually, POSs trading charcoal were more frequent than those trading firewood, and the traded quantities of charcoal were larger. This trend remained the same even when standardized by road length, highlighting the greater demand for charcoal, particularly from urban environments, as it is lightweight for transport, produces less smoke, minimizes pot soiling, and is more cost-effective in terms of energy per unit price. Additionally, charcoal is easier to store since it is resistant to pests and does not decompose as readily as firewood [31]. The estimated yearly amount of woodfuel traded by the roadside vendors along RNIE#2 and RNIE#3 reached 36,800 t year−1 in 2023. This value is very low compared to the latest national estimates from the 1990s (<2%) and may be explained by the differences in methods used, and by the focus on roadside vending along both main roads [31,32]. This comparison also points to a limitation of the present study, as the adopted approach captures only the roadside segment of the woodfuel economy and may underrepresent off-road, village-based, urban wholesale, and seasonal flows. Future surveys combining roadside observations with data from production sites, secondary roads, and urban retail markets would help refine the absolute estimates and test the robustness of the spatial patterns identified here.
Roadside woodfuel vending is more prevalent on RNIE#2 compared with RNIE#3. This economic activity generally depends on traffic volume and the socio-economic status of passersby [33]. From a political point of view, RNIE 2 is an important transport corridor between Benin and Niger, with heavy truck traffic supplying landlocked Niger, Burkina Faso, and even northern Nigeria from the port of Cotonou [34]. RNIE#2 connects the southern and northern parts of the country, passing through key cities like Parakou and Bohicon that are major industrial centers [35]. Travelers on RNIE#2 are often urban middle-class citizens owning a car or a motorbike.
The analysis of the geographical distribution of woodfuel sources and supply shadow leads to the rejection of the third hypothesis on the influence of vegetation density on woodfuel supply. In Benin, vegetation strongly declines from south to north, reflecting the major rainfall gradient. However, spatial position and density of charcoal and firewood sources follow a different pattern and are concentrated on specific hotspots. The latter are in the Colline and Zou districts next to primary forest islands. The southern part of the country, where biomass growth is potentially high, harbors only a few sources and a low quantity of traded charcoal and firewood. The low average supply shadow (11.3 km) and its consistency across latitudes indicate that most POSs source locally, with minimal influence from latitudinal variations in vegetation density. This distribution highlights that woodfuel sources may be defined by factors other than vegetation density, such as vegetation quality [36], land tenure, access rights, and policy measures [37]. In practice, woodfuel extraction does not necessarily concentrate where biomass is potentially highest, but rather where preferred species are available, where access to trees is socially and politically feasible, and where production can be linked to roads and markets under workable institutional arrangements. In the context of Benin, this may help explain why source hotspots occur in specific districts rather than following the broader south–north vegetation gradient. Recent literature similarly shows that charcoal production sites are often strongly socially mediated and depend not only on the geographical proximity of tree cover, but also on the political and social accessibility of land and markets [38], while land tenure and institutions can structure both the environmental footprint of production and the capacity of actors to access resources and commercialize them [39,40]. These dimensions were beyond the main empirical scope of the present study, but they provide an important perspective for interpreting the observed spatial patterns. At the same time, the rejection of this hypothesis should be interpreted cautiously, since vegetation density was considered here at a broad spatial gradient and not through direct measurements of local biomass availability, species composition, or harvesting intensity. A finer-scale integration of ecological and governance data could therefore improve the explanation of the observed source hotspots. High anthropic pressure on woodfuel taking place in the vicinity of populated places also affects woodfuel supply as it creates irreversible effects on these sources and pushes the extraction boundaries further away [31].
The results on the geographical distribution of woodfuel destinations and market reach confirm the fourth hypothesis, claiming that there is a large urban woodfuel demand that is increasingly met by suppliers from distant rural regions. Most of the traded charcoal and firewood is destined for urban areas, particularly the Cotonou–Porto-Novo metropolitan region, which had a population growth rate of 2.5% in 2024 [18], and whose urban boundaries have merged with nearby villages, creating an extended metropolis. The area is currently hosting a quarter of the country’s population, thus being a major consumption hub for woodfuel. The demand for charcoal and firewood in Cotonou–Porto-Novo is covered by distant POSs in the country’s hinterland, which is explained by the increasing market reach of POSs and the cumulative quantities of traded fuelwood to Cotonou–Porto-Novo over a latitude gradient. However, the market reach peaks at a certain value, meaning that there is a limit to the travel distance if other nearby urban areas exist and are economically interesting for traders.
Beyond Benin, the findings reflect broader urban energy transition trends across African cities, where shifts away from biomass are often slow, uneven, and socially differentiated rather than linear. Even under rapid urbanization, the use of charcoal as a major energy source for local households abounds because charcoal is affordable, accessible, easy to store, and compatible with everyday cooking practices [7,41,42]. Many households stack fuels rather than fully substituting charcoal with LPG or electricity when prices, reliability, and cooking needs vary [43]. In this sense, the case of Benin suggests that urban growth may not immediately reduce dependence on woodfuel but may instead lead to a reorganization of supply chains over longer distances and intensified pressure on resources of selected rural hinterlands.

5. Conclusions

This study provides a first spatially explicit assessment of charcoal and firewood supply chains in Benin, focusing on the segment centered on roadside vending. The findings confirm that charcoal is the dominant traded woodfuel, and that roadside vending activity varies between major roads, with RNIE#2 serving as a more significant corridor due to its higher traffic volume and regional importance. Despite assumptions about vegetation density, woodfuel supply appears to be driven more by local socio-political and ecological factors than by latitudinal gradients in biomass availability. The spatial analysis of destinations highlights the growing urban demand, particularly in the Cotonou–Porto-Novo metropolitan region, which is increasingly supplied by distant rural areas. These insights underscore the complexity of the woodfuel trade and its entanglement with infrastructure, urbanization, and land use dynamics. From a policy perspective, the results call for targeted interventions along RNIE#2, connecting woodfuel hotspots in central Benin, and in the Cotonou–Porto-Novo metropolitan region as the principal demand hub. Priorities should be set on monitoring the effects of woodfuel flows on forest resources, more sustainable production and charcoal conversion, and the gradual expansion of affordable clean cooking alternatives in urban areas. Long-term sustainability of local forest ecosystems will also depend on improving charcoal conversion efficiency and expanding the use of tree-based food production alternatives such as agroforestry to reduce pressure on natural forests. To build on these findings, further surveys of the woodfuel supply chain are recommended with particular attention to its upstream and downstream segments. This includes investigating vegetation and harvest decisions at the source, as well as market organization and consumer interactions at the destination. In parallel, regular and comprehensive inventories of forest resources and urban woodfuel demand would support sustainable management and informed policymaking.

Supplementary Materials

The following supporting information can be downloaded at https://www.mdpi.com/article/10.3390/land15050734/s1, Content of the survey conducted with roadside vendors.

Author Contributions

Conceptualization: A.B., L.H.D., D.T.A.A. Data curation: Y.B., D.T.A.A. Formal analysis and writing—original draft: Y.B. Funding acquisition: A.B. Investigation: D.T.A.A. Methodology: A.B., L.H.D., D.T.A.A., Y.B. Supervision: A.B., L.H.D. Visualization and validation: Y.B., A.B. Writing—review and editing: A.B., L.H.D., D.T.A.A., Y.B. All authors have read and agreed to the published version of the manuscript.

Funding

This work was supported by the Erasmusworldwide exchange program between the University of Kassel, Germany, and the University of Abomey-Calavi, Benin by granting an exchange scholarship to D.T.A.A., and by the German Academic Exchange Service (DAAD) by granting a PhD scholarship to Y.B. [ID 57645448].

Data Availability Statement

The datasets generated and/or analyzed during the current study are available from the corresponding author upon reasonable request.

Acknowledgments

We would like to express our sincere gratitude to the roadside vendors in Benin for their cooperation and willingness to respond to our surveys. We also would like to thank Fabrice Olaye, Sandrine Houessou, and the Pro-RUWA local partner in Benin for their logistical support.

Conflicts of Interest

The authors declare no competing interests.

Abbreviations

The following abbreviations are used in this manuscript:
POS(s)Point(s) of sale
RNIERoute Nationale Inter-États

References

  1. Cline-Cole, R.A.; Main, H.A.C.; Nichol, J.E. On fuelwood consumption, population dynamics and deforestation in Africa. World Dev. 1990, 18, 513–527. [Google Scholar] [CrossRef]
  2. Kebede, E.; Kagochi, J.; Jolly, C.M. Energy consumption and economic development in Sub-Sahara Africa. Energy Econ. 2010, 32, 532–537. [Google Scholar] [CrossRef]
  3. Iiyama, M.; Neufeldt, H.; Dobie, P.; Njenga, M.; Ndegwa, G.; Jamnadass, R. The potential of agroforestry in the provision of sustainable woodfuel in Sub-Saharan Africa. Curr. Opin. Environ. Sustain. 2014, 6, 138–147. [Google Scholar] [CrossRef]
  4. World Energy Statistics and Balances. International Energy Agency. 2024. Available online: https://www.iea.org/data-and-statistics/data-product/world-energy-balances (accessed on 1 April 2025).
  5. Nyarko, I.; Nwaogu, C.; Miroslav, H.; Peseu, P.O. Socio-economic analysis of wood charcoal production as a significant output of forest bioeconomy in Africa. Forests 2021, 12, 568. [Google Scholar] [CrossRef]
  6. Rose, J.; Bensch, G.; Munyehirwe, A.; Peters, J. The forgotten coal: Charcoal demand in Sub-Saharan Africa. World Dev. Perspect. 2022, 25, 100401. [Google Scholar] [CrossRef]
  7. Sawe, E.N. Sustainable charcoal and firewood production and use in Africa. In Bioenergy for Sustainable Development in Africa; Janssen, R., Rutz, D., Eds.; Springer: Berlin/Heidelberg, Germany, 2011; pp. 75–80. [Google Scholar] [CrossRef]
  8. Horst, G.H.D.; Hovorka, A.J. Fuelwood: The “other” renewable energy source for Africa? Biomass Bioenergy 2009, 33, 1605–1616. [Google Scholar] [CrossRef]
  9. Zulu, L.C.; Richardson, R.B. Charcoal, livelihoods, and poverty reduction: Evidence from Sub-Saharan Africa. Energy Sustain. Dev. 2012, 17, 127–137. [Google Scholar] [CrossRef]
  10. Sander, K.; Gros, C.; Peter, C. Enabling reforms: Analyzing the political economy of the charcoal sector in Tanzania. Energy Sustain. Dev. 2013, 17, 116–126. [Google Scholar] [CrossRef]
  11. Sulaiman, C.; Abdul-Rahim, A.S.; Mohd-Shahwahid, H.O.; Chin, L. Wood fuel consumption, institutional quality, and forest degradation in Sub-Saharan Africa: Evidence from a dynamic panel framework. Ecol. Indic. 2016, 74, 414–419. [Google Scholar] [CrossRef]
  12. Du Plessis, M. The effects of fuelwood removal on the diversity of some cavity-using birds and mammals in South Africa. Biol. Conserv. 1995, 74, 77–82. [Google Scholar] [CrossRef]
  13. Specht, M.J.; Pinto, S.R.R.; Albuquerque, U.P.; Tabarelli, M.; Melo, F.P. Burning biodiversity: Fuelwood harvesting causes forest degradation in human-dominated tropical landscapes. Glob. Ecol. Conserv. 2014, 3, 200–209. [Google Scholar] [CrossRef]
  14. Sulaiman, C.; Abdul-Rahim, A.; Chin, L.; Mohd-Shahwahid, H. Wood fuel consumption and mortality rates in Sub-Saharan Africa: Evidence from a dynamic panel study. Chemosphere 2017, 177, 224–231. [Google Scholar] [CrossRef] [PubMed]
  15. Tumwesige, V.; Okello, G.; Semple, S.; Smith, J. Impact of partial fuel switch on household air pollutants in Sub-Sahara Africa. Environ. Pollut. 2017, 231, 1021–1029. [Google Scholar] [CrossRef] [PubMed]
  16. Jackson, R.B.; Ahlström, A.; Hugelius, G.; Wang, C.; Porporato, A.; Ramaswami, A.; Roy, J.; Yin, J. Human well-being and per capita energy use. Ecosphere 2022, 13, e3978. [Google Scholar] [CrossRef]
  17. United Nations. World Population Prospects 2024; United Nations, Department of Economic and Social Affairs, Population Division: New York, NY, USA, 2024; Available online: https://population.un.org/wpp (accessed on 1 April 2025).
  18. United Nations. World Urbanization Prospects 2018; United Nations, Department of Economic and Social Affairs, Population Division: New York, NY, USA, 2018; Available online: https://population.un.org/wup (accessed on 1 April 2025).
  19. Direction Générale des Ressources Energétiques, République du Bénin. Le Sous-Secteur de la Biomasse-Energie; Direction Générale des Ressources Energétiques, République du Bénin: Cotonou, Bénin, 2000; Available online: https://direction-energie.gouv.bj/ (accessed on 1 April 2025).
  20. Liu, J.; Hull, V.; Batistella, M.; DeFries, R.; Dietz, T.; Fu, F.; Hertel, T.W.; Izaurralde, R.C.; Lambin, E.F.; Li, S.; et al. Framing sustainability in a telecoupled world. Ecol. Soc. 2013, 18, 26. [Google Scholar] [CrossRef]
  21. Law, R.; Ronen, D.; Adotevi, S.S. Benin. Encyclopedia Britannica. 2025. Available online: https://www.britannica.com/place/Benin (accessed on 1 April 2025).
  22. ArcGIS Pro, version 3.1; Computer Software; Environmental Systems Research Institute Inc.: Redlands, CA, USA, 2022; Available online: https://www.esri.com/arcgis/products/arcgis-pro/ (accessed on 1 June 2023).
  23. World Bank. Benin Country Forest Note; World Bank: Washington, DC, USA, 2020; Available online: https://hdl.handle.net/10986/34437 (accessed on 1 April 2025).
  24. Food and Agriculture Organization of the United Nations. Global Forest Resources Assessment—Benin; Food and Agriculture Organization of the United Nations: Rome, Italy, 2020; Available online: https://fra-data.fao.org/assessments/fra/2020/BEN/home/overview/ (accessed on 1 April 2025).
  25. National Oceanic and Atmospheric Administration. Global Summary of the Day; version 1; [dataset]; National Oceanic and Atmospheric Administration: Washington, DC, USA, 2020. Available online: https://www.ncei.noaa.gov/ (accessed on 1 January 2025).
  26. Kobocollect, version 2023.1.2; Mobile and Web Application; Kobotoolbox; Kobo Inc.: Toronto, ON, Canada, 2023; Available online: https://www.kobotoolbox.org/ (accessed on 1 October 2023).
  27. Issifou, A.Y.; Tonouewa, M.F.; Biaou, S.S.H.; Houehanou, T.D.; Idrissou, Y. Technique de carbonisation du bois au Nord-Ouest du Bénin, Afrique de l’Ouest. Afr. Sci. 2020, 16, 49–58. Available online: https://www.researchgate.net/publication/342438327_Wood_carbonization_technique_in_northwestern_Benin_West_Africa (accessed on 1 April 2025).
  28. Humanitarian Data Exchange. Benin—Subnational Administrative Boundaries, version 1.83.4; dataset; Humanitarian Data Exchange: The Hague, The Netherlands, 2024; Available online: https://data.humdata.org/ (accessed on 1 April 2025).
  29. Quantum Geographic Information System (QGIS), version 3.22; Computer Software; QGIS: Online, 2021; Available online: https://qgis.org/ (accessed on 1 June 2023).
  30. Microsoft Excel, version 2016; Computer Software; Microsoft Corporation: Washington, DC, USA, 2016; Available online: https://www.microsoft.com/ (accessed on 1 October 2022).
  31. Juhé-Beaulaton, D. Bois de chauffe et charbon de bois dans le Sud du Bénin: évolution de la production au cours du XXe siècle in Le bois source d’énergie: Naguère et aujourd’hui. In Cahier D’études n°10, Forêt, Environnement et Société; Corvol, A., Ed.; CNRS: Paris, France, 2000; pp. 30–38. Available online: https://shs.hal.science/halshs-00089319 (accessed on 1 April 2025).
  32. Agbo, J.; Bamisso, N.; Mama, V.J. Statut de l’information sur le Bois-Energie au Bénin. In Deuxième Atelier Régional Sur L’information En Bois-Energie En AFRIQUE—Pays Francophones; Food and Agriculture Organization of the United Nations: Rome, Italy, 2001; Available online: https://www.fao.org/4/y2714f/y2714f13.htm (accessed on 1 April 2025).
  33. Eya, M.A.; Sinniah, G.K.; Shah, M.Z.; Hashim, A. Factors Influencing Community Participation in Street Vending Business on Urban Road Corridors: A Disposition of Economic Theories and Land use Models. Int. J. Res. Innov. Soc. Sci. 2024, 8, 21–36. [Google Scholar] [CrossRef]
  34. Réhabilitation de la Route Nationale Inter-Etats N°2: L’Ambassadeur Coll Sur Le Chantier Ce Jour. aCotonou.com. 2015. Available online: http://news.acotonou.com/h/74705.html (accessed on 1 April 2025).
  35. Nag, O.S. The Major Cities of Benin; WorldAtlas: Saint Laurent, QC, Canada, 2017; Available online: https://www.worldatlas.com/articles/the-major-cities-of-benin.html (accessed on 1 April 2025).
  36. Ramos, M.A.; De Medeiros, P.M.; De Almeida, A.L.S.; Feliciano, A.L.P.; De Albuquerque, U.P. Can wood quality justify local preferences for firewood in an area of caatinga (dryland) vegetation? Biomass Bioenergy 2008, 32, 503–509. [Google Scholar] [CrossRef]
  37. Beyene, A.D.; Koch, S.F. Property rights, institutions and choice of fuelwood source in rural Ethiopia. For. Policy Econ. 2013, 30, 30–38. [Google Scholar] [CrossRef][Green Version]
  38. Branch, A.; Agyei, F.K.; Anai, J.G.; Apecu, S.L.; Bartlett, A.; Brownell, E.; Caravani, M.; Cavanagh, C.J.; Fennell, S.; Langole, S.; et al. From crisis to context: Reviewing the future of sustainable charcoal in Africa. Energy Res. Soc. Sci. 2022, 87, 102457. [Google Scholar] [CrossRef]
  39. Schure, J.; Ingram, V.; Sakho-Jimbira, M.S.; Levang, P.; Wiersum, K.F. Formalisation of charcoal value chains and livelihood outcomes in Central- and West Africa. Energy Sustain. Dev. 2012, 17, 95–105. [Google Scholar] [CrossRef]
  40. Pelletier, J.; Hamalambo, B.; Trainor, A.; Barrett, C.B. How land tenure and labor relations mediate charcoal’s environmental footprint in Zambia: Implications for sustainable energy transitions. World Dev. 2021, 146, 105600. [Google Scholar] [CrossRef]
  41. Gazull, L.; Gautier, D.; Montagne, P. Household energy transition in Sahelian cities: An analysis of the failure of 30 years of energy policies in Bamako, Mali. Energy Policy 2019, 129, 1080–1089. [Google Scholar] [CrossRef]
  42. Doggart, N.; Ruhinduka, R.; Meshack, C.K.; Ishengoma, R.C.; Morgan-Brown, T.; Abdallah, J.M.; Spracklen, D.V.; Sallu, S.M. The influence of energy policy on charcoal consumption in urban households in Tanzania. Energy Sustain. Dev. 2020, 57, 200–213. [Google Scholar] [CrossRef]
  43. Wernecke, B.; Langerman, K.E.; Howard, A.I.; Wright, C.Y. Fuel switching and energy stacking in low-income households in South Africa: A review with recommendations for household air pollution exposure research. Energy Res. Soc. Sci. 2024, 109, 103415. [Google Scholar] [CrossRef]
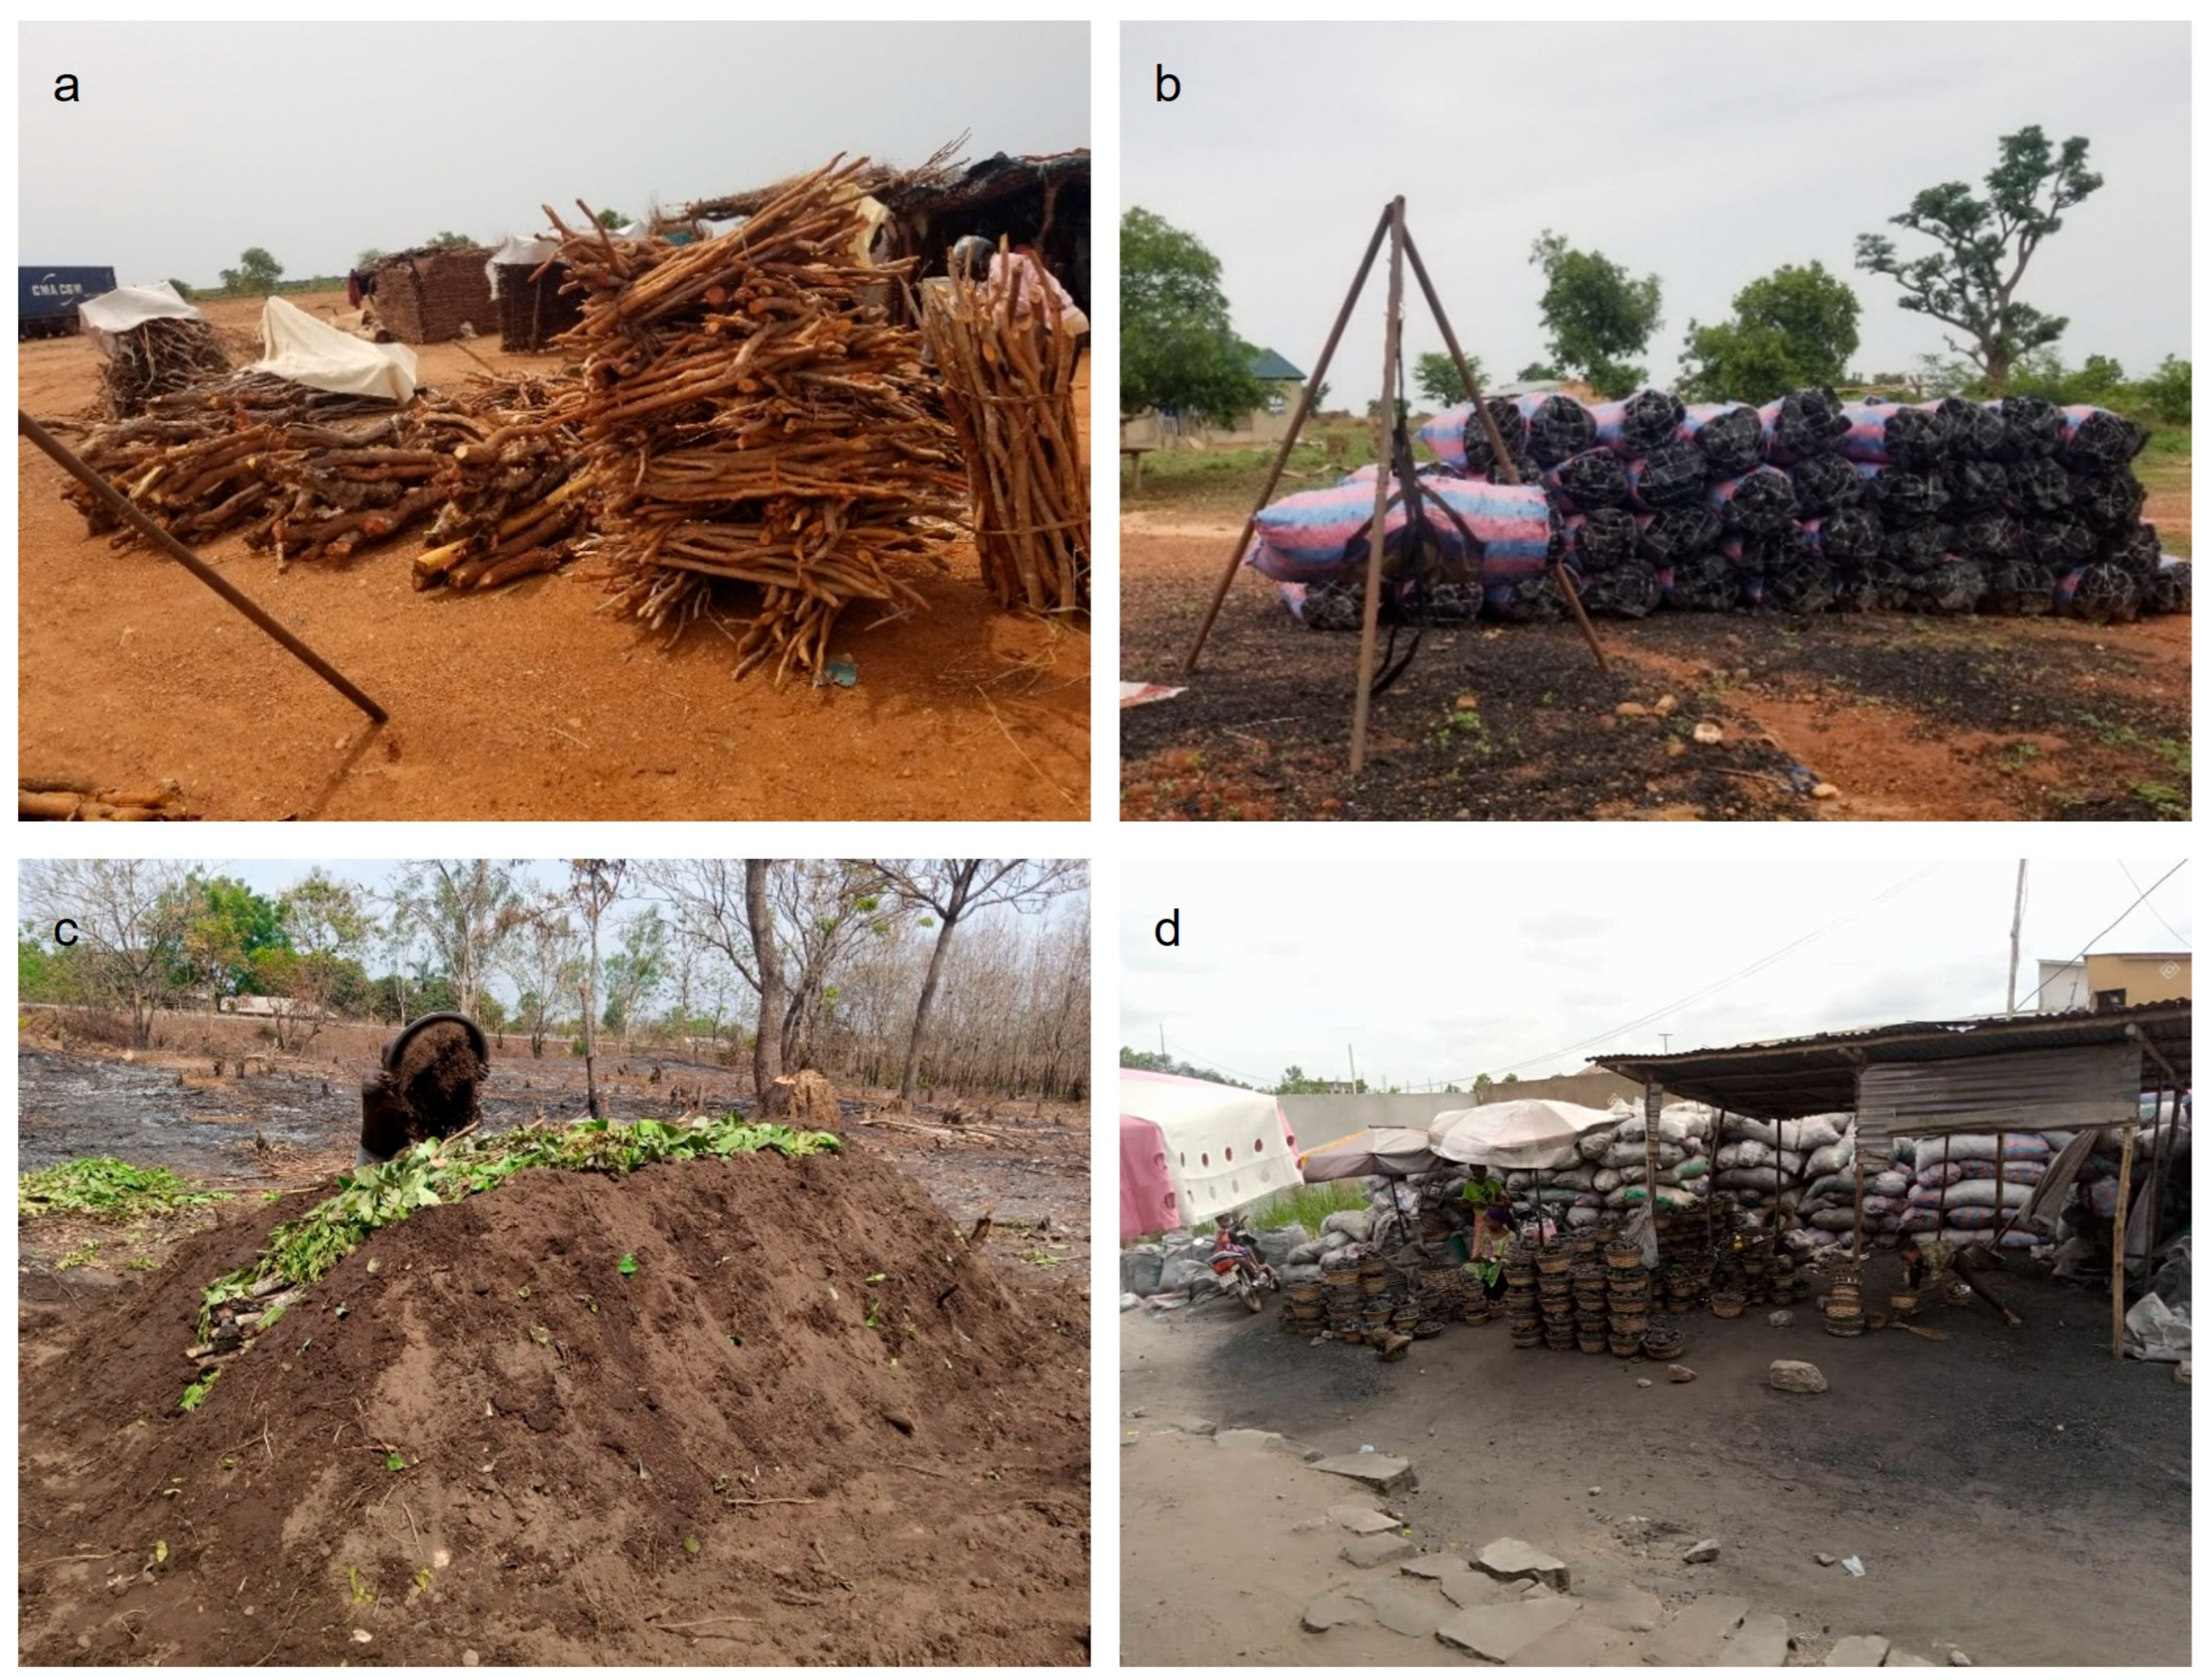
Figure 1. (a) Firewood piles at a roadside point of sale in Guéné, Benin. (b) Charcoal bags at a roadside point of sale in Zogbodomey, Benin (c). Production site of charcoal in Setto, Benin. (d) Urban market of charcoal and firewood in Cotonou, Benin.
Land 15 00734 g001
Figure 3. Ombrothermic diagrams between 2020 and 2023 of two locations in North and South Benin, West Africa [25].
Land 15 00734 g003
Figure 4. Three marketing pathways of the charcoal and firewood supply chain in Benin, West Africa, and the average selling price per kilogram of charcoal at different levels of the chain in the regional currency FCFA (Franc de la Communauté Financière d’Afrique whereby 1 € = 656 FCFA.
Land 15 00734 g004
Figure 5. Spatial distribution and total number of charcoal and firewood points of sale along RNIE#2 and RNIE#3 roads in Benin, West Africa. QGIS v.3.22 [29].
Land 15 00734 g005
Figure 6. Spatial distribution and total number of charcoal points of sale during the rainy period, and the dry season, along RNIE#2 and RNIE#3 roads in Benin, West Africa. QGIS v.3.22 [29].
Land 15 00734 g006
Figure 7. Boxplots of the traded quantity of wood-equivalent charcoal (n = 497) and firewood (n = 61) along RNIE#2 and RNIE#3 roads in Benin, West Africa.
Land 15 00734 g007
Figure 8. Kernel density map of the points of sales of charcoal and firewood along RNIE#2 and RNIE#3 in Benin, West Africa, weighted by the annual traded quantities. QGIS v.3.22 [29].
Land 15 00734 g008
Figure 9. Kernel density maps of the sources and destinations of charcoal and firewood traded in the points of sale along RNIE#2 and RNIE#3 in Benin, West Africa, weighted by the annual traded quantities. For the destination Cotonou–Porto-Novo metropolitan region, both products are overlaying. QGIS v.3.22 [29].
Land 15 00734 g009
Figure 10. Supply shadow and market reach of charcoal and firewood points of sale along RNIE#2 and RNIE#3 in Benin, West Africa, as a function of latitude, and fitted to a linear and 2nd degree polynomial trendline.
Land 15 00734 g010
Figure 11. Cumulative quantities of charcoal and firewood supplied to Cotonou–Porto-Novo metropolitan region in Benin, West Africa, as a function of distance from the source. A mark is indicating the distance at which 50% of the cumulative supplied quantity is reached for charcoal and firewood.
Land 15 00734 g011
Table 1. Metadata of the charcoal and firewood surveys conducted in Benin, West Africa.
SeasonPeriodProductNumber of RecordsMissing Values (%)
SourceDestinationQuantity (Bags/Piles Traded per Month)
Rainy-N
Dry-S
July/August, 2023Charcoal49925.16.80.4
Firewood624.81.61.6
DryFebruary, 2025Charcoal537---
Disclaimer/Publisher’s Note: The statements, opinions and data contained in all publications are solely those of the individual author(s) and contributor(s) and not of MDPI and/or the editor(s). MDPI and/or the editor(s) disclaim responsibility for any injury to people or property resulting from any ideas, methods, instructions or products referred to in the content.