Article

More Accessible, More Equitable? Rehabilitation Support Spaces for Persons with Mental Disabilities in Tianjin

1
Department of Urban and Rural Planning, School of Architecture, Southwest Jiaotong University, Chengdu 611756, China
2
Chengdu Institute of Urban Planning and Design, Chengdu 610041, China
3
School of Civil Engineering and Architecture, University of Jinan, Jinan 250022, China
*
Authors to whom correspondence should be addressed.
Land 2026, 15(10), 1884; https://doi.org/10.3390/land15101884
Submission received: 10 September 2026 / Revised: 27 September 2026 / Accepted: 2 October 2026 / Published: 7 October 2026

Abstract

The equitable allocation of mental health rehabilitation support spaces provides an important foundation for community living and social participation among persons with mental disabilities. Existing accessibility studies tend to focus on a single facility type or travel mode, with limited consideration of the relationships among rehabilitation needs, travel conditions, and spatial opportunities. Using the central urban area of Tianjin as a case study, we aggregated records of persons with mental disabilities at the residential community level and classified rehabilitation support spaces into four types: professional rehabilitation spaces, natural restorative spaces, social interaction spaces, and occupational participation spaces. The Gaussian-enhanced two-step floating catchment area (Gaussian E2SFCA) method was used to estimate accessibility by space type and comprehensive accessibility under public transport, walking, and car passenger travel scenarios. Moran’s I, bivariate LISA, Lorenz curves, the Gini coefficient, and screening for communities with high needs and low accessibility were combined to assess spatial clustering, overall distribution, and needs-based spatial equity. The results show that travel modes substantially reshape the spatial distribution of rehabilitation support opportunities. Public transport accessibility was higher in central areas and lower on the periphery, whereas high walking accessibility was confined to scattered patches around facilities. Car passenger travel reduced spatial disparities but access remained constrained by family caregiving capacity and financial resources. Sensitivity to travel constraints varied across space types, with the largest gaps in access observed for occupational participation and professional rehabilitation spaces, indicating that comprehensive accessibility cannot replace assessment by space type. Screening at the residential community level identified multiple units with high needs and low accessibility, revealing that overall equity assessments can obscure local mismatches between supply and demand. These findings indicate that transport improvements can reduce distance-related barriers but do not automatically achieve needs-based equity. The study provides spatial evidence to inform the allocation of mental health rehabilitation resources, the identification of priority areas, and the development of compensatory transport support policies.

1. Introduction

Ensuring equal participation in social life, access to basic public services, and independent living in the community for persons with disabilities has become an important goal of international public policy. The Convention on the Rights of Persons with Disabilities has shifted disability policy from medical assistance towards the protection of rights, equal opportunities, and social participation. It also emphasises that rehabilitation services should cover health, employment, education, and social services. Wherever possible, these services should be provided within communities [1]. The World Health Organization’s Comprehensive Mental Health Action Plan 2013–2030 further calls for comprehensive, continuous, and responsive community mental health and social care services. These services aim to promote social inclusion and protect the rights of people with mental disorders [2]. Against this background, rehabilitation for persons with mental disabilities has expanded beyond treatment in institutions to include community support, environmental accessibility, and social participation.
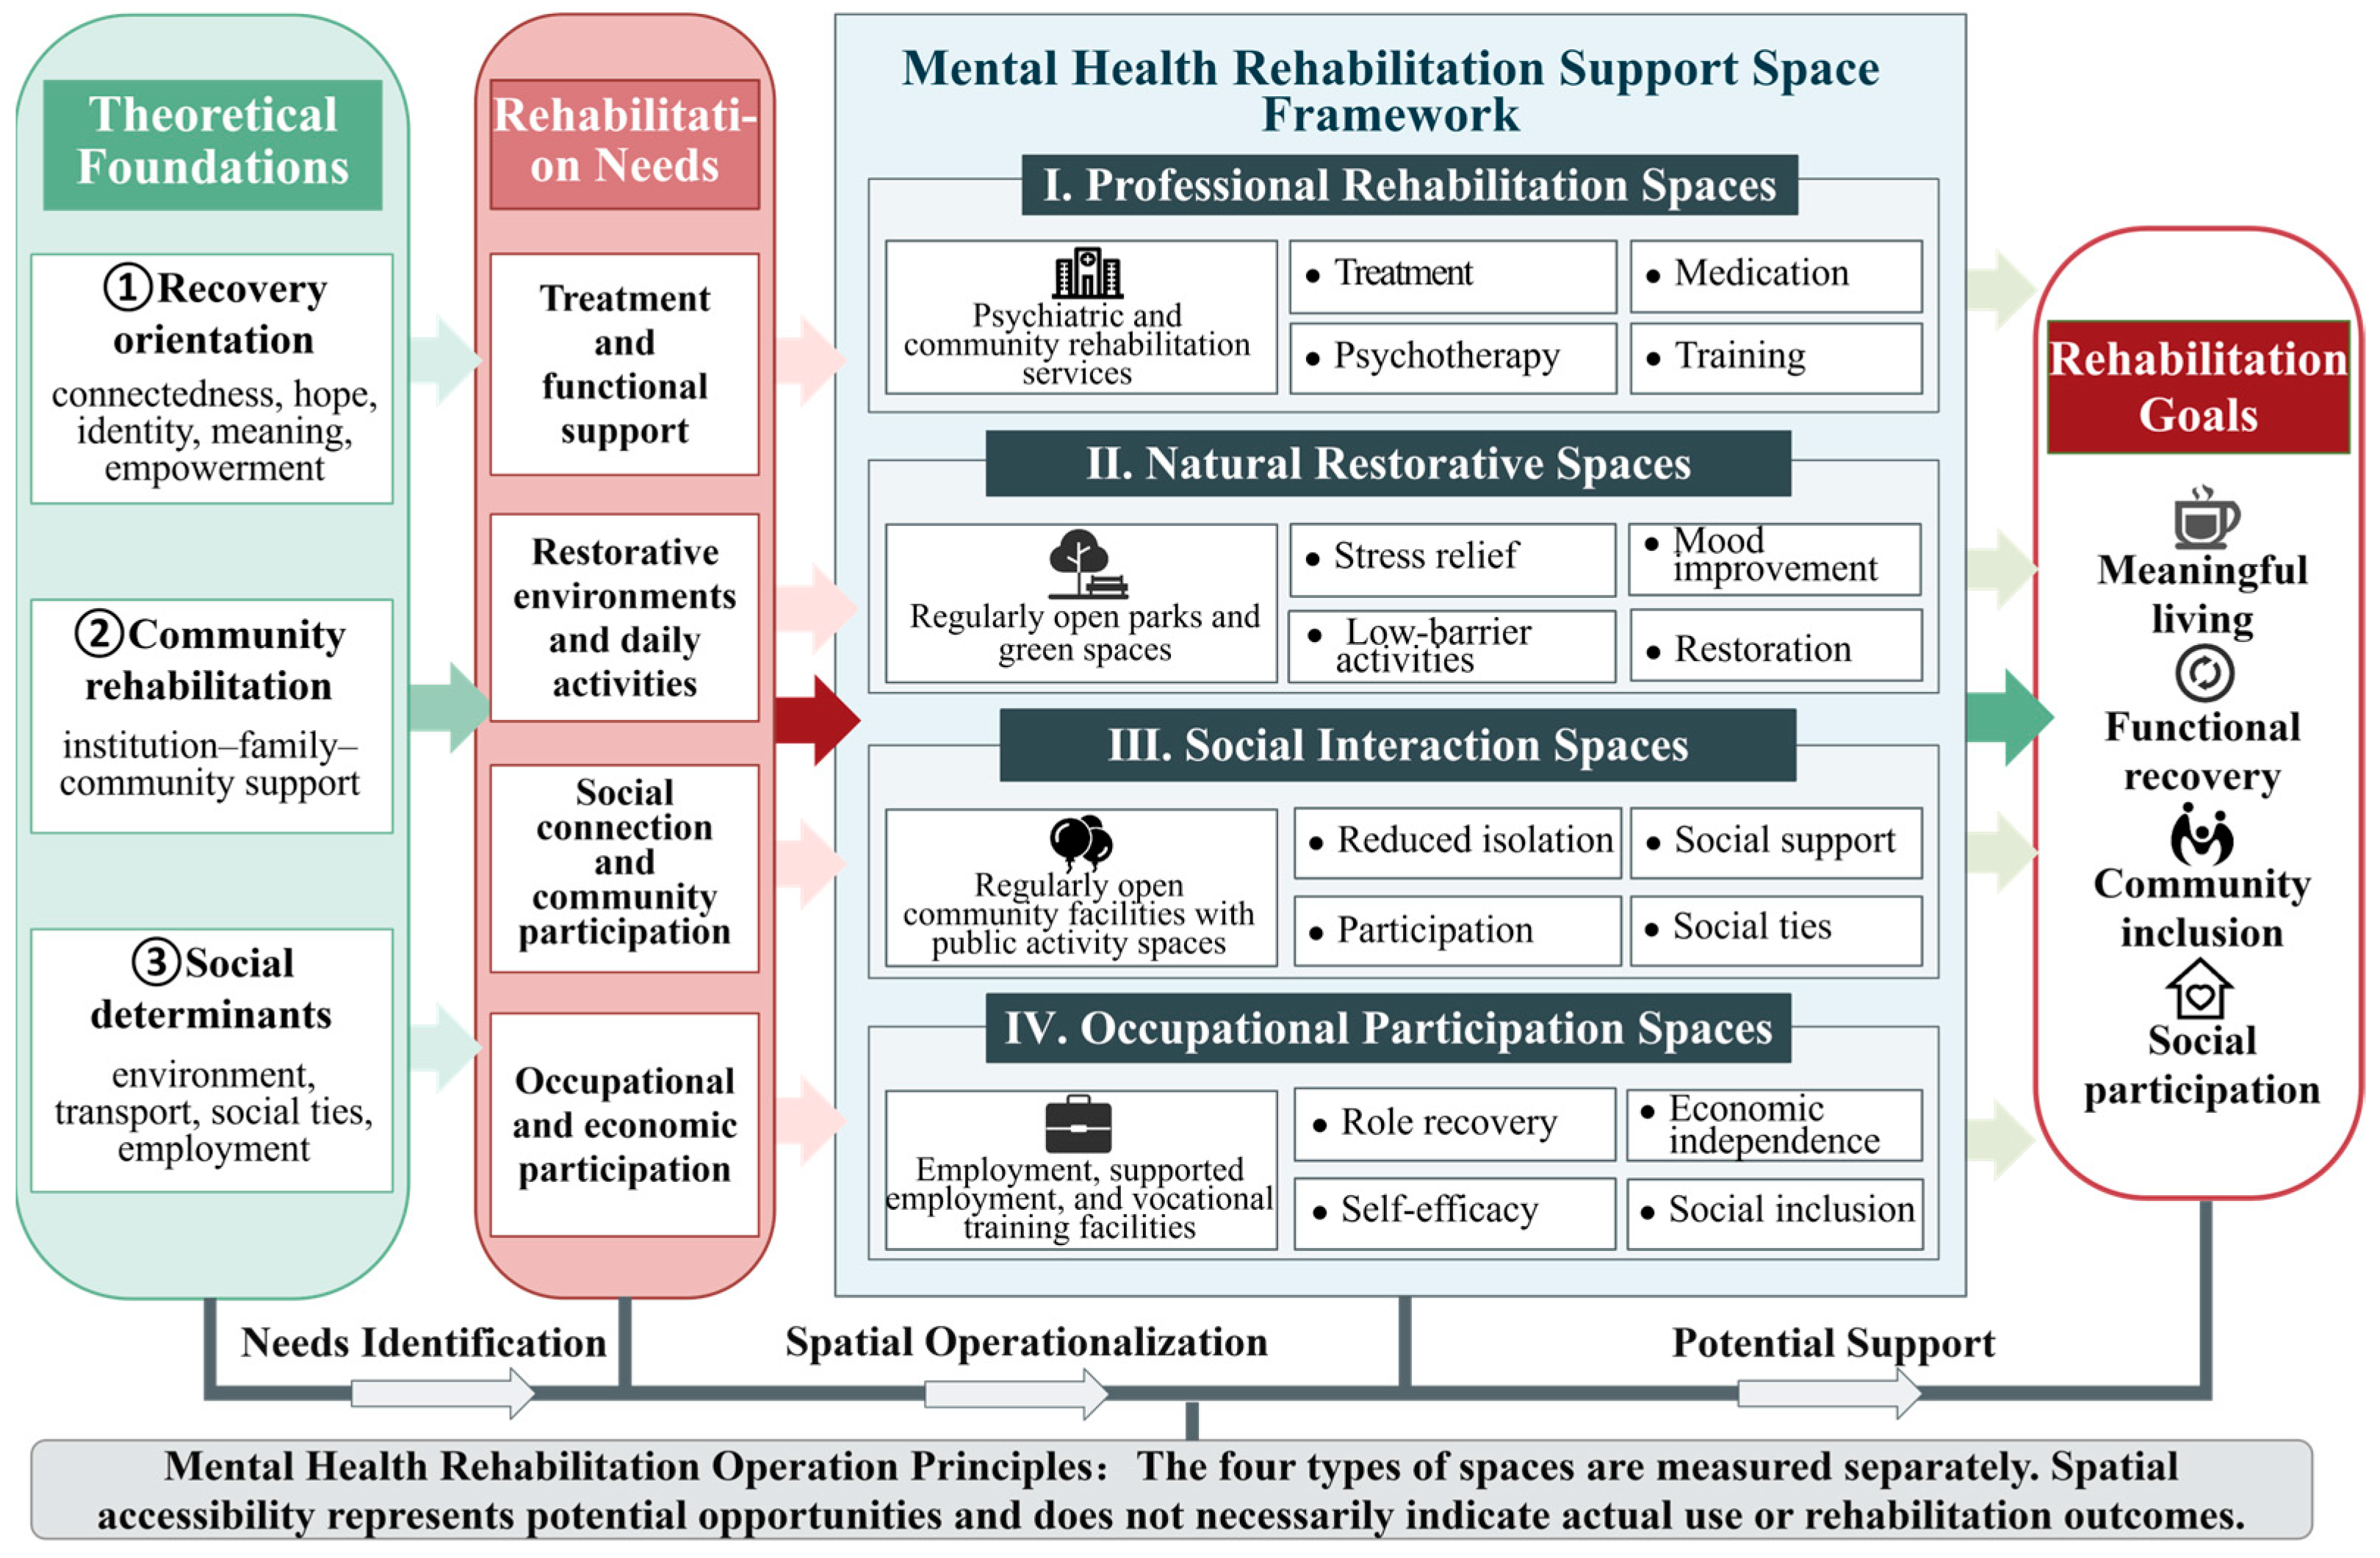
Mental health rehabilitation involves more than symptom reduction. It also includes community living, rebuilding relationships, restoring identity, and personal empowerment. Recovery-oriented theory emphasises that recovery is an ongoing process through which individuals regain hope, meaning, autonomy, and social roles. Its goal is to support individuals in living meaningful lives, rather than simply eliminating symptoms. Community inclusion theory further suggests that rehabilitation outcomes for persons with mental disabilities depend on their ability to access community settings, build social connections, and participate in daily activities. Rehabilitation support should therefore extend beyond healthcare institutions. Social determinants theory highlights the combined influence of residential environments, public spaces, employment conditions, social relationships, and transport accessibility on mental health and recovery opportunities. Together, these three theories frame mental health rehabilitation as a comprehensive process embedded in everyday life and the urban environment. This process requires support from professional services, community environments, and opportunities for social participation [3,4,5,6,7,8].
Rehabilitation opportunities for persons with mental disabilities have a clear spatial dimension. Professional services, open green spaces, community activity venues, and employment support organisations are unevenly distributed across the city. Persons with mental disabilities may also face functional limitations, financial burdens, stigma, limited caregiving support, and mobility constraints [9,10,11,12]. The presence of facilities does not ensure that people can reach or use them regularly.
Three gaps remain in the literature relevant to this study. First, most studies focus on a single facility type, such as healthcare facilities or parks and green spaces. Multidimensional assessments covering different rehabilitation support needs remain limited. Second, most studies use a single travel mode, a fixed radius, or a fixed road distance. Few compare scenarios such as walking, public transport, and transport provided by caregivers. Third, most studies focus on average accessibility or differences between administrative districts. Few identify where concentrated rehabilitation needs overlap with limited support opportunities at the scale of everyday living environments [13,14].
To address these gaps, this study conducts a multidimensional analysis of rehabilitation support opportunities for persons with mental disabilities at the residential community level in the central urban area of Tianjin. First, rehabilitation support spaces are classified into four types: professional rehabilitation spaces, natural restorative spaces, social interaction spaces, and occupational participation spaces. The functions and inclusion criteria for each facility type are defined. Second, three travel scenarios are established: public transport, walking, and car passenger travel. The Gaussian-enhanced two-step floating catchment area (Gaussian E2SFCA) method is used to measure accessibility for each space type and comprehensive accessibility. Third, population-weighted Lorenz curves, the Gini coefficient, spatial autocorrelation, and local spatial association analyses are combined. These methods assess overall differences in the distribution of rehabilitation support opportunities and their spatial clustering. Finally, the distribution of persons with higher support needs is overlaid with low accessibility to identify residential communities requiring priority intervention. The findings inform strategies for adding facilities, integrating services into communities, and providing compensatory transport support.
This study addresses three research questions: (1) How do accessibility levels and spatial patterns for the four types of rehabilitation support spaces vary across travel modes? (2) Do travel conditions change the distributive equity and spatial clustering of rehabilitation support opportunities? (3) Are there local mismatches among facility locations, transport networks, and the residential distribution of persons with mental disabilities, and which residential communities with high needs and low accessibility should be prioritised for planning intervention?
The remainder of this paper is organised as follows. Section 2 reviews research on mental health rehabilitation support spaces and accessibility measurement. Section 3 introduces the study area, data sources, and analytical framework. Section 4 describes the Gaussian E2SFCA model and the methods for spatial autocorrelation and equity analysis. Section 5 presents the results for accessibility by space type and comprehensive accessibility under the three travel scenarios. Section 6 discusses the theoretical and policy implications, study limitations, and directions for future research. Section 7 presents the conclusions.

2. Literature Review

2.1. Mental Health Rehabilitation Support Spaces

Existing studies examine spaces that support mental health rehabilitation from different perspectives. However, they usually focus on a particular service or setting. Research on professional rehabilitation mainly examines the accessibility and effectiveness of mental healthcare and rehabilitation facilities. Some studies use geographic information systems (GIS) and the two-step floating catchment area method to assess the potential accessibility of mental health service facilities [15,16]. Others show that professional rehabilitation activities in community settings can improve symptoms and social functioning among people with mental disorders. Research on natural restorative spaces focuses on the value of green spaces and outdoor settings for rehabilitation. Twohig-Bennett and Jones found associations between green space exposure and various physical and mental health outcomes [17]. Thompson et al. suggested that outdoor activities in natural environments may improve mental health [18,19]. Qualitative studies also indicate that parks and waterfront spaces can provide environmental support for mental health rehabilitation [20,21,22]. Research on social interaction spaces views public spaces and community settings as the physical basis for social connections. Studies by Townley et al. and Doroud et al. show that experiences of place, daily activities, and a sense of belonging can influence community inclusion and recovery among people with severe mental disorders [9,11]. Research on occupational participation spaces focuses on settings for employment and vocational activities [23]. Modini et al. found that supported employment generally outperforms traditional vocational rehabilitation in helping people with severe mental disorders enter competitive employment [24].
Overall, existing studies demonstrate the value of professional services, natural environments, community public spaces, and vocational support settings for mental health rehabilitation. However, these findings remain scattered across different research fields, including healthcare accessibility, green space and health, community inclusion, and supported employment. A unified understanding of how these spaces support the continuous rehabilitation process is still lacking. Assessing a single facility type is therefore insufficient to determine whether an area provides comprehensive support for symptom stabilisation, everyday recovery, social connections, and the rebuilding of social roles.

2.2. Measuring Accessibility to Rehabilitation Support Spaces

Spatial accessibility reflects an individual’s potential to overcome spatial impedance and access services or activities. It links facility locations, transport conditions, and public service equity [25]. Accessibility measures fall into three categories: distance- or coverage-based methods, gravity models, and the two-step floating catchment area method. Buffer analysis, network service areas, and nearest-facility distance measures quantify spatial proximity. However, they generally assume equal access within a threshold and give limited attention to facility capacity and competition among users. Gravity models combine facility size and distance decay to assess access to multiple facilities. Their results are sensitive to decay parameters and difficult to interpret as service opportunities per person. The two-step floating catchment area (2SFCA) method calculates facility supply-to-demand ratios and sums these ratios at population locations. It integrates facility capacity, the competing population, and spatial impedance, making it widely used in healthcare and park accessibility studies [26,27]. Traditional 2SFCA uses fixed catchment thresholds and uniform weights. Luo and Qi proposed enhanced 2SFCA (E2SFCA), which assigns weights to distance bands to capture declining service opportunities [28]. Later studies introduced Gaussian decay, variable catchment areas, and facility choice probabilities [29,30]. Gaussian E2SFCA applies continuous distance decay to reduce abrupt changes at catchment boundaries.
The reliability of accessibility measurement depends on key assumptions about facility capacity, the competing population, and spatial impedance. Facility capacity should reflect actual service capacity as closely as possible. When capacity data are unavailable, assigning the same value to all facilities measures facility opportunities rather than actual service provision. The competing population should include potential users within each facility’s catchment area. Its definition and spatial scale affect the supply-to-demand ratio. Catchment thresholds and distance-decay functions should reflect facility functions and travel modes. These settings should also be tested through sensitivity analysis. The use of online mapping APIs and public transport network data has shifted accessibility research beyond distance alone. Studies increasingly use travel times across multiple modes based on actual transport networks. Existing research shows that walking, public transport, and motor vehicle travel can produce different accessibility levels, spatial rankings, and equity patterns [31,32,33,34,35].
Despite these methodological advances, most studies still use the general population to represent demand and a single facility type, such as hospitals or parks, to represent supply. Few jointly consider the multiple rehabilitation needs of persons with mental disabilities. Their travel may be affected by functional limitations, travel anxiety, costs, transfer difficulties, and caregiving support. Using a single travel mode or standard driving times may therefore overestimate their access to rehabilitation opportunities. The four types of rehabilitation support spaces also differ in service functions, number, size, and barriers to use. A uniform catchment area or nearest-distance measure cannot fully capture these differences [15,36,37]. Further research should therefore combine fine-scale demand units with travel times across multiple modes. This would allow a closer examination of competition for facilities, distance decay, and differences in equity across rehabilitation support space types [38].

2.3. From Spatial Equality to Needs-Based Equity

Equality and equity are related but distinct concepts in public service allocation. Equality emphasises equal or similar resources and service opportunities across individuals or areas. Equity also considers whether resource allocation reflects population needs and social circumstances [39]. Studies further distinguish between horizontal and vertical equity. Horizontal equity requires similar service opportunities for people with similar needs. Vertical equity calls for greater support for those with higher needs, through either additional resources or easier access to them [40,41,42]. Research on healthcare and public spaces shows that assessments based on average population characteristics or uniform travel capabilities can conceal disadvantages faced by people with limited mobility or greater service needs. Spatial mismatch theory further suggests that local need–opportunity mismatches can occur even when a city has sufficient resources overall. Such mismatches arise when populations with higher needs are concentrated in areas with inadequate facilities or high travel costs [43,44].
Equity in accessibility is mainly assessed through two approaches: analysis of the overall distribution and assessment of spatial matching. Lorenz curves, the Gini coefficient, and the Theil index measure the overall distribution of accessibility opportunities across a population. They summarise inequality but cannot locate units with low accessibility or determine whether these overlap with higher needs [41,45]. Spatial autocorrelation methods test whether accessibility is spatially clustered. Local indicators of spatial association (LISA) and bivariate spatial correlation identify local combinations of needs and opportunities [46]. These methods reveal mismatch locations but do not directly measure overall inequality. Significant clustering does not necessarily indicate inequitable distribution. Measures of overall distribution and methods for identifying local spatial patterns therefore serve different purposes and cannot replace each other.
Needs-based equity concerns both the similarity of opportunities across areas and whether rehabilitation support reaches everyday living environments where needs are concentrated. A more balanced overall distribution does not necessarily mean that areas with concentrated high needs gain better service opportunities. Existing studies mainly examine overall accessibility for the general population or spatial differences in a single public facility type. Few combine multiple rehabilitation space types, travel modes, overall distribution, and local needs matching at the scale of residential units. This gap also limits the use of research findings to identify specific targets for planning intervention [16,47].

3. Study Area and Data

3.1. Study Area

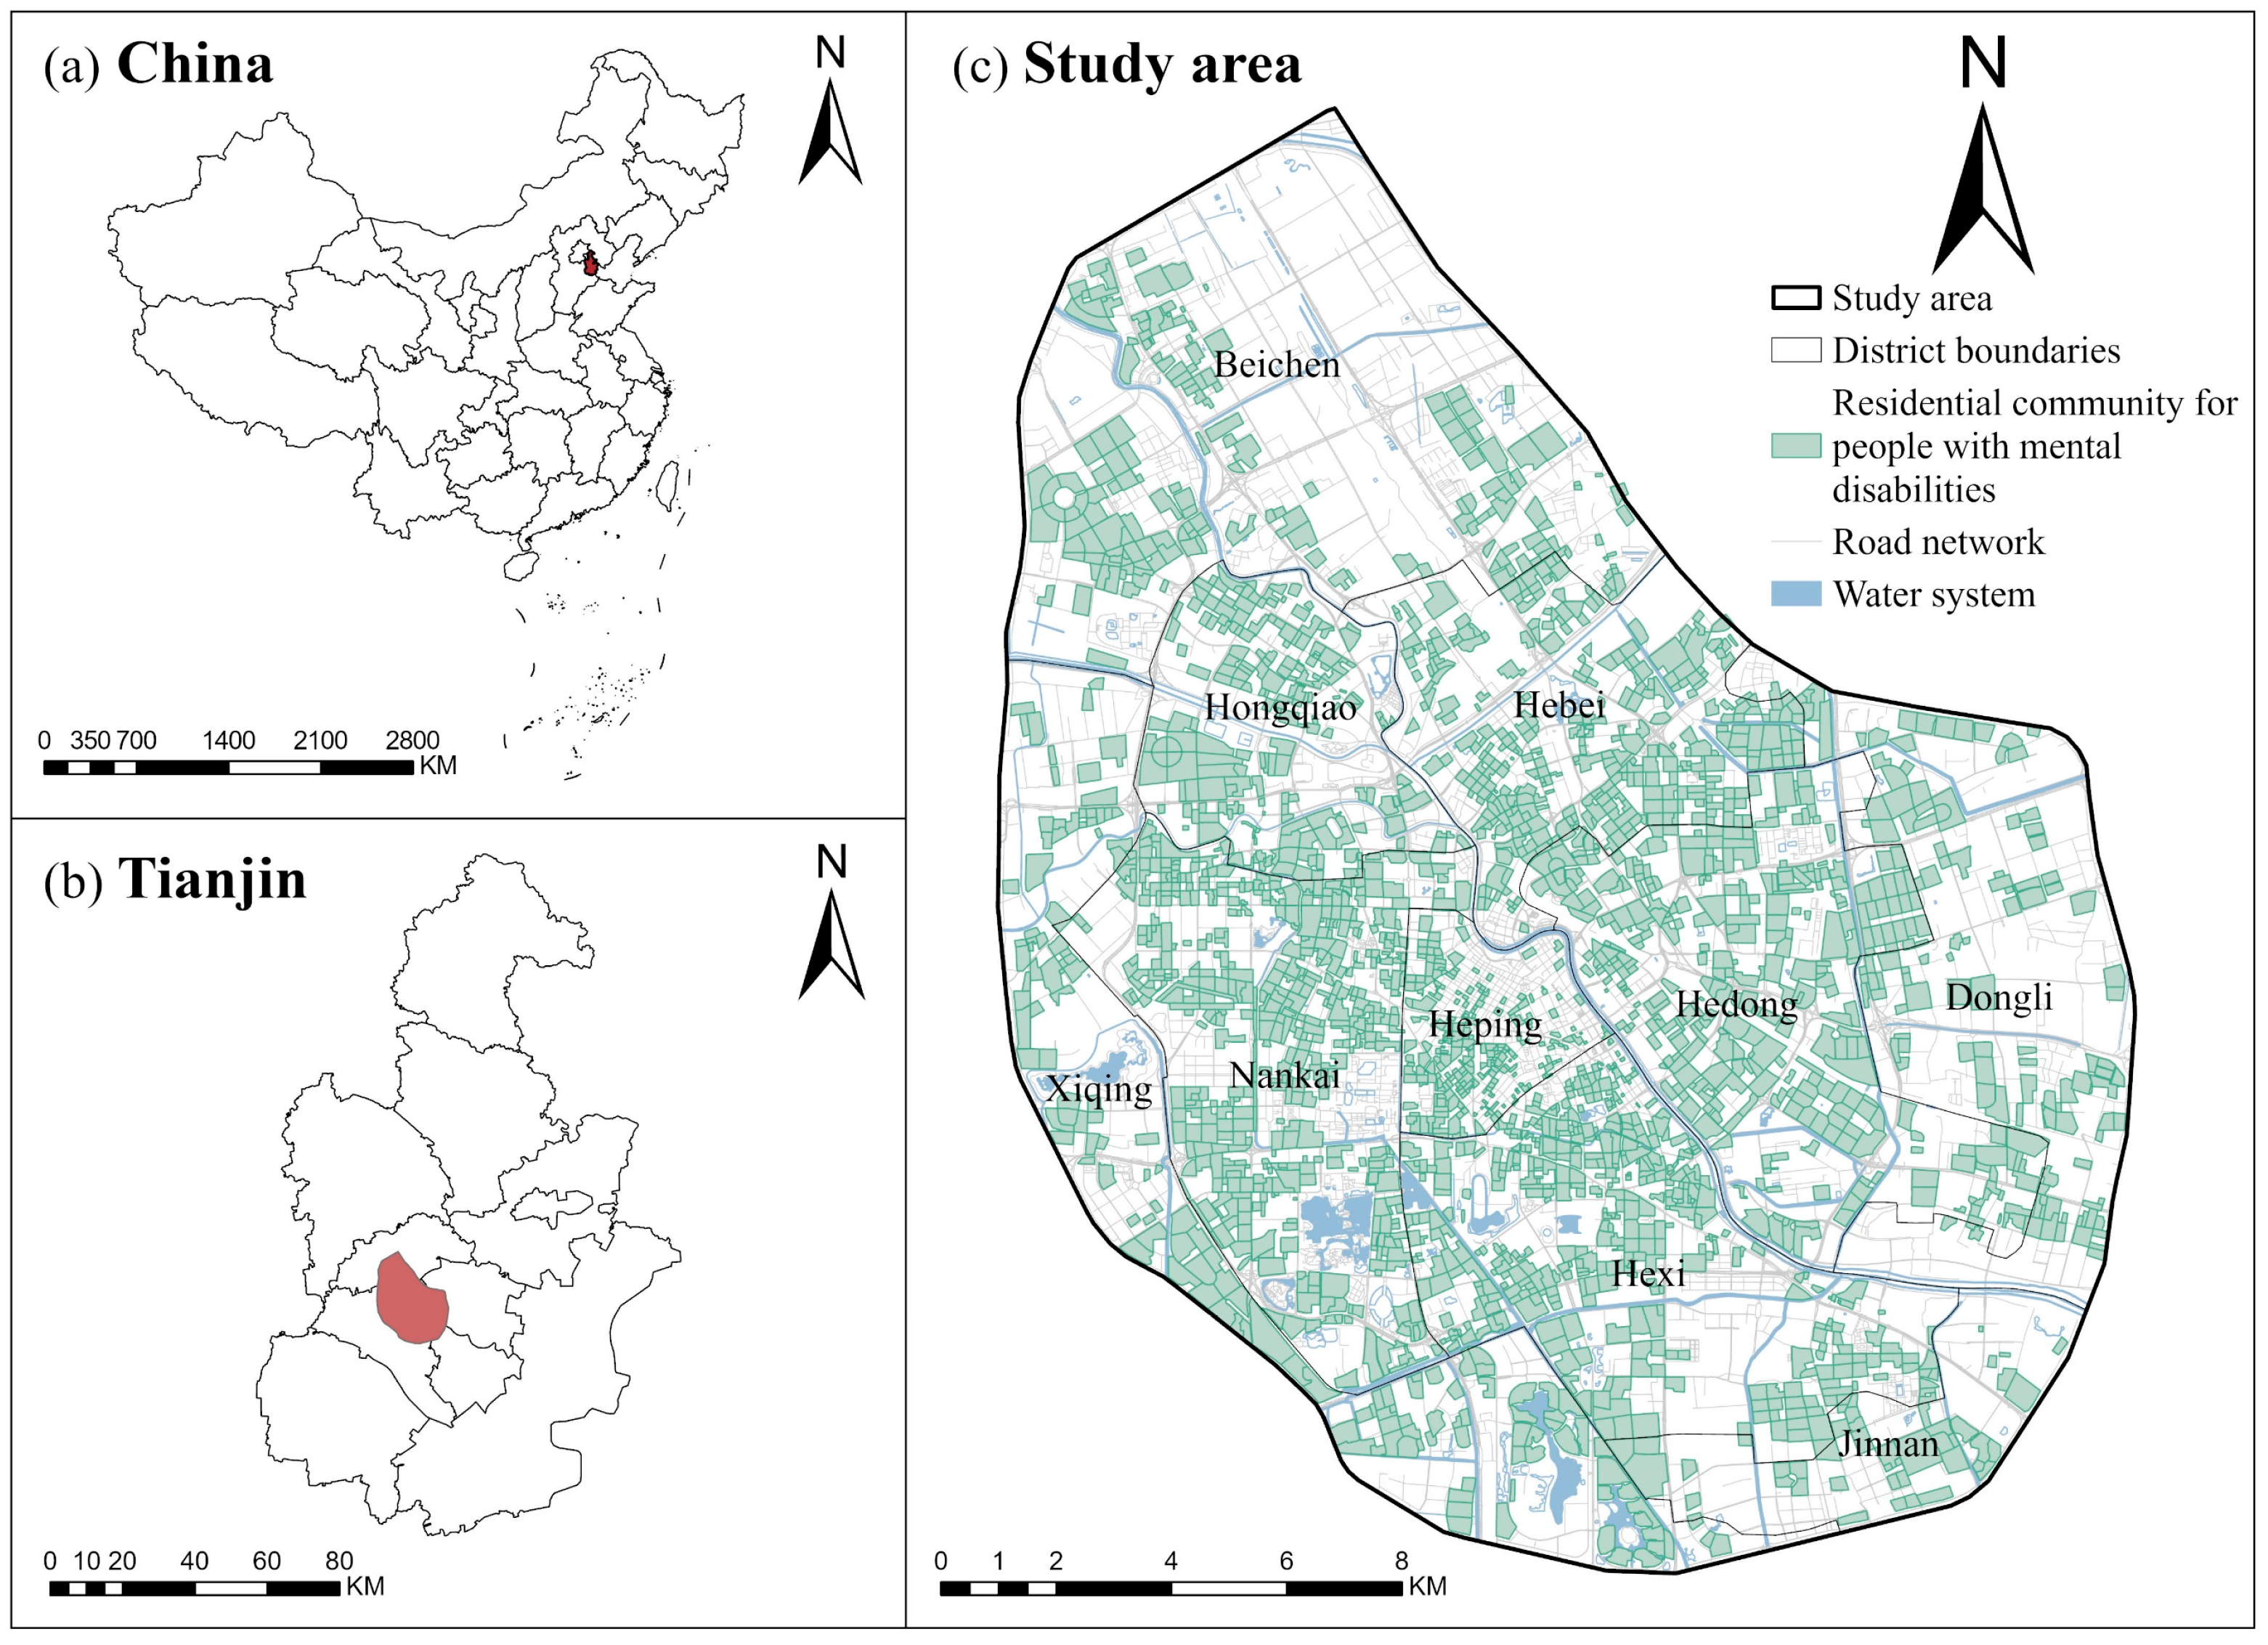
This study focuses on the central urban area of Tianjin within the Outer Ring Road. It covers six districts—Heping, Hedong, Hexi, Nankai, Hebei, and Hongqiao—and parts of Dongli, Xiqing, Jinnan, and Beichen (Figure 1). The study area includes the traditional urban core, concentrations of public services, and residential areas built in different periods. Urban functions, land use, and residential environments vary considerably within this area [48]. Diverse rehabilitation resources are concentrated here, including mental healthcare facilities, urban parks, community public services, and employment support facilities. This setting allows an examination of spatial complementarity and functional differences across facility types. The old urban core, established residential areas, and peripheral urban developments coexist. Population distribution, road networks, public transport, and facility provision show marked spatial differences. These conditions help reveal spatial mismatches between rehabilitation resource supply and the needs of persons with mental disabilities. The extensive walking and public transport networks also provide a suitable setting for comparing accessibility to rehabilitation support spaces across travel scenarios. Residential communities are used as demand units to reflect the actual residential origins of trips made by persons with mental disabilities. This allows more detailed accessibility measurement and local spatial identification.

3.2. Data

3.2.1. Demographic Data

Population data on persons with mental disabilities were obtained from the Tianjin Disabled Persons’ Federation’s 2020 register of certified persons with disabilities. The records included age, disability grade, and residential address. Boundary data for 2484 residential communities were obtained from Fang.com. The study included certified persons with mental disabilities living within the study area. Individual records were mapped to residential communities through address standardisation, geocoding with the Amap API, and GIS spatial matching using ArcGIS Pro 3.4.2. After address correction and manual verification, 17,325 valid records were retained, with a matching rate of 99.78%. These records were aggregated across 1938 residential communities. Each community’s population-weighted representative point was used as the origin for travel analysis.
Mental disability was recorded in the original dataset using four disability grades (Grades I–IV). The study population included 1522 persons with Grade I disabilities, 9520 with Grade II disabilities, 5302 with Grade III disabilities, and 981 with Grade IV disabilities. Grades I and II represent extremely severe and severe disabilities, respectively. Persons in these categories face greater limitations in self-care, social interaction, and social participation. They require comprehensive or extensive support in their daily lives. Grades I and II were therefore combined into a group with higher support needs. Grades III and IV were combined into a group with lower support needs. These groups were used for local need–accessibility screening.

3.2.2. Rehabilitation Support Space Data

Data on rehabilitation support facilities were obtained from Amap points of interest (POIs) collected in 2026. The classification drew on recovery-oriented theory, community rehabilitation, and social determinants theory. It also incorporated research on mental health rehabilitation, community inclusion, restorative environments, and supported employment. Rehabilitation support needs among persons with mental disabilities were grouped into four dimensions: professional treatment and functional support, restorative environments and daily activities, social connections and community participation, and occupational roles and economic participation. Accordingly, rehabilitation support spaces were classified into four types: professional rehabilitation spaces, natural restorative spaces, social interaction spaces, and occupational participation spaces (Figure 2).
Professional rehabilitation and occupational participation spaces mainly provide services that are directly related to rehabilitation, functional support, vocational training, or employment support for persons with mental disabilities. Natural restorative and social interaction spaces, including parks, libraries, cultural centres, and sports centres, are open public resources that are also used by the general population. In this study, these spaces are included because they provide environmental restoration, opportunities for daily activity, social contact, and community participation that may support mental health recovery. They are therefore treated as rehabilitation support opportunities rather than as facilities exclusively reserved for persons with mental disabilities.
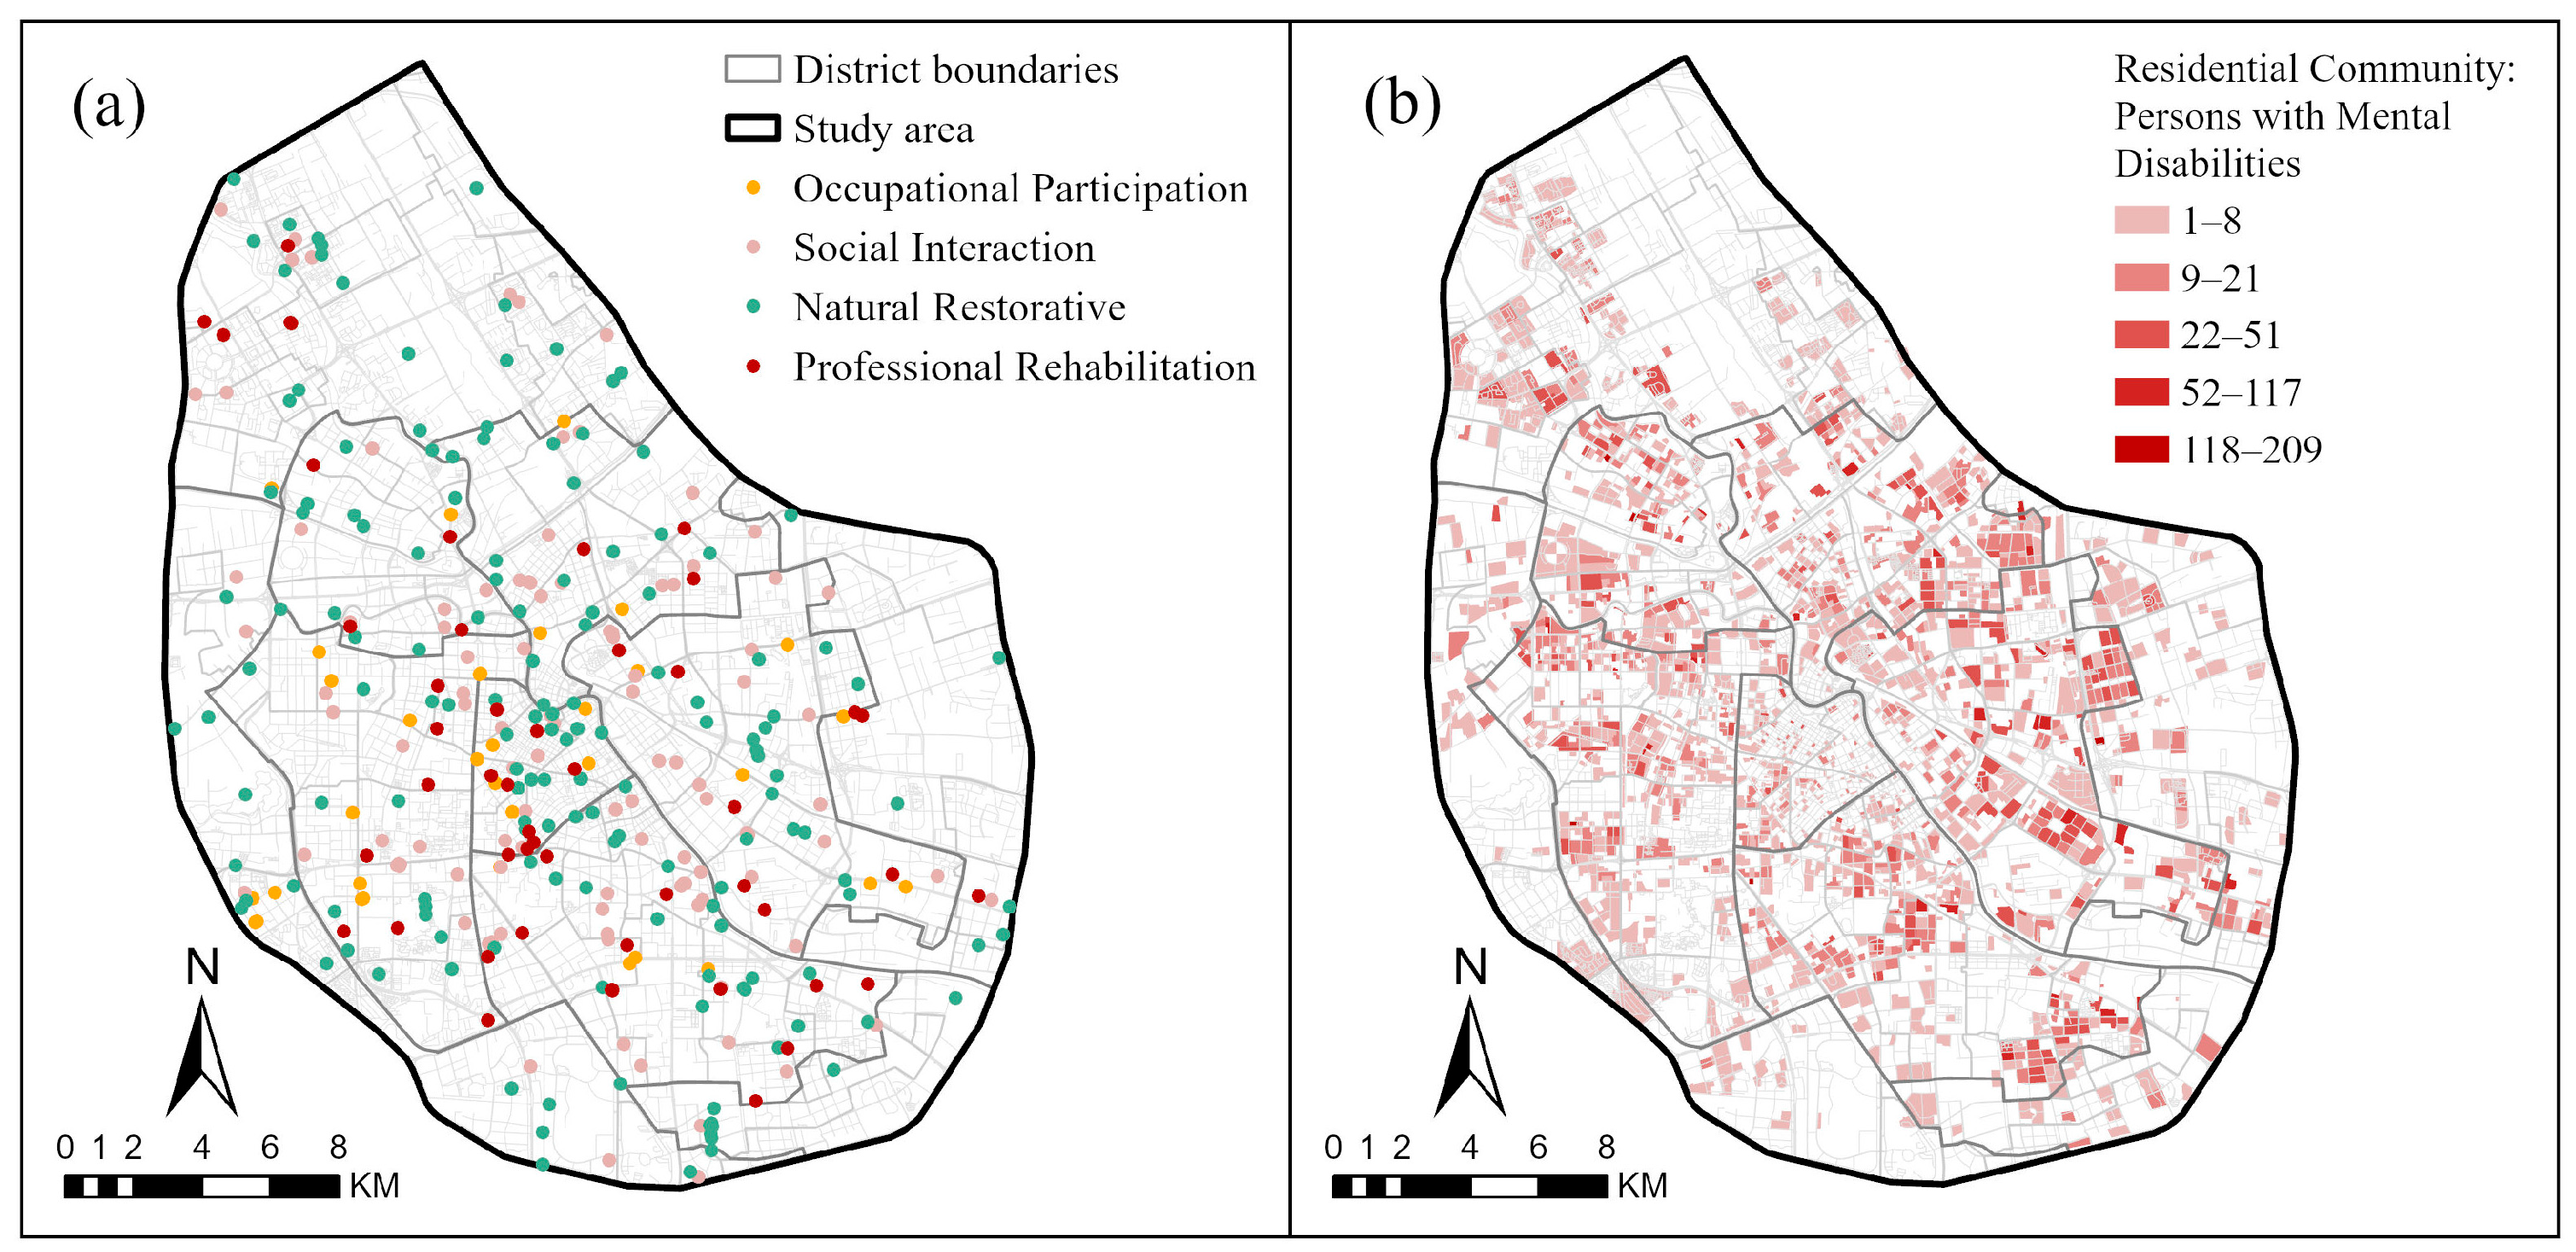
The POI dataset was clipped to the study area. Duplicate records were removed, names and addresses were verified, and facilities were screened by function. The final dataset contained 346 rehabilitation support facilities: 51 professional rehabilitation spaces, 154 natural restorative spaces, 107 social interaction spaces, and 34 occupational participation spaces. Table 1 presents the specific facility types and inclusion criteria for each category. Figure 3 shows the spatial distribution of the study sample and the four types of mental health rehabilitation support spaces.

3.2.3. Travel Time Data

This study used each residential community’s population-weighted representative point as the origin and rehabilitation support facilities as destinations. Route information was obtained through the Amap Web Service API to construct origin–destination (OD) travel time matrices [49]. These matrices represented spatial impedance between residential communities and facilities. Three travel scenarios were defined to reflect the travel conditions of persons with mental disabilities: public transport, walking, and car passenger travel. Public transport and walking represent basic modes that persons in the study population can use relatively independently. Car passenger travel includes transport provided by family members or caregivers, taxis, and ride-hailing services. It does not imply that persons in the study population drive themselves [31,33].
Data collection strategies varied by travel mode to account for route characteristics and API requirements. Car passenger travel times were obtained using the multiple-origin function of the Amap distance measurement API. For walking, a candidate catchment was first defined using a 3 km straight-line distance threshold. Travel times within this catchment were then obtained through the walking route planning API. Travel times for OD pairs outside this catchment were treated as exceeding the 30 min walking threshold. For public transport, OD pairs were sampled by facility type and origin–destination distance. Travel times for the sampled pairs were obtained through the Amap public transport route planning API. These data were used to develop a model that predicted travel times for the remaining OD pairs. API-derived and predicted times were then combined into a public transport travel time matrix. The resulting three OD travel time matrices—for public transport, walking, and car passenger travel—served as spatial impedance inputs for the Gaussian E2SFCA model.

4. Methods

4.1. Accessibility Measurement Using Gaussian E2SFCA

This study uses the Gaussian-enhanced two-step floating catchment area (Gaussian E2SFCA) method to measure residential communities’ potential accessibility to four types of rehabilitation support spaces. Demand is represented by the population of persons with mental disabilities in each residential community. Supply consists of professional rehabilitation, natural restorative, social interaction, and occupational participation facilities. Spatial impedance is represented by OD travel times under public transport, walking, and car passenger travel scenarios. Traditional 2SFCA uses binary distance decay. Gaussian decay instead captures a continuous decline in facility attraction as travel time increases. E2SFCA also considers facility supply, competition for services, and spatial impedance together. It is therefore more suitable than nearest-facility distance measures for comparing relative accessibility across facility types and travel modes [30,50].
Accessibility is calculated in two steps using Gaussian decay weights derived from travel times between residential communities and facilities:
W t ij = e − 1 2 t ij t 0 2 − e − 1 2 1 − e − 1 2 , t ij ≤ t 0 0 , t ij > t 0
Here, t0 is the mode-specific time threshold. It is set at 30 min for walking and 60 min for public transport and car passenger travel. These thresholds are applied uniformly across the four space types as mode-specific scenarios to ensure comparability. The function equals 1 when travel time is zero. It decreases continuously as travel time increases and reaches zero at the threshold.
The first step searches for residential communities that can reach facility j within the time threshold. A target-population opportunity-to-demand ratio is then calculated:
R j = S j ∑ k ∈ C ( j ) P k ⋅ W t kj
Here, Sj represents facility service capacity, uniformly set to 1 in the baseline model. Pk is the total population of persons with mental disabilities in residential community k. C(j) is the set of residential communities that can reach the facility within the time threshold. The denominator represents potential demand weighted by the travel-time decay function. The demand denominator in the baseline Gaussian E2SFCA model includes only persons with mental disabilities. This definition was selected because the purpose of the study is to compare the relative distribution of rehabilitation support opportunities available to the target population across residential communities. For professional rehabilitation and occupational participation spaces, this demand definition corresponds directly to the intended service population. For natural restorative and social interaction spaces, which are shared with the general population, the resulting measure does not estimate actual availability after competition from all users. Instead, it represents the relative potential accessibility of these public support opportunities from the perspective of persons with mental disabilities.
The second step sums the supply-to-demand ratios of all facilities of the same type that a given residential community can reach within the time threshold:
A i = ∑ j ∈ F ( i ) R j ⋅ W t ij
Here, F(i) is the set of facilities of the same type reachable from residential community i within the time threshold. Ai represents accessibility for that space type. Higher values indicate greater potential to obtain that type of rehabilitation support after accounting for competition for facilities and travel time. These calculations are performed separately for each combination of three travel modes and four facility types, producing 12 sets of accessibility estimates.
To compare space types, accessibility values for each type are normalised to a 0–1 scale by dividing by the maximum value within each travel mode. The normalised values are then combined with equal weights to calculate comprehensive accessibility. This index reflects only the overall pattern and relative ranking within each travel mode. It does not replace space-specific results. A high comprehensive value may still conceal a substantial lack of access to a particular type of rehabilitation support space.

4.2. Spatial Autocorrelation and Local Spatial Mismatch

Spatial autocorrelation analysis identifies spatial clustering in rehabilitation support opportunities. It also reveals spatial matching between rehabilitation resource supply and the needs of persons with mental disabilities. Global Moran’s I assesses whether a variable exhibits spatial clustering across the study area. Bivariate local indicators of spatial association (bivariate LISA) examine the spatial relationships between needs and opportunities at the local level.
Global Moran’s I is calculated for comprehensive accessibility under the three travel scenarios to identify spatial clustering in overall rehabilitation support opportunities. Spatial weights are defined using a row-standardised eight-nearest-neighbour matrix. Statistical significance is assessed using 999 random permutations.
Bivariate LISA is then used to examine local spatial associations between comprehensive accessibility and the needs of persons with mental disabilities under the three travel scenarios. This analysis identifies need–opportunity mismatches across the rehabilitation support system as a whole. Bivariate local Moran’s I is calculated as follows:
I i = z i P ∑ j w ij z j A
Here, z i P is the standardised population of persons with mental disabilities in residential community i, representing local rehabilitation demand. z j A is the standardised accessibility value for neighbouring community j, representing overall rehabilitation support opportunities in the surrounding area. wij denotes the spatial weight between the two communities in the row-standardised spatial weights matrix.
Local statistical significance was assessed using 999 random permutations with a two-sided pseudo-p threshold of 0.05. To account for multiple testing across the 1938 residential communities, the local pseudo-p values were adjusted using the Benjamini–Hochberg false discovery rate (BH-FDR) procedure, with q < 0.05 considered statistically significant.
Residential communities are classified into four association types based on local demand and neighbouring accessibility: high–high, high–low, low–high, and low–low. The high–low type indicates high local demand among persons with mental disabilities but limited rehabilitation support opportunities in surrounding communities. This is the main type of local mismatch examined in this study. Communities with non-significant local statistics are labelled as not significant.

4.3. Equity Analysis

This study assesses equity in mental health rehabilitation support spaces at two levels: overall distribution and spatial matching with needs. The assessment of overall distributive equity examines differences in accessibility across all persons with mental disabilities. Needs-based spatial equity identifies residential communities where persons with higher support needs are concentrated but rehabilitation support opportunities are limited. The former measures overall inequality. The latter identifies equity concerns in specific spatial units.

4.3.1. Overall Distributive Equity

For each accessibility indicator, residential communities are ranked from lowest to highest accessibility. The population of persons with mental disabilities is used as the weight. Cumulative population shares and cumulative shares of accessibility opportunities are then calculated to construct population-weighted Lorenz curves. Cumulative accessibility opportunities are obtained by summing the products of each community’s population of persons with mental disabilities and its accessibility value. A curve closer to the 45° line of perfect equality indicates a more even distribution of rehabilitation support opportunities across the population. Greater deviation indicates a higher concentration of opportunities. The population-weighted Gini coefficient is then calculated using the trapezoidal method:
G = 1 − ∑ i = 1 n P i − P i − 1 L i + L i − 1
Here, n is the number of residential communities. Pi is the cumulative population share, and Li is the corresponding cumulative share of accessibility opportunities, with P0 = L0 = 0. G ranges from 0 to 1. Values closer to 0 indicate a more even distribution, while values closer to 1 indicate a greater concentration of opportunities.

4.3.2. Needs-Based Spatial Equity

This analysis identifies residential communities where rehabilitation needs are concentrated but support opportunities are relatively limited. Relative need intensity is measured by the proportion of persons with Grade I or II mental disabilities among all persons with mental disabilities in each community:
H i = P i , 1 + P i , 2 P i
Here, Hi is the proportion of persons with higher support needs in residential community i. Pi,1 and Pi,2 are the numbers of persons with Grade I and Grade II mental disabilities, respectively. Pi is the total population of persons with mental disabilities in that community. All accessibility measures use the full population of persons with mental disabilities to represent demand. Disability grades are used only to characterise the distribution of support needs within each community. Accessibility is not calculated separately for groups with higher and lower support needs.
H i ≥ Q 75 ( H ) ,   A i ≤ Q 25 ( A )
This rule is applied separately to accessibility for each of the four space types and comprehensive accessibility under public transport, walking, and car passenger travel scenarios. It provides a relative screening method for planning purposes, rather than a test of statistical significance. The 75th and 25th percentiles are derived from the corresponding distributions within the study area. They are neither clinical thresholds for needs nor universal policy standards. The screening identifies residential communities requiring further investigation. Actual interventions also require consideration of facility capacity, land conditions, residents’ preferences, and implementation costs.
To clarify the relationship between the Q75–Q25 screening and bivariate LISA, we cross-tabulated the communities identified as having a high proportion of persons with higher support needs and low comprehensive accessibility against those classified as significant high–low clusters in the bivariate LISA under each travel scenario.

5. Results

5.1. Accessibility by Space Type and Comprehensive Accessibility Across Three Travel Modes

5.1.1. Public Transport

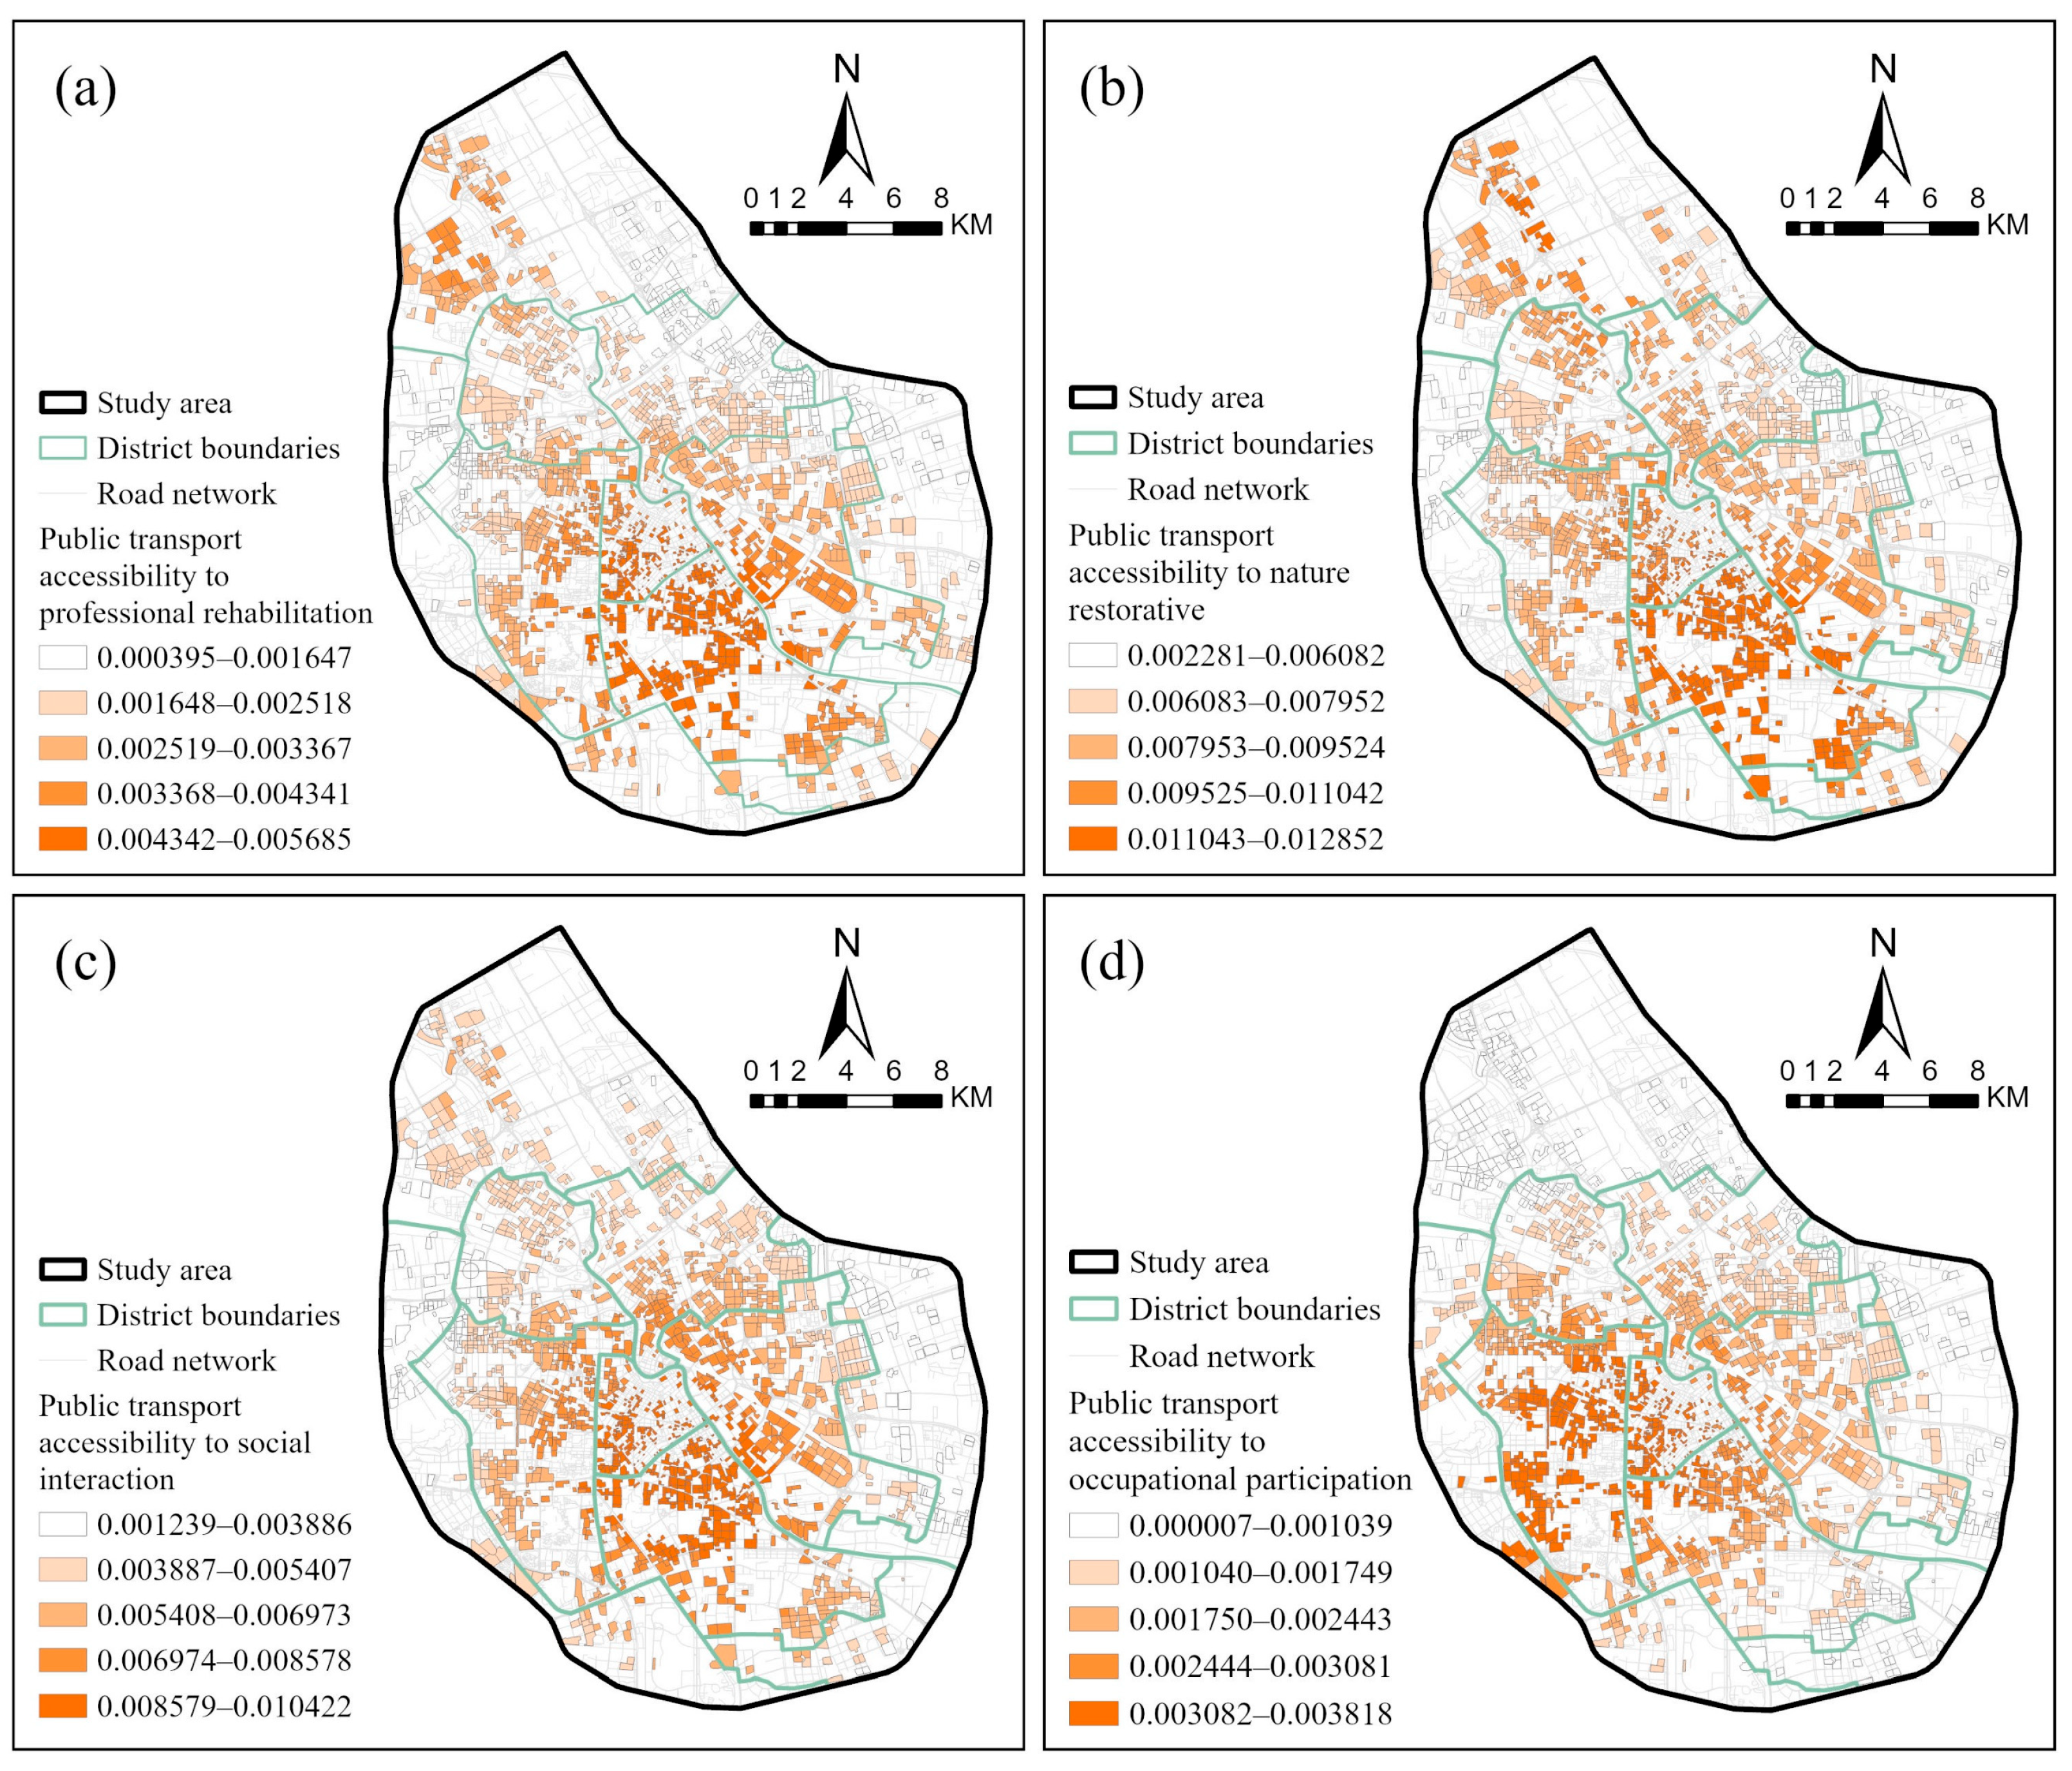
Under the public transport scenario, all 1938 residential communities had access to all four types of rehabilitation support spaces. However, accessibility varied considerably across space types. Access to natural restorative and social interaction spaces was generally better than access to professional rehabilitation and occupational participation spaces. Full spatial coverage did not mean that every community had sufficient rehabilitation support.
Accessibility across the four space types generally followed a continuous spatial gradient. Values were higher in central and southern areas and lower in northern and peripheral areas. However, the extent and shape of high-accessibility areas differed. High accessibility to professional rehabilitation spaces was mainly concentrated in Yuexiu Road and Guajiasi subdistricts in Hexi District, forming relatively continuous clusters. High accessibility to natural restorative spaces extended over a wider area. A continuous belt covered Guajiasi, Jianshan, Yuexiu Road, and Youyi Road subdistricts. High accessibility to social interaction spaces was concentrated in Heping and Hexi districts, with contiguous areas across Yuexiu Road, Taoyuan, and Xiawafang subdistricts. Accessibility to occupational participation spaces showed the strongest spatial concentration. High values were mainly found in Heping and Nankai districts, forming several connected nodes in Xuefu, Wanxing, Nanyingmen, and Xinxing subdistricts. Values were lower in Beicang and Jixianli subdistricts in Beichen District. Overall, public transport expanded facility coverage but did not eliminate the centre–periphery gap. The limited number and concentrated distribution of occupational participation facilities remained a major gap in provision (Figure 4).

5.1.2. Walking

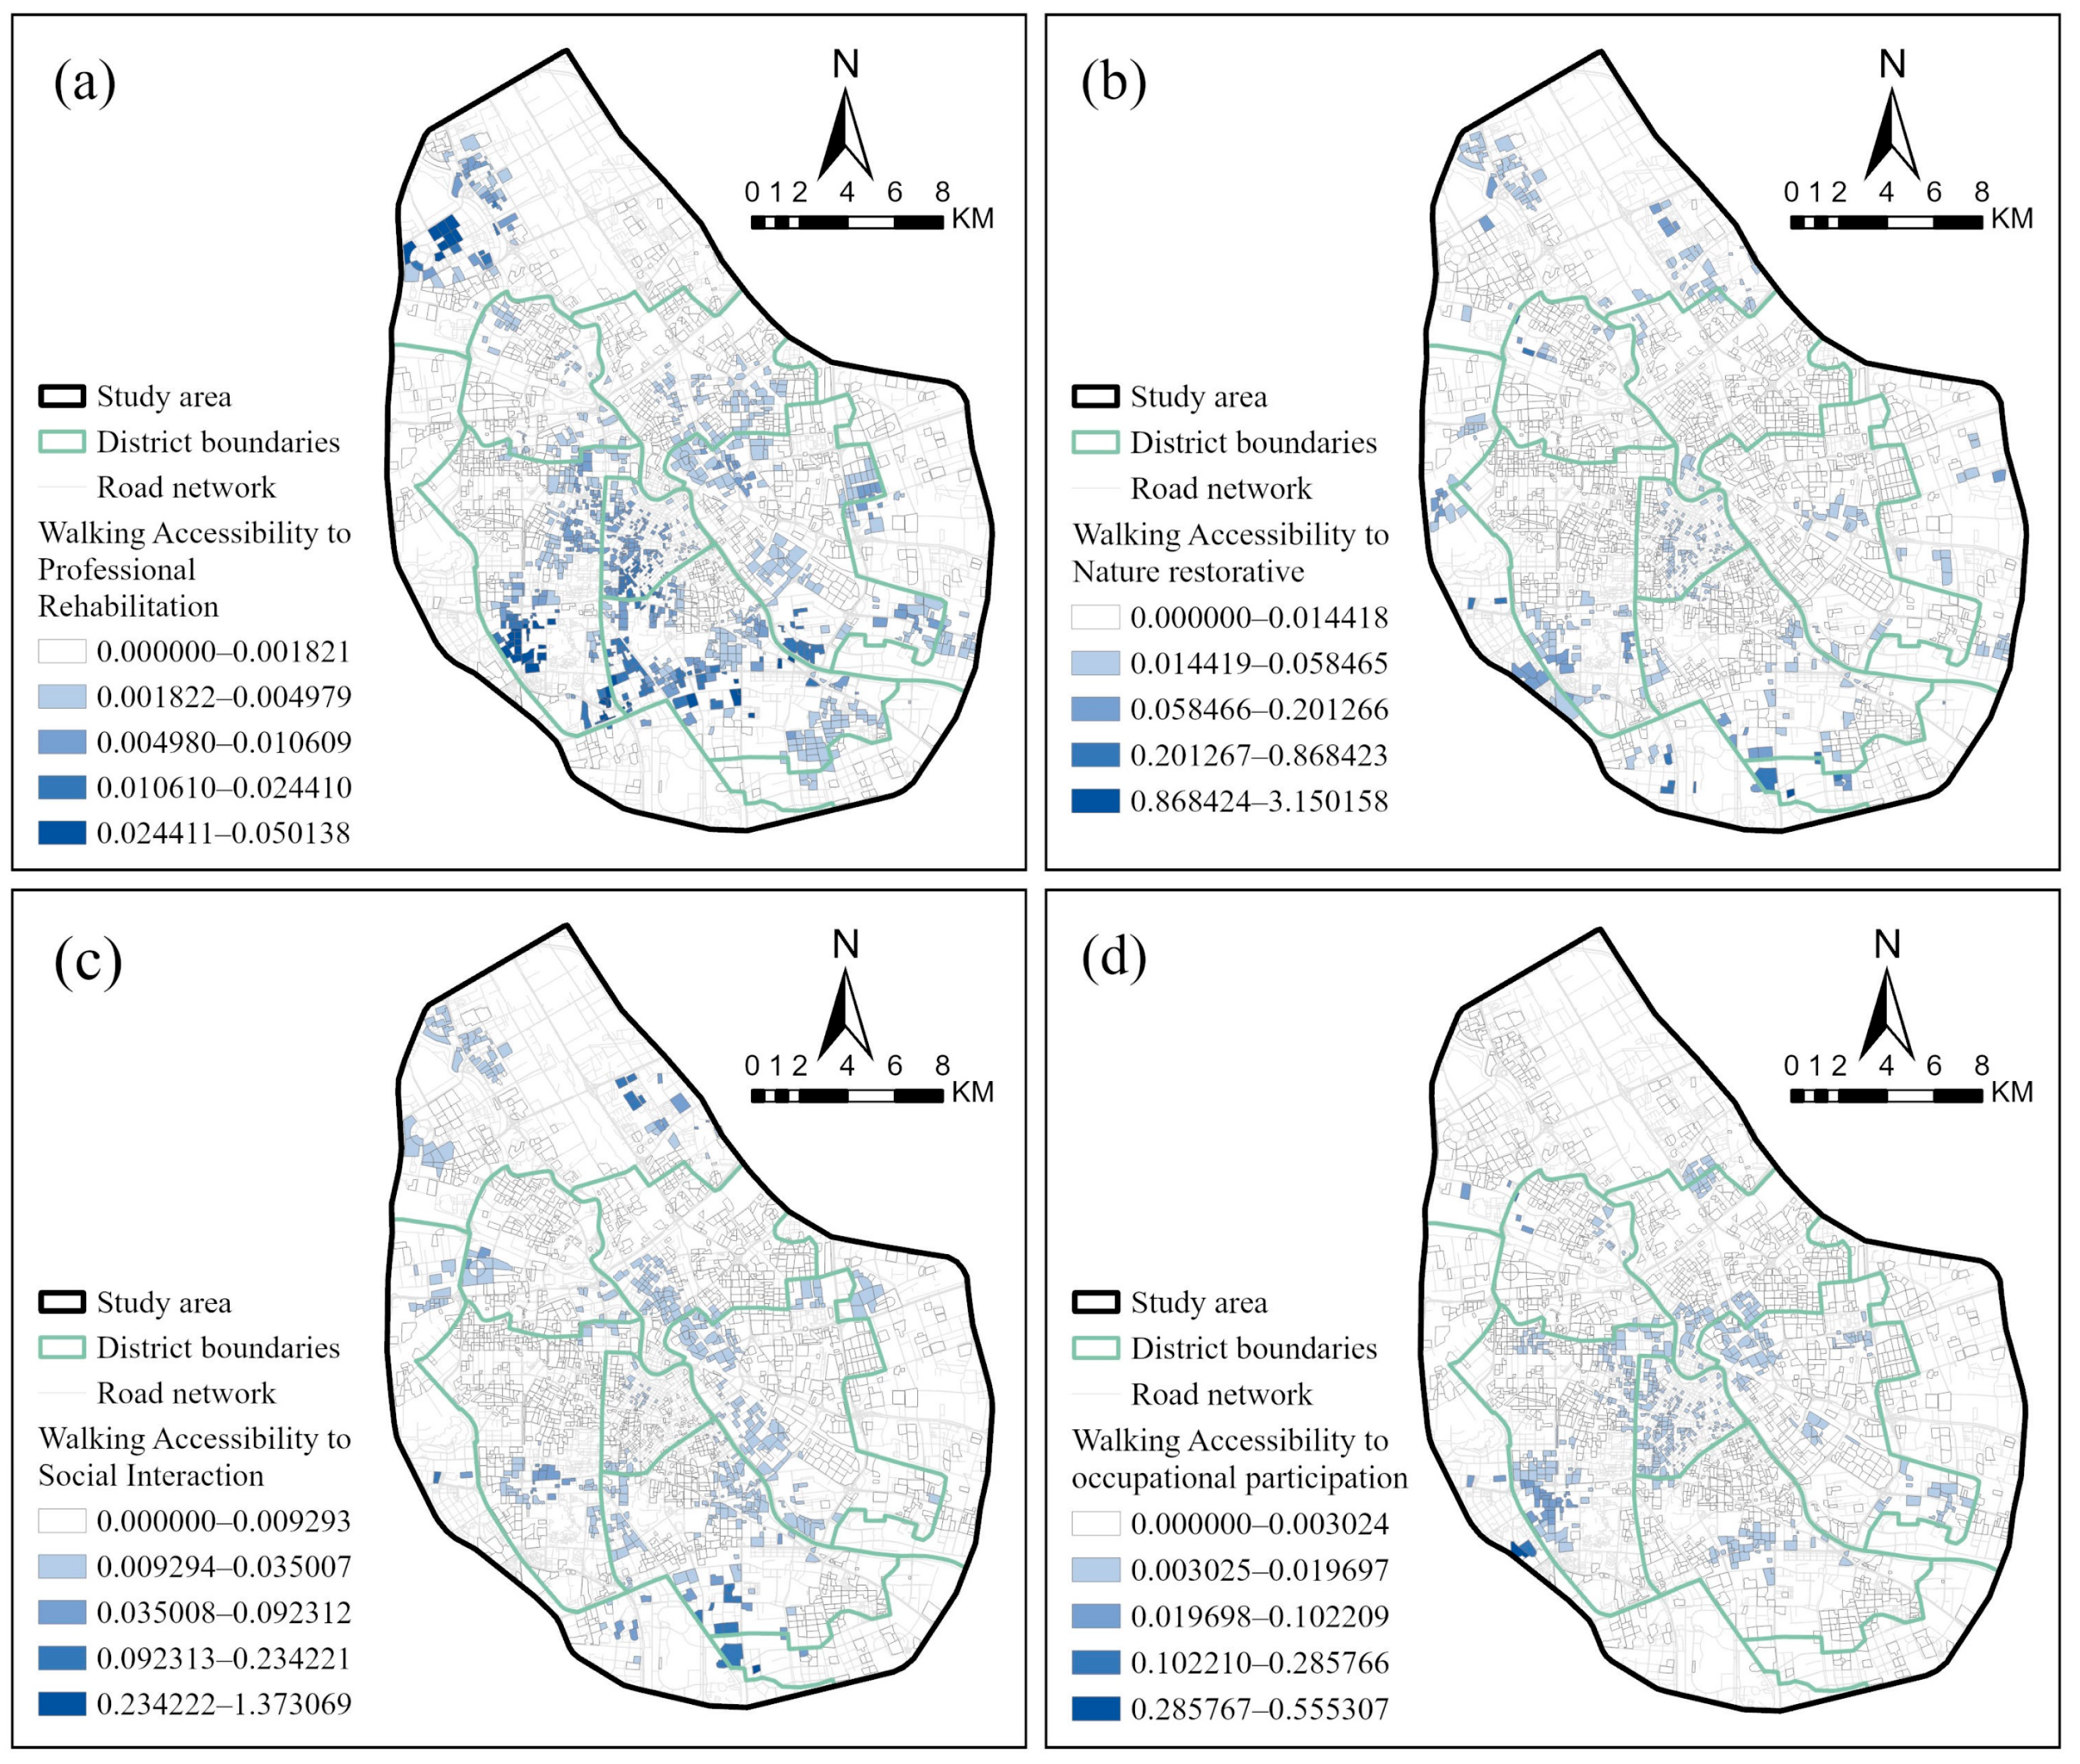
Under the walking scenario, accessibility shifted from a continuous gradient to fragmented neighbourhood patches. This pattern revealed gaps in provision within the neighbourhoods where basic daily activities take place. Walking accessibility was lower than public transport accessibility for all four types of rehabilitation support spaces. For each space type, some persons had no access within the walking threshold. The number of persons with zero accessibility was highest for occupational participation spaces (7752), followed by professional rehabilitation spaces (4718). The corresponding figures for social interaction and natural restorative spaces were 1906 and 799. Occupational participation and professional rehabilitation therefore represented the main gaps in provision at the neighbourhood level.
High walking accessibility formed isolated clusters. Only a few communities near facilities and their entrances had good access to rehabilitation opportunities. High-accessibility clusters for professional rehabilitation spaces were concentrated in Ruijing Subdistrict in Beichen District and Tiyuzhongxin and Shuishanggongyuan subdistricts in Nankai District. Accessibility to natural restorative spaces was largely shaped by park locations. Local peaks occurred in Zhongbei Town and in the Shuishanggongyuan and Beicang subdistricts. The maximum value of 3.150 far exceeded the study area median of 0.00583. This indicates that high accessibility was limited to some communities near green spaces where competition among potential users was low. Local peaks did not imply high service levels across an entire administrative district. High-accessibility patches for social interaction spaces were mainly located in Xuefu and Shuishanggongyuan subdistricts in Nankai District and Xiawafang and Tianta subdistricts in Hexi District. Occupational participation spaces showed the clearest pattern of isolated high-accessibility clusters. Only a few high-value nodes appeared in Wangdingdi, Xiaobailou, and Nanyingmen subdistricts. No communities in Fengnian, Jinzhong, Beicang, or Guoyuanxincun subdistricts could access these facilities within the walking threshold. Walking therefore reshaped the spatial distribution of rehabilitation opportunities, rather than merely lowering accessibility relative to public transport. Proximity to facilities, entrance locations, and road network connectivity directly determined access to resources. Accessibility declined rapidly beyond these isolated clusters, leaving extensive areas with low or zero accessibility (Figure 5).

5.1.3. Car Passenger Travel

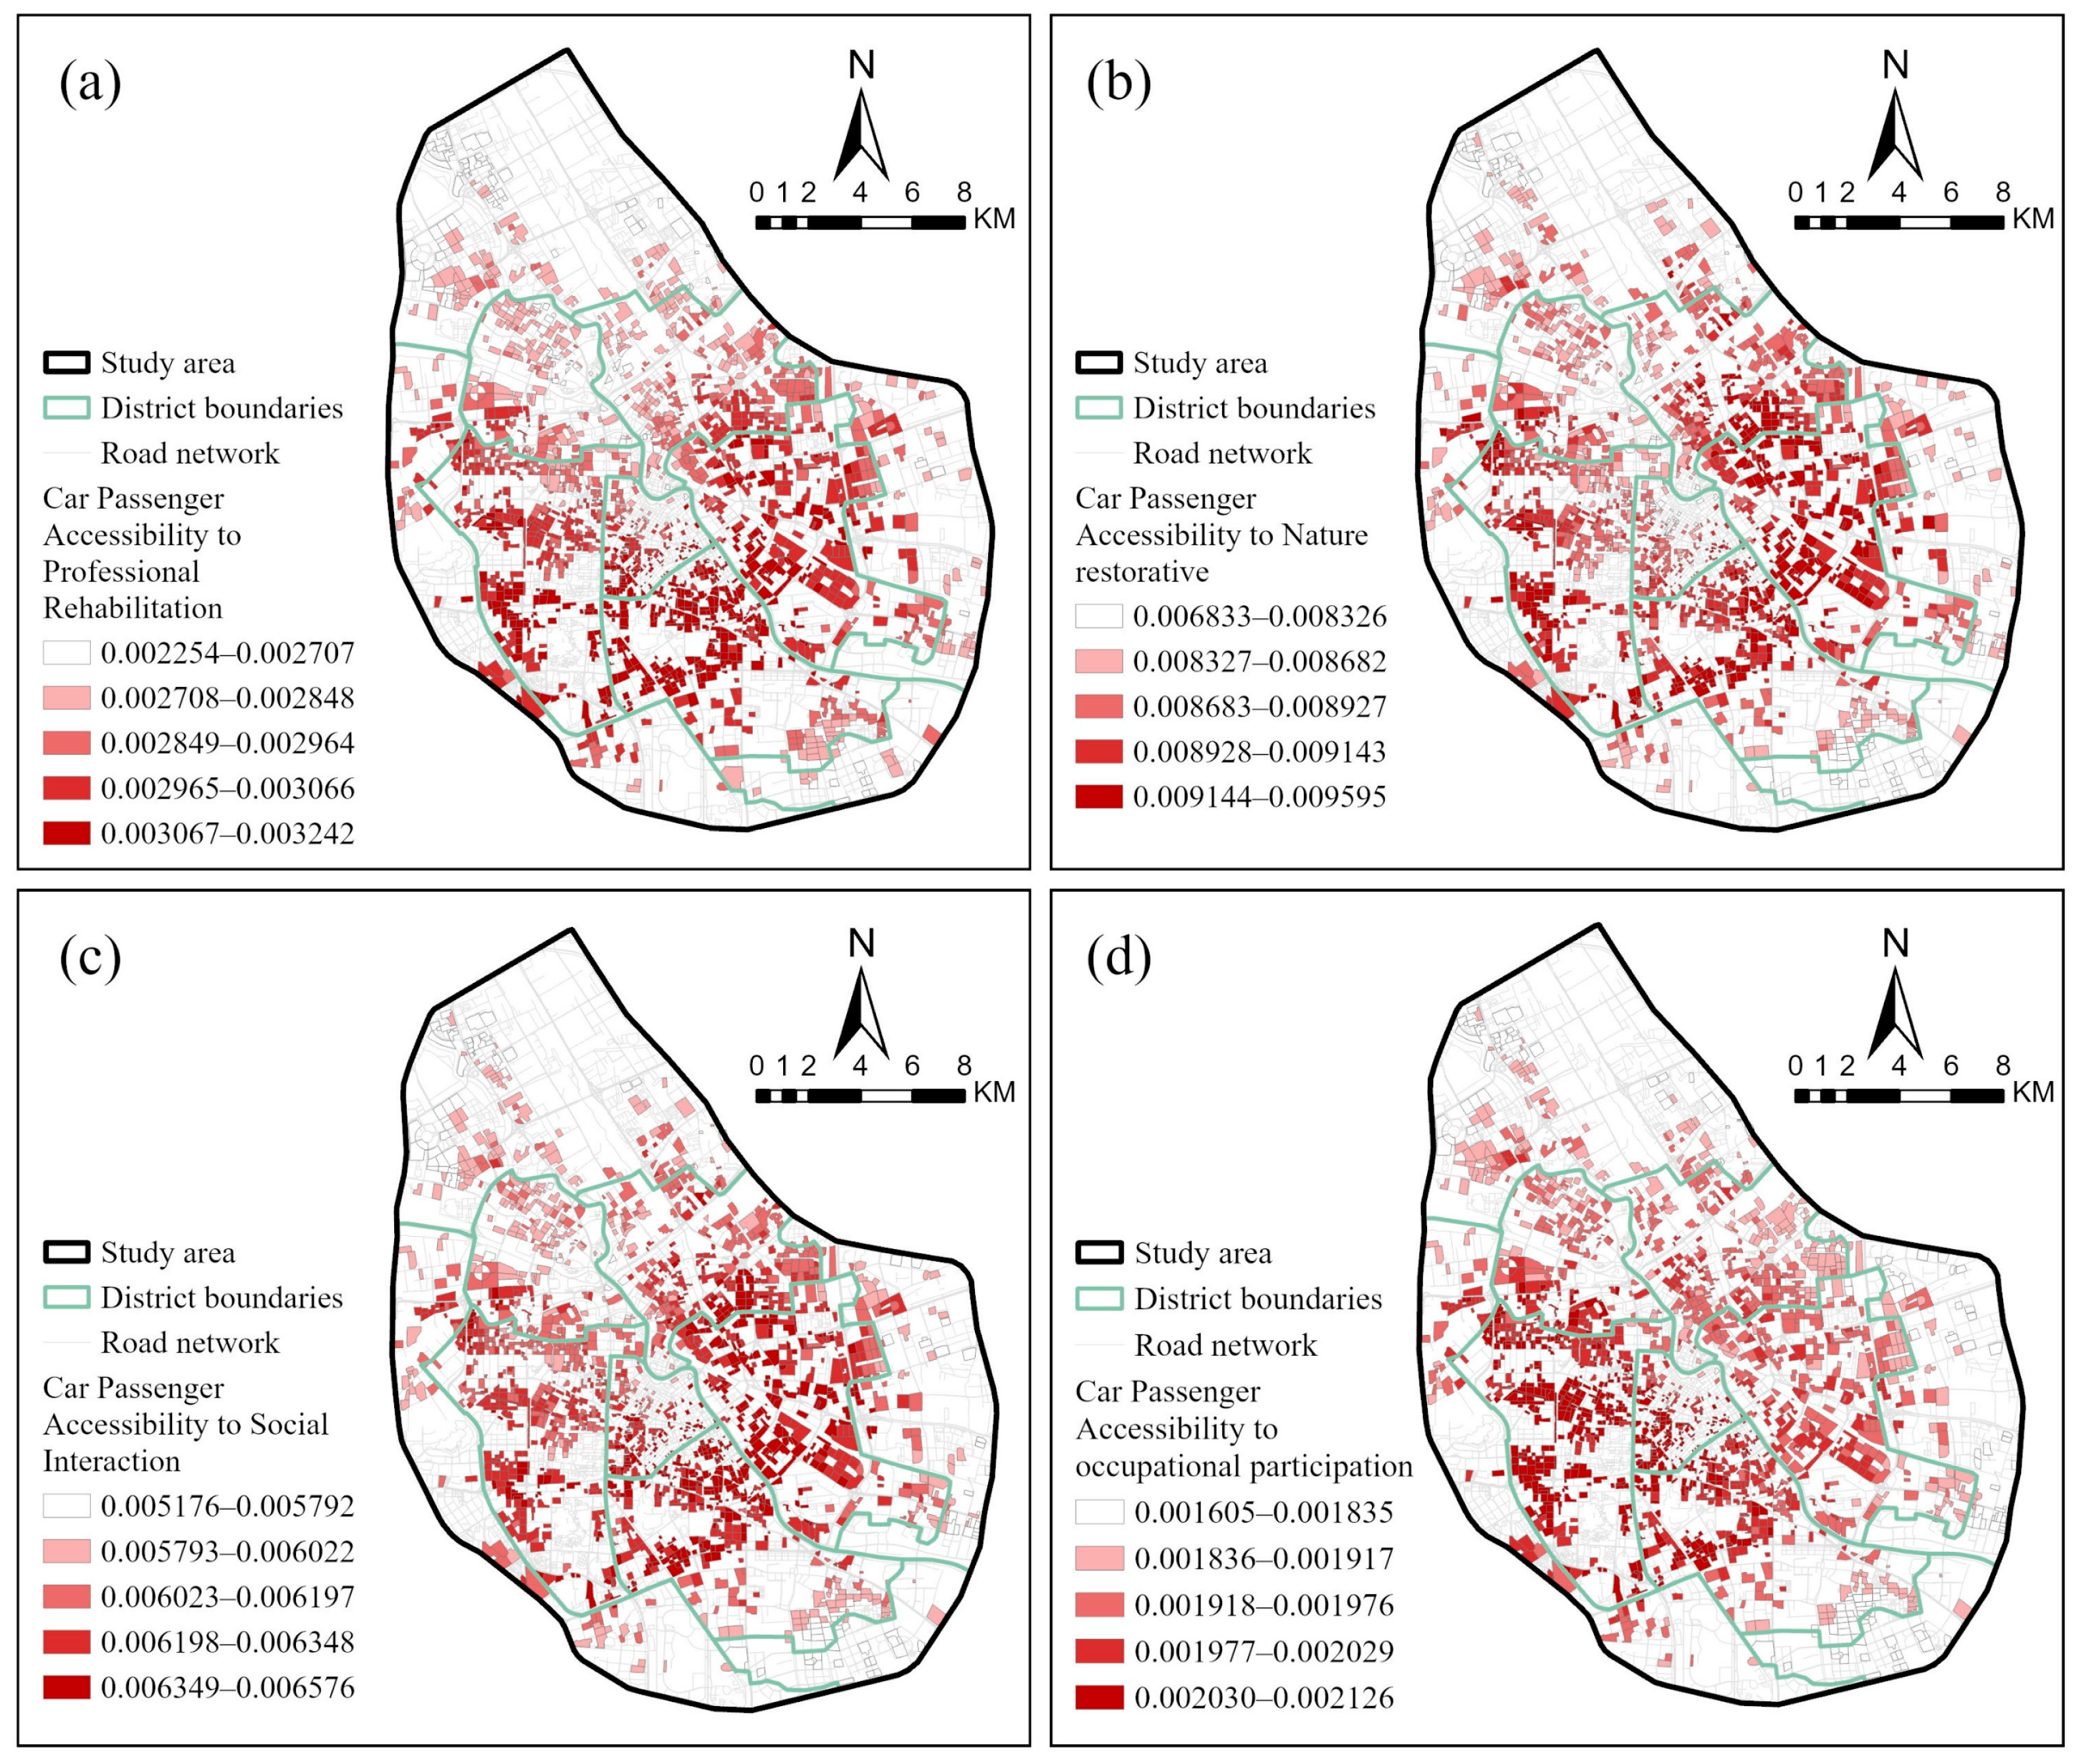
Under the car passenger scenario, motor vehicle travel substantially expanded facility catchment areas. All residential communities had non-zero accessibility to each of the four types of rehabilitation support spaces. Variation between communities narrowed considerably. High accessibility formed relatively continuous and uniform areas. Spatial gaps associated with isolated walking-accessibility clusters and public transport corridors were substantially reduced. However, relatively low accessibility remained in northern areas and along the study area boundary.
Low accessibility to professional rehabilitation spaces was mainly concentrated in northern subdistricts, including Jixianli and Beicang. Low-accessibility areas for natural restorative and social interaction spaces largely overlapped. They were located in Jixianli, Beicang, Shuanggang, Ruijing, and Fengnian subdistricts. Accessibility to occupational participation spaces remained higher at central urban nodes. Values were higher in Xinxing, Nanyingmen, and Wanxing subdistricts and relatively lower in Fengnian, Shuanggang, Jixianli, and Beicang subdistricts. This scenario represents car passenger travel, including transport provided by family members or caregivers, ride-hailing services, and taxis. It does not refer to persons with mental disabilities driving themselves. Nor does it imply that all persons in the study population can consistently meet the financial, caregiving, and logistical demands of travel. Instead, it represents an upper bound on potential opportunities under conditions of adequate caregiving support (Figure 6).

5.1.4. Comprehensive Accessibility

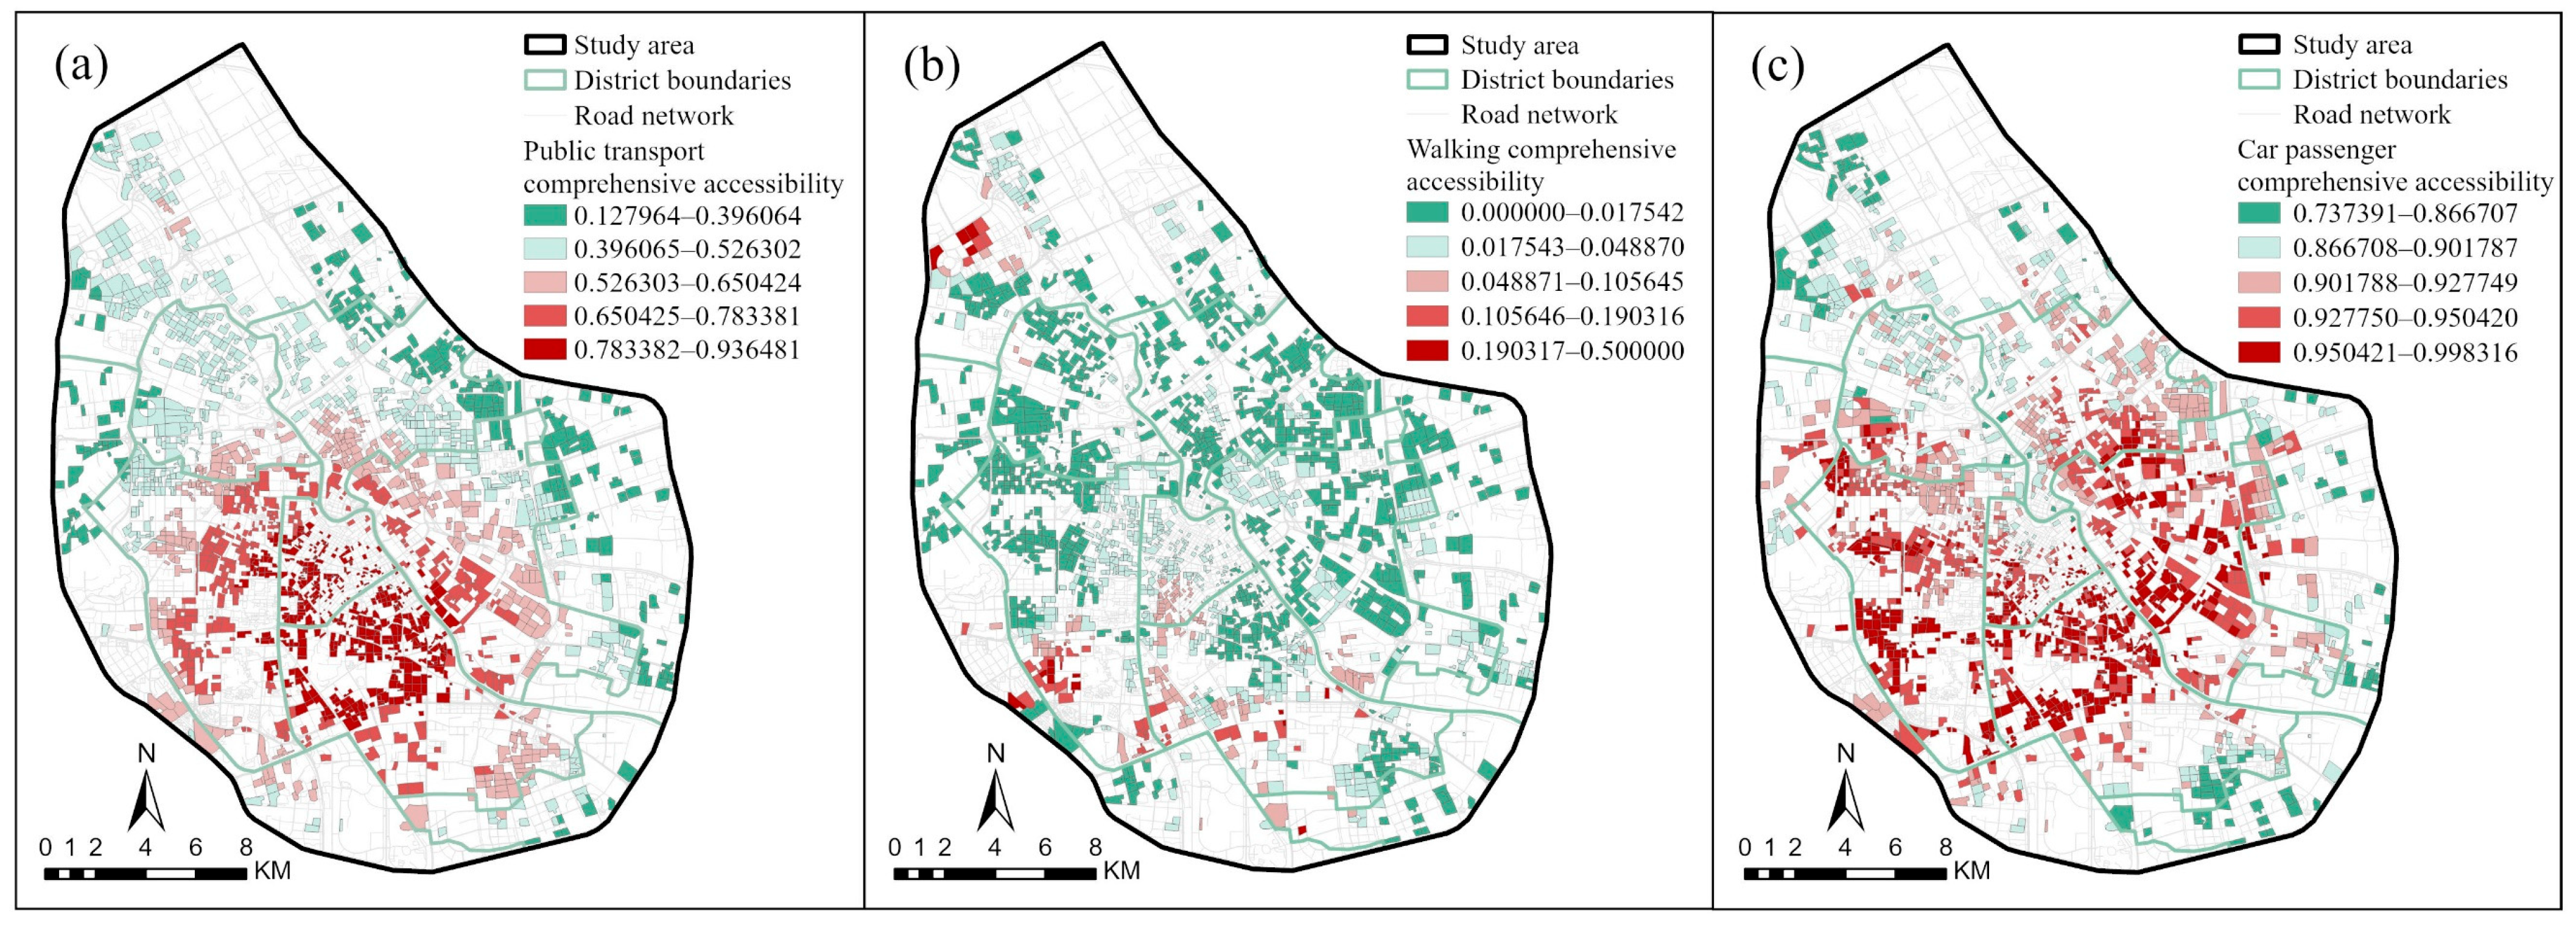
Comprehensive accessibility reflects how fully residential communities can access professional rehabilitation, natural restorative, social interaction, and occupational participation support together. The three travel modes produced different spatial patterns of comprehensive accessibility. Public transport showed substantial differences between residential communities. Under the walking scenario, comprehensive accessibility was characterised by fragmented spatial patterns, and 136 persons with mental disabilities had zero comprehensive accessibility. Under the car passenger scenario, spatial differences between residential communities were relatively limited. Because the four space-specific accessibility indicators were normalised separately within each travel mode, comprehensive accessibility values are interpreted only in terms of relative patterns within each mode and are not directly comparable across travel modes.
Comprehensive accessibility varied across spatial scales. At the district level, public transport values were higher in Heping and Hexi districts. They were relatively lower in Hongqiao and Hebei districts and peripheral parts of the study area. Under the walking scenario, high-accessibility areas contracted further, although Heping and Hexi retained a relative advantage. Car passenger travel substantially narrowed differences between districts. At the subdistrict level, public transport comprehensive accessibility was higher in Yuexiu Road, Taoyuan, and Machang. It was relatively lower in Lushandao, Jinzhong, and Xiyingmen. Walking values were higher in Ruijing, Shuishanggongyuan, and Tiyuzhongxin, and lowest in Xiyingmen and Lushandao. Car passenger values were higher in Youyi Road, Xiawafang, and Machang, and relatively lower in Jixianli and Beicang. Subdistrict results were calculated by aggregating residential community accessibility values using the population of persons with mental disabilities as weights. These results were used only to explain differences within the study area. Residential communities remained the basic units of analysis (Figure 7).
The comprehensive index and space-specific results provide different information. Some communities with high comprehensive accessibility may still lack professional rehabilitation or occupational participation opportunities. Higher accessibility to natural restorative and social interaction spaces may offset these gaps when the four types are combined with equal weights. Comprehensive accessibility is therefore useful for assessing the overall completeness of the rehabilitation support system. It cannot replace separate measurement of the four space types. Subsequent analyses of spatial clustering and equity should consider both space-specific results and comprehensive accessibility.

5.2. Spatial Clustering of Accessibility

Global Moran’s I tests showed significant positive spatial autocorrelation in comprehensive accessibility under all three travel modes (Table 2). Moran’s I values were 0.982 for public transport, 0.714 for walking, and 0.824 for car passenger travel. All three statistics were significant based on 999 random permutations (p = 0.001). Public transport comprehensive accessibility showed the strongest spatial clustering, forming a relatively continuous centre–periphery gradient. The car passenger scenario showed the second-strongest spatial clustering. Although it narrowed accessibility gaps between residential communities, it did not fully alter the spatial differences shaped by facility locations. Comprehensive accessibility under the walking scenario showed weaker spatial clustering. High values were scattered around nearby facilities, producing a localised and fragmented pattern.
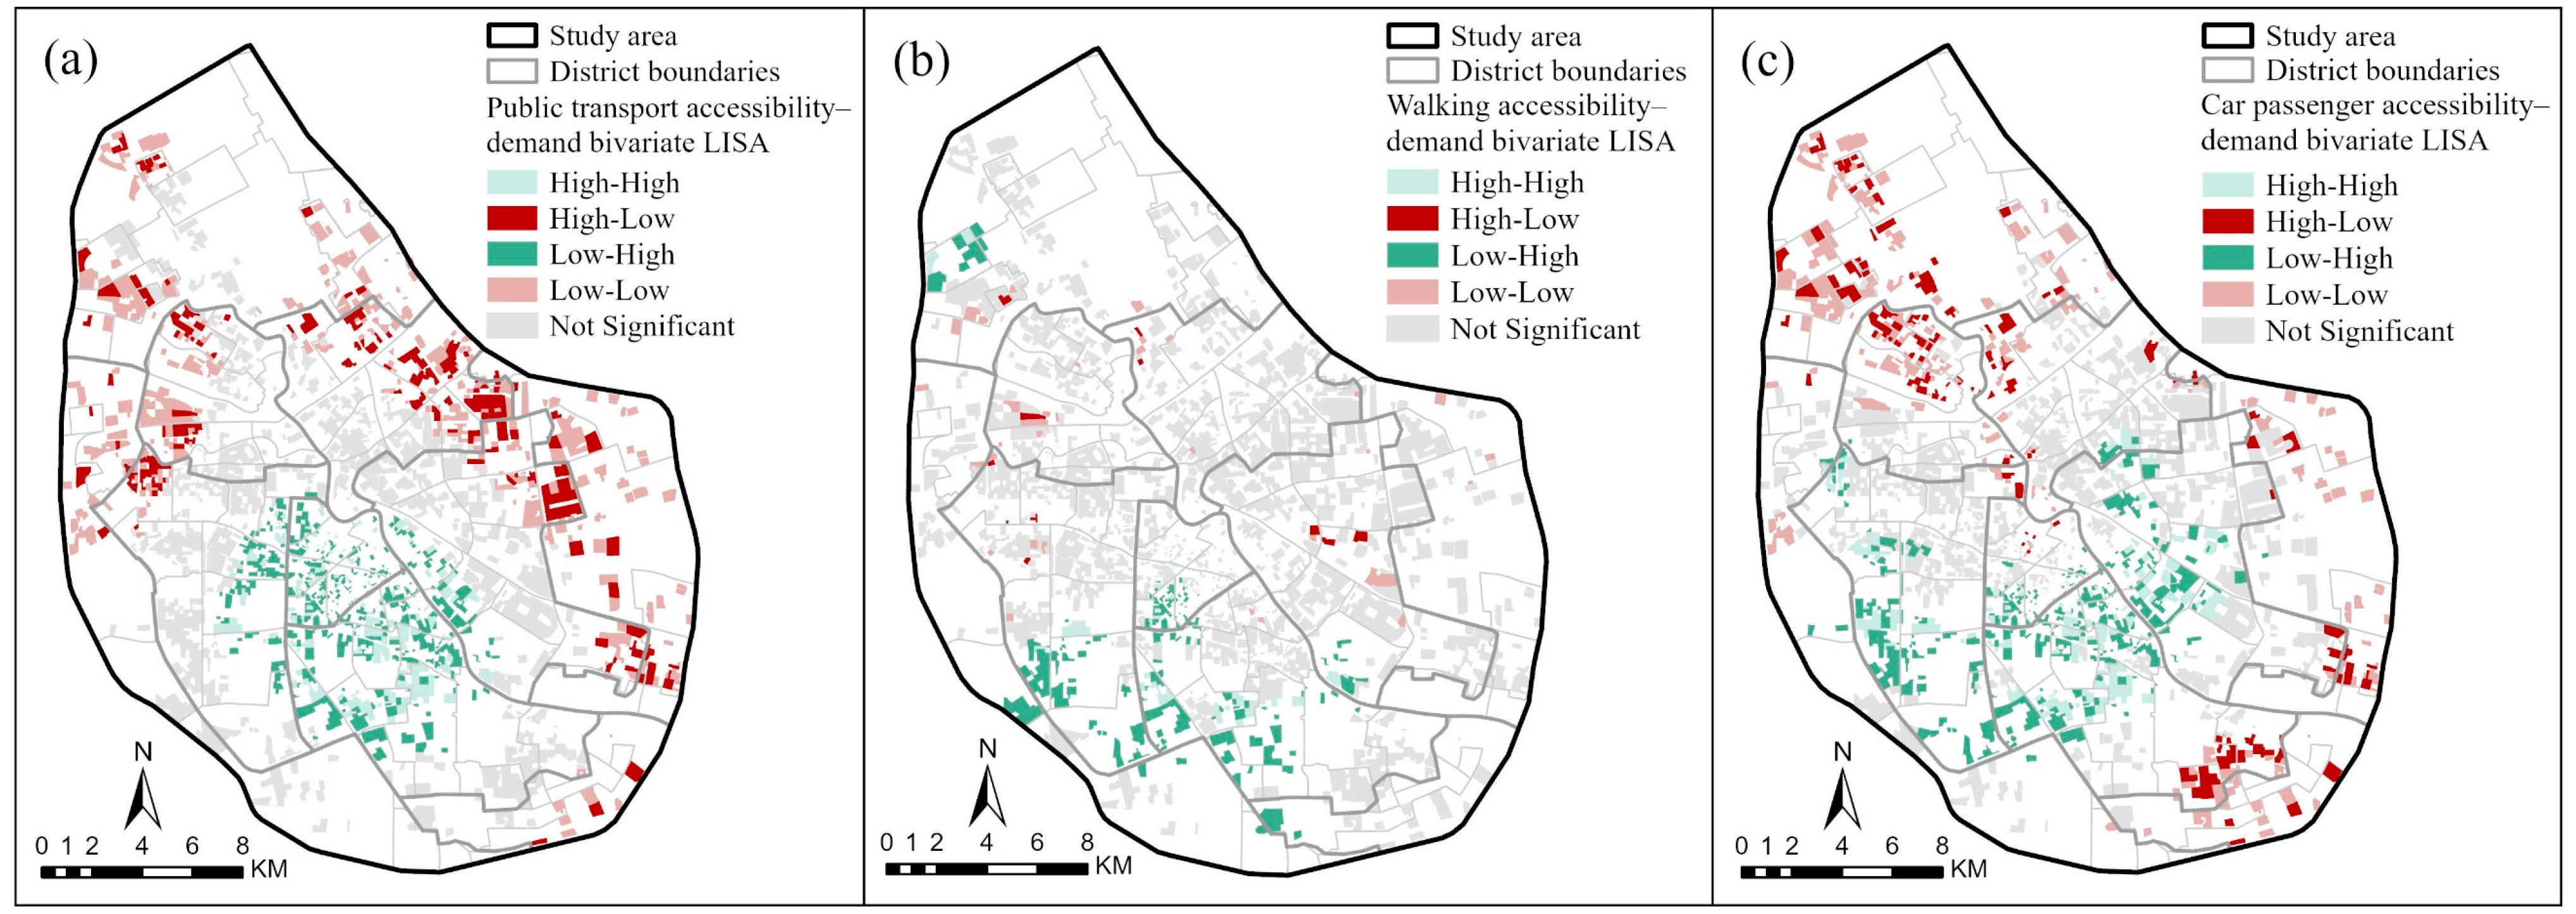
Bivariate LISA results revealed significant local need–accessibility mismatches under all three travel modes, but their spatial patterns differed (Figure 8). Under the public transport scenario, high-need–low-accessibility areas were extensive. They mainly formed contiguous clusters or belts along the northern, eastern, and northwestern periphery of the central urban area. Low-need–high-accessibility areas were concentrated in central and southern areas, indicating a clear centre–periphery pattern. Walking also produced high-need–low-accessibility clusters, but these were smaller. They mainly appeared as local patches in northern and east-central areas. Low-need–high-accessibility areas formed several clusters in the southwest and south. This suggests that walking-based need–opportunity relationships are more strongly shaped by nearby facilities and local road networks. Under the car passenger scenario, high-need–low-accessibility areas remained concentrated in northern, eastern, and southeastern peripheral areas. Low-need–high-accessibility areas were mainly located in central and southern areas. Motor vehicle travel therefore reduced spatial impedance but did not fully eliminate local mismatches shaped by population and facility locations.
Overall, need–opportunity mismatches under public transport formed spatially continuous patterns. Under the walking scenario, mismatches formed smaller, scattered patches. Car passenger travel improved overall accessibility but retained the relative disadvantages of peripheral areas. These findings indicate that greater travel capability can ease distance constraints. However, spatial differences between rehabilitation support provision and the needs of persons with mental disabilities persist.

5.3. Equity

5.3.1. Overall Distributive Equity Results

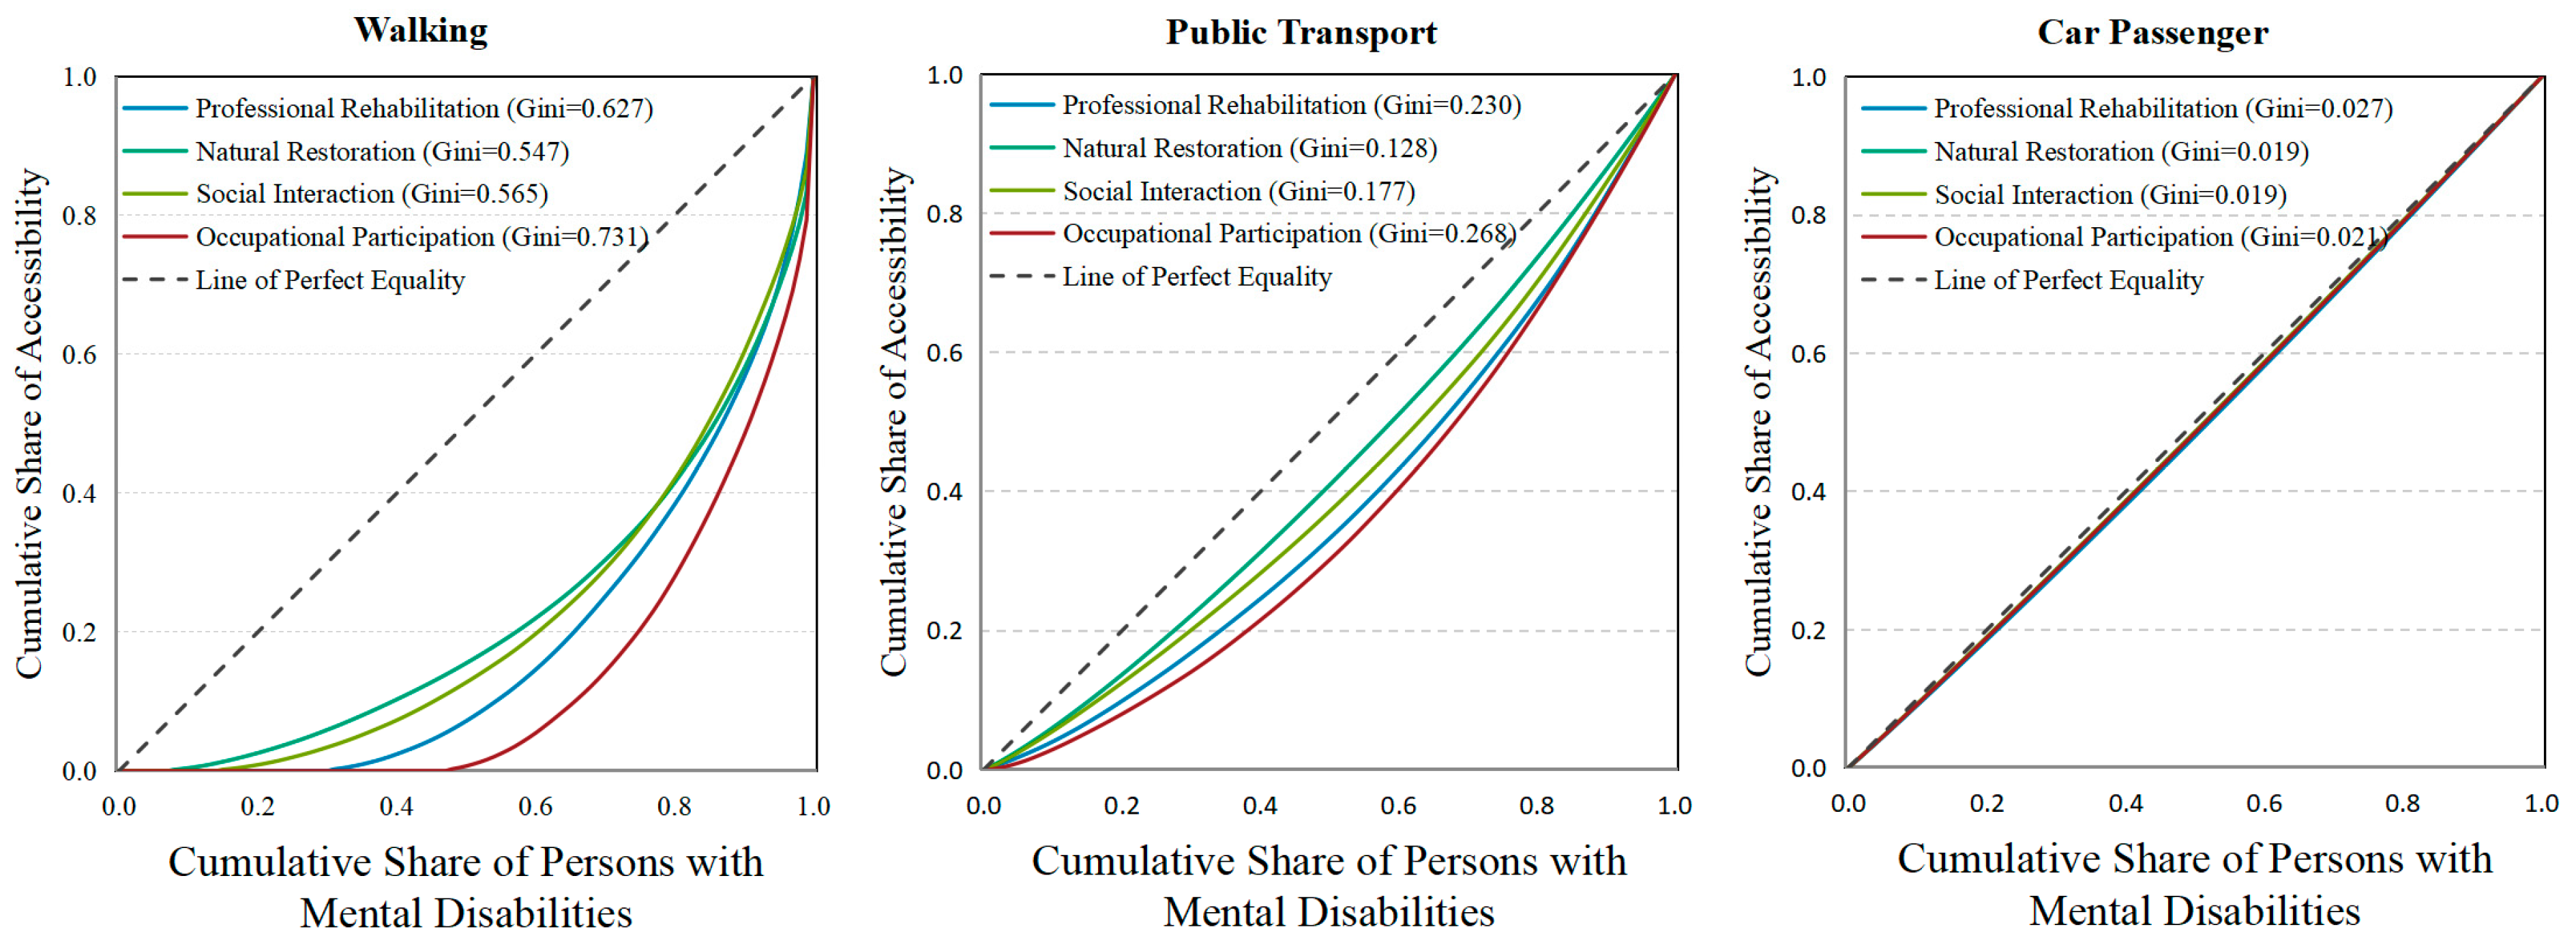
Population-weighted Lorenz curves and Gini coefficients showed that travel modes substantially changed the distribution of rehabilitation support opportunities (Figure 9). Inequality was greatest under the walking scenario. Gini coefficients exceeded 0.5 for all four space types. Occupational participation had the highest coefficient, followed by professional rehabilitation. This indicates that limited walking range concentrated opportunities in a small number of residential communities near facilities. Public transport expanded facility catchment areas and substantially narrowed opportunity gaps across the population. However, occupational participation remained the most unevenly distributed space type. Under the car passenger scenario, Gini coefficients were below 0.03 for all space types, indicating a nearly equal distribution. This suggests that motor vehicle support can substantially reduce opportunity gaps caused by spatial impedance.
Overall, walking constraints amplified inequalities in the existing facility distribution. Public transport reduced these gaps but did not eliminate them. Under the car passenger scenario, accessibility was most evenly distributed among the three travel scenarios, assuming adequate transport support. Occupational participation spaces showed the greatest distributional inequality under walking and public transport and remained a priority for improving access. It was therefore the most persistent equity gap in the rehabilitation support system. However, the balanced distribution under car passenger travel depended on family transport, caregiver accompaniment, or the ability to pay for travel. It should not be interpreted as evidence that the facility distribution itself was already balanced.

5.3.2. Needs-Based Spatial Equity Results

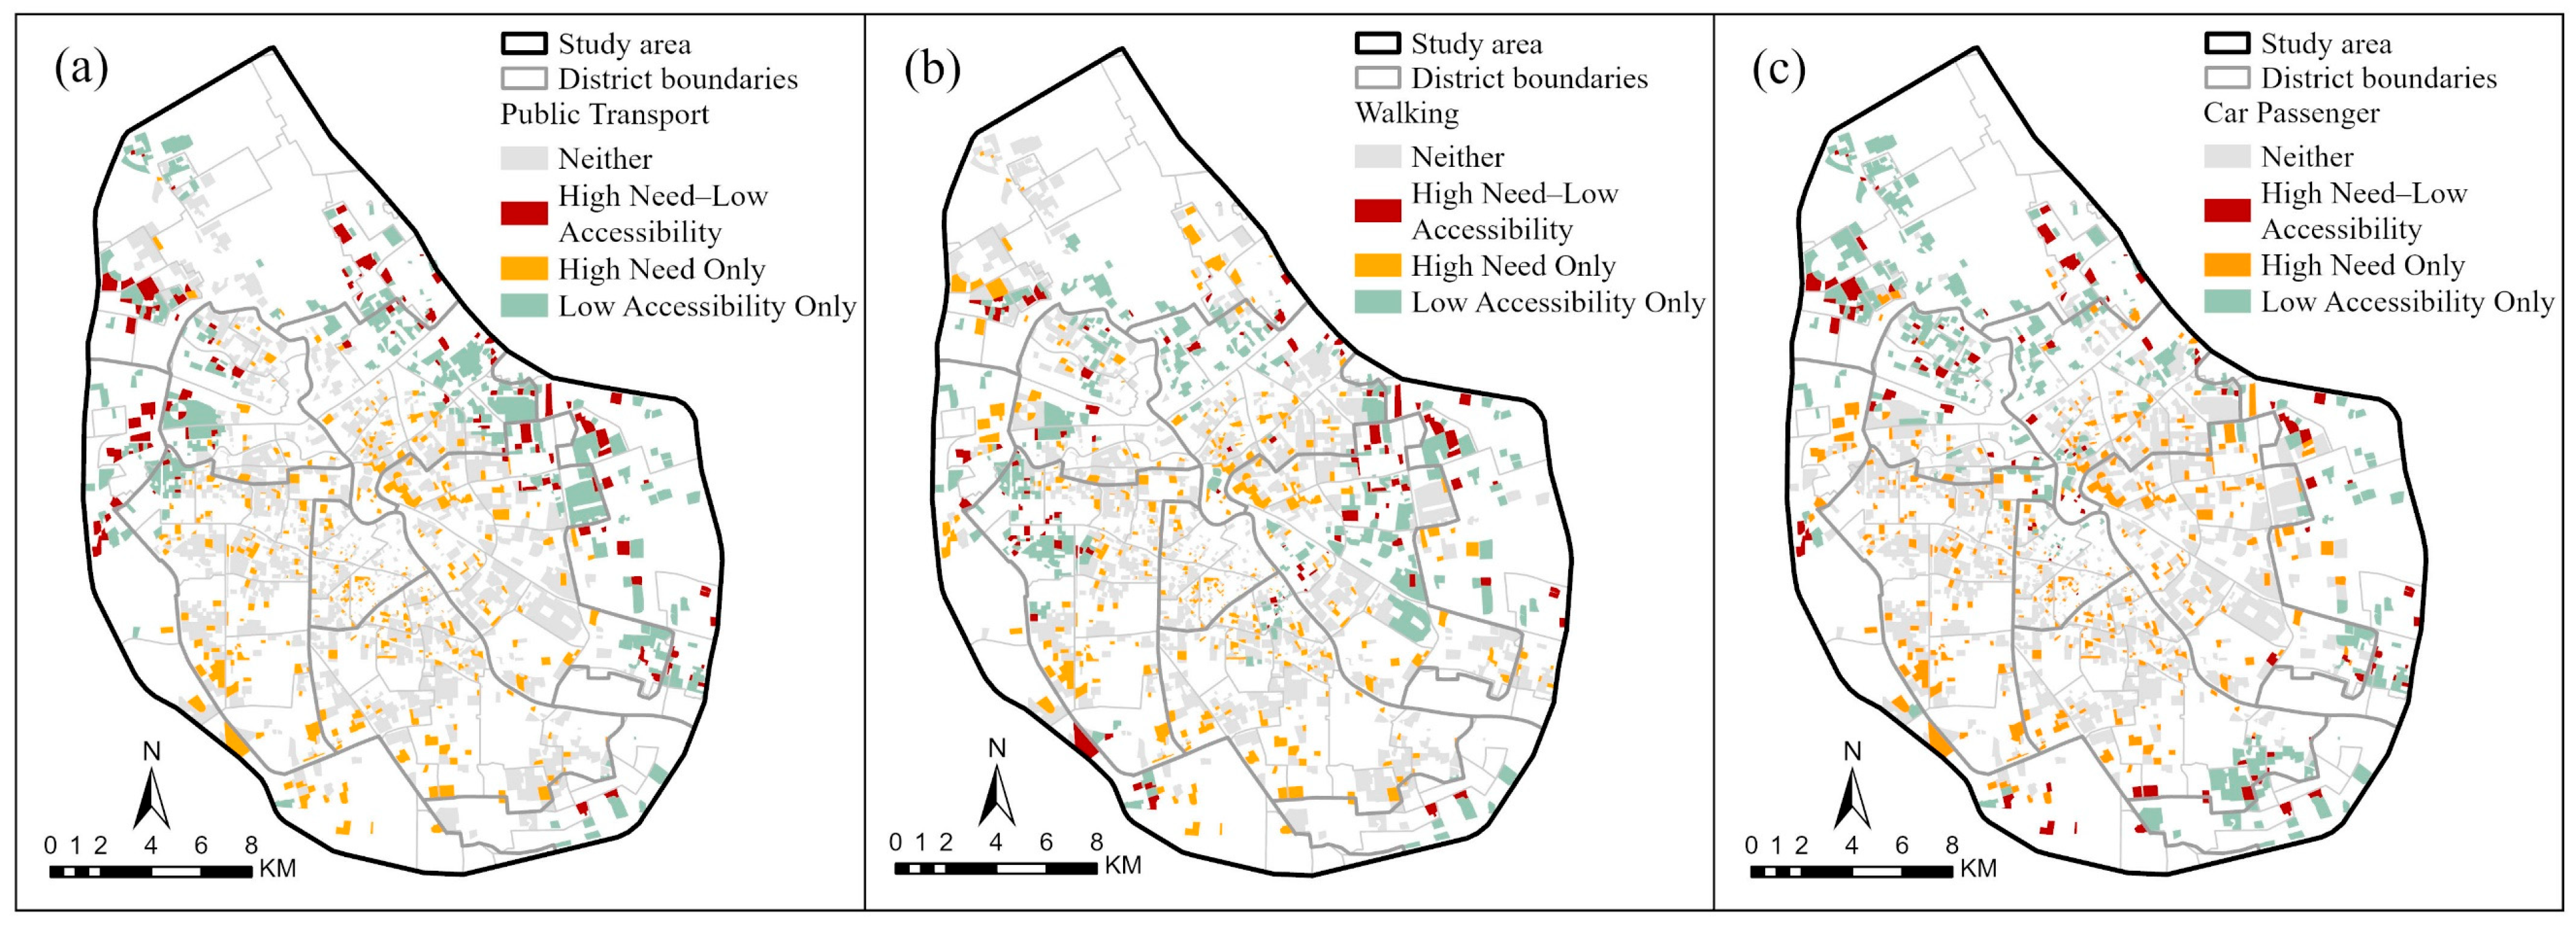
Overall distributive equity reflects general disparities. However, it cannot reveal where concentrated high needs overlap with low accessibility at the residential community level. Overlaying the proportion of persons with higher support needs and accessibility identified communities with high proportions and low accessibility under all three travel modes (Figure 10). In this study, the term “persons with higher support needs” refers to those with Grade I or II mental disabilities.
Screening based on comprehensive accessibility identified similar numbers of priority communities across the three travel modes. Most persons with mental disabilities in these communities had higher support needs. However, the spatial distributions of priority communities differed across modes. This indicates that mismatch locations differed across travel scenarios and that relative mismatches persisted under all three modes. Under public transport, priority communities were mainly located along the northern and eastern periphery of the central urban area. Under walking, they were more dispersed, indicating local shortages at the neighbourhood level. Car passenger travel improved the overall distribution. However, some communities on the urban periphery and study area boundary still combined concentrated needs with relatively low comprehensive accessibility.
Results by space type further showed that walking-based need–opportunity mismatches mainly involved occupational participation and professional rehabilitation spaces (Table 3). Occupational participation spaces showed the largest gap in access. Shortages of natural restorative and social interaction spaces were relatively limited in extent. This suggests that persons with higher support needs did not face a general shortage of all rehabilitation support space types within their local living areas. The most pronounced relative gaps in walking accessibility concerned professional rehabilitation and occupational participation spaces. This reflects gaps in the range of functions provided by the rehabilitation support system.
Cross-tabulation showed that the Q75–Q25 screening and bivariate LISA identified overlapping but largely non-identical sets of communities (Table 4). Under public transport, 9 communities were identified by both methods, whereas 115 were identified only by the Q75–Q25 screening and 166 only by bivariate LISA. Under walking, only 2 communities overlapped, with 113 identified only by the Q75–Q25 screening and 9 only by bivariate LISA. Under car passenger travel, 4 communities were identified by both methods, while 107 and 138 were identified only by the Q75–Q25 screening and bivariate LISA, respectively.
The limited overlap is expected because the two methods capture different dimensions of need–opportunity mismatch. The Q75–Q25 screening identifies communities with a high proportion of persons with higher support needs and low accessibility within the community itself. In contrast, bivariate LISA identifies spatial associations between the total number of persons with mental disabilities in a community and the accessibility of neighbouring communities. Communities identified by both methods may therefore be regarded as robust priorities because they combine local needs-based disadvantage with a broader spatial mismatch. Communities identified by only one method should be interpreted as reflecting either local deficits or surrounding spatial disadvantage rather than the same condition.
Together, the two levels of equity assessment show that a balanced overall distribution does not guarantee spatial matching between needs and opportunities. Walking produced both high overall inequality and substantial gaps in specific support functions. Public transport expanded service coverage, but high needs still overlapped with low accessibility in peripheral areas. Car passenger travel reduced Gini coefficients to nearly zero. Yet screening still identified communities with concentrated needs and relatively low comprehensive accessibility. Improving equity in access to mental health rehabilitation support spaces therefore requires both lower travel barriers and additional professional rehabilitation and occupational participation resources in areas where higher needs are concentrated.

6. Discussion

6.1. Key Findings and Theoretical Implications

This study examined four types of rehabilitation support spaces for persons with mental disabilities in the central urban area of Tianjin. The analysis assessed multimodal accessibility, spatial clustering, and equity. Three key findings emerged.
First, travel modes substantially changed the spatial distribution of rehabilitation support opportunities. Under walking, opportunities were mainly concentrated around facilities. Occupational participation showed the greatest inequality, and nearly half of the study population could not reach these facilities within the specified threshold. Public transport expanded service coverage but retained a clear centre–periphery gradient. Car passenger travel substantially narrowed differences between residential communities. These results mainly reflect the geographic reach of each travel mode. Walking captures opportunities at the neighbourhood level. Public transport depends on the urban transport network, while car passenger travel connects residents to more distant rehabilitation resources. A single travel mode therefore cannot fully represent rehabilitation support opportunities for persons with mental disabilities.
Second, accessibility differed across the four types of rehabilitation support spaces. Natural restorative and social interaction spaces were relatively widespread. Professional rehabilitation and occupational participation spaces were more likely to show low or zero accessibility under walking. The most pronounced gap in support provision concerned occupational participation spaces. These differences reflect the number and spatial distribution of facilities, as well as competition among potential users within their catchment areas. High comprehensive accessibility therefore does not indicate balanced access to all four types of support. Some communities may have good access to natural restorative and social interaction spaces but still lack professional rehabilitation or occupational participation opportunities. The comprehensive index captures the overall condition of the support system but cannot replace assessment by space type.
Third, improvements in overall distribution did not guarantee spatial matching between needs and opportunities. Accessibility opportunities were most evenly distributed under car passenger travel, followed by public transport. Walking showed the greatest inequality. However, under all three modes, some residential communities had concentrations of persons with higher support needs and low accessibility. Public transport mismatches mainly appeared as regional gaps in peripheral areas. Walking mismatches were more dispersed and occurred at the neighbourhood level. Car passenger travel also failed to eliminate local relative disadvantages. Overall distribution indicators therefore capture only opportunity gaps across the population. They must be considered alongside the distribution of support needs within residential communities to identify specific priorities for intervention.
The theoretical contribution of this study is to extend the understanding of spatial support for mental health rehabilitation beyond healthcare alone. It frames professional rehabilitation, natural restorative, social interaction, and occupational participation spaces as a continuous support system. It also incorporates travel modes and spatial matching with needs into accessibility assessment. The findings show that equity in access to mental health rehabilitation support spaces depends on how resources are distributed, whether the target population can reach them under actual travel conditions, and whether provision reaches the living environments where needs are concentrated. This offers a more complete analytical perspective for shifting the focus from balancing facility numbers to matching needs with opportunities.

6.2. Planning and Policy Implications

Improvements to mental health rehabilitation support spaces in Tianjin should address gaps in specific space types, coordinate interventions across spatial scales, and strengthen transport support. Professional rehabilitation and occupational participation spaces should receive priority. Areas lacking occupational participation opportunities could add community-based vocational training, assisted employment, and employment support sites to reduce travel barriers. Services could adopt individual placement and support (IPS), which outperformed conventional vocational services in promoting competitive employment among people with severe mental disorders [23]. Areas lacking professional rehabilitation should strengthen community mental health services, follow-up, and referrals. Community health centres could provide rehabilitation sites or mobile services. Evidence supports combining community rehabilitation with facility-based care [51]. Natural restorative spaces require attention to proximity, area, and quality, alongside entrances, opening arrangements, and walking connections [52]. Social interaction spaces should provide permanent, regularly open, usable facilities and support community participation and anti-stigma activities. Social contact interventions can improve attitudes in the short term, although long-term effects remain uncertain [53].
Planning interventions should reflect the spatial scale of mismatches [54]. Peripheral gaps under public transport require adjustments to service locations and better transport connections. Dispersed walking-based gaps call for rehabilitation consultation, community activities, nature-based recreation, and vocational support within neighbourhoods. Areas lacking several space types need combined provision based on their main functional gaps. Single-function gaps could be addressed through services in existing facilities, small-scale adaptations, or service sharing. These measures align with evidence that places support recovery through daily activities, social connections, and belonging [11].
Transport support can help when resources cannot be relocated quickly. Transport-related disadvantage is shaped by both individual and spatial factors [55], while broader studies also highlight the relationships among urban spatial conditions, travel behaviour, and accessibility [56,57,58]. Communities with higher support needs that are located far from professional rehabilitation and occupational participation facilities could benefit from better public transport connections, scheduled pick-up services, travel subsidies, and community vehicles. Walking access to stops, transfer arrangements, and access to travel information should also be improved. Policies should consider costs, accompaniment, reliability, and stigma without placing full transport responsibility on families. The car passenger scenario represents potential opportunities under adequate support, not the actual travel capabilities of all persons with mental disabilities.

6.3. Study Limitations and Future Directions

This study has several limitations. First, it measures potential spatial accessibility. It does not account for changes in mental health conditions, financial burdens, caregiving support, service quality, or individual preferences. The results therefore cannot directly represent actual service use or rehabilitation outcomes. Future research could combine service records with surveys of residents and caregivers to examine how potential opportunities translate into actual use.
Second, data on facility capacity, community population, and actual facility use were unavailable. Facility capacity was therefore uniformly set to 1, and the Gaussian E2SFCA denominator included only persons with mental disabilities. For natural restorative and social interaction spaces, which are shared public resources, the results should be interpreted as relative potential opportunities for the target population rather than actual availability after competition from all residents. This may overestimate effective access in heavily used public spaces. Future research should incorporate differentiated facility capacity, community population, and visitor data to estimate competition more directly.
Third, public transport OD travel times were mainly predicted using a model calibrated with sampled data. The identification of individual communities with low accessibility may still be affected. Future research could collect actual public transport data for different periods, including peak hours, off-peak hours, and weekends.
Fourth, the population data were derived from the 2020 register of certified persons with mental disabilities, whereas the POI data were collected in 2026. Changes in residential locations, population registration, facility openings or closures, or functional classifications during this period may have introduced uncertainty into the accessibility estimates. The population data covered only registered persons with mental disabilities who were successfully matched to residential communities. Higher support needs were identified solely by disability grade. This measure cannot fully capture changes in mental health conditions, family caregiving support, or individual travel capabilities. The Q75–Q25 screening rule identifies communities with a high proportion of persons with higher support needs and low accessibility. These are relative thresholds within the study area, rather than clinical or policy thresholds. Future research should use contemporaneous population and facility data, additional individual needs characteristics, actual service-use data, and field surveys to validate priority communities and screening thresholds.

7. Conclusions

This study examined certified persons with mental disabilities in the central urban area of Tianjin. The analysis included 1938 residential communities and 346 rehabilitation support spaces. These spaces were classified into professional rehabilitation, natural restorative, social interaction, and occupational participation spaces. Gaussian E2SFCA measured potential accessibility under public transport, walking, and car passenger travel scenarios. Spatial autocorrelation and high-need–low-accessibility screening were combined to examine the spatial distribution of rehabilitation support opportunities and needs-based equity. The findings show that travel modes substantially reshape these spatial patterns. Walking produced fragmented neighbourhood clusters of opportunities and extensive areas with zero accessibility. Public transport formed a continuous centre–periphery gradient. Car passenger travel substantially reduced spatial disparities. However, these potential opportunities depend on family caregiving and financial resources and do not represent actual access. Sensitivity to travel constraints differed considerably across the four space types. Professional rehabilitation and occupational participation remained major gaps across multiple scenarios. Comprehensive accessibility can conceal gaps in individual support functions, making assessment by space type essential.
Equity in mental health rehabilitation support spaces operates at multiple levels. A balanced overall distribution does not necessarily indicate substantive needs-based equity. Under all travel scenarios, some residential communities had concentrated high needs but limited accessibility. Mismatch patterns also varied by scenario. Public transport mismatches mainly formed contiguous gaps in peripheral areas. Walking mismatches appeared as dispersed neighbourhood patches. Even car passenger travel did not fully eliminate local mismatches. Planning should therefore shift from balancing facility numbers towards spatial matching between needs and opportunities. Priority should be given to residential communities with persistently low accessibility across scenarios or overlapping gaps in several space types. Measures should bring rehabilitation services closer to communities, establish community-based vocational support sites, and provide compensatory support for rehabilitation travel. This study measures potential spatial accessibility. The identified priority communities serve only as a basis for planning screening. Further assessment should incorporate facility operating conditions and residents’ actual travel experiences.

Author Contributions

Conceptualization, X.R., L.P. and Y.J.; methodology, X.R. and Y.J.; software, X.R. and H.Q.; validation, X.R., H.Q., J.C., L.P. and Y.J.; formal analysis, X.R.; investigation, X.R., H.Q. and X.D.; resources, X.D., L.P. and Y.J.; data curation, X.R., H.Q. and X.D.; writing—original draft preparation, X.R.; writing—review and editing, H.Q., X.D., J.C., L.P. and Y.J.; visualization, X.R. and J.C.; supervision, L.P. and Y.J.; project administration, Y.J.; funding acquisition, Y.J. All authors have read and agreed to the published version of the manuscript.

Funding

This research was funded by the National Natural Science Foundation of China, grant number 52508086; the Natural Science Foundation of Sichuan Province, grant numbers 2026NSFSC1300 and 2026NSFSC1302; and the Fundamental Research Funds for the Central Universities, grant number 2682026CX048.

Institutional Review Board Statement

The study was conducted in accordance with the Declaration of Helsinki and was approved by the Medical Ethics Committee of Southwest Jiaotong University (Approval No. SWJTU-2604-NSFSC(233); date of approval: 14 April 2026).

Data Availability Statement

The data presented in this study are available on request from the corresponding author due to privacy restrictions.

Conflicts of Interest

The authors declare no conflicts of interest.

Abbreviations

The following abbreviations are used in this manuscript:
2SFCATwo-step floating catchment area
APIApplication programming interface
E2SFCAEnhanced two-step floating catchment area
GISGeographic information system
LISALocal indicators of spatial association
ODOrigin–destination
POIPoint of interest
IPSIndividual placement and support
BH-FDRBenjamini–Hochberg false discovery rate

References

  1. United Nations General Assembly. Convention on the Rights of Persons with Disabilities; Resolution A/RES/61/106; United Nations: New York, NY, USA, 2006; Available online: https://undocs.org/en/A/RES/61/106 (accessed on 15 August 2026).
  2. World Health Organization. Comprehensive Mental Health Action Plan 2013–2030; World Health Organization: Geneva, Switzerland, 2021; Available online: https://www.who.int/publications/i/item/9789240031029 (accessed on 15 August 2026).
  3. Leamy, M.; Bird, V.; Le Boutillier, C.; Williams, J.; Slade, M. Conceptual framework for personal recovery in mental health: Systematic review and narrative synthesis. Br. J. Psychiatry 2011, 199, 445–452. [Google Scholar] [CrossRef] [Scilit] [PubMed]
  4. Bird, V.; Leamy, M.; Tew, J.; Le Boutillier, C.; Williams, J.; Slade, M. Fit for purpose? Validation of a conceptual framework for personal recovery with current mental health consumers. Aust. N. Z. J. Psychiatry 2014, 48, 644–653. [Google Scholar] [CrossRef] [Scilit] [PubMed]
  5. Slade, M.; Amering, M.; Farkas, M.; Hamilton, B.; O’Hagan, M.; Panther, G.; Perkins, R.; Shepherd, G.; Tse, S.; Whitley, R. Uses and abuses of recovery: Implementing recovery-oriented practices in mental health systems. World Psychiatry 2014, 13, 12–20. [Google Scholar] [CrossRef] [Scilit] [PubMed]
  6. Kirkbride, J.B.; Anglin, D.M.; Colman, I.; Dykxhoorn, J.; Jones, P.B.; Patalay, P.; Pitman, A.; Soneson, E.; Steare, T.; Wright, T.; et al. The social determinants of mental health and disorder: Evidence, prevention and recommendations. World Psychiatry 2024, 23, 58–90. [Google Scholar] [CrossRef] [Scilit] [PubMed]
  7. Patel, V.; Saxena, S.; Lund, C.; Thornicroft, G.; Baingana, F.; Bolton, P.; Chisholm, D.; Collins, P.Y.; Cooper, J.L.; Eaton, J.; et al. The Lancet Commission on global mental health and sustainable development. Lancet 2018, 392, 1553–1598. [Google Scholar] [CrossRef] [Scilit] [PubMed]
  8. Killaspy, H.; Harvey, C.; Brasier, C.; Brophy, L.; Ennals, P.; Fletcher, J.; Hamilton, B. Community-based social interventions for people with severe mental illness: A systematic review and narrative synthesis of recent evidence. World Psychiatry 2022, 21, 96–123. [Google Scholar] [CrossRef] [Scilit] [PubMed]
  9. Townley, G.; Kloos, B.; Wright, P.A. Understanding the experience of place: Expanding methods to conceptualize and measure community integration of persons with serious mental illness. Health Place 2009, 15, 520–531. [Google Scholar] [CrossRef] [Scilit] [PubMed]
  10. Chan, D.V.; Gopal, S.; Helfrich, C.A. Accessibility patterns and community integration among previously homeless adults: A Geographic Information Systems (GIS) approach. Soc. Sci. Med. 2014, 120, 142–152. [Google Scholar] [CrossRef] [Scilit] [PubMed]
  11. Doroud, N.; Fossey, E.; Fortune, T. Place for being, doing, becoming and belonging: A meta-synthesis exploring the role of place in mental health recovery. Health Place 2018, 52, 110–120. [Google Scholar] [CrossRef] [Scilit] [PubMed]
  12. Rüsch, N.; Angermeyer, M.C.; Corrigan, P.W. Mental illness stigma: Concepts, consequences, and initiatives to reduce stigma. Eur. Psychiatry 2005, 20, 529–539. [Google Scholar] [CrossRef] [Scilit] [PubMed]
  13. Metraux, S.; Brusilovskiy, E.; Prvu-Bettger, J.A.; Wong, Y.L.I.; Salzer, M.S. Geographic access to and availability of community resources for persons diagnosed with severe mental illness in Philadelphia, USA. Health Place 2012, 18, 621–629. [Google Scholar] [CrossRef] [Scilit] [PubMed]
  14. Duff, C. Exploring the role of ‘enabling places’ in promoting recovery from mental illness: A qualitative test of a relational model. Health Place 2012, 18, 1388–1395. [Google Scholar] [CrossRef] [Scilit] [PubMed]
  15. Ngamini Ngui, A.; Vanasse, A. Assessing spatial accessibility to mental health facilities in an urban environment. Spat. Spatio-Temporal Epidemiol. 2012, 3, 195–203. [Google Scholar] [CrossRef] [Scilit] [PubMed]
  16. Liu, L.; Gao, R.; Zhang, L. An equity evaluation of healthcare accessibility across age strata using the G2SFCA method: A case study in Karamay District, China. Land 2024, 13, 1259. [Google Scholar] [CrossRef] [Scilit]
  17. Twohig-Bennett, C.; Jones, A. The health benefits of the great outdoors: A systematic review and meta-analysis of greenspace exposure and health outcomes. Environ. Res. 2018, 166, 628–637. [Google Scholar] [CrossRef] [Scilit] [PubMed]
  18. Ward Thompson, C.; Roe, J.; Aspinall, P.; Mitchell, R.; Clow, A.; Miller, D. More green space is linked to less stress in deprived communities: Evidence from salivary cortisol patterns. Landsc. Urban Plan. 2012, 105, 221–229. [Google Scholar] [CrossRef] [Scilit]
  19. Korpela, K.M.; Ylén, M.; Tyrväinen, L.; Silvennoinen, H. Determinants of restorative experiences in everyday favorite places. Health Place 2008, 14, 636–652. [Google Scholar] [CrossRef] [Scilit] [PubMed]
  20. Hunter, R.F.; Cleland, C.; Cleary, A.; Droomers, M.; Wheeler, B.W.; Sinnett, D.; Nieuwenhuijsen, M.J.; Braubach, M. Environmental, health, wellbeing, social and equity effects of urban green space interventions: A meta-narrative evidence synthesis. Environ. Int. 2019, 130, 104923. [Google Scholar] [CrossRef] [Scilit] [PubMed]
  21. Masterton, W.; Carver, H.; Parkes, T.; Park, K. Greenspace interventions for mental health in clinical and non-clinical populations: What works, for whom, and in what circumstances? Health Place 2020, 64, 102338. [Google Scholar] [CrossRef] [Scilit] [PubMed]
  22. Birch, J.; Rishbeth, C.; Payne, S.R. Nature doesn’t judge you–how urban nature supports young people’s mental health and wellbeing in a diverse UK city. Health Place 2020, 62, 102296. [Google Scholar] [CrossRef] [Scilit] [PubMed]
  23. Burns, T.; Catty, J.; Becker, T.; Drake, R.E.; Fioritti, A.; Knapp, M.; Lauber, C.; Rössler, W.; Tomov, T.; van Busschbach, J.; et al. The effectiveness of supported employment for people with severe mental illness: A randomised controlled trial. Lancet 2007, 370, 1146–1152. [Google Scholar] [CrossRef] [Scilit] [PubMed]
  24. Modini, M.; Tan, L.; Brinchmann, B.; Wang, M.-J.; Killackey, E.; Glozier, N.; Mykletun, A.; Harvey, S.B. Supported employment for people with severe mental illness: Systematic review and meta-analysis of the international evidence. Br. J. Psychiatry 2016, 209, 14–22. [Google Scholar] [CrossRef] [Scilit] [PubMed]
  25. Penchansky, R.; Thomas, J.W. The concept of access: Definition and relationship to consumer satisfaction. Med. Care 1981, 19, 127–140. [Google Scholar] [CrossRef] [Scilit] [PubMed]
  26. Guagliardo, M.F. Spatial accessibility of primary care: Concepts, methods and challenges. Int. J. Health Geogr. 2004, 3, 3. [Google Scholar] [CrossRef] [Scilit] [PubMed]
  27. Luo, W.; Wang, F.H. Measures of spatial accessibility to health care in a GIS environment: Synthesis and a case study in the Chicago region. Environ. Plan. B Plan. Des. 2003, 30, 865–884. [Google Scholar] [CrossRef] [Scilit] [PubMed]
  28. Luo, W.; Qi, Y. An enhanced two-step floating catchment area (E2SFCA) method for measuring spatial accessibility to primary care physicians. Health Place 2009, 15, 1100–1107. [Google Scholar] [CrossRef] [Scilit] [PubMed]
  29. Luo, W.; Whippo, T. Variable catchment sizes for the two-step floating catchment area (2SFCA) method. Health Place 2012, 18, 789–795. [Google Scholar] [CrossRef] [Scilit] [PubMed]
  30. Tao, Z.; Zhang, R.; Liu, C.; Zhong, Q. On the modifiable areal unit problem (MAUP) in healthcare accessibility measurement via the two-step floating catchment area (2SFCA) method. Health Place 2025, 93, 103468. [Google Scholar] [CrossRef] [Scilit] [PubMed]
  31. Langford, M.; Higgs, G.; Fry, R. Multi-modal two-step floating catchment area analysis of primary health care accessibility. Health Place 2016, 38, 70–81. [Google Scholar] [CrossRef] [Scilit] [PubMed]
  32. Dony, C.C.; Delmelle, E.M.; Delmelle, E.C. Re-conceptualizing accessibility to parks in multi-modal cities: A variable-width floating catchment area (VFCA) method. Landsc. Urban Plan. 2015, 143, 90–99. [Google Scholar] [CrossRef] [Scilit]
  33. Xiao, W.; Wei, Y.D.; Wan, N. Modeling job accessibility using online map data: An extended two-step floating catchment area method with multiple travel modes. J. Transp. Geogr. 2021, 93, 103065. [Google Scholar] [CrossRef] [Scilit]
  34. Li, Z.; Fan, Z.; Song, Y.; Chai, Y. Assessing equity in park accessibility using a travel behavior-based G2SFCA method in Nanjing, China. J. Transp. Geogr. 2021, 96, 103179. [Google Scholar] [CrossRef] [Scilit]
  35. Wei, D.; Chen, J.; Jiang, Y.; Yang, L. Examining the associations between the built environment and older adults’ walking behavior: Spatial and distributional heterogeneity. Int. J. Sustain. Transp. 2026, 20, 305–318. [Google Scholar] [CrossRef] [Scilit]
  36. Qiu, N.; Zhang, T.; Cheng, J. Examining the impact of spatial accessibility to rehabilitation facilities on the degree of disability: A heterogeneity perspective. SSM-Popul. Health 2023, 23, 101489. [Google Scholar] [CrossRef] [Scilit] [PubMed]
  37. Xia, Y.; Chen, H.; Zuo, C.; Zhang, N. The impact of traffic on equality of urban healthcare service accessibility: A case study in Wuhan, China. Sustain. Cities Soc. 2022, 86, 104130. [Google Scholar] [CrossRef] [Scilit]
  38. Ghorbanzadeh, M.; Kim, K.; Ozguven, E.E.; Horner, M.W. A comparative analysis of transportation-based accessibility to mental health services. Transp. Res. Part D Transp. Environ. 2020, 81, 102278. [Google Scholar] [CrossRef] [Scilit]
  39. Qiu, N.; Jiang, Y.; Sun, Z.; Du, M. The impact of disability-related deprivation on employment opportunity at the neighborhood level: Does family socioeconomic status matter? Front. Public Health 2023, 11, 1232829. [Google Scholar] [CrossRef] [Scilit] [PubMed]
  40. Martens, K. Justice in transport as justice in accessibility: Applying Walzer’s ‘Spheres of Justice’ to the transport sector. Transportation 2012, 39, 1035–1053. [Google Scholar] [CrossRef] [Scilit]
  41. Lucas, K.; van Wee, B.; Maat, K. A method to evaluate equitable accessibility: Combining ethical theories and accessibility-based approaches. Transportation 2016, 43, 473–490. [Google Scholar] [CrossRef] [Scilit]
  42. Ding, T.; Wang, C.; Zeng, B.; Li, Y.; Li, Y. Accessibility and social equity of urban park green spaces in megacities from an environmental justice perspective: A case study of the six central districts of Beijing. Land 2026, 15, 484. [Google Scholar] [CrossRef] [Scilit]
  43. Foth, N.; Manaugh, K.; El-Geneidy, A.M. Towards equitable transit: Examining transit accessibility and social need in Toronto, Canada, 1996–2006. J. Transp. Geogr. 2013, 29, 1–10. [Google Scholar] [CrossRef] [Scilit]
  44. Guzman, L.A.; Oviedo, D.; Rivera, C. Assessing equity in transport accessibility to work and study: The Bogotá region. J. Transp. Geogr. 2017, 58, 236–246. [Google Scholar] [CrossRef] [Scilit]
  45. Xiao, Y.; Wang, Z.; Li, Z.; Tang, Z. An assessment of urban park access in Shanghai—Implications for the social equity in urban China. Landsc. Urban Plan. 2017, 157, 383–393. [Google Scholar] [CrossRef] [Scilit]
  46. Lee, S.I. Developing a bivariate spatial association measure: An integration of Pearson’s r and Moran’s I. J. Geogr. Syst. 2001, 3, 369–385. [Google Scholar] [CrossRef] [Scilit]
  47. Chang, M.; Huang, L.; Zhai, T.; Zhu, J.; Ma, Y.; Li, L.; Zhao, C. A challenge of sustainable urbanization: Mapping the equity of urban public facilities in multiple dimensions in Zhengzhou, China. Land 2023, 12, 1545. [Google Scholar] [CrossRef] [Scilit]
  48. Jiang, Y.; Han, X.; Qiu, N.; Du, M.; Zhao, L. Identifying urban–rural disparities and associated factors in the prevalence of disabilities in Tianjin, China. Land 2023, 12, 1480. [Google Scholar] [CrossRef] [Scilit]
  49. Hu, Y.; Wang, C.; Li, R.; Wang, F. Estimating a large drive time matrix between ZIP codes in the United States: A differential sampling approach. J. Transp. Geogr. 2020, 86, 102770. [Google Scholar] [CrossRef] [Scilit] [PubMed]
  50. Hu, S.; Song, W.; Li, C.; Lu, J. A multi-mode Gaussian-based two-step floating catchment area method for measuring accessibility of urban parks. Cities 2020, 105, 102815. [Google Scholar] [CrossRef] [Scilit]
  51. Chatterjee, S.; Naik, S.; John, S.; Dabholkar, H.; Balaji, M.; Koschorke, M.; Varghese, M.; Thara, R.; Weiss, H.A.; Williams, P.; et al. Effectiveness of a community-based intervention for people with schizophrenia and their caregivers in India (COPSI): A randomised controlled trial. Lancet 2014, 383, 1385–1394. [Google Scholar] [CrossRef] [Scilit] [PubMed]
  52. Rigolon, A. A complex landscape of inequity in access to urban parks: A literature review. Landsc. Urban Plan. 2016, 153, 160–169. [Google Scholar] [CrossRef] [Scilit]
  53. Thornicroft, G.; Mehta, N.; Clement, S.; Evans-Lacko, S.; Doherty, M.; Rose, D.; Koschorke, M.; Shidhaye, R.; O’Reilly, C.; Henderson, C. Evidence for effective interventions to reduce mental-health-related stigma and discrimination. Lancet 2016, 387, 1123–1132. [Google Scholar] [CrossRef] [Scilit] [PubMed]
  54. Chen, Y.; Gu, Y.; Cao, L.; Jiang, Y. Urban heat resilience from a state–process perspective: Heatwave-induced cooling service supply–demand mismatch and hierarchical spatial allocation of greening. Sustain. Cities Soc. 2026, 148, 107593. [Google Scholar] [CrossRef] [Scilit]
  55. Lucas, K. Transport and social exclusion: Where are we now? Transp. Policy 2012, 20, 105–113. [Google Scholar] [CrossRef] [Scilit]
  56. Qiu, N.; Xing, Z.; Han, X.; Du, M. Chrono-urbanism in action: Collaborative governance for heritage preservation and livability in Beijing’s Hutongs. Cities 2025, 160, 105841. [Google Scholar] [CrossRef] [Scilit]
  57. Du, M.; Li, W.; Qiu, N.; Liu, X. Shaping active transport behavior: The impact of public safety agencies and judicial institutions. J. Transp. Geogr. 2025, 127, 104261. [Google Scholar] [CrossRef] [Scilit]
  58. Qiu, N.; Li, W.; Han, X.; Jiang, Y.; Zhang, Z.; Du, M. Active commuting: An alternative source of health-promoting physical activity in job-housing imbalance contexts. Humanit. Soc. Sci. Commun. 2025, 12, 1990. [Google Scholar] [CrossRef] [Scilit]
Figure 1. Study area: (a) location of Tianjin in China; (b) location of the study area within Tianjin Municipality; and (c) study area boundary, residential communities included in the analysis, and road network.
Land 15 01884 g001
Figure 2. Theoretical framework of mental health rehabilitation support spaces.
Land 15 01884 g002
Figure 3. Spatial distribution of mental health rehabilitation resources and persons with mental disabilities in the study area: (a) four types of mental health rehabilitation support spaces; (b) persons with mental disabilities in the study sample.
Land 15 01884 g003
Figure 4. Accessibility to four types of rehabilitation support spaces by public transport: (a) professional rehabilitation; (b) natural restorative; (c) social interaction; (d) occupational participation.
Land 15 01884 g004
Figure 5. Walking accessibility to four types of rehabilitation support spaces: (a) professional rehabilitation; (b) natural restorative; (c) social interaction; (d) occupational participation.
Land 15 01884 g005
Figure 6. Accessibility to four types of rehabilitation support spaces when travelling as a car passenger: (a) professional rehabilitation; (b) natural restorative; (c) social interaction; (d) occupational participation.
Land 15 01884 g006
Figure 7. Comprehensive accessibility across three travel modes: (a) public transport; (b) walking; (c) car passenger travel.
Land 15 01884 g007
Figure 8. Bivariate LISA between the standardised number of persons with mental disabilities in each residential community and the spatial lag of standardised comprehensive accessibility under (a) public transport, (b) walking, and (c) car passenger travel. High–low clusters indicate communities with high local rehabilitation demand and low comprehensive accessibility in neighbouring communities.
Land 15 01884 g008
Figure 9. Lorenz curves of accessibility to four types of rehabilitation support spaces across three travel modes.
Land 15 01884 g009
Figure 10. Identification of residential communities with a high proportion of persons with higher support needs and low accessibility across three travel modes: (a) public transport; (b) walking; (c) car passenger travel.
Land 15 01884 g010
Table 1. Classification and screening criteria for mental health rehabilitation support spaces.
Space TypeNumberIncluded Spaces or FacilitiesInclusion and Screening Criteria
Professional rehabilitation spaces51Psychiatric hospitals;
psychiatric departments in general hospitals;
mental health rehabilitation facilities;
community mental health centres;
community rehabilitation service sites for people with mental disorders
Physical facilities offering clinical care, medication management, psychotherapy, functional training, or community rehabilitation
Natural restorative spaces154Comprehensive parks;
community parks;
roadside parks;
waterfront parks and public riverbanks;
other public natural spaces, including urban forests and botanical gardens
Parks and public green spaces with regular opening hours, public entrances, and areas where visitors can spend time and take part in activities
Social interaction spaces107Public libraries;
cultural and community arts centres;
subdistrict or community cultural centres;
integrated community service centres and public-access Party–community service centres;
disability support centres;
public sports centres
Permanent facilities with regular opening hours for residents and usable spaces for public activities
Occupational participation spaces34Disability employment service centres;
vocational training centres;
assisted or sheltered employment facilities;
work and agricultural therapy stations;
vocational rehabilitation sites for mental disorders
Physical facilities offering vocational training, assisted employment, employment support, or vocational rehabilitation
Table 2. Global spatial autocorrelation tests for comprehensive accessibility across three travel modes.
StatisticPublic TransportWalkingCar Passenger Travel
Moran’s I0.9820.7140.824
z-value88.12266.76979.382
p-value0.0010.0010.001
Table 3. Results of needs-based spatial screening for accessibility by space type and comprehensive accessibility across three travel modes.
Travel ModeRehabilitation Support Space Type/IndexNumber of Priority CommunitiesPersons with Mental
Disabilities
Persons with Higher Support Needs
Public transportProfessional rehabilitation120446419
Natural restorative121480449
Social interaction130505469
Occupational participation107478443
Comprehensive accessibility124476445
WalkingProfessional rehabilitation152430410
Natural restorative111481451
Social interaction108479443
Occupational participation206741697
Comprehensive accessibility115442414
Car passenger travelProfessional rehabilitation97248238
Natural restorative110415389
Social interaction108403378
Occupational participation118489462
Comprehensive accessibility111410385
Table 4. Cross-tabulation of communities identified by the Q75–Q25 screening and bivariate LISA of comprehensive accessibility across three travel scenarios.
Travel ModeQ75–Q25 OnlyBivariate LISA H–L OnlyIdentified by Both MethodsNeither Method
Public transport11516691648
Walking113921814
Car passenger travel10713841689
Disclaimer/Publisher’s Note: The statements, opinions and data contained in all publications are solely those of the individual author(s) and contributor(s) and not of MDPI and/or the editor(s). MDPI and/or the editor(s) disclaim responsibility for any injury to people or property resulting from any ideas, methods, instructions or products referred to in the content.