Article

Deciphering the Spatial Code: Identification and Optimization of Ecological Security Pattern—A Case Study of Jiangsu Province, China

1
School of Economics, Nanjing University of Finance and Economics, Nanjing 210023, China
2
Key Laboratory of Coastal Zone Exploitation and Protection, Ministry of Natural Resources, Nanjing 210017, China
3
Jiangsu Province Land Surveying and Planning Institute, Nanjing 210017, China
4
School of Public Administration, HoHai University, Nanjing 211100, China
*
Authors to whom correspondence should be addressed.
Land 2025, 14(9), 1928; https://doi.org/10.3390/land14091928
Submission received: 24 July 2025 / Revised: 15 September 2025 / Accepted: 16 September 2025 / Published: 22 September 2025

Abstract

Optimizing Ecological security patterns (ESPs) is critical for advancing territorial spatial restoration and fostering sustainable regional development. While research on ESPs’ construction has grown significantly, key challenges persist, particularly in the accurate identification of priority conservation areas and the integration of socioeconomic development with ecological conservation. To address these challenges, this study selects Jiangsu Province as a representative case. We move beyond single-factor assessments by combining ecosystem service importance evaluation with a multi-factor ecological sensitivity analysis (including water pollution, soil erosion, air pollution, and anthropogenic pressure). A comprehensive ecological resistance surface is then developed, incorporating both natural and anthropogenic disturbance factors, to evaluate spatial patterns of ecological security. Utilizing the Minimum Cumulative Resistance (MCR) model, we delineate ecological corridors and ultimately construct the ESPs by synthesizing ecological sources and corridors. Key results include: Jiangsu’s ESPs comprises 33 ecological patches (total area: 14,622.46 km2, 13.71% of the study region), predominantly composed of water bodies, wetlands, and cultivated land. Thirteen ecological corridors (total length: 1920.38 km) primarily traverse cultivated land, construction land, and water bodies. The optimized ESPs strategy termed “Two Cores, Two Barriers, Three Belts, Multiple Corridors” offers a concrete spatial blueprint. The findings provide effective scientific reference for assessing and managing regional ecological security trends.

1. Introduction

The concept of Ecological Security Pattern (ESP) originated from landscape ecological planning for biodiversity conservation [1]. It is refers landscape specific configurations that have a useful supporting effect on the ecological processes of the landscape and a few ecologically significant landscape elements [2]. As an effective methodology for delineating priority conservation areas and reconciling socioeconomic development with ecological protection, ESP plays a crucial role in regional sustainability [3]. However, persistent population pressures and long-term exploitation of ecosystems continue to drive ecological security challenges, including environmental pollution, biodiversity loss, soil erosion, and desertification [4]. Therefore, developing scientifically sound ESPs and proposing targeted optimization strategies are essential pathways to achieving high-level ecological security and regional sustainable development [5].
With continuous theoretical and methodological advancements, primary approaches for identifying ESPs have converged into two paradigms: the “Pattern-Process-Service” framework [6] and the “Source Identification-Resistance Surface Construction-Corridor Extraction” methodology [7]. The latter has become the prevailing methodology for ESP identification [8] due to its demonstrated efficacy in enhancing the accuracy of source and corridor delineation and strengthening the scientific rigor of ESP construction.
Ecological sources, defined as habitat patches critical to regional ecological security or possessing radiative ecological functions, form the foundation for constructing ESPs [9]. Two primary methodologies exist for identifying these sources: The first approach directly designates protected areas with high ecosystem service value. For example, ecological protection redlines that meet a certain minimum area threshold were regarded as ecological sources in Kunming [10]. However, this method has been questioned due to its policy-driven and subjectivity [11]. The second employs integrated assessments of habitat quality, remote sensing ecological indices, and ecosystem services [12,13], yet often inadequately addresses anthropogenic disturbances, potentially yielding unrealistic results [14].
The ecological resistance surface reflects the obstacles that species encounter when moving between ecological sources, influenced by both natural conditions and human activities [15]. Constructing this surface is essential for simulating ecological flows and plays a critical role in identifying ecological corridors [16]. The standard method sets resistance values based on landscape types to assess connectivity [17]. However, this approach faces limitations. Resistance assignment faces criticism due to subjectivity and poor differentiation within land-use categories [18]. Values vary widely (hundreds to tens of thousands) without standardization [19]. Small differences between land types reduce model sensitivity, while large differences oversimplify landscape connections and species movement pressures. Recent advancements have incorporated key human factors—such as nighttime lights and population density—along with natural variables including elevation, slope, vegetation cover, and proximity to water, thereby enhancing both accuracy and spatial detail [20]. Current studies also use overly broad land classifications (forest, grassland, cropland, water, construction land, bare land) [11,21]. For example, construction land subtypes (villages, transport zones, scenic areas, green spaces) have very different development levels but share identical resistance values.
Ecological corridors serve as a conduit for element flow between ecological source areas, enhancing ecosystem integrity and connectivity [12,22]. The extraction of ecological corridors constitutes the third step in establishing an ecological security spatial framework. The current literature identifies numerous models applicable to ecological corridor extraction, including the Ant Colony Model [11], Multi-Objective Genetic Algorithm [23], Circuit Theory Model [24], and Graph Theory Model [25]. However, these models are computationally intensive and require stringent data inputs. They exhibit significant limitations when applied to ecological corridor extraction [26].
The Minimal Cumulative Resistance model (MCR) originated in Knaapen et al.’s species dispersal research [27]. MCR is recognised as a premier connectivity assessment tool due to its simple data structure, rapid algorithms, and interpretable outputs [28,29]. Recent applications include urban ESP delineation and ecological planning [14,30]. Consequently, this study employs MCR to simulate least-cost organism movement paths between ecological source areas and extract ecological corridors.
Based on the above analysis, we demonstrate that this article is different from the existing literature in the following aspects:
(1)
We propose an integrated “Importance-Sensitivity” framework for ecological source identification, combining ecosystem service valuation with ecological sensitivity assessment to improve methodological robustness.
(2)
This study utilises land change survey data for ESP construction, contrasting with prior remote sensing-based approaches [11]. The dataset incorporates 56 land classification categories. We established ecological resistance coefficients for distinct land use types, integrating nighttime light data correction to develop a refined resistance surface. MCR was subsequently applied to identify ecological corridors.
(3)
Empirical research focuses on various scales such as river basins [31,32], cities [33,34], and counties [21,24]. Focusing on Jiangsu Province, an economically advanced yet ecologically pressured region, we construct a provincial-scale ESP described as “Two Cores, Two Barriers, Three Belts, and Multiple Corridors”. This approach provides a replicable basis for regional ecological planning and sustainable governance, particularly in developed areas under high anthropogenic pressure.

2. Materials and Methodology

2.1. Study Area

Jiangsu Province (31°45′–35°20′ N, 116°18′–121°57′ E) occupies China’s eastern coastal zone within the subtropical-warm temperate transition region (Figure 1), featuring abundant natural resources [35]. Its terrestrial area spans 1.07 × 10⁵ km2, with plains constituting 68%. A dense river network characterises the study area, containing two of China’s five largest freshwater lakes (Taihu and Hongze). Waterbody ecosystem cover 17% of the land area, second only to agricultural land, defining Jiangsu as a region where the cultivation of rice and fish farming flourish.
Despite its relatively favorable natural baseline conditions, Jiangsu Province is under intense anthropogenic pressure. Data show that the population of Jiangsu Province reached 85.26 million in 2024, leading to acute conflicts between economic development and ecological protection. This makes the province a typical and representative case of how economic advancement drives ecological fragmentation, degradation of ecosystem services, and biodiversity loss in coastal developed regions. For instance, due to the construction of linear infrastructure crossing ecological spaces, the integrity and connectivity of the ecosystem have been affected. River and lake wetlands have been polluted to varying degrees, threatening the ecological security of the water bodies [30]. In the areas along the Yangtze River, there are many heavy industries, and the proportion of river and lake line development is high, which has certain impacts on the protection of water sources and other aspects. It is difficult to significantly improve the quality of the marine eco-environment, and biological diversity is threatened by invasive species, land-based pollution, overfishing, and other factors [36]. Therefore, researching the identification and optimization of ESPs in Jiangsu is not only necessary but also highly relevant for other developing regions globally undergoing similar transitions.

2.2. Data Sources and Processing

The land change survey data employed in this study incorporates eight primary land use categories (forest land, grassland, farmland, wetland, water body, bare land, and construction land) comprising 56 subclasses. These data underwent rasterisation with desensitisation to comply with national security and governance protocols. Additional datasets were utilised (Table 1). To maintain coordinate consistency and minimise spatial distortion, all geospatial data underwent standardised preprocessing, including projection transformation, clipping, and resampling. Final outputs were unified within a consistent spatial reference system (Albers Equal Area Conic Projection) in ArcGIS 10.5 (ESRI Inc., Redlands, CA, USA).

2.3. Methodology

The framework of “source area—resistance surface—corridor” was employed to interpret the spatial code of the ESP in Jiangsu Province. Firstly, ecological source areas were identified based on the importance of ecosystem services and ecological sensitivity. Then, an ecological resistance surface was constructed by using the ecological resistance coefficients of different land use types, and it was corrected by combining with nighttime light data. Finally, ecological corridors were identified based on the MCR model, thereby comprehensively constructing the ESP of Jiangsu Province.

2.3.1. Ecological Source Identification

Evaluating the Ecosystem Services Value
Ecosystem services value is a monetary-based metric used to quantify the impact of human activities on the natural environment and to evaluate the capacity of ecosystems to provide services to humans [37]. In this study, we employed the ESV equivalence table established by Hasan et al. (2020) [38] and Xie et al. (2015) [39], and widely utilized by many scholars to calculate ecosystem services value [5]. Considering that ecosystem services have obvious spatial differences, the equivalent factors need to be corrected [40]. The current economic value of farmland in this region as a source of food production services is equivalent to one seventh of the ecosystem service value equivalent factor [37,39]. The main grain crops in Jiangsu Province are rice, corn, and wheat. The correction is carried out by investigating the annual unit area yields and national average prices of these three types of crops, and the calculation formula is:
E a = 1 7 × i = 1 n m i n i S
where E a represents the monetary value (in USD/hm2) of one standard unit ecosystem service value equivalent factor in Jiangsu Province. i denotes the category of major crops in Jiangsu Province, comprising three types: rice, maize, and wheat. m i is the average price (in USD/t) of crop i . n i is the yield (in t) of crop i . S is the total planting area (in hm2) of the three types of crops. All values are presented in United States Dollars (USD) converted from Chinese Yuan (CNY) using the average annual exchange rate of 2020 (1 USD = 6.897 CNY).
The revised equivalent factor table (Table 2) has been obtained. By combining the value of the unit equivalent factor and conducting calculations, the ecological service value of Jiangsu Province can be determined. The specific formula is as follows:
E k j = e k j × E a
E = k = 1 n j = 1 n S j E k j
where E k j represents the ecological service value coefficient of ecosystem type j for land use type k (in USD/hm2); e k j represents the equivalent factor of ecosystem type j for land use type k . The land use types in the land change survey data were grouped into 6 categories (Table 3). According to “Current Land Use Classification” (National Standard of the People’s Republic of China GB/T 21010-2017 [41]), land use types in the updated land survey data were consolidated into six major categories. It is worth noting that the ecosystem services value provided by the urban and rural construction land system is relatively weak, and its ecological service value is not estimated. j represents forest, grassland, farmland, wetland, water body, and bare land. E represents the total value of ecosystem services in the study area (in USD). S j represents the land use area of ecosystem service type j (in hm2).
Based on land change survey data and utilizing Equations (1)–(3), the total ecosystem service value in Jiangsu Province for 2020 was calculated to be USD 44.407 billion. Employing the Jenks natural breaks classification in ArcGIS 10.5, ecosystem services value was categorised into five tiers: extremely high, high, moderate, low, and very low.
Ecological Sensitivity Assessment
Ecological sensitivity assessment elucidates potential ecological vulnerabilities within natural systems, identifying high-sensitivity zones with limited post-disturbance resilience. This provides an ecosystem stability enhancement perspective for conservation area delineation [34]. An evaluation framework comprising five dimensions was established: waterbody pollution, soil degradation, atmospheric pollution, degradation of ecologically functional land, and construction land pressure (Table 4).
Factor weighting was determined using the coefficient of variation method, whereby the weight of each factor is calculated as the proportion of its coefficient of variation to the sum of all factors’ coefficients of variation [42].
W = S x ¯ i = 1 n S i x i ¯
where W is the weight of the assessment factor; S is the standard deviation of the assessment factor; x ¯ is the arithmetic mean of the assessment factor; and i is the index number of assessment factors.

2.3.2. Ecological Resistance Surface Construction

Species migration between ecological sources encounters resistance influenced by natural and anthropogenic disturbances [43]. Landscape resistance values vary across species due to their dispersal capacities—areas suitable for the diffusion of one species may act as barriers for others. A typical example is rivers: they significantly obstruct the movement of terrestrial wildlife while serving as corridors for aquatic organisms. Land use types reflect an integrated representation of natural processes and human activities, indicating the level of resistance wildlife may encounter when moving between source patches. Therefore, in the absence of species-specific data, land use types can serve as a valid basis for assigning cost values [44].
The coefficients of ecological resistance surfaces were set following an established set of procedures [45]. Referring to relevant empirical studies on the setting of ecological resistance surface coefficients [30,46], resistance surfaces under seven scenarios were constructed based on corresponding land use types. Forest land was assigned the lowest value of 1 due to its highest vegetation coverage and minimal human interference. Grassland, with relatively lower vegetation coverage than forest land, was assigned a resistance coefficient of 10 [5]. Although water bodies are considered ecological land, they obstruct terrestrial ecological flows [47], and thus were assigned a resistance coefficient of 100. Wetlands, serving as transition zones between land and water with good vegetation coverage [48], were assigned a resistance coefficient of 50—lower than that of water bodies but higher than that of grassland. Farmland, being an ecological space significantly influenced by human activities [49], was assigned a resistance coefficient of 200. Bare land as having medium-high resistance for general terrestrial fauna, as it provides limited cover and resources while increasing exposure risks [50]. Therefore, the ecological resistance coefficient of Bare land is set at 500. Given that the construction land within the study area is subject to intense anthropogenic disturbance and has sparse vegetation [30], these areas were assigned the highest resistance value of 1000.
To enhance the accuracy of ecological resistance surface assignment, NPP-VIIRS nighttime light raster data were applied to calibrate the baseline ecological resistance coefficients [8], calculated as follows:
R i = N L i N L A ¯ × R
where, N L i represents the nighttime light data value of grid i ; N L A ¯ represents the average nighttime light data value of land use type A corresponding to grid i ; R represents the baseline ecological resistance coefficient of land use type corresponding to grid i .

2.3.3. Ecological Corridor Extraction

Wider corridors are generally considered more ecologically beneficial [51]. However, excessively wide corridors may impede biotic flow exchange across corridors. They also require substantial investment, with costs increasing alongside width [52]. Narrow corridors may fail to meet sensitive species’ basic requirements, reducing corridor quality [53]. Currently, no comprehensive study systematically establishes the scientific basis for determining corridor width or provides definitive width-setting paradigms. Therefore, this study adopts a minimum width standard of 1000 m, referenced from studies on large-species ecological corridors [54], as the corridor width for this research.
The minimum cumulative resistance model was employed to simulate least-cost paths for species movement between ecological sources, extracting ecological corridors [55]. The formalisation is as follows.
M C R = f m i n k = 1 m ( D i j × R i )
where MCR is the minimum cumulative resistance value of the species diffusion between the source and the target. f indicates the positive correlation function between the minimum cumulative resistance and the ecological process. D i j indicates the spatial distance traversed by the source j to unit i , and R i indicates the resistance coefficient of the unit i to species diffusion. Central points of each ecological source were derived as focal nodes in ArcGIS 10.5. The Cost Distance tool within the Spatial Analyst module generated cumulative resistance surfaces radiating from these sources. Subsequently, the Linkage Mapper toolkit identified optimal least-cost paths, with proximal corridors amalgamated into consolidated ecological corridors through vector merging.

3. Results

3.1. Characteristics of Ecological Source

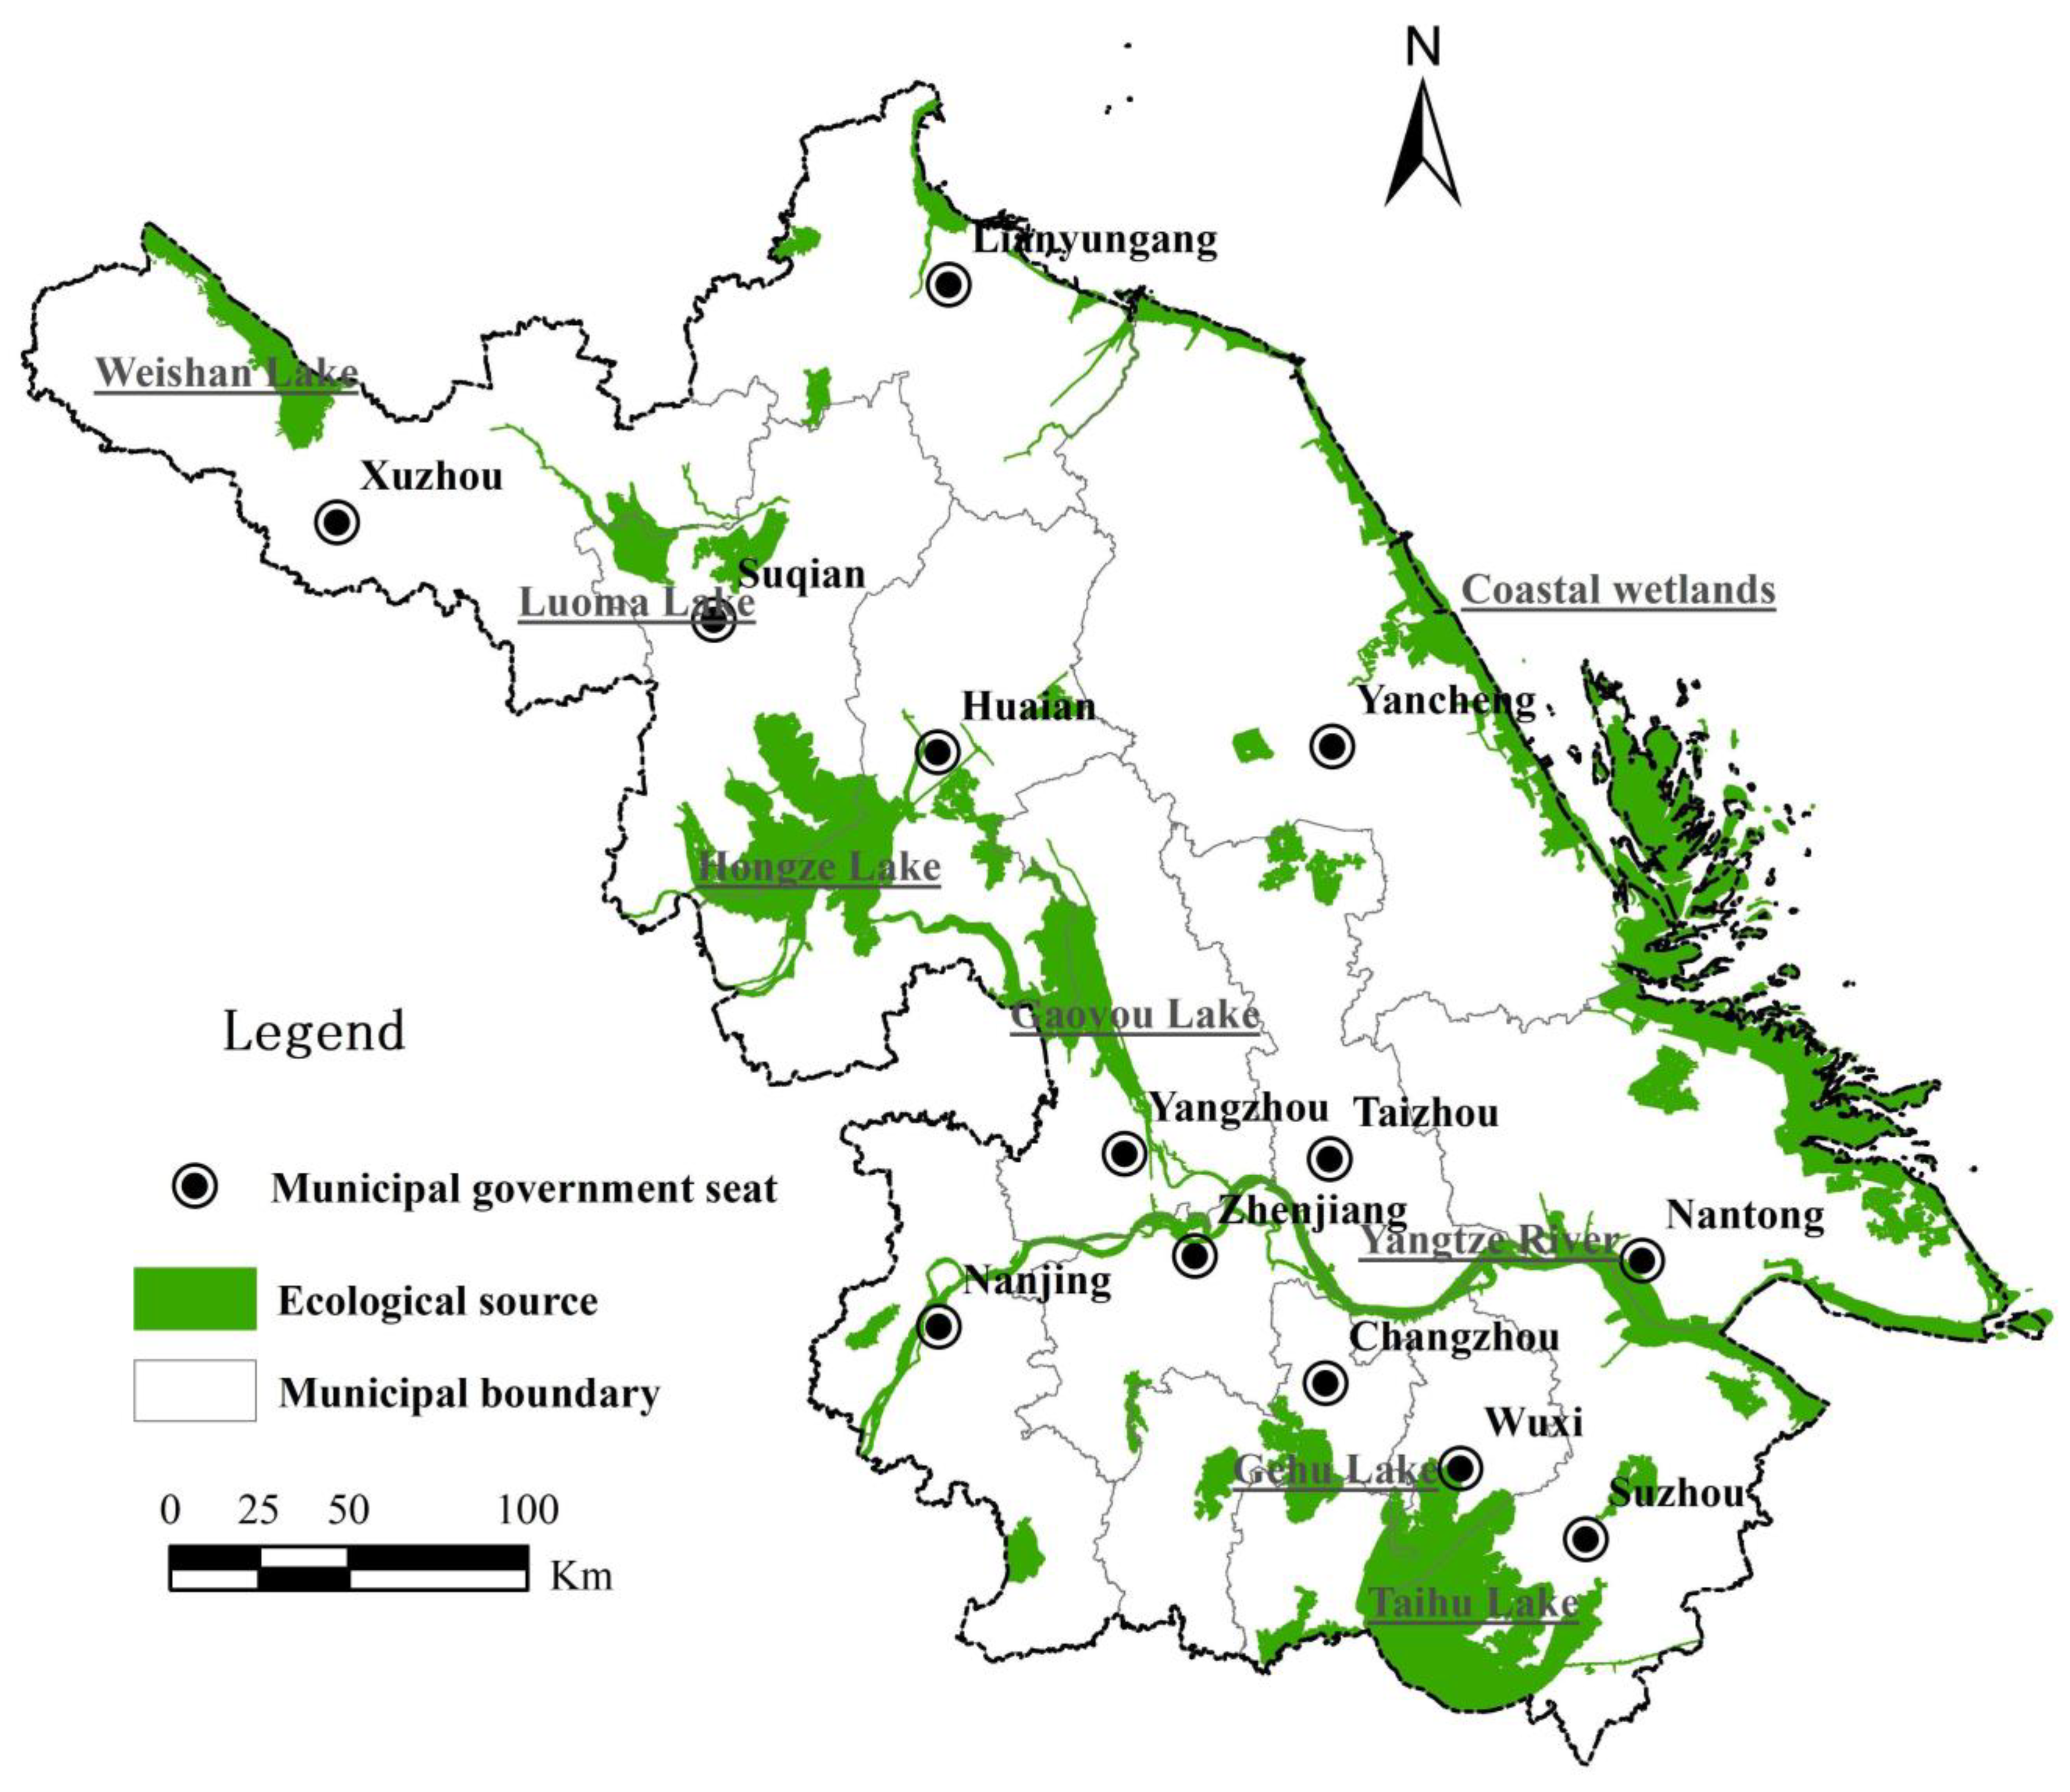
High ecosystem services value concentrations occurred near water-abundant regions including Taihu Lake, Gaoyou Lake, Poyang Lake, the Yangtze River estuary, and coastal wetlands. Ecological sensitivity was similarly stratified into five levels, with extremely sensitive and sensitive zones covering 21.20% of Jiangsu’s territory—these areas served as intermediate units for identifying high-sensitivity ecological source patches. Spatial overlay analysis integrated ecologically significant zones with high-sensitivity areas, with adjacent source patches amalgamated to delineate 33 ecological sources (Figure 2), spanning 14,622.46 km2 (13.71% of study area).
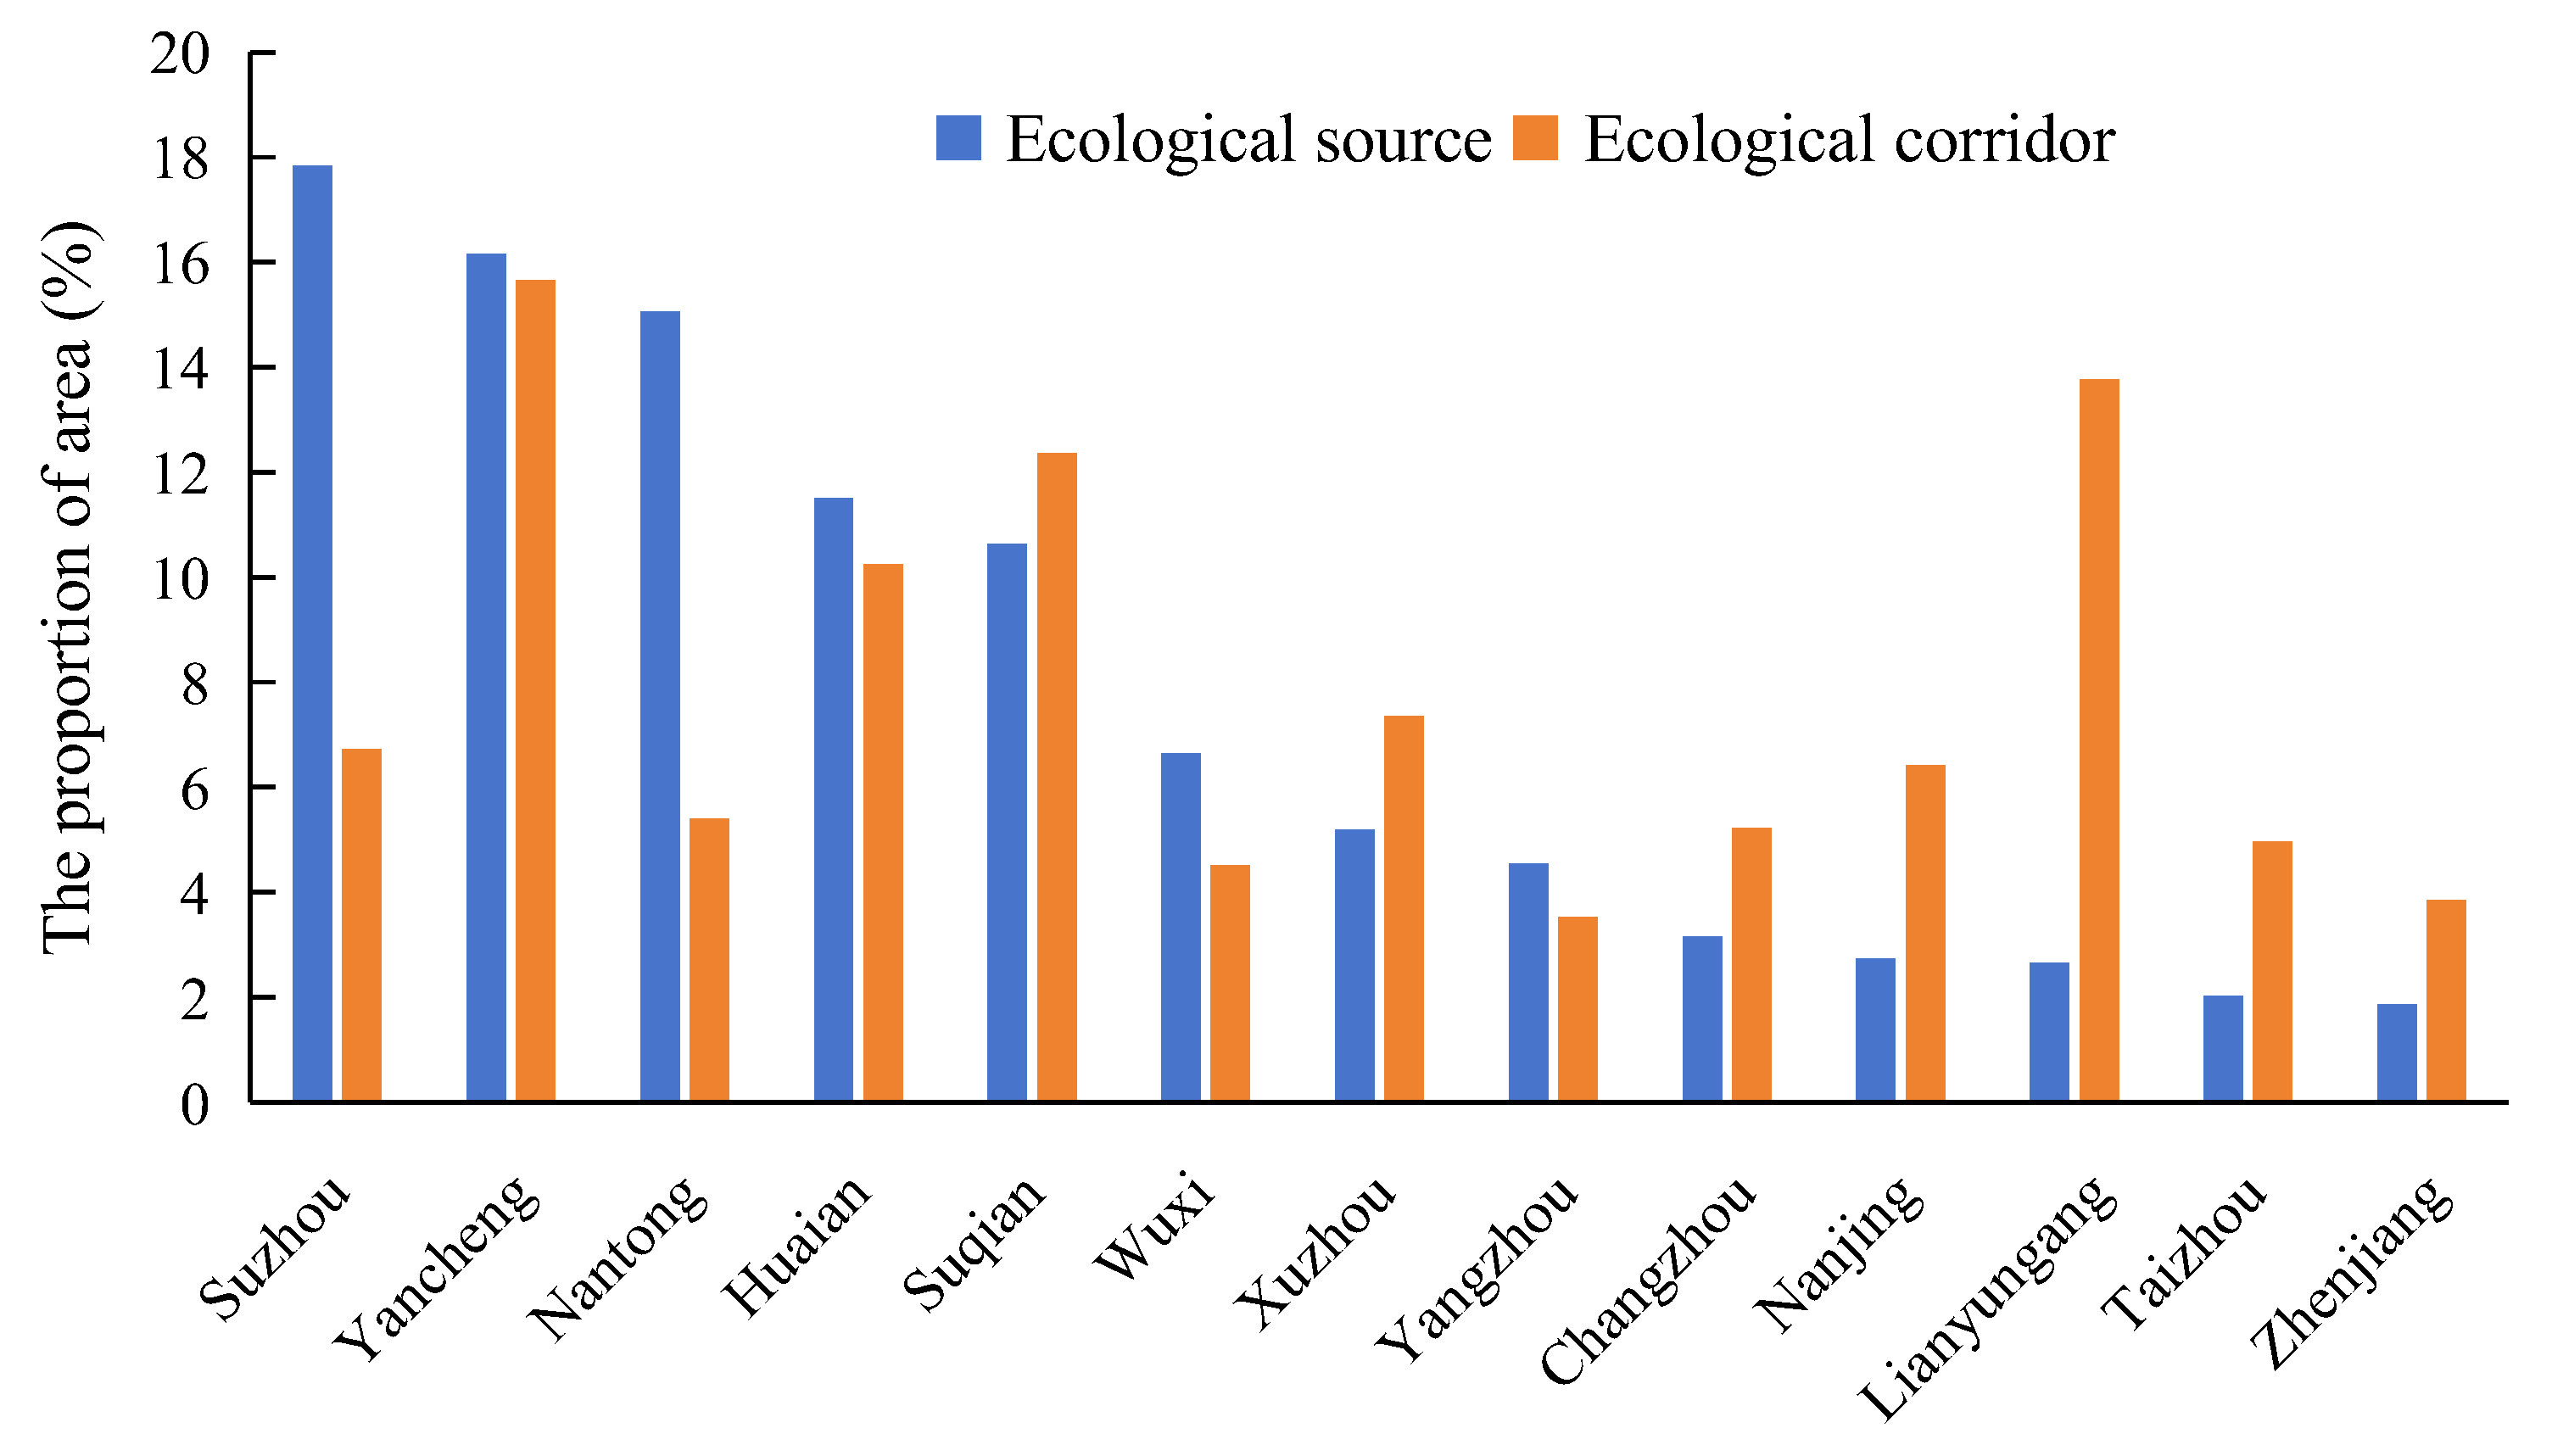
From a spatial layout perspective, the distribution of ecological source areas across prefecture-level cities in Jiangsu Province is highly uneven (Figure 3). Suzhou, Yancheng, and Nantong are the dominant contributors, accounting for 17.83%, 16.16%, and 15.06% of the total ecological source area, respectively. Together, these three municipalities comprise nearly half of the province’s ecological resources. Following them are Huaian (11.51%) and Suqian (10.64%), indicating a concentration in northern and coastal regions. In contrast, central and southern municipalities like Wuxi (6.64%), Changzhou (3.15%), Nanjing (2.74%), and Zhenjiang (1.86%) possess significantly smaller proportions. This spatial pattern suggests that ecological sources are primarily aggregated in the northern and eastern parts of Jiangsu, highlighting a distinct regional imbalance in the distribution of crucial ecosystem services.
Regarding landscape composition, water bodies constitute the largest proportion (59.90%) within ecological sources, attributable to their elevated ecosystem services value and heightened ecological sensitivity. Wetlands—critical for faunal habitats—account for 24.70% of corridor areas. Forest land covers merely 2.78% due to limited extent and high fragmentation across Jiangsu. These delineated sources align with the “Lake-Wetland Ecological Space” framework established in the Jiangsu Provincial Territorial Spatial Planning (2021–2035). However, our analysis revealed that a small fraction (2.79%) of construction land exhibited high ecological function. Upon careful verification, these specific patches correspond to large urban green infrastructures, such as: expansive urban parks and botanical gardens; large water bodies (e.g., reservoirs, lakes) within the city; other vegetated areas with high coverage (e.g., university campuses, golf courses). Although their land use category is “construction land”, their physical attributes (vegetation, water) allow them to provide significant ecosystem services. Thus, they were objectively identified as “ecological sources” in a functional sense.

3.2. Spatial Distribution of Ecological Resistance Surface

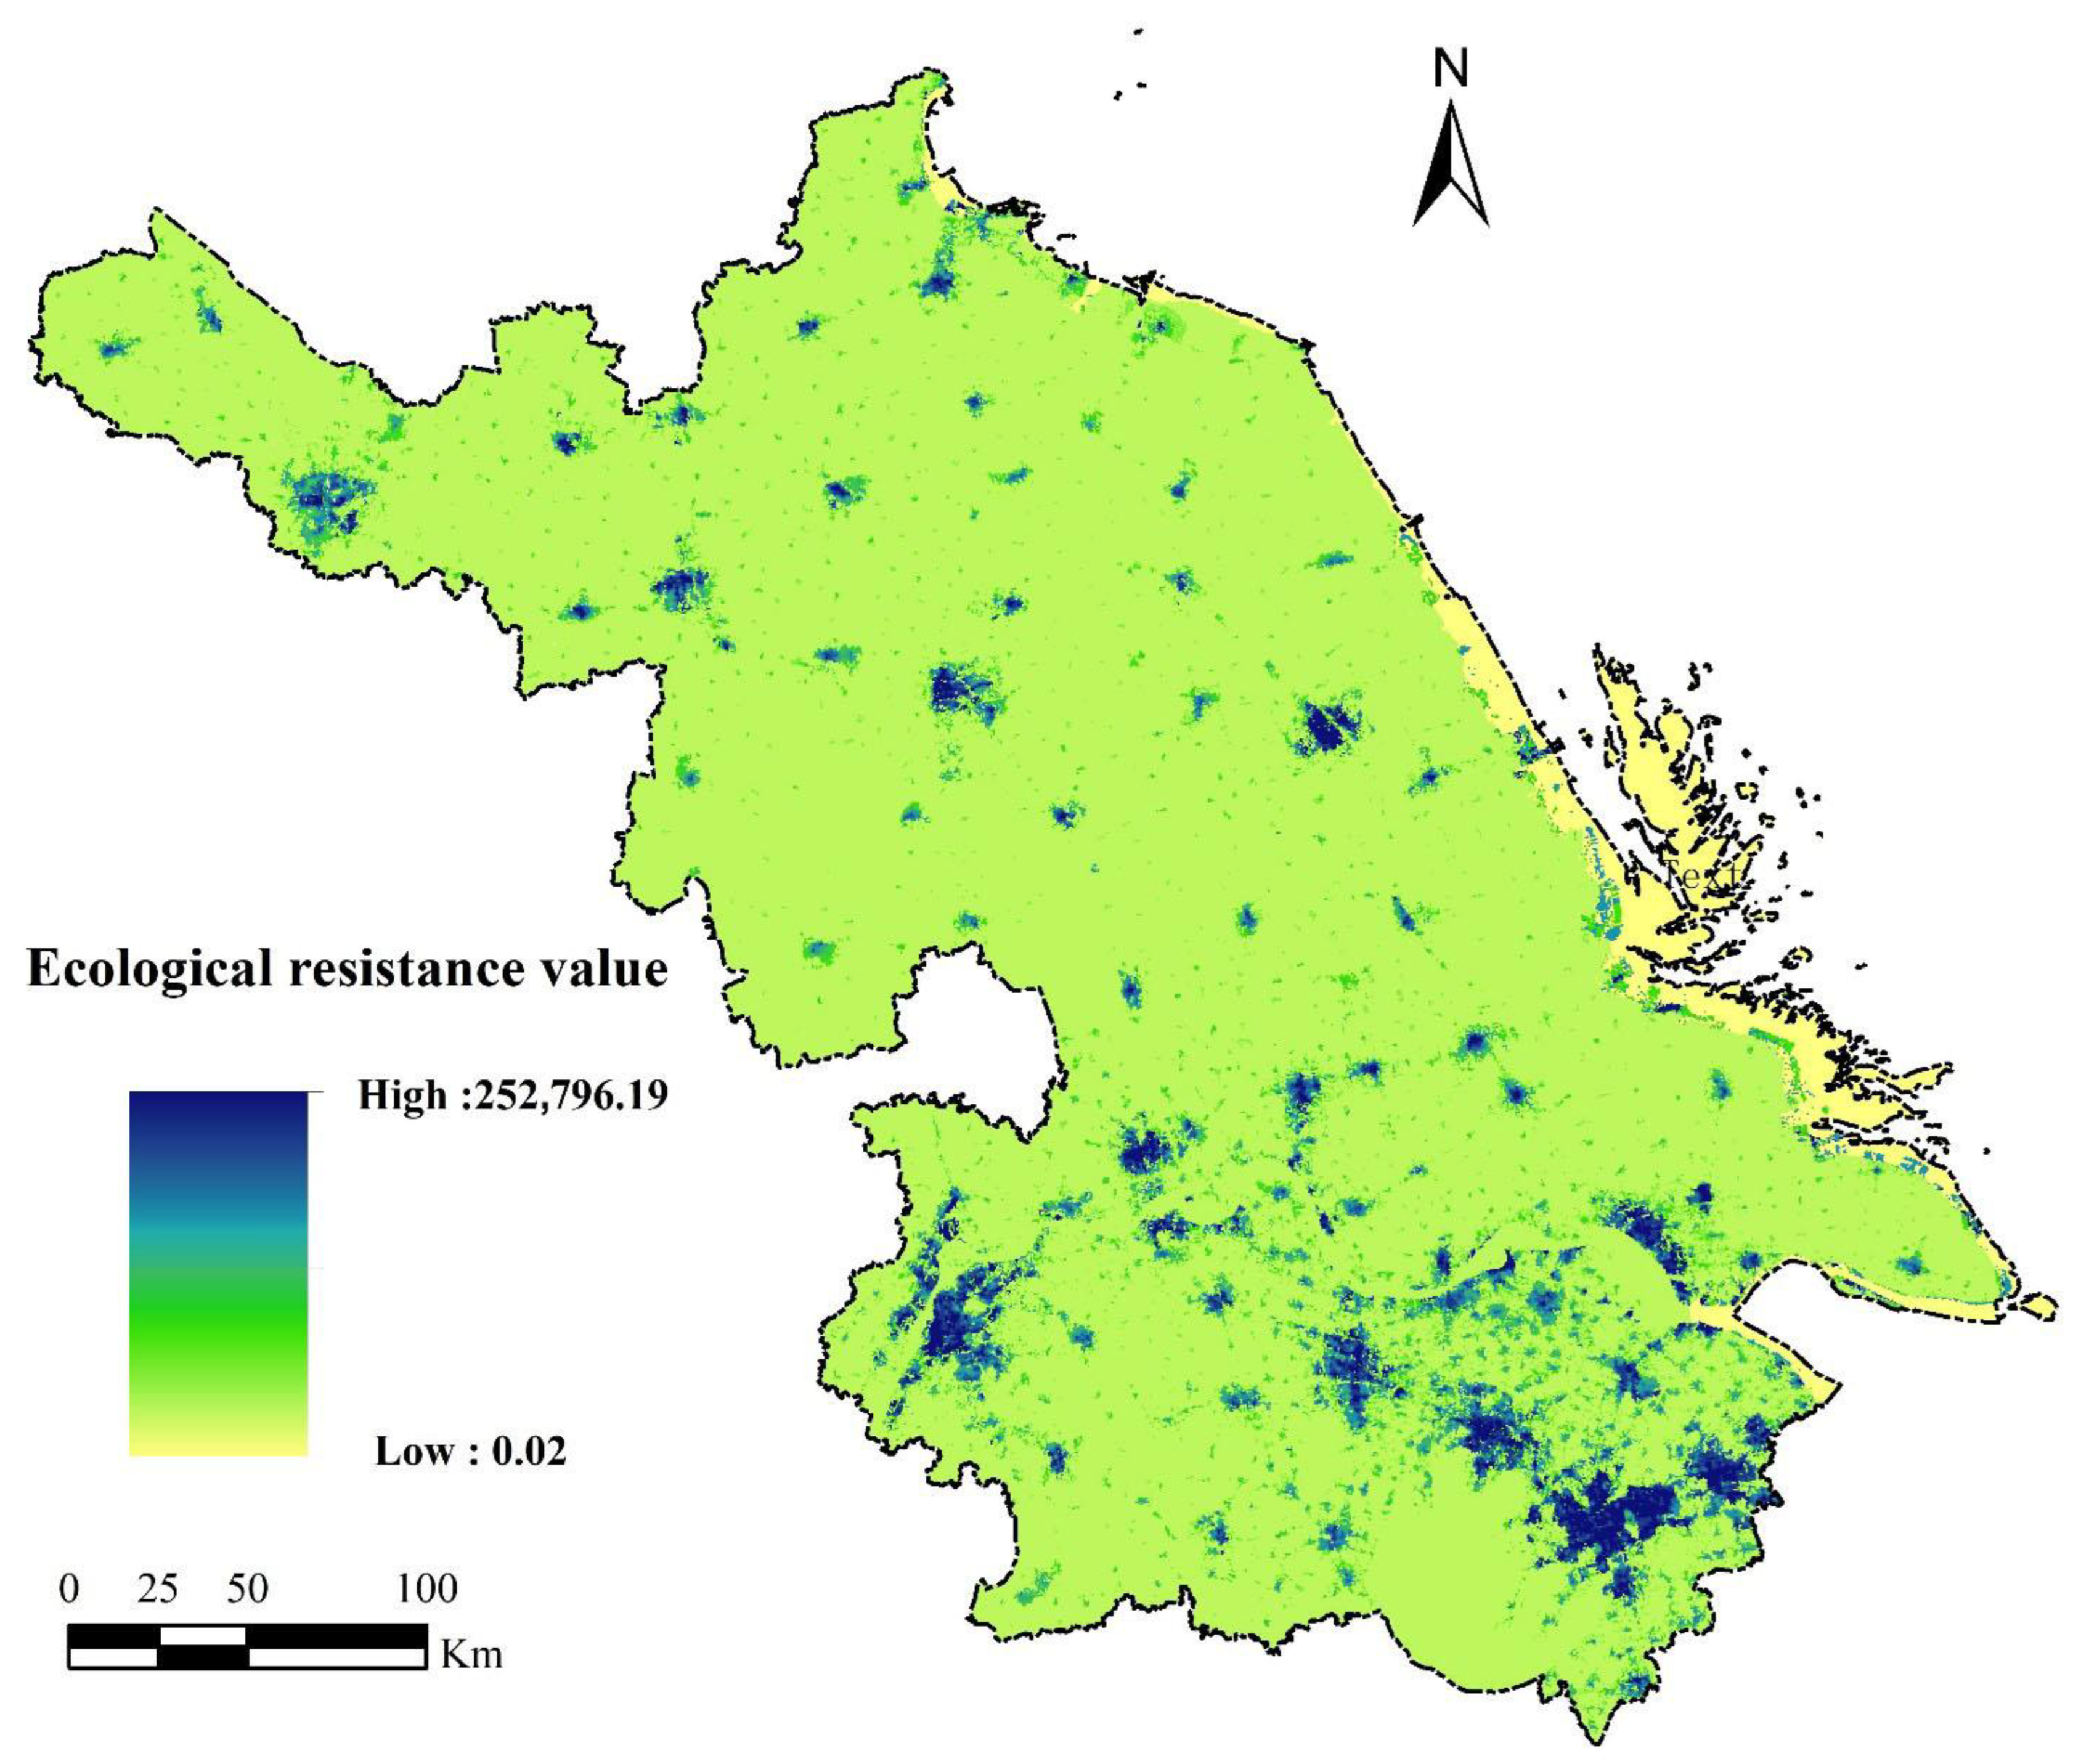
Calibration using Jiangsu’s nighttime light luminosity values refined the baseline ecological resistance coefficients, with results depicted in Figure 4. The resistance surface exhibited extreme spatial heterogeneity, ranging from 0.02 (minimum) to 252,796.19 (maximum). High-resistance zones predominantly coincided with densely urbanised cores, reflecting degraded ecological baseline conditions. Within these areas, intensive anthropogenic activities have severely diminished ecological land cover, underscoring conservation challenges in rapidly urbanising landscapes. Medium-resistance regions—characterised by urban scenic areas, green spaces, rural source patches, and minor rural roads—demonstrate greater ecological permeability, functioning as provisional pathways for material flows and species movement. Low-resistance zones displayed strong inverse correlation with light intensity, dominated by forested land and coastal wetlands with minimal human disturbance, sparse infrastructure, and superior ecological integrity.

3.3. Spatial Distribution of Ecological Corridor

Ecological corridors for Jiangsu Province were proposed using the Minimum Cumulative Resistance (MCR) model, totalling 13 corridors with a combined length of 1934.16 km (Figure 5). This network comprises 36 major corridors, including those along the Yangtze River, the Taihu Lake-Weishan Lake corridor, the Gaoyou Lake-Yancheng coastal wetlands corridor, and the Hongze Lake-Lianyungang coastal wetlands corridor. The Yangtze River corridor is the longest, spanning 350.97 km. Leveraging the Yangtze River waterway, it serves as a critical channel connecting the eastern coastal wetlands with the inland lakes. The Weishan Lake-Taihu Lake corridor, also known as the Beijing-Hangzhou Grand Canal, links major ecological sources including Weishan Lake, Luoma Lake, Hongze Lake, Baima Lake, Gaoyou Lake, the Yangtze River, and Taihu Lake. Its construction requires a corridor length of 288.73 km.
From a spatial perspective, the analysis of ecological corridor length distribution across prefecture-level cities in Jiangsu Province reveals significant disparities (Figure 3). Yancheng (15.66%), Lianyungang (13.77%), and Suqian (12.36%) exhibit the highest proportions, indicating these northern and coastal regions possess relatively extensive ecological corridor networks. In contrast, Yangzhou (3.53%), Zhenjiang (3.85%), and Wuxi (4.52%) demonstrate the lowest proportions, suggesting more fragmented or limited corridor coverage in these areas, often associated with intense urbanization in central and southern Jiangsu. Central municipalities like Nanjing (6.41%) and Suzhou (6.72%) maintain intermediate levels. This spatial pattern highlights a general trend of higher ecological corridor density in less developed northern regions compared to the more urbanized and industrialized south.
Cropland constitutes the largest proportion (38.56%) of the corridor landscape. This predominance is primarily attributed to cropland being the most extensive land cover type within Jiangsu Province. Construction land accounts for 25.73% of the corridor area. This land cover type poses significant barriers to species migration. Water Bodies represent 22.92% of the area within the potential corridors. Although water bodies generally impose considerable resistance to animal movement, the extensive and well-developed water network in Jiangsu Province necessitates that potential ecological corridors inevitably traverse smaller water bodies. To mitigate the resistance posed by water to animal migration, artificial afforestation can be implemented along the banks to provide stopover habitats during migration. Woodland occupies only 8.17% of the potential corridor landscape. As woodlands serve as crucial stepping stones for biological migration.

3.4. ESP of Two Cores, Two Barriers, Three Belts, and Multiple Corridors

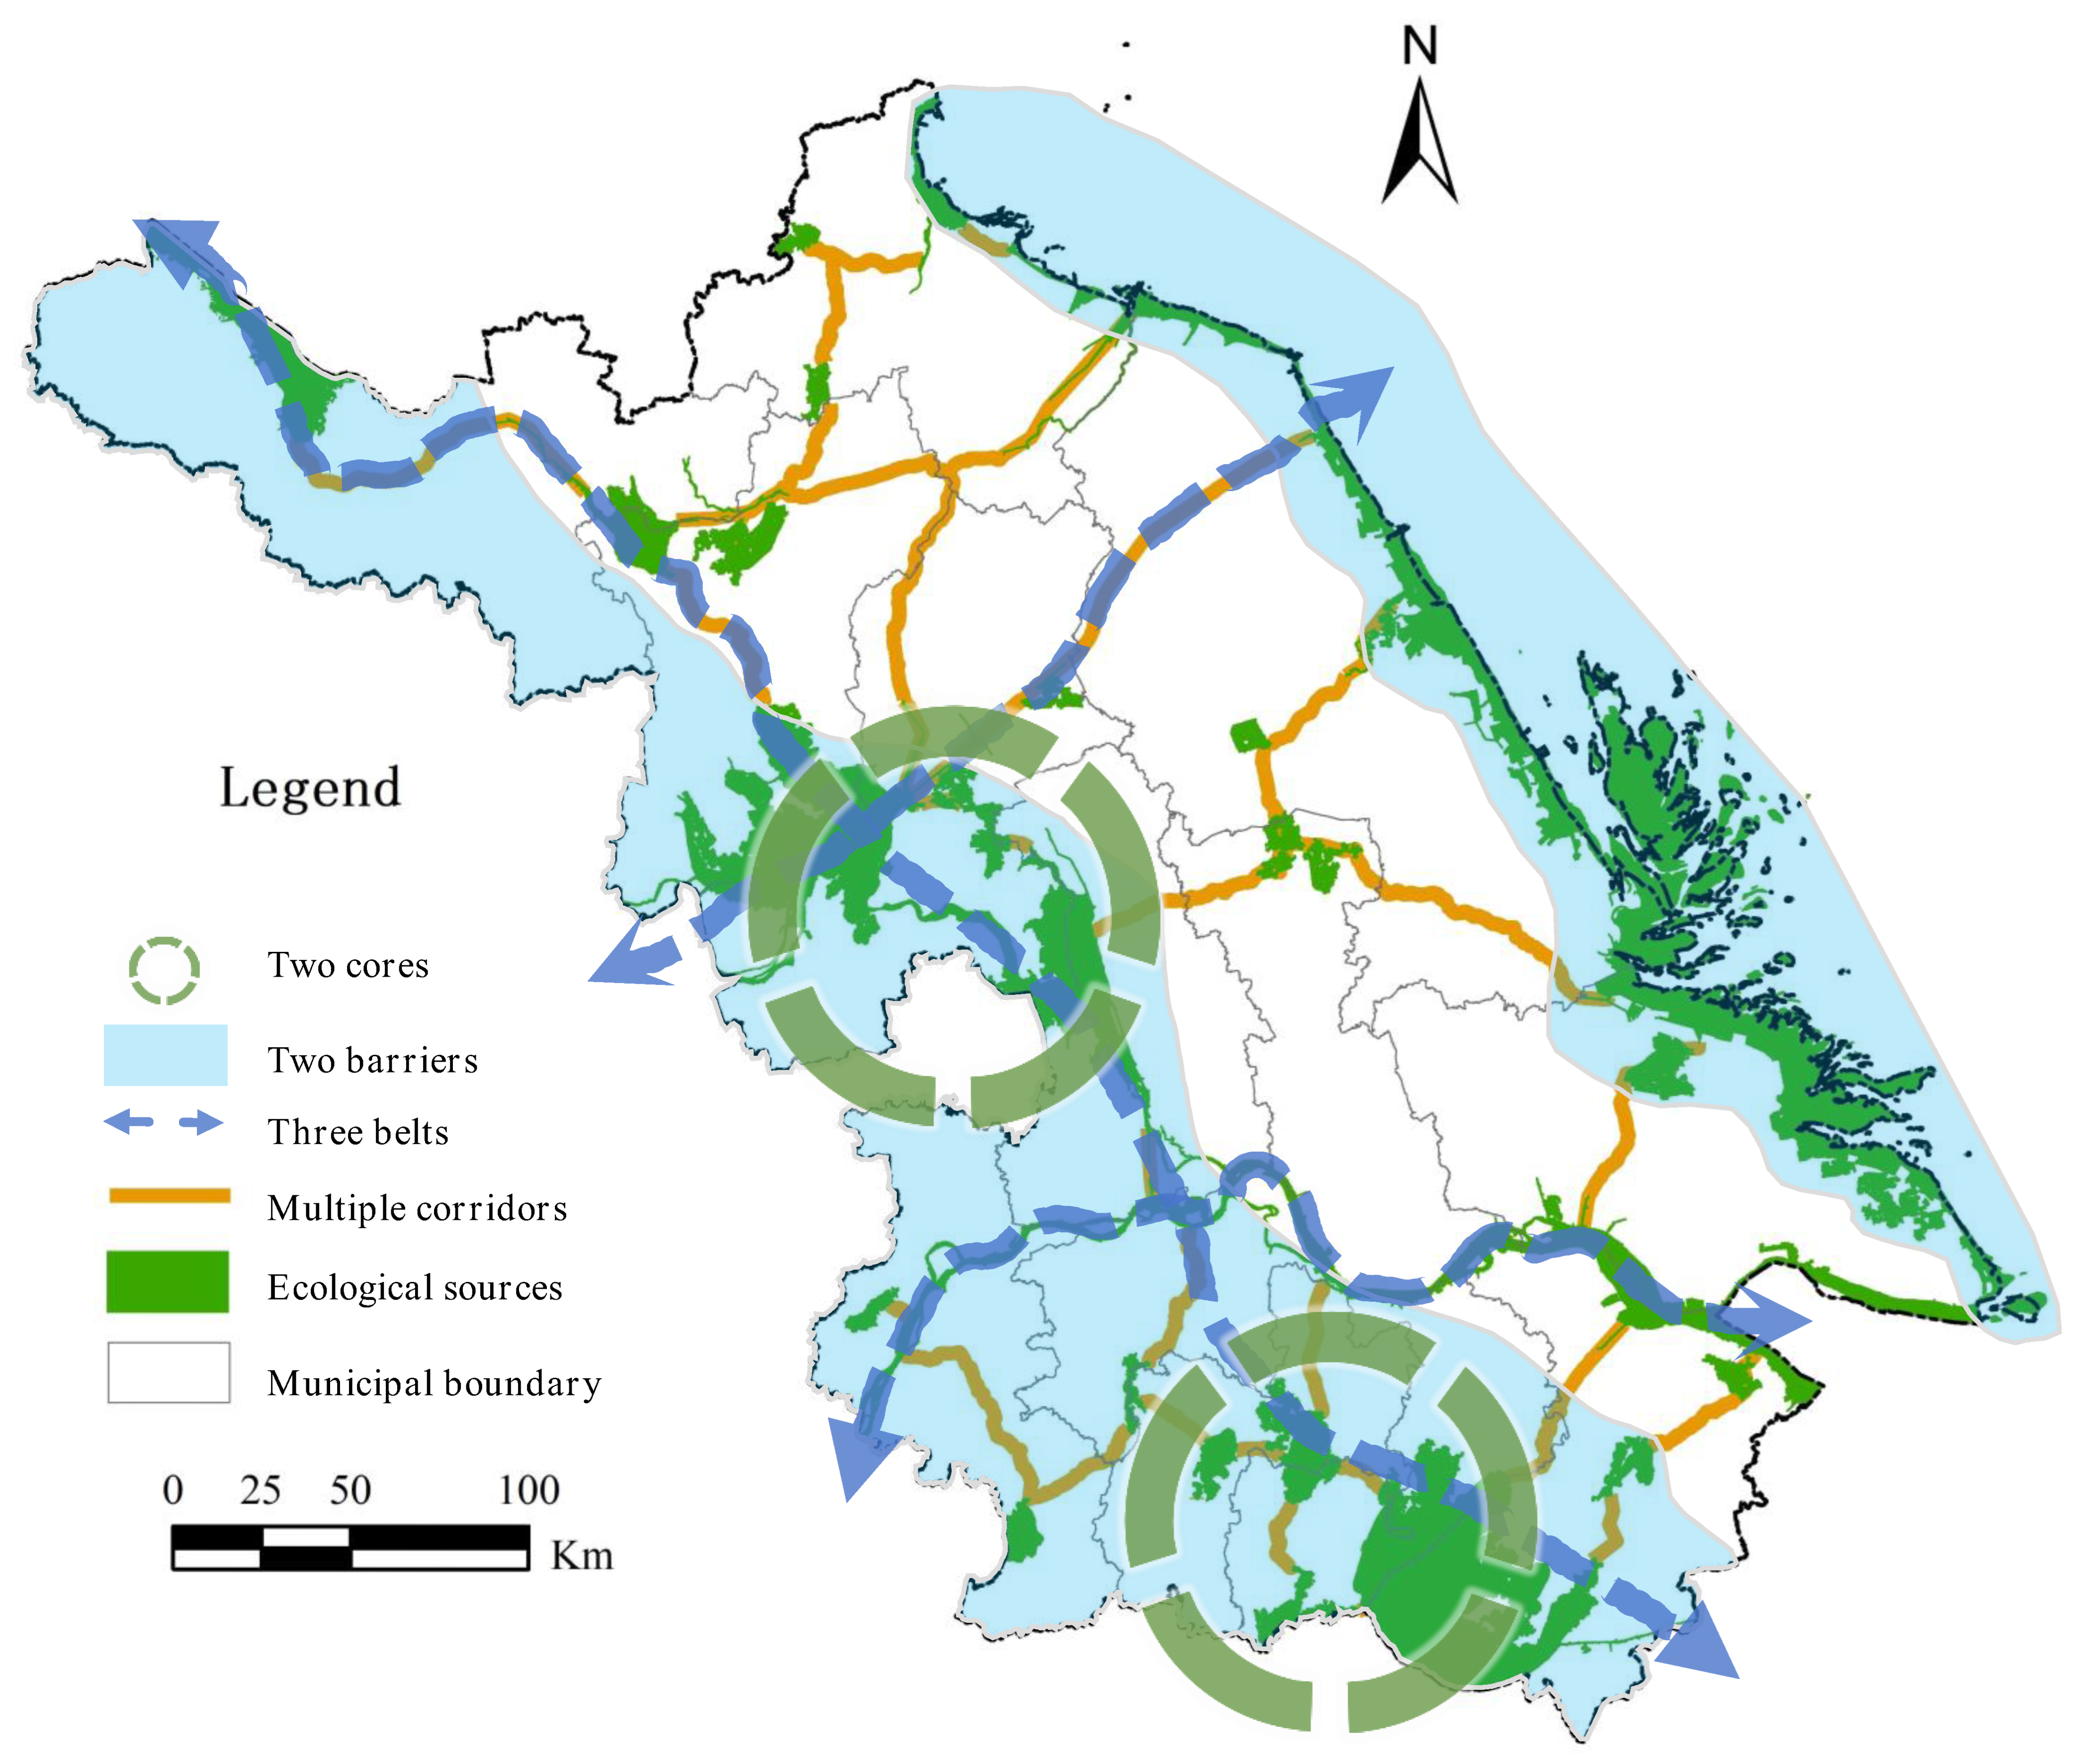
Based on the “Ecological Source Identification—Resistance Surface Construction—Corridor Extraction” framework, core components of the ecological network—including ecological sources and corridors—were identified. Integrated with assessments of ecosystem services importance and sensitivity in Jiangsu Province, this resulted in the formation of an ESP characterized as “Two Cores, Two Barriers, Three Belts, and Multiple Corridors” (Figure 6).
(1)
Two Cores refer to the ecological cores containing key ecological sources: the Taihu Hilly Ecological Green Core and the Jianghuai Lake Complex Ecological Green Core. The Taihu Hilly Ecological Green Core encompasses Taihu Lake and the administrative regions of Gaochun District (Nanjing), Yixing City (Wuxi), as well as Jintan District and Liyang City (Changzhou). The Jianghuai Lake Complex Ecological Green Core comprises lake groups in central Jiangsu such as Hongze Lake and Gaoyou Lake, spanning Hongze District, Xuyi County, and Jinhu County (Huai’an); Sihong County and Siyang County (Suqian); Gaoyou City and Baoying County (Yangzhou); and Xinghua City (Taizhou).
(2)
Two Barriers denote the Coastal Ecological Barrier and the Western Hilly Ecological Barrier. The Coastal Ecological Barrier consists of Jiangsu’s extensive nearshore waters and coastal zones, incorporating typical marine ecosystems like coastal wetlands, estuaries, and bays. The Western Hilly Ecological Barrier refers to the Jianghuai Hills, Ningzhen Mountains, Yili Mountains, and their surrounding lake areas.
(3)
Three Belts represent ecological conservation belts with composite functions including ecological conservation, landscape recreation, and ventilation corridors. These include: (1) the Yangtze River Ecological Conservation Belt, a vital drinking water source area in Jiangsu, crucial for maintaining aquatic migration corridors and protecting biodiversity; (2) the Hongze Lake-Huaihe River Estuary Ecological Conservation Belt, encompassing the water body ecological sources and corridor areas of Hongze Lake, the Huaihe River, and other water bodies; (3) the Grand Canal (Beijing-Hangzhou) Belt, China’s most renowned canal, forming a continuous north-south green ecological conservation corridor traversing Jiangsu.
(4)
Multiple Corridors constitute the ecological sources and connecting corridors, primarily comprising cross-regional, river-coastal water system ecological corridors such as the Yangtze River, Huaihe River, Yi-Shu-Si River system, and the Grand Canal. These serve as vital passages for species migration.

4. Discussion

4.1. Response to Research Objectives and Methodological Approach

This study aimed to construct an ESPs for Jiangsu Province by integrating ecosystem services, ecological sensitivity, and anthropogenic pressures to identify key ecological sources and corridors. In response to the fixed objectives, we developed a composite identification framework that not only emphasizes ecological supply capacity but also incorporates human-induced stressors such as pollution, land degradation, and urbanization pressure. This approach enables a more realistic representation of ecological security in highly urbanized regions.
The results show that ecological sources cover 13.71% of Jiangsu’s territory, which is lower than values reported in less developed regions (e.g., 23.1% in the Shule River Basin [11] and 31.47–43.26% in the Loess Plateau [56]), reflecting the intense anthropogenic pressure and high urbanization rate in Jiangsu. A total of 1934.16 km of ecological corridors were identified, forming a connected network that facilitates ecological flows and enhances landscape functionality. For instance, the Yangtze River–Taihu Lake corridor has been documented to facilitate seasonal bird migrations and fish spawning migrations [19]. The spatial structure of the ESP aligns with the “Two Cores, Two Barriers, Three Belts, Multiple Corridors” framework proposed in the Jiangsu Provincial Territorial Spatial Planning (2021–2035) [57], confirming its practical relevance.

4.2. Comparative Analysis with Studies in China and Southeast Asia

Compared to other studies in China, our approach demonstrates adaptability to high-urbanization contexts. For instance, research in the Pearl River Delta used future land-use simulation and multi-scenario analysis to enhance ESP robustness under urban expansion [5]. Although our study did not incorporate future scenarios, the integration of nighttime light data to modify resistance surfaces and the inclusion of ecological sensitivity factors improve the accuracy of corridor identification under current anthropogenic pressures.
In Southeast Asia, ESP research often focuses on biodiversity-rich or coastal ecosystems using circuit theory or minimum cumulative resistance models, but with limited integration of socio-economic factors. For example, studies in the Red River Delta [58] or Bangkok Metropolitan Region [59] primarily emphasize habitat connectivity without fully considering urban pressure. Our method offers a transferable framework for deltaic and coastal regions experiencing rapid urbanization, where balancing economic growth and ecological conservation is critical.
The smaller proportion of ecological sources in Jiangsu—compared to arid and semi-arid regions—highlights the region’s unique socio-ecological context: high population density, extensive built-up land, and intensive agriculture [36,60]. Nevertheless, the higher corridor connectivity achieved in our study underscores the importance of strengthening landscape linkages in human-dominated environments.

4.3. Implication for Optimising the ESP

The spatial analysis reveals a pronounced north-south disparity in Jiangsu’s ecological infrastructure. Ecological sources are predominantly aggregated in the northern and coastal municipalities (e.g., Yancheng, Huai’an), which function as the province’s primary ecological baselands. Conversely, the highly urbanized and economically developed southern regions (e.g., Suzhou, Wuxi) exhibit significantly fragmented sources and sparse corridor networks, heightening their vulnerability to ecological degradation.
This spatial mismatch necessitates differentiated conservation strategies. For the northern source-rich areas, policy should prioritize strict protection against urban sprawl and industrial encroachment. In the central and southern regions, the focus must shift to strategic ecological restoration, including creating stepping-stone patches and strengthening the width and quality of existing corridors to mitigate fragmentation. Crucially, cross-administrative coordination is imperative to construct north-south spanning corridors, ensuring ecological connectivity and flow across the entire province, thereby enhancing overall ecosystem resilience.
Based on the “Two Cores, Two Barriers, Three Belts, Multiple Corridors”, our findings support highly targeted ecological optimization. The spatial concentration of sources in northern Jiangsu underscores their role as irreplaceable baselands, demanding absolute protection from urban and industrial encroachment. Conversely, the identified corridor gaps in the heavily urbanized south highlight an urgent need for strategic restoration to ensure landscape connectivity.
Policy must reflect this duality: (1) In northern core areas, enforce strict protection and large-scale ecological projects (e.g., mining subsidence restoration, coastal wetland rehabilitation). (2) For southern urban agglomerations, prioritize the construction of stepping-stone patches and the widening of critical corridors to counter fragmentation. (3) Key corridors, particularly those crossing administrative boundaries (e.g., Yangtze River, Grand Canal), require inter-jurisdictional coordination for integrated pollution control and shoreline re-naturalization. This spatially explicit guidance translates the ecological pattern into actionable priorities for securing Jiangsu’s ecological security network.

4.4. Limitations and Future Research

This study provides critical references for ecological conservation and landscape planning, offering insights to help balance socioeconomic growth with environmental carrying capacity and advance urban sustainability goals. However, several limitations should be noted. First, the identification of ecological sources and corridors was based on a static analysis under current environmental and socioeconomic conditions, which does not fully account for the dynamic interactions and long-term evolution of ecological systems. Second, the current model does not incorporate species-specific habitat suitability or movement data, limiting the functional specificity of the corridors. The actual effectiveness of these corridors requires further empirical verification through field studies such as wildlife tracking, remote camera monitoring, or genetic connectivity analysis [58]. Third, the determination of ecological corridor widths relied on a uniform threshold (1 km), which may not adequately reflect the specific requirements of different species or landscape contexts [54].
We acknowledge that species-specific responses may vary, but this value represents a conservative and widely accepted estimate for multi-species connectivity planning at the landscape scale.
Future research should incorporate dynamic simulation models, such as those integrating land use change with ecosystem processes, to project spatial-temporal changes in ESPs. Moreover, species-specific movement characteristics and ecological niche differentiations should be considered to optimize the width and structure of ecological corridors, thereby enhancing their effectiveness in promoting biodiversity and landscape connectivity. It is also essential to integrate multi-species requirements and conduct cost-benefit analyses to improve both the ecological relevance and economic feasibility of corridor implementation.

5. Conclusions

Establishing effective ESPs and targeted ecological restoration strategies is crucial for balancing regional development and conservation. This study firstly developed an “importance-sensitivity” identification method for ecological sources. Subsequently, it reconstructed the ecological resistance surface. Ecological corridors were extracted using the MCR model. Finally, the ESP was constructed with optimisation measures proposed. Key conclusions are as follows:
(1)
Jiangsu’s total ecological source area covers 1.46 × 10⁴ km2, representing 13.71% of the province. These sources concentrate in eastern coastal mudflats (3274.30 km2) across Yancheng, Nantong, and Lianyungang; major lakes including Taihu, Hongze, Gaoyou, and Luoma; and woodland patches in southwestern Jiangsu. Water bodies constitute 59.90% of ecological source landscapes.
(2)
The province’s ecological corridors span 1934.16 km. They structurally connect northern, central, and southern Jiangsu. The densest connectivity occurs among Suqian and Lianyungang (north), Huai’an and Yancheng (centre), and Yangzhou and Wuxi (south). Cultivated land dominates corridor landscapes at 38.56%.
(3)
An ESP of “Two Cores, Two Barriers, Three Belts, Multiple Corridors” was established, with targeted optimisation policy recommendations proposed.
This study presents a rational and innovative approach for constructing ESPs, supporting urban sustainability by balancing socio-economic development with environmental carrying capacity. While the framework offers a scientific basis for ecological planning in urbanizing regions, it is limited by its use of static modelling for long-term time-series data and structural connectivity-based corridor definitions. Future work should incorporate dynamic modelling and functional connectivity to improve ecological relevance.

Author Contributions

Conceptualization, H.M., C.Q. and X.B.; data curation, Q.L.; formal analysis, Z.G. and C.S.; methodology, H.M., Z.G. and X.B.; project administration, X.Z. and C.S.; software, Z.G.; writing—review and editing, H.M., Q.L., X.Z., Z.G. and C.Q. All authors have read and agreed to the published version of the manuscript.

Funding

This work was supported by the National Natural Science Foundation of China (No. 42101204, No. 42371293).

Data Availability Statement

The data presented in this study are available on request from the corresponding author. The data are not publicly available due to privacy restrictions.

Conflicts of Interest

The authors declare no conflicts of interest.

References

  1. Yu, K.J. Security patterns and surface model in landscape ecological planning. Landsc. Urban Plan. 1996, 36, 1–17. [Google Scholar] [CrossRef]
  2. Wang, Y.; Pan, J.H. Building ecological security patterns based on ecosystem services value reconstruction in an arid inland basin: A case study in Ganzhou District, NW China. J. Clean. Prod. 2019, 241, 118337. [Google Scholar] [CrossRef]
  3. Gou, M.M.; Li, L.; Ouyang, S.; Shu, C.; Xiao, W.F.; Wang, N.; Hu, J.W.; Liu, C.F. Integrating ecosystem service trade-offs and rocky desertification into ecological security pattern construction in the Daning river basin of southwest China. Ecol. Indic. 2022, 138, 108845. [Google Scholar] [CrossRef]
  4. Meng, H.; Liu, Q.M.; Yang, J.; Li, J.B.; Chuai, X.; Huang, X.J. Spatial Interaction and Driving Factors between Urban Land Expansion and Population Change in China. Land 2024, 13, 1295. [Google Scholar] [CrossRef]
  5. Li, L.; Huang, X.J.; Wu, D.F.; Yang, H. Construction of ecological security pattern adapting to future land use change in Pearl River Delta, China. Appl. Geogr. 2023, 154, 102946. [Google Scholar] [CrossRef]
  6. Fu, B.J.; Liu, Y.X.; Zhao, W.W.; Wu, J.G. The emerging “pattern-process-service-sustainability” paradigm in landscape ecology. Landsc. Ecol. 2025, 40, 54. [Google Scholar] [CrossRef]
  7. Klar, N.; Herrmann, M.; Henning-Hahn, M.; Pott-Dörfer, B.; Hofer, H.; Kramer-Schadt, S. Between ecological theory and planning practice: (Re-) Connecting forest patches for the wildcat in Lower Saxony, Germany. Landsc. Urban Plan. 2012, 105, 376–384. [Google Scholar] [CrossRef]
  8. Li, L.; Huang, X.J.; Wu, D.F.; Wang, Z.L.; Yang, H. Optimization of ecological security patterns considering both natural and social disturbances in China’s largest urban agglomeration. Ecol. Eng. 2022, 180, 106647. [Google Scholar] [CrossRef]
  9. Xie, H.L.; He, Y.F.; Choi, Y.; Chen, Q.R.; Cheng, H. Warning of negative effects of land-use changes on ecological security based on GIS. Sci. Total Environ. 2020, 704, 135427. [Google Scholar] [CrossRef]
  10. Lai, J.L.; Qi, S. Construction of ecological security pattern based on ecological protection red line, machine learning algorithms, and circuit theory: A case study of Kunming city, China. J. Clean. Prod. 2025, 520, 146117. [Google Scholar] [CrossRef]
  11. Pan, J.H.; Liang, J.; Zhao, C.C. Identification and optimization of ecological security pattern in arid inland basin based on ordered weighted average and ant colony algorithm: A case study of Shule River basin, NW China. Ecol. Indic. 2023, 154, 110588. [Google Scholar] [CrossRef]
  12. Dai, L.; Liu, Y.B.; Luo, X.Y. Integrating the MCR and DOI models to construct an ecological security network for the urban agglomeration around Poyang Lake, China. Sci. Total Environ. 2021, 754, 141868. [Google Scholar] [CrossRef]
  13. Pierik, M.E.; Dell’Acqua, M.; Confalonieri, R.; Bocchi, S.; Gomarasca, S. Designing ecological corridors in a fragmented landscape: A fuzzy approach to circuit connectivity analysis. Ecol. Indic. 2016, 67, 807–820. [Google Scholar] [CrossRef]
  14. Li, S.C.; Xiao, W.; Zhao, Y.L.; Lv, X.J. Incorporating ecological risk index in the multi-process MCRE model to optimize the ecological security pattern in a semi-arid area with intensive coal mining: A case study in northern China. J. Clean. Prod. 2020, 247, 119143. [Google Scholar] [CrossRef]
  15. Zhang, Y.L.; Zhao, Z.Y.; Yang, Y.Y.; Fu, B.J.; Ma, R.M.; Lü, Y.H.; Wu, X. Identifying ecological security patterns based on the supply, demand and sensitivity of ecosystem service: A case study in the Yellow River Basin, China. J. Environ. Manag. 2022, 315, 115158. [Google Scholar] [CrossRef] [PubMed]
  16. Jia, Q.Q.; Jiao, L.M.; Lian, X.H.; Wang, W.L. Linking supply-demand balance of ecosystem services to identify ecological security patterns in urban agglomerations. Sustain. Cities Soc. 2023, 92, 104497. [Google Scholar] [CrossRef]
  17. Wang, J.X.; Lai, X.W.; Zhang, Z.F.; Zhou, S.L.; Lv, L.G.; Fan, Y.T. Optimization of territorial ecological space under the constraint of ecosystem service externalities. Ecol. Indic. 2024, 168, 112752. [Google Scholar] [CrossRef]
  18. Meier, K.; Kuusemets, V.; Luig, J.; Mander, Ü. Riparian buffer zones as elements of ecological networks: Case study on Parnassius mnemosyne distribution in Estonia. Ecol. Eng. 2005, 24, 531–537. [Google Scholar] [CrossRef]
  19. Liang, K.Y.; Jin, X.J.; Zhang, X.L.; Song, J.P.; Li, Q.Q.; Ying, S.C.; Qi, Z.; Zhou, Y.K. Construction of ecological security patterns coupling supply and demand of ecosystem services: A case study of Southern Jiangsu Province. Acta Ecol. Sin. 2024, 44, 3880–3896. [Google Scholar] [CrossRef]
  20. Jalkanen, J.; Toivonen, T.; Moilanen, A. Identification of ecological networks for land-use planning with spatial conservation prioritization. Landsc. Ecol. 2020, 35, 353–371. [Google Scholar] [CrossRef]
  21. Nie, W.B.; Shi, Y.; Siaw, M.J.; Yang, F.; Wu, R.W.; Wu, X.; Zheng, X.Y.; Bao, Z.Y. Constructing and optimizing ecological network at county and town Scale: The case of Anji County, China. Ecol. Indic. 2021, 132, 108294. [Google Scholar] [CrossRef]
  22. Liang, J.; He, X.Y.; Zeng, G.M.; Zhong, M.H.; Gao, X.; Li, X.; Li, X.D.; Wu, H.P.; Feng, C.T.; Xing, W.L.; et al. Integrating priority areas and ecological corridors into national network for conservation planning in China. Sci. Total Environ. 2018, 626, 22–29. [Google Scholar] [CrossRef]
  23. Gobeyn, S.; Mouton, A.M.; Cord, A.F.; Kaim, A.; Volk, M.; Goethals, P.L.M. Evolutionary algorithms for species distribution modelling: A review in the context of machine learning. Ecol. Model. 2019, 392, 179–195. [Google Scholar] [CrossRef]
  24. Zhang, T.Y.; Chen, W.B.; Sheng, Z.Y.; Wang, P.Q.; Guan, F.Y. Ecological network construction and identification of important elements based on morphological spatial pattern analysis and circuit theory in Pingxiang City. J. Nat. Conserv. 2025, 86, 126902. [Google Scholar] [CrossRef]
  25. Lin, J.; Wang, Y.; Lin, Z.; Li, S. National-scale connectivity analysis and construction of forest networks based on graph theory: A case study of China. Ecol. Eng. 2025, 216, 107639. [Google Scholar] [CrossRef]
  26. Wang, Y.X.; Qiao, J.M.; Hu, Y.M.; Zhang, Q.; Han, X.L.; Li, C.L. Risk Assessment of Non-Point Source Pollution Based on the Minimum Cumulative Resistance Model: A Case Study of Shenyang, China. Land 2025, 14, 88. [Google Scholar] [CrossRef]
  27. Knaapen, J.P.; Scheffer, M.; Harms, B. Estimating Habitat Isolation in Landscape Planning. Landsc. Urban Plan. 1992, 23, 1–16. [Google Scholar] [CrossRef]
  28. Chen, Z.F.; Liu, Y.S.; Feng, W.L.; Li, Y.R.; Li, L.N. Study on spatial tropism distribution of rural settlements in the Loess Hilly and Gully Region based on natural factors and traffic accessibility. J. Rural Stud. 2022, 93, 441–448. [Google Scholar] [CrossRef]
  29. Wang, S.; Wu, M.Q.; Hu, M.M.; Fan, C.; Wang, T.; Xia, B.C. Promoting landscape connectivity of highly urbanized area: An ecological network approach. Ecol. Indic. 2021, 125, 107487. [Google Scholar] [CrossRef]
  30. Xiao, S.C.; Wu, W.J.; Guo, J.; Ou, M.H.; Pueppke, S.G.; Ou, W.X.; Tao, Y. An evaluation framework for designing ecological security patterns and prioritizing ecological corridors: Application in Jiangsu Province, China. Landsc. Ecol. 2020, 35, 2517–2534. [Google Scholar] [CrossRef]
  31. Huang, Y.; Huang, J.L.; Liao, T.J.; Liang, X.; Tian, H. Simulating urban expansion and its impact on functional connectivity in the Three Gorges Reservoir Area. Sci. Total Environ. 2018, 643, 1553–1561. [Google Scholar] [CrossRef]
  32. Wei, C.Z.; Taubenböck, H.; Blaschke, T. Measuring urban agglomeration using a city-scale dasymetric population map: A study in the Pearl River Delta, China. Habitat Int. 2017, 59, 32–43. [Google Scholar] [CrossRef]
  33. Li, F.; Ye, Y.P.; Song, B.W.; Wang, R.S. Evaluation of urban suitable ecological land based on the minimum cumulative resistance model: A case study from Changzhou, China. Ecol. Model. 2015, 318, 194–203. [Google Scholar] [CrossRef]
  34. Hu, X.J.; Ma, C.M.; Huang, P.; Guo, X. Ecological vulnerability assessment based on AHP-PSR method and analysis of its single parameter sensitivity and spatial autocorrelation for ecological protection ? A case of Weifang City, China. Ecol. Indic. 2021, 125, 107464. [Google Scholar] [CrossRef]
  35. Meng, H.; Huang, X.J.; Yang, H.; Chen, Z.G.; Yang, J.; Zhou, Y.; Li, J.B. The influence of local officials’ promotion incentives on carbon emission in Yangtze River Delta, China. J. Clean. Prod. 2019, 213, 1337–1345. [Google Scholar] [CrossRef]
  36. Sun, X.L.; Peng, B.H.; Elahi, E.; Wan, A.X. Examining the evolution and influential factors of regional ecological security patterns: A case study of Jiangsu Province, China. Stoch. Environ. Res. Risk Assess. 2025, 39, 999–1013. [Google Scholar] [CrossRef]
  37. Costanza, R.; de Groot, R.; Sutton, P.; van der Ploeg, S.; Anderson, S.J.; Kubiszewski, I.; Farber, S.; Turner, R.K. Changes in the global value of ecosystem services. Glob. Environ. Chang. 2014, 26, 152–158. [Google Scholar] [CrossRef]
  38. Hasan, S.S.; Zhen, L.; Miah, M.G.; Ahamed, T.; Samie, A. Impact of land use change on ecosystem services: A review. Environ. Dev. 2020, 34, 100527. [Google Scholar] [CrossRef]
  39. Xie, G.D.; Zhang, C.X.; Zhang, L.M.; Chen, W.H.; Li, S.M. Improvement of the Evaluation Method for Ecosystem Service Value Based on Per Unit Area. J. Nat. Resour. 2015, 30, 1243–1254. [Google Scholar] [CrossRef]
  40. Xu, L.F.; Xu, X.G.; Luo, T.; Zhu, G.R.; Ma, Z.W. Services based on land use:A case study of Bohai Rim. Geogr. Res. 2012, 31, 1775–1784. (In Chinese) [Google Scholar]
  41. GB/T 21010-2017; Current Land Use Classification. China National Standardization Administration: Beijing, China, 2017.
  42. Ust, Y.; Sogut, O.S.; Sahin, B.; Durmayaz, A. Ecological coefficient of performance (ECOP) optimization for an irreversible Brayton heat engine with variable-temperature thermal reservoirs. J. Energy Inst. 2006, 79, 47–52. [Google Scholar] [CrossRef]
  43. Li, Y.Y.; Wei, M.; Zhou, R.; Jin, H.; Chen, Y.S.; Hong, C.J.; Duan, W.T.; Li, Q.Y. Identifying priority restoration areas based on ecological security pattern: Implications for ecological restoration planning. Ecol. Indic. 2025, 174, 113486. [Google Scholar] [CrossRef]
  44. Fanhua, K.; Haiwei, Y.; Nakagoshi, N.; Yueguang, Z. Urban green space network development for biodiversity conservation: Identification based on graph theory and gravity modeling. Landsc. Urban Plan. 2010, 95, 16–27. [Google Scholar] [CrossRef]
  45. Liu, Z.; Wang, Y.; Li, Z.; Peng, J. Impervious surface impact on water quality in the process of rapid urbanization in Shenzhen, China. Environ. Earth Sci. 2013, 68, 2365–2373. [Google Scholar] [CrossRef]
  46. Peng, J.; Pan, Y.J.; Liu, Y.X.; Zhao, H.J.; Wang, Y.L. Linking ecological degradation risk to identify ecological security patterns in a rapidly urbanizing landscape. Habitat Int. 2018, 71, 110–124. [Google Scholar] [CrossRef]
  47. Wei, Q.Q.; Abudureheman, M.; Halike, A.; Yao, K.X.; Yao, L.; Tang, H.; Tuheti, B. Temporal and spatial variation analysis of habitat quality on the PLUS-InVEST model for Ebinur Lake Basin, China. Ecol. Indic. 2022, 145, 109632. [Google Scholar] [CrossRef]
  48. Ribeiro, J.W.; Silveira dos Santos, J.; Dodonov, P.; Martello, F.; Brandão Niebuhr, B.; Ribeiro, M.C. LandScape Corridors (lscorridors): A new software package for modelling ecological corridors based on landscape patterns and species requirements. Methods Ecol. Evol. 2017, 8, 1425–1432. [Google Scholar] [CrossRef]
  49. Li, S.N.; Zhu, C.M.; Lin, Y.; Dong, B.Y.; Chen, B.J.; Si, B.; Li, Y.J.; Deng, X.D.; Gan, M.Y.; Zhang, J.; et al. Conflicts between agricultural and ecological functions and their driving mechanisms in agroforestry ecotone areas from the perspective of land use functions. J. Clean. Prod. 2021, 317, 128453. [Google Scholar] [CrossRef]
  50. Liang, Y.; Jiao, J.; Tang, B.; Cao, B.; Li, H. Response of runoff and soil erosion to erosive rainstorm events and vegetation restoration on abandoned slope farmland in the Loess Plateau region, China. J. Hydrol. 2020, 584, 124694. [Google Scholar] [CrossRef]
  51. Shen, J.K.; Wang, Y.C. An improved method for the identification and setting of ecological corridors in urbanized areas. Urban Ecosyst. 2023, 26, 141–160. [Google Scholar] [CrossRef]
  52. Ersoy, E.; Jorgensen, A.; Warren, P.H. Identifying multispecies connectivity corridors and the spatial pattern of the landscape. Urban For. Urban Green. 2019, 40, 308–322. [Google Scholar] [CrossRef]
  53. Loro, M.; Ortega, E.; Arce, R.M.; Geneletti, D. Ecological connectivity analysis to reduce the barrier effect of roads. An innovative graph-theory approach to define wildlife corridors with multiple paths and without bottlenecks. Landsc. Urban Plan. 2015, 139, 149–162. [Google Scholar] [CrossRef]
  54. Zhou, Y.; Feng, Z.; Lin, Q.; Wang, J.B.; Zhang, K.X.; Wu, K.N. Research progress on the width of ecological corridors in ecological security paltem. Chin. J. Appl. Ecol. 2025, 36, 918–926. [Google Scholar]
  55. Ghosh, A.; Maiti, R. Development of new Ecological Susceptibility Index (ESI) for monitoring ecological risk of river corridor using F-AHP and AHP and its application on the Mayurakshi river of Eastern India. Ecol. Inform. 2021, 63, 101318. [Google Scholar] [CrossRef]
  56. Fu, Y.J.; Shi, X.Y.; He, J.; Yuan, Y.; Qu, L.L. Identification and optimization strategy of county ecological security pattern: A case study in the Loess Plateau, China. Ecol. Indic. 2020, 112, 106030. [Google Scholar] [CrossRef]
  57. Jiangsu Provincial People’s Government. Jiangsu Provincial Territorial Spatial Planning (2021–2035). Available online: https://zrzy.jiangsu.gov.cn/gtxxgk/nrglIndex.action?type=2&messageID=2c9082548b6e0094018b6fda45ab00b9 (accessed on 3 September 2024).
  58. Ma, X.P.; Li, J.; Yu, Y.Y.; Xu, X.T. Water Ecological Security Pattern Based on Hydrological Regulation Service: A Case Study of the Upper Hanjiang River. Sustainability 2024, 16, 7913. [Google Scholar] [CrossRef]
  59. Zou, Y.; Wang, S.Q.; Luo, X.; Jin, H.Y.; Xiao, X.; Li, Y.A. A new multivariate index for ecological security assessment in the China-Myanmar border region. J. Environ. Manag. 2024, 364, 121447. [Google Scholar] [CrossRef] [PubMed]
  60. Zhang, O.S.; Li, F.X.; Wang, D.W.; Li, M.C.; Chen, D. Analysis on changes of ecological spatial connectivity in Jiangsu Province based on ecological network. Acta Eeologica Sin. 2021, 41, 3007–3020. (In Chinese) [Google Scholar]
Figure 1. The study area.
Land 14 01928 g001
Figure 2. Spatial distribution of ecological sources in Jiangsu Province.
Land 14 01928 g002
Figure 3. Proportion of ecological sources and corridors in the 13 municipalities of Jiangsu Province in 2020.
Land 14 01928 g003
Figure 4. Spatial distribution of revised ecological resistance surface of Jiangsu Province in 2020.
Land 14 01928 g004
Figure 5. Spatial distribution of ecological corridors of Jiangsu Province in 2020.
Land 14 01928 g005
Figure 6. Ecological security pattern of Jiangsu Province.
Land 14 01928 g006
Table 1. The research data information regarding sources, time, and spatial resolution.
DataSourcesTimeSpatial Resolution
The land change survey dataJiangsu Provincial Department of Natural Resources2015, 202030 m
Soil pollutionJiangsu Provincial Department of Natural Resources20191 km
Water qualityJiangsu Provincial Department of Natural Resources20201 km
Digital elevation model (DEM)United States Geological Survey200030 m
Nighttime light datahttps://www.gisrs.cn (accessed on 1 January 2024)202030 m
Road space distribution datahttps://www.resdc.cn (accessed on 1 October 2023)2020Vector
Soil erosionhttps://www.gisrs.cn (accessed on 1 August 2023)202030 m
Amount of precipitationhttps://www.gisrs.cn (accessed on 1 October 2023)202030 m
Normalized difference vegetation index (NDVI)https://www.gisrs.cn (accessed on 1 August 2022)202030 m
Concentration of CO2 emissionshttps://www.gisrs.cn (accessed on 1 October 2023)202030 m
PM2.5 concentrationhttps://www.geodata.cn/main/ (accessed on 1 June 2023)202030 m
Table 2. Estimated unit values (USD/hm2) for ecosystem services value in Jiangsu Province during 2020.
Ecosystem ServiceForest LandGrasslandFarmlandWetlandWater BodyBare Land
Atmospheric regulation781.28178.58111.60401.790.000.00
Climate regulation602.70200.91198.663817.06102.670.00
Water harvest714.30178.58133.933459.924549.226.69
Soil formation and protection870.56435.29325.91381.712.224.47
Waste disposal292.43292.43366.094058.154058.152.22
Biodiversity Conservation727.69243.31158.48558.07555.8275.88
Food production22.3366.98223.2366.9822.332.22
Raw material production580.3711.1522.3315.622.220.00
Entertainment and Culture285.728.932.221238.87993.992.22
Total4877.371616.161542.4513,998.1510,286.6293.69
Table 3. Correspondence between land ecological value classes and the hierarchical land classification system.
Ecological SystemPrimary Category of Land ClassificationSecondary Category of Land ClassificationLand Classification Code
Forest landOrchardFruit Orchard0201
WoodlandArbor Woodland0301
Bamboo Woodland0302
Shrubland0305
Other Woodland0307
GrasslandGrasslandNatural Grassland0401
Artificial Grassland0403
Other Grassland0404
Land for Public Administration and Public ServicesParks and Green Spaces0810
FarmlandCroplandPaddy Field0101
Irrigated Cropland0102
Dry Cropland0103
OrchardTea Plantation0202
Rubber Plantation0203
Other Plantations0204
WetlandWetlandMangrove Forest0303
Forested Wetland0304
Shrub Wetland0306
Marsh Grassland0402
Coastal Tidal Flat1105
Inland Tidal Flat1106
Marshland1108
Water bodyWater bodyRiver Surface Water1101
Lake Surface Water1102
Reservoir Water1103
Pond Water1104
Canals1107
Glaciers and Perpetual Snow1110
Bare landBare landSaline-Alkali Land1204
Sandy Land1205
Bare Soil1206
Exposed Rock and Gravel1207
Field Ridges1203
Note: The numerical codes presented in the ‘Land classification code’ column are quoted from the authoritative National Standard of the People’s Republic of China (GB/T 21010-2017 [41]) Current Land Use Classification.
Table 4. The hierarchical indicator system for assessing ecological sensitivity to identify key areas for ecological security pattern construction.
Target LayerCriterion LayerDefinition and Calculation Methodology
Water bodies PollutionWater bodies Degradation RatioAnnual mean rate of waterbody reduction (2015–2020)
Proportion of Polluted water bodiesProportion of polluted water bodies to total area
Soil Environment DegradationProportion of Total Polluted Soil AreaProportion of Polluted Soil Area to Total Area
Soil ErosionSoil Erosion Assessment Using the Soil Loss Equation Model, R × s × e × v 4 , R: Rainfall erosivity (MJ·mm·ha−1·h−1·yr−1), s: Slope gradient (dimensionless), e: Elevation factor (m), v: Vegetation cover index (NDVI, dimensionless)
Atmospheric PollutionAtmospheric CO2 ConcentrationAnthropogenic Atmospheric Pollution Level
Ambient PM2.5 ConcentrationQuantified using satellite-derived atmospheric aerosol optical depth—a parameter significantly positively correlated with PM2.5
Ecological Land DegradationForest Land Degradation RatioAnnual mean rate of forest land reduction (2015–2020)
Vegetation Coverage RateNormalised difference vegetation index (NDVI)—a radiometric measure indicating relative abundance and vigour of green vegetation
Construction Land StressRoad DensityRoad area per unit grid area. Higher values denote greater landscape fragmentation and elevated ecological sensitivity
Land Development IntensityProportion of regional construction land to total area
Disclaimer/Publisher’s Note: The statements, opinions and data contained in all publications are solely those of the individual author(s) and contributor(s) and not of MDPI and/or the editor(s). MDPI and/or the editor(s) disclaim responsibility for any injury to people or property resulting from any ideas, methods, instructions or products referred to in the content.