Article

The Impact of Ecological Restoration Measures on Carbon Storage: Spatio-Temporal Dynamics and Driving Mechanisms in Karst Desertification Control

1
School of Karst Science, Guizhou Normal University, Guiyang 550001, China
2
State Engineering Technology Institute for Karst Desertification Control, Guiyang 550001, China
3
Guizhou Karst Mountain Land Ecology and Land Use Observation and Research Station, Ministry of Natural Resources, Anshun 561301, China
*
Author to whom correspondence should be addressed.
Land 2025, 14(9), 1903; https://doi.org/10.3390/land14091903
Submission received: 12 June 2025 / Revised: 7 September 2025 / Accepted: 16 September 2025 / Published: 18 September 2025
(This article belongs to the Section Land – Observation and Monitoring)

Abstract

Karst landscapes, characterized by ecological constraints such as thin soil layers, severe rock desertification, and fragile habitats, require a clear understanding of the mechanisms regulating carbon storage and the impacts of ecological restoration measures. However, current research lacks detailed insights into the specific effects of ecological restoration measures. This study integrates multi-source remote sensing data and adjusts InVEST model parameters to systematically reveal the spatiotemporal evolution of carbon storage and its driving mechanisms in typical karst plateau regions of southwest China under ecological restoration measures. The results indicate: (1) From 2000 to 2020, the carbon stock in the study area increased by 6.09% overall. However, from 2020 to 2025, due to the rapid conversion of forest land into building land and grassland, the carbon stock decreased sharply by 7.69%. (2) Severe rock desertification constrains carbon stock, and afforestation provides significantly higher long-term carbon sink benefits. (3) The spatial heterogeneity of carbon storage is primarily influenced by the combined effects of natural factors (rock desertification, elevation, NDVI) and human factors (POP). Based on the research findings, it is recommended that measures to promote close forests be prioritized in karst regions to protect and restore forest ecosystems. At the same time, local habitat improvement and the establishment of ecological compensation mechanisms should be implemented, and the expansion of building land should be strictly controlled to enhance the stability of ecosystems and their carbon sink functions. These research findings provide a solid scientific basis for enhancing and precisely regulating the carbon sink capacity of fragile karst ecosystems, and are of great significance for formulating scientifically sound and reasonable ecological protection policies.

1. Introduction

In 2020, China put forward the “double carbon” goal, which explicitly requires the realization of carbon peak and carbon neutrality by 2030 and 2060, respectively [1], and in this context, upgrading the carbon stock in karst areas has become one of the core paths to realize the “double carbon” goal. Karst areas are characterized by prominent human-land conflicts [2], high ecological sensitivity [3], rapid precipitation seepage, exposed bedrock [4], surface fragmentation, infertile soils, and frequent surface droughts, which make their ecological sensitivity and risk of degradation significantly higher than that of other landforms [5,6,7,8,9], making them one of the key areas for global ecological restoration and carbon cycle research. As one of the most concentrated regions in the world for the distribution of karst landforms, Southwest China, specifically Guizhou Province, where karst land area accounts for as high as 61.9% [10], has become a core issue restricting regional ecological security and sustainable development [11]. Rocky desertification not only leads to vegetation degradation and biodiversity loss, but also exacerbates global carbon cycle imbalance by weakening the forest carbon sink function [12,13]. In this context, analyzing the impact mechanism of ecological restoration measures on carbon stock in the karst plateau region is an urgent need for scientific research and an important path to achieve the goal of “double carbon”.
The ecological vulnerability of karst landscapes stems from the double limitation of its geological and hydrological features. On the one hand, the strong dissolution and erosion of carbonate rocks lead to surface gullies and shallow soil layers with extremely low soil water holding capacity [14]; on the other hand, precipitation rapidly seeps down to the underground river system through fissures, and the dispersed surface runoff and strong evapotranspiration further exacerbate the drought stress [8]. Such habitat conditions severely constrain the natural recovery ability of vegetation. In Zijin County, Guizhou Province, for example, the area of rocky desertification accounts for 46.96% of the total area of the county, with severe vegetation degradation, reduction in arable land resources, ecological deterioration, and frequent natural disasters [15]. The degradation of vegetation not only reduces the productivity of ecosystems but also significantly weakens their carbon sink function. Due to land degradation and unsustainable land use, the carbon storage potential of these areas is often lost. Forest enclosure is often used as a means of ecological restoration, but their long-term impact on the carbon cycle has not been fully studied, especially in terms of spatial and temporal dimensions. Studies have shown that 90% of the carbon dioxide exchanged with air in terrestrial ecosystems occurs in forests, where forest plants absorb carbon dioxide through photosynthesis and fix it in vegetation and soil [16,17]. Therefore, how to reverse the process of rocky desertification, restore vegetation, and enhance carbon stock through ecological restoration measures has become a core issue of sustainable development in karst areas. To cope with the ecologically severe ecological challenges, the government has led the implementation of a variety of ecological projects to improve the local ecological environment [18], such as the National Forest Rehabilitation Project [19], the Mountain-River-Forest-Field-Lake-Grass System Project [20], the Natural Forest Protection Project [21], and the Cultivation and Rehabilitation of Farmland Project [22,23], among others. In recent years, forest carbon stock research has made significant progress at both the methodological and application levels. Large-scale remote sensing techniques (e.g., fusion of Sentinel-2 and SAR data) combined with machine learning algorithms are able to efficiently estimate the spatial distribution of forest structure and carbon stocks, while age-carbon density function models constructed based on National Forest Inventory (NFI) data provide a reliable tool for predicting the long-term carbon sequestration potential [24]. In addition, driver analysis reveals that natural factors (e.g., elevation, slope) and human activities (e.g., distance to highways) jointly shape the spatial and temporal patterns of carbon stock differentiation [25]. However, most of the existing studies focused on non-karst areas and paid insufficient attention to the special characteristics of karst ecosystems, such as the fragmented topography of karst areas resulted in, remote sensing data is difficult to distinguish, and it is difficult to capture its small-scale habitat heterogeneity, which led to the bias of carbon stock estimation [26]; the traditional models (e.g., PLUS-InVEST) did not sufficiently consider the mutual feedback mechanism between rocky desertification and vegetation restoration [27]; most of the studies Most studies show that ecological restoration increases effective carbon stock and enhances ecosystem resilience and sustainable land use capacity, but they do not deeply analyze the driving mechanism [28,29,30], and there is a lack of quantitative comparison of carbon stock between ecological restoration measures (e.g., planted forests and closed forests), and most existing studies focus on a single measure, ignoring the carbon stock capacity and spatial differences between different ecological projects and driving mechanisms [31,32]. However, there may be blind spots in the understanding and implementation of some ecological projects, which may bring negative impacts on the ecology [33].
The study aims to explore the spatial and temporal evolution of carbon stocks, predict future carbon stocks, analyze the effects of natural and anthropogenic factors on carbon stocks, and reveal the differences in carbon stocks among various ecological restoration measures. To achieve the above objectives, the study combines multi-source data and integrates the CA-Markov model and the InVEST model to simulate land-use changes and quantify carbon stock dynamics. Combining hotspot analysis and Moran’s index, the study reveals the spatial clustering characteristics of carbon stock and its correlation with driving factors; and systematically evaluates the differences in carbon density and driving factors between planted forests (economic forests dominated by plums and walnuts) and closed forests (soil and water conservation forests dominated by white birch). The value of this study is to reveal for the first time the differences in carbon stocks between plantation forests and closed forests in the karst plateau area, and to provide a scientific basis and data support for optimizing ecological engineering policies and formulating precise ecological restoration plans [34,35].

2. Materials and Methods

2.1. Study Area

See Figure 1, Zhijin County is located in the west of central Guizhou Province, southeast of Bijie, geographic location 105°24′14″~106°10′19″ E, 26°21′47″~26°57′24″ N, located in the transition zone from Qianxi Plateau to Qianzhong Plateau Basin, and the terrain is generally high and low in the western high school; the western topography is fragmented and strongly cut, with overlapping peaks, gullies and ravines, and the role of solvation and water erosion is remarkable; the eastern topography has greater undulation and open terrain; the northern rocky desertification degree is high and low in the south. In the west, the terrain is broken and strongly cut, with overlapping peaks and gullies, and significant dissolution and water erosion; in the east, the terrain is undulating and open; in the north, the degree of rocky desertification is high, and in the south, it is low. The development of karst landform is remarkable, with a large height difference in the region and a high degree of rock exposure; the precipitation has strong seepage capacity and is easy to infiltrate into groundwater, and the surface water flows faster and is scattered and easy to evaporate, making the soil layer barren. The highest point in the territory of 2265 m above sea level, the lowest point in the territory of 859 m above sea level, the maximum relative altitude difference in the whole territory of 1406 m, belongs to the north subtropical plateau monsoon humid climate, warm winters and cool summers, long frost-free period, adequate rainfall, water and heat at the same time, the seasons are clear. The soil is mainly yellow soil, which is fertile and deep with high organic matter content, suitable for the normal growth of most subtropical plants and animals. The area of rocky desertification in Bijie City is 496,761.53 ha, accounting for 20.11% of the total area of rocky desertification in Guizhou Province, and it is the largest prefecture-level city of rocky desertification in Guizhou Province; the area of rocky desertification in Zijin County is 51,504.85 ha, accounting for 10.37% of the area of rocky desertification in Bijie City.

2.2. Overview of Ecological Engineering

Since this study focuses on vegetation restoration projects (Planted Forests and forest enclosures), both are ecological restoration measures aimed at improving the functionality of the entire county’s ecosystem. It mainly considers vegetation community structure factors. The time range of the Planted Forests dataset was 2009–2019, and the area is 46,227.35 ha. Between 2009 and 2019, the Planted Forests Zone carried out Planted Forests projects totaling 794.13, 679.91, 2764.431619, 1310.51, 2046.13, 6951.48, 6747.13, 10,419.33, 9738.31, 2909.31, and 1866.68 ha. Planted Forests involves rapidly increasing forest area through artificial tree planting, with a focus on fruit tree forests, including medicinal forests, edible raw material forests, soil and water conservation forests, fuelwood forests, general timber forests, and forest chemical industry raw material forests, which have relatively short growth cycles. The primary tree species selected for planting include soapberry, cherry, pomegranate, cypress, plum, walnut, and tung oil trees, among other economically valuable species. This approach involves high-intensity human intervention and is suitable for regions with fragile ecological foundations, characterized by an average diameter at breast height (DBH) of 2.76 cm and an average elevation of 1499.95 m. The survival rate is 87.34%, whereas the tree closure rate is 9.74%. The elevation is 1499.95 m, with a soil thickness of 32.49 cm and a shrub cover percentage of 2.91%. The predominant land type is characterized by unforested Planted Forests, where the preserved plant count is at least 85% of the designed number, alongside newly afforested areas that are not yet closed but have potential for forest development, comprising 95.69% of the total area. This is followed by pure forests at 3.11%, barren lands suitable for forests at 0.82%, and mixed forests at 0.38%.
Forest closure adheres to the principle of “conservation first,” and the area is 35,793.69 ha primarily through enclosure-based protection measures to reduce human disturbance, thereby promoting the recovery of natural vegetation and the self-repair of forest ecosystems. Additionally, through supplementary planting of trees primarily for soil and water conservation (e.g., white birch, cypress, etc.), it addresses the deficiency of slow biomass accumulation during the initial stage of natural regeneration. This enhances soil retention capacity and reduces soil erosion in karstified areas. Its characteristic is reliance on natural restorative capacity with minimal human intervention. The time range of the Forest closure dataset was 2006–2019. From 2006 to 2019, the Forest closure area planted 2707.26, 1577.29, 2272.01, 3803.11, 2671.73, 1422.97, 1301.88, 1002.82, 3003.43, 7207.43, 2724.02, 2399.44, 1700.24, and 2000.07 ha. The main tree species were soil and water conservation forests dominated by white birch, containing willow, cypress, oak scrub, alpine cypress, yellow cypress, firethorn, oak scrub, and chaste tree, with an average tree height of 1.68 m, an average diameter at breast height of 21.56 cm, an average altitude of 1528.58 m, and an average soil layer The average height of the trees was 1.68 m, the average diameter at breast height was 21.56 cm, the average elevation was 1528.58 m, the soil thickness was 31.48 cm, the survival rate was 32.79%, the tree cover was 16.73%, and the shrub cover was 34.23%. The existing land type is dominated by the forested land with no mature forest (65.04%), followed by pure forest (18.83%), mixed forest (12.75%), other shrub land (1.69%), and forestable rocky mountain (1.69%). The cultivation measures are dominated by replanting and replanting (57.91%), which refers to the sparse forest in the closure area on the basis of the natural restoration, The technical measures of planting seedlings or sowing seeds with artificial assistance to local plots of land in the closed area that are poorly renewed naturally or in need of directional cultivation; the undesigned forest conservation measures accounted for 4.58%. Artificial promotion of regeneration refers to the technical means of accelerating and optimizing the process of natural forest regeneration by improving the environmental conditions of natural regeneration through artificial measures, and by promoting the germination of seeds, growth of seedlings, and development of young trees, which accounted for 37.5%.

2.3. Data Sources

The ecological restoration measures data used in the study were obtained from the forest survey data of the county forestry bureau, covering key parameters such as soil layer thickness, tree trunk diameter, vegetation coverage, tree height, and forest stand density; the karst desertification data were obtained from the National Karst Desertification Prevention and Control Engineering Technology Research Center “https://sck.gznu.edu.cn (accessed on 20 August 2024)”. Both forest survey data and karst desertification data have undergone de-classification processing and do not include confidential data such as topography, and are solely used for research purposes. According to research requirements, both types of data were processed using ArcGIS 10.8 to achieve a spatial resolution of 30 m. For specific data sources, please refer to Table 1. Forest inventory data were collected in 2019, desertification data in 2012 and 2016, DEM data in 2020, soil data, terrain roughness, temperature, precipitation, GDP, and POP data in 2020, and land use data from 2000 to 2020.

2.4. Research Methodology

2.4.1. Land Use Forecasting and CA-Markov Modeling

In this study, the CA-Markov model, which combines metric automata (CA) and Markov chain (Markov) principles, is used to simulate and analyze land use changes. The model can be applied to simulate the spatiotemporal evolution process of 2D land use types under customization, utilizing multi-criteria evaluation and decision support. The model enhances the simulation capability of spatial patterns through domain relationship analysis and can effectively predict the quantity and spatial distribution of land use structures, which is an important method for predicting changes in landscape patterns [36]. The land cover of the study area was classified into seven types (cropland, woodland, scrubland, grassland, wetland, building land, and water), and the current land cover images and data of 2010 and 2015 in Zijin County were processed using ArcGIS 10.8, and the results of the processing were imported into IDRISI “https://www.clarku.edu/centers/geospatial-analytics (accessed on 18 July 2024)”. The conversion between different land types was determined by analyzing the land use transfer matrices in these two periods of time. Kappa coefficient (Kappa coefficient) was used to assess the consistency between the model simulation results and the real observation data. In the study, Kappa = 0.88, which indicates that there is a high degree of consistency between the model’s prediction results and the actual situation, with a good effect. Based on the above conclusions, the land use of the study area in 2020–2030 was predicted, aiming to simulate the prediction of future trends in carbon stock changes.
C A = ( C , S , N , R )
where C is the metric space, S is the set of metric states, N is the neighborhood, and R is the transition rule.

2.4.2. Carbon Density Correction

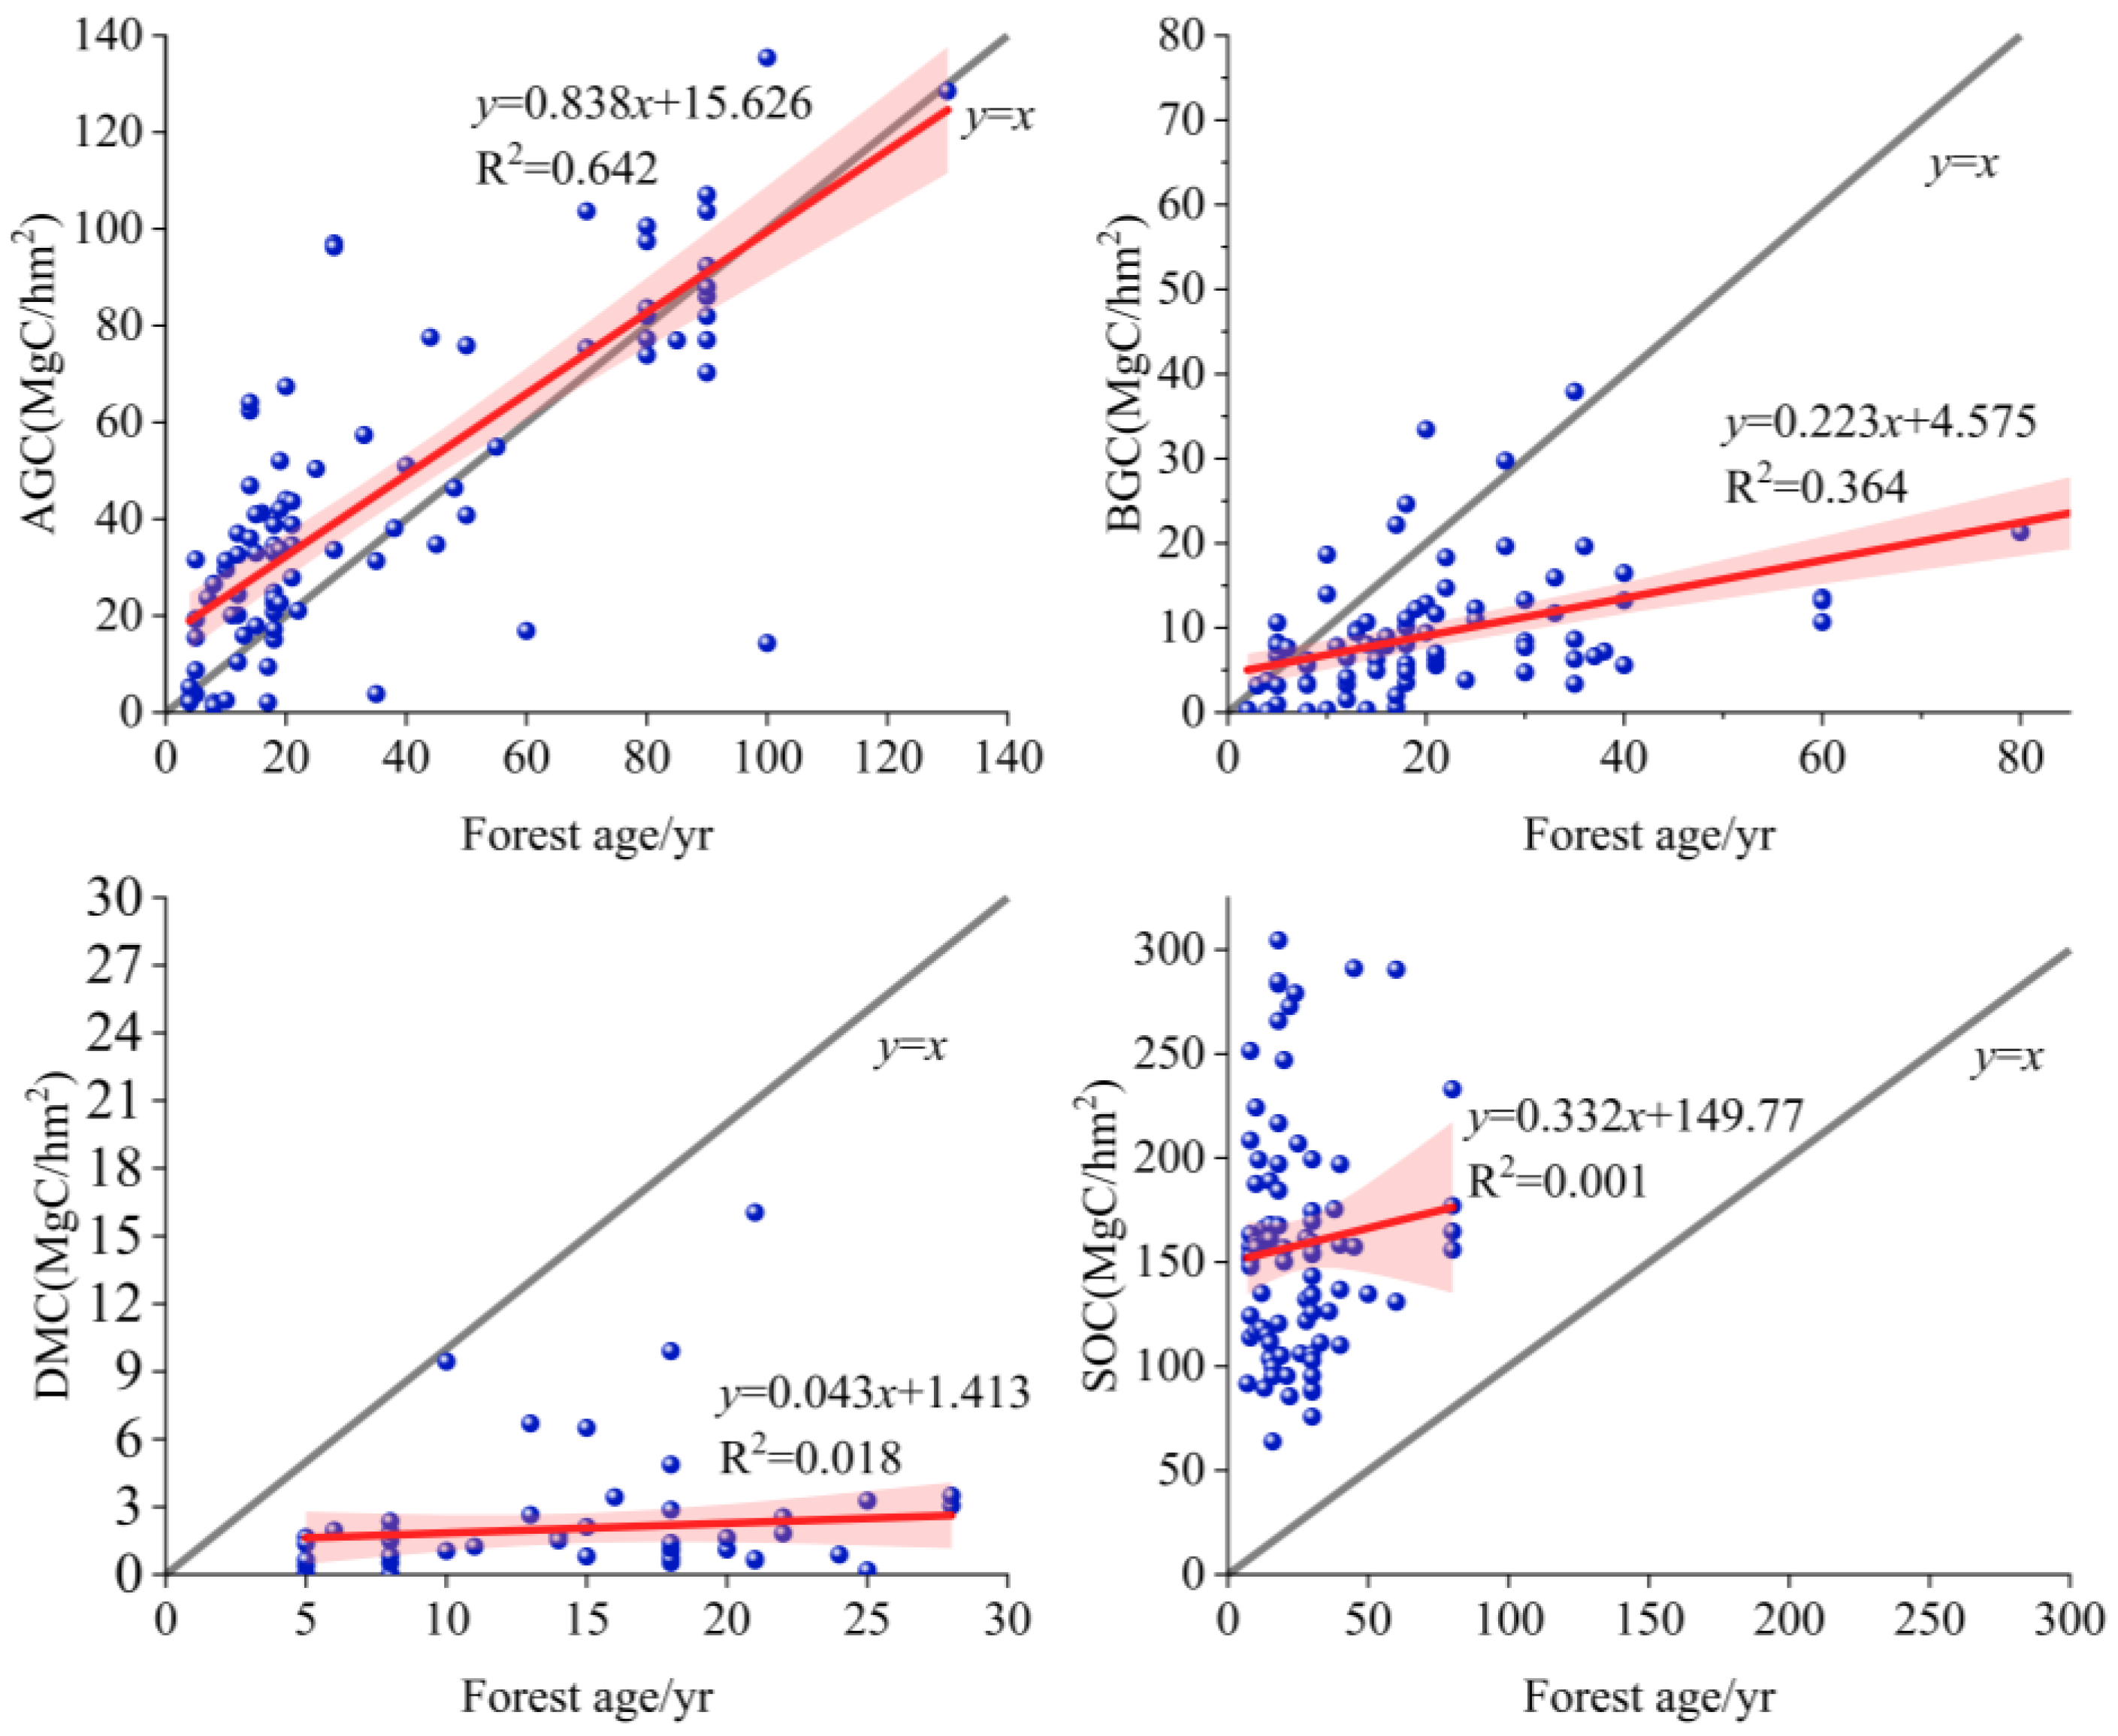
Zhijin County is situated in the west-central part of Guizhou Province, characterized by a typical karst landscape. Based on the spatial heterogeneity of forest carbon stocks, the carbon density dataset in Guizhou Province was selected to construct the carbon density linear regression model (Figure 2). The model was constructed using the “2004–2014 Chinese forest ecosystem carbon density dataset” [37]. A total of 332 sample points were obtained, of which there were 93, 86, 55, and 88 sample points for AGC (above-ground carbon density), BGC (below-ground carbon density), DMC (dead organic matter carbon density), and SOC (soil carbon density), respectively. The initial carbon densities were referred to the study of Luo Dan et al. [38]. The model performance evaluation is shown in Table 2. The R2 value of AGC is 0.642, indicating that the model can explain 64.2% of the variability (p < 0.01), which is a relatively high value, indicating that the model has good explanatory power. Since the R2 values of DMC and SOC were low (Figure 2) and not generalizable, only AGC and BGC were selected for the study to be corrected to obtain the carbon densities of each class in Zhijin County (Table 3). By combining carbon density and land use change, the InVEST model can be used to accurately and intuitively calculate regional carbon stocks [31].

2.4.3. Hot Spot Analysis

Hot spot analysis is a local spatial autocorrelation analysis method to calculate spatial clusters with statistically significant high (low) values in response to the spatial aggregation of carbon stocks [39]. A hotspot in the ecosystem carbon stock in the study area indicates that similar high-value points surround a data point with a high value, while a coldspot indicates that a data point with a low value is surrounded by similar low-value points [40]. The spatial clustering characteristics of low values (cold spots) and high values (hot spots) can be determined by the Z-value, and the cold and hot spot zoning table (Table 4) refers to previous studies [41], which is not listed in the table because there is no extremely significant cold spot area in the study.
Z ( G i * ) = j = 1 n w i j x j x ¯ j = 1 n w i j S n j = 1 n w i j 2 ( j = 1 n w i j ) 2 n 1
G i * = j = 1 n w i j x j j = 1 n x j
S = j = 1 n x j 2 n 1 x ¯ 2
where Z is the normalized agglomeration index, which can represent the spatial agglomeration characteristics, Gi* is the agglomeration index of raster i, wij is the spatial weight between rasters i and j, xj is the carbon stock of raster j, x ¯ is the mean value of all the panels in the space n is the total number of rasters, and S is the standard deviation of the attribute values of all the patches.

2.4.4. Correlation Analysis

The study was analyzed using the Pearson correlation coefficient r, a measure proposed by Karl Pearson to quantify the degree of linear correlation between two continuous variables [42], with the value of r ranging from −1 to 1, where 1 indicates a perfect positive correlation, −1 indicates a perfect negative correlation, and 0 indicates no linear correlation. By calculating the Pearson correlation coefficient, the researcher can quantitatively analyze the relationship between the variables, thus providing an important reference for the subsequent research work, and its formula is as follows:
r = i = 1 n ( X i X ¯ ) ( Y i Y ¯ ) i = 1 n ( X i X ¯ ) 2 i = 1 n ( Y i Y ¯ ) 2

2.4.5. Moran Index

To further explore the spatial correlation of carbon stocks with each factor, the study quantified the full range of factors using the Moran Index to characterize the average degree of correlation of all spatial units with their neighbors over the entire region [43].
I = n S 0 · i = 1 n j = 1 n w i j ( x i x ¯ ) ( x j x ¯ ) i = 1 n ( x i x ¯ ) 2

3. Results

3.1. Spatial and Temporal Variation in Carbon Stocks

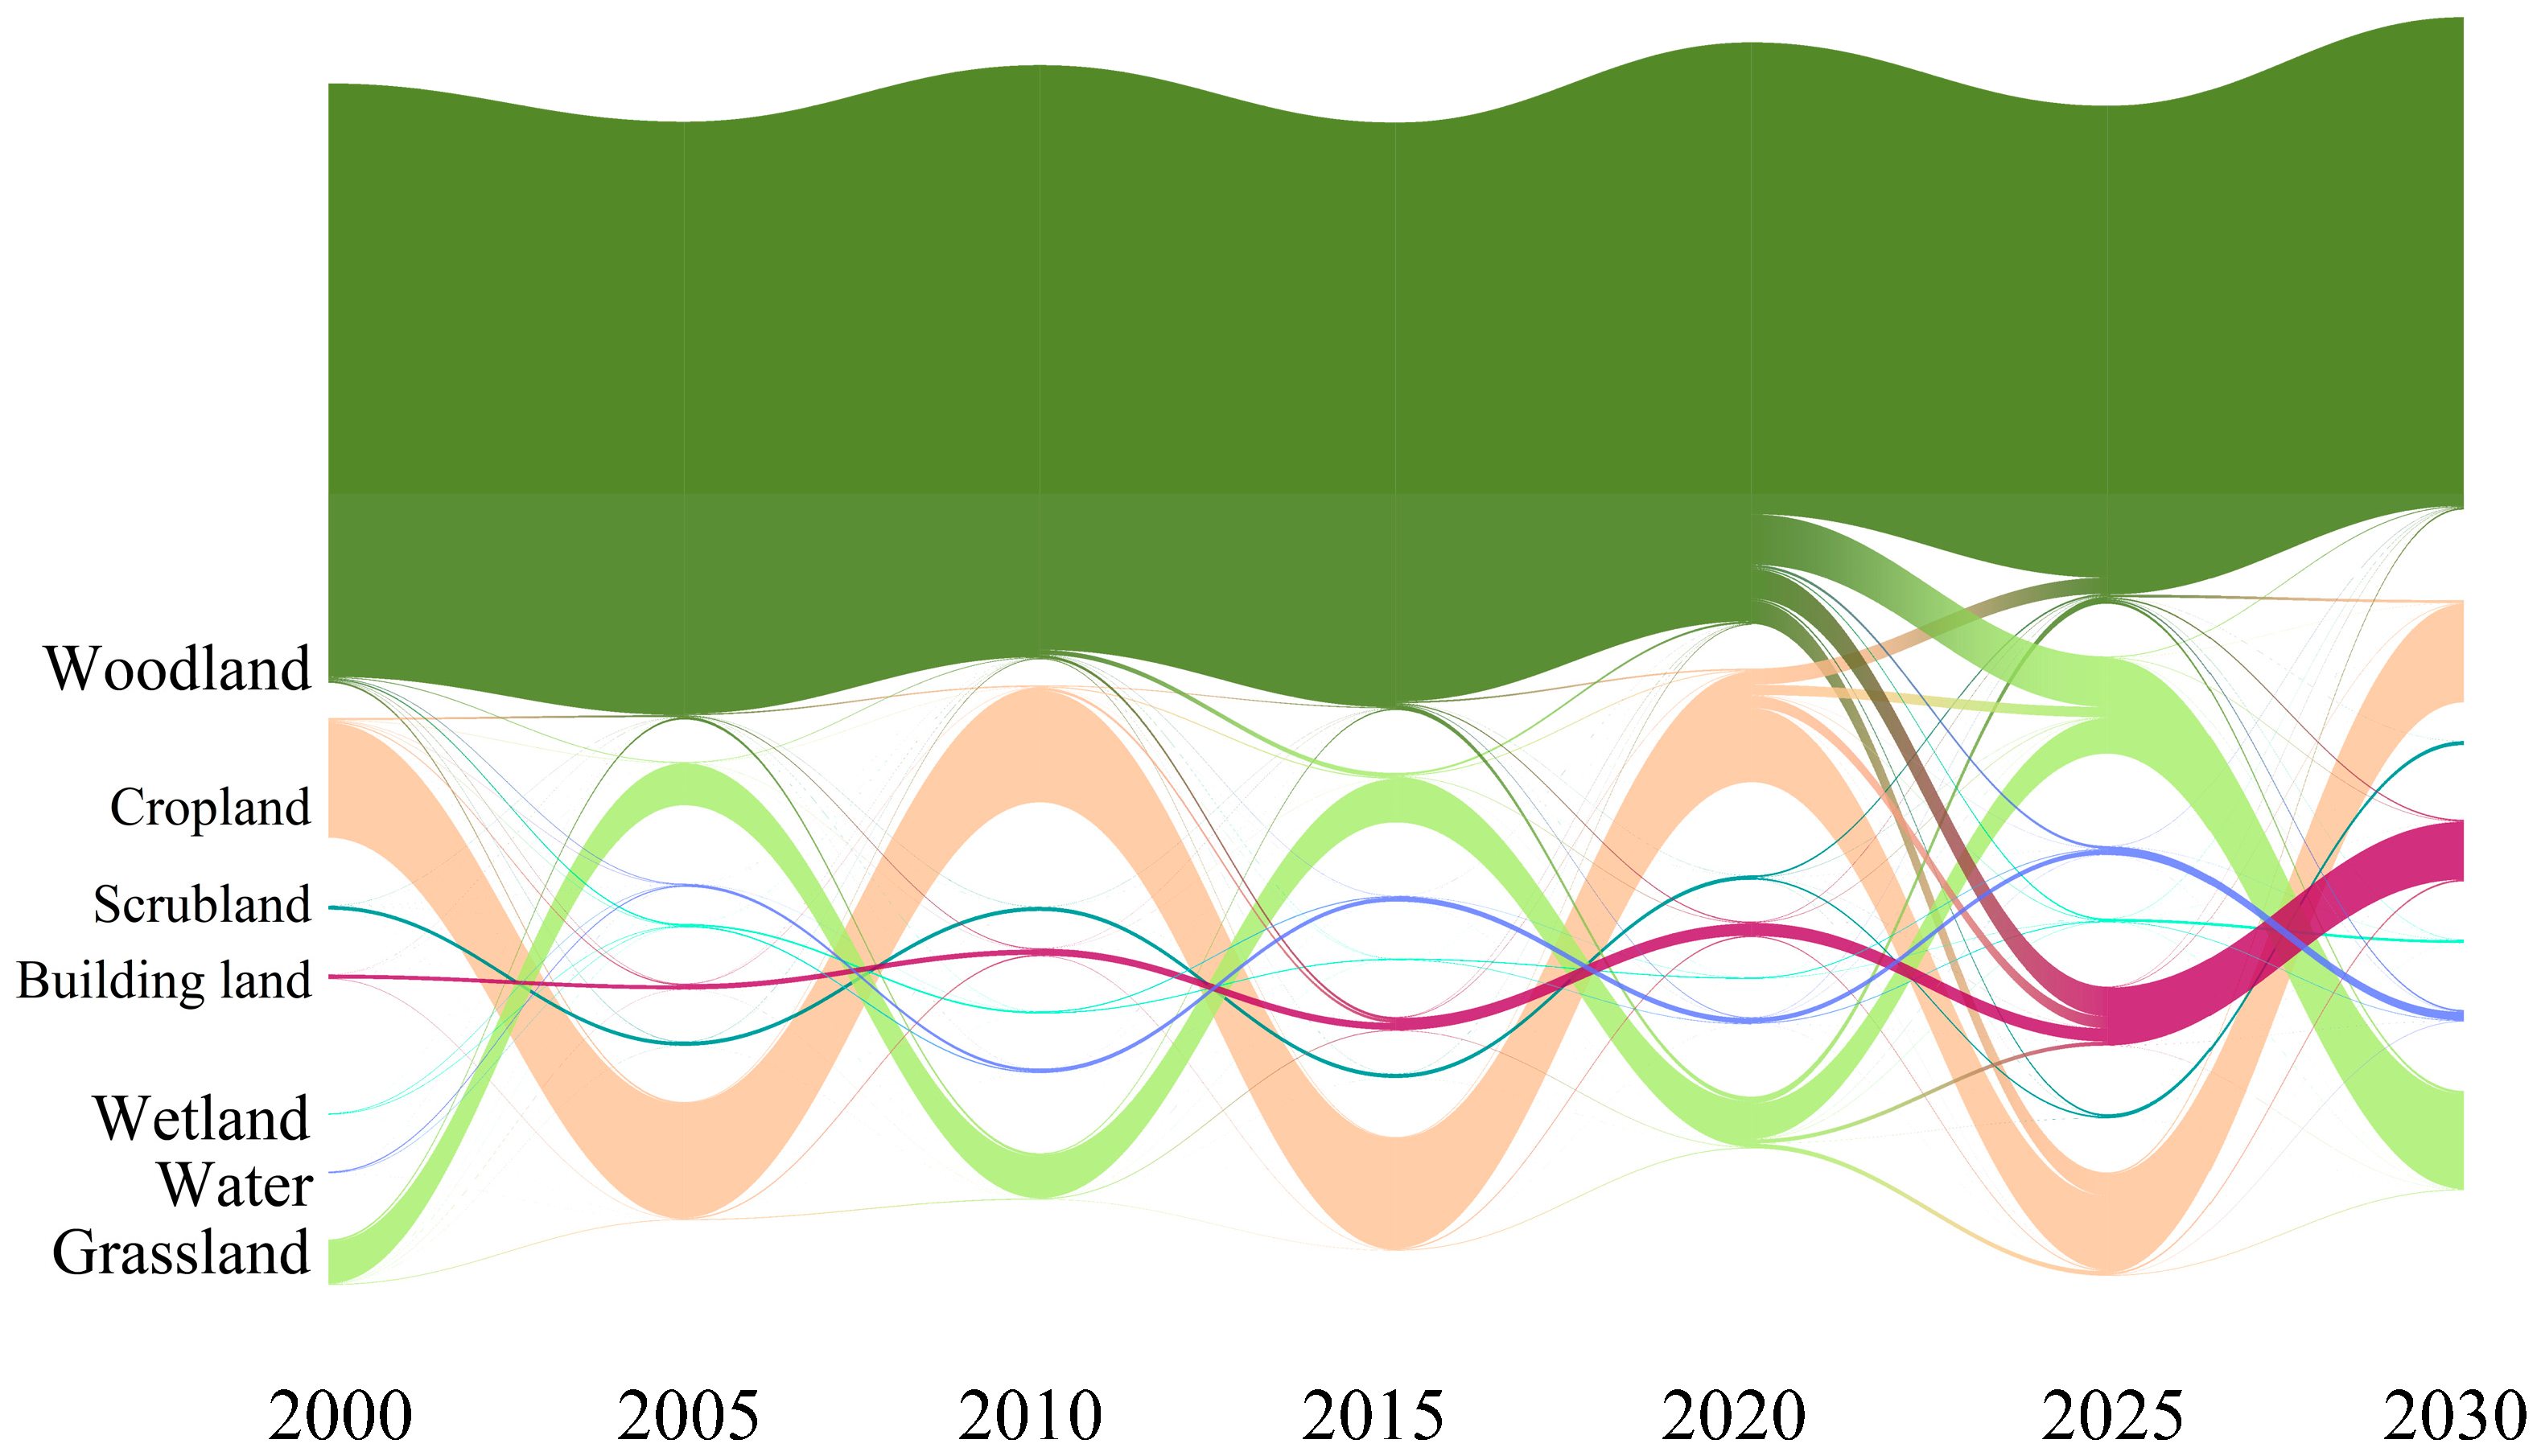
The CA-Markov model was used to predict the land use types in 2020–2030, and the InVEST model was used to calculate the carbon stock in Zhijin County from 2000 to 2030 and the results are shown in Figure 3. During the period from 2000 to 2020, the carbon stock in Zhijin County generally showed a steady upward trend, reaching a peak in 2020 (57.92 × 10⁶ Mg C), an increase of 6.09% from 2000. However, in 2025, the carbon stock declined sharply to 53.47 × 10⁶ Mg C, a decrease of 7.69%. By 2030, carbon stock showed a slow upward trend, reaching 53.95 × 10⁶ Mg C. The cause of the sharp change in carbon stock between 2020 and 2025 was the shift in land use type, which was analyzed by combining Figure 3 and Figure 4 (Figure 4 visualizes the quantitative flow from one land category to another between two points in time and does not represent the total area of each land category at the end of the period, the land transfer matrix is provided in Supplementary Material Table S1). The total area for each year can be found in Table 5. Combined Table 5, in 2020–2025, a large area of forest land is transformed to building land and grassland, in which the area of forest land decreases by 31,604 ha, or 14.52%, and the loss of this high-carbon-density land type directly leads to the decline in carbon stock; the area of building land increases by 16,123 ha, or 288.75%, while the carbon density of this land type is 0; the area of grassland increased by 17,331 ha, an increase of 97%, but the carbon density of forest land was lower than that of forest land, which could not compensate for the carbon loss caused by the conversion of forest land. Forest land changes between 2015 and 2020 were exceptionally pronounced, reflecting the reality that ecological restoration measures were implemented intensively and concentrated during this period. Newly planted forest areas reached 24,933.63 hectares between 2016 and 2019, accounting for 53.94% of the total area added throughout the entire project period (2009–2019). The net increase in forest closure during 2016–2019 was 8823.77 hectares, accounting for 24.65% of the total area added throughout the entire project period (2006–2019). This indicates that over half of the artificial forests and nearly a quarter of the closed forests were established within just four years after 2015. This explosive growth directly led to dramatic dynamic changes in forest land types between 2015 and 2020. Compared to the period from 2015 to 2020, the average annual temperature has risen by 0.39 °C, and the average annual precipitation has decreased by 32.47 mL, jointly triggering the unique “drought-rock desertification-carbon loss” positive feedback loop in karst regions: rising temperatures exacerbate soil moisture evaporation, while reduced precipitation directly leads to drought. The shallow soil layers in karst regions have extremely poor water retention capacity, causing vegetation (especially shallow-rooted artificial forests) to suffer severe water stress, inhibiting photosynthesis and sharply reducing carbon fixation capacity. Drought leads to vegetation degradation and reduced canopy cover, making the soil more susceptible to erosion. Soil erosion accelerates the exposure of bedrock, and exposed rock walls further raise local temperatures and worsen moisture conditions, creating a vicious cycle. Additionally, planted forests (carbon storage growth rate −1.31%), which rely on human intervention, have weak resilience, while forest closure (growth rate −0.97%), which relies on natural recovery, demonstrates greater stability, further indicating that forest closure is a more effective measure.
The spatial distribution of carbon stocks in this study area is characterized by significant spatial heterogeneity (Figure 3). Carbon stock hotspots (Z ≧ 2.58) are mainly concentrated in the southwestern trough area, while coldspots (Z < −1.96) are significantly concentrated in the northeastern area, and most of the central and southeastern areas show insignificant characteristics (p > 0.05). The formation of this spatial differentiation pattern was mainly influenced by the combination of natural geographic conditions and human activities: the southwestern trough and valley area exhibited a high carbon sink capacity due to its high elevation topography, developed underground river system and frequent surface water-groundwater exchange, which maintained large areas of forests and other natural vegetation ecosystems; the northeastern area exhibited a high carbon sink capacity due to a high proportion of cultivated land and a serious degree of rocky desertification, which led to increased soil erosion. The northeastern region, on the other hand, has a high proportion of cultivated land and a serious degree of rocky desertification, leading to increased soil erosion and restricted vegetation growth, which significantly reduces the carbon stock capacity. Although the central region has a gentle topography, it is strongly disturbed by urbanization and agricultural activities; while the southeastern region has a statistically insignificant feature due to the fragmented topography, serious soil erosion, the effectiveness of ecological restoration has not yet appeared, as well as the constraints such as low vegetation cover, infertile soils, and uneven distribution of water resources, which lead to the insufficient accumulation capacity of carbon stock in the region.
Overall, carbon stock in Zhijin County exhibited significant temporal volatility and spatial heterogeneity: a general increasing trend during 2000–2020 was sharply reversed in 2025 due to extensive forest loss to construction and grassland, followed by a partial recovery. Spatially, carbon storage was concentrated in the natural vegetation-rich southwest, while the human-impacted northeast showed critically low values, highlighting the strong dual influence of ecological conditions and anthropogenic pressure on carbon dynamics.

3.2. Characterization of Carbon Stocks Under Different Ecological Restoration Measures

In this study, we adopted an exclusive classification system: Planted Forests refer to forest land that has been intentionally planted and managed through human intervention; closed forests refer to natural secondary forests that are mainly restored through natural regeneration processes; other areas refer to all areas not included in the above two categories, including grasslands, shrublands, water areas, agricultural land, and urban areas. In order to explore the differences in carbon stocks between artificial intervention and natural restoration modes in the karst plateau region, other regions were added as a control group. The results are shown in Figure 5: from 2000 to 2020, the carbon stock of planted forests, closed forests, and other regions showed an upward trend, reaching a peak in 2020, followed by a region-wide recession in 2025, and then a slow recovery in 2030, with the overall fluctuating trend highly synchronized with the changes in the total regional carbon stock. The contribution of planted forests and closed forest systems continues to increase, with the combined share increasing from 27.6% in 2000 to 33.3% in 2030, and the total carbon stock of planted forests is higher than that of closed forests. Referring to Table 6, the average annual growth rate of closed forests between 2000 and 2030 is 0.39%, far exceeding that of planted forests (0.05%) and other regions (−0.12%), with a net increase of 11.77%, showing the advantage of the natural restoration mode in long-term carbon stock benefits. From 2000 to 2020, all types of carbon stocks all maintain positive growth, especially the average annual growth rate of 1.77% in 2000–2005 for forest closure, which reaches the peak, and drastic negative growth in 2020–2025, with simultaneous declines in planted forests (−1.31%), forest closure (−0.97%), and other regions (−1.70%), and an overall decline of 3.95% in carbon stock in other regions. A comprehensive decline in stock of 3.95% (2000–2030) signifies inadequate protection in non-targeted areas and a diminished capacity for risk resistance in cultivated forests; the period from 2025 to 2030 represents a recovery phase, during which the growth rate of carbon stock reverts to a positive value, exhibiting favorable recovery elasticity in the natural restoration mode. However, carbon stock levels across all regions remain substantially below initial levels, and the lag effect of the restoration process is pronounced. In order to compare the carbon stock benefits of ecological restoration measures more intuitively, the carbon stock per unit area (ha) was calculated as carbon density. The carbon density of closed forest is significantly higher than that of planted forest and other areas, and the decrease of carbon density is positively correlated with the growth rate of the previous period, which shows that the high carbon stock area has certain anti-adverse buffering ability; by 2030, the carbon density of closed forest (217.37 Mg C/ha) maintains the advantage of carbon sequestration 17% higher than other types.
Overall, the study demonstrates that while Planted Forests store more carbon in total due to their larger area, closed forests (resulting from natural restoration) exhibit superior carbon sequestration efficiency, higher carbon density, and greater resilience to disturbances, making them a more effective long-term strategy for enhancing carbon sinks in karst regions.

3.3. Differences in Carbon Density Under Different Levels of Rocky Desertification

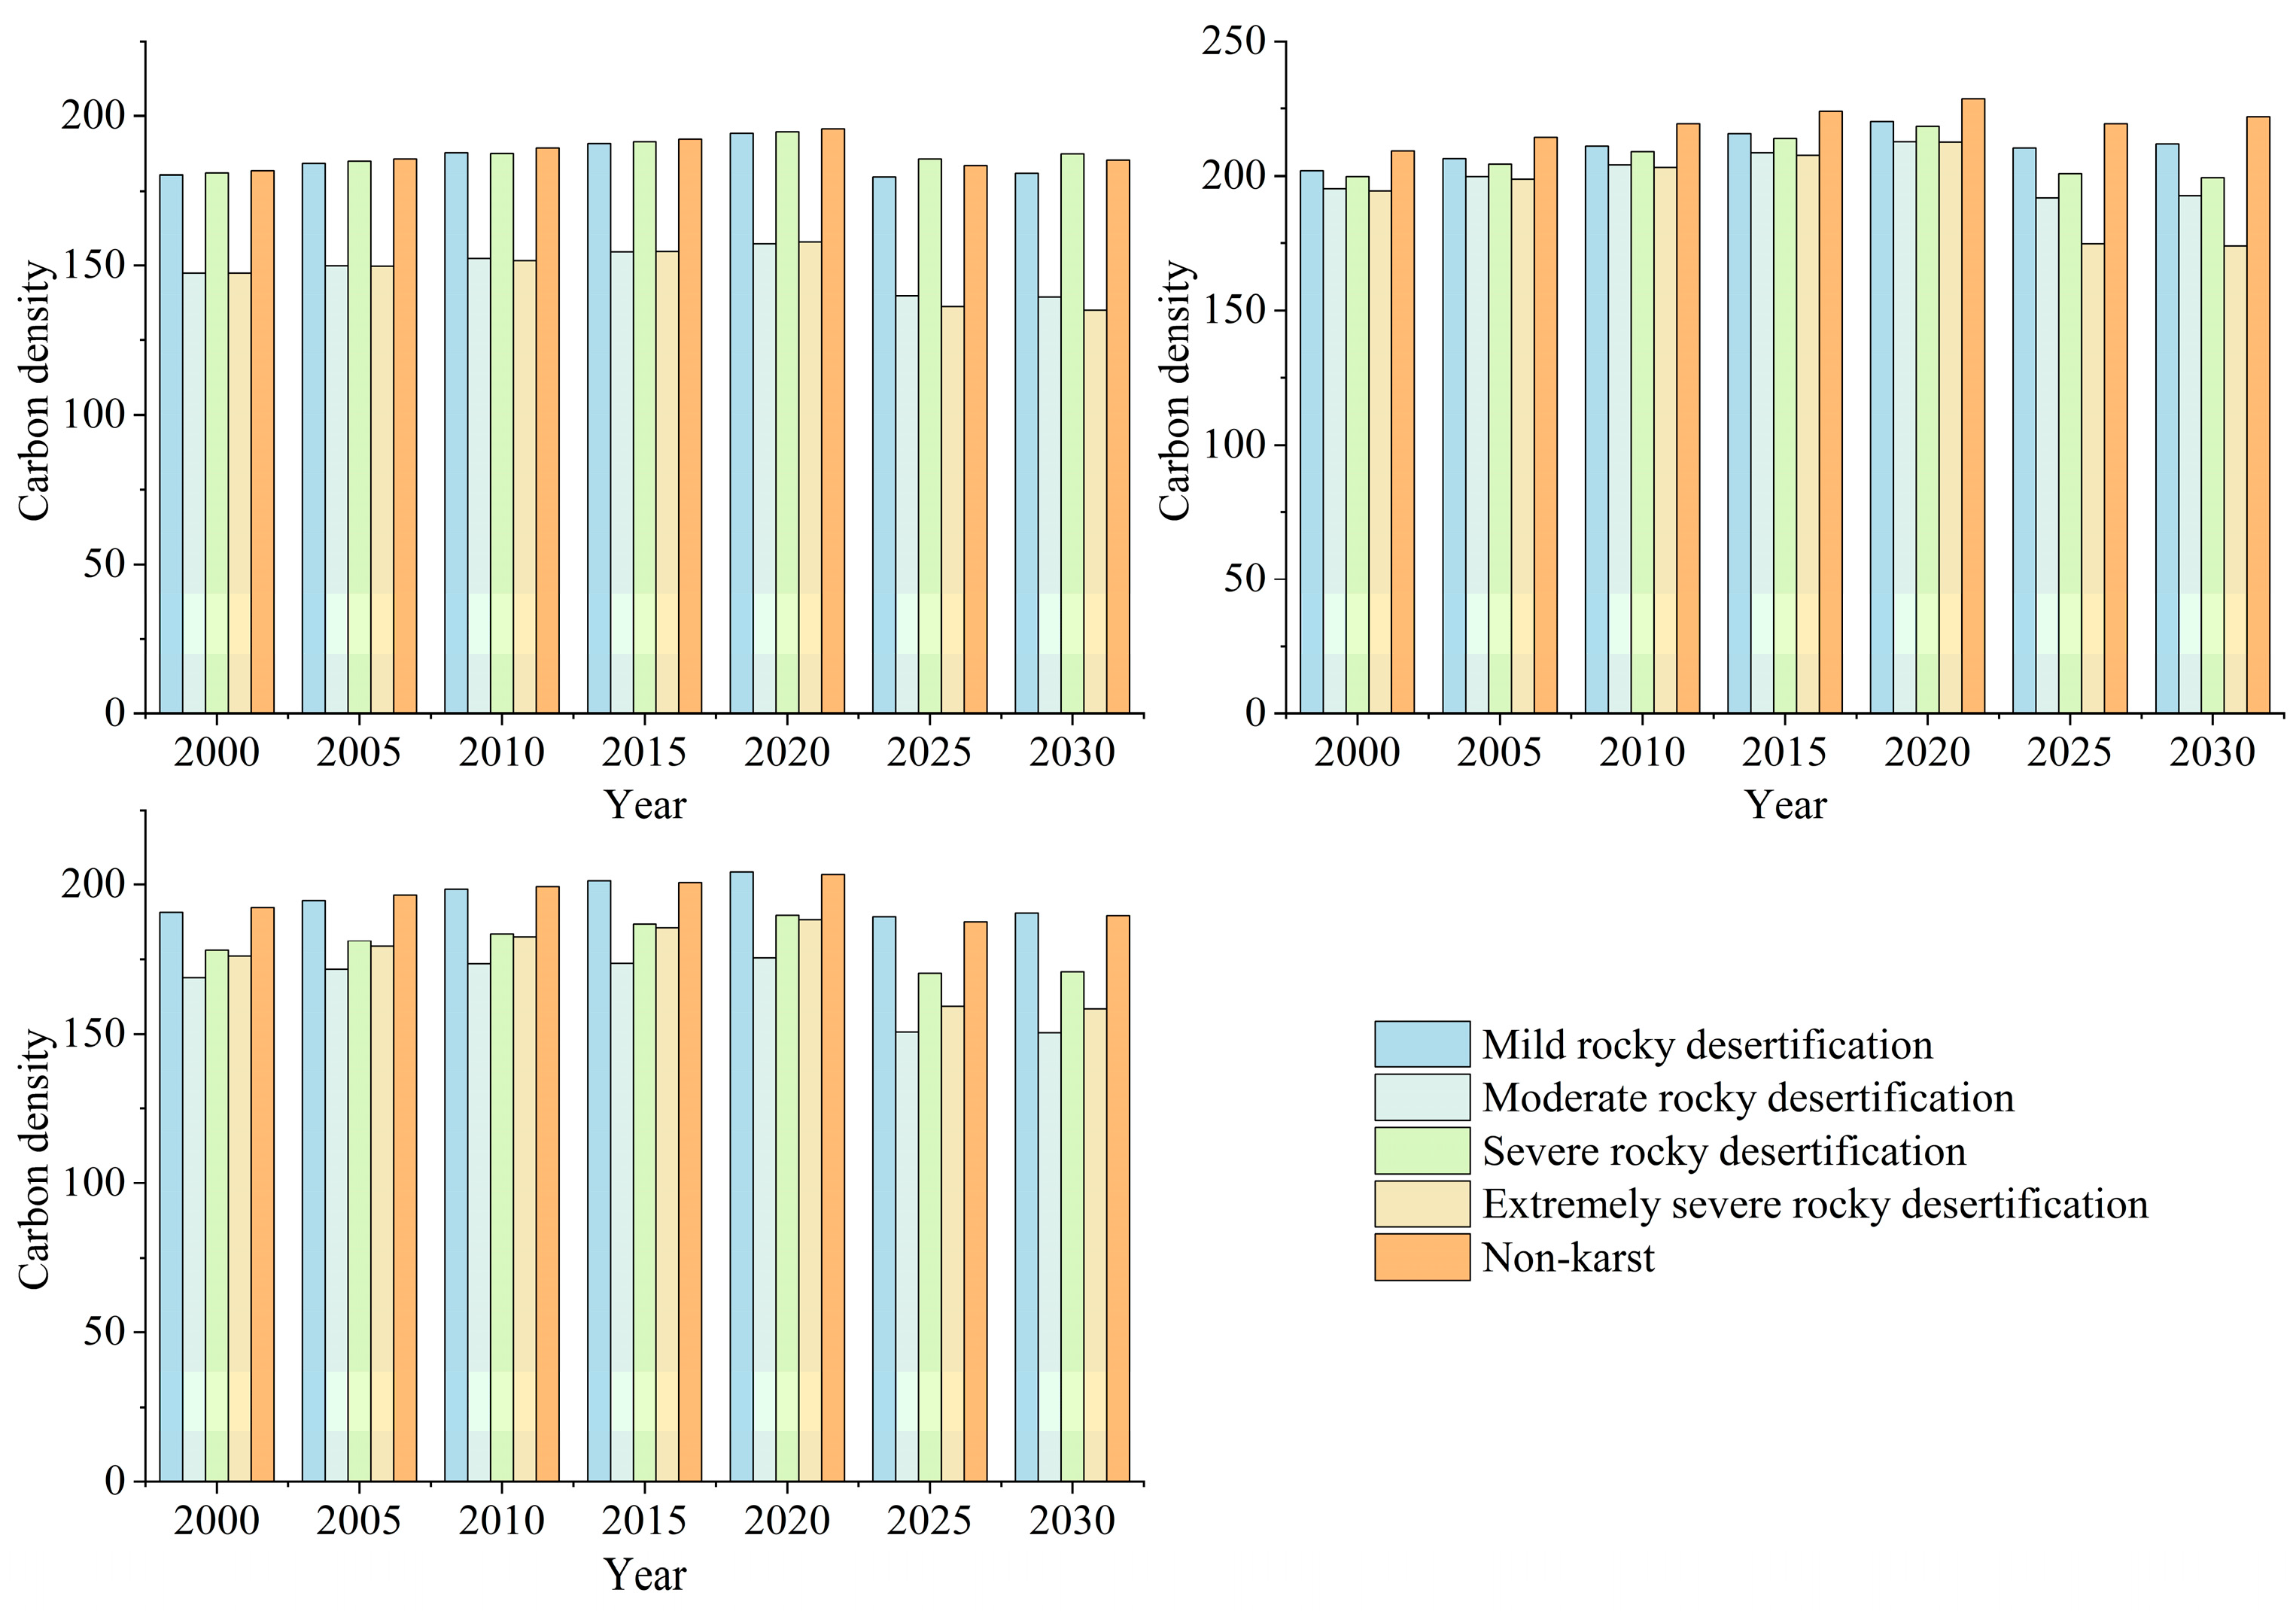
This study further examines the differences in carbon density dynamics between the two ecological restoration models, Planted Forests and Forest closure, and the unrestored control area (NEE) from the perspective of desertification severity levels (Figure 6). Carbon density in all desertification severity levels and non-desertified areas showed an increasing trend from 2000 to 2020, followed by a decline from 2020 to 2025, and a slight recovery from 2025 to 2030, consistent with the overall conclusions mentioned earlier. Across all levels of desertification, carbon density followed the pattern Forest closure > NEE > Planted Forests, with the Forest closure model consistently holding a dominant advantage. For example, in 2020, the carbon density of Forest closure in non–karst areas reached 228.61 Mg C/ha, significantly higher than NEE (200.64 Mg C/ha) and Planted Forests (195.81 Mg C/ha). Even in areas with extremely severe stone desertification and extremely poor site conditions, Forest closure still demonstrated significant restoration effects, with its carbon density (212.62 Mg C/ha) significantly higher than that of Planted Forests (157.88 Mg C/ha) and 12.88% higher than that of NEE (188.36 Mg C/ha). This clearly demonstrates that forest closure can effectively enhance regional carbon sink capacity by reducing human disturbance and promoting natural recovery, making it the most stable and effective strategy for increasing carbon storage in karst regions. On the other hand, although Planted Forests have a lower initial carbon density, their growth rate (6.66–7.73%) between 2000 and 2020 is significantly higher than that of NEE (3.94–7.01%), reflecting the important role Planted Forests still play in accelerating carbon accumulation. From the perspective of different degrees of stone desertification, between 2000 and 2030, the carbon density of planted forests, forest closure, and NEE all showed an overall downward trend as stone desertification intensified. Severe stone desertification has a significant inhibitory effect on carbon storage and is a major obstacle that needs to be overcome in ecological restoration.
Overall, ecological restoration measures can significantly enhance carbon storage. In ecologically fragile karst regions, forest closure is a more effective ecological restoration measure than planted forests, as it possesses stronger resistance to disturbances and ecological stability. It can more efficiently and stably enhance ecosystem carbon density, making it a more reliable pathway to achieving the “dual carbon” goals.

3.4. Driver Analysis

In order to better explore the influence of carbon stock in the karst plateau region, the study quantified rocky desertification as an influencing factor and obtained the correlation values of several factors with carbon stock (Table 7). NDVI (Normalized Vegetation Index) showed a significant positive correlation among all types, with a total r = 0.29, planted forests r = 0.33, and forestation r = 0.38, which indicated that the areas with a high degree of vegetation cover are more conducive to forest restoration, especially the effect of closed forest closure is more significant, which may be related to the optimization of ecological conditions in the natural restoration mechanism; topographic factors (DEM, terrain roughness, slope): altitude (DEM) has a significant effect on planted forests (r = 0.29), which is because the degree of rocky desertification is weaker in high altitude areas, human interference is lower, and vegetation species are abundant, etc.; terrain roughness (r = 0.26) The role of terrain roughness (r = 0.26) is more prominent in planted forests. Rough terrain is easy to accumulate water, promote vegetation growth and reduce soil erosion, and it is easy to form a variety of microclimatic environments by differentiating between shady slopes and sunny slopes, etc., coupled with the fact that high roughness areas are weaker in human activities, better preserved in natural vegetation, and with higher carbon stock; the degree of depression was significantly and positively correlated in both planted forests (r = 0.20) and forest closure (r = 0.20), which indicated that the areas with high canopy coverage were more conducive to forest restoration. The forest community under higher vegetation cover was more stable and could absorb more light for photosynthesis.
Population density (POP) had the strongest overall negative correlation (r = −0.23), indicating that human activities (e.g., land use change, resource exploitation) have a significant inhibitory effect on forest recovery; Rocky desertification showed a significant negative correlation with carbon stocks across all land types (total r = −0.11, planted forests r = −0.17, closed forests r = −0.13). This statistically quantifies the core mechanism by which rocky desertification severely constrains forest carbon storage capacity through soil impoverishment, poor habitat quality, and water scarcity. Results from Section 3.3 indicate that the degree of Rocky desertification is a key county-specific driver of spatial variation in carbon density. Across all desertification levels, carbon density followed the pattern: Forest closure > NEE > Planted Forests. Even in areas with extremely severe Rocky desertification where ecosystem baseline is highly fragile, carbon density in Forest closure (212.62 Mg C/ha) remained significantly higher than in Planted Forests (157.88 Mg C/ha) and unrestored areas (NEE, 188.36 Mg C/ha), confirming that the Forest closure model, centered on natural recovery, possesses unique advantages in coping with severe habitat constraints. Rocky desertification exerted a stronger negative impact on Planted Forests (r = −0.17) than on Forest closure (r = −0.13), indicating that Planted Forests ecosystems are more sensitive to stress induced by Rocky desertification and their stability is more easily disrupted. Temperature had an overall negative correlation (r = −0.14), possibly related to increased evaporation in high temperature regions, and drought aggravates rocky desertification, especially in the case of planted forests. Poor quality and water scarcity seriously constrain the capacity of forest carbon stock; temperature was negatively correlated in general (r = −0.14), which may be related to the increase in evaporation in high-temperature regions and drought exacerbating rocky desertification, and is especially more sensitive in planted forests (r = −0.07), and it also indicates that ecological restoration measures are more resistant to negatively correlated impacts of some factors. Planted forests are more dependent on topographic conditions (slope, roughness) and management measures (e.g., transportation location r = 0.18), indicating that it is more affected by human interventions; forest closure is more dependent on natural conditions, such as NDVI (r = 0.38), suggesting that the restoration effect is closely related to the ecological conditions. The effect of GDP (an economic indicator) on the carbon stock is almost negligible (r ≈ 0), suggesting that the regional economic level has no direct correlation with forest restoration, and policy orientation plays a dominant role.
Overall, the effectiveness of forest restoration is influenced by natural conditions (NDVI, topography), human activities (POP, transportation locations), and ecological stressors like temperature. Rocky desertification is not only a distinct localized feature in the karst region of Zijing County but also a key and unique ecological constraint driving the spatial evolution of its carbon storage patterns. Future ecological restoration strategies must fully consider their intensity and spatial distribution, implement differentiated measures, and develop tailored approaches based on restoration types, striking a balance between ecological optimization and human intervention.

3.5. Spatial Correlation Analysis

Referring to the Moran index in Table 7, the results show that DEM has the highest spatial correlation with carbon stock (I = 0.48), followed by NDVI (I = 0.34), implying that the spatial correlation between carbon stock and the two is the most significant, mainly in an aggregated pattern; while rocky desertification has the lowest I value (I = −0.28), followed by POP (I = −0.23), with a spatial pattern of difference between carbon stock and the two being the most significant, with low values of both in areas of high carbon stock; and by using POP (I = −0.23), GDP (I = −0.18), and transportation location (I = −0.03) to characterize the impact of anthropogenic activities, the results showed that the Moran’s index of all three factors was negative. This implies that there is a certain negative correlation between these human activity factors and carbon stock in terms of spatial distribution. The spatial aggregation pattern of carbon stock is mainly manifested in the High-Low clustering, where high-value areas are surrounded by low-value areas, and areas with reduced or weaker human activities are often accompanied by higher carbon stock. On the other hand, the I-values of tree height, diameter at breast height (DBH), degree of depression, and age group tended to be 0 (I = 0~0.03), and the overall difference was relatively small, indicating that the spatial correlation between carbon stock and stand structure was weak, and that the distribution of carbon stock in forests did not have significant aggregation phenomenon, but rather was distributed relatively uniformly in each stand structure. From Figure 6, carbon stock and DEM are mainly High-High clustered in the west, and both carbon stock and DEM reach high values in the western part of Zijin County, and Low-Low clustered in the northeastern part of the county, showing low values, and combining with Figure 7 (distribution of rocky desertification), it can be seen that rocky desertification is mainly distributed in the north, east, and northeastern part of the study area, which are areas with frequent population activities, high use of arable land, serious soil erosion, and soil Compared with these areas, the western part has higher altitude, weaker rocky desertification, less anthropogenic interference, obvious vertical zone climate, and diversified vegetation types, which is conducive to the accumulation of carbon stock.
Overall, spatial analysis reveals that natural factors (elevation and vegetation cover) strongly promote carbon stock aggregation in western regions, while human activities and rocky desertification significantly inhibit carbon accumulation, particularly in the northeast. Carbon stock distribution shows clear spatial autocorrelation with environmental drivers but minimal dependence on forest stand structure.

4. Discussion

4.1. Differences in Carbon Stocks and Mechanisms of Ecological Restoration Measures

The present study revealed a significant difference in the carbon sink capacity of karst plateaus between planted forests and closed forests. Previous studies have shown that the cumulative rate of biomass in the arbor layer of closed forests is lower than that of planted forests [44,45]. Still, in this study, the average annual growth rate of carbon stock in the closed forest area (0.39%) was much higher than that of planted forests (0.05%). The carbon density of the area (217.37 Mg C/ha) was 22.12% higher than that of planted forests (Figure 5), a result consistent with the findings of Clifton et al. [46], who investigated that Mediterranean -Mountainous riparian zone natural restoration model can accumulate biomass more efficiently, which is consistent with the conclusion of the study, indicating that even in the karstic rocky desertification area, there are differences in carbon stock between different ecological restoration measures; the restoration measures may be the same in different geographic environments. The tree closure and shrub cover were significantly higher in the closed forest area than in the plantation area, indicating a more complex community structure and fuller ecological niche differentiation [47]. This diversity advantage not only enhances the photosynthetic carbon sequestration capacity of vegetation but also provides nutrients for tree growth through decomposition [48]. On the contrary, despite the faster growth rate of carbon stock in the short term, the high dependence on topographic conditions (slope r = 0.21) and anthropogenic management (traffic location r = 0.18) of planted forests leads to a weaker ability to resist disturbances, as evidenced by the plummet of carbon stock (−1.31%) in 2020–2025: planted economic forests (e.g., plum, walnut) are vulnerable to extreme droughts or policy adjustments, which can lead to a reduction in carbon stock. Extreme droughts or policy adjustments are prone to extensive degradation due to insufficient irrigation or interruption of conservation [9]. The results of this study are significantly different from the conclusion that forest carbon stock decreases with elevation in Hainan Island [41]. The higher carbon stock in the western high-elevation zone of Zhijin County than in the eastern low-elevation zone is mainly attributed to the special hydrological-geomorphological coupling mechanism of karst, where the well-developed subterranean river system in the southwestern trough area mitigates surface drought, and the frequent surface-subterranean water exchanges provide a stable water recharge for the vegetation [49], thus supporting the sustained development of the high-carbon-density forests. In highland troughs and valleys similar to those in Zhijin County, forest closure can be a prioritized strategy, whereas in karst plains lacking underground river recharge, artificial irrigation and microhabitat improvement (e.g., rock crevice filling) need to be combined to enhance the effectiveness of silviculture.

4.2. Spatial Heterogeneity Analysis of Carbon Stock Drivers

This study showed that the effects of natural factors (DEM, NDVI) and anthropogenic factors (POP, rocky desertification) on carbon stocks showed significant spatial heterogeneity. The positive driving effects of DEM and NDVI were most prominent in the southwest hotspot, and both showed strong spatial autocorrelation through Moran’s I (I = 0.48 vs. 0.34). This result is partially consistent with the findings of Nie et al. [25] in Fujian Province that topography indirectly affects carbon sink capacity by regulating water-heat redistribution. It was concluded that higher elevations are accompanied by lower intensity of anthropogenic disturbance and more stable hydrothermal conditions [50], and that the high elevation areas of the karst region are less rocky desertification and have a greater thickness of soil layer, which can support a more stable vegetation community [14], whereas the low elevation areas, despite the favorable hydrothermal conditions, suffer a significant loss of carbon stocks due to the expansion of arable land and rocky desertification. In addition, the negative effect of human activities is particularly significant in the northeastern cold spot area, where carbon density decreased by 22% from 2015 to 2020 due to the crowding out of ecological land by urbanization, confirming the “secondary crowding out” effect proposed by Ke et al. [35]. The negative correlation between temperature and carbon stock shows a unique mechanism in karst areas: high temperature does not directly inhibit photosynthesis, but induces seasonal drought by increasing evapotranspiration, which in turn restricts the growth of vegetation, and this process forms a positive feedback loop with rocky desertification: Drought causes vegetation degradation, leading to increased soil erosion, increased exposure of bedrock, increased surface albedo, and ultimately further local temperature increases [8]. Therefore, future ecological restoration needs to focus on water regulation techniques (e.g., rainwater harvesting systems, water-saving irrigation) to break this vicious cycle.

4.3. Research Limitations and Future Directions

Although this study improved the accuracy of estimating karst carbon stocks by combining multi-source data with models, the correction of AGC and BGC was only performed using linear regression, while the correction of DMC and SOC was insufficient. The soil carbon cycle period ranged from 0.9 to 152 years, with an average of 24.3 years, which is a relatively long period [51]. The forest closure (2006–2019) and afforestation (2009–2019) periods used in the study did not align with the average soil carbon cycle period of 24.3 years. Additionally, both forest closure (2006–2019) and afforestation (2009–2019) involve annual additions of new trees. Forest closure primarily relies on natural recovery, with human intervention limited to auxiliary measures, such as high proportions of spot planting (57.91%), while afforestation involves comprehensive planting. The carbon density cycles of these newly added trees are shorter than those of the previous year’s trees. The study suggests that changes in soil carbon density during the implementation phase can be ignored [31]. Regarding DMC, the forest litter layer has strong respiratory activity, and the rapid turnover of carbon elements results in weaker carbon sequestration capacity. Therefore, the carbon density of the litter layer can be considered a constant value [52]. Since SOC and DMC are not significantly different, no correction was applied, and this limitation has a limited impact on the study. Annual predictions fail to capture the impact of seasonal changes on carbon storage, and the effects of the rainy and dry seasons may cause fluctuating changes in carbon storage [53]. Furthermore, since the CA-Markov model predicts land use under a no-intervention scenario—projecting a severe outcome consistent with historical expansion patterns—it cannot account for policy variables. Our study demonstrates, conversely, that without implementing these policies, carbon stocks face substantial loss risks, as indicated in our projections. Future research should further integrate high-precision remote sensing technology to analyze the dynamic changes in carbon storage under different spatiotemporal sequences [54,55]. It should also incorporate “policy constraints” as a dynamic variable into predictive models and introduce ecological models, such as LPJ-GUESS, to simulate the dynamic processes of the carbon cycle under vegetation-soil-hydrological coupling conditions. Additionally, it should focus on exploring the incentive effects of carbon trading and ecological compensation mechanisms on farmers, providing a basis for the synergistic path between “ecological restoration” and “economic development” [56].

5. Conclusions

This study systematically revealed the spatiotemporal evolution patterns and driving mechanisms of carbon storage under ecological restoration measures in karst plateau regions by integrating multi-source data and improving models. The results indicate that ecological restoration should prioritize natural recovery methods, such as maintaining close forests, to enhance carbon sink stability. At the same time, strict control of building land expansion is necessary, along with the implementation of a zoned governance strategy—focusing on the protection of the high-carbon-sink ecological zone in the southwest, strengthening desertification control and human activity management in the degraded areas of the northeast, and achieving sustainable development through harmonious human-land interaction. The main conclusions are as follows:
1. Carbon storage increased by 6.09% from 2000 to 2020, but decreased sharply by 7.69% from 2020 to 2025 due to the conversion of forest land to building land and climate change. High-value areas are located in the southwest (high vegetation cover, low rock desertification), while low-value areas are in the northeast (high human activity, severe rock desertification).
2. Natural forests have a carbon sink efficiency 22.12% higher than planted forests, with an annual carbon growth rate 7.8 times that of planted forests, and stronger resistance to disturbances. Severe stone desertification significantly impacts carbon storage.
3. Both natural and human factors drive carbon storage, requiring differentiated management. Elevation and vegetation cover positively drive carbon storage, while population density and stone desertification negatively drive it. The southwest relies on natural conditions, while the northeast requires control of human activities.

Supplementary Materials

The following supporting information can be downloaded at: https://www.mdpi.com/article/10.3390/land14091903/s1, Table S1. Raw data of land use and land cover (LULC) change transition matrix.

Author Contributions

Conceptualization, S.L. and P.Y.; Data curation, P.Y.; Formal analysis, P.Y.; Funding acquisition, P.Y.; Investigation, S.L.; Methodology, S.L.; Software, S.L., H.Z., X.G. and C.Y.; Supervision, H.Z., X.G. and C.Y.; Validation, S.L., H.Z., X.G. and C.Y.; Visualization, S.L. and H.Z.; Writing—original draft, S.L.; Writing—review and editing, S.L. All authors have read and agreed to the published version of the manuscript.

Funding

This study is financially supported by the National Natural Science Foundation of China (32560394); Guizhou Provincial Science and Technology Program (Qian Ke He Ping Tai YWZ [2025] 001); Guizhou Provincial 2025 Central Government Guided Local Science and Technology Development Fund Project (Qian Ke He Zhong Yin Di [2025] 031); Guizhou Provincial Key Laboratory Construction Project, (Qian Ke He Ping Tai [2025] 014).

Data Availability Statement

The original contributions presented in the study are included in the article/Supplementary Material, further inquiries can be directed to the corresponding author.

Acknowledgments

We thank the corresponding authors for their support and the various authors for their cooperation.

Conflicts of Interest

The authors declare no conflicts of interest.

References

  1. Liu, Z.; Deng, Z.; He, G.; Wang, H.; Zhang, X.; Lin, J.; Qi, Y.; Liang, X. Challenges and opportunities for carbon neutrality in China. Nat. Rev. Earth Environ. 2022, 3, 141–155. [Google Scholar] [CrossRef]
  2. Zhang, Y.; Zhang, Z.; Zhang, M.; Yuan, Z. The Global Situation of Karst Desertification Research Based on Forest Ecology. Forests 2024, 15, 126. [Google Scholar] [CrossRef]
  3. Wen, D.; Huang, Y.; Huang, Y.; Ding, N.; Ni, K.; Wang, H.; Müller, C. Karst rocky desertification restoration increases soil inorganic N supply to reduce plant N limitation. Catena 2024, 241, 108012. [Google Scholar] [CrossRef]
  4. Jiang, Z.; Lian, Y.; Qin, X. Rocky desertification in Southwest China: Impacts, causes, and restoration. Earth-Sci. Rev. 2014, 132, 1–12. [Google Scholar]
  5. Gao, A.J. Study on Water-Fertilizer Coupling and Fruit Quality Improvement Techniques for Rosa roxburghii in Karst Rocky Desertification Control; Guizhou Normal University: Guiyang, China, 2021. (In Chinese) [Google Scholar]
  6. Quan, X.Y.; Su, W.C.; Gou, R.; Huang, X.F. Analysis of Spatiotemporal Differentiation Characteristics and Trade-off/Synergy Relationships of Ecosystem Services in the FAST Radio Quiet Zone. China Environ. Sci. 2024, 44, 5145–5159. (In Chinese) [Google Scholar] [CrossRef]
  7. Lan, G.W.; Zhang, F.; Wu, J.; Jiang, F. Spatiotemporal Differentiation Characteristics and Dynamic Simulation of “Production-Living-Ecological” Functions in the Lijiang River Basin. Res. Soil Water Conserv. 2024, 31, 431–442. (In Chinese) [Google Scholar]
  8. Wang, S.J.; Li, Y.B.; Li, R.L. Formation Background, Evolution and Control of Karst Rocky Desertification. Quat. Sci. 2003, 6, 657–666. (In Chinese) [Google Scholar]
  9. Xiong, H.F.; Wang, S.J.; Rong, L.; Cheng, A.y.; Li, Y.B. Effects of Extreme Drought on Plants in Karst Areas of Guizhou Province. Chin. J. Appl. Ecol. 2011, 22, 1127–1134. (In Chinese) [Google Scholar]
  10. Yu, Q.H. Research on Employment Issues in the Process of Economic Growth in Guizhou Province; Minzu University of China: Beijing, China, 2012. (In Chinese) [Google Scholar]
  11. Huang, J.; Shi, Q.; Ou, G.W.; Cui, W.; Sun, Q. Dilemmas and Countermeasures for the Development of Modern Mountain Efficient Agriculture in Guizhou. Guizhou Agric. Sci. 2015, 43, 275–279. (In Chinese) [Google Scholar]
  12. Pan, Y.; Birdsey, R.A.; Fang, J.; Houghton, R.; Kauppi, P.E.; Kurz, W.A.; Phillips, O.L.; Shvidenko, A.; Lewis, S.L.; Canadell, J.G.; et al. A large and persistent carbon sink in the world’s forests. Science 2011, 333, 988–993. [Google Scholar] [CrossRef] [PubMed]
  13. Xu, X.L.; Cao, M.K.; Li, K.R. Study on Spatiotemporal Dynamic Changes of Vegetation Carbon Storage in China’s Forest Ecosystems. Prog. Geogr. 2007, 6, 1–10. (In Chinese) [Google Scholar]
  14. Ding, Y.L.; Zhou, Y.C. Study on the Coupling Relationship Between Slope-Soil Thickness and Rock Exposure Rate in a Karst Small Watershed. Chin. J. Soil Sci. 2019, 50, 1053–1061. (In Chinese) [Google Scholar]
  15. Lei, Z.B. Discussion on the Causes and Control Countermeasures of Rocky Desertification in Karst Areas of Zhijin County. Subtrop. Soil Water Conserv. 2009, 21, 52–54. (In Chinese) [Google Scholar]
  16. Huang, F. Economic Value of Forest Carbon Sinks. Guangxi For. 2006, 5, 42–44. (In Chinese) [Google Scholar]
  17. Huang, Y. Research on Forest Carbon Sinks in the Era of Low-Carbon Economy. J. Northwest For. Univ. 2012, 27, 260–268. (In Chinese) [Google Scholar]
  18. Yin, R.; Yin, G. China’s primary programs of terrestrial ecosystem restoration: Initiation, implementation, and challenges. Environ. Manag. 2010, 45, 429–441. [Google Scholar] [CrossRef]
  19. Vogler, K.C.; Ager, A.A.; Day, M.A.; Jennings, M.; Bailey, J.D. Prioritization of forest restoration projects: Tradeoffs between wildfire protection, ecological restoration and economic objectives. Forests 2015, 6, 4403–4420. [Google Scholar] [CrossRef]
  20. Fu, H.; Yan, Y. Ecosystem service value assessment in downtown for implementing the “Mountain-River-Forest-Cropland-Lake-Grassland system project”. Ecol. Indic. 2023, 154, 110751. [Google Scholar] [CrossRef]
  21. Lu, F.; Hu, H.; Sun, W.; Zhu, J.; Liu, G.; Zhou, W.; Yu, G. Effects of national ecological restoration projects on carbon sequestration in China from 2001 to 2010. Proc. Natl. Acad. Sci. USA 2018, 115, 4039–4044. [Google Scholar] [CrossRef]
  22. Xu, C.; Jiang, Y.; Su, Z.; Liu, Y.; Lyu, J. Assessing the impacts of Grain-for-Green Programme on ecosystem services in Jinghe River basin, China. Ecol. Indic. 2022, 137, 108757. [Google Scholar] [CrossRef]
  23. Wei, C.; Dong, X.; Yu, D.; Liu, J.; Reta, G.; Zhao, W.; Su, B. An alternative to the Grain for Green Program for soil and water conservation in the upper Huaihe River basin, China. J. Hydrol. Reg. Stud. 2022, 43, 101180. [Google Scholar] [CrossRef]
  24. Egusa, T.; Nakahata, R.; Neumann, M.; Kumagai, T.O. Carbon stock projection for four major forest plantation species in Japan. Sci. Total Environ. 2024, 927, 172241. [Google Scholar] [CrossRef] [PubMed]
  25. Nie, Q.; Wu, G.; Li, L.; Man, W.; Ma, J.; Bao, Z.; Li, H. Exploring scaling differences and spatial heterogeneity in drivers of carbon storage Changes: A comprehensive geographic analysis framework. Ecol. Indic. 2024, 165, 112193. [Google Scholar] [CrossRef]
  26. Feng, Q.; Zhou, Z.; Chen, Q.; Zhu, C.; Zhang, L. Evaluating the Ecological Restoration Effectiveness of Poverty Alleviation Relocation through Carbon Storage Analysis: Insights from Karst Regions. Forests 2024, 15, 1006. [Google Scholar] [CrossRef]
  27. Li, Y.; Luo, H.F. Spatio-temporal Evolution and Multi-scenario Simulation of Carbon Storage in Karst Regions of Central Guizhou Province: Taking Puding County as An Example. Environ. Sci. 2024, 45, 961–973. [Google Scholar]
  28. Qasha, V.; Manyevere, A.; Flynn, T.; Mashamaite, C.V. Assessing the impact of ecological forest restoration on soil carbon stocks in Sub-Saharan Africa: A systematic review. Carbon Manag. 2024, 15, 2404409. [Google Scholar] [CrossRef]
  29. Liu, J.; Gao, W.; Liu, T.; Dai, L.; Wu, L.; Miao, H.; Yang, C. A bibliometric analysis of the impact of ecological restoration on carbon sequestration in ecosystems. Forests 2023, 14, 1442. [Google Scholar] [CrossRef]
  30. Guo, X.; Liu, Y.; Xie, T.; Li, Y.; Liu, H.; Wang, Q. Impact of Ecological Restoration on Carbon Sink Function in Coastal Wetlands: A Review. Water 2025, 17, 488. [Google Scholar] [CrossRef]
  31. Luo, D.; Zhou, Z.; Zhang, L.; Chen, Q.; Huang, D.; Feng, Q.; Wu, T.; Wu, L. Evolution and driver analysis of forest carbon stocks in karst mountainous areas of southwest China in the context of rocky desertification management. Catena 2024, 246, 108335. [Google Scholar] [CrossRef]
  32. Lin, T.; Wu, D.; Yang, M.; Ma, P.; Liu, Y.; Liu, F.; Gan, Z. Evolution and simulation of terrestrial ecosystem carbon stock and sustainability assessment in Karst Areas: A case study of Guizhou Province. Int. J. Environ. Res. Public Health 2022, 19, 16219. [Google Scholar]
  33. Lyons, K.G.; Török, P.; Hermann, J.M.; Kiehl, K.; Kirmer, A.; Kollmann, J.; Temperton, V.M. Challenges and opportunities for grassland restoration: A global perspective of best practices in the era of climate change. Glob. Ecol. Conserv. 2023, 46, e02612. [Google Scholar] [CrossRef]
  34. Fu, K.; Chen, L.; Yu, X.; Jia, G. How has carbon storage changed in the Yili-Tianshan region over the past three decades and into the future? What has driven it to change? Sci. Total Environ. 2024, 945, 174005. [Google Scholar]
  35. Ke, X.L.; Tang, L.P. Impact of Coupling between Urban Expansion and Cultivated Land Protection on Terrestrial Ecosystem Carbon Storage: A Case Study of Hubei Province. Acta Ecol. Sin. 2019, 39, 672–683. (In Chinese) [Google Scholar]
  36. Hamad, R.; Balzter, H.; Kolo, K. Predicting land use/land cover changes using a CA-Markov model under two different scenarios. Sustainability 2018, 10, 3421. [Google Scholar] [CrossRef]
  37. Peng, S.L.; He, N.P. 2004–2014 Chinese Forest Carbon Density Dataset. Chin. Acad. Sci. 2018. (In Chinese) [Google Scholar] [CrossRef]
  38. Luo, D.; Zhou, Z.F.; Chen, Q.; Zhang, L.; Wu, L.; Wu, T.Y. Response of Carbon Storage to Land Use Patterns in Karst Areas: A Case Study of Nanpanjiang and Beipanjiang River Basins. Acta Ecol. Sin. 2023, 43, 3500–3516. (In Chinese) [Google Scholar]
  39. Gwal, S.; Sena, D.R.; Srivastava, P.K.; Srivastava, S.K. Identifying Conservation Priority Areas of Hydrological Ecosystem Service Using Hot and Cold Spot Analysis at Watershed Scale. Remote Sens. 2024, 16, 3409. [Google Scholar] [CrossRef]
  40. Qi, Z.; Li, S.; Pang, Y.; Zheng, G.; Kong, D.; Li, Z. Assessing spatiotemporal variations of forest carbon density using bi-temporal discrete aerial laser scanning data in Chinese boreal forests. For. Ecosyst. 2023, 10, 100135. [Google Scholar] [CrossRef]
  41. Gao, S.C.; Chen, Y.Q.; Chen, Z.Z.; Lei, J.R.; Wu, T.T. Carbon Storage and Its Spatial Distribution Characteristics in Forest Ecosystems of Hainan Island. Acta Ecol. Sin. 2023, 43, 3558–3570. (In Chinese) [Google Scholar] [CrossRef]
  42. Pan, H.; Shuai, J.; Li, J.; Li, H.; Zhang, H.; Zhang, T.; Ji, X. Analysis of Deformation Behavior Characteristics of Double-Prevention Boreholes Based on Pearson Correlation Coefficient. Rock Mech. Rock Eng. 2025, 58, 6893–6915. [Google Scholar] [CrossRef]
  43. Lemmerz, T.; Herlé, S.; Blankenbach, J. Geostatistics on real-time geodata streams—An extended spatiotemporal moran’s I index with distributed stream processing technologies. ISPRS Int. J. Geo-Inf. 2023, 12, 87. [Google Scholar]
  44. Tan, J.; Rong, L.; Xiong, K.N. Correlation Study Between Rocky Desertification Grade and Vegetation Carbon Storage: Taking Dingtan Small Watershed as an Example. J. Guizhou Norm. Univ. Nat. Sci. 2013, 31, 88–91+108. (In Chinese) [Google Scholar]
  45. Huang, D.M.; Chen, Y.L.; Mo, J.F.; Huang, X.H.; Mao, Y.C.; Qing, B.Y. Variation Characteristics of Vegetation Coverage with Terrain in Typical Geomorphology of Guangxi. Guangxi For. Sci. 2022, 51, 626–633. (In Chinese) [Google Scholar]
  46. Clifton, B.; Ghezzehei, T.A.; Viers, J.H. Carbon stock quantification in a floodplain restoration chronosequence along a Mediterranean-montane riparian corridor. Sci. Total Environ. 2024, 946, 173829. [Google Scholar] [CrossRef] [PubMed]
  47. Lan, X.; Du, H.; Song, T.Q.; Zeng, F.P.; Peng, W.X.; Liu, Y.X.; Fan, Z.L.; Zhang, J.Y. Carbon Storage and Its Influencing Factors of Major Forest Vegetation in Guangxi. Acta Ecol. Sin. 2019, 39, 2043–2053. (In Chinese) [Google Scholar]
  48. Zhang, H.; Feng, Z.; Shen, C.; Li, Y.; Feng, Z.; Zeng, W.; Huang, G. Relationship between the geographical environment and the forest carbon sink capacity in China based on an individual-tree growth-rate model. Ecol. Indic 2022, 138, 108814. [Google Scholar] [CrossRef]
  49. Shi, Q.W.; Ke, L.P.; Nie, X.; Zhao, Y.; Zhao, T.F. Analysis of Spatiotemporal Distribution Characteristics of Short-time Heavy Precipitation in Zhijin County. Meteorol. Hydrol. Mar. Instrum. 2022, 39, 49–52. (In Chinese) [Google Scholar]
  50. Qiu, Z.X. Research on Methods and Applications for Measuring Forest Vegetation Carbon Sinks on China’s Land Surface; Beijing Forestry University: Beijing, China, 2020. (In Chinese) [Google Scholar] [CrossRef]
  51. Wang, J.; Sun, J.; Xia, J.; He, N.; Li, M.; Niu, S. Soil and vegetation carbon turnover times from tropical to boreal forests. Funct. Ecol. 2018, 32, 71–82. [Google Scholar] [CrossRef]
  52. Carvalhais, N.; Forkel, M.; Khomik, M.; Bellarby, J.; Jung, M.; Migliavacca, M.; Reichstein, M. Global covariation of carbon turnover times with climate in terrestrial ecosystems. Nature 2014, 514, 213–217. [Google Scholar] [CrossRef]
  53. Zhang, Y.; Tan, Z.; Song, Q.; Yu, G.; Sun, X. Respiration controls the unexpected seasonal pattern of carbon flux in an Asian tropical rain forest. Atmos. Environ. 2010, 44, 3886–3893. [Google Scholar] [CrossRef]
  54. Chen, Y.; Guerschman, J.P.; Cheng, Z.; Guo, L. Remote sensing for vegetation monitoring in carbon capture storage regions: A review. Appl. Energy 2019, 240, 312–326. [Google Scholar] [CrossRef]
  55. Li, L.; Xin, X.; Zhao, J.; Yang, A.; Wu, S.; Zhang, H.; Yu, S. Remote sensing monitoring and assessment of global vegetation status and changes during 2016–2020. Sensors 2023, 23, 8452. [Google Scholar] [CrossRef] [PubMed]
  56. Cai, W.M.; Wang, Y.Q.; Lin, G.B.; Huo, C.B.; Sun, X.B. Construction of the Value Realization Mechanism of Forest Carbon Sink Resource Assets from the Perspective of Income System. Resour. Ind. 2024, 26, 13–22. (In Chinese) [Google Scholar]
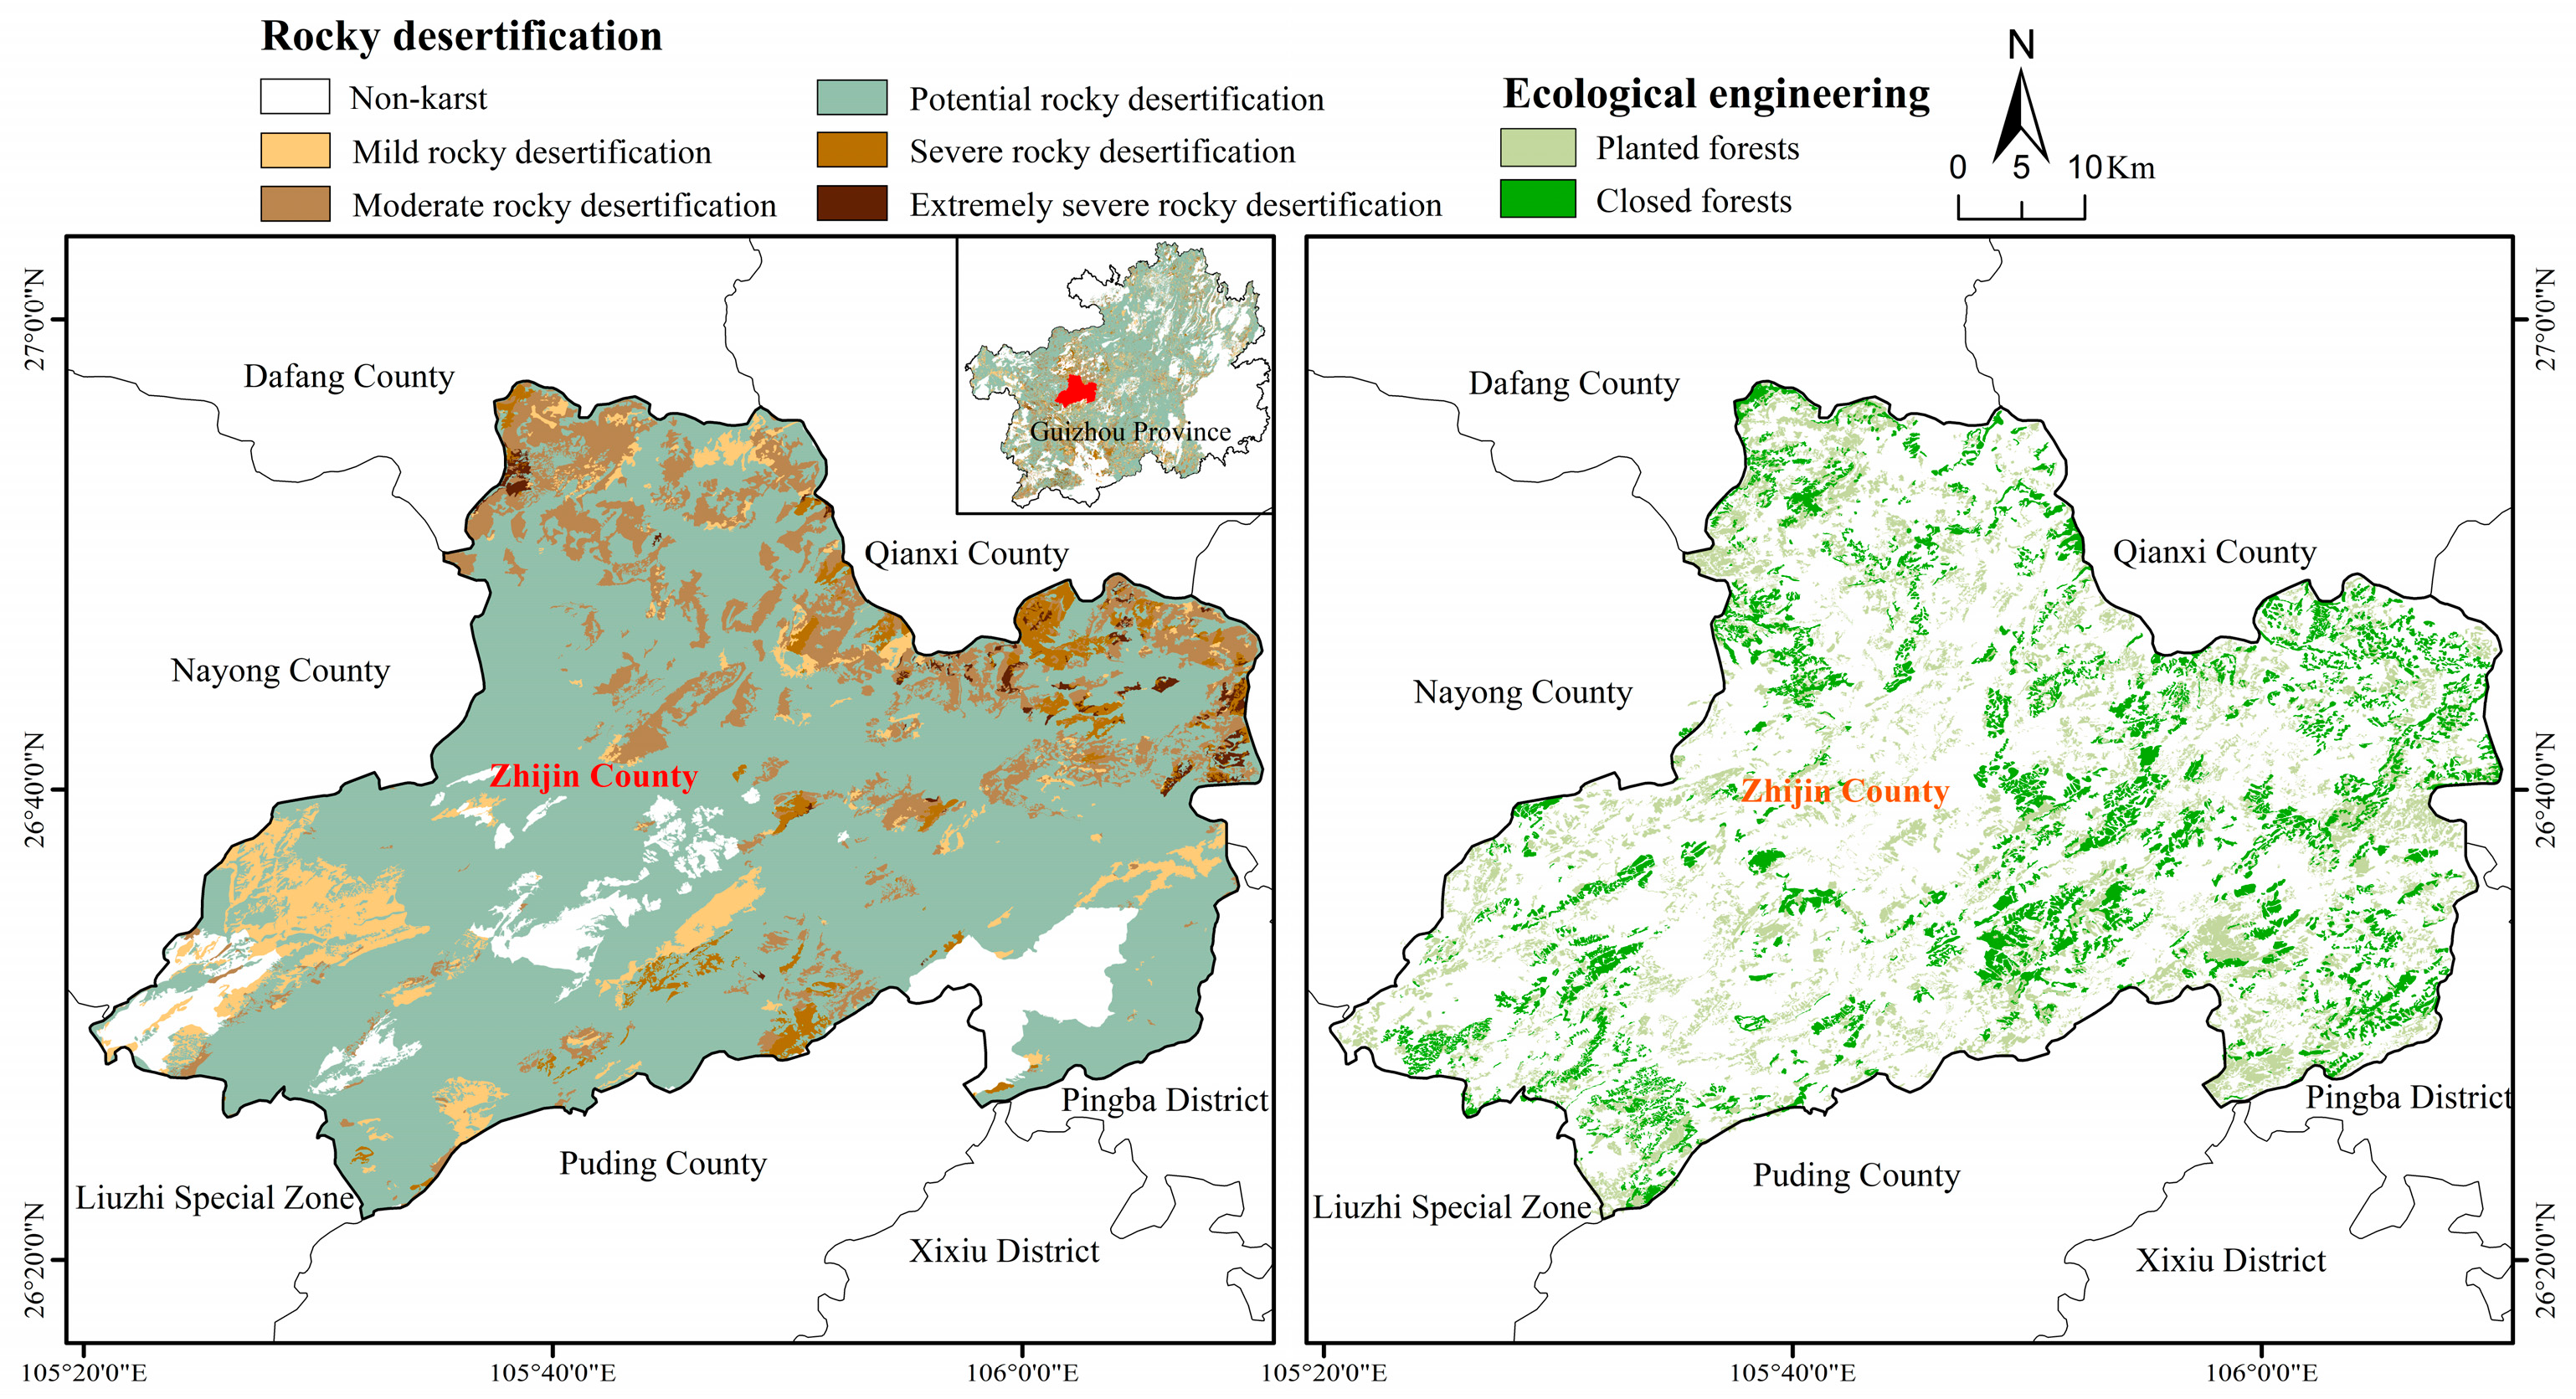
Figure 1. Map of the study area.
Land 14 01903 g001
Figure 2. Carbon density correction model (The red line in the figure represents the linear regression equation).
Land 14 01903 g002
Figure 3. Spatiotemporal dynamics of carbon stocks (2000–2030). Note: The last subplot in the figure is a hotspot analysis diagram.
Land 14 01903 g003
Figure 4. Sankey diagram illustrating the transitions (flows) between different land use types across study periods.
Land 14 01903 g004
Figure 5. Carbon stock and carbon density changes: left (carbon stock), right (carbon density).
Land 14 01903 g005
Figure 6. Carbon density of ecological restoration measures under different degrees of rocky desertification.
Land 14 01903 g006
Figure 7. Cluster distribution: (a) DEM; (b) NDVI; (c) rocky desertification; (d) POP.
Land 14 01903 g007
Table 1. Data Sources.
Date TypeResolutionProcessing MethodSource
Ecological engineering30 mProcessed with ArcGIS to a resolution of 30 mCounty Forestry Bureau
Bedrock Exposure Rate, Soil Layer Thickness30 mProcessed with ArcGIS to a resolution of 30 mhttps://sck.gznu.edu.cn (accessed on 20 August 2024)
DEM Terrain Data30 mDirect acquisitionhttps://www.gscloud.cn (accessed on 18 July 2024)
Soil Data30 mKriging interpolation downscaled to the study area resolutionhttps://data.casearth.cn (accessed on 12 August 2024)
Land Use Data30 mImage interpretation (accuracy ≥ 85%) + spatiotemporal consistency correctionhttps://www.geodata.cn (accessed on 18 July 2024)
Terrain Roughness30 mDirect acquisitionhttps://portal.opentopography.org (accessed on 12 August 2024)
Temperature30 mKriging interpolation downscaled to the study area resolutionhttps://www.ncei.noaa.gov (accessed on 3 September 2024)
Precipitation30 mCorrected using the vertical temperature lapse rate to a resolution of 30 mhttps://data.tpdc.ac.cn (accessed on 3 September 2024)
GDP, POP100 mData fusion estimationhttps://hub.worldpop.org (accessed on 3 September 2024)
Table 2. Model parameter evaluation.
Carbon DensityR2CoefficientValueSEtp
AGC0.642Intercept15.6263.12345.0024<0.01
Slope0.8380.06612.7731<0.01
BGC0.364Intercept4.5751.01316.9403<0.01
Slope0.2230.03228.6266<0.01
DMC0.018Intercept1.4130.52710.0406<0.05
Slope0.0430.00520.8558
SOC0.001Intercept149.77144.9515.97<0.01
Slope0.3320.28491.1543
Note: “–” indicates no significant difference (p > 0.05).
Table 3. Carbon density (Mg C/ha) for each land use type in the study area in 2020.
Land Use TypeAGCBGCDMCSOC
Cropland000104.2
Woodland53.4214.633.35164.74
Scrubland15.019.41089.93
Grassland0.9590119.61
Wetland0.650.260190.64
Building land0000
Water0000
Table 4. Hot and cold spot zoning.
Z(Gi*) Range≤−1.96[−1.95, −1.65](−1.65, 1.65)[1.65,1.95][1.96, 2.58)≧−2.58
partitionssignificant cold spotCold spotsNot significantHot spotsSignificant hot spotsVery significant hot spots
Table 5. Land use change (ha).
YearCroplandWoodlandScrublandGrasslandWetlandBuilding LandWater
200043,390.21223,636.521231.8515,745.90432.831635.10608.69
200542,814.43223,143.891328.9014,964.441167.512108.961152.87
201042,436.57221,818.211309.4115,908.67758.412831.161621.00
201541,109.96219,506.261293.7217,061.18573.025020.192119.29
202041,209.67217,697.821281.3417,867.17483.245583.142526.70
202537,520.50186,093.871244.4735,198.511379.9521,706.543488.59
203037,159.03183,994.161268.4435,941.061184.8622,735.974411.37
Table 6. Average annual growth rate of carbon stocks.
Time PeriodGrowth Rate of Planted Forests (%)Growth Rate of Forest Closure (%)Growth Rate of Other Regions (%)
2000–20050.421.770.14
2005–20100.370.460.27
2010–20150.290.420.15
2015–20200.340.460.24
2020–2025−1.31−0.97−1.70
2025–20300.170.200.18
2000–20300.050.39−0.12
Table 7. Factor correlations.
FactorsCarbon StocksPlanted ForestsForest ClosureI
rprprp
Traffic location−0.05<0.010.18<0.010.11<0.01−0.03
Temperature−0.14<0.01−0.07<0.01−0.04<0.01−0.21
Tree height−0.03<0.010.17<0.010.09<0.010
Trees per hectare0.04<0.010.12<0.010.01<0.010.1
Accumulation0.01<0.010.12<0.010.04<0.010.06
DBH0.01-0.14<0.010.04<0.010.02
Tree species−0.05<0.01−0.08<0.01−0.01<0.01−0.12
Canopy density0.02<0.010.2<0.010.2<0.010.03
Forest category−0.13<0.01−0.11<0.01−0.08<0.01−0.05
Age group−0.06<0.010.15<0.010.02<0.010.03
Forest species−0.13<0.010<0.01−0.08<0.01−0.06
GDP−0.01<0.01−0.02<0.010<0.01−0.18
NDVI0.29<0.010.33<0.010.38<0.010.34
Precipitation0.01<0.010.08<0.010.06<0.010.12
POP−0.23<0.01−0.14<0.01−0.1-−0.23
DEM0.28<0.010.29<0.010.16<0.010.48
Terrain roughness0.19<0.010.26<0.010.05<0.010.26
Soil thickness0.05<0.010.13<0.010.06<0.010.1
soil types−0.02<0.010.13<0.010-−0.06
Slope0.1<0.010.21<0.010.14<0.010.16
Slope position−0.06<0.01−0.05<0.01−0.06<0.01−0.17
Aspect−0.05<0.01−0.05<0.01−0.06<0.01−0.03
Rocky desertification−0.11<0.01−0.17<0.01−0.13<0.01−0.28
Note: “-” indicates no significant difference (p > 0.05).
Disclaimer/Publisher’s Note: The statements, opinions and data contained in all publications are solely those of the individual author(s) and contributor(s) and not of MDPI and/or the editor(s). MDPI and/or the editor(s) disclaim responsibility for any injury to people or property resulting from any ideas, methods, instructions or products referred to in the content.