Article

Identifying Suitable Zones for Tourism Activities on the Qinghai–Tibet Plateau Based on Trajectory Data and Machine Learning

1
Institute of Geographic Sciences and Natural Resources Research, Chinese Academy of Sciences, Beijing 100101, China
2
University of Chinese Academy of Sciences, Beijing 100049, China
*
Author to whom correspondence should be addressed.
Land 2025, 14(9), 1885; https://doi.org/10.3390/land14091885
Submission received: 16 August 2025 / Revised: 5 September 2025 / Accepted: 12 September 2025 / Published: 15 September 2025

Abstract

The Qinghai–Tibet Plateau (QTP), a globally significant tourist destination and critical ecological barrier, faces an intrinsic conflict between development and conservation. The scientific identification of suitable tourism zones is therefore crucial for formulating sustainable development policies. Conventional suitability assessments, however, which typically rely on subjective, expert-based weighting and static, supply-side data, often fail to capture the complex, non-linear dynamics of actual tourist–environment interactions. To overcome these limitations, an innovative analytical framework is presented, integrating massive tourist trajectory big data (66.7 million GPS points) as an objective, demand-driven suitability proxy, a Geo-detector model to identify key drivers and their interactions, and a Random Forest algorithm for spatial prediction. The framework achieves high predictive accuracy (AUC = 0.827). The results reveal significant spatial heterogeneity: over 85% of the QTP is unsuitable for tourism, while suitable zones are intensely concentrated in southeastern river valleys, forming distinct agglomerations around core cities and along primary transport arteries. Analysis demonstrates that supporting conditions—particularly transport accessibility and service facility density—are the dominant drivers, their influence substantially surpassing that of natural resource endowment. Furthermore, the formation of high-suitability zones is not attributable to any single factor but rather to the synergistic coupling of multiple conditions. This research establishes a replicable, data-driven paradigm for tourism planning in environmentally sensitive regions, offering a robust scientific basis to guide the sustainable development of the QTP.

1. Introduction

The scientific identification of suitable tourism zones is a critical prerequisite for sustainable regional planning and management, providing a spatial framework to balance economic development with ecological preservation [1,2]. Globally, inadequately planned tourism has resulted in significant challenges in numerous destinations, including severe ecological degradation in popular coastal areas and the erosion of cultural heritage in historic cities under the pressure of over-tourism [3,4,5]. A robust and objective assessment of tourism suitability is therefore fundamental to optimizing resource allocation, guiding tourist flows, mitigating environmental and social risks, and ultimately fostering a resilient tourism economy [1,6]. The primary objective of this study is to develop and validate an innovative, data-driven framework for identifying tourism suitability zones. By moving beyond traditional subjective evaluations, this research aims to provide a more precise, replicable, and scientifically grounded basis for sustainable tourism policy and spatial planning, particularly within large-scale, environmentally sensitive regions.
The Qinghai–Tibet Plateau (QTP) serves as a compelling case study, as it epitomizes the intense conflict between rapid tourism development and ecological preservation [7,8]. The region’s economic reliance on tourism is substantial: in 2023, tourism revenue contributed up to 27.23% of Tibet’s GDP, and visitor arrivals surpassed the local population by more than tenfold [9]. While this economic growth is crucial for local livelihoods, it exerts immense pressure on the plateau’s highly fragile ecosystem, which functions as a critical ecological security barrier for Asia [10,11]. Consequently, the QTP’s unique combination of high tourism dependency and extreme environmental constraints provides an ideal yet challenging context for advancing methodologies in sustainable tourism suitability assessment [9,12].
Existing literature on tourism suitability reflects considerable progress. In terms of content, research has evolved from assessing single-type tourism (e.g., ecotourism, rural tourism) to comprehensive regional suitability evaluations that consider multiple tourism formats [13,14]. Methodologically, the dominant paradigm has been Geographic Information System-based Multi-Criteria Decision Analysis (GIS-MCDA) [15,16]. Within this framework, techniques such as the Analytic Hierarchy Process (AHP) and expert scoring are widely used for weight determination [15,17]. More recently, with the advent of data science, machine learning models such as Random Forest (RF), Artificial Neural Networks (ANNs), and Support Vector Machines (SVMs) have been introduced to enhance predictive accuracy [18,19,20]. Regarding the indicators used, studies have established comprehensive systems typically encompassing natural environmental factors (e.g., topography, climate, vegetation), tourism resource endowment [1,15].
Despite this progress, significant limitations persist in existing research. The heavy reliance on expert-defined weights in most MCDA models introduces subjectivity, which limits the objectivity and replicability of the results [15,21,22]. Furthermore, these evaluations are predominantly based on a static, supply-side assessment of environmental and infrastructural factors, often failing to integrate the dynamic, demand-side dynamics reflected in tourists’ actual spatial behaviors [23,24,25]. Finally, the conventional weighted overlay approach inherently simplifies the relationships between factors by assuming they are linear and independent, thereby failing to capture the complex, non-linear interactions that govern real-world geographical systems [26,27].
To address these critical research gaps, this study proposes a novel framework that integrates tourist trajectory big data, the Geo-detector model, and a Random Forest algorithm. To overcome the limitations of subjectivity and a static supply-side focus, a massive dataset of tourist GPS trajectories is utilized as an objective, dynamic, and demand-driven quantitative measure of tourism suitability, reflecting the actual spatial choices made by tourists [28,29]. To move beyond the simplistic assumption of linear factor relationships, the Geo-detector model is employed to identify key driving factors and cruciall to diagnose the types and strengths of their non-linear interactions [30,31]. Finally, to enhance predictive power, the Random Forest model is leveraged—a model highly effective at handling complex, high-dimensional, and non-linear geographical data—to produce a fine-grained and accurate suitability map of the QTP [18,32]. Through this integrated, data-driven approach, this study aims not only to provide a robust scientific foundation for the sustainable development of tourism on the QTP but also to offer a new, replicable analytical paradigm for tourism suitability research in other environmentally sensitive regions globally.

2. Study Area and Data Source

2.1. Study Area

The Qinghai–Tibet Plateau (QTP), often referred to as the “Third Pole of the Earth,” possesses an average elevation exceeding 4000 m, rendering it the highest and most topographically complex geographical unit globally [33] (Figure 1). The region is characterized by abundant natural landscape resources, including snow-capped mountains, grasslands, and lakes, in addition to diverse folk cultures, making it a world-renowned tourist destination [34]. Tourism constitutes a key pillar of the local economy. However, tourism activities in this area are constrained by both the natural environment and the available infrastructure [35]. Therefore, the scientific identification of suitable tourism zones is of significant theoretical and practical importance for the sustainable development of the region’s ecology and tourism industry [23,36].

2.2. Data Sources and Processing

The data sources utilized in this research are detailed in Table 1. Trajectory data were sourced from the “foooooot” outdoor-tracking platform, which contains over 8.97 million publicly shared trajectories. The platform’s core user base is primarily composed of individuals engaged in outdoor sports, self-guided tours, and in-depth experiential tourism [37]. These users typically record and share detailed itineraries, resulting in trajectory data characterized by high spatial precision and significant behavioral information [38]. Following data cleaning, 22,531 valid trajectories, comprising a total of 66,741,500 trajectory points, were obtained to quantify tourism activity suitability. Concurrently, multi-dimensional data covering the natural environment, socio-economics, and infrastructure were integrated into the analysis. To ensure consistency in the spatial analysis, all data were standardized within the ArcGIS environment. This process included unifying the coordinate system to WGS 1984 Albers and resampling all raster layers to a 1 × 1 km grid resolution, which ultimately produced a unified spatial database for subsequent modeling and analysis.

3. Methodology

3.1. Research Framework

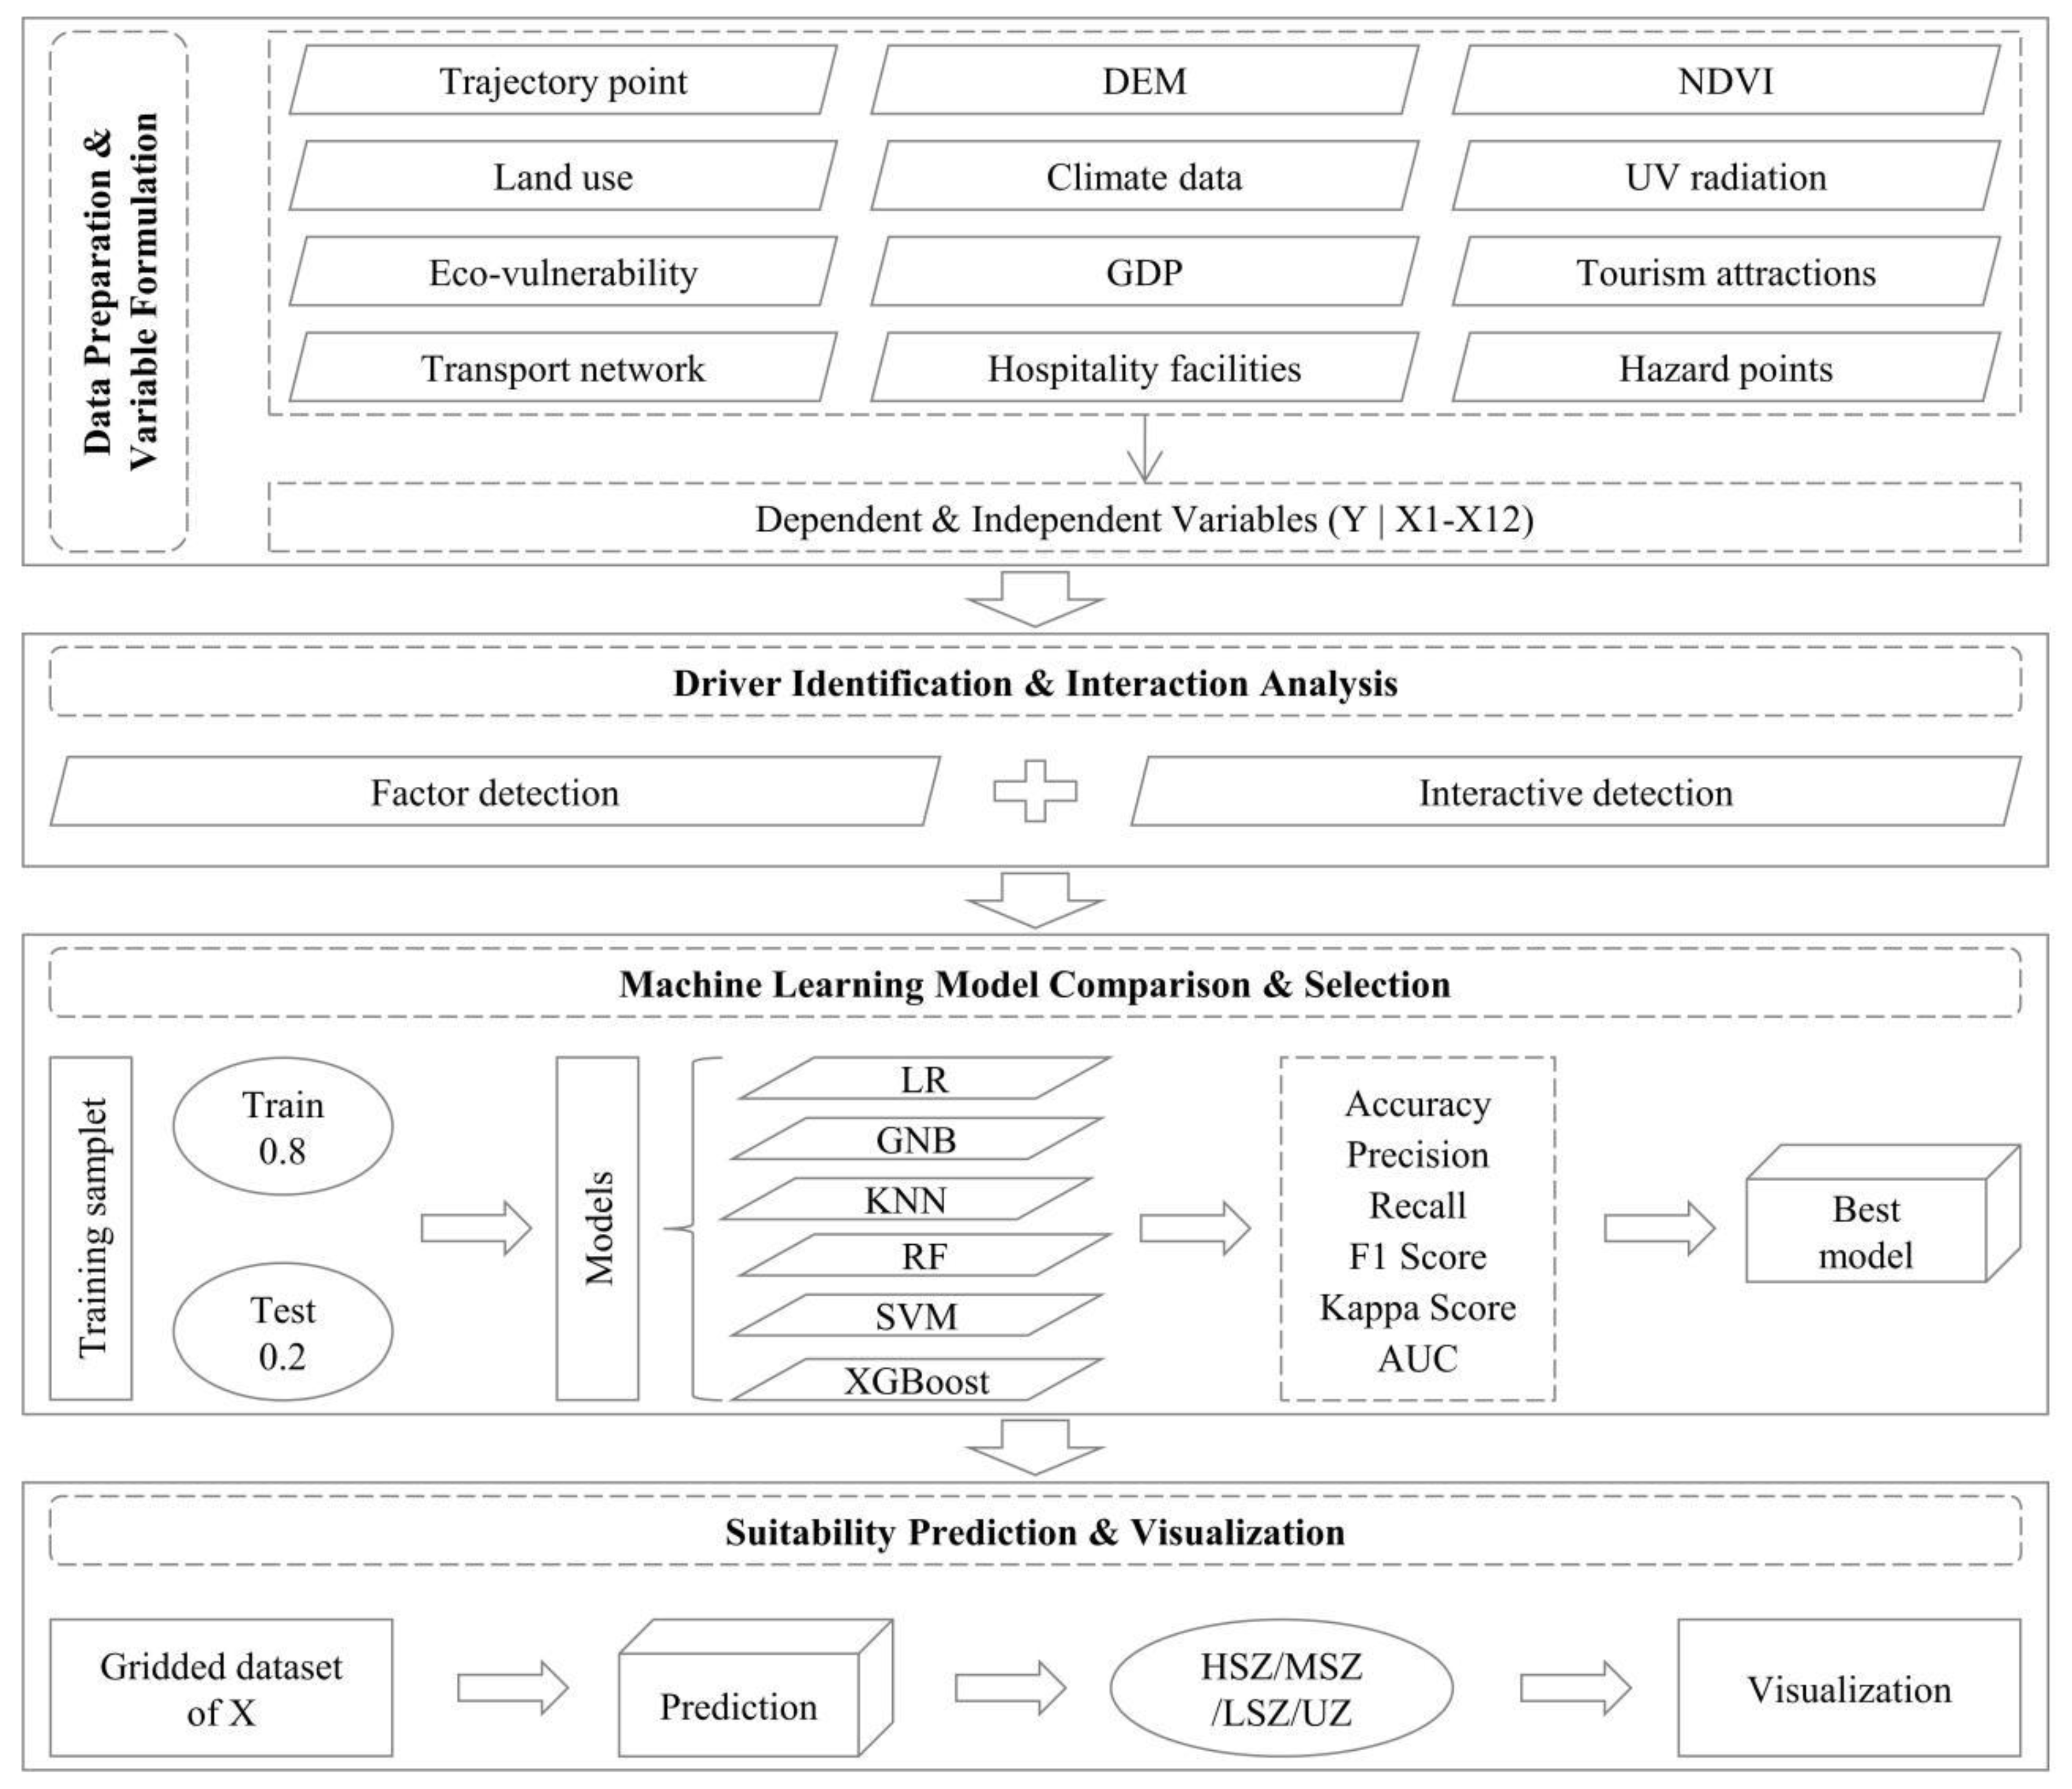
The research framework, as shown in Figure 2, consists of four steps: Data Preparation and Variable Formulation, Driver Identification and Interaction Analysis, Machine Learning Model Comparison and Selection, and Suitability Prediction and Visualization.

3.2. Selection of Variables

3.2.1. Dependent Variable

To quantify tourism suitability, an objective, demand-driven proxy—the dependent variable (Y)—was formulated based on a massive dataset of high-precision tourist GPS trajectories. The rationale for this approach is that the spatial aggregation of trajectory points empirically reflects the collective outcome of tourists’ spatial choices, which implicitly integrate the combined influence of landscape attractiveness, accessibility, and facility provision [39,40]. This data-driven metric provides a robust alternative to conventional supply-side inventories or subjective expert-based weighting schemes, grounding the suitability assessment in demonstrated human–environment interactions [41]. To operationalize this proxy, the study area was partitioned into a 10 × 10 km grid, a resolution selected as appropriate for the vast geographical extent of the QTP. The value of the dependent variable for each grid cell was subsequently derived by calculating the density of tourist trajectory points within its boundaries, yielding a direct and quantitative measure of tourism activity suitability.

3.2.2. Independent Variables

The selection of independent variables (X) is a critical step in delineating the multifaceted drivers that govern the spatial distribution of tourism. The methodological approach is grounded in established tourism suitability research, particularly within the domain of GIS-based Multi-Criteria Evaluation (GIS-MCE) [13,15]. This body of literature has consistently affirmed the utility of employing multidimensional indicator systems to model tourism suitability across diverse geographical contexts [16,21]. Typically, these frameworks integrate variables from three core dimensions: (1) the intrinsic attractiveness of tourism resources [28,29]; (2) the opportunities and constraints imposed by the natural geographical environment [23,34]; and (3) the functional significance of supporting infrastructure and socioeconomic conditions [6,24].
Drawing from this established paradigm, which synthesizes supply-side endowments with demand-enabling factors, an analytical framework was constructed for the specific context of the QTP. This framework guided the selection of twelve independent variables, systematically structured across the three core dimensions [1,22] (Table 2). The attribute data for each variable were subsequently extracted and aggregated to a unified 10 × 10 km grid. Finally, to ensure the statistical robustness of the subsequent modeling and to mitigate potential multicollinearity, a Variance Inflation Factor (VIF) analysis was performed.

3.3. Geo-Detector

The Geo-detector, a spatial statistical method, was employed to measure spatial stratified heterogeneity and reveal the driving forces behind the geographical phenomenon [42]. The core principle of this model is the assumption that if an independent variable (X) has a significant influence on a dependent variable (Y), their spatial distributions will exhibit a high degree of similarity [43]. The model quantifies this influence using the q-statistic, where a higher value (ranging from 0 to 1) indicates a stronger explanatory power of X over Y [42]. The Geo-detector method was selected for two primary reasons: (1) its ability to handle both numerical and categorical data, making it robust for diverse geographical datasets [44] and (2) its unique “interaction detector” function, which can assess whether the combined effect of two factors is enhanced or weakened and can specifically identify non-linear enhancement effects—a capability absent in traditional regression models [45].
In this study, the Geo-detector was implemented using the “GD” package in R [46]. Initially, it was used to screen the 12 independent variables; the q-statistic and its significance level were employed to identify the dominant factors driving the spatial distribution of tourism suitability on the QTP. Subsequently, the interaction detector was applied to all significant factor pairs to diagnose the nature and strength of their combined effects, thereby revealing the complex synergistic mechanisms that shape the formation of suitable tourism zones.

3.4. Model Building and Training

3.4.1. Principle and Applicability of Machine Learning

A supervised machine learning approach was adopted to predict tourism activity suitability across the entire study area. The fundamental principle involves training a model on a dataset where both the input features (the influencing factors, X) and the corresponding output classes (the suitability levels, Y) are known [47]. The algorithm identifies the underlying complex patterns and relationships from this training data to create a robust predictive function [18].
This data-driven paradigm offers significant advantages over traditional evaluation methods. First, it replaces subjective expert-based weighting with an objective learning process derived from empirical data (i.e., tourist trajectories), thereby enhancing the scientific validity and replicability of the results [47]. Second, machine learning models are particularly effective at capturing the complex, non-linear interactions between multiple influencing factors, which are often oversimplified by the linear assumptions of conventional weighted overlay analyses [48]. Consequently, this approach is particularly suitable for generating a spatially explicit prediction map, providing a validated and highly accurate tool for spatial planning [49].

3.4.2. Implementation

To ensure the selection of the most effective model for this specific geographical context, a comparative analysis of six mainstream machine learning algorithms was conducted: Logistic Regression (LR), Gaussian Naive Bayes (GNB), K-Nearest Neighbors (KNNs), Random Forest (RF), Support Vector Machine (SVM), and Gradient Boosting (XGBoost) [50].
(1)
Dataset Construction: Based on the number of trajectory points per grid, the dependent variable (Y) was classified into four levels using the quantile method: 0—Unsuitable Zone, 1—Low-Suitability Zone, 2—Medium-Suitability Zone, and 3—High-Suitability Zone [51]. These levels served as the classification labels for the models. The dataset was then randomly partitioned into a training set (80%) for model learning and a test set (20%) for performance evaluation.
(2)
Model Training and Evaluation: The model training and evaluation process was conducted within the Python 3.12 programming environment, primarily utilizing the scikit-learn library. To establish a standardized baseline for performance comparison, all six algorithms were trained using their default parameter settings. To identify the optimal algorithm, their performance on the unseen test set was rigorously evaluated using a comprehensive suite of metrics: Accuracy, Precision, Recall, F1 Score, Kappa Score, and the Area Under the Receiver Operating Characteristic Curve (AUC) [52].
(3)
Prediction and Mapping: The best-performing model from the evaluation phase was subsequently applied to the gridded dataset covering the entire QTP. The model predicted a suitability class for each grid cell, and the results were then visualized as a comprehensive tourism activity suitability map using ArcGIS 10.8.

4. Results

4.1. Analysis of Influencing Factors

The results of the multicollinearity test (Table 3) confirmed the absence of significant collinearity among the selected variables [53]. All Variance Inflation Factor (VIF) values were well below the conventional threshold of 10, with the Ecological Vulnerability Index (X3) registering the highest value at 1.052. This finding indicates that all selected factors were suitable for the subsequent Geo-detector analysis.
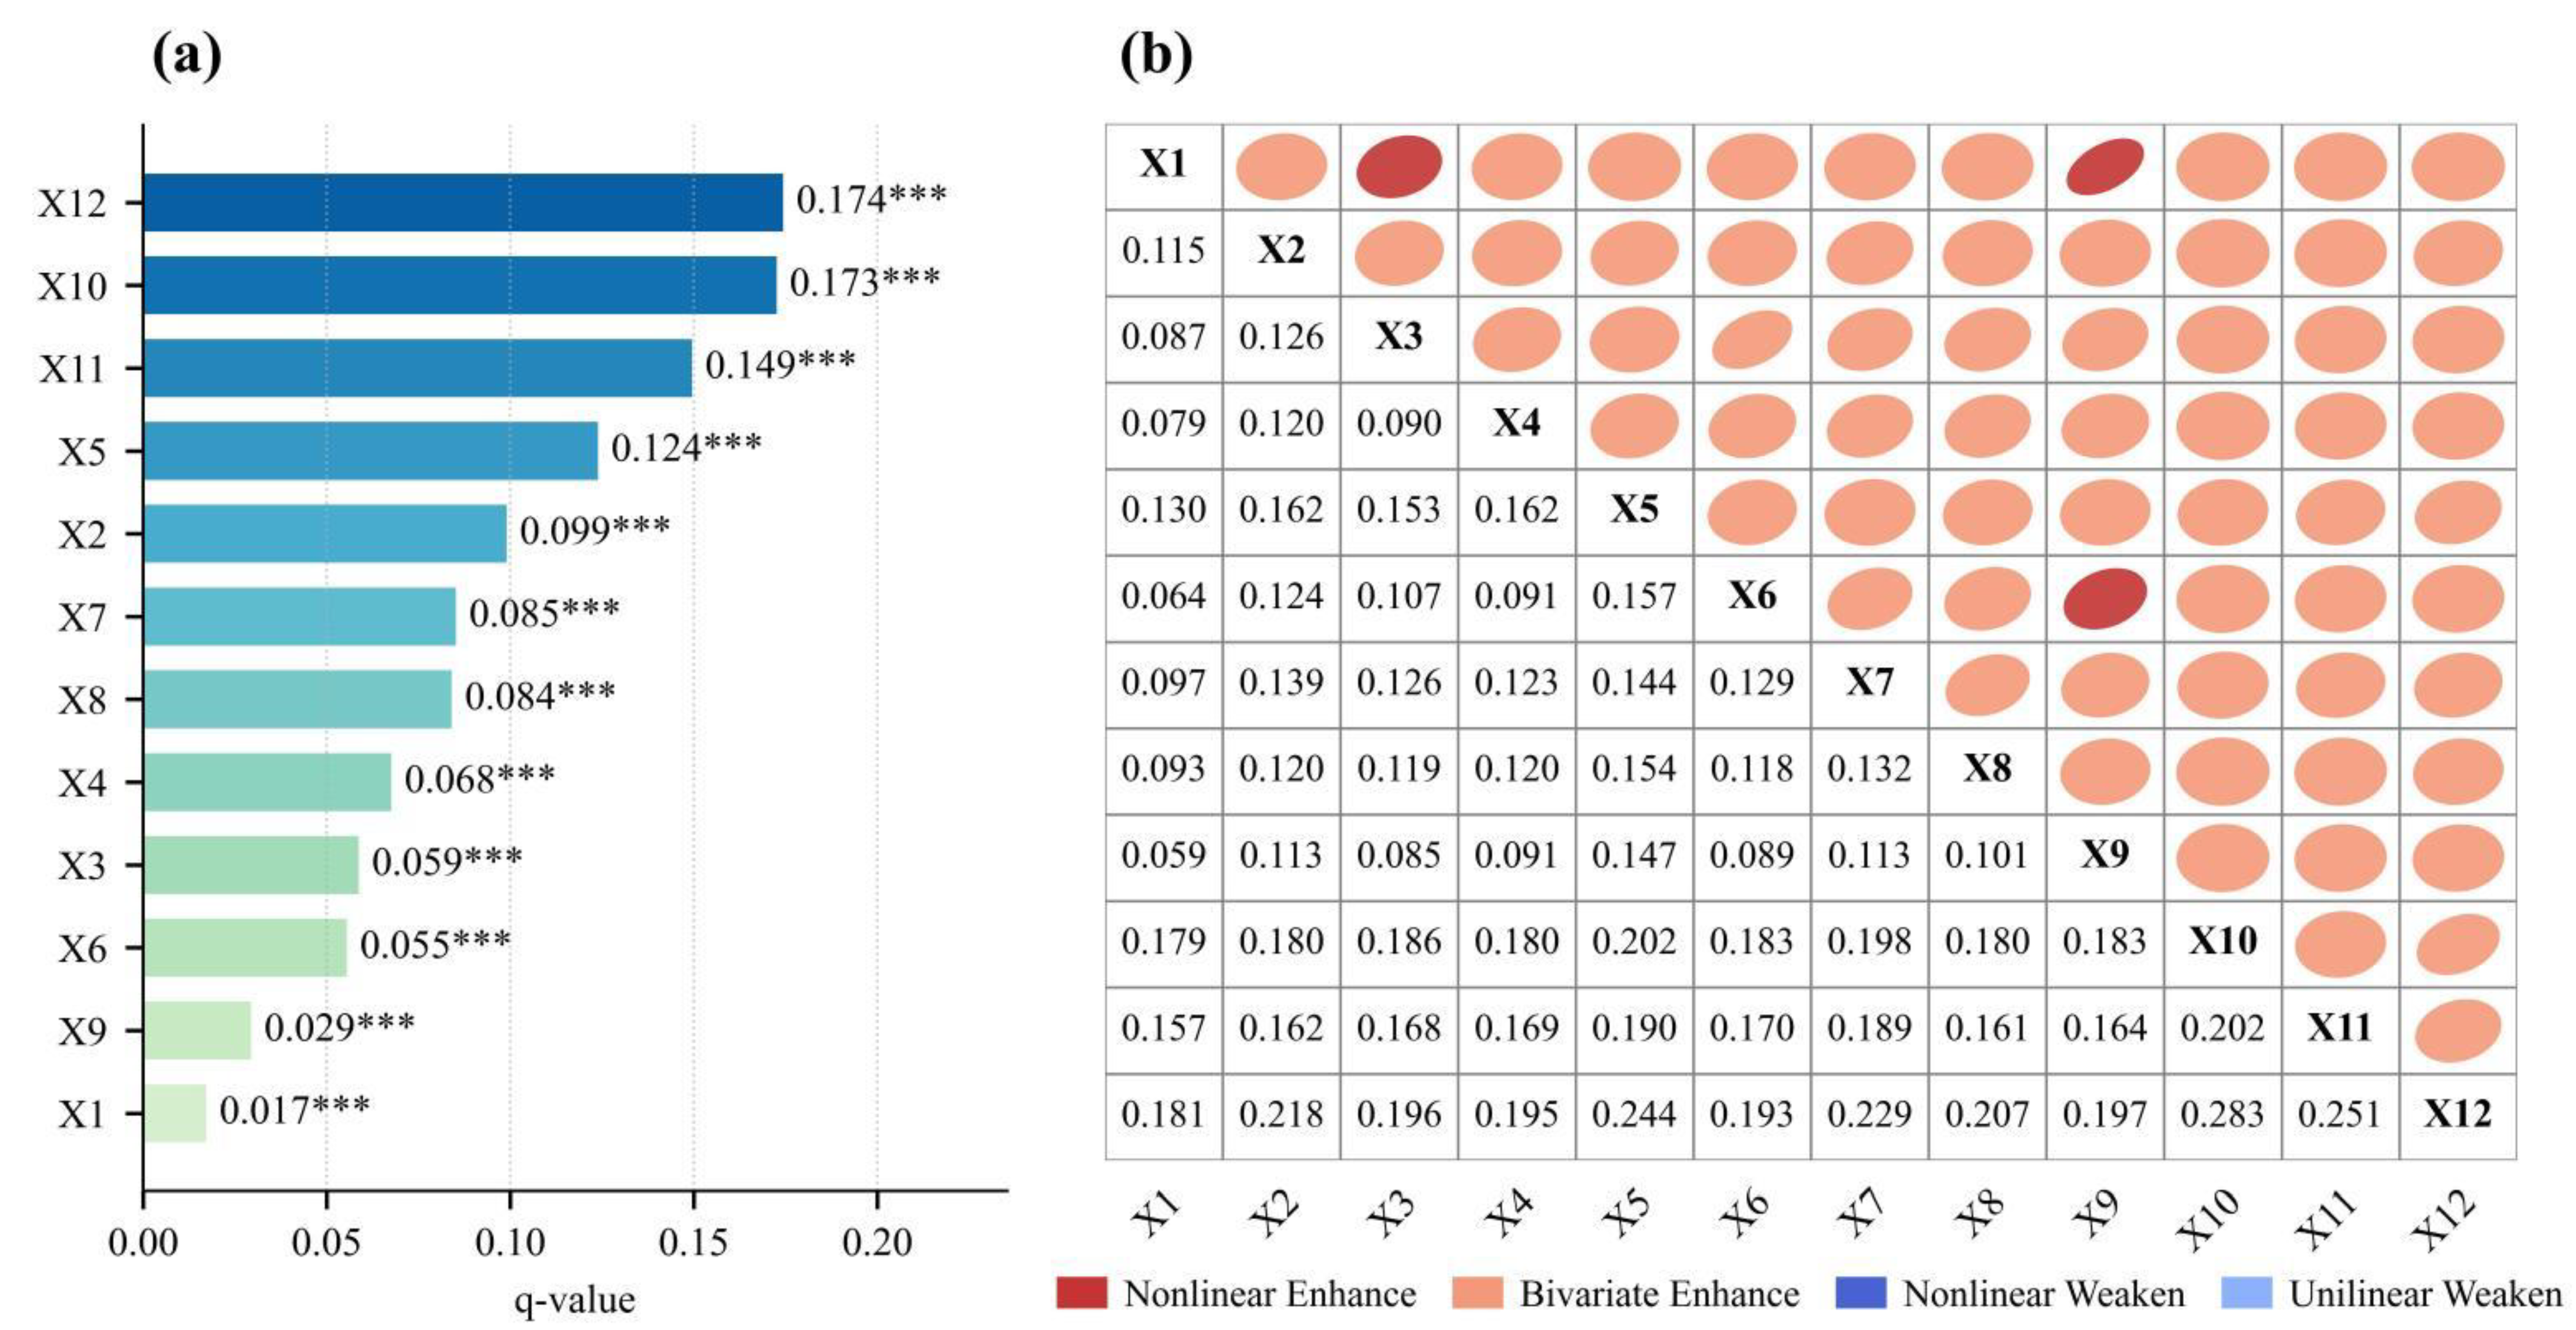
The Geo-detector analysis quantified the explanatory power of each factor on the spatial distribution of tourism activities (Figure 3a). Factors categorized under “Supporting and guaranteeing conditions” were identified as the dominant drivers. Specifically, Distance to Main Roads (X12), Hospitality Facility Density (X10), and Distance to Urban Centers (X11) exhibited the highest explanatory power, with q-values of 0.174, 0.173, and 0.149, respectively. Subsequently, factors associated with the “natural geographical environment” also demonstrated considerable explanatory power. The Temperature–Humidity Index (X5) (q = 0.124), Scenic Spot Density (X2) (q = 0.099), Altitude (X7) (q = 0.085), and Hazard Point Density (X8) (q = 0.084) were identified as key determinants. While factors such as the Vegetation Coverage Index (X4) and GDP (X9) had a comparatively weaker direct influence, their contributions were also statistically significant.
The analysis of factor interactions (Figure 3b) revealed synergistic effects between all pairs of variables. All interactions were found to produce either bivariate or non-linear enhancement, indicating that the combined explanatory power of any two-factor pair was greater than the effect of each factor individually. The interaction between Hospitality Facility Density (X10) and Distance to Main Roads (X12) yielded the strongest synergistic effect, with an interaction q-value of 0.283. This value is markedly higher than their individual explanatory powers (q = 0.173 and q = 0.174, respectively). Similarly, the interaction between the Temperature–Humidity Index (X5) and Distance to Main Roads (X12) yielded a notable interaction q-value of 0.244, demonstrating a significant combined effect of climate comfort and accessibility on tourism suitability.

4.2. Model Performance Evaluation

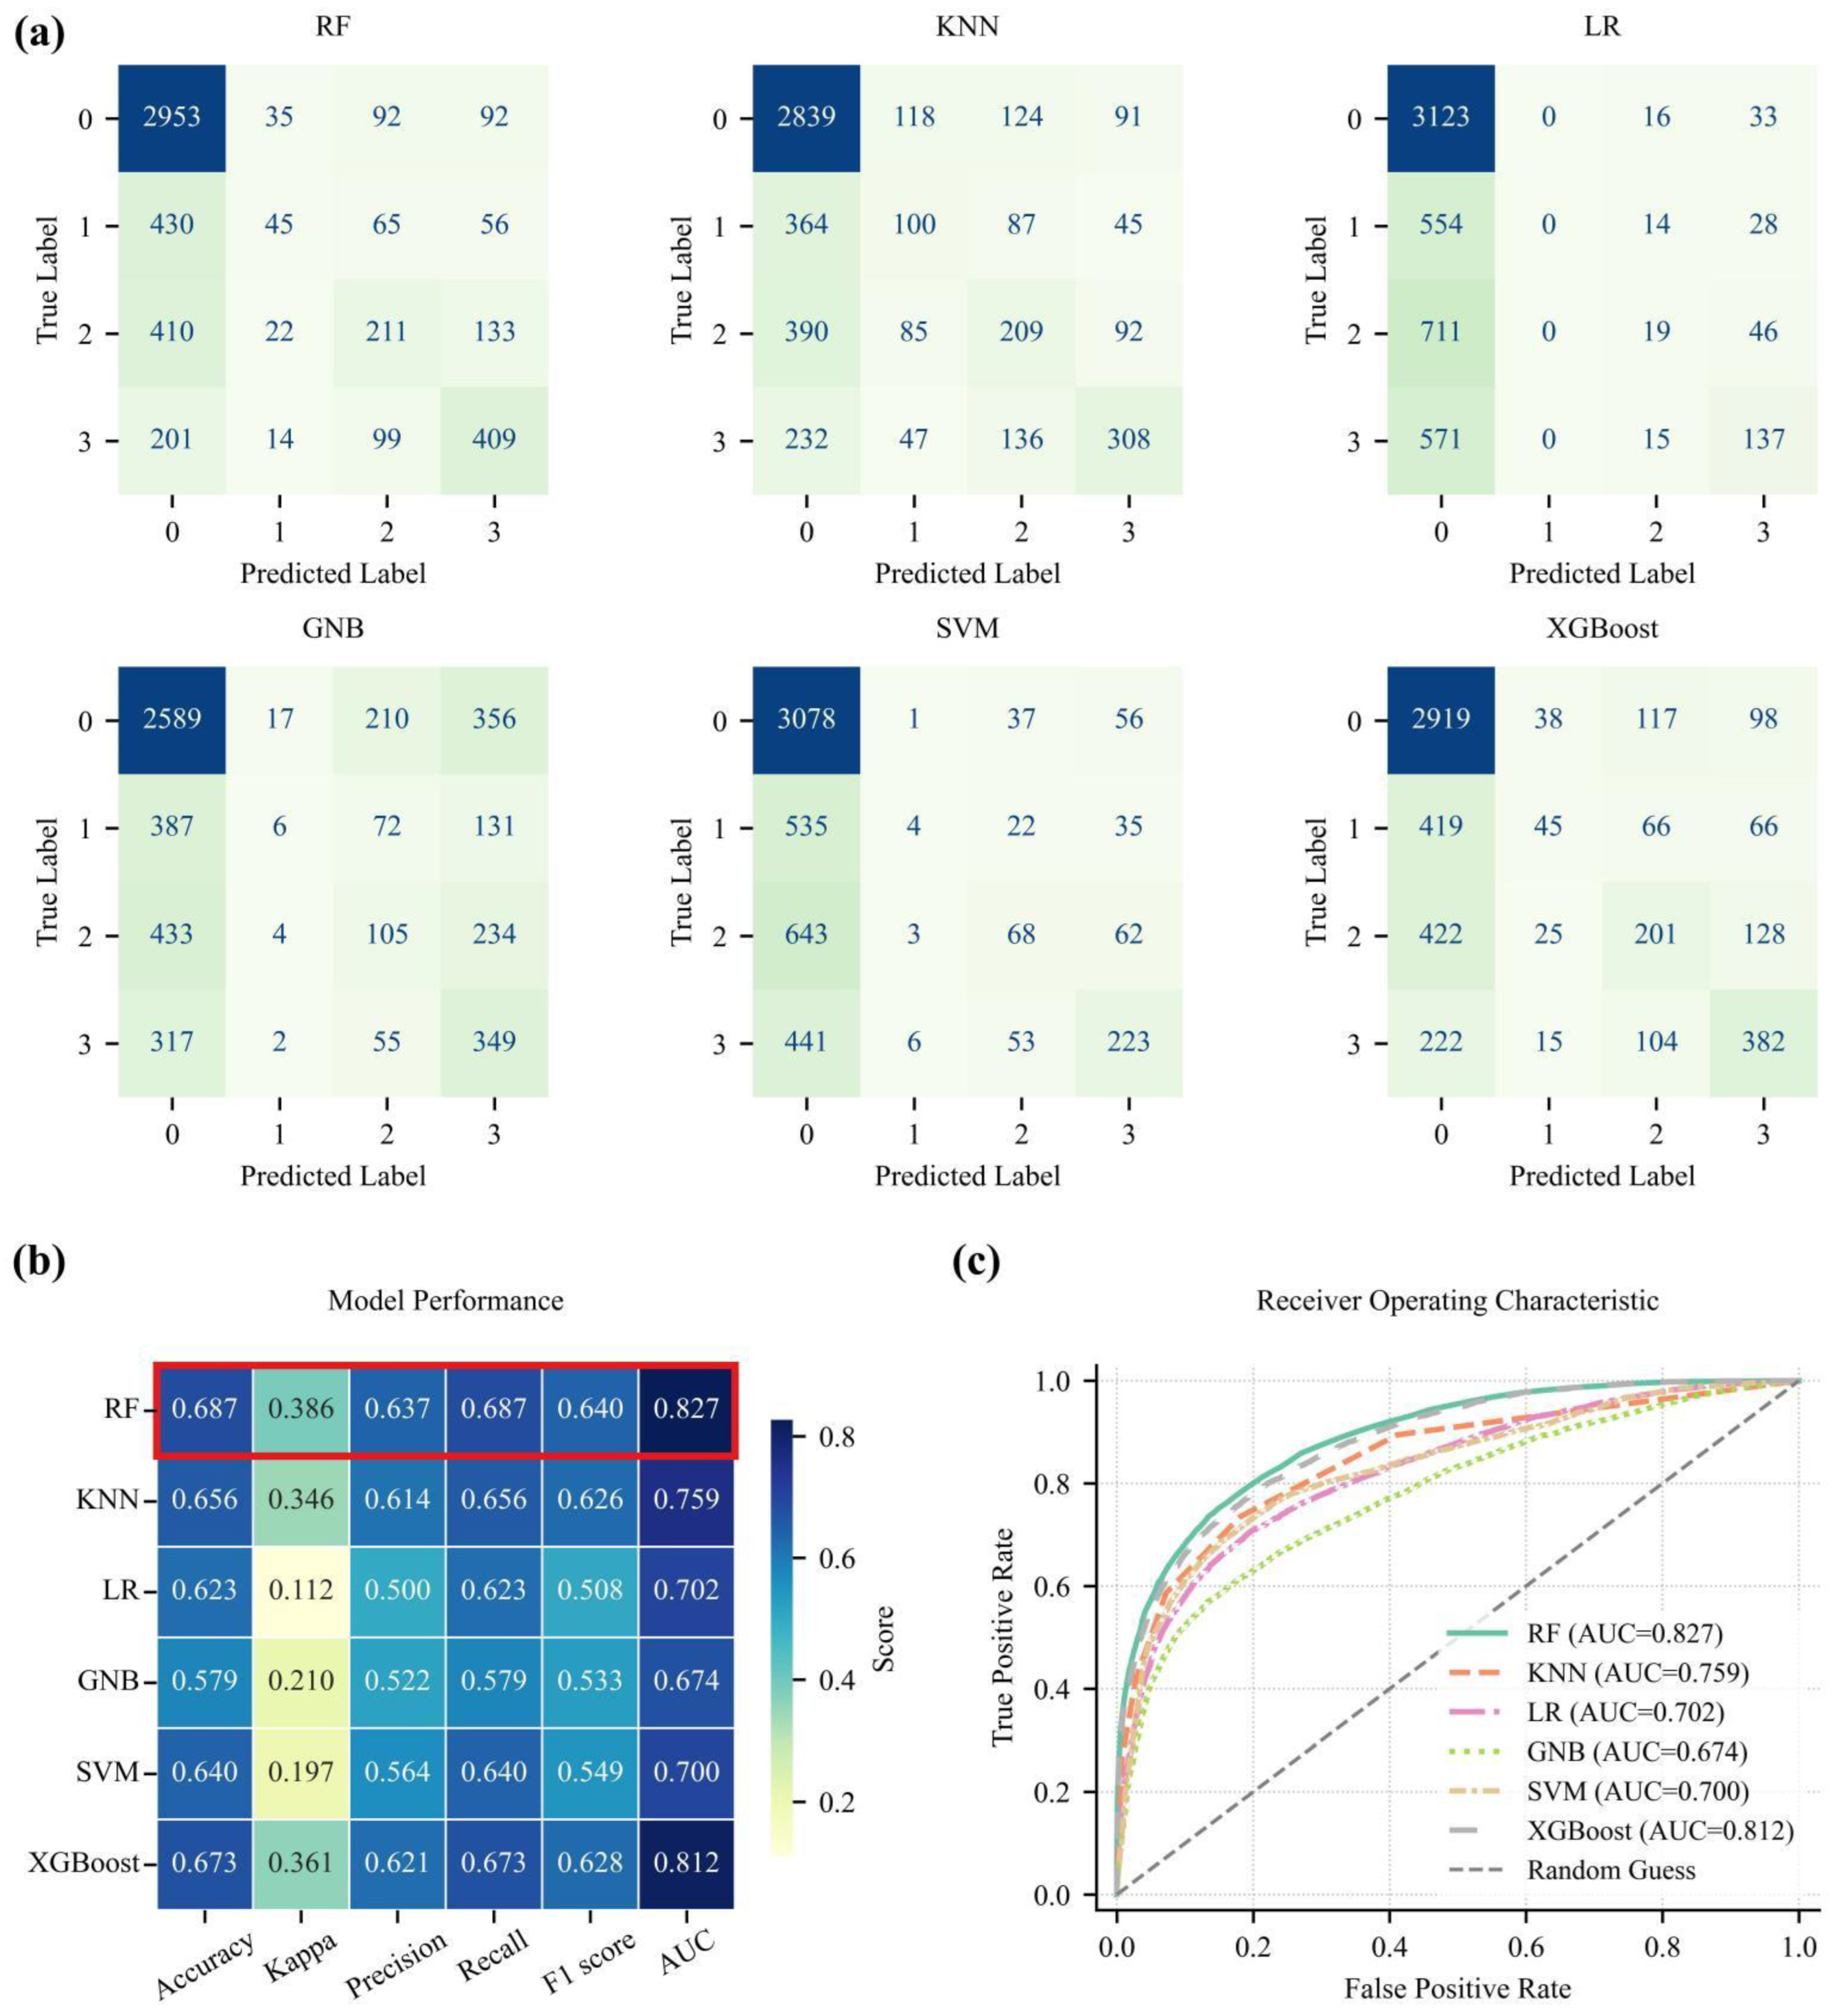
The performance of six mainstream machine learning algorithms was evaluated to identify the optimal model for predicting tourism activity suitability (Figure 4). Based on a comprehensive assessment of key metrics, including Accuracy, Kappa, and the Area Under the Curve (AUC), the Random Forest (RF) model was identified as the superior-performing algorithm (Figure 4b).
Specifically, the RF model outperformed all other algorithms across the primary evaluation metrics. It achieved an AUC value of 0.827, the only model to surpass the 0.82 threshold (Figure 4c). Furthermore, its accuracy (0.687), Kappa coefficient (0.386), and F1 score (0.640) were consistently higher than those of the other models. These results indicate that the RF model possesses high prediction accuracy and demonstrates superior robustness and generalization ability, particularly when applied to imbalanced datasets, which is characteristic of the spatially varied suitability zones in this study.
The Gradient Boosting (XGBoost) model delivered competitive performance, ranking second with an AUC of 0.812. In contrast, the Logistic Regression (LR) and Support Vector Machine (SVM) models exhibited lower performance, yielding AUC values of 0.702 and 0.700, respectively, along with low Kappa coefficients. This suggests a limited capacity of these models to capture complex, non-linear geographical patterns. The confusion matrices (Figure 4a) further illustrate these performance differences, showing that the RF model achieved substantially higher predictive accuracy for both High-Suitability (Class 3) and Medium-Suitability (Class 2) zones compared to the other algorithms.
Therefore, based on a comprehensive evaluation of prediction accuracy, stability, and overall performance, the Random Forest (RF) model was selected as the optimal algorithm for mapping tourism activity suitability zones across the entire Qinghai–Tibet Plateau.

4.3. Analysis of Tourism Activity Suitability Zones

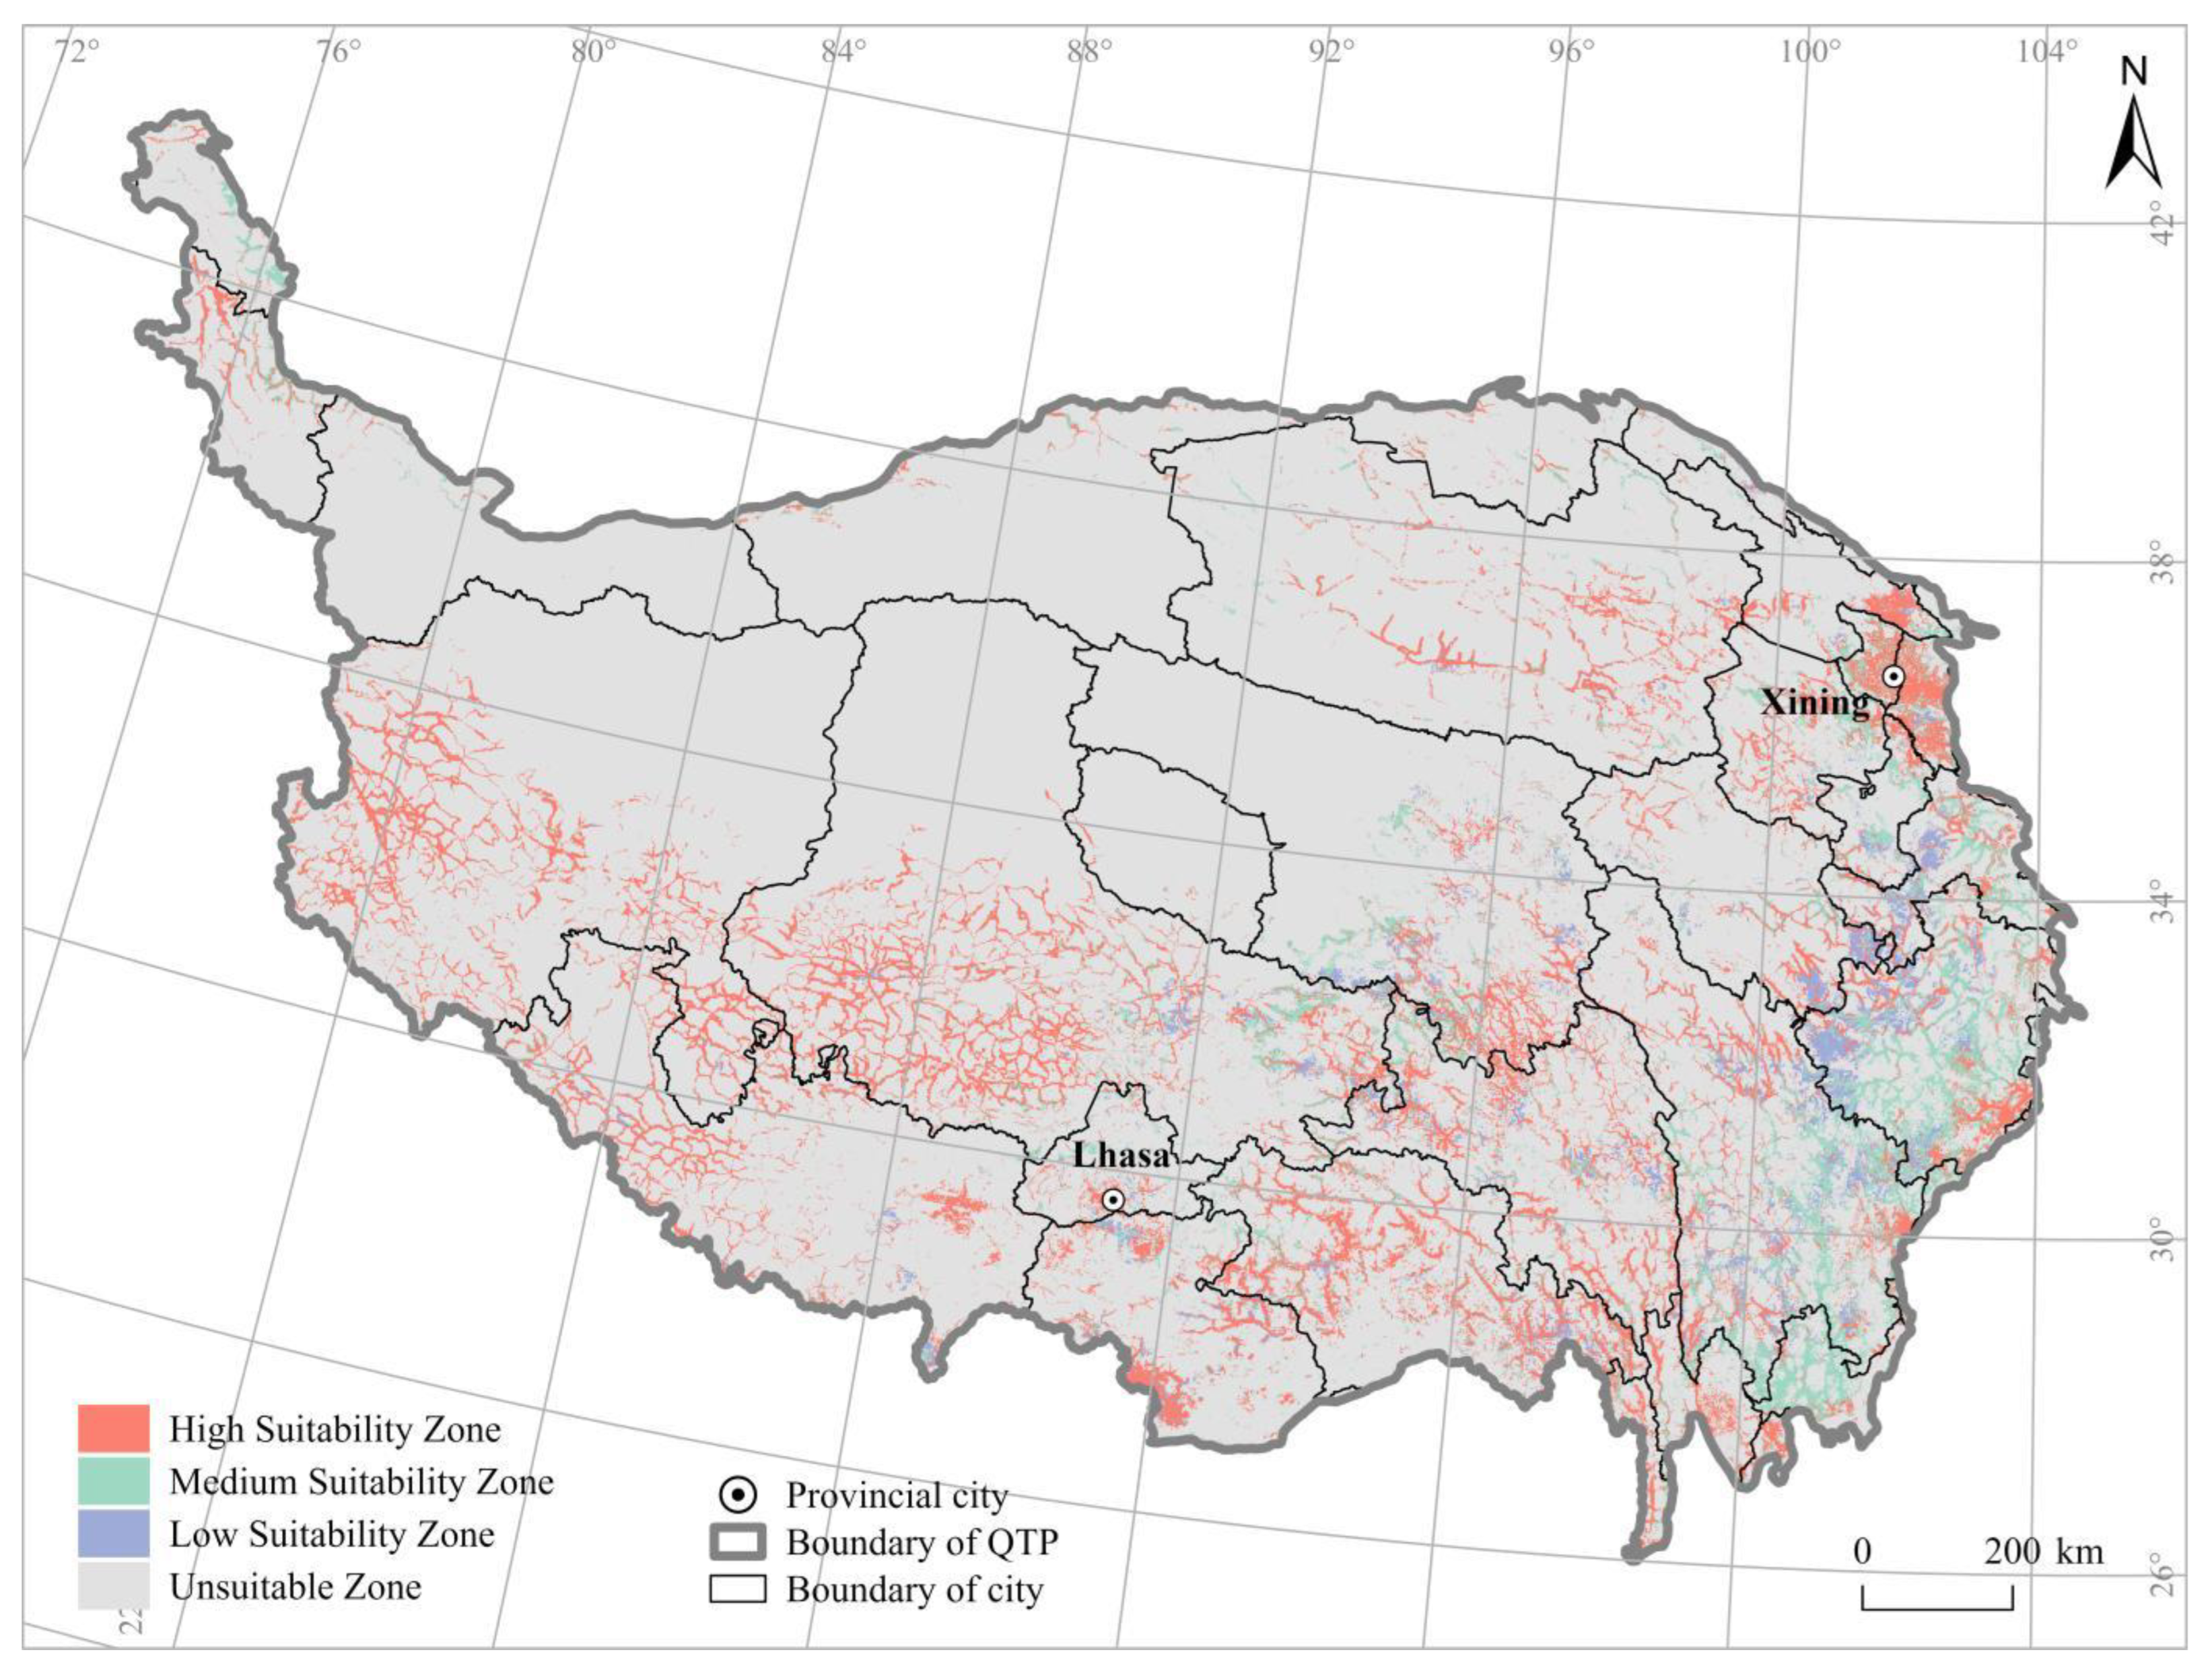
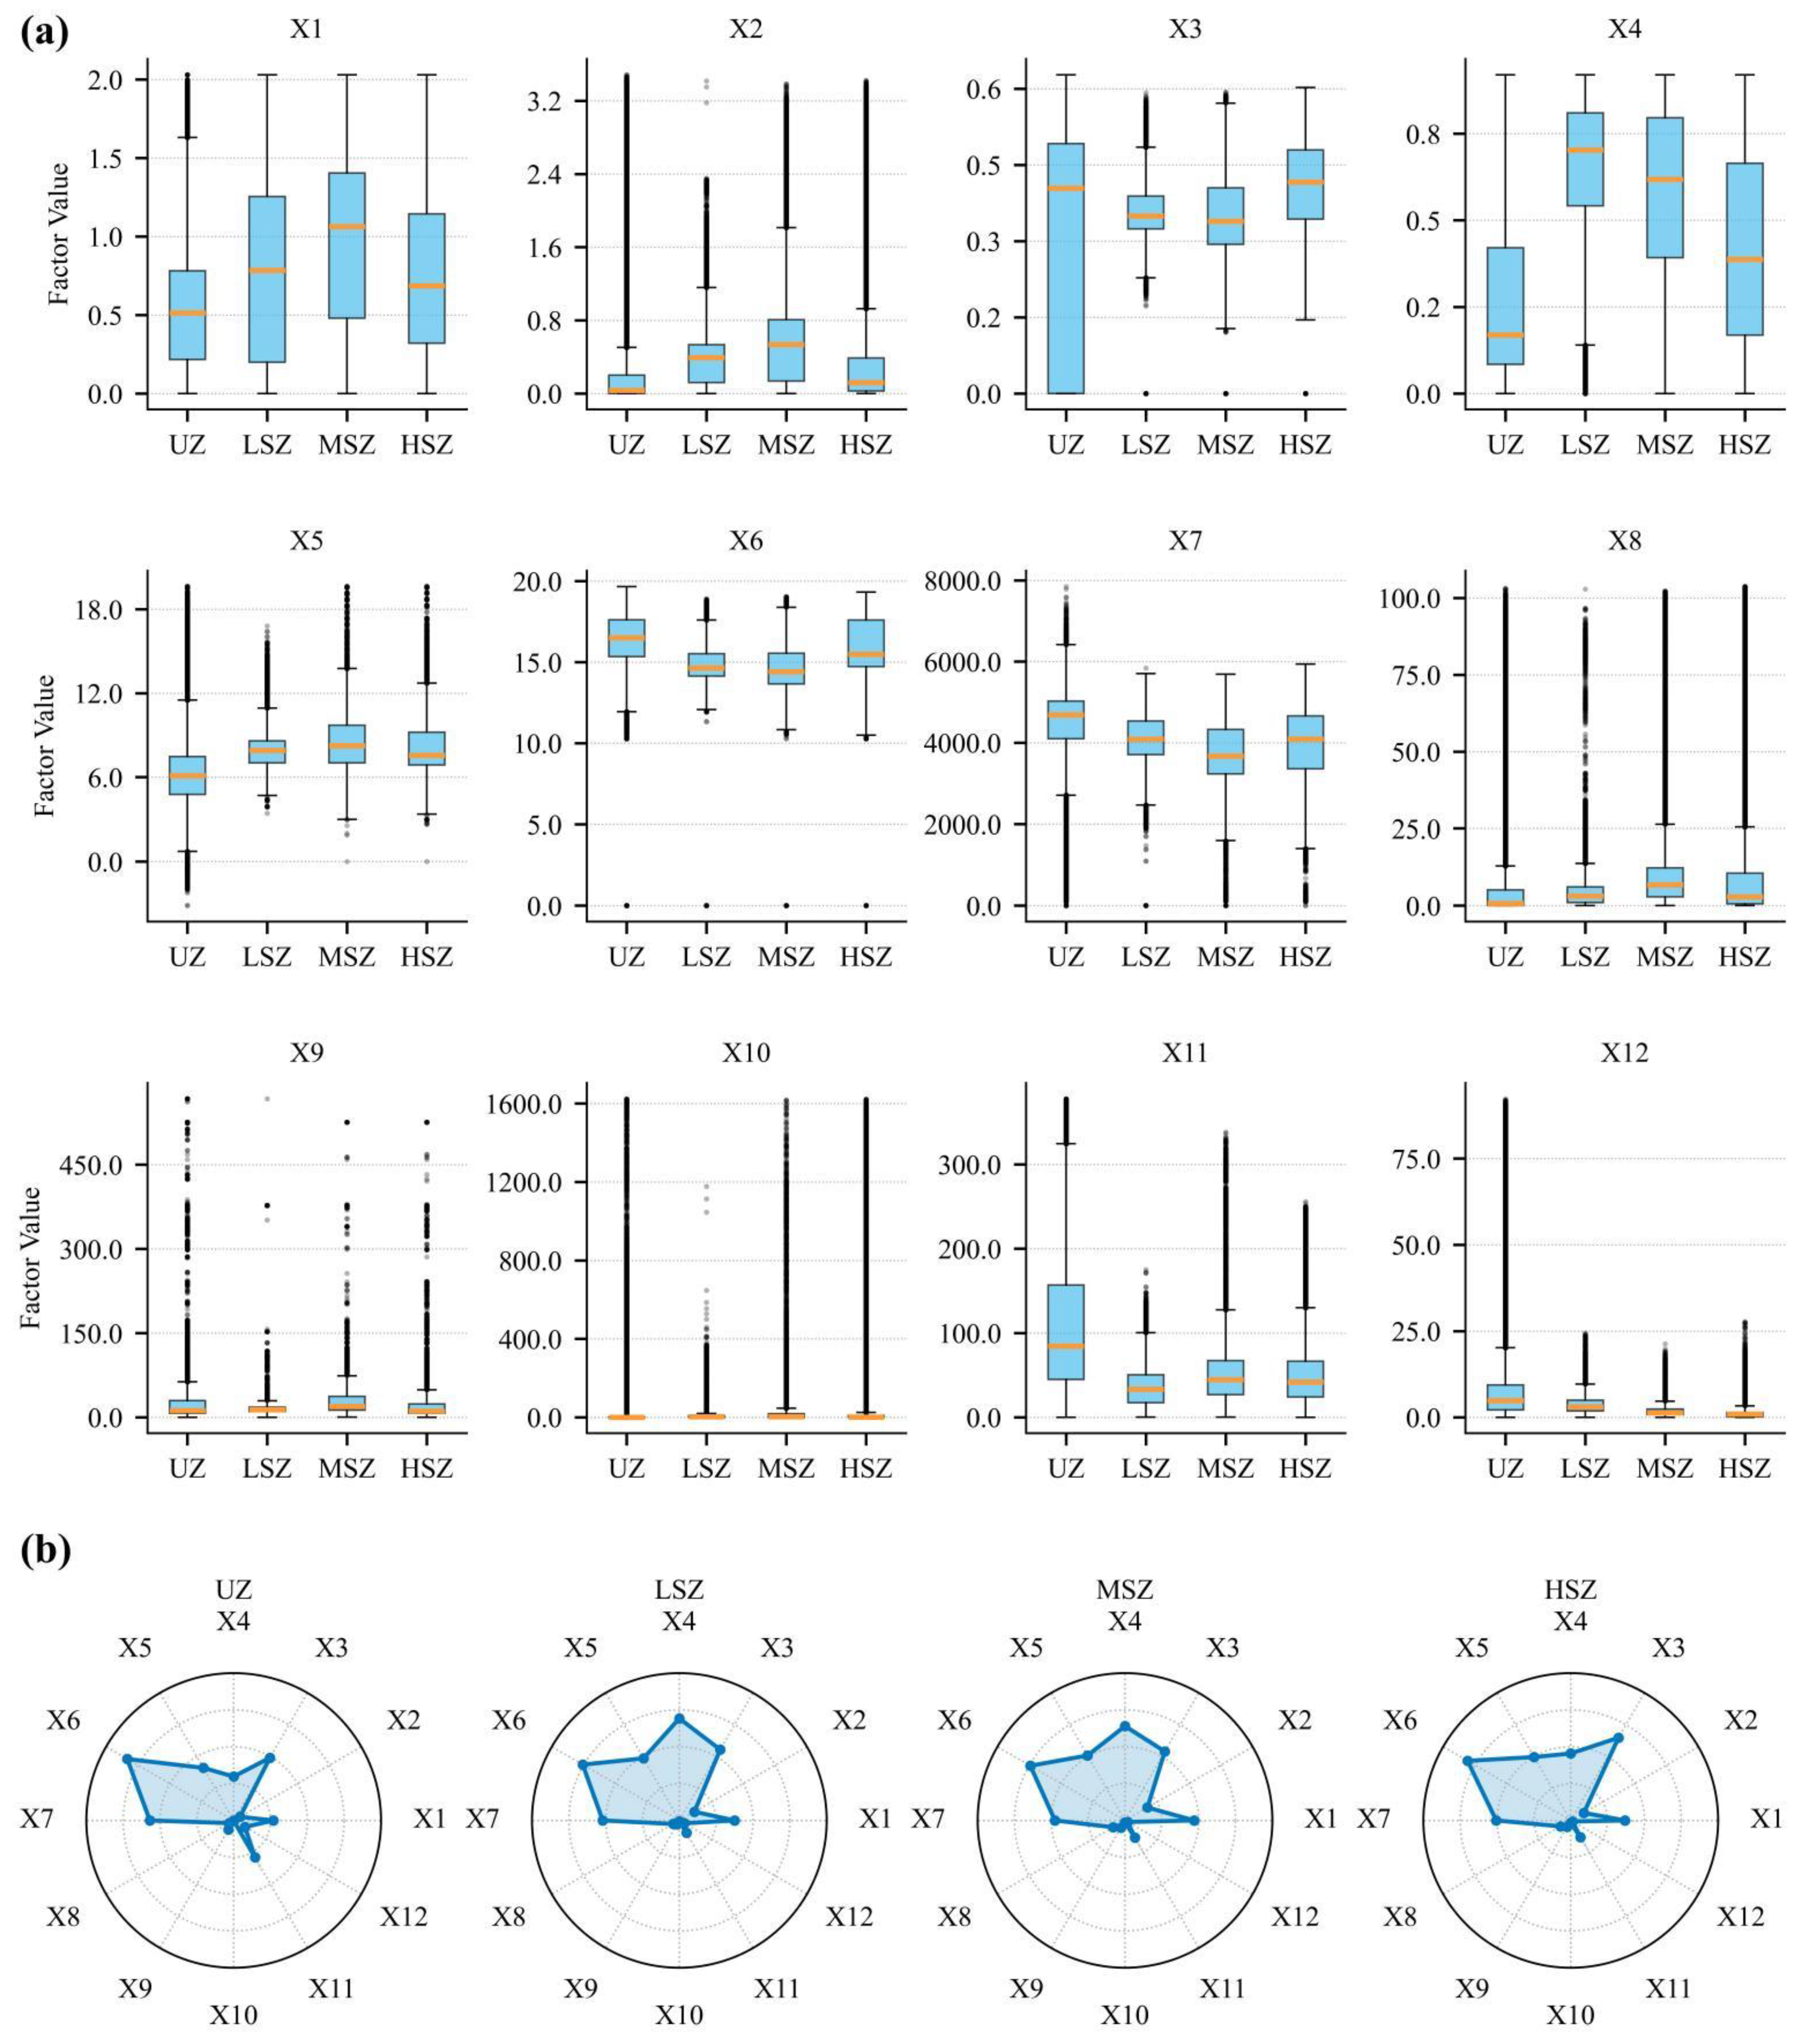
The spatial distribution of tourism activity suitability zones, as predicted by the Random Forest model, exhibits significant differentiation and agglomeration across the QTP (Figure 5). The QTP is dominated by Unsuitable Zones (UZs), which account for 85.25% of the total area. In contrast, High-Suitability Zones (HSZs), Medium-Suitability Zones (MSZs), and Low-Suitability Zones (LSZs) constitute smaller proportions of the area, at 9.00%, 3.89%, and 1.87%, respectively (Table 4). These suitable zones are not uniformly distributed; instead, they are highly concentrated in the southeastern river valley regions. This distribution forms a distinct agglomeration pattern, characterized by high-density cores centered around major cities (e.g., Lhasa, Xining, Nyingchi) with linear extensions along primary transportation arteries (Figure 6). The statistical profiles of the different suitability zones, illustrated in Figure 7, highlight their distinct factor characteristics.
High-Suitability Zones (HSZs) are characterized by the most favorable combination of influencing factors. These areas exhibit the highest values for the Landscape Diversity Index (X1), Scenic Spot Density (X2), Vegetation Coverage Index (X4), GDP (X9), and Hospitality Facility Density (X10). Concurrently, these zones possess the lowest values for factors that constrain tourism, including Altitude (X7), UV Radiation (X6), and Hazard Point Density (X8). In terms of supporting conditions, the HSZ demonstrate the shortest mean distances to urban centers (X11) and main roads (X12). The areas surrounding Lhasa, Nyingchi, and Xining serve as typical examples of this zone type (Figure 6).
Medium- (MSZ) and Low-Suitability Zones (LSZ) represent transitional areas within the suitability gradient. The indicator profiles for these zones fall between those of the high-suitability and unsuitable zones. While often possessing certain favorable natural or cultural resources, they are constrained by one osr more limiting factors, such as lower accessibility or less developed service facilities. Spatially, these zones are primarily located on the periphery of HSZ or along key transport corridors, such as National Highways G318 and G214.
Unsuitable Zones (UZs) encompass the vast inland and high-altitude regions of the QTP, including the Changtang Plateau and Hoh Xil. The factor profile for these zones is inverse to that of the HSZ. They are characterized by the highest values for adverse factors, such as the Ecological Vulnerability Index (X3), Altitude (X7), and UV Radiation (X6), while simultaneously exhibiting the lowest values for landscape diversity, vegetation cover, GDP, and facility density.

5. Discussion

5.1. Effectiveness and Superiority of the Research Method

The methodological framework employed in this research offers a substantial advancement in the assessment of tourism suitability, addressing known limitations of conventional approaches. Traditional assessments have predominantly relied on Multi-Criteria Decision Analysis (MCDA), often utilizing the Analytic Hierarchy Process (AHP) for factor weighting [15,17]. Such methods, while structured, are inherently limited by their dependence on expert opinion, which can introduce subjectivity and compromise the replicability of findings across different contexts [14,16]. This subjectivity presents a particular challenge in a region as environmentally and culturally distinct as the Qinghai–Tibet Plateau (QTP), where generalized assumptions may fail to capture unique local dynamics [7,8].
By leveraging a massive dataset of tourist GPS trajectories, this study’s approach moves the basis of assessment from subjective, expert-led weighting to the objective analysis of demonstrated tourist activity patterns [38,39]. The resulting suitability map is not a theoretical construct based on expert assumptions but an empirical representation of the collective spatial choices made by thousands of tourists [28,41]. This data-driven approach aligns with the growing consensus that analyzing passively collected mobility data is critical for understanding the reality of human–environment interactions in tourism systems [37,40].
The analytical power of the framework is further consolidated by its constituent statistical and machine learning models. The Geo-detector model is specifically designed for geographical inquiry, enabling the quantification of spatial stratified heterogeneity and, critically, the detection of non-linear interactions between variables—a capacity absent in most conventional regression techniques [30,31,42]. Concurrently, the Random Forest algorithm provides a highly accurate predictive engine renowned for its robustness in handling high-dimensional and non-linear data without being compromised by multicollinearity [48,52]. The integration of these advanced computational tools provides a transparent, replicable, and scientifically rigorous paradigm for spatial planning, directly addressing the call for more evidence-based approaches in sustainable destination management [18].

5.2. The Primacy of Infrastructure over Resource Endowment

A central finding from the analysis is the decisive role of “supporting and guaranteeing conditions,” specifically transport accessibility and service facility provision, in determining tourism suitability on the QTP [54]. The explanatory power of this infrastructure far surpasses that of intrinsic “tourism resource endowment,” a result that challenges the resource-centric models that have historically dominated tourism theory [55]. These models posit that unique attractions are the primary impetus for tourism development; however, the findings indicate that in environments characterized by extreme physical constraints, such attractions are a necessary but insufficient condition [56]. The potential energy of a resource can only be converted into the kinetic energy of tourist flows when the friction of distance is sufficiently overcome [57].
The geographical concept of the friction of distance, representing the costs and challenges of traversing space, is exceptionally high on the QTP [58]. This friction is amplified by severe hypoxia, extreme and unpredictable weather, vast distances between settlements, and the inherent fragility of the alpine ecosystem [55]. These conditions impose significant physiological, logistical, and safety-related costs on any form of travel [56]. In this context, modern infrastructure does not merely enhance convenience; it functions as a life-sustaining system that makes tourism feasible [54]. This conclusion resonates with studies from other remote mountain regions where infrastructure is the primary bottleneck to development [57]. Consequently, the geography of tourism on the QTP is dictated less by the spatial distribution of its remarkable landscapes and more by the engineered corridors of human accessibility [55].

5.3. The Synergistic Coupling of Multiple Factors

The formation of highly suitable tourism zones is not attributable to any single dominant factor but is instead the outcome of a synergistic coupling of multiple advantageous conditions [7,10]. This is empirically validated by the Geo-detector interaction analysis, which consistently revealed that the combined influence of any two factors was greater than their additive individual effects [31,42]. This non-linear enhancement demonstrates that determinants of tourism suitability operate within a complex system of interdependencies [1]. For example, the potent interaction between transport accessibility and hospitality density creates a reinforcing positive feedback loop, a process described by the theory of cumulative causation [57,58]. Initial infrastructure investments improve accessibility, which attracts a nascent flow of tourists; this demand then stimulates private investment in services, enhancing the destination’s appeal and creating the conditions for further public investment [4,5].
An isolated asset, such as a scenic monastery or a unique geological feature, is unlikely to generate significant tourism in the absence of this integrated support system [25]. A location’s suitability undergoes a qualitative transformation only when a critical mass of enabling factors converges [9]. High suitability therefore emerges at the nexus of superior natural conditions, efficient transport, comprehensive service facilities, and a supportive socio-economic environment [21,22]. This finding has profound implications for policy, suggesting that successful and sustainable destination development on the QTP requires integrated, multi-sectoral planning rather than isolated, single-factor interventions [14]. The development of cohesive destination clusters or “tourism systems” is therefore a more viable strategy than attempting to promote dispersed, disconnected attractions [5,10].

5.4. The Resulting Spatial Pattern of Tourism Suitability

The mechanism of multifactor synergy produces the stark spatial pattern observed in the results: a landscape defined by intense agglomeration within a pronounced core-periphery structure [11]. This form of spatial organization is a classic outcome of development in regions where the friction of distance is high and resources are unevenly distributed [10]. Tourism functions and their benefits become highly concentrated in a few accessible “core” areas, leaving the vast majority of the territory as a peripheral region with minimal tourism activity [8]. The suitable zones effectively function as “islands of development” in an expanse of logistical and environmental unsuitability, a pattern dictated by the imperatives of access and safety [26].
This structure is vividly illustrated by the region’s primary tourism areas, whose current status is a product of long-term historical processes and strategic infrastructure investment [5]. Lhasa’s preeminence as the primary tourism hub is a clear example of path dependency, where its historical role as the region’s political and religious center made it the logical focus for foundational investments like the international airport and the Qinghai–Tibet Railway [28]. This established its non-negotiable status as the gateway and service hub. Concurrently, the G318 National Highway functions as a textbook development corridor, creating a linear zone of suitability that fosters tourism all along its route by providing a continuous supply of access and services [29]. In stark contrast, the Changtang Plateau, despite its immense ecological significance and aesthetic value, remains almost entirely unsuitable due to its extreme inaccessibility, confirming that on the QTP, infrastructure is not merely a contributing factor but the ultimate arbiter of tourism suitability [28].

6. Conclusions

This study proposed and validated an analytical framework integrating tourist trajectory big data, a Geo-detector model, and a Random Forest algorithm to objectively identify tourism suitability zones and reveal their formation mechanisms on the QTP. This data-driven paradigm overcomes the inherent subjectivity of traditional evaluation methods, offering a more precise, replicable, and scientifically grounded approach to sustainable tourism planning in environmentally sensitive regions. The primary conclusions drawn from this research are as follows.
First, this research redefines the primary determinants of tourism activity in extreme environments, demonstrating that infrastructure and supporting services have primacy over natural resource endowment. The findings indicate that transport accessibility and the availability of hospitality facilities are not merely contributing variables but are the fundamental prerequisites for tourism development on the QTP. In this context, infrastructure is the decisive factor for tourism feasibility, overcoming the region’s high friction of distance. This conclusion challenges conventional resource-centric tourism theories and underscores that even world-class natural attractions remain as latent potentials without essential transportation and service infrastructure.
Second, the formation of highly suitable tourism zones is not attributable to a single dominant factor but is the outcome of the synergistic coupling of multiple interdependent conditions. The Geo-detector analysis revealed that the combined explanatory power of any two factors significantly exceeds their individual effects. High suitability emerges only at the nexus where favorable natural conditions, efficient transportation, comprehensive service facilities, and a supportive socio-economic environment converge. This non-linear enhancement mechanism explains the distinct spatial agglomeration of tourism activity, where isolated assets are insufficient to generate significant tourist flows in the absence of an integrated support system.
Third, the resultant spatial pattern of tourism suitability on the QTP is characterized by a pronounced core-periphery structure, with suitable zones forming highly localized clusters surrounded by vast unsuitable areas. Over 85% of the QTP is unsuitable for tourism, while highly suitable zones are intensely concentrated in the southeastern river valleys, forming a pattern of high concentration around major urban centers with linear extensions along primary transport arteries. This spatial organization is a direct consequence of synergistic mechanisms and the path dependency of historical and strategic infrastructure investments, creating a spatial pattern primarily shaped by the requirements of access and safety.
These findings, in turn, offer critical insights for the formulation of sustainable tourism development policies on the QTP. Policymakers should transition from isolated, resource-focused planning to integrated, multi-sectoral strategies that prioritize the development of cohesive tourism systems [8,14]. A spatially differentiated management approach is required: for High-Suitability Zones (HSZs), the focus should shift from scale expansion to quality enhancement and carrying capacity management [6,29]; for Medium- and Low-Suitability Zones (MSZs/LSZs), selective and eco-friendly infrastructure development can strategically integrate them into the regional network [24,57]; and for the vast Unsuitable Zones (UZs), conservation must be the priority, with strict legislative measures to preserve the region’s environmental integrity [11,12].
While this study provides a robust framework, certain limitations should be acknowledged, which in turn highlight avenues for future research. The use of trajectory data reflects tourism patterns under existing conditions and may not fully capture the latent potential of areas that could become suitable with infrastructure improvements [28]. Furthermore, the cross-sectional nature of the socio-economic data do not account for the dynamic evolution of tourism suitability, and the study treats tourists as a homogeneous group. Future research could advance this work by incorporating multi-source tourism big data to enable tourist behavior segmentation [36]. Dynamic simulation models could also be developed to forecast changes in tourism suitability under future scenarios, including major engineering projects and the impacts of climate change [10]. Such studies would provide more robust and forward-looking scientific support for the sustainable development of tourism on the QTP and in other similar regions globally.

Author Contributions

Conceptualization, Z.L. and J.X.; methodology, Z.L. and S.Y.; validation, Z.L., S.Y. and J.X.; writing—original draft preparation, Z.L.; writing—review & editing, Z.L. and J.X.; visualization, S.Y.; supervision, J.X.; project administration, Z.L.; funding acquisition, Z.L. All authors have read and agreed to the published version of the manuscript.

Funding

This research was funded by the National Natural Science Foundation of China, grant number U24A20583.

Data Availability Statement

The data presented in this study are available on request from the corresponding author.

Acknowledgments

The authors are grateful to those who reviewed the article. The anonymous reviewers are acknowledged for their valuable comments.

Conflicts of Interest

The authors declare no conflicts of interest.

References

  1. Withanage, N.C.; Chanuwan Wijesinghe, D.; Mishra, P.K.; Abdelrahman, K.; Mishra, V.; Fnais, M.S. An ecotourism suitability index for a world heritage city using GIS-multi criteria decision analysis techniques. Heliyon 2024, 10, e31585. [Google Scholar] [CrossRef]
  2. Benabbou, A. Land use suitability analysis using an approach combining GIS, regionalization, and PROMETHEE II. Ann. GIS 2024, 30, 121–136. [Google Scholar] [CrossRef]
  3. Baltranaitė, E.; Inácio, M.; Valença Pinto, L.; Bogdziewicz, K.; Rocha, J.; Gomes, E.; Pereira, P. Tourism impacts on marine and coastal ecosystem services: A systematic review. Geogr. Sustain. 2025, 6, 100277. [Google Scholar] [CrossRef]
  4. Milano, C.; Koens, K.; Russo, A.P. The politics of urban tourism (im)mobilities: Critical perspectives on inequalities and social justice. Cities 2024, 152, 105148. [Google Scholar] [CrossRef]
  5. Paiva, D. The paradox of atmosphere: Tourism, heritage, and urban liveability. Ann. Tour. Res. 2023, 101, 103600. [Google Scholar] [CrossRef]
  6. Rogowski, M.; Zawilińska, B.; Hibner, J. Managing tourism pressure: Exploring tourist traffic patterns and seasonality in mountain national parks to alleviate overtourism effects. J. Environ. Manag. 2025, 373, 123430. [Google Scholar] [CrossRef] [PubMed]
  7. Wang, Z.; Li, J.; Liang, L. Ecological risk in the Tibetan Plateau and influencing urbanization factors. Environ. Chall. 2022, 6, 100445. [Google Scholar] [CrossRef]
  8. Yang, B.; Wu, J.; Miao, A.; Ran, J.; Jia, R. Balancing tourism development and habitat conservation in fragile ecosystems: A case study of the Qinghai-Tibet Plateau. PLoS ONE 2025, 20, e0327803. [Google Scholar] [CrossRef]
  9. Hua, Y.; Yong, X.U.; Kan, Z.; Lijia, W.; Lin, X.U. Evaluation of suitability, adaptability, and reserve potential of construction land on the Qinghai-Tibet Plateau. J. Geogr. Sci. 2024, 34, 41–61. [Google Scholar] [CrossRef]
  10. Luo, Y.; Yang, D.; O’Connor, P.; Wu, T.; Ma, W.; Xu, L.; Guo, R.; Lin, J. Dynamic characteristics and synergistic effects of ecosystem services under climate change scenarios on the Qinghai–Tibet Plateau. Sci. Rep. 2022, 12, 2540. [Google Scholar] [CrossRef]
  11. Li, W.; Liu, Y.; Lin, Q.; Wu, X.; Hao, J.; Zhou, Z.; Zhang, X. Identification of ecological security pattern in the Qinghai-Tibet Plateau. Ecol. Indic. 2025, 170, 113057. [Google Scholar] [CrossRef]
  12. Lu, T.; Li, C.; Zhou, W.; Liu, Y. Fuzzy Assessment of Ecological Security on the Qinghai-Tibet Plateau Based on Pressure-State-Response Framework. Remote Sens. 2023, 15, 1293. [Google Scholar] [CrossRef]
  13. Gigović, L.; Pamučar, D.; Lukić, D.; Marković, S. GIS-Fuzzy DEMATEL MCDA model for the evaluation of the sites for ecotourism development: A case study of “Dunavski ključ” region, Serbia. Land Use Policy 2016, 58, 348–365. [Google Scholar] [CrossRef]
  14. McLoughlin, E.; Hanrahan, J. Evidence-informed planning for tourism. J. Policy Res. Tour. Leis. Events 2023, 15, 1–17. [Google Scholar] [CrossRef]
  15. Zabihi, H.; Alizadeh, M.; Wolf, I.; Karami, M.; Ahmad, A.; Salamian, H. A GIS-based fuzzy-analytic hierarchy process (F-AHP) for ecotourism suitability decision making: A case study of Babol in Iran. Tour. Manag. Perspect. 2020, 36, 100726. [Google Scholar] [CrossRef]
  16. Ronizi, S.R.A.; Mokarram, M.; Negahban, S. Utilizing multi-criteria decision to determine the best location for the ecotourism in the east and central of Fars province, Iran. Land Use Policy 2020, 99, 105095. [Google Scholar] [CrossRef]
  17. Raha, S.; Mondal, M.; Gayen, S. Ecotourism Potential Zone Mapping by Using Analytic Hierarchy Process (AHP) and Weighted Linear Algorithm: A Study on West Bengal, India. J. Geogr. Stud. 2021, 5, 44–64. [Google Scholar] [CrossRef]
  18. Núñez, J.C.S.; Gómez-Pulido, J.A.; Ramírez, R.R. Machine learning applied to tourism: A systematic review. WIREs Data Min. Knowl. Discov. 2024, 14, e1549. [Google Scholar] [CrossRef]
  19. Teixeira, J.P.; Fernandes, P.O. Tourism time series forecast with artificial neural networks. Tékhne 2014, 12, 26–36. [Google Scholar] [CrossRef]
  20. Dimitriadou, A.; Gogas, P.; Papadimitriou, T. Tourism and uncertainty: A machine learning approach. Curr. Issues Tour. 2025, 28, 2278–2298. [Google Scholar] [CrossRef]
  21. Habib, M.H.R.; Rahman, M.; Uddin, M.M.; Shimu, N.J.; Hasan, M.; Alam, M.J.; Islam, M.S. Application of AHP and geospatial technologies to assess ecotourism suitability: A case study of Saint Martin’s Island in Bangladesh. Reg. Stud. Mar. Sci. 2024, 70, 103357. [Google Scholar] [CrossRef]
  22. Sarkar, A.; Mondal, M.; Sarma, U.S.; Podder, S.; Gayen, S.K. Tourism Suitability Assessment in Malbazar Block using principal component analysis and analytical hierarchy process. Environ. Dev. Sustain. 2024. [Google Scholar] [CrossRef]
  23. Liu, J.; Xin, Z.; Huang, Y.; Yu, J. Climate suitability assessment on the Qinghai-Tibet Plateau. Sci. Total Environ. 2022, 816, 151653. [Google Scholar] [CrossRef]
  24. Mou, N.; Liu, Z.; Zheng, Y.; Makkonen, T.; Yang, T.; Zhang, L. Cycling in Tibet: An analysis of tourists’ spatiotemporal behavior and infrastructure. Tour. Manag. 2022, 88, 104418. [Google Scholar] [CrossRef]
  25. Wangjie, G.; Lou, Y.; Song, K.; Li, X.; Fang, Y.; Hou, J.; Sun, Y. Human-wildlife coexistence on the Qinghai-Tibet Plateau: The correlation between Tibetan Buddhist monasteries and avian community composition. People Nat. 2024, 6, 573–585. [Google Scholar] [CrossRef]
  26. Shao, D.; Zoh, K.; Xie, Y.Z. The spatial differentiation mechanism of intangible cultural heritage and its integration with tourism development based on explainable machine learning and coupled coordination models: A case study of the Jiang-Zhe-Hu in China. Herit. Sci. 2024, 12, 414. [Google Scholar] [CrossRef]
  27. Yuvaraj, R.M.; Ambrisha, S.; Muthunagai, S. Integrated AHP-TOPSIS models to evaluate suitability and sustainable development of beach tourism: A case in Chennai City, Tamil Nadu, India. J. Coast. Conserv. 2024, 28, 32. [Google Scholar] [CrossRef]
  28. Yu, H.; Chen, Q.J.; Hu, X.Y. Tourist interest areas and spatial movement patterns on the qinghai-Tibet plateau based on dynamic trajectory similarity. Habitat Int. 2025, 163, 103500. [Google Scholar] [CrossRef]
  29. Huang, S.; Yi, J.W.; Du, Y.Y.; Liang, F.Y.; Xu, R.; Wang, N.; Qian, J.L.; Tu, W.N.; Luo, P.X.; Xing, A.Z.F. Unveiling the potential supply of cultural ecosystem services on the Qinghai-Tibet Plateau: Insights from tourist hiking trajectories. Ecosyst. Serv. 2025, 73, 101711. [Google Scholar] [CrossRef]
  30. Zhang, H.; Dong, G.; Wang, J.; Zhang, T.-L.; Meng, X.; Yang, D.; Liu, Y.; Lu, B. Understanding and extending the geographical detector model under a linear regression framework. Int. J. Geogr. Inf. Sci. 2023, 37, 2437–2453. [Google Scholar] [CrossRef]
  31. Guo, Y.; Wu, Z.; Zheng, Z.; Li, X. An optimal multivariate-stratification geographical detector model for revealing the impact of multi-factor combinations on the dependent variable. GISci. Remote Sens. 2024, 61, 2422941. [Google Scholar] [CrossRef]
  32. Bollenbach, J.; Rebholz, D.; Keller, R. The road not taken: Representing expert knowledge for route similarities in sustainable tourism using machine learning. Electron. Mark. 2025, 35, 72. [Google Scholar] [CrossRef]
  33. Yao, T.; Thompson, L.G.; Mosbrugger, V.; Zhang, F.; Ma, Y.; Luo, T.; Xu, B.; Yang, X.; Joswiak, D.R.; Wang, W.; et al. Third Pole Environment (TPE). Environ. Dev. 2012, 3, 52–64. [Google Scholar] [CrossRef]
  34. Lu, Y.; Han, F.; Liu, Q.; Wang, Z.; Wang, T.; Yang, Z. Evaluation of Potential for Nature-Based Recreation in the Qinghai-Tibet Plateau: A Spatial-Temporal Perspective. Int. J. Environ. Res. Public Health 2022, 19, 5753. [Google Scholar] [CrossRef]
  35. Chen, X.; Wang, T.; Zheng, X.; Han, F.; Yang, Z. The Structure and Evolution of the Tourism Economic Network of the Tibetan Plateau and Its Driving Factors. Land 2022, 11, 241. [Google Scholar] [CrossRef]
  36. Huang, S.; Sheng, D.; Wang, P.; Xiao, J.; Li, Q.; Liu, H. Assessment of ecotourism suitability in Qilian mountain National park. Sci. Rep. 2025, 15, 19529. [Google Scholar] [CrossRef]
  37. Yue, Y.; Lan, T.; Yeh, A.G.O.; Li, Q.-Q. Zooming into individuals to understand the collective: A review of trajectory-based travel behaviour studies. Travel Behav. Soc. 2014, 1, 69–78. [Google Scholar] [CrossRef]
  38. Huang, W.; Wang, L. Towards big data behavioral analysis: Rethinking GPS trajectory mining approaches from geographic, semantic, and quantitative perspectives. Archit. Intell. 2022, 1, 7. [Google Scholar] [CrossRef]
  39. Mashkov, R.; Shoval, N. Using high-resolution GPS data to create a tourism Intensity-Density Index. Tour. Geogr. 2023, 25, 1657–1678. [Google Scholar] [CrossRef]
  40. Schmücker, D.; Reif, J. Measuring tourism with big data? Empirical insights from comparing passive GPS data and passive mobile data. Ann. Tour. Res. Empir. Insights 2022, 3, 100061. [Google Scholar] [CrossRef]
  41. Beeco, J.A.; Hallo, J.C.; Brownlee, M.T.J. GPS Visitor Tracking and Recreation Suitability Mapping: Tools for understanding and managing visitor use. Landsc. Urban Plan. 2014, 127, 136–145. [Google Scholar] [CrossRef]
  42. Wang, J.-F.; Zhang, T.-L.; Fu, B.-J. A measure of spatial stratified heterogeneity. Ecol. Indic. 2016, 67, 250–256. [Google Scholar] [CrossRef]
  43. Ma, X.; Yang, Z.; Zheng, J. Analysis of spatial patterns and driving factors of provincial tourism demand in China. Sci. Rep. 2022, 12, 2260. [Google Scholar] [CrossRef]
  44. Song, Y.; Wang, J.; Ge, Y.; Xu, C. An optimal parameters-based geographical detector model enhances geographic characteristics of explanatory variables for spatial heterogeneity analysis: Cases with different types of spatial data. GISci. Remote Sens. 2020, 57, 593–610. [Google Scholar] [CrossRef]
  45. Chen, J.; Wang, S.; Han, Y.; Zhang, Y.; Li, Y.; Zhang, B.; Li, X.; Zhang, J. Geodetector analysis of individual and joint impacts of natural and human factors on maternal and child health at the provincial scale. Sci. Rep. 2024, 14, 1643. [Google Scholar] [CrossRef]
  46. Lv, W.; Lei, Y.; Liu, F.; Yan, J.; Song, Y.; Zhao, W. gdverse: An R Package for Spatial Stratified Heterogeneity Family. Trans. GIS 2025, 29, e70032. [Google Scholar] [CrossRef]
  47. Pouwels, R.; van Eupen, M.; Walvoort, D.J.J.; Jochem, R. Using GPS tracking to understand the impact of management interventions on visitor densities and bird populations. Appl. Geogr. 2020, 116, 102154. [Google Scholar] [CrossRef]
  48. Sothe, C.; De Almeida, C.M.; Schimalski, M.B.; La Rosa, L.E.C.; Castro, J.D.B.; Feitosa, R.Q.; Dalponte, M.; Lima, C.L.; Liesenberg, V.; Miyoshi, G.T.; et al. Comparative performance of convolutional neural network, weighted and conventional support vector machine and random forest for classifying tree species using hyperspectral and photogrammetric data. GISci. Remote Sens. 2020, 57, 369–394. [Google Scholar] [CrossRef]
  49. Li, A.; Zhang, Z.; Hong, Z.; Liu, L.; Liu, Y. Evaluation method for ecology-agriculture-urban spaces based on deep learning. Sci. Rep. 2024, 14, 11353. [Google Scholar] [CrossRef] [PubMed]
  50. Zhang, G.; Li, X.; Zhang, L.; Wei, X. Dynamics and causes of cropland Non-Agriculturalization in typical regions of China: An explanation Based on interpretable Machine learning. Ecol. Indic. 2024, 166, 112348. [Google Scholar] [CrossRef]
  51. Berrettini, M.; Hennig, C.M.; Viroli, C. The quantile-based classifier with variable-wise parameters. Can. J. Stat. 2025, 53, e11837. [Google Scholar] [CrossRef]
  52. Sheth, V.; Tripathi, U.; Sharma, A. A Comparative Analysis of Machine Learning Algorithms for Classification Purpose. Procedia Comput. Sci. 2022, 215, 422–431. [Google Scholar] [CrossRef]
  53. Noll, B.; Filatova, T.; Need, A.; de Vries, P. Uncertainty in individual risk judgments associates with vulnerability and curtailed climate adaptation. J. Environ. Manag. 2023, 325, 116462. [Google Scholar] [CrossRef] [PubMed]
  54. Sánchez-Rivero, M.; Miguel-Barrado, V.; Rodríguez-Rangel, M.C.; Pérez-Calderón, E. Evolution of transport, accessibility and tourism competitiveness in Extremadura (Spain): A benchmarking analysis. Eur. Transp. Res. Rev. 2024, 16, 66. [Google Scholar] [CrossRef]
  55. Zhu, G.-r.; Wang, M.; Li, Q.-l.; Liu, J.; Zhao, Y.-n.; Gao, J.-w.; Xu, H.-l. Land development suitability analysis for transport planning evaluation and optimization in mountainous ecological region. J. Mt. Sci. 2022, 19, 862–873. [Google Scholar] [CrossRef]
  56. Ibanescu, B.-C.; Eva, M.; Gheorghiu, A.; Iatu, C. Tourism-Induced Resilience of Rural Destinations in Relation to Spatial Accessibility. Appl. Spat. Anal. Policy 2023, 16, 1237–1254. [Google Scholar] [CrossRef]
  57. Waleghwa, B.; Ioannides, D. “Everyone Wants to Drive There”: Challenges to Transport Sustainability in Rural Tourism Destinations. Int. J. Tour. Res. 2024, 26, e2810. [Google Scholar] [CrossRef]
  58. Cattaneo, A.; Adukia, A.; Brown, D.L.; Christiaensen, L.; Evans, D.K.; Haakenstad, A.; McMenomy, T.; Partridge, M.; Vaz, S.; Weiss, D.J. Economic and social development along the urban–rural continuum: New opportunities to inform policy. World Dev. 2022, 157, 105941. [Google Scholar] [CrossRef]
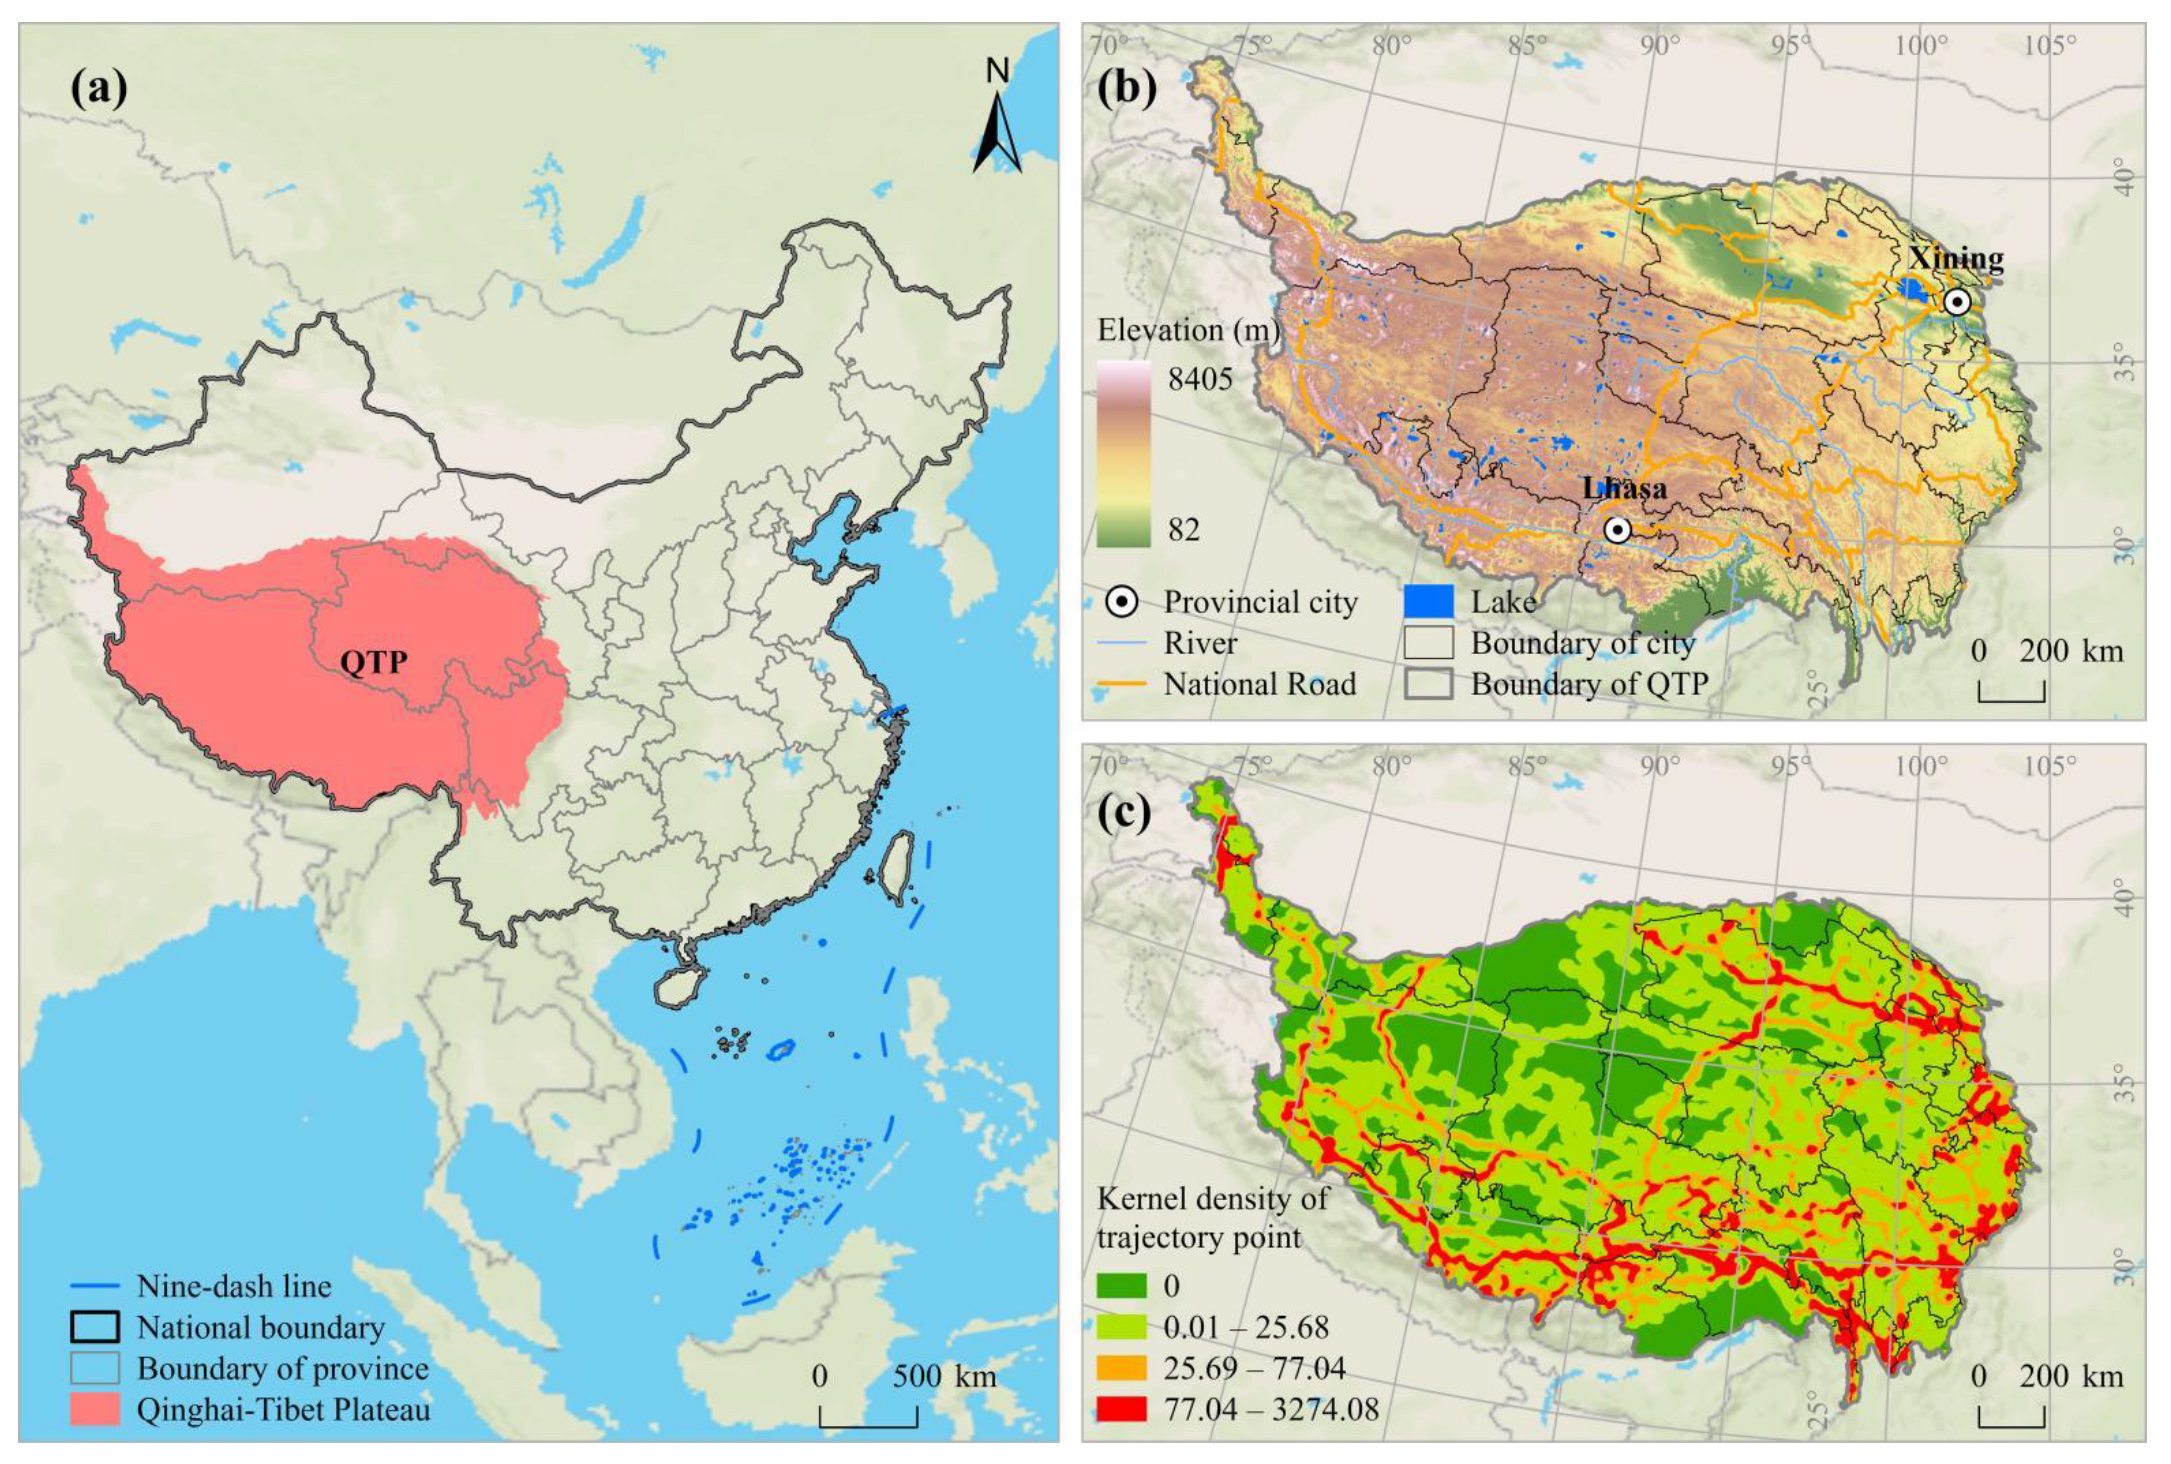
Figure 1. Study area. (a) Location of the Qinghai–Tibet Plateau (QTP) in China. (b) Elevation map of the QTP. (c) Kernel density map of tourist trajectory points.
Land 14 01885 g001
Figure 2. Research framework.
Land 14 01885 g002
Figure 3. Geographical detector analysis of influencing factors. (a) The explanatory power (q-value) of each factor. *** indicates statistical significance at the p < 0.001 level. (b) The interaction detector matrix showing the combined explanatory power of factor pairs.
Land 14 01885 g003
Figure 4. Performance evaluation of the machine learning models. (a) Confusion matrices for Random Forest (RF), K-Nearest Neighbors (KNNs), Logistic Regression (LR), Gaussian Naive Bayes (GNB), Support Vector Machine (SVM), and XGBoost. (b) Comparison of model performance metrics. (c) Receiver Operating Characteristic (ROC) curves and Area Under the Curve (AUC) values.
Land 14 01885 g004
Figure 5. Spatial distribution of tourism activity suitable zones across the Qinghai–Tibet Plateau predicted by the RF model.
Land 14 01885 g005
Figure 6. Spatial relationship between predicted tourism activity suitable zones and key tourism elements. (a) Overview map showing the congruence of suitability zones with scenic spots, natural reserves, and major transport routes. (be) Enlarged views revealing detailed spatial patterns in the four core tourism areas: Xining, Shigatse, Lhasa and Shannan, and Nyingchi.
Land 14 01885 g006
Figure 7. Statistical characteristics of influencing factors across different suitability zones. (a) Boxplots showing the distribution of factor values within each zone. (b) Radar charts illustrating the composite factor profiles for each suitability zone.
Land 14 01885 g007
Table 1. Details about the data used in this study.
Data TypeDescriptionFormatTemporal CoverageSource
Trajectory pointHigh-precision GPS points representing tourist activity intensity.Vector (point)April 2023–December 2024https://www.foooooot.com/, accessed on 15 January 2025
DEMDigital Elevation Mode for calculating altitude.1 km Raster2020Resources and Environmental Science Data Center (https://www.resdc.cn/, accessed on 20 December 2024)
NDVINormalized Difference Vegetation Index.1 km Raster2023
Land UseClassification of land cover types.1 km Raster2020
Climate DataAnnual mean temperature, precipitation, wind speed.Station records2015–2023National Meteorological Science Data Center (http://data.cma.cn/, accessed on 25 December 2024)
UV RadiationAnnual mean ultraviolet radiation intensity.Station records2015–2023
Ecological VulnerabilityIndex assessing the sensitivity of the ecosystem.1 km Raster2020National Earth System Science Data Center (https://www.geodata.cn/, accessed on 25 December 2024)
Administrative BoundariesVector boundaries of the Qinghai–Tibet Plateau.Vector (polygon)2020
GDPGross Domestic Product at the county level.CSV2023Local Government Reports
Tourism AttractionsOfficial list of national A-level scenic spots.Vector (point)2023Ministry of Culture and Tourism of PRC (https://www.mct.gov.cn/, accessed on 10 December 2024)
Transport NetworkMajor road network, including national and provincial highways.Vector (point)2023OpenStreetMap (http://www.openstreetmap.org/, accessed on 15 December 2024)
Hospitality FacilitiesPoints of Interest, including hotels, restaurants, gas stations.Vector (point)2023Amap (https://ditu.amap.com/, accessed on 10 December 2024)
Hazard PointsLocation of historical natural disasters.Vector (point)2015–2023Global Disaster Data Platform (https://www.gddat.cn/, accessed on 15 December 2024)
Table 2. Indicator system and variable specification for tourism activity suitability.
DimensionIndicatorCodeUnitEffect on SuitabilityDescription
Tourism Resource EndowmentLandscape Diversity Index X1PositiveMeasures landscape attractiveness using Shannon’s Diversity Index (SHDI) based on land use data. Higher values indicate greater attraction.
Scenic Spot DensityX2 PositiveMeasures tourism resource endowment via the Kernel density of A-level scenic spots. Higher values indicate richer resources.
Natural Geographical EnvironmentEcological Vulnerability IndexX3NegativeReflects the degree of ecological vulnerability. Higher vulnerability suggests the area is less suitable for tourism development.
Vegetation Coverage IndexX4PositiveRepresents the condition of the ecological environment, derived from NDVI. Better environments have a stronger attraction for tourists.
Temperature-Humidity IndexX5PositiveIndicates the level of climate comfort. More comfortable climates are more conducive to tourism.
UV RadiationX6W/m2NegativeRepresents the intensity of ultraviolet radiation. Higher radiation levels can cause discomfort and are less suitable for tourists.
AltitudeX7mNegativeIndicates the probability of tourists experiencing altitude sickness. Higher values represent a greater likelihood of adverse reactions.
Hazard Point DensityX8count/km2NegativeReflects the safety level of the area via the Kernel Density of historical natural disasters. A higher value indicates lower safety.
Supporting and Guaranteeing ConditionsGDPX9108 CNYPositiveMeasures the regional socioeconomic level. Higher GDP is associated with better supporting infrastructure and services.
Hospitality Facility DensityX10count/km2PositiveMeasures tourism service capacity via the Kernel Density of hospitality facilities (e.g., hotels, restaurants).
Distance to Urban CentersX11kmNegativeMeasures remoteness. Closer proximity to urban centers facilitates easier access to services for tourists.
Distance to Main RoadsX12kmNegativeMeasures accessibility. Closer proximity to main roads (national and provincial highways) facilitates easier tourist entry.
Table 3. Results of the variance inflation factor (VIF) for the selected factors.
Factor
X1X2X3X4X5X6X7X8X9X10X11X12
VIF0.2990.1621.0520.3980.1130.0090.0390.7740.8110.9830.4010.657
Table 4. Area and proportion of different tourism activity suitable zones.
Suitability ZoneArea (km2)Percentage (%)
High-Suitability Zone (HSZ)232,5089.00
Medium-Suitability Zone (MSZ)100,4353.89
Low-Suitability Zone (LSZ)48,2561.87
Unsuitable Zone (UZ)2,203,20085.25
Disclaimer/Publisher’s Note: The statements, opinions and data contained in all publications are solely those of the individual author(s) and contributor(s) and not of MDPI and/or the editor(s). MDPI and/or the editor(s) disclaim responsibility for any injury to people or property resulting from any ideas, methods, instructions or products referred to in the content.