Article

Spatial Resilience Differentiation and Governance Strategies of Traditional Villages in the Qinba Mountains, China

1
School of Human Settlements and Civil Engineering, Xi’an Jiaotong University, Xi’an 710049, China
2
Department of Architecture and Urban Studies (DASTU), Politecnico di Milano, Piazza Leonardo da Vinci 32, 20133 Milan, Italy
*
Author to whom correspondence should be addressed.
Land 2025, 14(9), 1852; https://doi.org/10.3390/land14091852
Submission received: 7 August 2025 / Revised: 8 September 2025 / Accepted: 10 September 2025 / Published: 11 September 2025

Abstract

The Qinba Mountain Region in southern Shaanxi, China, is both a key ecological barrier and a repository of cultural heritage, yet its traditional villages remain highly vulnerable to natural disasters. Disaster-relocation policies have reduced direct exposure to hazards but also created challenges such as settlement hollowing and weakening of cultural continuity. However, systematic studies on the resilience mechanisms of these villages and a corresponding governance framework remain limited. This study applies social–ecological resilience theory to evaluate the resilience of 57 nationally recognized traditional villages. Using a combination of Morphological Spatial Pattern Analysis (MSPA), the entropy weight method, and the geographical detector model, we construct a three-dimensional evaluation framework encompassing terrain adaptability, hazard exposure, and ecological sensitivity. The results show that the Terrain Adaptability Index (TAI) is the dominant driver of resilience, with an explanatory power of q = 0.61, while the interaction of Hazard Exposure Index (HEI, q = 0.58) and Ecological Sensitivity Index (ESI, q = 0.49) produces a nonlinear enhancement effect, significantly increasing vulnerability. Approximately 83% of villages adopt a “peripheral attachment–core avoidance” strategy, and 57% of high-resilience villages (CRI ≥ 0.85) rely on traditional clan-based networks and drainage systems to offset ecological fragility. Based on these differentiated resilience characteristics, the study proposes a three-tiered governance framework of core protection areas–ecological restoration zones–cultural corridors. While this framework demonstrates broad applicability, its findings are context-specific to the Qinba Mountains. Future studies should apply the model to other mountainous regions and integrate dynamic simulation methods to assess climate change impacts, thereby expanding the generalizability of resilience governance strategies.

1. Introduction

The theory of spatial resilience originated from the research on social-ecological systems (SESs), emphasizing the dynamic adaptation, recovery, and transformation capabilities of human society and the natural environment in the face of disturbances [1,2]. As an important branch of resilience theory, “spatial resilience” [3,4] is gradually becoming a core tool for understanding the adaptation mechanisms of complex human–land systems. For instance, Chambers applied spatial resilience concepts to develop a geospatial decision-support tool that prioritizes management actions based on resilience capacity in sagebrush landscapes [5]. Similarly, Zhao proposed an optimized agricultural protection network in terrace systems by enhancing connectivity and redundancy—key spatial resilience mechanisms [6]. Different from the early resilience research that regarded space as a material carrier, Cumming [7] was the first to propose that the spatial pattern itself is the core mechanism shaping system resilience. It achieves the dispersion of risks through spatial heterogeneity, the transmission of resources through spatial connectivity, and the provision of buffers through spatial redundancy, thus realizing the transformation of resilience research from focusing on “what the system can do” to “how space enables the system to do it”. However, existing spatial resilience studies mainly focus on two-dimensional planes, which have obvious limitations when dealing with complex terrains with significant vertical differences. For example, Keane modeled resilience in ecosystem landscapes as trajectories in a 2D phase space [8]. Although Allen [9] advanced a three-component framework encompassing spatial structure, function, and process, these investigations continue to privilege horizontal spatiality, thereby neglecting the fundamental influence of topographic factors on resilience mechanisms. Against the backdrop of intensifying climate change and escalating extreme events, transcending the “planar” constraint inherent in current spatial resilience theory and constructing an analytical framework responsive to three-dimensional terrain is becoming an urgent imperative. Recent scholarship supports this shift: Zlatanova reviewed the use of 3D space representations across spatial science, underscoring the need for volumetric conceptualization in planning and resilience analysis [10]. Similarly, Lu demonstrated the limitations of ignoring vertical complexity in assessing urban form and resilience [11].
Mountainous traditional villages, as a distinctive type of traditional settlement, provide valuable case studies for testing and advancing spatial resilience theory. In the context of rapid urbanization and intensifying climate change, these villages—crucial repositories of cultural heritage and ecological resources—are facing unprecedented challenges [12]. They accommodate about 13% of the global population and 80% of terrestrial organisms [13,14]. Through long-term historical adaptation, such villages have developed spatial organization patterns well-suited for extreme terrains, showing unique resilience characteristics. Specifically, vertically stratified spatial configurations achieve systematic risk avoidance through the elevation differentiation of “residence–production–ecology” [15]; fragmented spatial patterns, while limiting the free flow of elements, effectively prevent the rapid spread of disasters [16]; the multi-scale nested spatial system allows resilience mechanisms at different spatial scales—such as slopes, river basins, and mountain ranges—to support one another and function synergistically. Studies have demonstrated that a rational vertical spatial layout can significantly mitigate losses caused by mountain disasters. For instance, Zhu. found that in the mountainous areas of Southwest China, vertical spatial differentiation enhances the buffering, adjustment, and renewal capacities of rural livelihood systems, especially across varying terrain gradients, thereby strengthening system resilience [7,12]. Through elevation-based segmentation of residential, production, and ecological zones, such layouts provide systematic risk avoidance and long-term adaptability [12]. This spatial construction wisdom, which has stood the test of thousands of years, not only reflects the in-depth adaptation of humans to complex mountain environments but also provides a rich empirical basis for the development of modern spatial resilience theory. However, current global mountainous regions are facing unprecedented challenges: Data from the IPCC [17] shows that the rate of temperature rise in mountainous areas is 40% higher than the global average, coupled with an annual population outflow rate of 1.8%. These intertwined factors are profoundly impacting the mountain spatial resilience system formed through thousands of years of evolution, resulting in a chain reaction of “environmental change–pattern imbalance–resilience decline” [18].
The Qinba Mountain area in southern Shaanxi, a typical sample of East Asian mountain settlements, is located at the intersection of the Qinling and Daba Mountains. It serves as both a crucial ecological barrier and a cultural heritage-rich zone in China [19]. Traditional villages in this region, mostly built along mountain slopes, have long faced severe threats from natural disasters such as landslides and mudslides [20]. However, through millennia of evolution and adaptation to nature, these villages have developed unique spatial layout wisdom: the vertical tripartite spatial structure of “residential terraces, cultivated slopes, and conserved peaks” ingeniously avoids dual geological risks of valley floods and mountaintop collapses [21]; the scattered spatial layout maintains internal connectivity while effectively dispersing external risks; and the multi-level spatial organization system constrained by topography forms an effective risk buffering mechanism. Although these local wisdoms provide empirical evidence for modern resilience theories, they have long been excluded from planning practices due to the lack of a quantitative analytical framework, resulting in insufficiently targeted disaster mitigation strategies and resilience enhancement measures. Nevertheless, recent large-scale ecological resettlement policies, while reducing direct exposure to geological hazards, have disrupted traditional spatial balance. Wang demonstrates that resettlement often reorganizes habitats into concentric settlement patterns, replacing natural river–forest–shrubland gradients and increasing fragmentation and risk concentration [22]. Similarly, in mountainous settlements of Pingnan County, Fujian Province, rural reclamation and spatial restructuring have led to increased scale and number of settlements, modifying surrounding land-use patterns and potentially weakening the adaptive capacity of spatial systems [23]. This high-density, centralized development model may introduce new risk aggregations and weaken the long-term resilience of mountain village spatial systems. Faced with this dilemma, it is essential to re-examine and systematically analyze the internal mechanisms and evolutionary trajectories of spatial resilience in mountainous villages.
Based on this, this study takes 57 national-level traditional villages in the Qinba Mountain area of southern Shaanxi as empirical cases, aiming to address two core issues by constructing a three-dimensional analytical framework of “terrain–disaster–ecology”: First, how natural factors interact to drive the resilience differentiation of traditional villages; second, how to optimize the resilience structure through spatial governance. Through quantitative analysis, it reveals the adaptive logic of village site selection and ecological disaster avoidance mechanisms, proposes an optimization framework, and formulates differentiated governance paths integrated with national spatial planning. This ensures the organic integration of resilience governance strategies with existing planning systems, breaks through the current disconnect between disaster prevention and conservation in planning, and compensates for the absence of resilience governance in existing frameworks. Ultimately, it provides a scientific basis for cultural heritage protection and disaster risk management in mountain settlements. This exploration not only advances spatial resilience theory from a planar to three-dimensional and from static to dynamic paradigm but also offers critical scientific insights and Chinese wisdom for global mountain communities seeking sustainable spatial development pathways under the dual pressures of environmental change and developmental transformation.
The novelty of this study is reflected in three aspects:
(1) It shifts the perspective from static spatial distribution and historical evolution toward a resilience-oriented framework;
(2) It adopts a multi-scale analytical approach that integrates macro landscape patterns, meso settlement structures, and micro building–social networks, employing spatial syntax and landscape metrics;
(3) It constructs a dual evaluation system (CI + MSRI) that links resilience assessment with governance strategies.
Together, these innovations advance spatial resilience theory and provide practical guidance for the sustainable planning of mountainous traditional villages.

2. Materials and Methods

2.1. Research Overview

2.1.1. Research Framework

Based on the above background, the spatial resilience of traditional villages is essentially the result of the interaction between natural environmental constraints and social adaptation strategies. Therefore, it is necessary to analyze the interplay among topographic adaptability, disaster risk exposure, and ecological sensitivity. From a natural dimension, topographic conditions such as elevation, slope gradient, and aspect directly influence village site selection and spatial layout, serving as a fundamental barrier for mountain settlements to cope with natural disasters. However, most existing studies remain at the level of single-factor analysis [24,25]. Research integrating topographic adaptability, disaster exposure, and ecological sensitivity into a quantitative framework remains insufficient [26], and there is a lack of systematic analysis of the multidimensional factor coupling mechanism of “topography–disaster–ecology.” [27,28]. With advancements in research, Morphological Spatial Pattern Analysis (MSPA) has become a critical tool for assessing landscape connectivity and ecological barriers. Recent studies have combined MSPA with risk assessment models to identify ecological core areas and edge effects [29], but its application in the resilience of traditional villages remains limited. The entropy weight method and geodetector model have been used in urban resilience research [30], yet their adaptability to mountainous social-ecological systems requires further exploration [31,32,33]. Moreover, social-ecological resilience theory emphasizes the dynamic coupling between natural and social systems. However, previous studies often separated these two systems, neglecting the compensatory role of social capital in offsetting natural constraints within traditional villages. Notably, traditional villages in the Qinba Mountains of southern Shaanxi exhibit adaptive strategies such as “selecting gentle slopes for settlement” and “clan-based risk-sharing,” which effectively mitigate risks posed by steep terrain and ecological fragility [34]. Nevertheless, due to the absence of a quantitative analysis framework, these strategies have not been fully integrated into modern planning practices [35].
Overall, existing studies on the resilience mechanisms of mountainous traditional villages have three shortcomings: First, they neglect the synergistic effects of terrain, disaster, and ecological factors, lacking a comprehensive evaluation system suitable for complex mountain environments. Second, they separate the connection between natural and social systems, failing to fully explore the compensatory role of social capital in resilience. Third, the application of quantitative analysis methods is limited, and there is a gap in the connection between traditional construction wisdom and modern planning practices. To address these gaps, this study takes the Qinba Mountainous Region in southern Shaanxi as the research area, integrating socio-ecological resilience theory with technical methods such as MSPA and geodetector models. By incorporating the unique characteristics of mountainous villages in this region, we construct a “topography–disaster–ecology” three-dimensional evaluation framework tailored to the study area. This framework aims to fill the aforementioned research voids and provide theoretical and methodological innovations for resilience governance in mountain settlements. Methodologically, this study combines field investigations with multi-source data analysis. The fieldwork was conducted from September to December 2023, covering three typical types of mountainous villages in the Qinba region: 9 plain-basin villages, 44 low-hill villages, and 3 mid-mountain villages to ensure sample representativeness (Appendix A). Data analysis employs MSPA, GIS spatial analysis, and statistical methods including the geodetector model and Pearson correlation analysis to calculate village resilience indices and reveal spatial resilience disparities and their driving factors across different villages. The research framework is illustrated in Figure 1.

2.1.2. Data Sources

The research data adopt a multi-source heterogeneous database, specifically divided into three categories: basic data of traditional villages, historical disaster point data, and social-cultural data, with the following sources:
Basic data of traditional villages: Village lists and geographical locations are from the first to sixth batches of the Catalog of Chinese Traditional Villages issued by the Ministry of Housing and Urban–Rural Development. Spatial coordinates are obtained through Baidu Maps API, converted from WGS84 to CGCS2000 using a 7-parameter transformation model (dx = 12.5, dy = −15.8, dz = 20.3) to align with China’s national standard, and a vector database is constructed using ArcGIS 10.7.
Disaster and environmental data: Historical disaster point data (2010–2020) are provided by the Shaanxi Provincial Geological Disaster Prevention and Control Center, with spatial error controlled within 5%, including location information of disaster types such as landslides, debris flows, and floods. Land-use data are from GlobeLand30 (30 m resolution) in 2020, with ecological sensitive land types such as forest, grassland, and water areas extracted through reclassification. Terrain data (DEM, 30 m resolution) and vegetation coverage (NDVI) are sourced from the Geospatial Data Cloud Platform of the Chinese Academy of Sciences.
Social-cultural data: The socio-cultural data were collected through “participatory observation + in-depth interviews”, covering more than 200 households in 57 villages, to ensure the reliability of social capital quantification.

2.2. Research Area

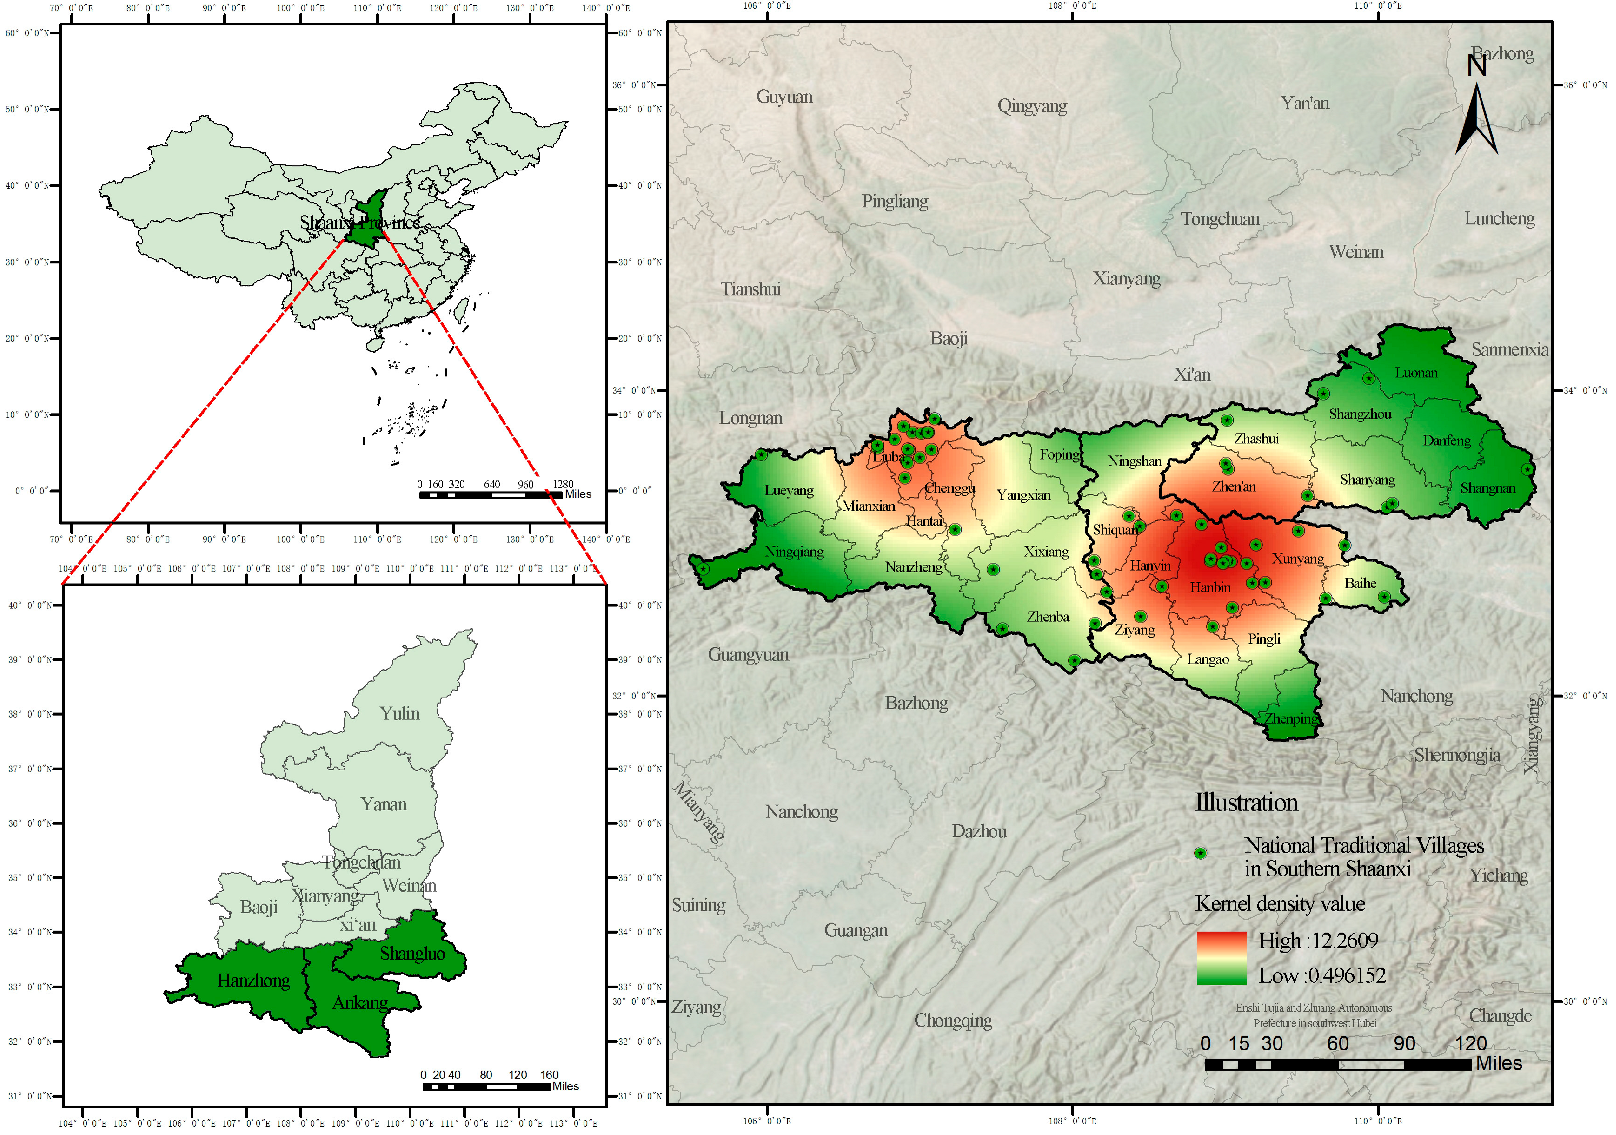
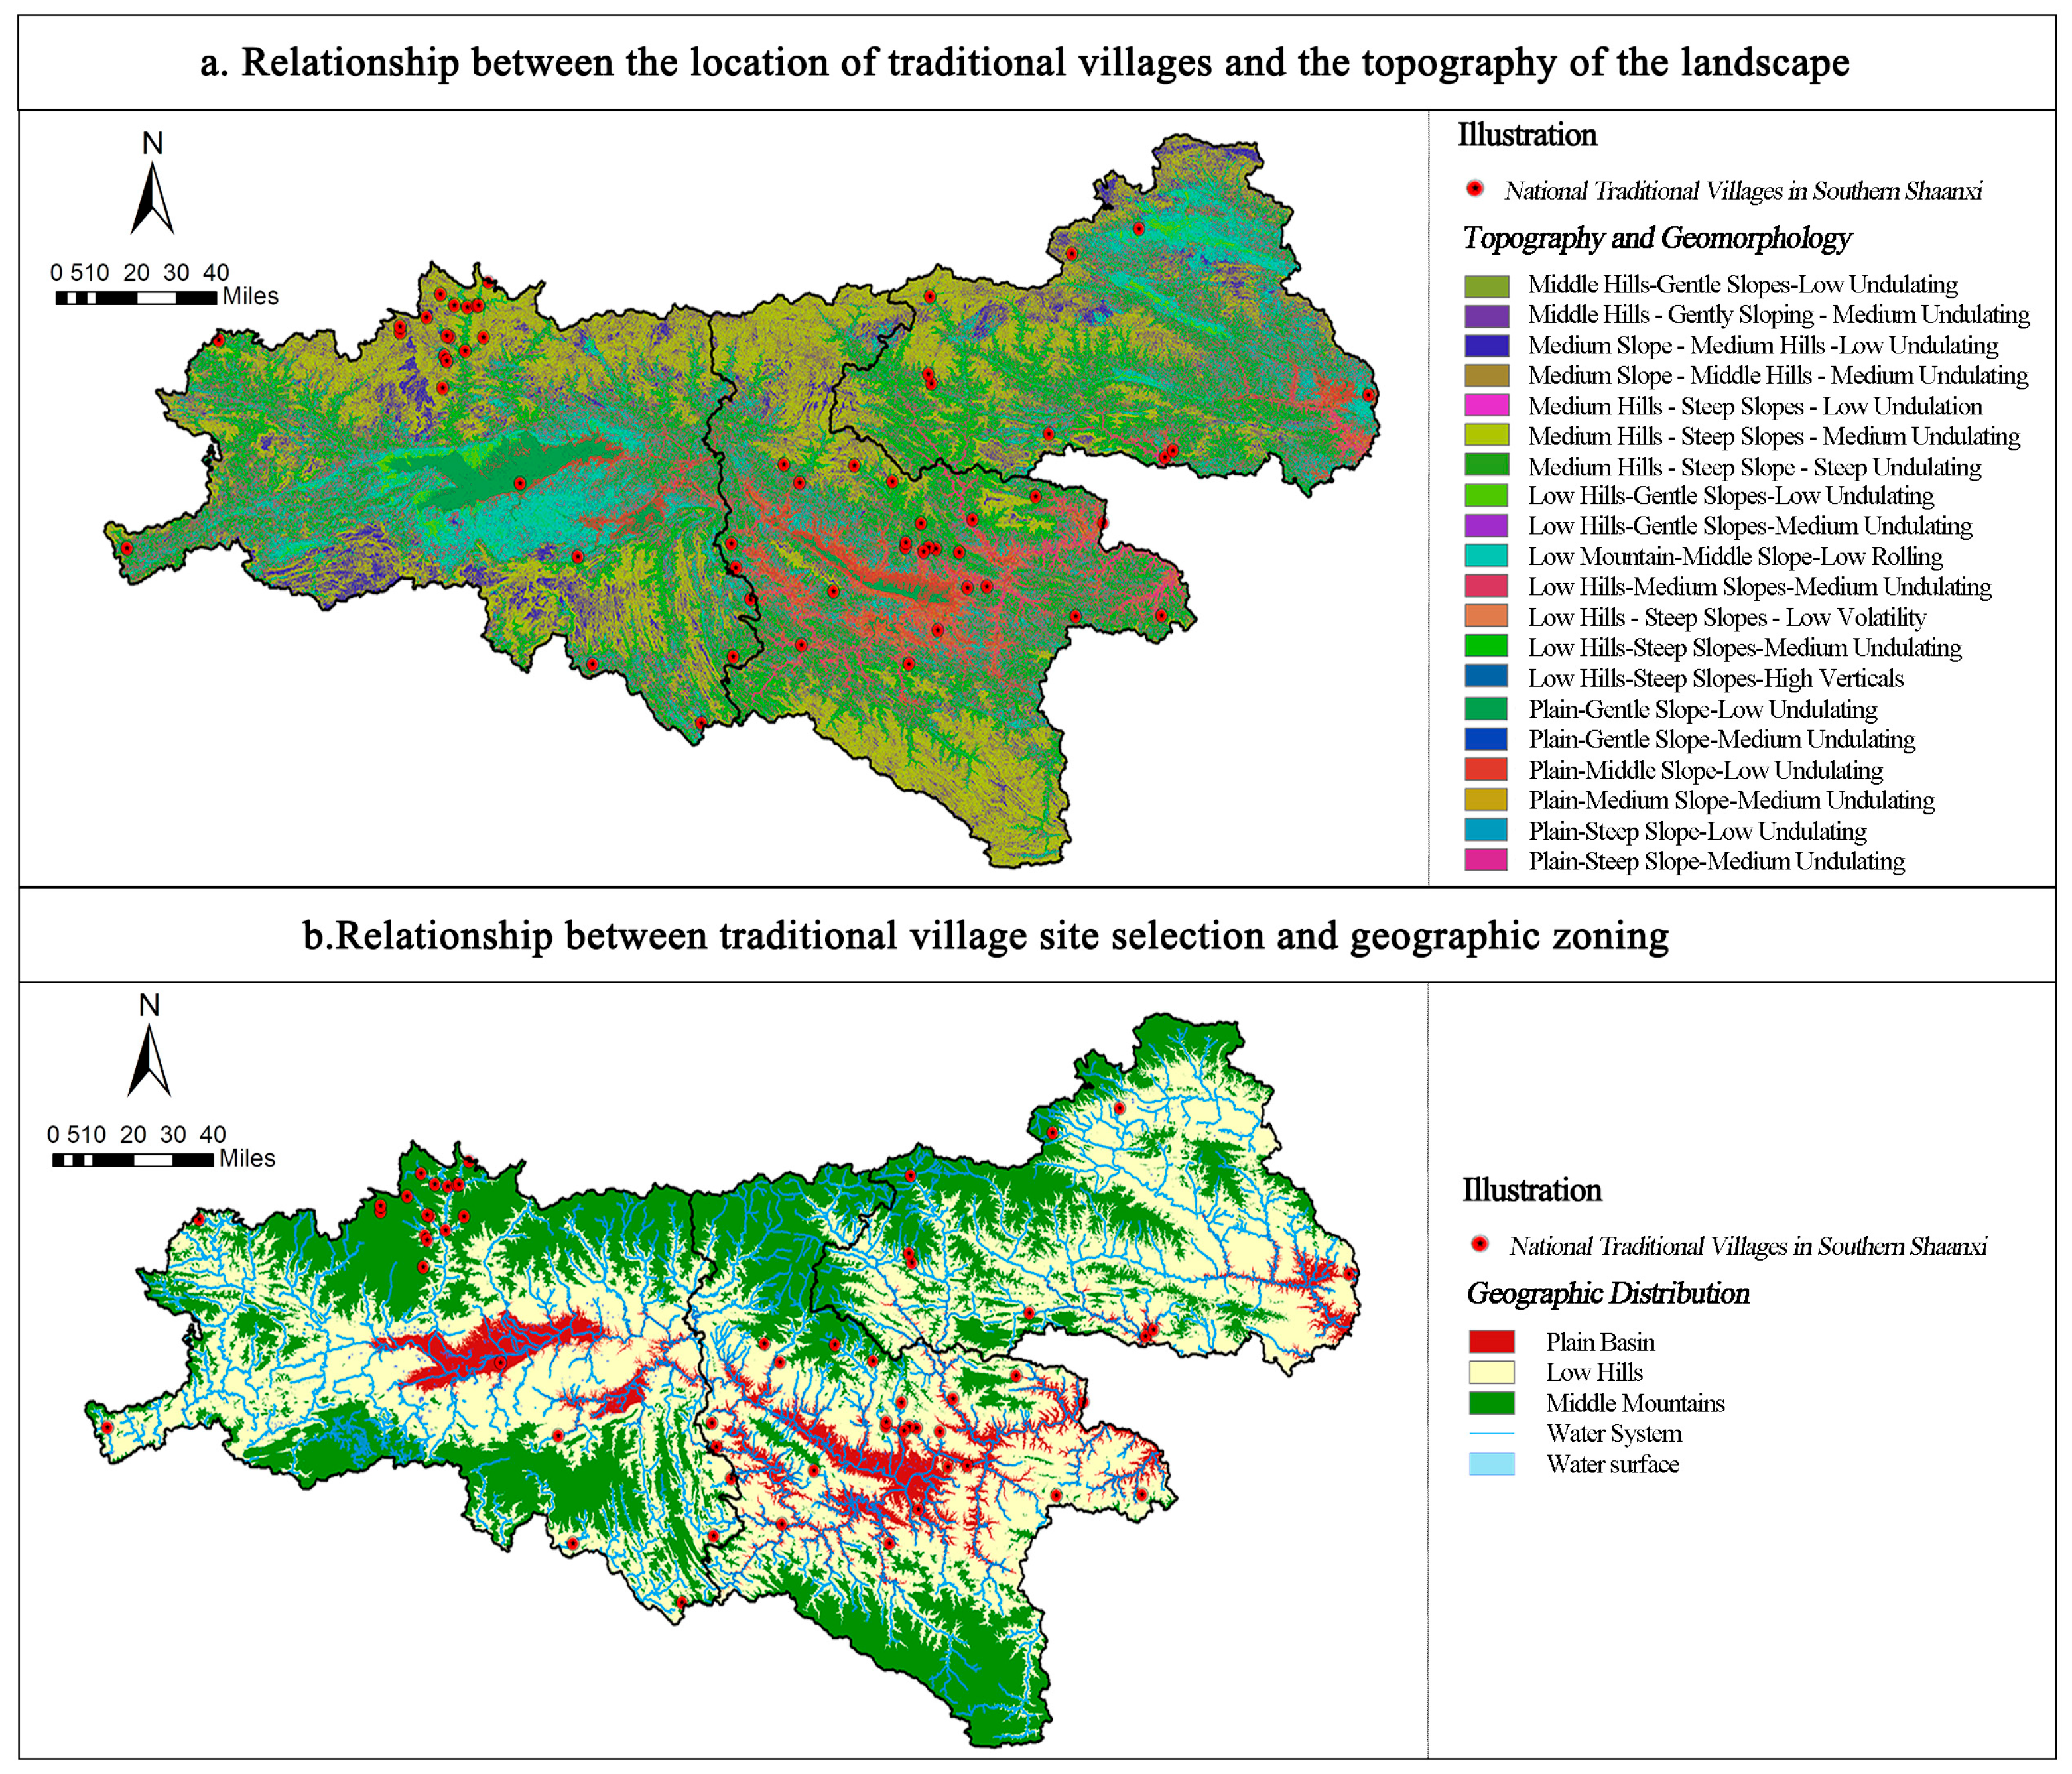
The Qinba Mountain area in southern Shaanxi, situated at the intersection of the Qinling and Daba Mountains, is predominantly mountainous, with fragile ecology and relatively backward economic development (Figure 2). This region boasts numerous traditional villages rich in cultural heritage and unique spatial layouts, but they also face challenges such as urbanization, ecological degradation, and cultural heritage loss. This study selects 57 national traditional villages in the Qinba Mountain area as the research objects. Their site selections cover the three major typical geographical units in the study area: 9 plain basin villages, 44 low-mountain hilly villages, and 3 mid-mountain villages (Figure 3). Additionally, the samples also cover the three major disaster risk zones defined in the “Traditional Village Protection Plan of Shaanxi Province,” ensuring the regional representativeness of the research conclusions and the universality of the findings.

2.3. Resilience Evaluation and Analysis Methods

Based on socio-ecological resilience theory, the resilience evaluation model constructs the Terrain Adaptability Index (TAI), Hazard Exposure Index (HEI), and Ecological Sensitivity Index (ESI) from the aspects of natural factors, ecological factors, and resource endowment, which together form the Comprehensive Resilience Index (CRI). To ensure the scientific reliability of each index model, this study adopts a combination of statistical analysis and spatial models to systematically verify the model’s rationality and explanatory power.

2.3.1. Data Preprocessing and Standardization

To ensure comparability among indicators with different units and to minimize subjective interference, all raw input data were standardized to the [0,1] range using the range method:
Z i j = X i j X m i n X m a x X m i n   ( positive indicators )
Z i j = X m a x X i j X m a x X m i n   ( negative indicator )
This procedure guarantees consistency across indices and avoids unit dependency.
Indicator polarity was explicitly defined (Table 1):
Positive indicators (higher values indicate higher risk/suitability): slope aspect (SD), vegetation coverage (FVC), soil erosion intensity (SEI), disaster density (D), edge bandwidth effectiveness (B), elevation risk (H).
Negative indicators (higher values indicate lower suitability, reversed during standardization): elevation (H), slope (S).
For missing values (<1% of all samples), the mean value of villages within the same geomorphological type was used. For tied values, standardized scores were kept equal across villages to avoid artificial rank bias.
The basic spatial analysis unit was the village polygon, derived from the official vector database of the Ministry of Housing and Urban–Rural Development. For disaster risk and ecological barrier analyses, supplementary spatial representations (village centroid and 100 m buffer zone) were used. Sensitivity testing showed consistent CRI results across different spatial units, ensuring robustness.

2.3.2. Terrain Adaptability Index (TAI)

The TAI evaluates the suitability of traditional village locations for terrain conditions, constructed based on three terrain factors: elevation, slope, and aspect. Elevation and slope characterize terrain constraints on residential and production activities, while aspect reflects the optimization potential of local microenvironments, collectively forming the village’s adaptability to complex mountain environments. The entropy weight method is used to objectively assign index weights, and the calculated TAI model is
TAI = 0.327⋅(1 − Zelevation) + 0.365 (1 − Zslope) + 0.308 Zaspect
where Zelevation and Zslope are reverse indicators, meaning higher values indicate lower suitability; Zaspect is a positive indicator, with higher values indicating higher suitability. The TAI ranges from 0 to 1, with higher values indicating stronger terrain adaptability.

2.3.3. Hazard Exposure Index (HEI)

The HEI quantifies the natural disaster risks faced by traditional villages, constructed by integrating three indicators: disaster density (D), edge band effectiveness (B), and elevation risk (H), reflecting disaster occurrence probability and ecological barrier protection capabilities. Disaster density (D) is calculated using the kernel density estimation method, inputting disaster points into ArcGIS, outputting density raster units with a 5 km search radius and standardizing the results. Edge bandwidth effectiveness (B) is based on MSPA to extract ecological edge zones and generate a 100 m buffer. By overlaying disaster points, the bandwidth coefficient is calculated by statistically analyzing the proportion of disaster points within the edge zone. After standardization, higher values indicate weaker barrier effects of the edge zone against disasters. Elevation risk (H) is categorized into low, medium, and high levels based on altitude, with higher values indicating greater risk after standardization. Weights are determined through principal component analysis combined with expert scoring. The HEI formula is as follows:
HEI = 0.397 D + 0.302 B + 0.301 H
where D, B, and H are standardized to 0–1 values, with higher HEI indicating greater disaster exposure risk.

2.3.4. Ecological Sensitivity Index (ESI)

The ESI quantifies the potential pressure of traditional village locations on natural ecosystems and their ecological background conditions, mainly constructed based on two core indicators: vegetation coverage (FVC) and soil erosion intensity (SEI). FVC reflects the stability of the surface ecosystem and biodiversity maintenance capacity, while SEI characterizes land degradation risks, collectively reflecting the sensitivity and recovery capacity of the ecosystem. FVC is calculated from 2020 Landsat 8 remote sensing images using the Normalized Difference Vegetation Index (NDVI). SEI is based on the Revised Universal Soil Loss Equation, classified into five levels (very slight, slight, moderate, severe, very severe) according to the “Soil Erosion Classification and Grading Standards,” with higher values indicating greater sensitivity after standardization. The entropy weight method is used to assign indicator weights, and the calculated ESI formula is
ESI = 0.621 ZFVC + 0.379 ZSEI
where ZFVC and ZSEI are standardized values of vegetation coverage and soil erosion intensity, respectively. Higher ESI values indicate greater ecological sensitivity.

2.3.5. Comprehensive Resilience Index (CRI)

The CRI integrates TAI, HEI, and ESI to systematically evaluate the comprehensive resilience level of villages under the interaction of natural–social systems (Table 1).
Weight assignment and verification: Weights for TAI, HEI, and ESI are determined as 0.4, 0.3, and 0.3, respectively, through the analytic hierarchy process (AHP), incorporating independent scoring results from 15 experts in urban planning, architecture, and ecology, and referencing the priority ranking of resilience factors for mountainous villages in existing studies. The consistency check shows a consistency ratio (CR) of 0.021, less than 0.1, meeting reliability requirements.
Formula Construction and Standardization:
CRI = 0.4 * TAI + 0.3 * (1 − HEI) + 0.3 (1 – ESI)
where TAI, HEI, and ESI are standardized to 0–1 continuous values. Higher CRI indicates stronger comprehensive village resilience.

2.4. Morphological Spatial Pattern Analysis (MSPA)

MSPA is a landscape pattern analysis method based on image processing, comprising four technical modules: data preprocessing, parameter optimization, spatial interpretation, and correlation analysis. It is mainly used for morphological classification, systematically identifying the distribution characteristics of landscape elements such as ecological core areas and edge zones, as well as their constraint effects on village site selection.
The MSPA in this study utilizes Guidos Toolbox 3, based on the 30 m resolution GlobeLand30 land cover data from 2020. Forest, grassland, and water areas are extracted as the foreground, while other land types such as cropland and construction land are set as the background to generate binary raster data. MSPA parameter settings are based on the characteristics of the study area and validations from existing literature, fully considering the topographic complexity and village scale features of the study area (Table 2). The core area threshold is set to 5 hectares, referencing the official recommendations of Guidos Toolbox and studies on minimum patches of mountain ecological core areas by Guo [27]. The edge bandwidth is set to 100 m, based on the average village size of 50–100 households in southern Shaanxi and the width of topographic transition zones. Connectivity rules adopt 8-neighborhood to adapt to the boundary continuity of complex terrain. The operation process includes the following: (1) extracting forest, grassland, and water areas as the foreground from GlobeLand30 data; (2) generating landscape elements such as core areas and edge zones using the Morphological Mapper module of Guidos Toolbox 3.0; (3) overlaying disaster points and village points to analyze the disaster barrier effects of ecological barriers.

2.5. Village Resilience Factor Interaction Analysis Method

To systematically analyze the relationships among TAI, HEI, ESI, and their action mechanisms on CRI, the study uses the Geographical Detector model and Pearson correlation based on data from 57 traditional villages in the Qinba Mountains to calculate single-factor q-values and interactive q-values, determining nonlinear enhancement or two-factor enhancement effects and pairwise correlations among TAI, HEI, and ESI.

3. Results

3.1. Spatial Differentiation Characteristics of Resilience

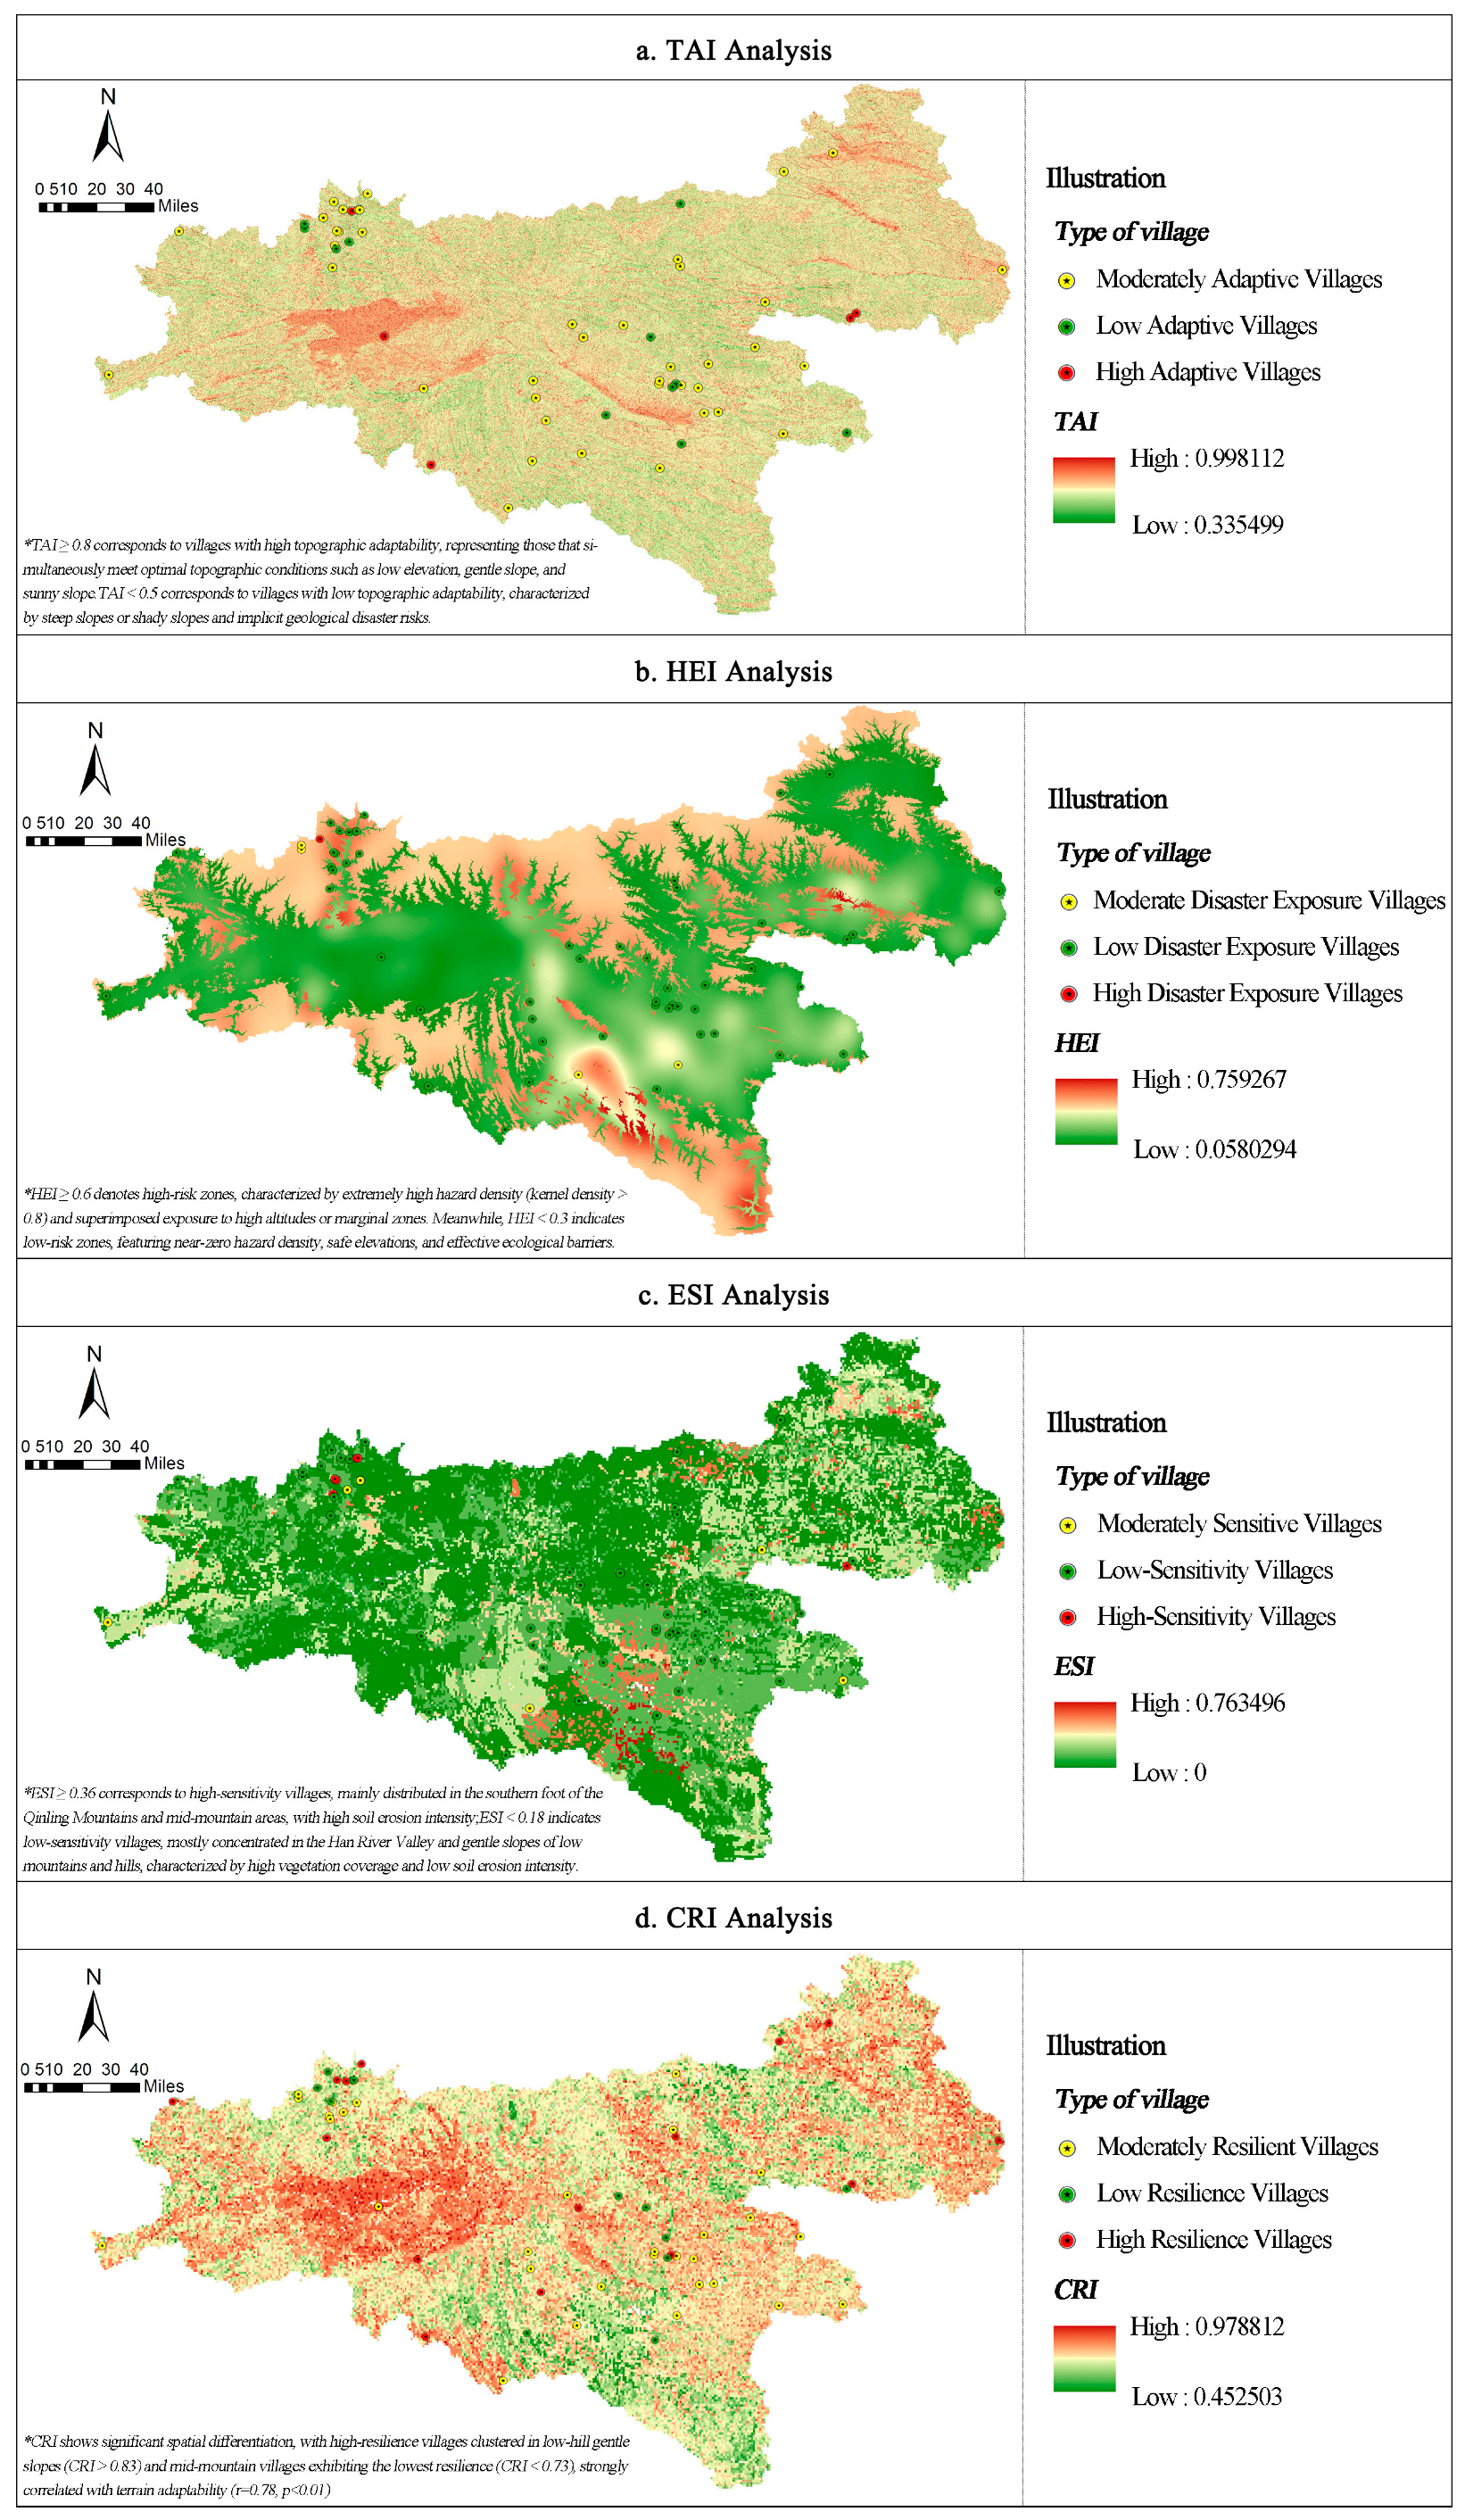
The results show that the CRI of mountain villages in the Qinba Mountains of southern Shaanxi ranges from 0.605 to 0.958, with significant differentiation characteristics (Figure 4). Based on the CRI calculation results and the coupling relationships among sub-models, the study systematically classifies village resilience into three levels: high, medium, and low.
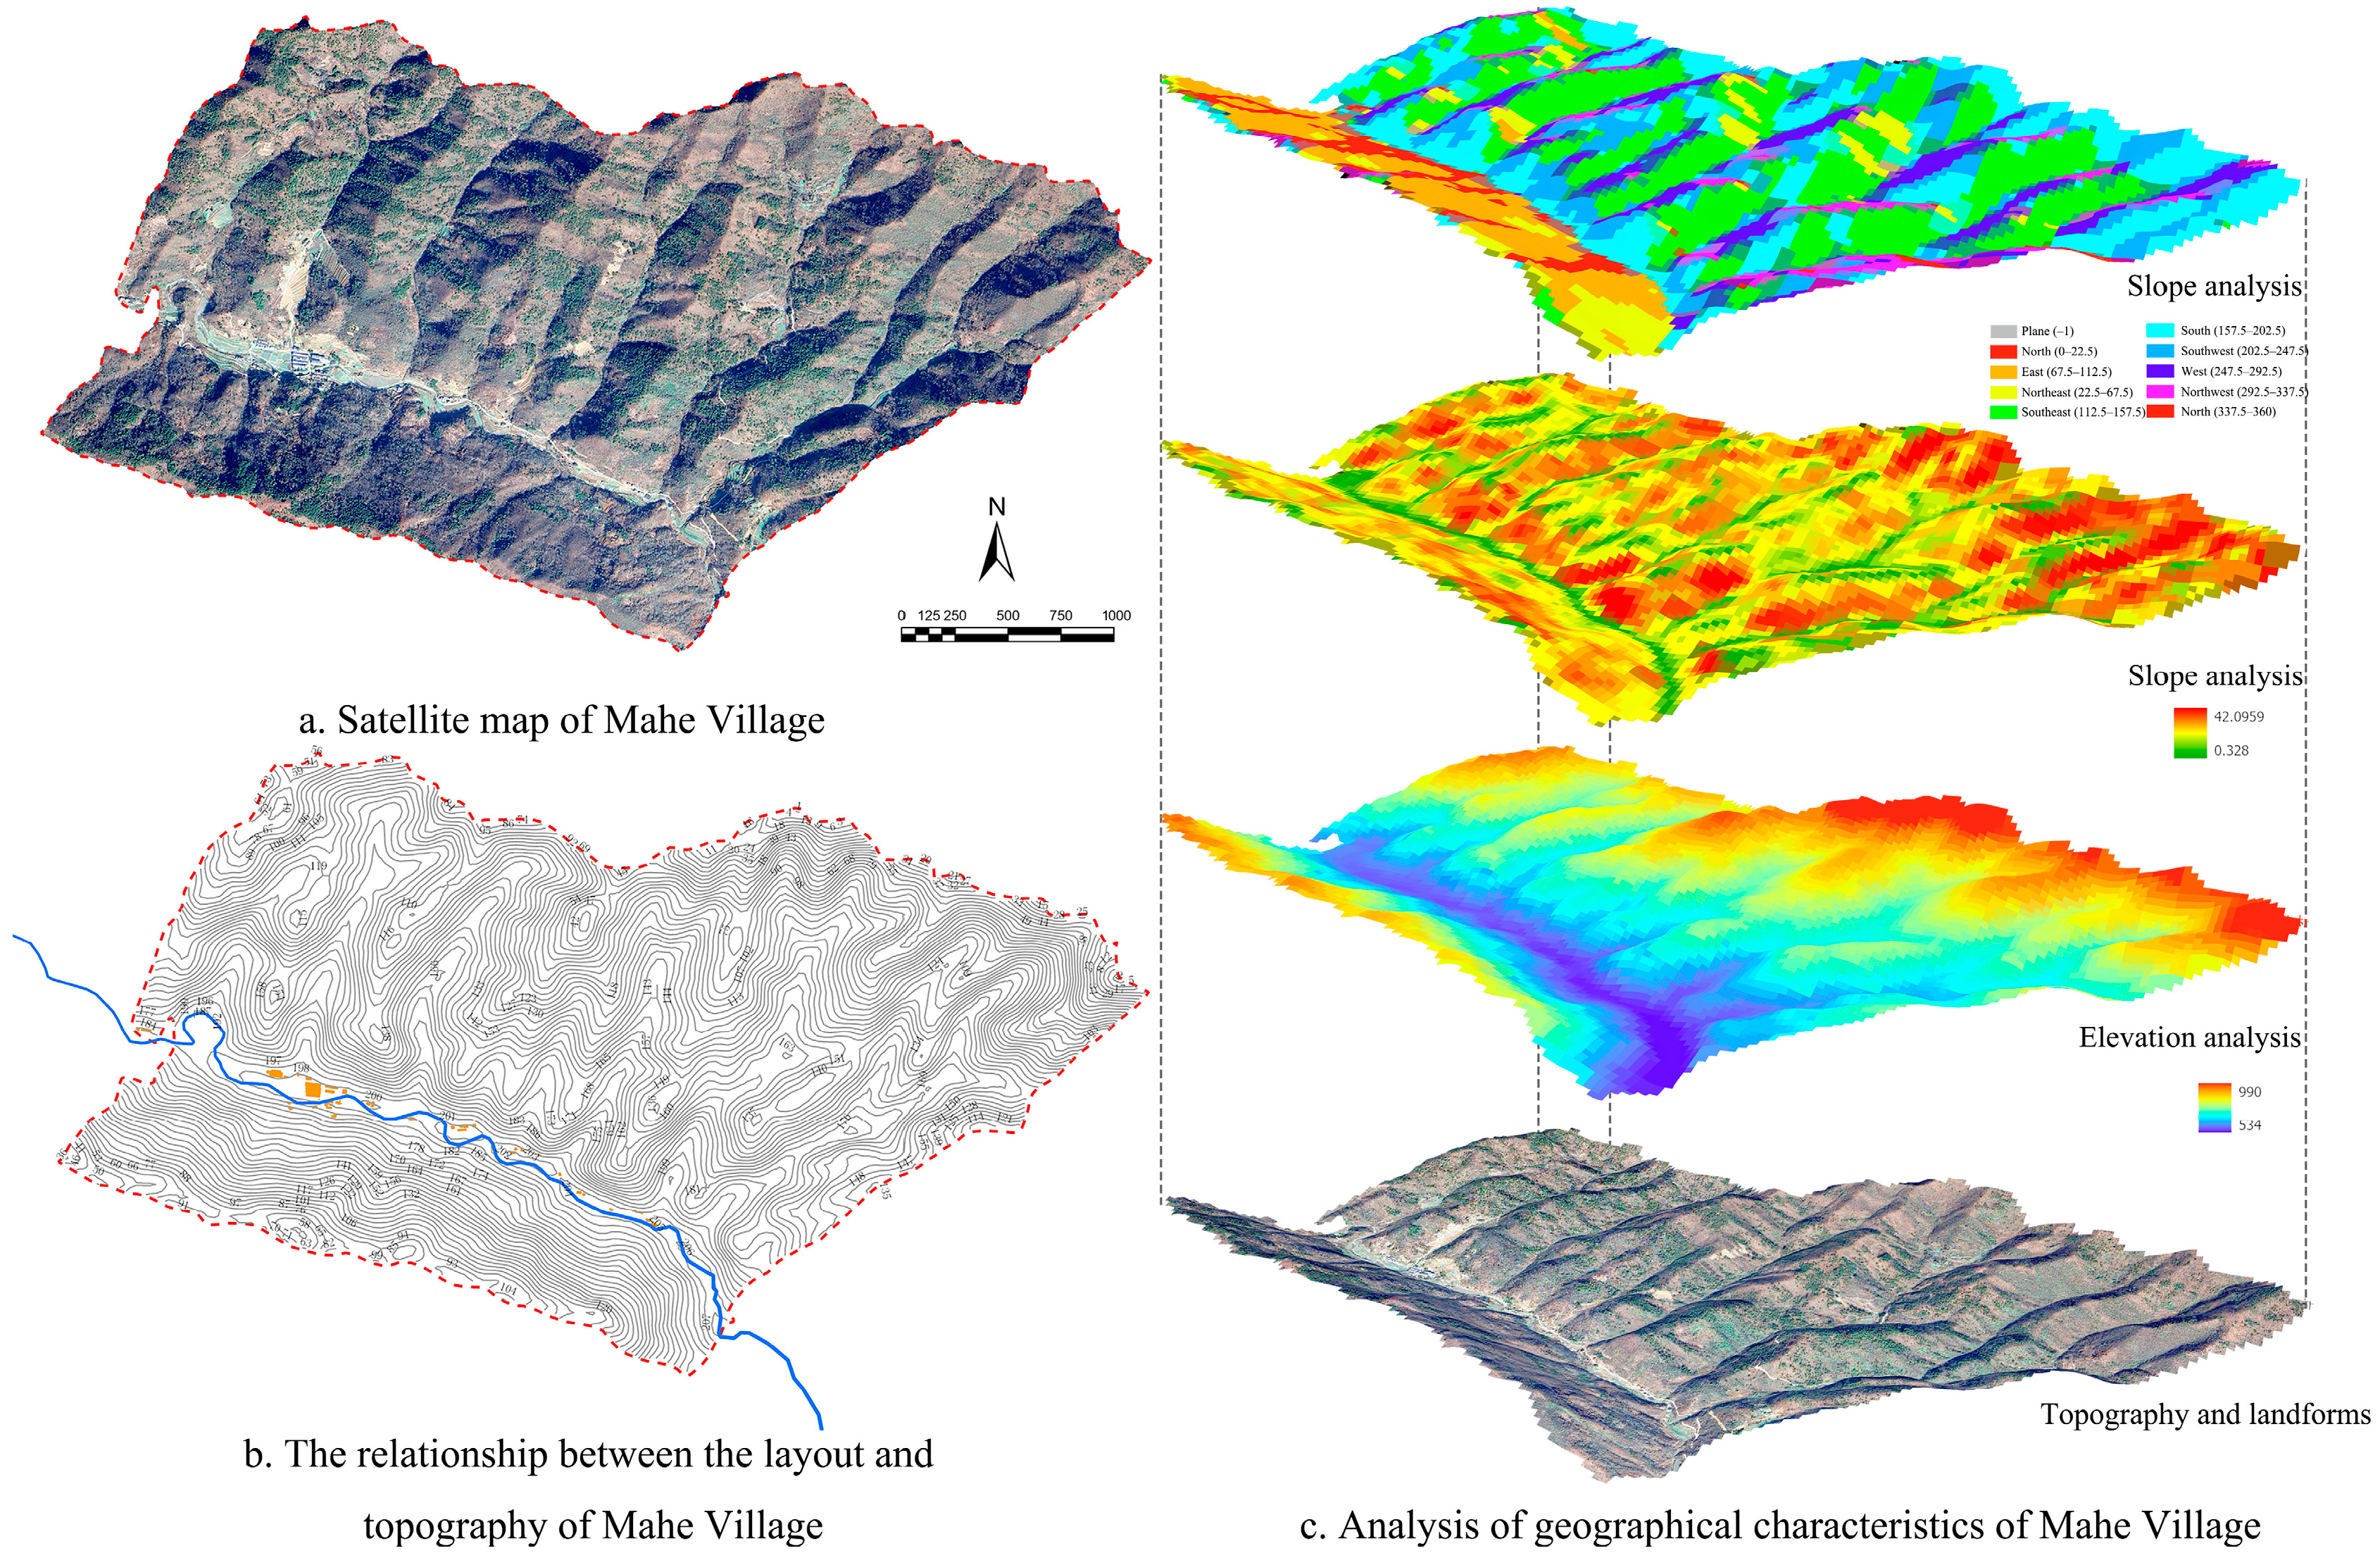
High-resilience villages: With a CRI ≥ 0.83, accounting for approximately 35.1% of the total, these are concentrated in low-mountain, hilly, gentle-slope areas at elevations of 550 m to 1200 m. These areas generally have a TAI > 0.8, HEI < 0.2, and ESI approaching zero. For example, Yangjiaying Village in Zhenba County, Hanzhong City y (Figure 5a), has a CRI of 0.958, the highest in the study area. Sited on a gentle slope of 6.79° at an elevation of 570 m, it exhibits a TAI of 0.86 and a HEI of 0.078, demonstrating efficient disaster risk avoidance through terrain optimization.
Among them, the high-resilience villages, with a CRI value of 0.83 or higher, account for approximately 35.1% of the total number of villages studied. They are concentrated in the gentle-slope areas of low mountains and hills with an altitude ranging from 550 m to 1200 m. In such regions, the TAI is generally higher than 0.8, the HEI is lower than 0.2, and the ESI is close to zero. Taking Mahe Village as an example (Figure 5), its CRI value reaches 0.830. The village is located on a gentle sunny slope at an altitude of 576.67 m, with a slope of only 6.21°, a TAI value of 0.72, and an HEI value as low as 0.121, demonstrating the efficient ability of terrain optimization to avoid disaster risks.
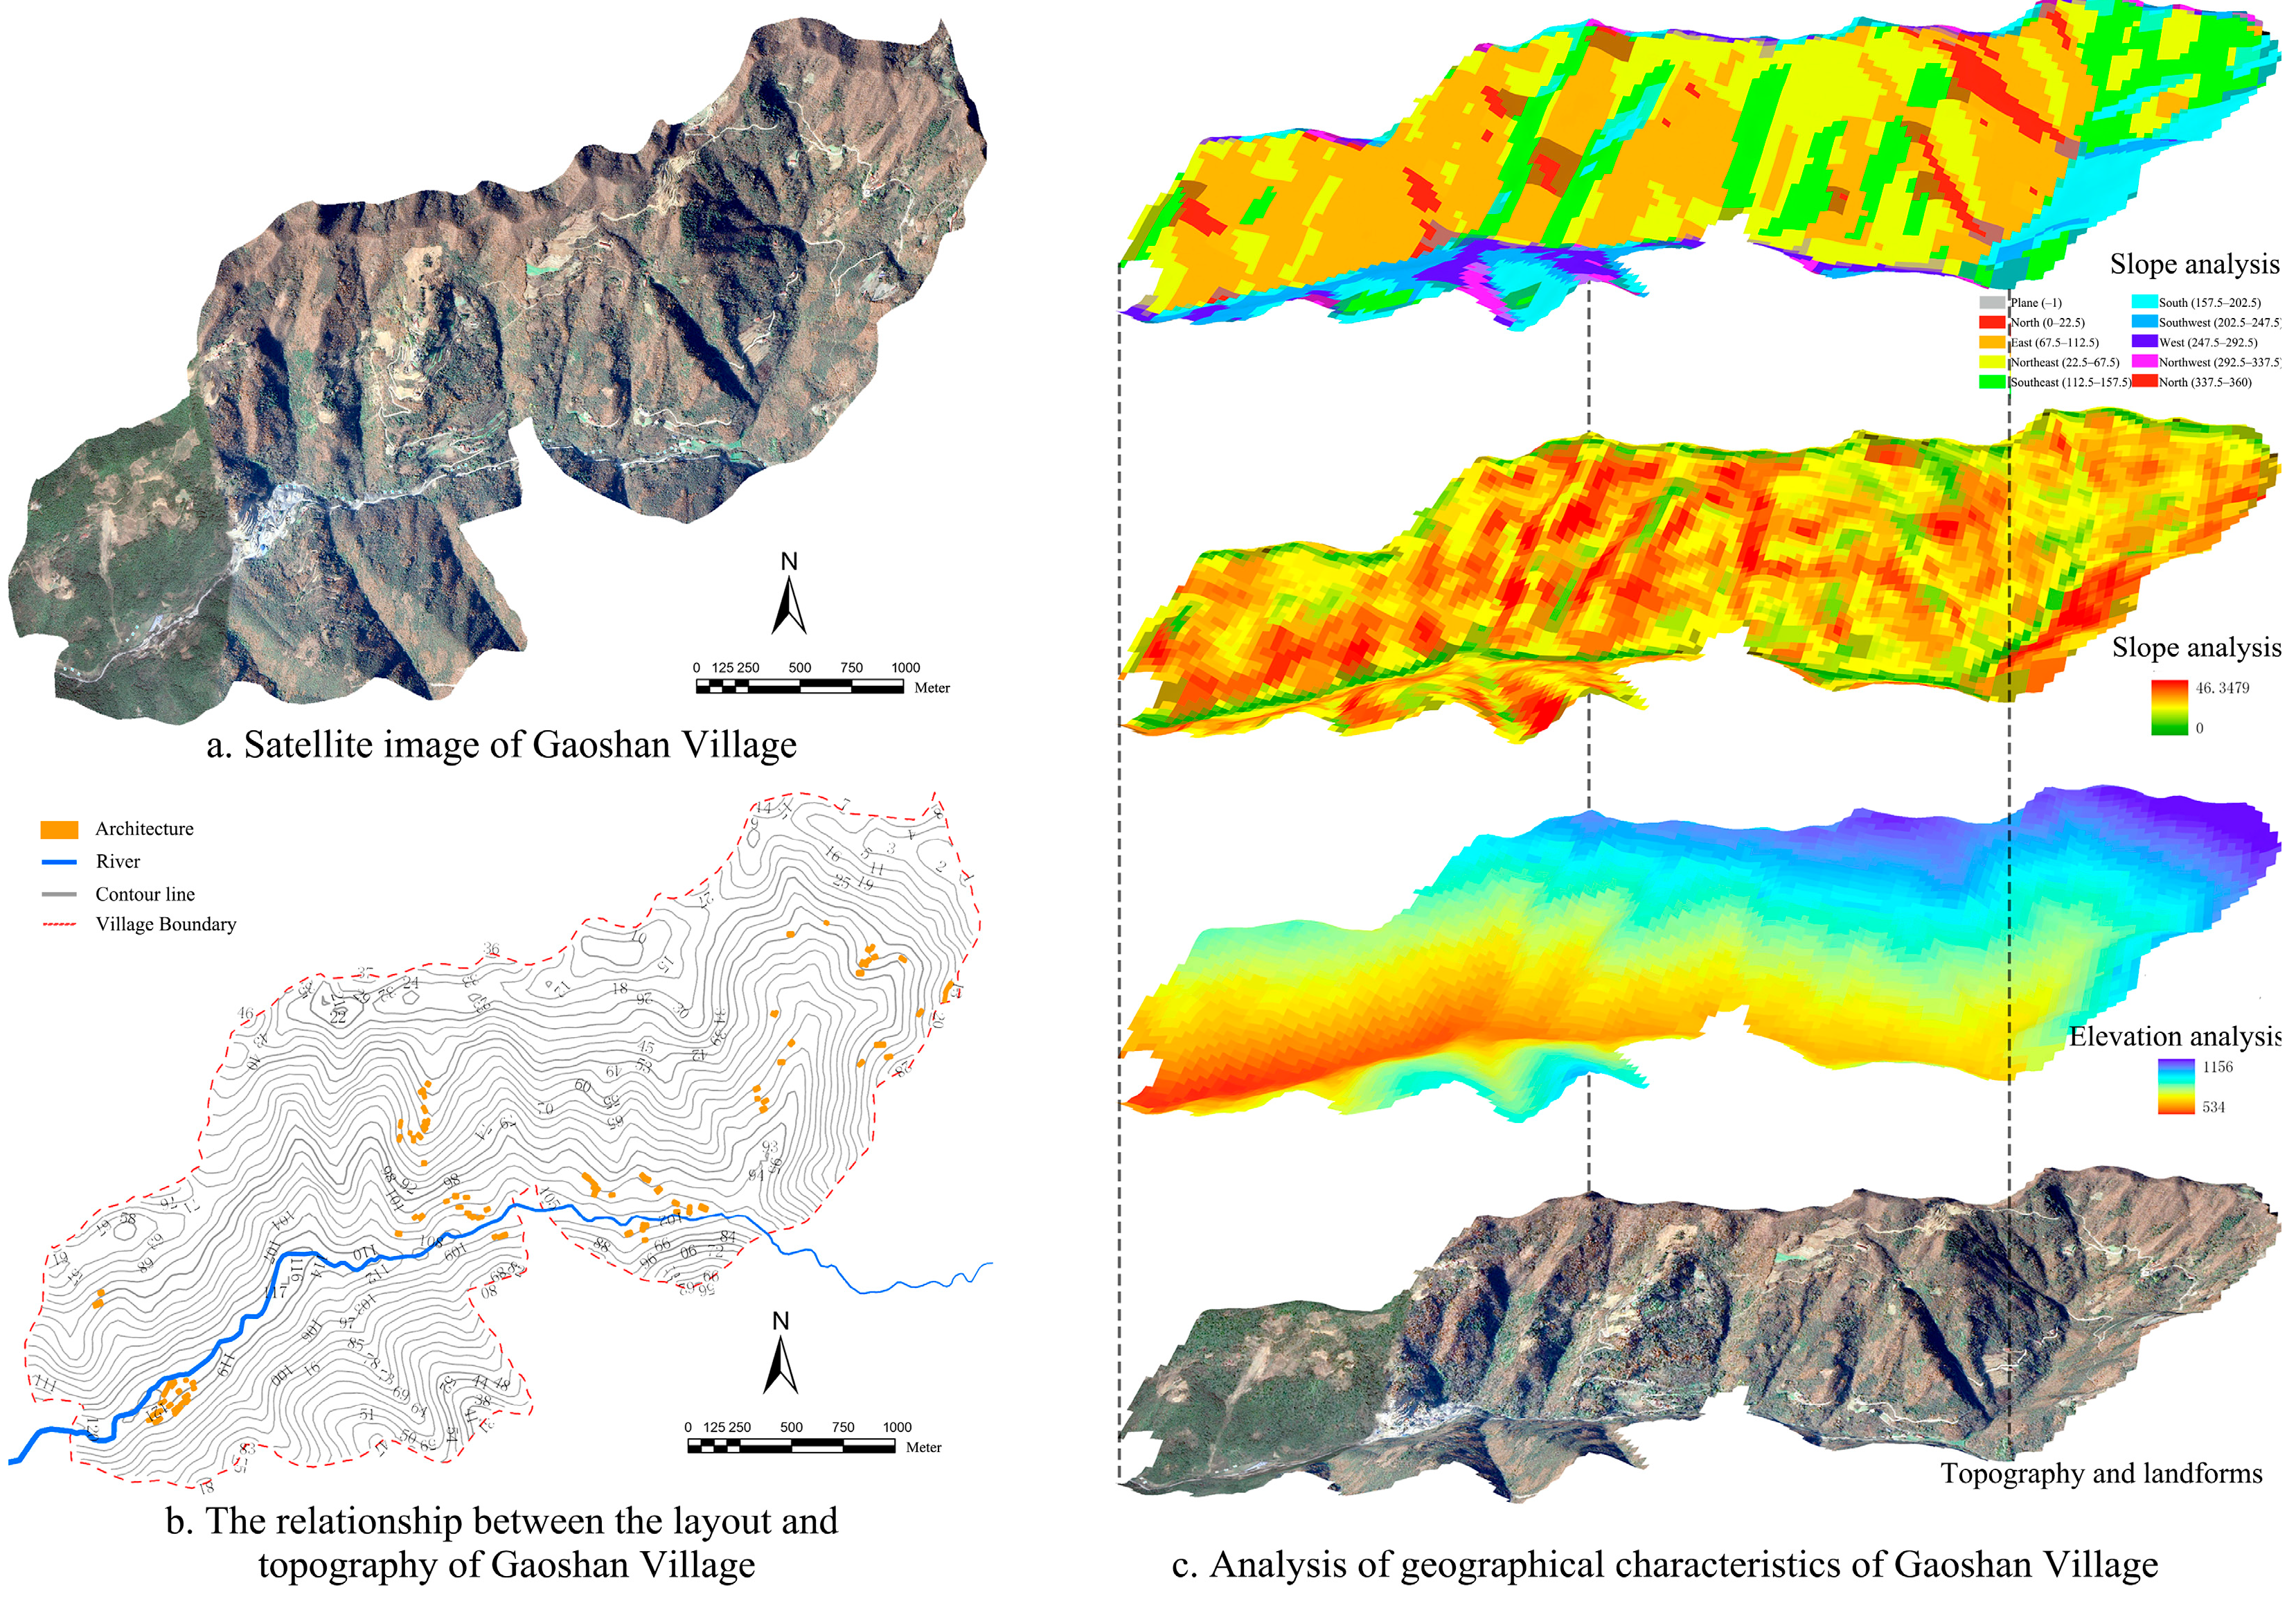
Medium-resilience villages, with a CRI value ranging from 0.73 to 0.83, account for approximately 46.4% of the total number of villages studied. Most of these villages have a single risk shortcoming, such as a HEI between 0.2 and 0.3 or an ESI reaching 0.2 to 0.3. However, they partially mitigate risks through terrain adaptability or social collaboration. Taking Gaoshan Village as an example (Figure 6), its CRI value is 0.816, TAI value is 0.69, and HEI value is 0.137. Although its ecological sensitivity is relatively low, it still needs to improve overall resilience through ecological restoration.
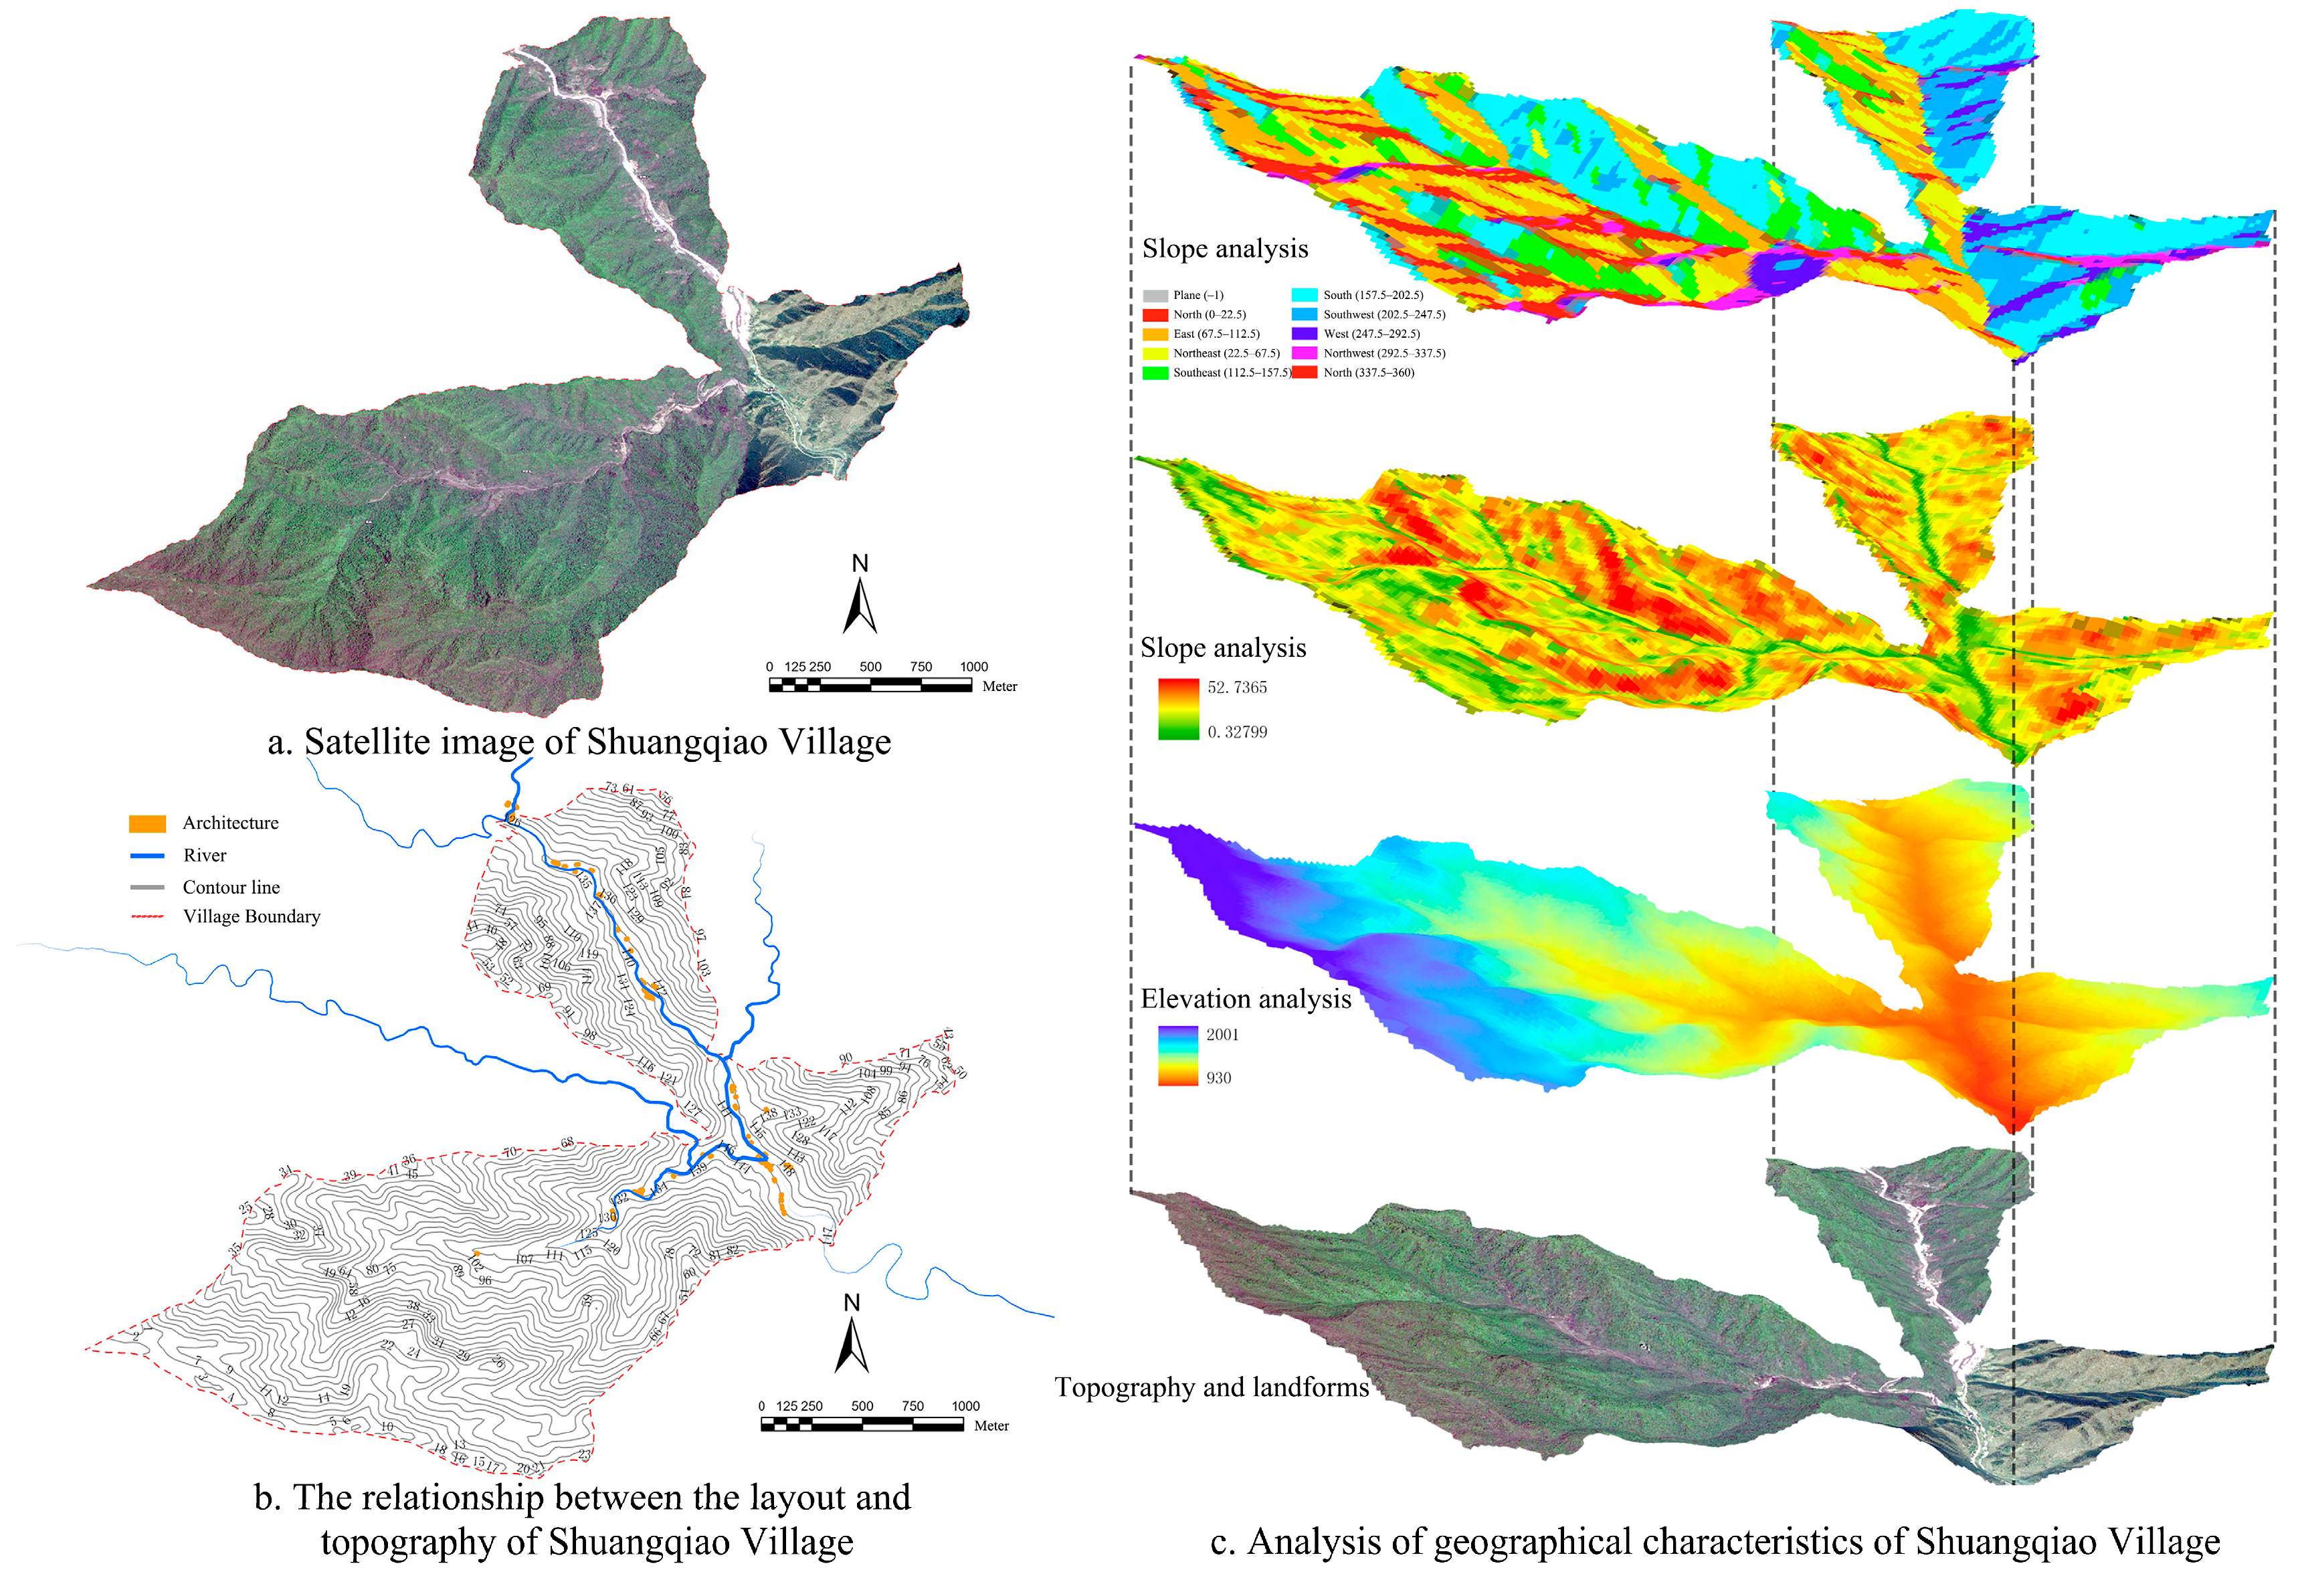
Low-resilience villages, with a CRI value of less than 0.73, account for approximately 12.3% of the total number of villages studied. They are mostly distributed in mid-mountainous areas above 1200 m above sea level or in ecologically fragile zones on the southern foothills of the Qinling Mountains. Such regions are subject to the dual constraints of steep terrain and ecological degradation, with TAI values generally below 0.6 or HEI values exceeding 0.3. For instance, Shuangqiao Village is situated in a mid-mountainous and hilly area, where mountains and waters interweave, resulting in complex terrain and exposure to the interactive impacts of multiple disasters (Figure 7). Moreover, spatial analysis indicates that there is a significant spatial overlap between low-resilience villages and areas with high ecological sensitivity.
Additionally, high-resilience villages are mostly distributed in regions with convenient transportation and abundant resources. These villages have well-organized communities, strong cultural heritage protection awareness, and diversified livelihood modes. In contrast, low-resilience villages are usually in remote mountainous areas, facing issues such as ecological fragility, backward infrastructure, and single livelihoods. From the perspective of social-ecological system resilience theory, high-resilience villages coordinate well in the three dimensions, effectively coping with external disturbances; low-resilience villages have obvious weaknesses in these dimensions, making them difficult to withstand natural disasters and external shocks, resulting in low spatial resilience. Comparative analysis of village types—plain-basin (9 villages, 15.8%), low-hill (44 villages, 77.2%), and mid-mountain (3 villages, 5.0%)—reveals distinct resilience patterns. Plain-basin villages, benefiting from low elevation (<550 m) and gentle slopes (<8°), exhibit the highest CRI (mean = 0.89). Low-hill villages, locating 83% outside the 100 m buffer of ecological cores, balance risks via the “edge-attachment” strategy (CRI mean = 0.81). Mid-mountain villages, constrained by high elevation (>1200 m) and steep slopes (>25°), show significantly lower resilience (CRI mean = 0.73), despite lower hazard exposure, confirming terrain’s dominant role in resilience formation. These findings provide a scientific basis for formulating targeted governance strategies.

3.2. Driving Mechanisms of Resilience Factors

The core driving mechanism of resilience spatial differentiation originates from the multidimensional coupling of terrain adaptability, disaster exposure, and ecological sensitivity. Through Geographical Detector model and Pearson correlation analysis, the study finds the following characteristics in traditional villages of the Qinba Mountains in southern Shaanxi: terrain adaptability dominates resilience spatial differentiation, social capital dynamically compensates for resilience weaknesses, “terrain–disaster–ecology” collaborative risks form spatial coupling effects, and there are multi-scale resilience coupling mechanisms.

3.2.1. Terrain Adaptability Dominates Resilience Spatial Differentiation

As shown in Table 3, the q-values of single-factor explanatory power calculated by the Geographical Detector model are ranked as TAI > HEI > ESI, all passing the significance test. This suggests that terrain adaptability is the primary factor influencing village resilience, followed by hazard exposure. Although ecological sensitivity has a weaker individual effect, it still imposes constraints on site selection.
The TAI, as the core driver of CRI, has a geographical detector model explanatory power q-value of 0.61, significantly higher than 0.58 for HEI and 0.49 for ESI. TAI is constructed through three factors: elevation, slope, and aspect. Quantitative results show that low-mountain, hilly, gentle-slope areas at elevations of 550 m to 1200 m with slopes below 15° have the optimal terrain adaptability. Taking Yangjiaying Village in Zhenba County, Hanzhong City, as an example, it is sited on a sunny slope at an elevation of 570 m with a slope of 6.79°, resulting in a TAI of 0.86, HEI of 0.078, and CRI of 0.958. The disaster loss rate is 41% lower than that of steep slope villages. In contrast, Zhujiawan Village in Zhashui County, Shangluo City, with a slope of 18.3° and TAI of only 0.46, has a CRI of 0.845 despite a low HEI of 0.068. This spatial differentiation confirms the traditional village construction wisdom of choosing gentle slopes, highly consistent with the disaster prevention principle of “residing in silt accumulation areas rather than flood channels” recorded in the «Shuijingzhu». It indicates that terrain conditions directly dominate the formation of resilience patterns through natural barrier effects and microclimate optimization.

3.2.2. Dynamic Compensation of Resilience Weaknesses by Social Capital

Field surveys reveal that in representative villages, villagers effectively reduce the impact of disasters through mutual assistance, with clan networks, collective actions, and traditional knowledge systems playing a key role in dynamically compensating for natural constraint weaknesses. For example, Nianzi Village in Zhenba County, Hanzhong City y (Figure 8), despite a moderate TAI of 0.64, significantly reduces its HEI to 0.131 and enhances its CRI to 0.894 by relying on a hierarchical drainage system constructed by clan networks, such as stone retaining walls and diversion channels. This practice reveals that social capital can optimize resilience performance at the micro-scale through risk-sharing and resource integration mechanisms. The study further finds that 57% of high-resilience villages (CRI ≥ 0.85) adopt the traditional “house–field–forest” vertical spatial layout, which mitigates flood impacts through stepped land use and reduces disaster loss rates. This phenomenon resonates with Zheng and Chou’s theory of social capital enhancing resilience [36], indicating that social network collaboration and traditional knowledge systems can dynamically balance the rigid constraints of natural systems, forming a composite resilience mechanism combining natural barriers and social reinforcement.

3.2.3. Spatial Coupling Effect of “Terrain–Disaster–Ecology” Collaborative Risks

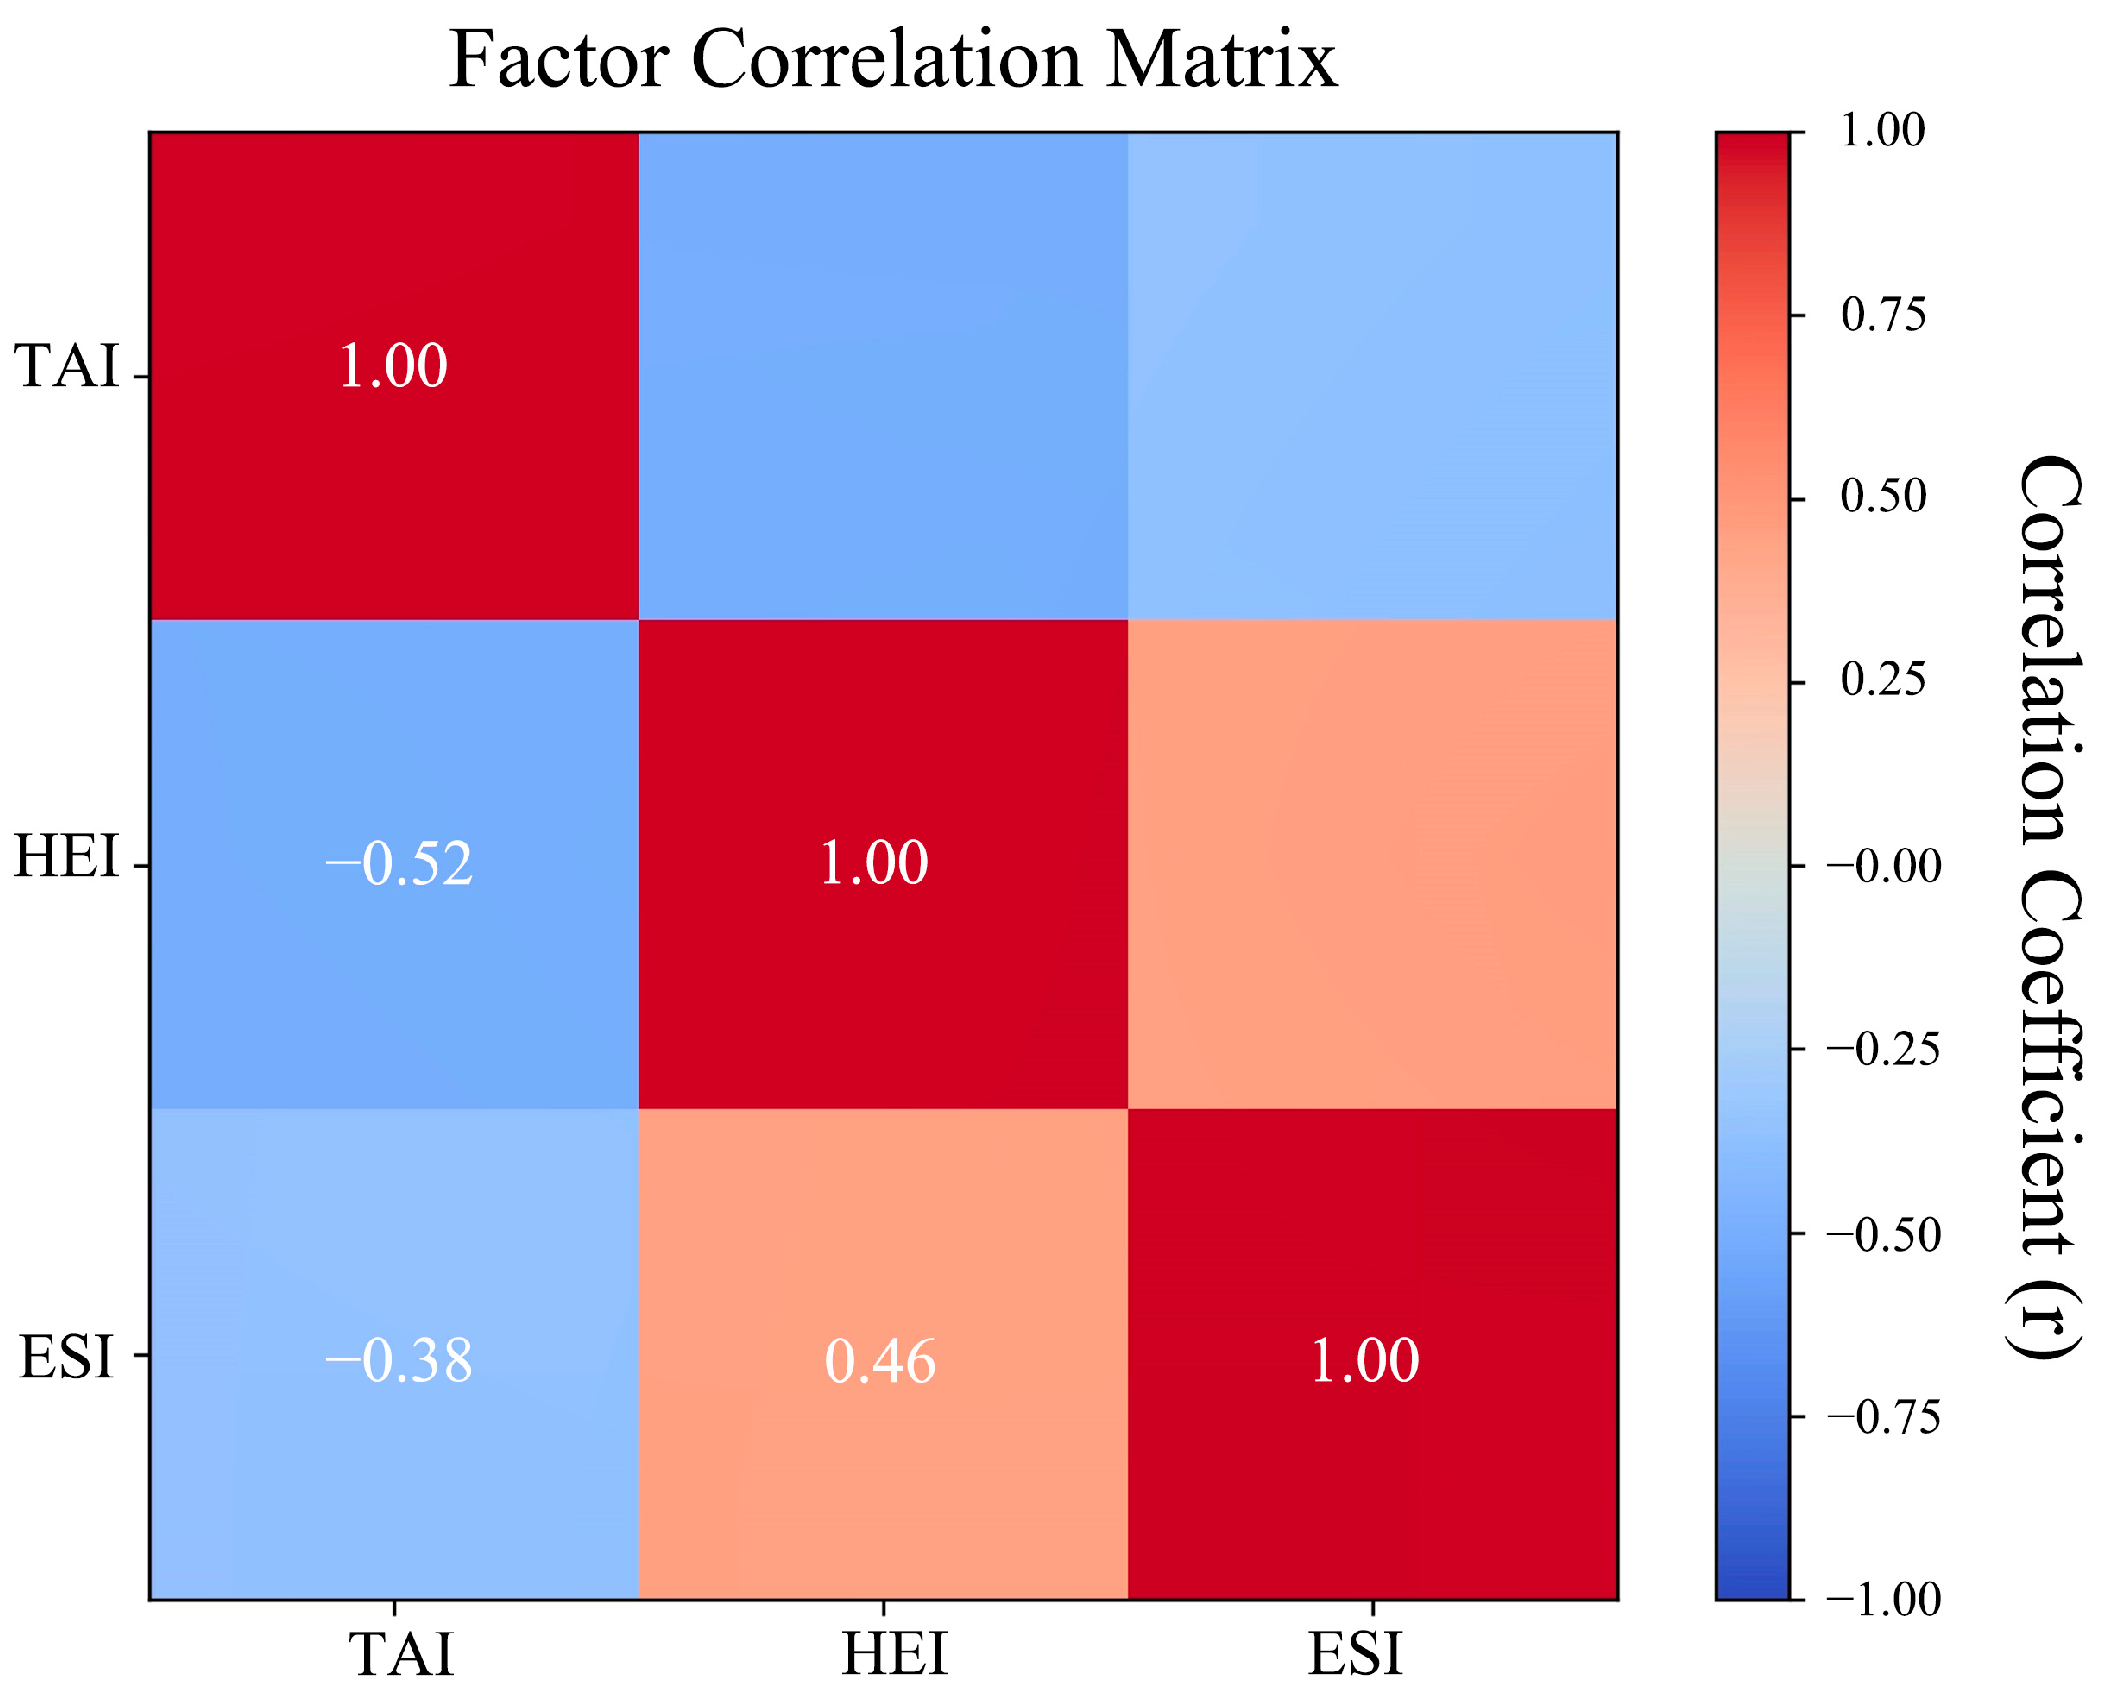
The spatial resilience of traditional villages is determined by the multi-dimensional interactions among terrain adaptability, hazard exposure, and ecological sensitivity. Pearson correlation analysis and the geographic detector model can deeply reveal the coupling mechanisms among these three factors. Pearson correlation analysis shows that TAI and HEI are significantly negatively correlated with each other, with a correlation coefficient of −0.52 and significant at the 0.01 level, which implies that the more favorable the terrain conditions are, such as on gentle slopes and sunny slopes at low altitudes, the lower the risk of disaster exposure, fully reflecting the natural barrier effect of terrain on disasters; HEI and ESI are positively correlated with each other, with a correlation coefficient of 0.46 and significant at the 0.01 level, indicating that ecologically sensitive areas, such as those with degraded vegetation and serious soil erosion, are more susceptible to natural hazards, and that the two form a risk-overlapping effect; TAI is weakly negatively correlated with HEI, with a correlation coefficient of −0.38 and significant at the 0.05 level, reflecting that the ecological background is relatively well preserved in areas with complex topography with less interference from human activities, but excessively steep topography may also exacerbate ecological vulnerability (Figure 9).
Geographical Detector interaction analysis further shows that the interactive q-value between TAI and HEI is 0.79, showing a nonlinear enhancement effect, where terrain adaptability significantly reduces the negative impact of hazard exposure risks (Table 4). For example, in areas of high terrain resilience, through the implementation of micro-terrain modification measures, such as terracing and the placement of diversion channels, the impact of risk can be effectively offset and a high level of overall resilience can be maintained, even in the face of moderate disaster risk; The interaction q-value between disaster exposure and ecological sensitivity was 0.72, which also showed a nonlinear enhancement effect, and ecological degradation would further amplify the disaster risk, forming a vicious cycle of “ecological vulnerability → enhanced disaster response”; The interaction q-value between TAI and ESI is 0.68, indicating a bifactor enhancement effect, where the interaction of terrain conditions and ecological sensitivity has an additive effect on resilience. Regions with both low terrain adaptability and high ecological sensitivity exhibit significantly higher composite vulnerability than those with single factors.
This synergistic coupling mechanism exhibits significant spatial overlap in traditional villages in the Qinba Mountain area of southern Shaanxi. For example, the ancient town community in Manchuanguan Town, Shanyang County, Shangluo City, has a TAI of 0.84, indicating good terrain suitability, but long-term human activities have led to an ESI of 0.554, significantly higher than the regional average of 0.28, reflecting the degradation of vegetation buffer functions in the ecological edge zone. Despite a HEI of 0.119, indicating moderate risk, the disaster density within its 100 m buffer zone is 42% higher than that outside the core area, resulting in a CRI of only 0.727, lower than the average of 0.85 for villages in similar terrain. This verifies the synergistic risk mechanism where increased ecological sensitivity exacerbates disaster exposure. Hexi Village in Liuba County, Hanzhong City, located at the edge of mid-mountains, has a TAI of 0.70, indicating moderate terrain adaptability. However, situated in an ecologically sensitive area at the southern foot of the Qinling Mountains, it has an ESI of 0.497. During the “8.11” rainstorm event in 2018, the village, adjacent to degraded woodlands with a vegetation retention rate of only 23% in the core area buffer zone, suffered mudslides that damaged 12 residences. MSPA shows that the village did not strictly adhere to the “core avoidance” strategy, offsetting its terrain advantages with the interactive effects of ecology and disasters, resulting in a low CRI of 0.605. This highlights the composite constraint effect of three-dimensional factors. Conversely, Gaoshan Village in Hanbin District, Ankang City, with a TAI of 0.69, HEI of 0.137, and ESI of 0.124, adopted the “edge-attached, core-avoided” strategy. Sited outside the 100 m buffer zone of the ecological core area, it retains a complete “house–field–forest” vertical layout, with core areas accounting for 68% of the surrounding 500 m range. This layout effectively reduces flood and landslide risks from rainstorms, achieving a CRI of 0.816 and serving as a typical case of medium-resilience villages enhancing resilience through spatial optimization. This fully demonstrates the synergistic advantage of “terrain prioritization for disaster avoidance + ecological barrier assistance.”
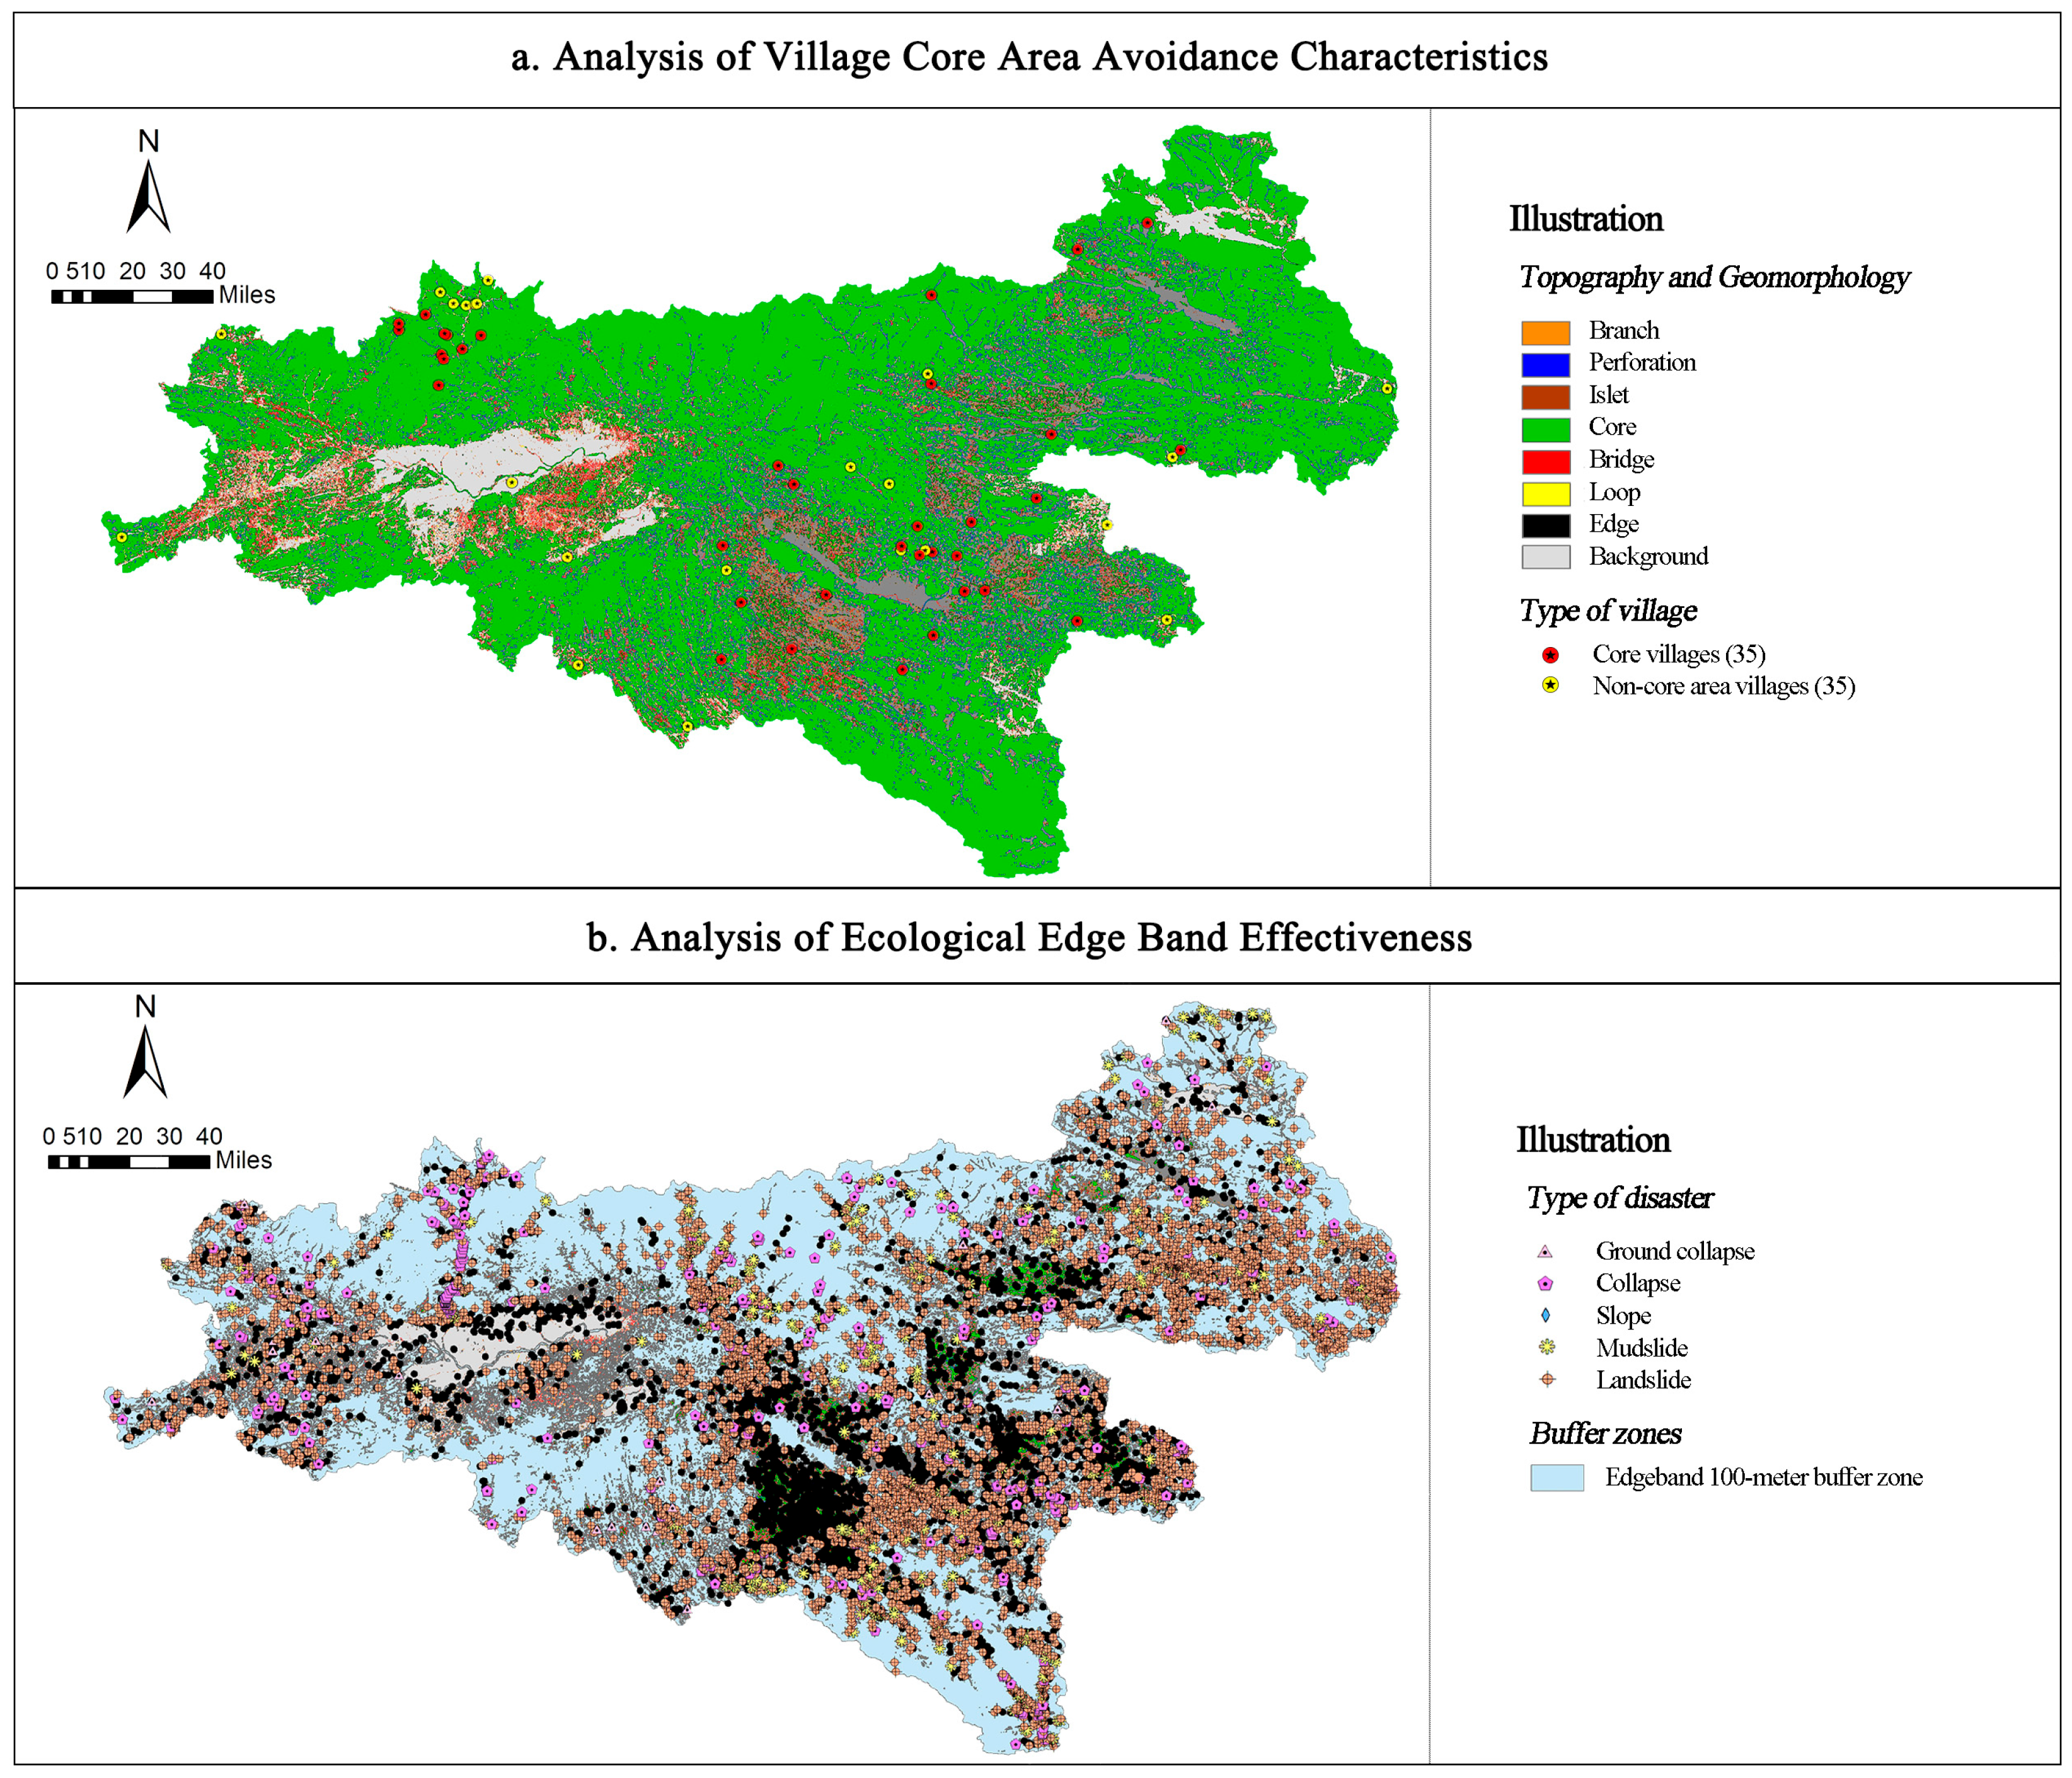
Furthermore, ArcGIS overlay analysis indicates that 61.4% of low-resilience villages are simultaneously located in regions with HEI ≥ 0.3 and ESI ≥ 0.4, whereas only 12% of high-resilience villages exhibit such overlap. MSPA edge band effectiveness analysis shows that the disaster density within the 100 m buffer zone of core ecological areas is 0.077 disasters/km2, 73% lower than the periphery, indicating significant disaster barrier effects of ecological barriers. However, when ecological sensitivity increases, such as ESI ≥ 0.5, the vegetation buffering function in edge bands declines, and hazard exposure increases by an average of 28%, forming a vicious cycle of “ecological degradation → disaster risk amplification.” Conversely, in regions with high terrain adaptability (TAI ≥ 0.8), even with moderate hazard risks (HEI between 0.2 and 0.3), micro-terrain modifications such as terracing and diversion channels can maintain a CRI above 0.85, reflecting the dynamic balance between natural conditions and human adaptation strategies (Figure 10).
In summary, the collaborative risks of “terrain–disaster–ecology” are manifested not only in the spatial overlap of ecologically fragile areas and high-disaster-risk areas but also in the differentiated risk response capabilities of terrain adaptability. High resilience villages achieve risk mitigation through the strategy of “terrain preference + ecological avoidance”, while low resilience villages are caught in the vicious cycle of “ecological degradation–disaster exacerbation–resilience decline” due to the shortcomings of a single factor or multiple factors. Although social capital, such as clan collaboration and traditional knowledge systems, can compensate for natural constraints at the micro-scale, the spatial coupling effect of macro-scale terrain, disaster, and ecological factors remains the key determinant of village resilience levels. The interaction of the three factors, through natural barrier functions, ecological buffer effects, and dynamic balance of human adaptation strategies, collectively shapes the resilience differentiation pattern of traditional villages.

4. Discussion

4.1. Key Findings and Mechanisms

The spatial resilience of traditional villages is the outcome of long-term interactions between natural environmental constraints and social adaptation strategies [37]. Our analysis establishes terrain adaptability (TAI) as the paramount factor governing spatial resilience in the Qinba Mountains, with a q-value of 0.61, significantly outweighing the individual effects of hazard exposure (HEI) and ecological sensitivity (ESI). This dominance manifests through a dual mechanism: optimal terrain (550–1200 m elevation, slopes < 15°) provides a natural barrier against geophysical threats, while south-facing slopes enhance microclimatic conditions for settlement and production. This finding challenges purely hazard-centric vulnerability models and underscores the foundational role of geomorphology in mountainous social-ecological systems. It corroborates and extends the work of Zhu [12], who identified vertical differentiation as key to livelihood resilience in Southwest China, by quantifying its primacy within a comprehensive resilience index.

4.2. The Synergistic Amplification of Vulnerability

While secondary in individual explanatory power, the interaction between HEI and ESI produces a nonlinear enhancement effect (q = 0.72), significantly amplifying village vulnerability. This synergy creates a vicious cycle: ecological degradation (e.g., vegetation loss in edge zones) diminishes natural buffering capacity, which in turn increases disaster exposure. For instance, disaster density was 73% lower within the 100 m buffer of ecological cores, but this barrier effect collapsed when ESI ≥ 0.5, leading to a 28% average increase in hazard exposure. This result aligns with the conceptual framework of Allen [9] on spatial resilience but provides empirical, quantitative evidence of how specific spatial configurations (core-edge patterns) mediate risk in complex terrains.

4.3. The Compensatory Role of Social–Cultural Adaptations

Beyond natural determinants, social capital functions as a critical compensatory mechanism, dynamically offsetting biophysical constraints. In 57% of high-resilience villages (CRI ≥ 0.85), traditional knowledge systems—embodied in clan-organized drainage infrastructure and the “house–field–forest” vertical layout—effectively mitigated risks despite moderate TAI values. This demonstrates that social networks facilitate resource integration and risk-sharing, optimizing the performance of a given natural setting. This evidence supports the theory proposed by Zheng and Chou [36] that social capital enhances community resilience, illustrating its tangible manifestation through spatial organization and collective action in traditional villages.

4.4. Implications for Spatial Planning and Governance

The spatial differentiation of resilience necessitates differentiated governance strategies. The proposed three-tier framework (core protection–ecological restoration–cultural corridor) translates these mechanistic insights into actionable planning principles. It moves beyond generic conservation approaches by explicitly coupling cultural heritage protection with ecological restoration and disaster risk reduction, ensuring resilience strategies are embedded within the existing spatial planning system (e.g., China’s “Territorial Spatial Planning” [26]).
Policy Implication:
Agency Integration: Coordination between Cultural Heritage, Natural Resources, and Emergency Management departments is essential.
Funding Mechanisms: Integrate ecological compensation, rural revitalization, and disaster prevention funds into a dedicated “resilience governance” pool.
Implementation Timeline: Prioritize ecological restoration in high-ESI/HEI villages within 5-year plans, with core protection measures enacted immediately.

4.5. Limitations and Future Research Directions

This study is context-specific to the Qinba Mountains, and its static snapshot does not capture dynamic processes under climate change. The quantification of social capital, while innovative, relied on participatory methods that require further standardization for broader application. Future research should implement the following methods:
(1) Test this evaluative framework in other mountainous regions with different governance regimes.
(2) Integrate dynamic simulation models (e.g., cellular automata, agent-based models) to project resilience under future climate and land-use scenarios.
(3) Develop more robust, transferable metrics for quantifying socio-cultural factors in resilience assessments.

5. Conclusions

This study aimed to evaluate the spatial resilience differentiation of 57 traditional villages in the Qinba Mountains using a three-dimensional framework of terrain adaptability, hazard exposure, and ecological sensitivity.
The findings show that terrain adaptability is the dominant factor (q = 0.61), while the interaction of hazard exposure and ecological sensitivity produces nonlinear enhancement effects that amplify vulnerability. High-resilience villages typically adopt a “core avoidance–edge attachment” strategy and rely on social networks and drainage systems to offset ecological fragility. Practically, the study proposes a three-tiered governance framework of “core protection areas–ecological restoration zones–cultural corridors,” which can be aligned with territorial spatial planning to integrate cultural heritage protection, ecological restoration, and disaster prevention.
These results are context-specific to the Qinba Mountains. Future work should test this framework in other mountainous regions and incorporate dynamic simulations to assess long-term impacts of climate change.

Author Contributions

Conceptualization: Y.L. and B.Z.; Methodology: Y.L. and B.Z.; Data Curation: Y.L., P.W., D.V. and E.V.; Formal Analysis: Y.L., P.W. and E.V.; Writing—Original Draft: Y.L.; Writing—Review and Editing: B.Z. and D.V.; Supervision: B.Z.; Funding Acquisition: B.Z. All authors have read and agreed to the published version of the manuscript.

Funding

This study was supported by the National Natural Science Foundation of China (52178057); National Key Research and Development Program of China (2024YFE0105300); Shaanxi Provincial Science and Technology Innovation Team (2024RS-CXTD-14); Shaanxi Province Key Research and Development Plan Project (2022GY-330).

Data Availability Statement

Data will be made available on request.

Conflicts of Interest

The authors declare no conflicts of interest.

Appendix A. Research Data

Table A1. Information of Research Subjects.
No.CityDistrictTownVillageXYElevation/mSlope AspectsSlope/°TypeArea/km2Resident PopulationMain Economic SituationMain Disaster Types
1ShangLuoShanYangManChuanGuanGuZhen110.05733.233305.712273.411.478Plain Basin Village2.51200Tourism + Rice CultivationFlood, Landslide
2ShangLuoShanYangFaGuanFaGuanMiao110.09233.258379.006186.39512.025Plain Basin Village3.2850Tea Cultivation + Medicinal HerbsMudslide
3AnKangShiQuanYunDouChangLing108.15932.797448.63526.90619.958Plain Basin Village4.8600Sericulture + Eco-tourismLandslide
4AnKangXunYangChiYanZhanJiaWan109.26232.744482.35736.50610.141Plain Basin Village5.1950Tobacco Cultivation + Traditional FarmingFlood, Geological Disaster
5HanZhongChengGuShangYuanGuanLeFeng107.23133.088485.967186.0231.302Plain Basin Village2.71100Traditional Bamboo Crafts + Rice CultivationFlood
6ShangLuoShangNanFuShuiWangJiaLou110.97933.483493.79656.362.594Plain Basin Village3.5700Mushroom Cultivation + Black Fungus CultivationRainstorm, Landslide
7AnKangZiYangXiangYangYingLiang108.44532.519521.62489.04717.357Plain Basin Village6480Selenium-rich Tea CultivationRainstorm, Landslide
8AnKangHanBinShiTiYingChun109.17732.739522.166227.2999.94Plain Basin Village4.31300Rice Cultivation + Rapeseed CultivationFlood, Mudslide
9AnKangXunYangZhaoWanZhongShan109.19932.99527.758161.97923.108Plain Basin Village7.2550Pine Forestry + Gastrodia CultivationWildfire, Geological Disaster
10AnKangBaiHeQiaZiFengHuang110.04132.647554.68421.75620.804Low Hill Village8.5300Turmeric Cultivation + Low Mountain Terrace FarmingSoil Erosion, Drought
11HanZhongZhenBaNianZiNianZi108.22432.683570.313136.92213.111Low Hill Village9.1400Animal Husbandry + Traditional FarmingLandslide, Rainstorm
12HanZhongXiXiangLuoJiaBaZhongJiaGou107.4832.827572.785247.2432.328Low Hill Village3.8650Tea Cultivation + Eco-tourismFlood, Mudslide
13AnKangHanBinTanBaMaHe108.90432.899576.66393.1246.219Low Hill Village9.6435Corn Cultivation + Potato CultivationLandslide, Hail
14AnKangHanBinTanBaQianHe108.90132.882576.91519.75112.022Low Hill Village18.21680Grain Cultivation, Herbal Medicine CultivationMudslide, Drought
15AnKangShiQuanYingFengXinZhuang108.43733.112595.12211.3634.077Low Hill Village6.7350Gastrodia Cultivation + Small-scale FarmingLandslide, Rainstorm
16AnKangXunYangChiYanQiLiMiaoWan109.47833.079598.271158.73118.466Low Hill Village7.4420Tea Cultivation + Traditional CraftsGeological Disaster, Flood
17AnKangHanBinGongJinGaoShan109.03632.878624.354139.9837.906Low Hill Village5560Grain Termination + Eco-tourismWildfire, Soil Erosion
18HanZhongZhenBaJianChiYangJiaYing107.54232.439624.729170.7396.795Low Hill Village5.3380Corn Cultivation + Konjac CultivationMudslide, Hail
19ShangLuoZhenAnMiLiangShuPing109.53733.311641.455198.2422.85Low Hill Village9.5250Chestnut Cultivation + BeekeepingLandslide, Drought
20HanZhongNingQiangQingMuChuanQingMuChuan105.57932.83670.296233.823.415Low Hill Village121500Ancient Town TourismFlood, Landslide
21AnKangHanBinTanBaHuiPing108.98232.868690.35322.13528.223Low Hill Village10.2200Pine Forestry + Small-scale FarmingGeological Disaster, Rainstorm
22AnKangHanBinHeDaDuo109.04532.579700.59245.33225.4Low Hill Village11.5180Animal Husbandry (Cattle) + Low-yield AgricultureSoil Erosion, Drought
23AnKangHanBinTanBaYaDanHe109.00432.884710.87188.87628.927Low Hill Village8.7220Tea Cultivation + SericultureLandslide, Mudslide
24AnKangHanBinCiGouWaPu108.97132.971712.387131.41712.258Low Hill Village6.9320Corn Cultivation + Potato CultivationFlood, Hail
25AnKangHanBinShuangLongTianBao108.91732.453724.98713.8699.532Low Hill Village8.7880Grain, Fruit Cultivation + Tea ManufacturingWildfire, Geological Disaster
26AnKangXunYangXianHeNiuJiaYinPo109.78132.987734.566317.84816.21Low Hill Village9.8350Tobacco Cultivation + Corn CultivationMudslide, Rainstorm
27AnKangShiQuanYingFengSanGuanMiao108.36933.178757.587249.4079.517Low Hill Village10.5400Poria Cultivation + Traditional FarmingLandslide, Drought
28AnKangHanBinShiZhuanShuangBai108.58632.717769.2683.88717.648Low Hill Village121180AgricultureFlood, Geological Disaster
29HanZhongLveYangBaiShuiJiangTieFoSi105.9633.578770.575256.8078.146Low Hill Village11.2180Economic Forest + BeekeepingWildfire, Mudslide
30ShangLuoZhenAnYunGaiSiYunZhen109.01633.486813.579218.2174.967Low Hill Village13600Black Fungus Cultivation + Ancient Town TourismRainstorm, Landslide
31HanZhongLiuBaWuGuanYiHeKou106.99833.562819.662276.74921.313Low Hill Village14.5250Corn Cultivation + Konjac CultivationMudslide, Hail
32AnKangHanBinZaoYangWangZhuang109.1432.867883.706157.9118.389Low Hill Village6410Grain Cultivation, Herbal Medicine CultivationWildfire, Soil Erosion
33ShangLuoShangZhouYaoShiShangJi109.94134.077900.431224.0161.283Low Hill Village16.2700Wheat Cultivation + Rapeseed CultivationDrought, Geological Disaster
34HanZhongLiuBaYuHuangMiaoXiaXiHe107.00733.72905.934174.5672.098Low Hill Village17.8150Bamboo Processing + BeekeepingLandslide, Rainstorm
35ShangLuoZhenAnYunGaiSiHeiYaoGou109.00233.52907.65443.4399.7Low Hill Village18.5120Animal Husbandry + Low-yield AgricultureMudslide, Drought
36AnKangHanBinZiJingZiJing108.84533.122910.234233.63232.04Low Hill Village19300Tea Cultivation + Eco-tourismWildfire, Geological Disaster
37HanZhongLiuBaHuoShaoDianWangXingTai106.9133.54912.453222.5951.503Low Hill Village20.3100Economic Forest + Protective FarmingLandslide, Hail
38HanZhongLiuBaJiangKouHeXi107.04733.726915.566203.0781.569Low Hill Village21.7180Corn Cultivation + Potato CultivationFlood, Mudslide
39HanZhongLiuBaJiangKouSuoLuo107.05433.726922.558139.3753.18Low Hill Village22.590Beekeeping + Small-scale ForestryGeological Disaster, Drought
40AnKangShiQuanHouLiuChangXing108.14132.884938.469277.17712.608Low Hill Village23350Water Town Tourism + FisheryFlood, Landslide
41HanZhongLiuBaChengGuanChengGuan106.9333.611950.804178.6546.027Low Hill Village24.51200Rice Cultivation + Rapeseed CultivationMudslide, Rainstorm
42HanZhongLiuBaZiBaXiaoLiuBa106.91933.615961.07375.9391.538Low Hill Village25.8800Eco-tourism + Traditional HandicraftsLandslide, Hail
43HanZhongZhenBaGuanYinXiaoLiGou108.14832.474964.86868.47717.262Low Hill Village26.3450Corn Cultivation + Konjac CultivationGeological Disaster, Drought
44AnKangHanBinYePingShuangQiao108.67833.179965.88949.12110.358Low Hill Village23665Grain Cultivation + Forest Products Collection + Tea ManufacturingFlood, Soil Erosion
45HanZhongLiuBaYuHuangMiaoYuHuangMiao106.95133.725973.629147.1731.676Low Hill Village28.4200Animal Husbandry + Low-yield AgricultureFlood, Soil Erosion
46ShangLuoShangZhouSanChaHeYinLongSi109.6433.9791038.34177.4435.311Low Hill Village29.7650Wheat Cultivation + Corn CultivationLandslide, Drought
47HanZhongLiuBaHuoShaoDianZhongXiGou106.91933.5241043.56302.31419.277Low Hill Village30.2150Economic Forest + Ecological ProtectionMudslide, Rainstorm
48HanZhongLiuBaMaDaoLongTanBa106.90233.4271064.0430.7397.741Low Hill Village31.5120Beekeeping + Small-scale FarmingGeological Disaster
49HanZhongLiuBaYuHuangMiaoLiangHeKou106.89333.7641085.75159.8833.631Low Hill Village32100Forestry + TourismWildfire, Landslide
50ShangLuoZhaShuiYingPanZhuJiaWan109.0133.8051086.68261.10418.31Low Hill Village35800Ski Tourism + Under-forest EconomySnow Disaster, Mudslide
51AnKangXunYangChiYanWanFu109.65732.6381099.37162.83920.564Low Hill Village36.5400Tobacco Cultivation + Corn CultivationGeological Disaster, Drought
52HanZhongLiuBaJiangKouMoPing107.09733.8121106.58279.55810.058Low Hill Village38250Bamboo Processing + BeekeepingFlood, Landslide
53HanZhongLiuBaWuGuanYiShangNanHe107.07533.6141129.34188.30612.354Low Hill Village40.2180Animal Husbandry + Small-scale FarmingMudslide, Hail
54HanZhongZhenBaYanChangXiangDong108.01232.231174.49295.70910.339Low Hill Village42.5150Konjac Cultivation + Potato CultivationLandslide, Rainstorm
55HanZhongLiuBaLiuHouMiaoTaiZi106.83333.681277.37262.7014.349Mid-Mountain Village45500High Mountain HoneySnow Disaster, Landslide
56HanZhongLiuBaLiuHouYingPan106.72233.6221680.37277.9675.764Mid-Mountain Village50300Fir Forest Protection + Ecological StudyExtreme Low Temperature, Geological Disaster
57HanZhongLiuBaLiuHouZhaKouShi106.72133.6441713.48285.43.439Mid-Mountain Villag55200Eco-tourism + Alpine AgricultureLandslide, Extreme Weather
(Source: Author’s illustration).

Appendix B. Entropy Weight Method Steps

Taking terrain adaptability weight determination as an example, it mainly includes the following 3 steps.
Using the range method to standardize original terrain data of elevation, slope, and slope direction:
Z ij   =   x i j min   ( x j ) m a x ( x j ) m i n ( x j )   ( Positive indicator )
Z ij = max   ( x j ) x i j m a x ( x j ) m i n ( x j )   ( Negative indicators )
The information entropy Ej of the j-th indicator is:
Weight calculation formula:
w j   =   1 E j j 1 m ( 1 E j )
After calculation, the results are shown in Table A2.
Table A2. Terrain Adaptability Index (TAI) Factor Weights.
IndicatorEntropy Value (Ej)Difference Coefficient (dj)Weight (Wj)Indicator Polarity
Elevation0.9230.3410.327
Slope0.8910.7190.365
Slope Aspect0.9560.5480.308+
(Source: Author’s illustration).
The final terrain adaptability weights are as follows: Elevation (0.327), Slope (0.365), Slope Direction (0.308).

References

  1. McPhearson, T.M.; Raymond, C.; Gulsrud, N.; Albert, C.; Coles, N.; Fagerholm, N.; Nagatsu, M.; Olafsson, A.S.; Soininen, N.; Vierikko, K. Radical changes are needed for transformations to a good Anthropocene. npj Urban Sustain. 2021, 1, 5. [Google Scholar] [CrossRef]
  2. Pineda-Pinto, M.; Herreros-Cantis, P.; McPhearson, T.; Frantzeskaki, N.; Wang, J.; Zhou, W. Examining ecological justice within the social-ecological-technological system of New York City, USA. Landsc. Urban Plan. 2021, 215, 104228. [Google Scholar] [CrossRef]
  3. Wang, X.; Zhu, Q. Influencing Factors of Traditional Village Protection and Development from the Perspective of Resilience Theory. Land 2022, 11, 2314. [Google Scholar] [CrossRef]
  4. Kayal, D.; George, A. Assessing the Adaptive Resilience of Traditional Built Forms of Villages in Flood-Prone Zones: A Case of Two deltaic Villages. Sustainable Resilient Built Environment—2022 (SRBE 2022). 2022. [Google Scholar] [CrossRef]
  5. Chambers, J.C.; Allen, C.R.; Cushman, S.A. Operationalizing Ecological Resilience Concepts for Managing Species and Ecosystems at Risk. Front. Ecol. 2019, 7, 241. [Google Scholar] [CrossRef]
  6. Zhao, L.; Ma, R.; Chen, F.; Li, J.; Chen, Q.; Fan, Y. Enhancing the spatial resilience of agricultural heritage through constructing a balanced production-living-ecological space protection network. Npj Herit. Sci. 2025, 13, 368. [Google Scholar] [CrossRef]
  7. Cumming, G.S. Spatial Resilience in Social-Ecological Systems; Springer: Dordrecht, The Netherlands, 2011. [Google Scholar]
  8. Keane, R.E.; Loehman, R.A.; Holsinger, L.M.; Falk, D.A.; Higuera, P.; Hood, S.M.; Hessburg, P.F. Use of landscape simulation modeling to quantify resilience for ecological applications. Ecosphere 2018, 9, e02414. [Google Scholar] [CrossRef]
  9. Allen, C.R.; Angeler, D.G.; Cumming, G.S.; Folke, C.; Twidwell, D.; Uden, D.R. Quantifying spatial resilience. J. Appl. Ecol. 2016, 53, 625–635. [Google Scholar] [CrossRef]
  10. Zlatanova, S.; Yan, J.; Wang, Y.; Diakité, A.; Isikdag, U.; Sithole, G.; Barton, J. Spaces in Spatial Science and Urban Applications—State of the Art Review. ISPRS Int. J. Geo-Inf. 2020, 9, 58. [Google Scholar] [CrossRef]
  11. Lu, Q.; Ding, Z.; Li, M.; Gu, J. Beyond the horizon: Unveiling the impact of 3D urban landscapes on residents’ perceptions through machine learning. Ecol. Indic. 2025, 177, 113736. [Google Scholar] [CrossRef]
  12. Zhu, S.; Sun, J.; Wu, Y.; Lu, Q.; Ke, Y.; Xue, Z.; Zhu, G.; Xiao, Y. Vertical Spatial Differentiation and Influencing Factors of Rural Livelihood Resilience: Evidence from the Mountainous Areas of Southwest China. Agriculture 2024, 14, 1295. [Google Scholar] [CrossRef]
  13. Payne, D.; Spehn, E.M.; Snethlage, M.; Fischer, M. Opportunities for research on mountain biodiversity under global change. Curr. Opin. Environ. Sustain. 2017, 29, 40–47. [Google Scholar] [CrossRef]
  14. Ehrlich, D.; Melchiorri, M.; Capitani, C. Population Trends and Urbanisation in Mountain Ranges of the World. Land 2021, 10, 255. [Google Scholar] [CrossRef]
  15. Ibarra, J.T.; Caviedes, J.; Marchant, C.; Mathez-Stiefel, S.-L.; Navarro-Manquilef, S.; Sarmiento, F.O. Mountain social-ecological resilience requires transdisciplinarity with Indigenous and local worldviews. Trends Ecol. Evol. 2023, 38, 1005–1009. [Google Scholar] [CrossRef]
  16. Yang, Y.; Wang, Y. Exploring Rural Resilient Factors Based on Spatial Resilience Theory: A Case Study of Southern Jiangsu. Land 2023, 12, 1677. [Google Scholar] [CrossRef]
  17. Intergovernmental Panel on Climate Change. Climate Change 2022—Impacts, Adaptation and Vulnerability: Working Group II Contribution to the Sixth Assessment Report of the Intergovernmental Panel on Climate Change; Cambridge University Press: Cambridge, UK, 2023. [Google Scholar]
  18. Li, Z.; Zeng, Z.; Tian, D.; Wang, J.; Fu, Z.; Zhang, F.; Zhang, R.; Chen, W.; Luo, Y.; Niu, S. Global patterns and controlling factors of soil nitrification rate. Glob. Chang. Biol. 2020, 26, 4147–4157. [Google Scholar] [CrossRef]
  19. Li, S.; Yang, X.; Shi, R.; Wang, F.; Chen, J. Trade-Offs and Synergies of Soeia-eological Syslem Resilienee and Driving Forces in the Qinba Mountains: A case study of souther Shaanxi, China. Mt. Res. 2023, 41, 571–583. [Google Scholar] [CrossRef]
  20. Bai, Y.; Chen, J.; Yin, S.; Li, R.; Yang, X. Evolution and influencing factors of rural resilience in povertythe background of rural revitalization. Acta Ecol. Sin. 2024, 44, 8798–8811. [Google Scholar] [CrossRef]
  21. Xu, Y.; Yang, X.; Feng, X.; Yan, P.; Shen, Y.; Li, X. Spatial distribution and site selection adaptation mechanism of traditional villages along the Yellow River in Shanxi and Shaanxi. River Res. Appl. 2022, 39, 1270–1282. [Google Scholar] [CrossRef]
  22. Wang, L.; Liao, T.; Gao, J. How Does Eco-Migration Influence Habitat Fragmentation in Resettlement Areas? Evidence from the Shule River Resettlement Project. Land 2025, 14, 1514. [Google Scholar] [CrossRef]
  23. Chen, S.; Wang, X.; Qiang, Y.; Lin, Q. Spatial–temporal evolution and land use transition of rural settlements in mountainous counties. Environ. Sci. Eur. 2024, 36, 38. [Google Scholar] [CrossRef]
  24. Jiazhuo, W.; Qianhui, X.; Chunyang, Z. The Practice of Enhancing Urban Drainage and Flood Control Capacity with the Concept of Resilient Cities. City Plan. Rev. 2024, 48, 136–143. [Google Scholar]
  25. Bai, H.; Shi, M.; Cao, Q.; Ning, Z. Spatial distribution characteristics and disaster resilience assessmentof traditional villages in earthquake-prone areas. J. Nat. Disasters 2024, 33, 30–41. [Google Scholar] [CrossRef]
  26. Zhou, K.; Wang, S.; Feng, Y. How Is Spatial Planning Adapting to Climate Change? A Textual Analysis Based on the Territorial and Spatial Plans of 368 Chinese Cities. Land 2023, 12, 1993. [Google Scholar] [CrossRef]
  27. Guo, Z.; Zhu, C.; Fan, X.; Li, M.; Xu, N.; Yuan, Y.; Guan, Y.; Lyu, C.; Bai, Z. Analysis of ecological network evolution in an ecological restoration area with the MSPA-MCR model: A case study from Ningwu County, China. Ecol. Indic. 2025, 170, 113067. [Google Scholar] [CrossRef]
  28. Vogt, P.; Riitters, K.H.; Estreguil, C.; Kozak, J.; Wade, T.G.; Wickham, J.D. Mapping Spatial Patterns with Morphological Image Processing. Landsc. Ecol. 2007, 22, 171–177. [Google Scholar] [CrossRef]
  29. Zhai, T.; Huang, L. Linking MSPA and Circuit Theory to Identify the Spatial Range of Ecological Networks and Its Priority Areas for Conservation and Restoration in Urban Agglomeration. Front. Ecol. Evol. 2022, 149, 103086. [Google Scholar] [CrossRef]
  30. Wang, M.; Wang, X.; Shi, W. Exploring the response of trade-offs and synergies among ecosystem services to future land use changes in the hilly red soil region of Southern China. J. Environ. Manag. 2024, 372, 123283. [Google Scholar] [CrossRef] [PubMed]
  31. Shuang, S.; Shuai, W.; Bojie, F.; Haibin, C.; Yanxu, L.; Wenwu, Z. Study on adaptive governance of social-ecological system:Progress and prospect. Acta Geogr. Sin. 2019, 74, 2401–2410. [Google Scholar]
  32. Gunderson, L.; Holling, C. Panarchy: Understanding Transformations In Human And Natural Systems. Bibliovault OAI Repos. Univ. Chic. Press 2003, 114, S0006–S3207. [Google Scholar]
  33. Yang, Y.; Bao, W.; de Sherbinin, A. Mapping fine-resolution nested social-ecological system archetypes to reveal archetypical human-environmental interactions. Landsc. Urban Plan. 2023, 239, 104863. [Google Scholar] [CrossRef]
  34. Botequilha Leitão, A.; Ahern, J. Applying landscape ecological concepts and metrics in sustainable landscape planning. Landsc. Urban Plan. 2002, 59, 65–93. [Google Scholar] [CrossRef]
  35. Guan, R.; Chen, Y.; Chen, X. Scientific Evaluation of Fengshui from the Perspective of Geography: Empirical Evidence from the Site Selection of Traditional Hakka Villages. Appl. Spat. Anal. Policy 2024, 17, 1545–1568. [Google Scholar] [CrossRef]
  36. Zheng, Z.-Q.; Chou, R.-J. Rebuilding the resilience of mountainous rural communities by enhancing community capital through industrial transformation: A case study from rural Fujian, China. Habitat Int. 2024, 149, 103086. [Google Scholar] [CrossRef]
  37. Wu, X.; Yuan, Z. Understanding the socio-cultural resilience of rural areas through the intergenerational relationship in transitional China: Case studies from Guangdong. J. Rural. Stud. 2023, 97, 303–313. [Google Scholar] [CrossRef]
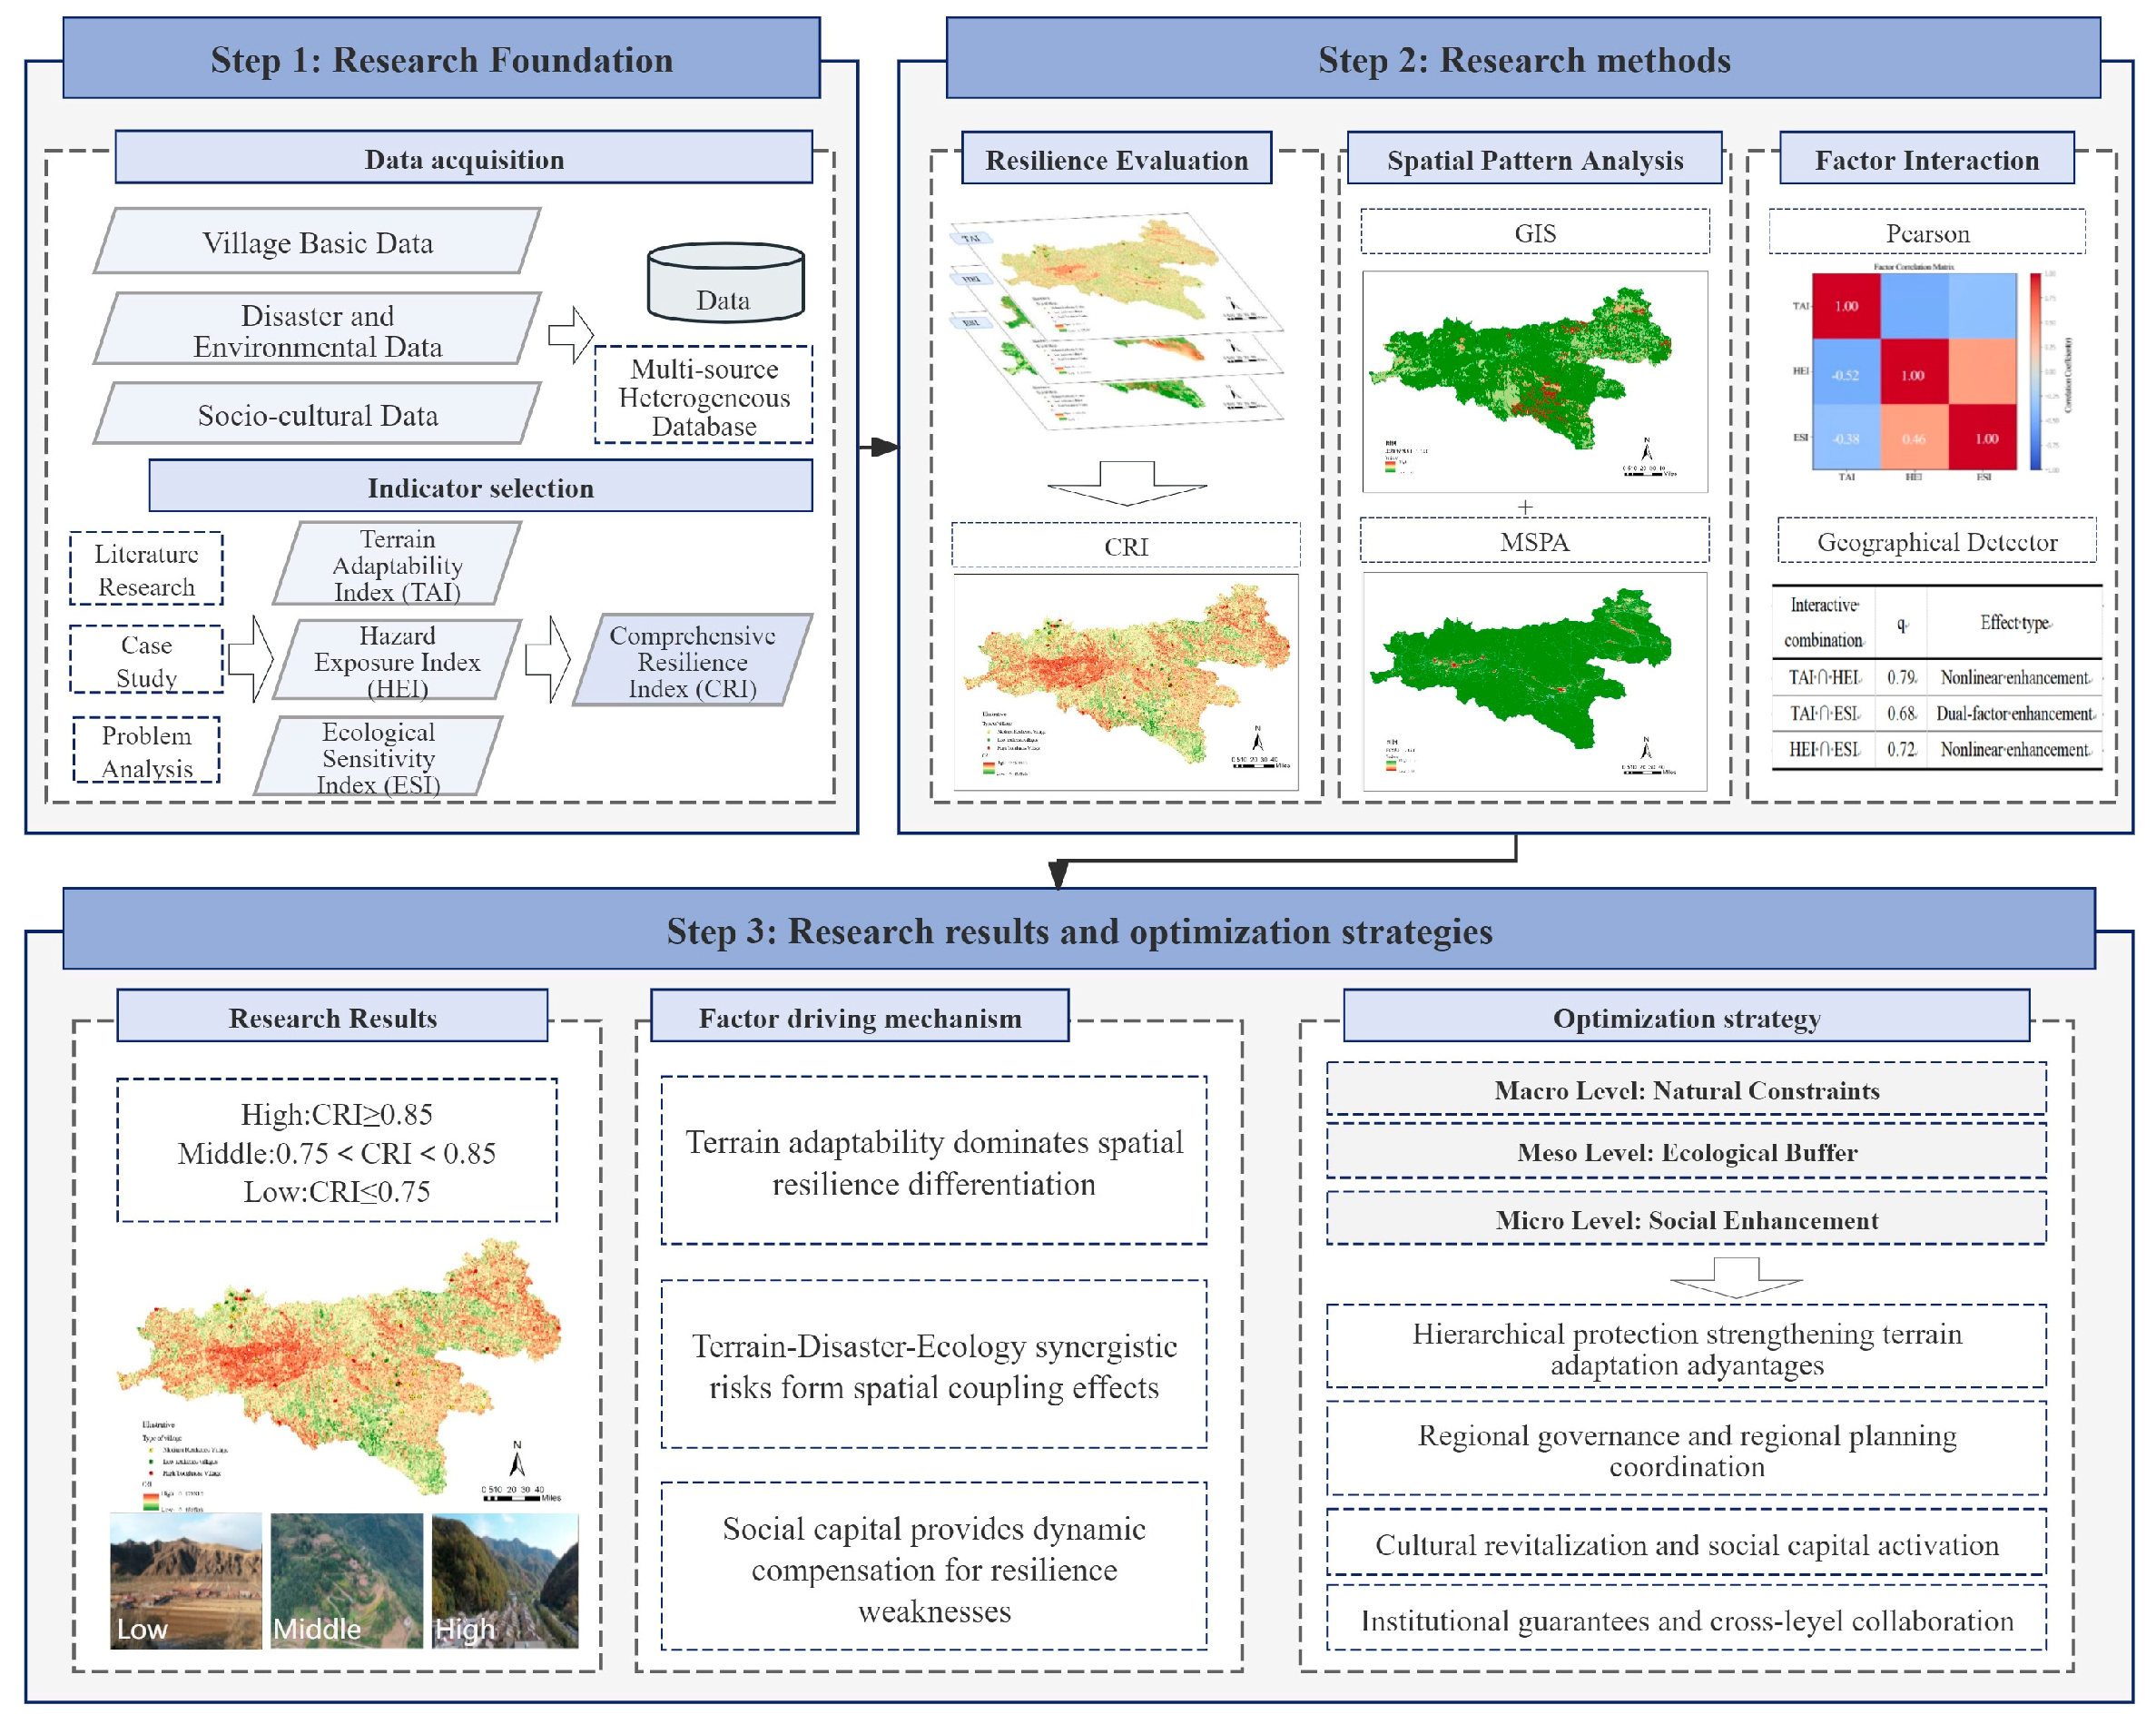
Figure 1. Research Framework (Source: Drawn by the Authors).
Land 14 01852 g001
Figure 2. Distribution of the Study Area and National Traditional Villages in Southern Shaanxi (Source: Drawn by the Authors).
Land 14 01852 g002
Figure 3. Relationship between Site Selection of National Traditional Villages and Topography/Geography in the Qinba Mountain Area of Southern Shaanxi (Source: Drawn by the Authors).
Land 14 01852 g003
Figure 4. Spatial Differentiation Analysis of Resilience (Source: Drawn by the Authors).
Land 14 01852 g004
Figure 5. Spatial characteristics analysis of Mahe Village (Image source: Drawn by the authors).
Land 14 01852 g005
Figure 6. Spatial characteristics analysis of Gaoshan Village (Image source: Drawn by the authors).
Land 14 01852 g006
Figure 7. Spatial characteristics analysis of Shuangqiao Village (Image source: Drawn by the authors).
Land 14 01852 g007
Figure 8. “house–field–forest” vertical layout (Source: Drawn by the Authors).
Land 14 01852 g008
Figure 9. Heatmap of Correlations Among Factors (TAI-HEI: r = −0.52, HEI-ESI: r = +0.46. Source: Drawn by the Authors).
Land 14 01852 g009
Figure 10. MSPA (Source: Drawn by the Authors).
Land 14 01852 g010
Table 1. Index System of Comprehensive Resilience Index (CRI)(Source: Compiled by the authors).
Target LayerCriterion LayerWeightPolarityFactor LayerWeightPolarityCalculation Criteria
Comprehensive Resilience Index (CRI)Terrain Adaptability Index (TAI)0.4+Elevation (H)0.327Characterizes the constraints of terrain on residential and production activities.
Slope (S)0.365Characterizes the constraints of terrain on residential and production activities.
Aspect (SD)0.308+Reflects the potential for optimizing local microenvironments.
Hazard Exposure Index (HEI)0.3Comprehensive Disaster Density (D)0.397+Using kernel density estimation, disaster points are input into ArcGIS, with a 5 km search radius to output density raster units, followed by standardization.
Edge Bandwidth Effectiveness (B)0.302+Based on MSPA analysis, ecological edge zones are extracted to generate 100 m buffers; disaster points are overlaid, and the bandwidth coefficient is calculated by counting the proportion of disaster points within the edge zones.
Elevation Risk (H)0.301+Divided into low, medium, and high levels by altitude; positively reflects risk levels after standardization
Ecological Sensitivity Index (ESI)0.3Fractional Vegetation Cover (FVC)0.621+Calculated using the Normalized Difference Vegetation Index (NDVI) based on 2020 Landsat 8 remote sensing images.
Soil Erosion Intensity (SEI)0.379+Based on the modified universal soil loss equation, classified into five levels (micro, mild, moderate, intense, extremely intense). according to the Classification and Grading Standards for Soil Erosion, with positive assignment after standardization.
Table 2. MSPA Parameter Settings (Source: Drawn by the Authors).
ParameterValueBasis
Edge Width100 mSet based on the average village size (50–100 households) and topographic transition zone width in southern Shaanxi, covering the interaction area between villages and ecological zones.
Core Threshold5 haFilters fragmented small patches and retains contiguous ecological core areas.
Connectivity8 NeighborAdapts to complex mountainous terrain and ensures continuity of core area boundaries.
Background Value0Non-target landscape types such as cultivated land and construction land are set as background.
Table 3. Explanatory Power of Single Factors (Source: Drawn by the Authors).
Factorq-ValueSignificance (p-Value)Ranking
TAI0.61<0.011
HEI0.58<0.012
ESI0.49<0.013
TAI: Terrain Adaptability Index; HEI: Hazard Exposure Index; ESI: Ecological Sensitivity Index.
Table 4. Interaction Mechanisms Among Factors (Source: Drawn by the Authors).
Interaction CombinationInteraction Q-ValueType of Interaction
TAI ∩ HEI0.79Nonlinear Enhancement
TAI ∩ ESI0.68Bifactor Enhancement
HEI ∩ ESI0.72Nonlinear Enhancement
Disclaimer/Publisher’s Note: The statements, opinions and data contained in all publications are solely those of the individual author(s) and contributor(s) and not of MDPI and/or the editor(s). MDPI and/or the editor(s) disclaim responsibility for any injury to people or property resulting from any ideas, methods, instructions or products referred to in the content.