Article

Spatial Heterogeneity of Traditional Villages in Southern Sichuan, China: Insights from GWR and K-Means Clustering

School of Architecture, Southwest Jiaotong University, Chengdu 611756, China
*
Author to whom correspondence should be addressed.
Land 2025, 14(9), 1817; https://doi.org/10.3390/land14091817
Submission received: 13 August 2025 / Revised: 31 August 2025 / Accepted: 3 September 2025 / Published: 6 September 2025

Abstract

Understanding the spatial heterogeneity and driving mechanisms of traditional villages is critical for their tailored preservation and revitalization. Existing studies often overlook intra-regional variations shaped by historical and cultural contexts. In addition, the lack of systematic quantitative approaches limits the formulation of effective conservation strategies. This study addresses these gaps by examining 71 nationally listed traditional villages across five prefectures in southern Sichuan, China. We first mapped spatial patterns using ArcGIS10.5 and Geodetector. Then we applied GWR (adjusted R2 = 0.70), K-means clustering, and Kruskal–Wallis tests to examine the spatial heterogeneity. This workflow resulted in three different village clusters related to historical migration: S1-Indigenous (n = 14)—Villages established before the Ming Dynasty, primarily inhabited by indigenous Sichuan residents. S2-Huguang migrants (n = 30)—Villages formed during the late Ming to early Qing “Huguang Migration to Sichuan,” facilitated by proximity to rivers and transport routes. S3-Refugees (n = 27)—Villages settled by war refugees from northern and eastern Sichuan, often located in secure, high-elevation areas. Based on these findings, we propose tailored conservation strategies: preserving historical layout and architectural integrity in S1; maintaining migration-shaped forms and highlighting cultural imprints in S2; and balancing spatial conservation with improved mountain road accessibility in S3.

1. Introduction

Traditional villages refer to settlements established before the Republic of China era, which continue to serve as living communities today [1]. In 2012, China’s Ministry of Housing and Urban-Rural Development, the Ministry of Culture, and the Ministry of Finance jointly issued a document in which traditional villages were defined as “rural settlements that possess both tangible and intangible cultural heritage, and demonstrate significant historical, cultural, scientific, artistic, social, and economic value [2].” These villages retain much of their original built environment, architectural style, and site selection, while also preserving unique folk customs. The outstanding representatives, such as Xidi and Hongcun in Anhui Province, were inscribed on the UNESCO World Heritage List in 2000 as a type of “cultural landscape.” In describing their Outstanding Universal Value, UNESCO emphasizes that “the villages faithfully preserve elements that are typical of traditional pre-modern villages, including the surrounding environment, man-made waterways, the villages’ layout, architectural style, decorative arts, construction methods and materials, traditional technology, and the overall appearance of the villages [3].” As such, traditional villages are invaluable for studying the wisdom behind historical settlement patterns and human habitation.
However, since the 21st century, rapid industrialization and urbanization in China have led to the widespread decline of traditional villages, highlighting the urgent need for scientific preservation and adaptive reuse [4]. Since the implementation of China’s Rural Revitalization Strategy in 2012, the importance of conserving these villages has gradually gained more attention. To support these efforts, the Chinese government has released six editions of the National Catalog of Traditional Villages, providing crucial data and policy support for systematic regional protection. Despite these efforts, current preservation initiatives often fail to account for the unique characteristics of individual villages. Many villages experience a homogenized, “one-size-fits-all” approach to conservation—leading to the phenomenon of “a thousand villages looking the same.” For instance, through field investigations and empirical analysis of traditional villages in the Taihang Mountain area of Hebei Province, Wang and Fang (2020) identified a prominent homogenization phenomenon in their tourism products [5].
In fact, traditional villages are shaped by the complex interplay of natural, socioeconomic, and historical–cultural factors, resulting in a non-uniform spatial distribution. So villages in different regions face distinct dominant risks and embody different core conservation values. Only by identifying this heterogeneity can local governments obtain direct and effective spatial guidance to optimize resource allocation, thereby implementing “precise conservation” and “zonal strategies” for traditional villages. Consequently, analyzing the existing traditional village data to investigate their spatial heterogeneity patterns and the varied driving mechanisms behind their formation and development is essential. This approach allows for the identification of each village’s unique regional characteristics, helping to avoid standardized preservation methods and ensuring more tailored and effective revitalization efforts.
A review of the relevant literature reveals that the research on the spatial heterogeneity of traditional villages has expanded in recent years. In terms of scale, most studies operate within administrative boundaries at national, provincial, or municipal levels. GIS-based spatial analyses have been used to identify nationwide distribution patterns [6]. Mixed-methods approaches have examined the drivers of spatial evolution in specific regions, such as Guizhou Province [7]. City-level investigations have combined spatial analysis with historical data to interpret localized spatial characteristics [8]. A smaller set of studies has shifted toward geographical units that reflect natural systems, such as watersheds and river basins. These studies have provided insights into clustering patterns in the South Taihang Mountains [9] and the Qiantang River Basin [10]. From a methodological perspective, existing studies have primarily relied on descriptive spatial techniques, emphasizing the identification of distribution patterns and qualitative exploration of influencing factors. Commonly used tools include the Nearest Neighbor Index, Kernel Density Estimation, and the Lorenz Curve, which have been applied to regions such as Zhejiang [11] and Xinjiang [12] to characterize spatial structures and evolutionary trends. In recent years, quantitative approaches aimed at uncovering causal mechanisms have begun to emerge. For example, Geodetector models have been used to isolate dominant drivers of village distribution in Inner Mongolia [13]. Optimized spatial statistical frameworks have further enabled the measurement of multiple factors’ relative impacts, as demonstrated in research conducted on Hainan Island [14].
Despite existing advances, significant limitations persist in current research. Spatial analyses are largely confined to national or provincial administrative units and broad watershed scales—territories that encompass diverse socio-cultural contexts and often obscure local-level dynamics. While suitable for revealing macro-patterns and offering contextual reference, these scales are not well-suited for informing planning implementation. In contrast, mesoscale units—such as cultural-geographical subregions or small watershed systems—remain underexplored, despite offering an appropriate resolution for examining village identity formation. At this scale, it becomes possible to identify cultural typologies, analyze spatial relationships among geographic units, and distinguish between villages, all of which are essential for Place-tailored preservation strategies. Methodologically, most studies rely on descriptive spatial analysis, with limited progress toward identifying causal mechanisms through tools such as the Geodetector or regression-based models [15,16]. As a result, the underlying drivers of spatial heterogeneity remain insufficiently and non-quantitatively examined, constraining the applicability of research findings to planning practices. Furthermore, as a cultural landscape and historical heritage, the siting and layout of traditional villages result from dynamic interactions between historical–cultural forces and site-specific conditions, rather than physical geography alone [17]. The existing research has mainly examined natural geographic factors as well as their underlying mechanisms, while few studies adopt historical and cultural perspectives to explain spatial heterogeneity. This narrow focus constrains a comprehensive understanding of the mechanisms shaping traditional village formation.
To address these gaps, this study conducted an empirical investigation of 71 villages in Southern Sichuan, China. We developed an integrated analytical framework. This framework combines Geodetector, Geographically Weighted Regression (GWR), and K-means clustering to examine traditional village spatial patterns. The framework simultaneously identifies spatial distributions and dominant drivers, models spatial heterogeneity in factor effects, and classifies representative village typologies. By coupling factor detection, spatial non-stationarity analysis, and typology construction, the proposed approach mitigates individual methodological constraints and provides a robust basis for understanding spatial heterogeneity. Finally, this study incorporates historico-cultural perspectives, using dialect geography as a theoretical lens, to decipher the underlying drivers of traditional villages’ spatial heterogeneity. So we aim to address the following research questions by using the new integrated analytical framework and to propose more specific and targeted strategies for village conservation.
RQ1: Which spatial factors drive the heterogeneity of traditional villages in southern Sichuan, China?
RQ2: Do the effects of these driving factors vary across regions with different historical and cultural contexts?

2. Materials and Methods

2.1. Study Area

The study area (102°50′–106°26′ E, 28°18′–30°2′ N) is situated in the southern margin of the Sichuan Basin in southwest China, covering five prefecture-level cities: Luzhou, Yibin, Leshan, Neijiang, and Zigong (Figure 1). The landscape is dominated by hilly terrain and river valley plains. The climate is characterized as humid subtropical monsoon, with annual precipitation ranging from 1000 to 1618 mm and average annual temperatures between 17 °C and 18 °C. Southern Sichuan is interlaced with a dense fluvial network, including navigable sections of the Yangtze River, Minjiang River, and Tuojiang River. Historically, this system served as a major aquatic corridor linking the Chengdu Plain with the middle and lower reaches of the Yangtze River, earning it the name “waterway gateway” of Sichuan [18]. During the large-scale Huguang Migration to Sichuan in the late Ming and early Qing dynasties, settlers entered the region via both overland routes from Guizhou and riverine pathways from Chongqing [19]. The area’s dual advantages in land and water transportation facilitated population inflows, accelerated the restoration of local agricultural systems, and promoted the emergence of villages along rivers and transport routes. As of 2025, 71 traditional villages within the study area were designated in the National Catalog of Traditional Villages (Batches 1–6) by China’s Ministry of Housing and Urban-Rural Development, accounting for 17.9% of all nationally recognized traditional villages in Sichuan Province.

2.2. Data Sources and Processing

This study integrates data from multiple spatial and socioeconomic sources. We obtained the coordinates (WGS 84/EPSG:3395) of traditional villages in southern Sichuan through Baidu Coordinate Picker, based on entries from the National Catalog of Traditional Villages (Batches 1–6) released by China’s Ministry of Housing and Urban-Rural Development. Administrative boundaries and 30 m resolution digital elevation models (DEM) were downloaded from the Geospatial Data Cloud (https://www.gscloud.cn). Vector data for the river network and road network were sourced from the National Geomatics Center of China (https://www.ngcc.cn). County-level socioeconomic indicators, including GDP and urbanization rates, were extracted from local statistical yearbooks and official government portals. Additionally, data on the number of historical docks in each county were derived from archival sources compiled in Chen Junliang’s doctoral dissertation [20]. Data for dialect subregion boundaries were obtained from the Language Atlas of China (1987). The detailed information of the data and the pre-processing methods are as follows (Table 1).

2.3. Methodological Framework

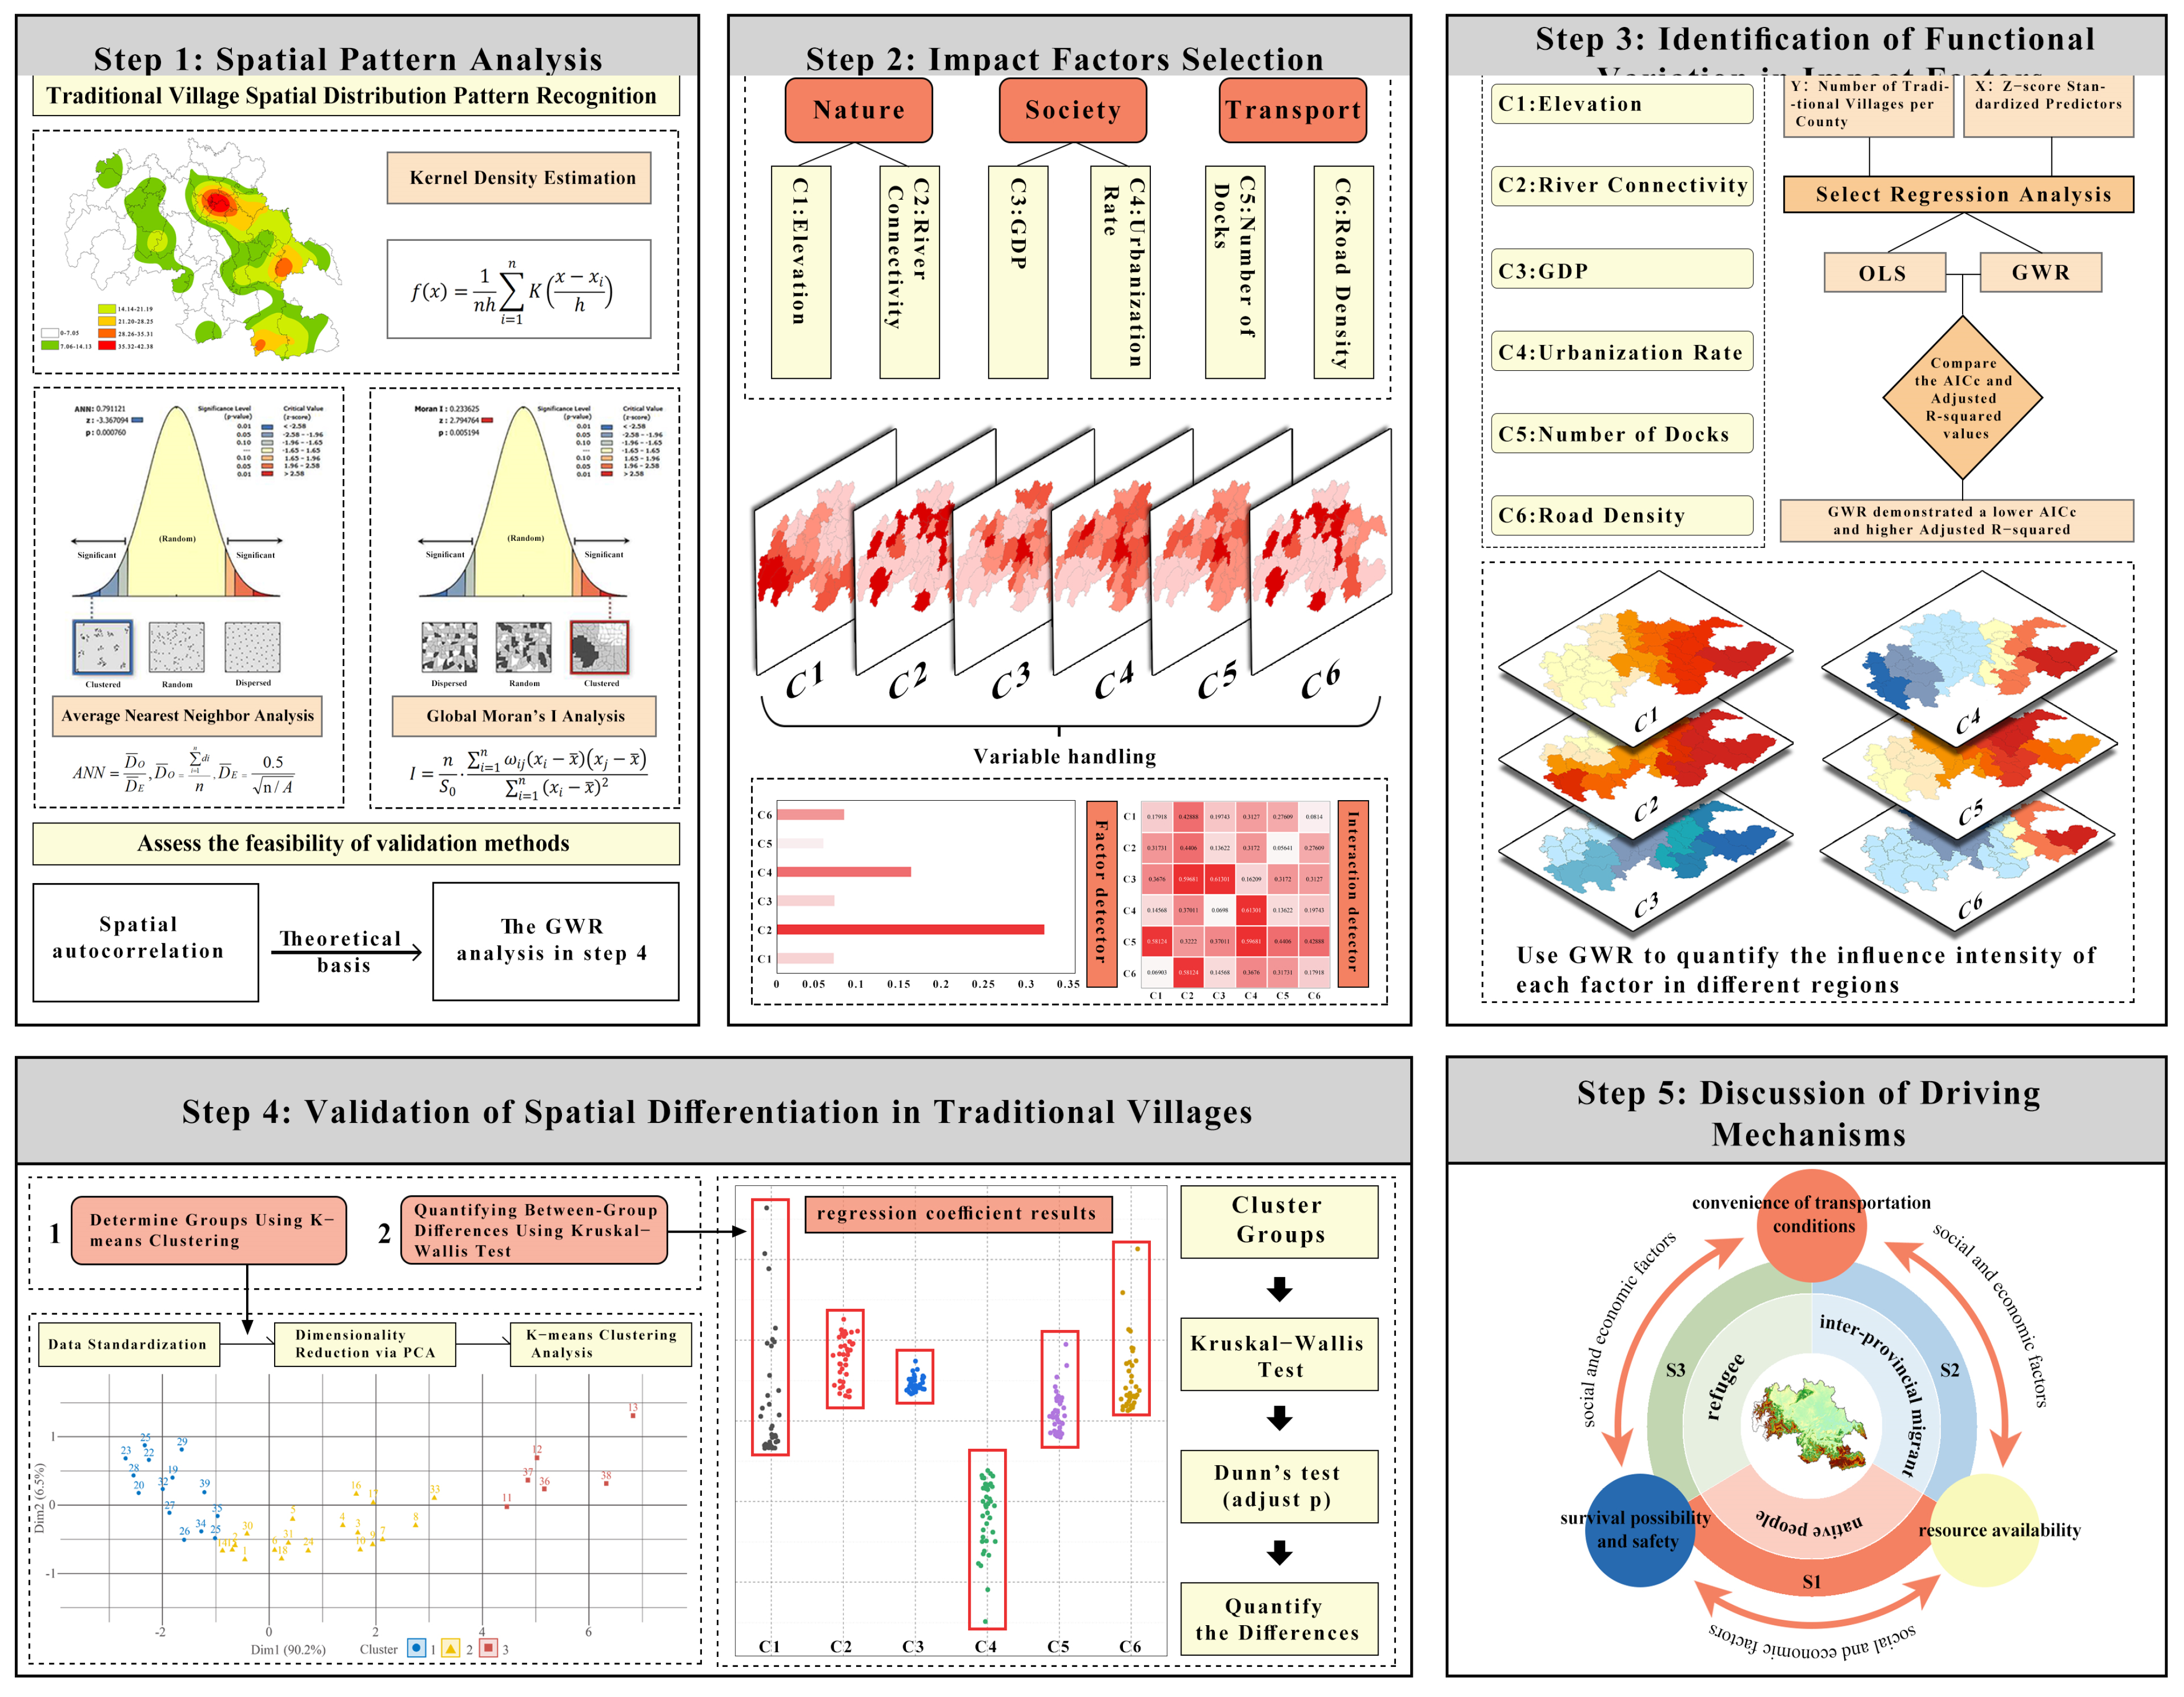
To establish the analytical framework, this study employed Kernel Density Estimation (KDE), Average Nearest Neighbor (ANN), and Global Moran’s I to determine the spatial distribution patterns of traditional villages, laying the foundation for subsequent analysis. Then we employed the Geodetector to quantify the explanatory power of candidate factors using the q-statistic. While its computational efficiency and intuitive interpretation offer advantages, as a globally calibrated model, it fails to capture localized spatial disparities. To address this, we applied Geographically Weighted Regression (GWR) to model spatial non-stationarity, thereby estimating local coefficients that reveal spatial heterogeneity. However, the continuous surface of GWR coefficients poses a challenge for extracting discrete spatial typologies, which hinders the development of targeted recommendations. So we used K-means clustering to reduce the dimensionality of the GWR outputs, grouping spatial units by their coefficient commonalities and variations to derive representative typologies. Since clustering results are sensitive to parameters (e.g., the number of clusters, k), the Kruskal–Wallis test was used to validate the statistical significance of inter-cluster differences, thereby reinforcing the robustness of the derived typology. Finally, we performed a spatial concordance analysis between the derived clusters and the vectorized dialect map, quantifying their degree of overlap to test the central hypothesis. This integrated analytical framework (Figure 2) provides a more comprehensive basis for interpreting the spatial patterns of traditional villages and their underlying driving mechanisms.

2.3.1. Average Nearest Neighbor Index

The Average Nearest Neighbor (ANN) Index is a spatial statistical metric used to measure the degree of proximity among point features [21]. It evaluates whether a given spatial distribution tends toward randomness, dispersion, or clustering by comparing the observed mean nearest neighbor distance with the expected distance under a hypothetical random distribution. As a core indicator in spatial pattern analysis, ANN is widely applied to characterize the spatial arrangement of discrete point-based phenomena.
ANN = D ¯ O D ¯ E , D ¯ O = i = 1 n d i n , D ¯ E = 0 . 5 n / A
where D ¯ O represents the observed mean distance between each feature and its nearest neighbor, while D ¯ E denotes the expected mean distance under a completely random distribution, n is the number of features, and A is the area of the study region. ANN is the Average Nearest Neighbor Index. An ANN value less than 1 indicates a clustered distribution, greater than 1 suggests a dispersed pattern, and equal to 1 reflects complete spatial randomness.

2.3.2. Kernel Density Estimation (KDE)

Kernel Density Estimation (KDE) is employed to identify high-concentration areas of point features across space. In this study, we employed a Gaussian kernel function with bandwidth automatically determined using Silverman’s rule of thumb, which is the default optimization method for Gaussian kernels in ArcGIS. This data-driven approach ensures an objective and smooth density surface that best represents the point data distribution.
f x = 1 nh i = 1 n K x x i h
where K x x i h denotes the kernel function. h represents the bandwidth. x x i refers to the distance.

2.3.3. Global Moran’s I

Global Moran’s I measures the average degree of spatial association among all spatial units across a given region [22]. It is used to evaluate whether the distribution of traditional villages across counties in southern Sichuan exhibits spatial autocorrelation. In this study, we defined spatial neighbors based on the Queen contiguity criterion (CONTIGUITY_EDGES_CORNERS). This approach is particularly suitable for our study area as it effectively captures the potential for spatial interaction (e.g., cultural diffusion) across adjacent units, even when they only meet at a single point.
I = n S 0 · i = 1 n ω ij x i x ¯ x j x ¯ i = 1 n x i x ¯ 2
where n denotes the total number of counties, ω ij represents an element of the spatial weight matrix, indicating the spatial relationship between units i and j. Variables x i and x j are the observed values for units i and j, respectively, representing the number of traditional villages. x ¯ indicates the mean of all observed values, S 0 is the normalization factor for the spatial weight matrix, and I refers to Moran’s I index. A value of I > 0 indicates positive spatial autocorrelation, I < 0 suggests negative spatial autocorrelation, and I = 0 reflects spatial randomness.

2.3.4. Geodetector

Geodetector is a statistical approach for identifying spatial stratified heterogeneity and quantifying the contribution of potential drivers [23]. Its factor detection function evaluates the explanatory power of different variables in shaping the spatial heterogeneity of traditional village counts. In this study, all models were run using the EXCEL Geodetector software (version 2015), which was downloaded from the website (http://geodetector.cn).
q = 1 h = 1 L N h σ h 2 N σ 2
where L denotes the number of strata defined by the independent and dependent variables. N h and N , respectively, represent the number of units in stratum h and in the entire study area. σ h 2 refers to the variance of the dependent variable within stratum h, and N σ 2 indicates the variance of the dependent variable across the whole region. The value of q measures the explanatory power of the independent variable on the dependent variable, ranging from 0 to 1. A larger q value implies stronger explanatory strength.

2.3.5. Geographically Weighted Regression (GWR)

Geographically Weighted Regression (GWR) is a local linear regression technique that models spatially varying relationships [24]. It generates a distinct regression equation at each location within the study area, capturing how the influence of an independent variable on the dependent variable changes across space. This method effectively reveals spatial heterogeneity in factor effects. In this study, we employed an adaptive bandwidth. Compared with a fixed bandwidth, it enhances model stability in areas with heterogeneous data density, similar to the distribution of traditional villages. A bisquare kernel function was applied to calculate the weights of neighboring observations, providing computational efficiency and a clear boundary. The optimal bandwidth was selected by minimizing the corrected Akaike Information Criterion (AICc), which balances goodness-of-fit against model complexity and helps prevent overfitting. In this study, the Geographically Weighted Regression (GWR) was conducted using ArcGIS version 10.5.
y i = β 0 u i , v i + k = 1 n β k u i , v i x ki + ε i
where y i denotes the dependent variable value for the i-th county, and u i , v i represents its spatial coordinates. β 0 u i , v i and β k u i , v i , respectively, refer to the intercept and the regression coefficient of the k-th independent variable at the location of the i-th county. x ki is the observed value of the k-th independent variable in the i-th county, and ε is the random error term.

2.3.6. K-Means Clustering Analysis

K-means clustering, a widely used non-hierarchical method, partitions samples into K clusters by minimizing the within-cluster sum of squared errors (SSE). This approach ensures high internal similarity within clusters and significant heterogeneity between them. In this study, K-means clustering was applied to identify characteristic response patterns to influencing factors across regions, enabling unsupervised classification of traditional villages [25,26]. The optimal number of clusters (K) was determined using the elbow method, following established practices in related studies [27].
d x , C i = j = 1 m x j C ij 2
SSE = i = 1 k x C i d x , C i 2
where x denotes a data object, C i represents the i-th cluster center, m is the number of dimensions of the data object. The x j and C ij are the j-th attribute values of x and C i , respectively. The value of SSE reflects the quality of the clustering result, and k indicates the number of clusters.

2.3.7. Differentiation Analysis (Kruskal–Wallis Test)

The Kruskal–Wallis test is a nonparametric statistical method suitable for small samples [28]. When the assumptions of normality or homogeneity of variance are not met, it serves as an alternative to one-way analysis of variance (ANOVA). It quantifies intergroup differences by constructing a rank-based test statistic and is commonly used to assess whether a continuous or ordinal variable differs significantly across three or more independent groups. In this study, it helps determine whether the influence of a given factor varies significantly among different clusters.
H = 12 N ( N + 1 ) + i = 1 k R i 2 n i 3 N + 1
where k represents the number of groups, N is the total sample size across all groups, n i denotes the sample size of the i-th group, and R i refers to the sum of ranks within the i-th group. H is the test statistic, where larger values of H indicate more significant differences between groups.

2.4. Indicator System

This study developed the indicator system (Table 2) by conducting a thorough review of the literature on traditional village development. Given the distinctive geography and cultural history of southern Sichuan, China, we selected six indicators of three aspects as the independent variables (C): elevation, river connectivity, GDP, urbanization rate, number of historical docks, and road density to examine the spatial heterogeneity of traditional villages. Indicators C1 and C2 represent natural factors, governing land and water availability for settlement and cultivation. C3 and C4 reflect the level of socioeconomic development, determining capital investment capacity in rural development and trends of population mobility. C5 and C6 characterize transportation accessibility from land and water perspectives, shaping the locational advantages and external connectivity of villages. The number of nationally designated traditional villages in each county is used as the dependent variable (Y). Prior to analysis with the Geodetector, each variable (C) was standardized using the Z-score method and then classified into four strata based on the natural breaks method (Jenks).

3. Results

3.1. Spatial Distribution Characteristics

3.1.1. Overall Spatial Distribution Characteristics

The spatial distribution pattern refers to the arrangement of traditional village locations in space, typically categorized as clustered, dispersed, or random. Table 3 shows that the observed mean distance ( D ¯ O ) between villages in southern Sichuan is 12,382 m, while the expected mean distance ( D ¯ E ) under a random distribution is 15,652 m. The resulting Average Nearest Neighbor Index (ANN) is 0.79, with a z-score of −3.367094 (p = 0.00076 < 0.001). The results indicate a statistically significant clustered distribution pattern of traditional villages in southern Sichuan.
Additionally, Table 4 shows a Moran’s I value of 0.233625 (p = 0.005194 < 0.01) for traditional villages in southern Sichuan. This indicates a significant positive spatial autocorrelation, meaning that high-value areas tend to cluster with other high values, and low-value areas cluster with low values. This suggests that the clustering is not merely geographical but also driven by underlying spatial processes and influencing factors.

3.1.2. Distribution Density

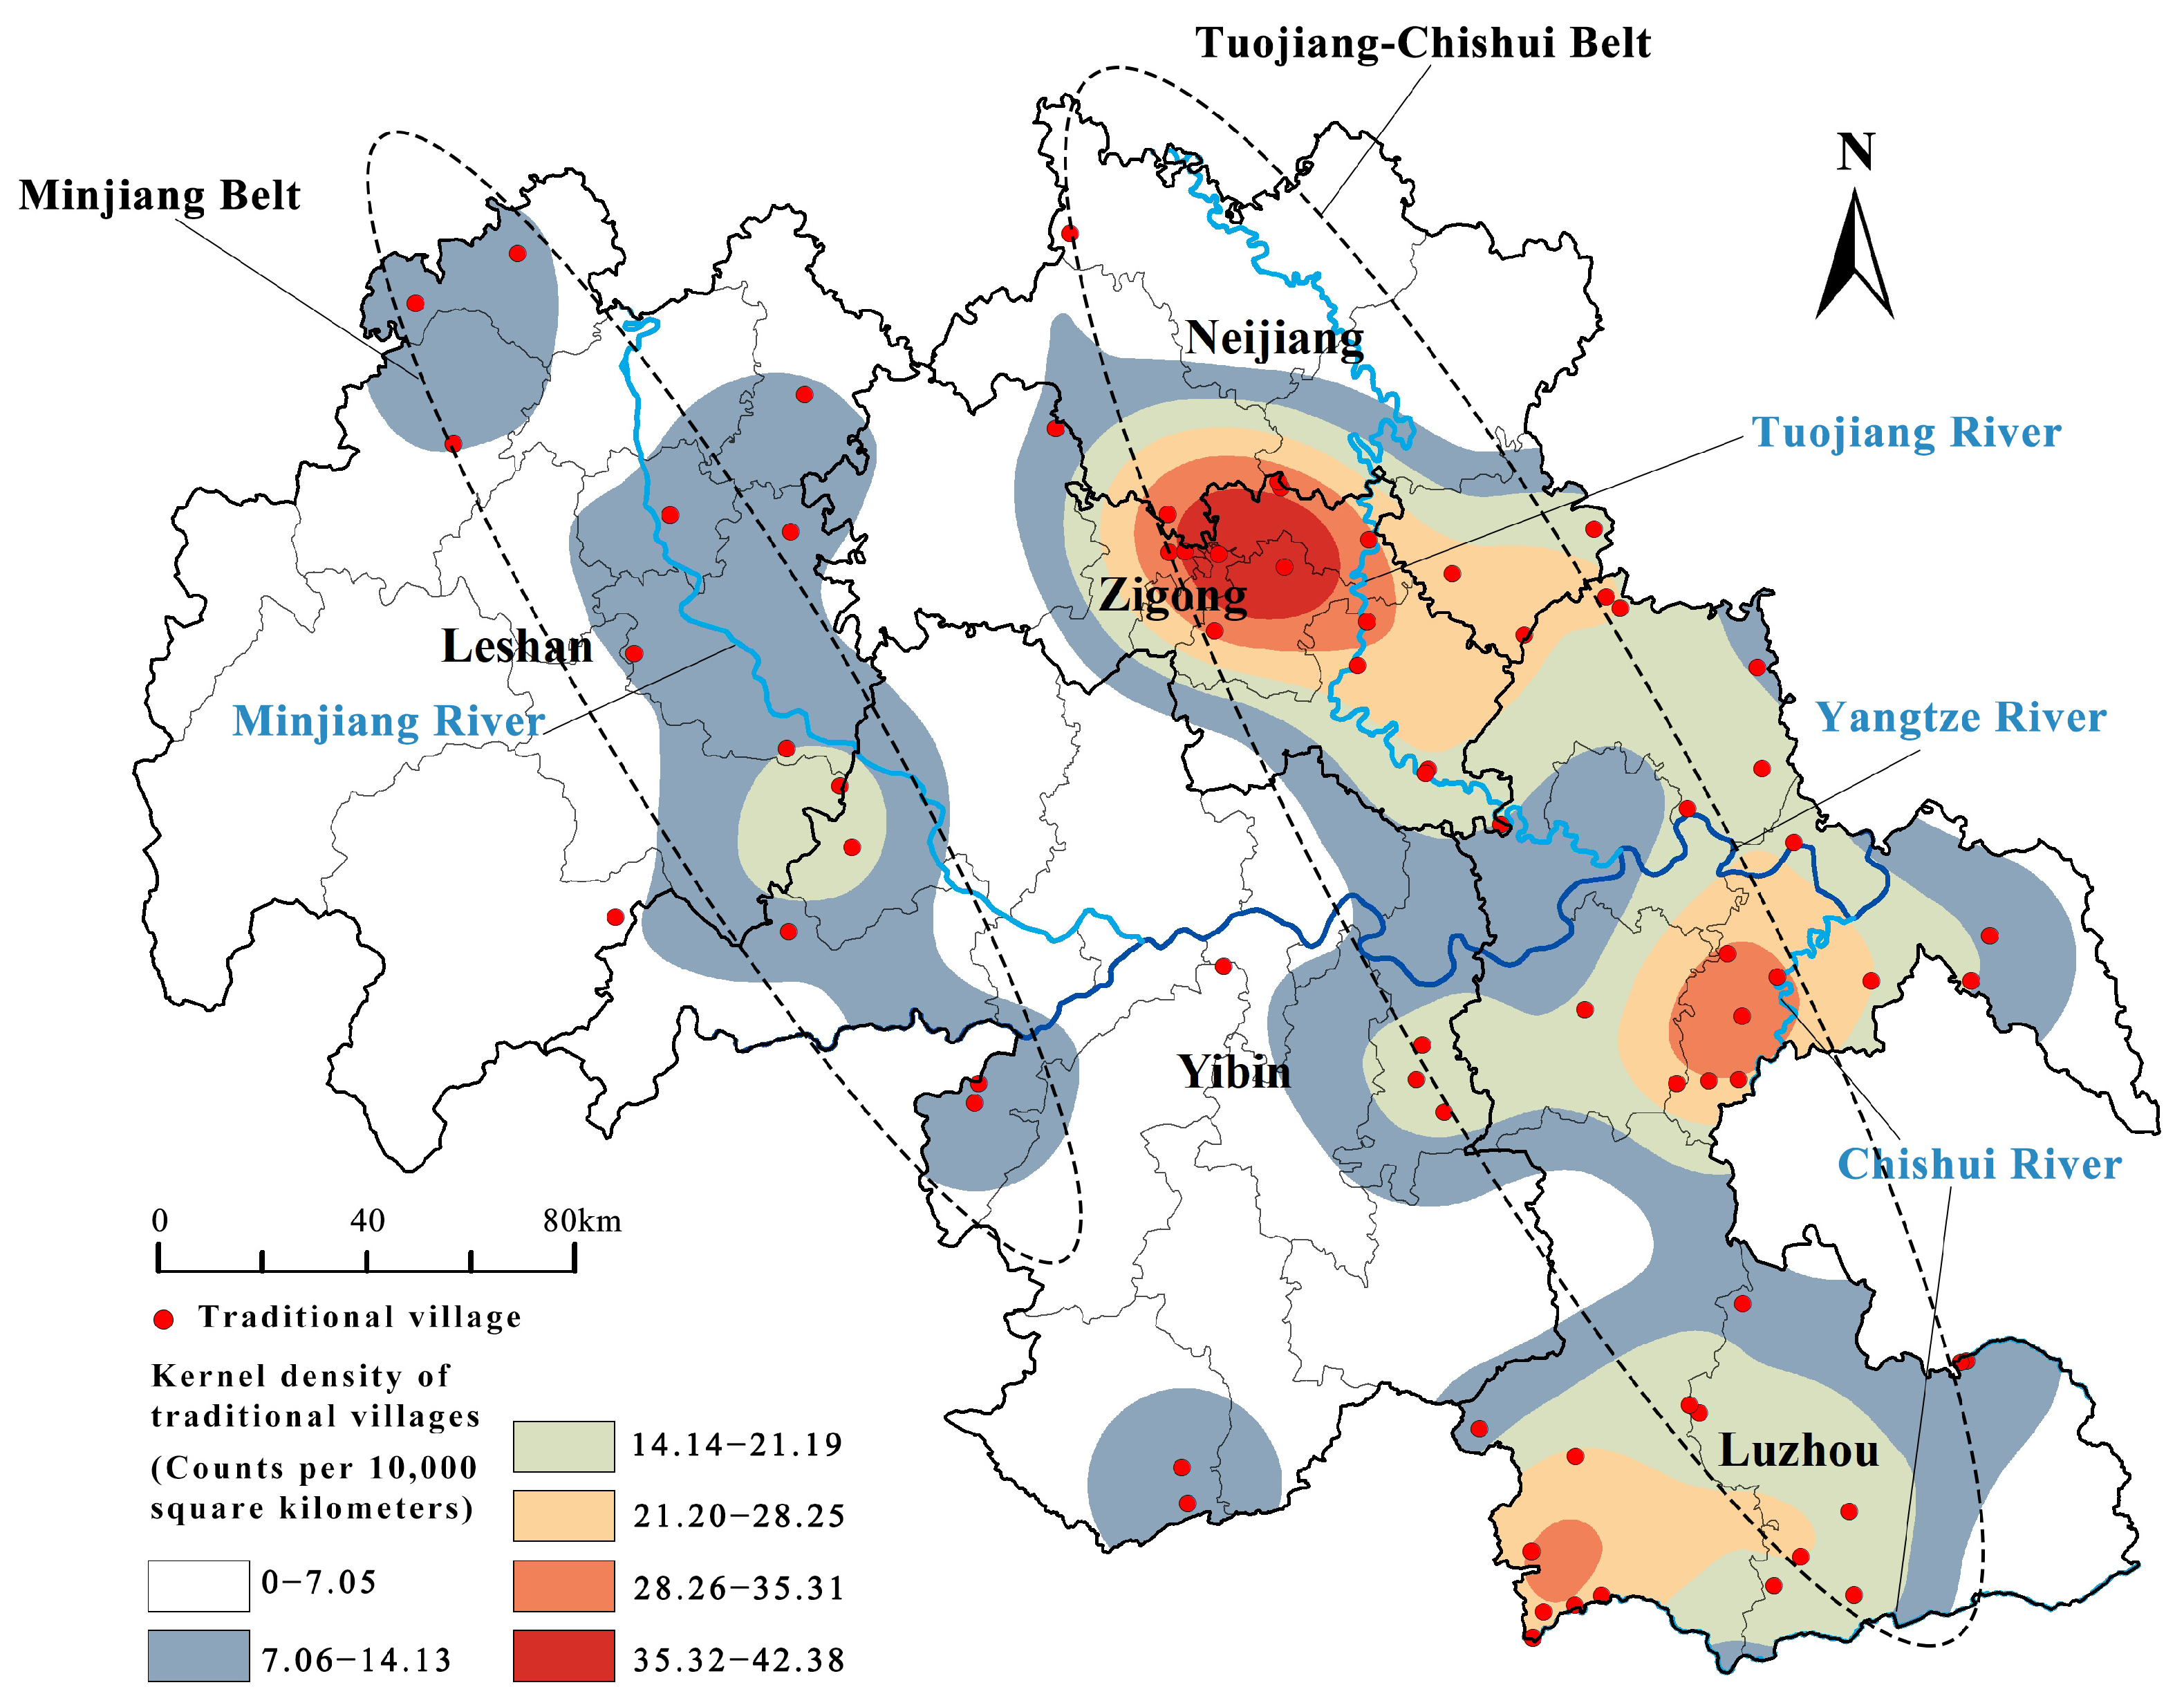
Figure 3 reveals that traditional villages in southern Sichuan exhibit a predominantly linear belt-like distribution pattern. Two approximately parallel high-density zones emerge along major river systems. The first belt extends along the Tuojiang and Chishui River basins, where a core concentration of villages forms in northern Zigong and southern Neijiang, accompanied by two secondary density clusters in eastern and southern Luzhou. The second belt follows the Minjiang River, with a smaller high-density core located in southeastern Leshan and western Yibin.

3.2. Detection of Driving Factors Behind Spatial Heterogeneity

Table 5 shows varying explanatory power among the six selected indicators in driving the spatial heterogeneity of traditional village distribution across southern Sichuan. According to the q-values from the factor detection, the driving factors are ranked as follows: river connectivity (C2) > urbanization rate (C4) > road density (C6) > GDP (C3) > elevation (C1) > number of historical docks (C5). These results suggest that proximity to rivers, urbanization level, and transportation infrastructure are the three most influential factors shaping the spatial distribution of traditional villages in the region.
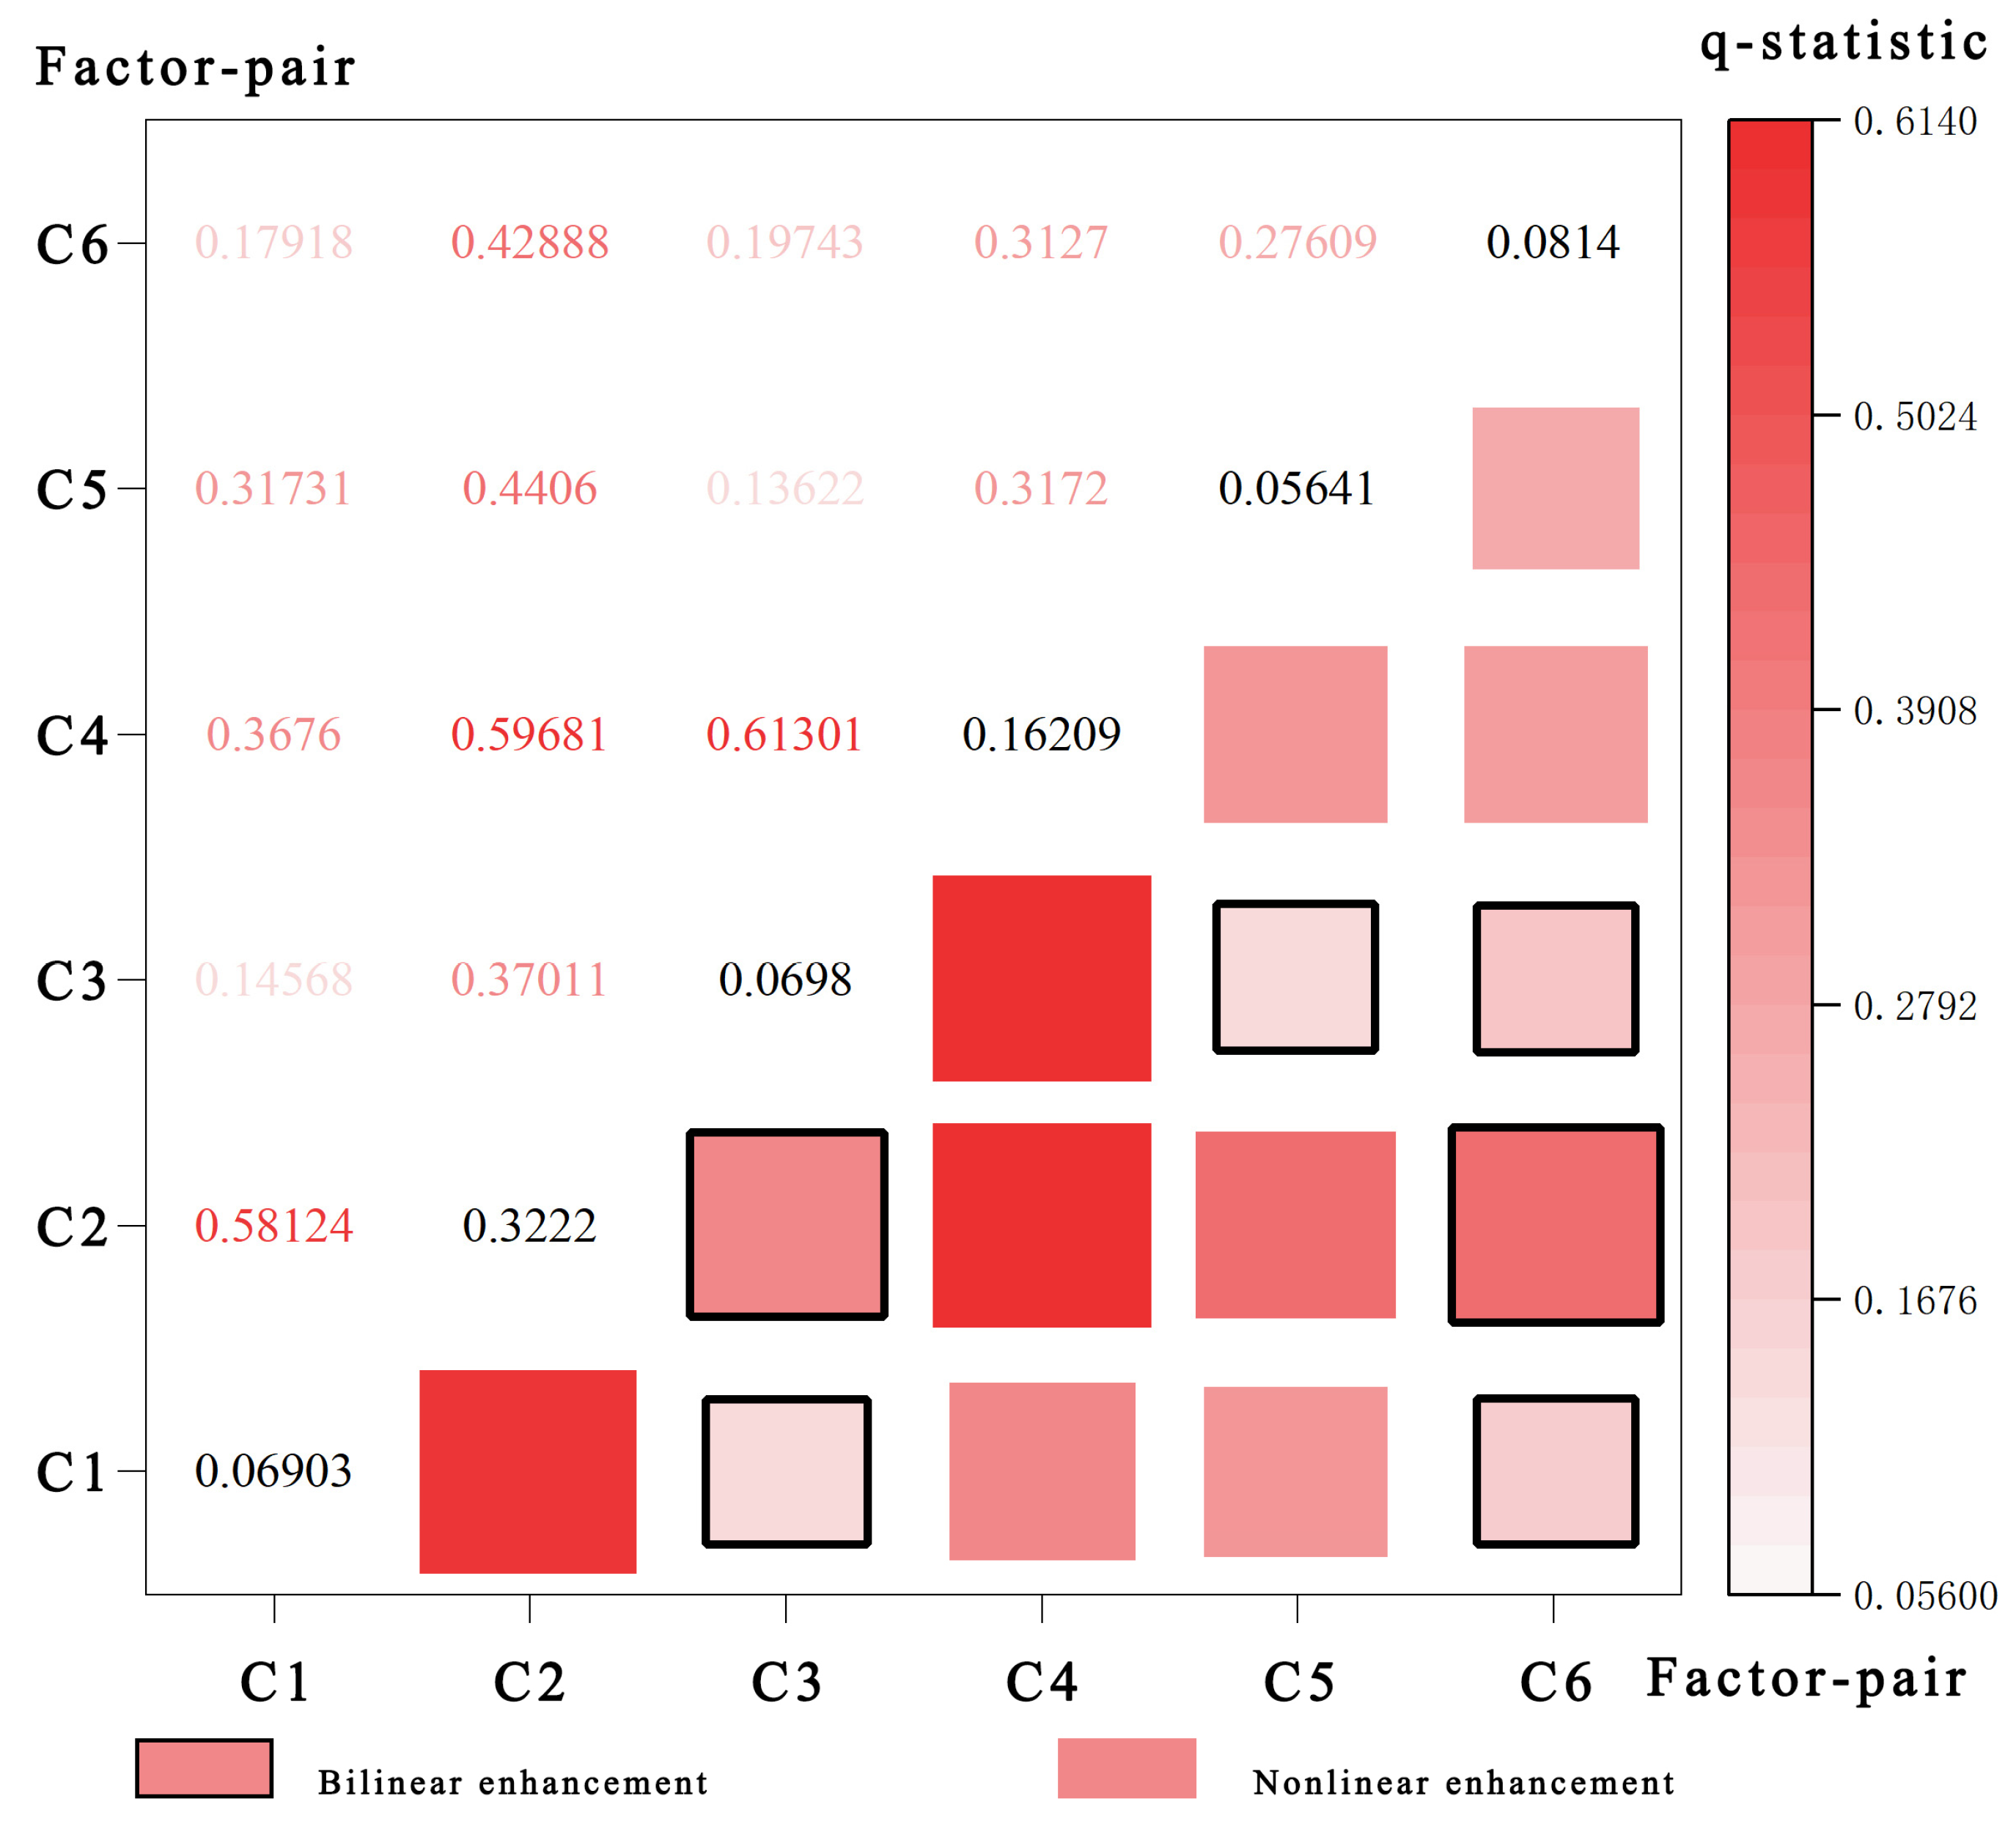
Further interaction detection (Figure 4, Table 6) indicates that the combined effects of certain variables significantly enhance explanatory power. Specifically, the interactions of elevation (C1) ∩ river connectivity (C2), river connectivity (C2) ∩ urbanization rate (C4), and GDP (C3) ∩ urbanization rate (C4) yield the highest q-values—0.581, 0.597, and 0.613, respectively. In terms of interaction types, pairs such as elevation (C1) with GDP (C3) and road density (C6); road density (C6) with river connectivity (C2) and GDP (C3); and GDP (C3) with river connectivity (C2) and number of historical docks (C5) exhibit bilinear enhancement effects. All other combinations exhibit nonlinear enhancement, meaning that any two-factor interaction contributes more explanatory power than either factor alone. This further illustrates that the spatial distribution of traditional villages in southern Sichuan results from the combined influence of multiple factors.

3.3. Results of Geographically Weighted Regression Analysis

3.3.1. Comparison of Preliminary Methods

The dependent variable Y represented the number of national-level traditional villages. Independent variables C comprised six standardized factors: elevation, river connectivity, GDP, urbanization rate, number of docks, and road density. Both Ordinary Least Squares (OLS) and Geographically Weighted Regression (GWR) models were applied. Table 7 demonstrates GWR’s superior performance: higher adjusted R2 (0.701 > 0.279) and lower AICc (152.89 < 177.25). This confirms GWR’s statistical superiority over OLS, justifying subsequent spatial non-stationarity analysis.
To validate the effectiveness of the GWR model in addressing spatial dependence, we examined the spatial autocorrelation of the model residuals and the condition numbers for each variable. Figure 5a shows that the Global Moran’s I for the GWR residuals is 0.07, with a statistically non-significant p-value of 0.28 (p > 0.05). This indicates that the residuals are randomly distributed in space with no discernible pattern. Figure 5b shows that the maximum condition number for the counties is 6.44478 (<30), indicating the absence of multicollinearity among the independent variables in every county. Therefore, it can be concluded that the GWR model successfully captured the spatial processes in the data, and the residual spatial autocorrelation was effectively removed.

3.3.2. Regression Results

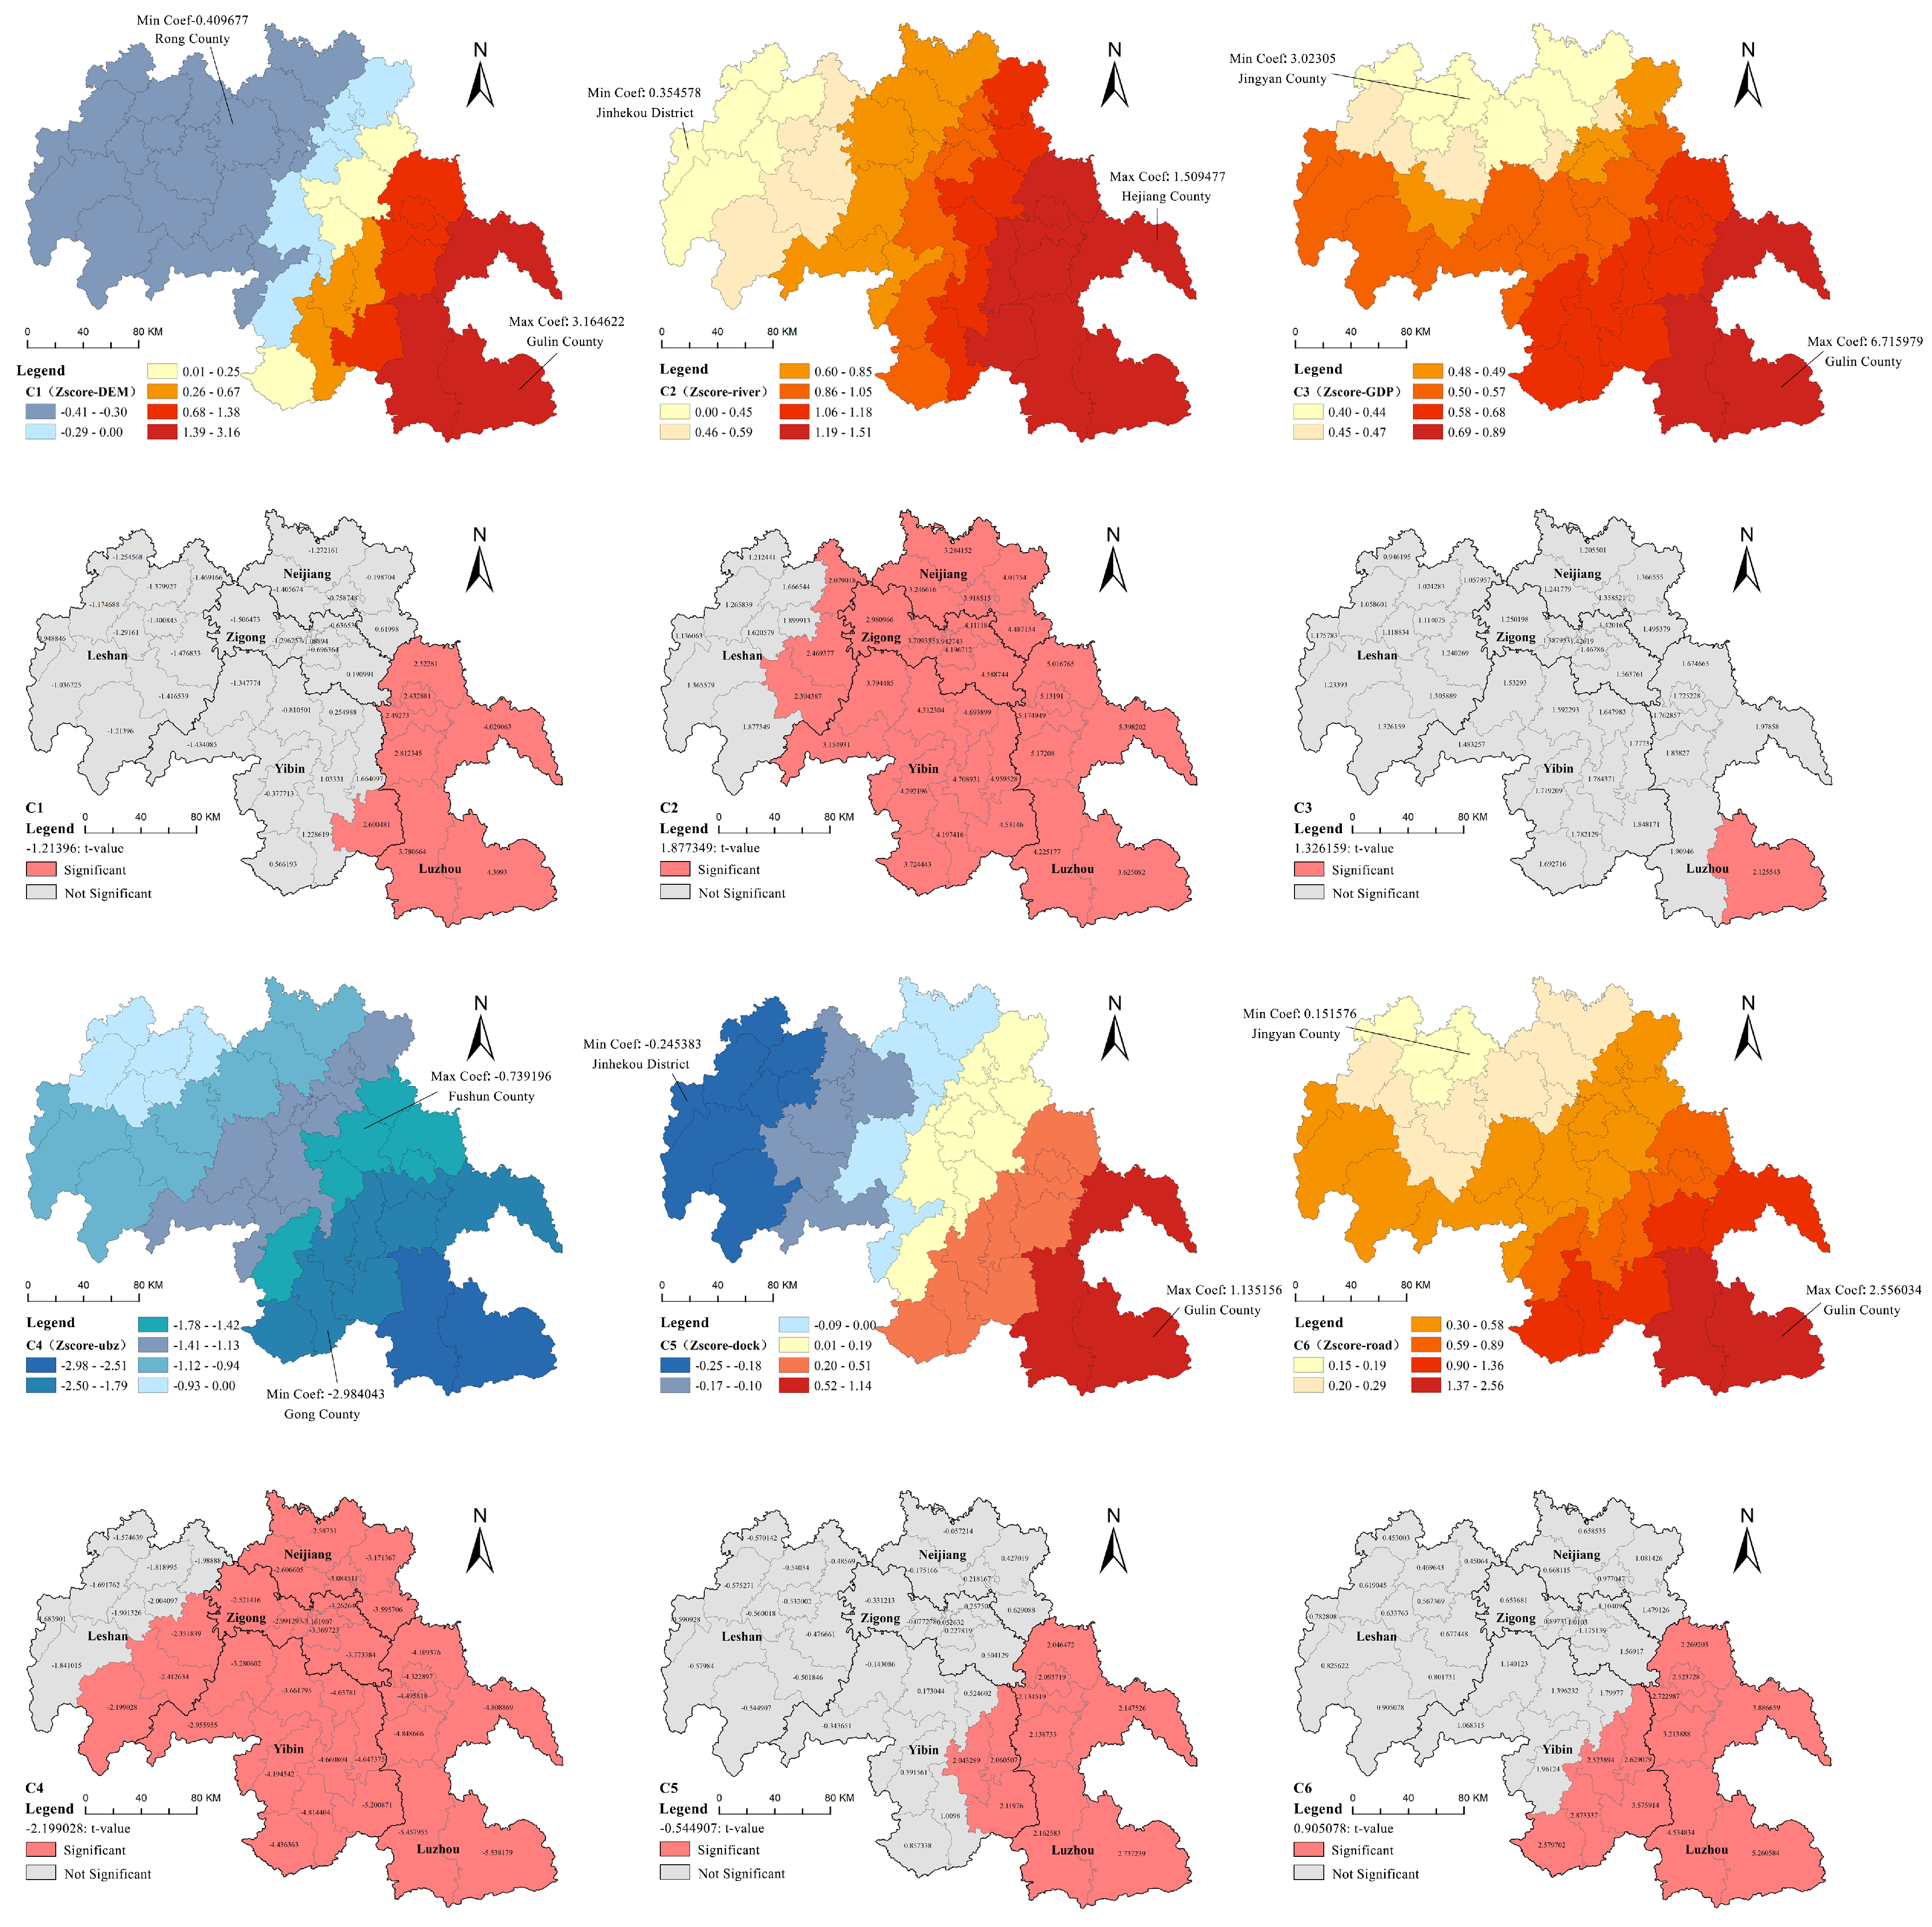
We classified the spatially varying coefficients into six tiers using the Jenks Natural Breaks algorithm. These tiers were further distinguished by sign into positive associations, suggesting a promotive effect on village distribution, and negative associations, indicating an inhibitory effect. Figure 6 demonstrates pronounced spatial heterogeneity in driver influences across southern Sichuan: River connectivity (C2), GDP (C3), and road density (C6) exhibited exclusively positive effects, while urbanization rate (C4) showed uniformly negative impacts. Elevation (C1) and dock density (C5) displayed spatially divergent effect directions, transitioning between positive and negative influences across subregions.

3.4. Clustering Analysis Results

The elbow method identified the inflection point in the within-cluster sum of squares (WCSS) relative to cluster number (k), determining k = 3 as optimal, with a silhouette score of 0.553 (Figure 7a). This indicates three distinct driving patterns for traditional villages in southern Sichuan. The coefficients of six influencing factors were constructed as a six-dimensional vector. Prior to principal component analysis (PCA), all input variables were standardized using the Z-score method to ensure comparability across scales. PCA was then performed to reduce data dimensionality. The first two principal components (PCs), which collectively accounted for 96.7% of the cumulative variance (PC1 = 90.2%; PC2 = 6.5%), were retained for subsequent analysis. K-means clustering subsequently generated distinct spatial clusters. The results (Figure 7b and Table 8) suggest that traditional villages in southern Sichuan can be clustered into three types based on differences in factor influence.

3.5. Difference Analysis

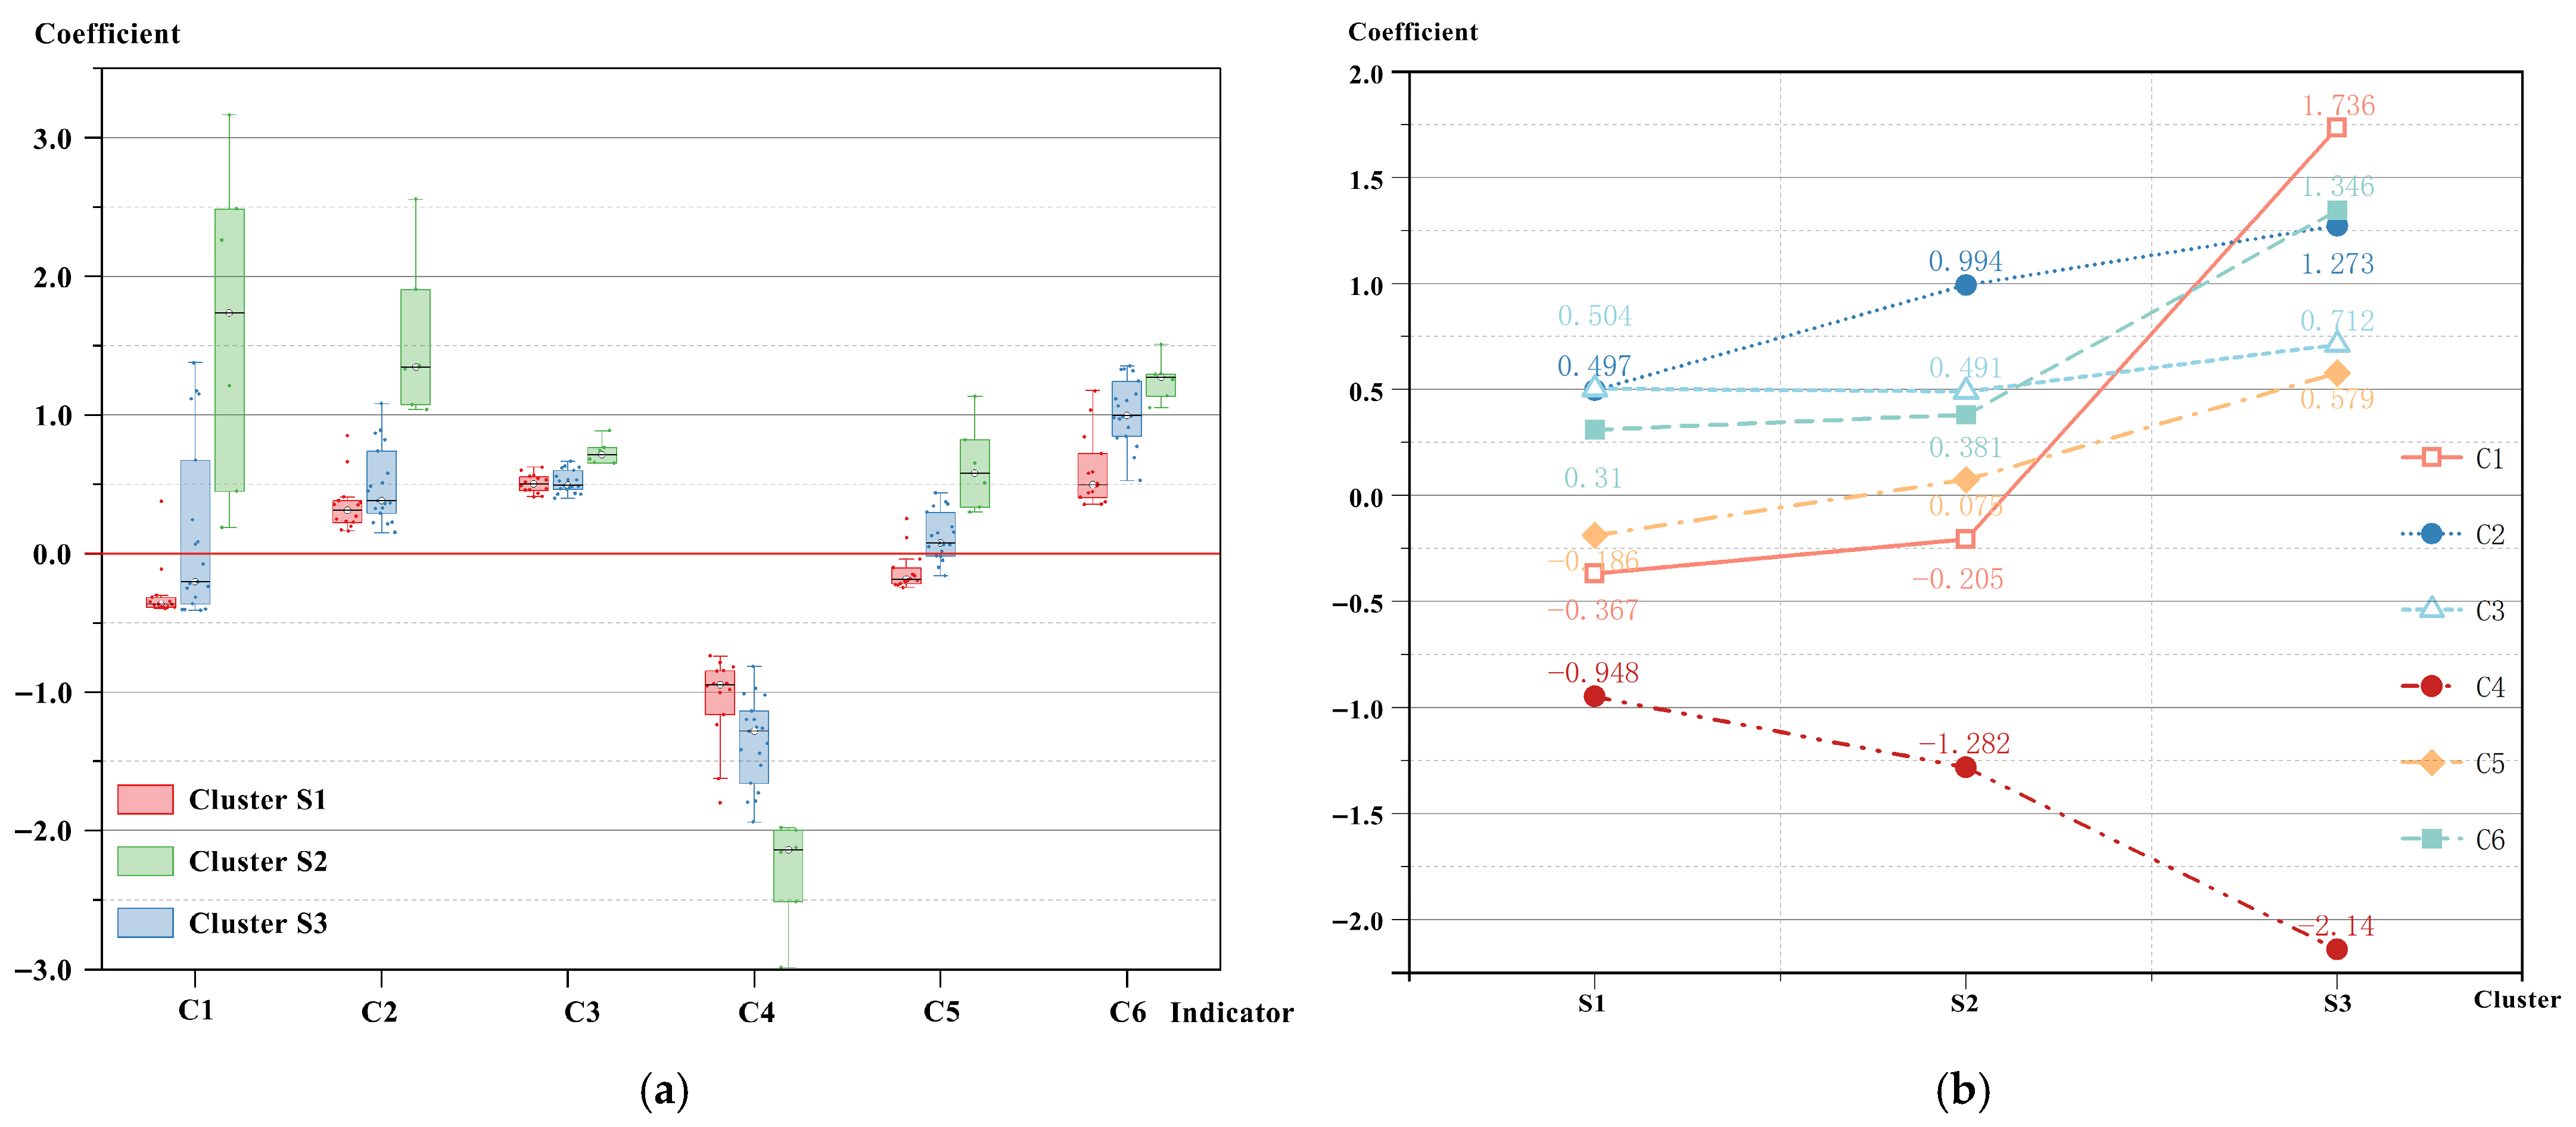
To quantify inter-cluster heterogeneity, cluster type (S) was designated as the categorical variable with county-level regression coefficients of each factor (Y) serving as dependent variables. Kruskal–Wallis tests assessed differentials in regression coefficients across clusters, revealing distinct driving mechanisms.
Table 9 and Figure 8 demonstrate significant inter-cluster differences (p < 0.05) for all six factors. Based on H-statistic magnitude, factors ranked as: number of historical docks (C5) > urbanization rate (C4) > river connectivity (C2) > road density (C6) > elevation (C1) > GDP (C3). The top-ranked factors (C5, C4, C2) exhibited strong variation (η2 > 0.4), while others showed moderate effects (0.25 < η2 < 0.4), confirming meaningful differentials across all drivers.
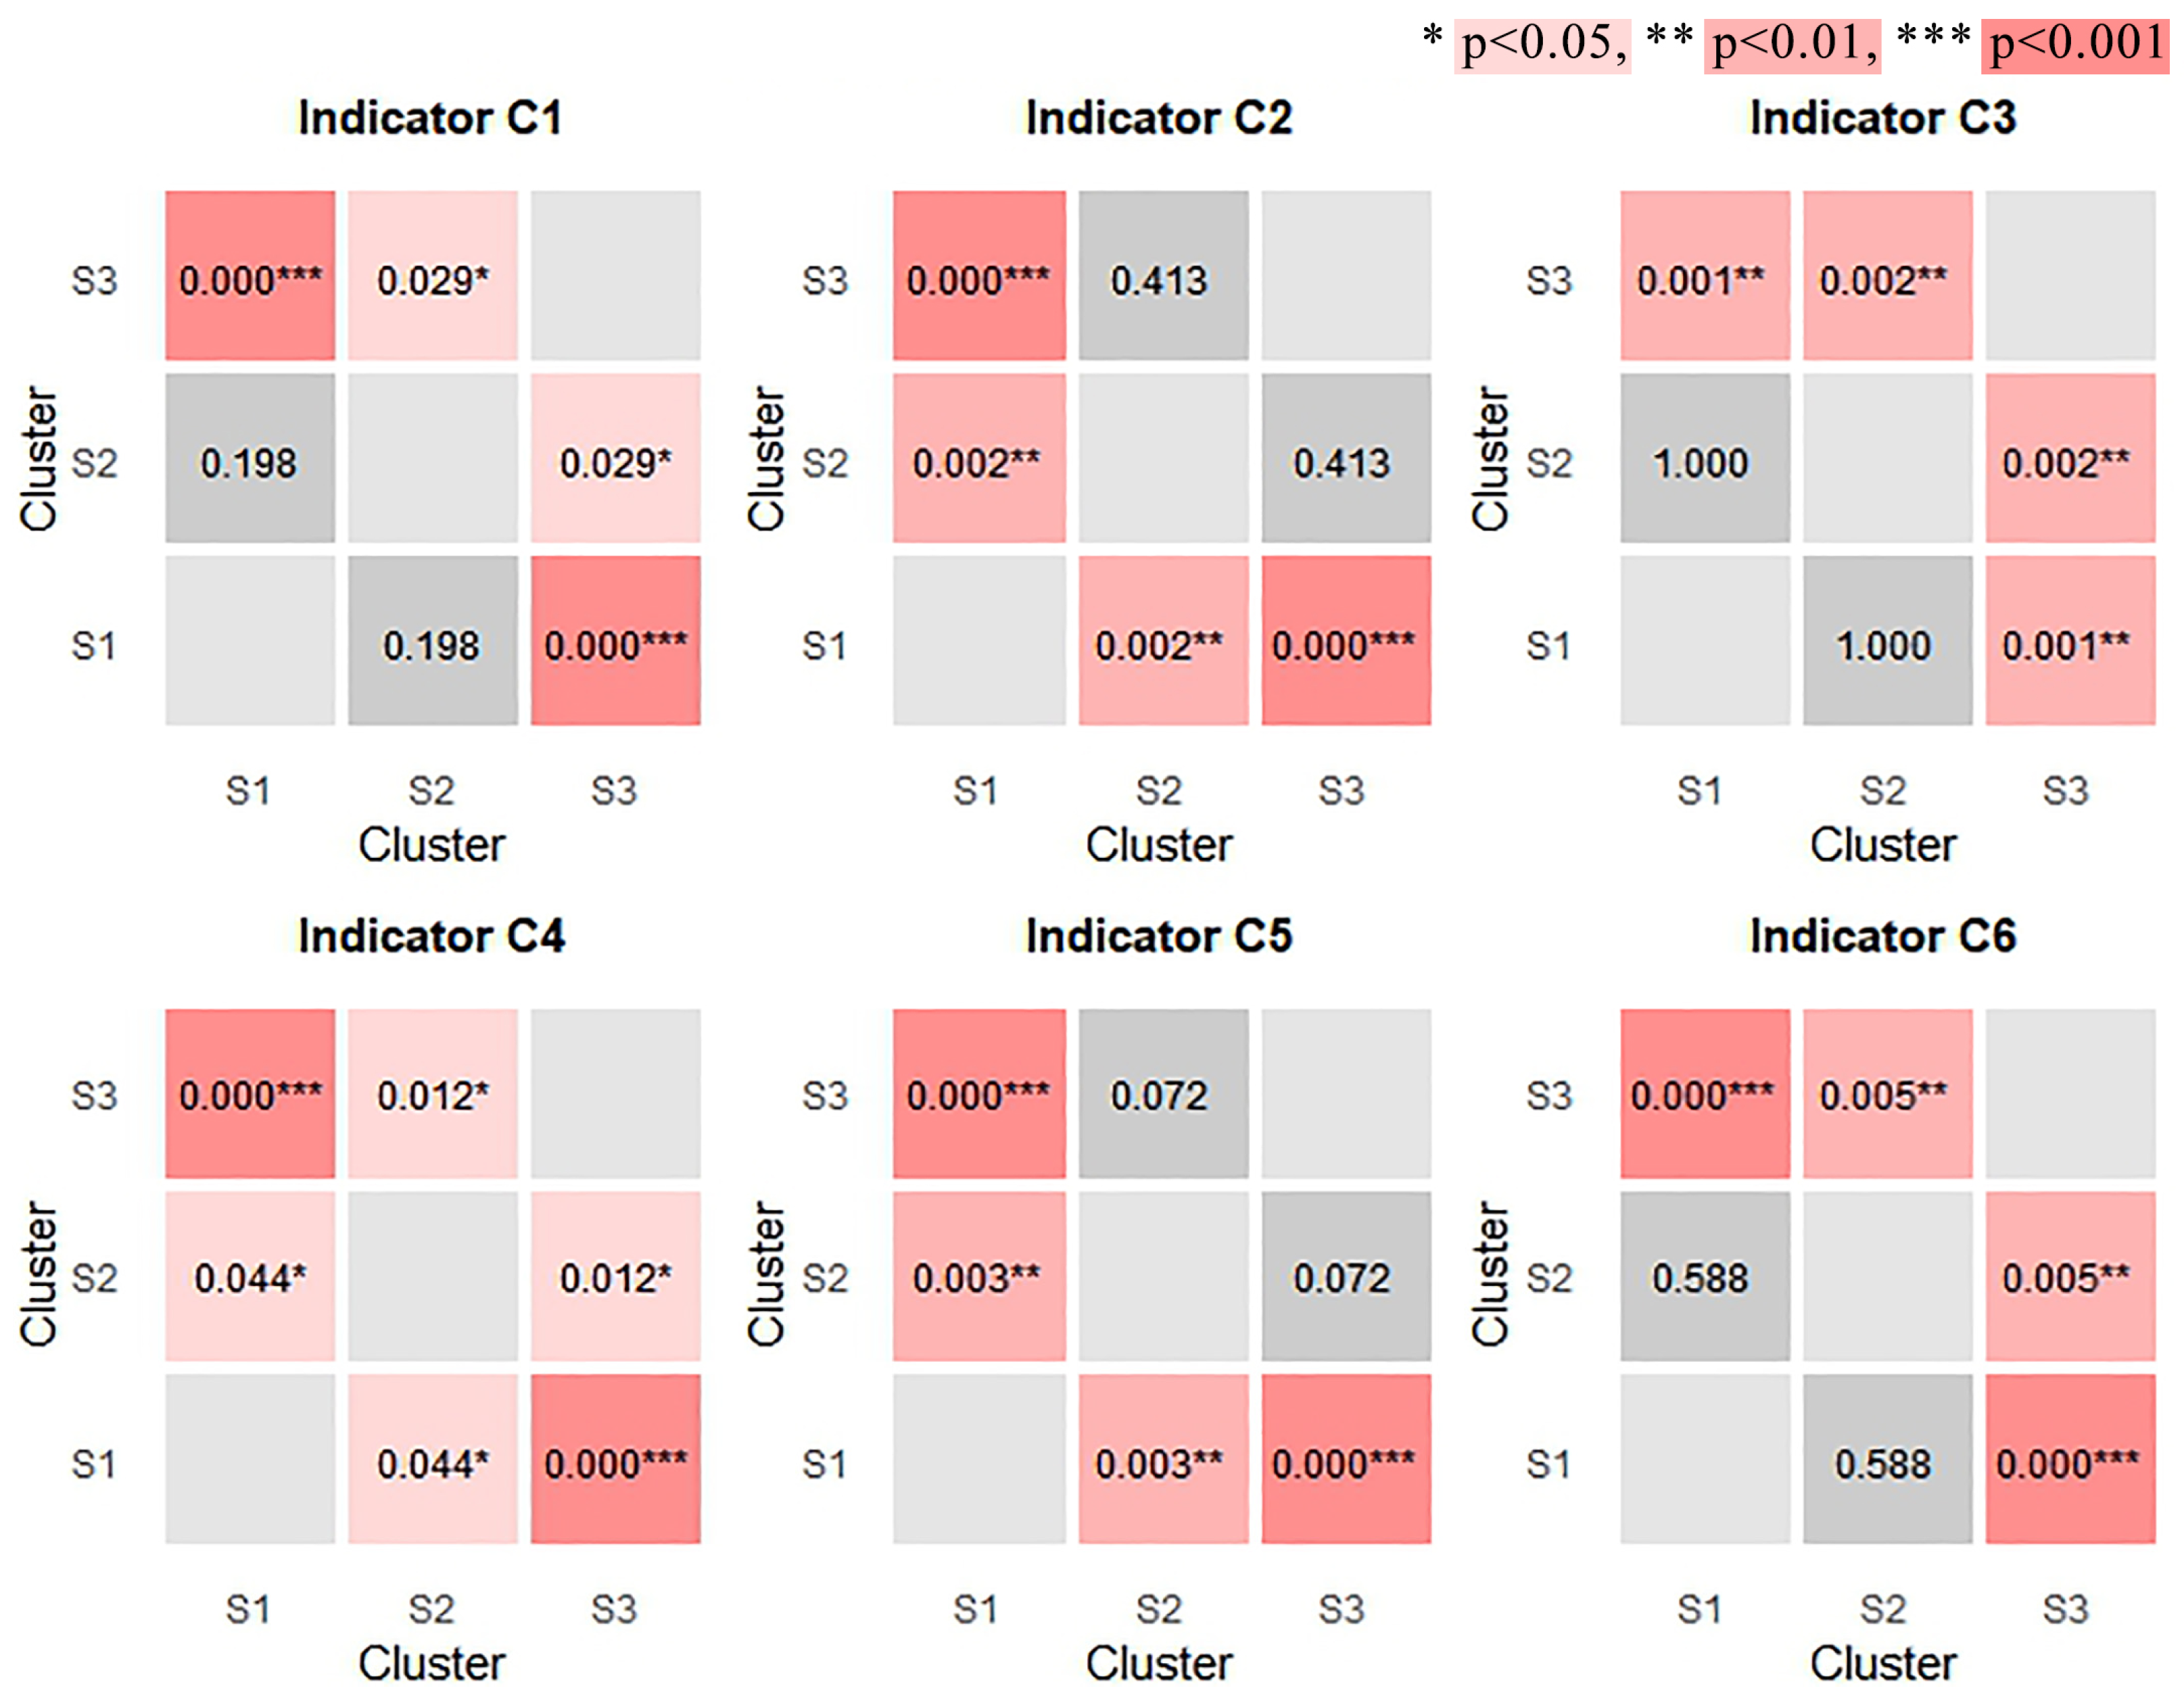
The statistically significant Kruskal–Wallis test was followed by Dunn’s post hoc test for pairwise comparisons. To control the family-wise error rate across multiple comparisons, the p-values from Dunn’s test were adjusted using the Bonferroni correction, a conservative adjustment method. These adjusted tests revealed statistically significant pairwise differences for all factors (C1–C6).
The results (Table 10 and Figure 9) demonstrate significantly stronger effects of elevation, urbanization rate, GDP, and road density in cluster S3 than in S1/S2. River connectivity effects were comparable between S2 and S3 but significantly stronger than in S1. Urbanization rate exhibited significant differences across all three clusters. These patterns confirm spatial heterogeneity among traditional villages in southern Sichuan driven by distinct underlying mechanisms.

3.6. Verification of the Spatial Heterogeneity

Linguistic research [29] classifies southern Sichuan dialects into two branches: Minjiang and Renfu subregions. The Minjiang subregion spans areas west of the Minjiang River and south of the Yangtze River, encompassing parts of Leshan, Yibin, and Luzhou. It exhibits greater internal divergence with distinctive phonetic variations. Conversely, the Renfu subregion occupies prefecture-level cities northeast of the Minjiang River along historical migration corridors, demonstrating higher linguistic consistency [30]. This dialectal bifurcation reflects divergent evolutionary pathways: The Minjiang subregion primarily comprises indigenous populations with long-term linguistic evolution, fostering substantial internal diversity. But the Renfu subregion predominantly descends from late Ming-early Qing migrants (Hu-Guang Migration to Sichuan), resulting in shorter local linguistic development and greater uniformity.
Given that population mobility drove dialect differentiation, we investigated whether traditional village distributions reflect analogous migration influences.
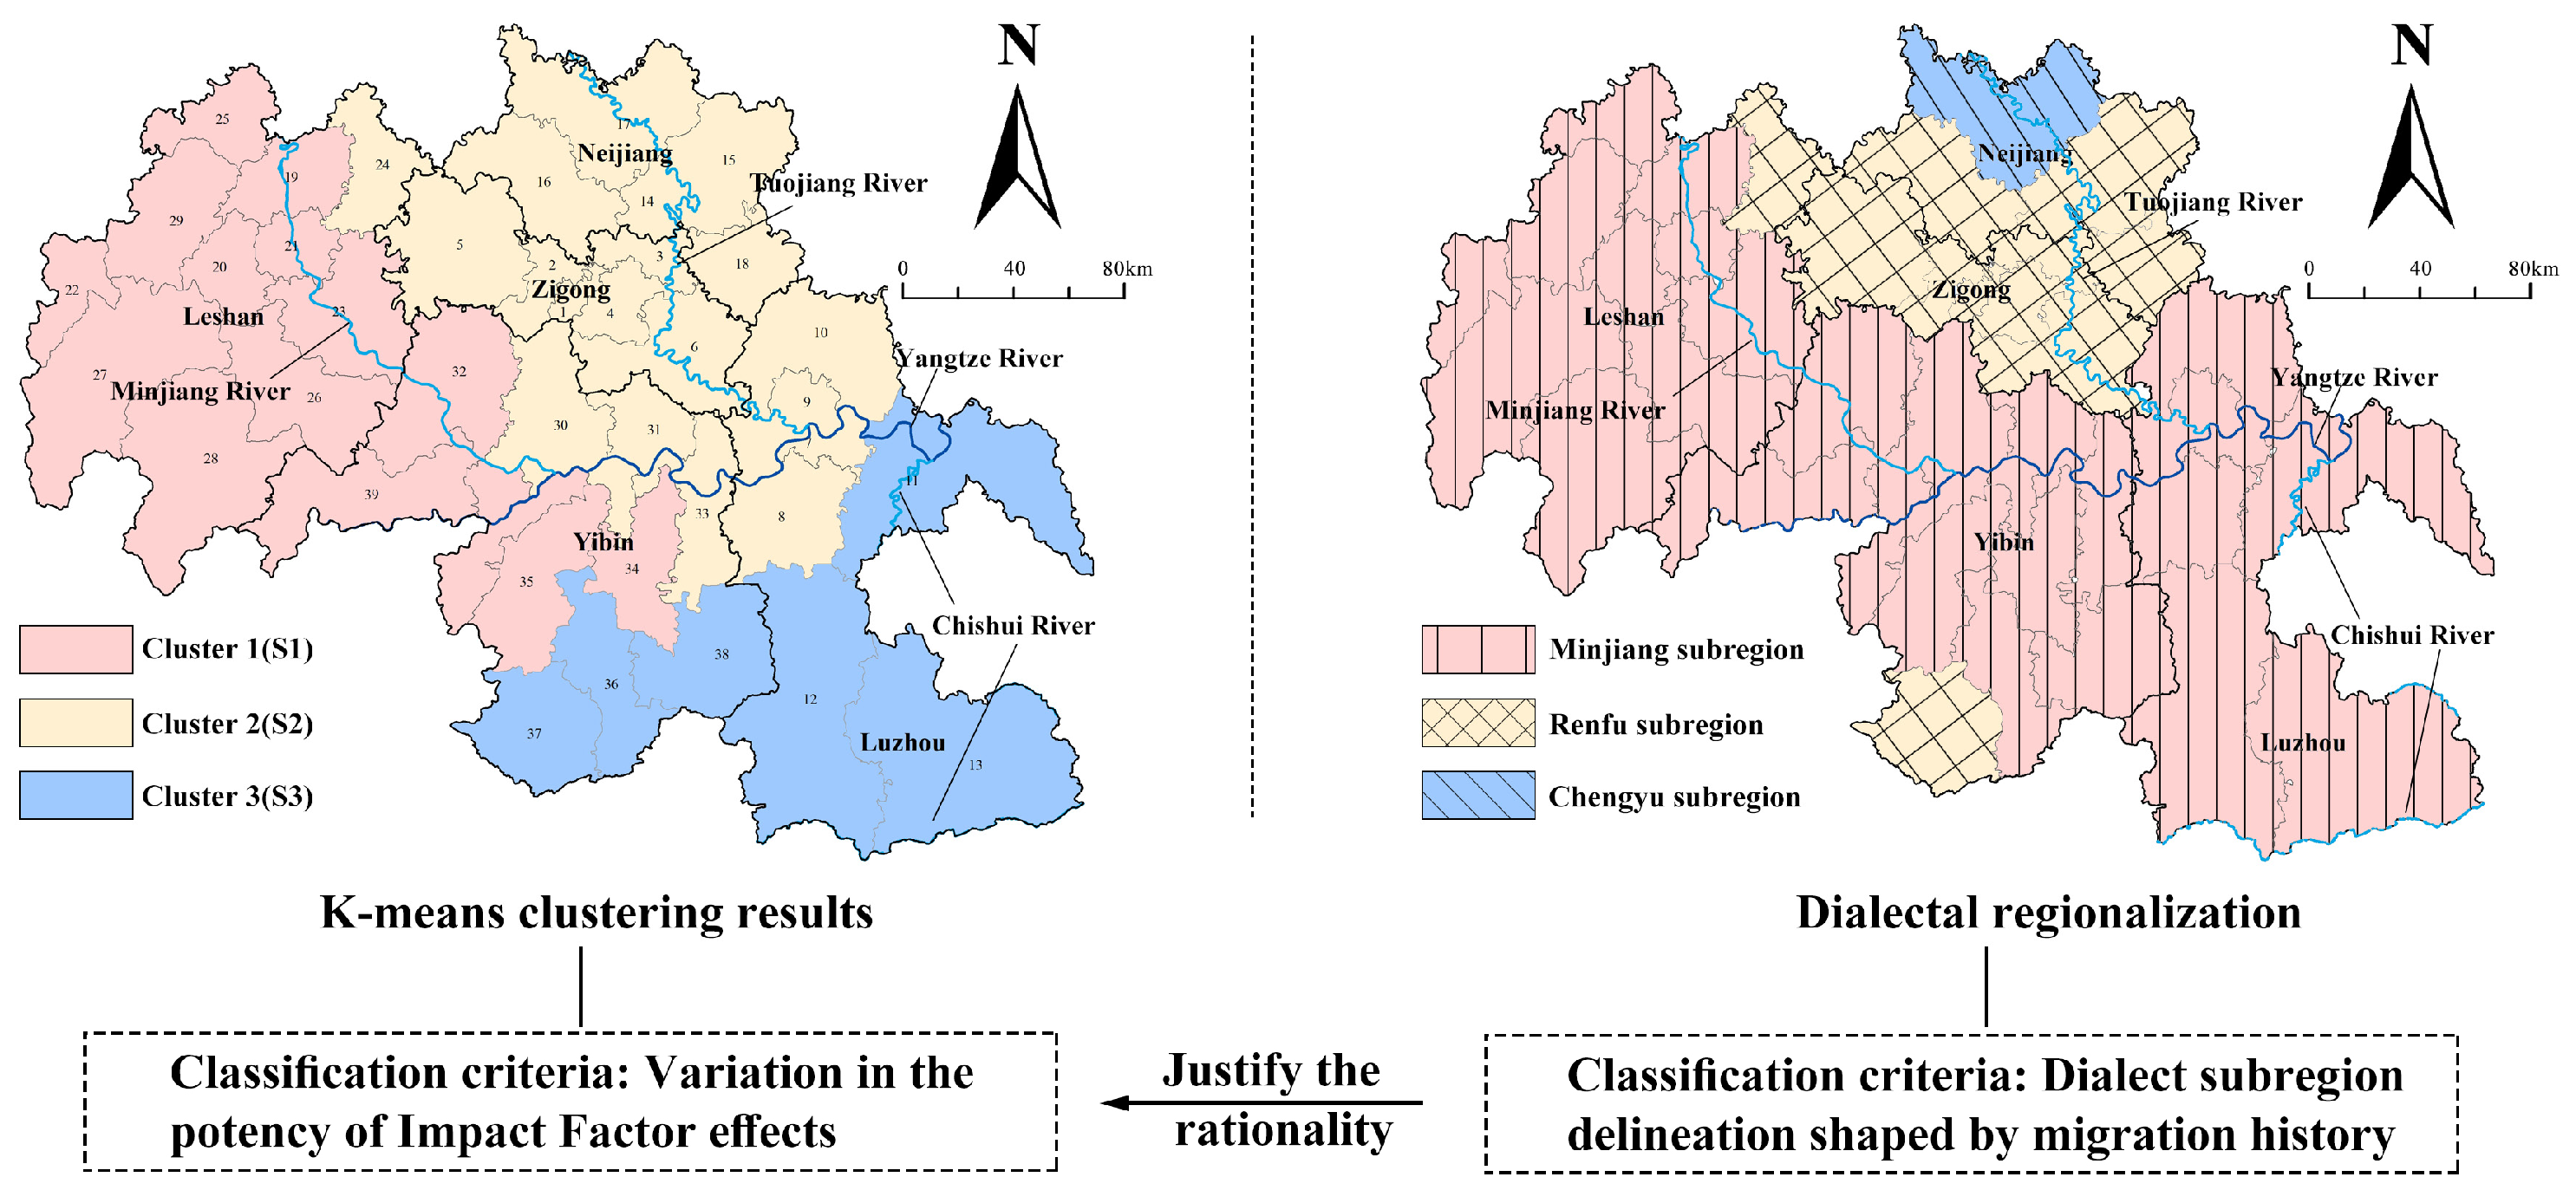
To test this hypothesis, we spatially compared previously mapped dialect boundaries [31] with the K-means clustering results. This analysis revealed a strong correspondence between them (Figure 10 and Table 11): Cluster S1 corresponds to the Minjiang subregion, characterized by indigenous village communities. Cluster S2 matches the Renfu subregion, dominated by Hu-Guang migrant-descended populations. Specifically, all of the counties in cluster S1 fell within the Minjiang subregion (ARI = 1), and 58% of the counties in cluster S2 fell within the Renfu subregion (ARI = 0.579). Although Cluster S3 exhibits no corresponding dialect subregion, its spatial validity is reinforced by archival historical evidence [32]. These historical archives reveal that late Ming-early Qing warfare severely impacted eastern/northern Sichuan, whereas southern regions (excluding Luzhou) largely preserved indigenous populations through negotiated surrenders. Concurrently, refugees from war-torn northern/eastern areas migrated to southern Sichuan and adjacent Guizhou/Yunnan regions. Counties like Xingwen, Xuyong, and Gulin likely functioned as temporary sanctuaries, receiving significant refugee influxes. These distinct settlement preferences, shaped by migrants’ sanctuary-seeking behavior, explain why areas within the same dialect subregion fall into different clusters (S1/S3) and clarify the formation of the Renfu subregion’s spatial enclave in southern Sichuan.

4. Discussion

4.1. Mechanism of the Spatial Heterogeneity

Drawing on migration history and linguistics, and corroborated by historical records, the spatially heterogeneous factor influences across clusters can be systematically explained:

4.1.1. Elevation

Significant differences in elevation (C1) were observed between Cluster S1 and S3 (p = 0.000 < 0.001) and between Cluster S2 and S3 (p = 0.029 < 0.05), with median differences of −2.102 and −1.94, respectively (Table 10). No significant difference was found between Cluster S1 and S2. These results indicate a stronger elevation effect on traditional village distribution in Cluster S3. The median value for S3 was positive, while those for S1 and S2 were negative. This suggests that higher elevations correspond to more traditional villages in S3, but fewer in S1 and S2.
Most residents in Cluster S3 descended from migrants who fled warfare and tusi rule during the late Ming and early Qing periods. For these migrants, settlement safety was the primary concern. As a result, they often favored higher and more remote mountainous areas over flat plains. In contrast, residents of Clusters S1 and S2, without similar security-driven pressures, preferred low-lying plains with flatter terrain for settlement.

4.1.2. River Connectivity

Significant differences in river connectivity (C2) were found between Cluster S1 and S2 (p = 0.002 < 0.01), and between Cluster S1 and S3 (p = 0.000 < 0.001), with median differences of −0.497 and −0.776 (Table 10). No significant difference was observed between Cluster S2 and S3. This suggests that river connectivity had a stronger influence on Clusters S2 and S3 than on S1.
Traditional villages in S2 and S3 were primarily settled by migrants or refugees. Due to underdeveloped land transportation in historical times, most migration relied on waterways. The dense river network in southern Sichuan facilitated such movement. Although S2 and S3 belong to different clusters, both were shaped by migration. Hence, the river network played a greater role in these areas than in S1, where indigenous residents dominated.

4.1.3. GDP and Urbanization Rate

Significant differences in GDP (C3) were observed between Cluster S1 and S3 (p = 0.001 < 0.01), and between Cluster S2 and S3 (p = 0.002 < 0.05), with median differences of −0.208 and −0.221 (Table 10). No significant difference was found between Clusters S1 and S2. This indicates a stronger influence of GDP on traditional village distribution in Cluster S3. Urbanization rate (C4) also showed significant variation. The median value in Cluster S1 was significantly higher than in S2 (p = 0.044 < 0.05) and S3 (p = 0.000 < 0.001), with differences of 0.334 and 1.191. Cluster S2 also had a higher median than S3 (p = 0.012 < 0.05), with a difference of 0.858.
These findings suggest that socio-economic factors like GDP and urbanization rate exert a stronger influence on Cluster S3. This cluster is largely mountainous, where slower economic development and policy constraints have delayed urbanization. S3 remains in an early acceleration phase, making it more sensitive to socio-economic changes. In contrast, Clusters S1 and S2, located in more economically advanced plains, have entered more stable urbanization phases with greater resilience.

4.1.4. Number of Historical Docks

Significant differences in the number of historical docks (C5) were found between Cluster S1 and S2 (p = 0.003 < 0.01), and between Cluster S1 and S3 (p = 0.000 < 0.001), with median differences of −0.26 and −0.765 (Table 10). No significant difference was observed between Clusters S2 and S3. The median C5 value in Cluster S1 was negative (−0.186), while those in Clusters S2 and S3 were positive (0.075 and 0.579) (Table 7). This indicates that historical docks inhibited traditional village development in S1 but promoted it in S2 and S3.
As hubs linking river and land routes, docks represented connectivity in water-dependent regions like southern Sichuan. In Cluster S1, where indigenous residents dominated, higher dock density brought more external disturbance, which threatened existing settlements and reduced village numbers. In contrast, in migrant-dominated Clusters S2 and S3, docks enabled river-based migration and landing, promoting settlement and the formation of more villages.

4.1.5. Road Density

Significant differences in road density (C6) were identified between Cluster S1 and S3 (p = 0.000 < 0.001), and between Cluster S2 and S3 (p = 0.005 < 0.05), with median differences of −1.036 and −0.965 (Table 10). No significant difference was found between Clusters S1 and S2.
These results indicate that road infrastructure had a much stronger influence on Cluster S3. Migrants in S3 prioritized safety when selecting settlement locations. After arriving by river, they tended to move inland and settle in higher, more remote areas. Roads became a key medium for locating suitable sites. In contrast, residents of S1 and S2, unconcerned with safety in the same way, often settled near rivers to reduce cost, making them less dependent on road networks.

4.2. Revisiting Spatial Patterns of Traditional Villages in Southern Sichuan

In previous studies on traditional villages in Sichuan Province, the southern Sichuan region has often been treated as a homogeneous unit. For instance, Chen et al. (2018) reported that traditional villages in this area are predominantly distributed in low-altitude plains and river valleys with slopes of 0–5° [33], and Zheng et al. (2023) identified a distinct clustering of traditional villages along water systems [34]. Although these findings are broadly reasonable at a macro scale, they fail to adequately capture internal differentiations shaped by regional historical and cultural disparities. To address this gap, this study proposed two research questions and employed an integrated analytical framework combining Geographically Weighted Regression (GWR) and K-means clustering to investigate the spatial heterogeneity mechanisms of traditional villages in southern Sichuan. The results demonstrated that various spatial factors, including topography and hydrology, jointly drive the spatial variation in villages. Moreover, under the influence of historical and cultural contexts, the strength and direction of these drivers vary significantly across subregions, which addresses the initial research questions (RQ1 and RQ2). Notably, in contrast to previous macro-level conclusions, this study reveals that docks exert a restraining effect on the distribution of traditional villages in Cluster S1-Indigenous, and villages in Cluster S3-Refugees show a preference for higher-altitude areas. These contrasting findings highlight that the spatial distribution of traditional villages in southern Sichuan is not homogeneous and should not be generalized. Instead, deeper analysis within specific historical and cultural contexts is essential to guide the formulation of tailored and precise conservation strategies.

4.3. Protection and Utilization Strategies Based on Different Clusters

Traditional villages in different clusters require distinct tailored strategies based on their spatial heterogeneity mechanisms. For Cluster S1, where villages originated before the Ming Dynasty and were primarily established by indigenous Sichuan populations, historical continuity and cultural authenticity remain strong. Conservation should emphasize preserving the overall settlement layout and historical fabric, with particular attention to the integrity of traditional architecture and spatial patterns. In Cluster S2, most villages emerged during the Hu-Guang Migration to Sichuan period and are distributed along rivers and transport corridors. These settlements display hybrid cultural features shaped by migration. Conservation strategies should maintain the settlement forms shaped by waterways and transport routes, while highlighting immigrant cultural imprints through measures such as creating riverside heritage trails. For Cluster S3, where villages were largely founded by refugees during periods of conflict, settlements are often located in secure but inaccessible environments such as mountains and gorges. Conservation should focus on maintaining traditional spatial structures while enhancing accessibility of mountain roads to improve connectivity with surrounding regions.

5. Conclusions

This study innovatively established an integrated analytical framework to identify driving factors and explain the mechanisms of spatial heterogeneity of traditional villages in southern Sichuan, China. The results reveal that the influence of geographical factors, such as elevation and the number of docks, is not uniform across the region and sometimes even exerts opposite effects. For instance, river proximity was found to suppress the distribution of traditional villages in Cluster S1, a phenomenon not previously reported in macro-scale studies. Based on this heterogeneity, we derived a typology of traditional villages in southern Sichuan and provided an in-depth interpretation from historical and cultural perspectives. Finally, we proposed tailored strategies for each village type. The key contributions of this study are as follows:
(1)
Methodological innovation: By integrating GWR, K-means clustering, and the Kruskal–Wallis test, this integrated approach uncovers the heterogeneous mechanisms underlying spatial patterns, enabling the development of a nuanced typology and tailored strategies.
(2)
Cluster typology: We proposed a meaningful classification, which translated the complex underlying mechanisms into a clear typology. The classification is constructed not only on spatial characteristics but also on historical and cultural contexts, offering deeper insights into the mechanisms of spatial heterogeneity.
(3)
Planning guidance: Beyond generic recommendations, this study proposed targeted conservation strategies—preserving the historical fabric of indigenous villages (S1), highlighting multicultural heritage in immigrant villages (S2), and improving transportation accessibility of refuge-type villages (S3)—thus enabling more efficient resource allocation by policymakers.
Certainly, this study also has several limitations. The reliance on county-level data may have resulted in the omission of certain critical village-scale socio-economic variables, such as population size and household income. Additionally, the manual vectorization process used in translating dialect maps may have introduced potential ambiguities in boundary delineation. Moreover, a limited number of indicator factors introduced a degree of subjectivity. Furthermore, the framework was developed and validated within a specific regional context. Therefore, future research could extend in two directions: firstly, employing more micro-level survey methods to obtain data from individual villages to validate the findings at a finer scale; secondly, testing the applicability of the analytical framework in other provinces, such as Yunnan or Guizhou province, which possess distinct cultural and historical backgrounds, thereby examining the generalizability of the model and facilitating its further refinement.

Author Contributions

Conceptualization, Y.T.; Data curation, J.G.; Formal analysis, H.G.; Methodology, H.G.; Project administration, Y.T.; Resources, Y.T.; Software, H.G. and J.G.; Supervision, Y.T.; Validation, H.G.; Visualization, H.G.; Writing—original draft, H.G.; Writing—review and editing, Y.T. All authors have read and agreed to the published version of the manuscript.

Funding

This research was funded by the National Natural Science Foundation of China (Grant No. 52278079).

Acknowledgments

This research was funded by the National Natural Science Foundation of China (Grant No. 52278079), under the project titled ‘Research on the Evolution Mechanism, Characteristic Construction, and Planning Support Methods of Ecological Regionalization in the Chengdu Plain Economic Zone’ (2023.01–2026.01).

Conflicts of Interest

The authors declare that they have no conflicts of interest or personal relationships that could have appeared to influence the work reported in this paper.

Appendix A

Table A1. The complete list of counties for each cluster.
ClusterIncluded Districts and Counties
S1Leshan: Shizhong District, Shawan District, Wutongqiao District, Jinkouhe District, Jiajiang County, Qianwei County, Muchuan County, Ebian Yi Autonomous County, Mabian Yi Autonomous County, Emeishan City; Yibin: Xuzhou District, Pingshan County, Gao County, Changning County.
S2Leshan: Jingyan County; Luzhou: Jiangyang District, Naxi District, Longmatan District, Luxian County; Yibin: Cuiping District, Nanxi District, Jiang’an County; and the entire jurisdictions of Zigong and Neijiang;
S3Luzhou: Hejiang County, Xuyong County, Gulin County; Yibin: Gong County, Junlian County, Xingwen County.

References

  1. Feng, J. The dilemmas and prospects of traditional villages: On traditional villages as another type of cultural heritage. Folk Cult. Forum 2013, 1, 7–12. [Google Scholar] [CrossRef]
  2. Guiding Opinions on Strengthening the Protection and Development of Traditional Villages. Available online: https://www.mohurd.gov.cn/gongkai/zc/wjk/art/2012/art_17339_212337.html (accessed on 23 August 2025).
  3. Ancient Villages in Southern Anhui–Xidi and Hongcun. Available online: https://whc.unesco.org/en/list/1002 (accessed on 23 August 2025).
  4. Niu, Y.; Wang, Y. Spatial differentiation pattern and influencing mechanisms of traditional villages in the Taihang Mountains based on the MGWR model. J. Arid Land Resour. Environ. 2024, 38, 87–96. [Google Scholar]
  5. Wang, X.; Fang, J. Analysis and countermeasures of homogenization in rural tourism products. Jiangsu Agric. Agric. Sci. 2020, 48, 14–19. [Google Scholar] [CrossRef]
  6. Bian, J.; Chen, W.; Zeng, J. Spatial distribution characteristics and influencing factors of traditional villages in China. Int. J. Environ. Res. Public Health 2022, 19, 4627. [Google Scholar] [CrossRef]
  7. Su, X.; Zhou, H.; Guo, Y.; Zhu, Y. Multi-dimensional influencing factors of spatial evolution of traditional villages in Guizhou Province of China and their conservation significance. Buildings 2024, 14, 3088. [Google Scholar] [CrossRef]
  8. Ding, K.; Ding, S. Spatial distribution and influencing factors of traditional villages in Shangrao City. South-Cent. Agric. Sci. Technol. 2025, 46, 194–197. [Google Scholar] [CrossRef]
  9. Zheng, S.; Liu, S. Spatial distribution characteristics and formation mechanisms of traditional villages in the southern Taihang subregion. Agric. Technol. 2025, 45, 95–100. [Google Scholar] [CrossRef]
  10. Huang, X.; Si, Z.; Chen, X.; Li, J. Distribution characteristics and mechanisms of traditional villages influenced by the Qiantang River system. J. Southwest For. Univ. (Soc. Sci.) 2024, 8, 43–50. [Google Scholar]
  11. Chen, Y.; Li, R. Spatial distribution and type division of traditional villages in Zhejiang Province. Sustainability 2024, 16, 5262. [Google Scholar] [CrossRef]
  12. Guo, Y.; Zhai, S.; Huang, J.; Guo, H. Characteristics of the spatial structure of traditional villages in the Xinjiang Uygur Autonomous Region in China and their influence mechanisms. Buildings 2024, 14, 3420. [Google Scholar] [CrossRef]
  13. Li, D.; Gao, X.; Lv, S.; Zhao, W.; Yuan, M.; Li, P. Spatial distribution and influencing factors of traditional villages in Inner Mongolia Autonomous Region. Buildings 2023, 13, 2807. [Google Scholar] [CrossRef]
  14. Chen, Z.; Meng, Y.; Yang, D.; Xiao, Y.; Yuan, Y. Spatial distribution characteristics and driving mechanisms of traditional villages on Hainan Island. Areal Res. Dev. 2025, 44, 114–121. [Google Scholar] [CrossRef]
  15. Fang, Q.; Li, Z.; Huang, L. Spatial distribution and influencing factors of traditional villages in the Huizhou cultural ecological protection subregion. Ind. Archit. 2024, 54, 105–113. [Google Scholar] [CrossRef]
  16. Ma, Y.; Huang, Z. Spatial patterns and accessibility of traditional villages in the middle reaches of the Yangtze River urban agglomeration based on a GWR model. Hum. Geogr. 2017, 32, 78–85. [Google Scholar] [CrossRef]
  17. Sauer, C.O. The Morphology of Landscape; University of California Publications in Geography; University of California Press: Berkeley, CA, USA, 1925; Volume 2, pp. 19–53. [Google Scholar]
  18. Zheng, Z.; Jiao, S.; Xiong, Y. Characteristics of regional historical and cultural resources and research on cluster-based protection. Archit. J. 2020, S1, 98–102. [Google Scholar]
  19. Huang, Q.; Yang, G. Sichuan migrant place names and the ‘Hu-Guang Migration to Sichuan’: Spatial distribution and provincial origin ratio. J. Southwest China Norm. Univ. (Humanit. Soc. Sci.) 2005, 3, 111–118. [Google Scholar] [CrossRef]
  20. Chen, J. A Geographical Study of Sichuan River Ports from the Late Qing Dynasty to 1949. Doctoral Dissertation, Southwest University, Chongqing, China, 2023. [Google Scholar]
  21. Su, H.; Wang, Y.; Zhang, Z.; Dong, W. Characteristics and influencing factors of traditional village distribution in China. Land 2022, 11, 1631. [Google Scholar] [CrossRef]
  22. Kang, J.; Zhang, J.; Hu, H.; Zhou, J.; Xiong, J. Spatial distribution characteristics of traditional villages in China. Prog. Geogr. 2016, 35, 839–850. [Google Scholar] [CrossRef]
  23. Wang, J.; Li, X.; Christakos, G.; Liao, Y.; Zhang, T.; Gu, X.; Zheng, X. Geographical detectors-based health risk assessment and its application in the neural tube defects study of the Heshun Region, China. Int. J. Geogr. Inf. Sci. 2010, 24, 107–127. [Google Scholar] [CrossRef]
  24. Brunsdon, C.; Fotheringham, S.; Charlton, M. Geographically weighted regression. J. R. Stat. Soc. Ser. D (Stat.) 1998, 47, 431–443. [Google Scholar] [CrossRef]
  25. Liu, F.; Xu, W.; Niu, Q. Spatial Pattern of Traditional Villages in Remote Mountainous Areas and Their Development Potential Assessment: The Case of Enshi, China. Sustainability 2025, 17, 1138. [Google Scholar] [CrossRef]
  26. Zhong, Q.; Xie, L.; Wu, J. Reimagining heritage villages’ sustainability: Machine learning–driven human settlement suitability in Hunan. Humanit. Soc. Sci. Commun. 2025, 12, 661. [Google Scholar] [CrossRef]
  27. Yang, J.; Zhao, C. A review of research on the K-means clustering algorithm. Comput. Eng. Appl. 2019, 55, 7–14. [Google Scholar] [CrossRef]
  28. Zhang, L. Principles and empirical analysis of the Kruskal–Wallis test for multiple independent samples. J. Suzhou Univ. Sci. Technol. (Nat. Sci. Ed.) 2014, 31, 14–16. [Google Scholar] [CrossRef]
  29. Li, L. The subregional division of Southwestern Mandarin (draft). Dialect 2009, 31, 72–87. [Google Scholar]
  30. Zhou, J.; Zhou, M. Phonetic features and subregional dialect divisions in the Minjiang–Jialing River basins. Stud. Hist. Linguist. 2023, 1, 1–48+251–252. [Google Scholar]
  31. Sun, Y. A Phonetic Study of Southwestern Mandarin in Sichuan; Publishing House of Electronics Industry: Beijing, China, 2016. [Google Scholar]
  32. Hu, Z. A Critical Study on Zhang Xianzhong’s Massacre in Sichuan; Sichuan People’s Publishing House: Chengdu, China, 1980; Volume 44. [Google Scholar]
  33. Chen, Q.; Luo, Y.; Zhang, H.; Tan, X.; Teng, L.; Yang, H. Spatial distribution characteristics and influencing factors of traditional villages in Sichuan Province. Geomat. Spat. Inf. Technol. 2018, 41, 49–52. [Google Scholar] [CrossRef]
  34. Zheng, Z.; Yuan, X.; Mo, Q. Spatial distribution characteristics and causation analysis of traditional villages in Sichuan Province. In People’s Cities, Planning Empowerment, Proceedings of the 2022 China Urban Planning Annual Conference (Vol. 09: Urban Cultural Heritage Protection), Suzhou, China, 12–13 November 2022; Architecture & Building Press: Beijing, China, 2023; pp. 1394–1399. [Google Scholar]
Figure 1. Location of the study area.
Land 14 01817 g001
Figure 2. Research design and analytical framework.
Land 14 01817 g002
Figure 3. KDE of traditional village distribution in Southern Sichuan (Gaussian kernel, Silverman’s rule).
Land 14 01817 g003
Figure 4. Interaction detection results of the six variables.
Land 14 01817 g004
Figure 5. The results of the GWR model validation. (a) Moran’s I of residuals; (b) Distribution of condition numbers.
Land 14 01817 g005
Figure 6. Spatial distribution of GWR coefficients.
Land 14 01817 g006
Figure 7. Results of K-means cluster analysis in Southern Sichuan (k = 3). (a) Selection of k-value; (b) Cluster distribution.
Land 14 01817 g007
Figure 8. The distribution of GWR coefficients across the three clusters. (a) Distribution of coefficients across the clusters; (b) Between-cluster differences in medians.
Land 14 01817 g008
Figure 9. Dunn’s Test Results for All indicators.
Land 14 01817 g009
Figure 10. The concordance of clustering results and dialect subregions.
Land 14 01817 g010
Table 1. Data description and pre-processing.
DatasetResolutionDatePre-Processing Steps
Traditional village locationsPoint coordinates2012–2020Transforming from BD-09 to WGS84 geographic coordinate system.
DEM30 m2022Clipping to the study area boundary.
Projected to a projected coordinate system (EPSG:3395).
GDPCounty-level2022Digitizing and joining to the county boundary attribute table.
Urbanization rateCounty-level2022Digitizing and joining to the county boundary attribute table.
Administrative boundariesCounty-level2020Joining with the socioeconomic data.
Dialect boundariesCounty-level1987Vectorize in ArcGIS. Translate into discrete units that align with modern administrative divisions.
River network1:250,0002015Clipping to the study area boundary.
Road network1:250,0002015Clipping to the study area boundary.
dock dataCounty-levelhistoricalDigitizing and joining to the county boundary attribute table.
Table 2. Selection and assignment methods of indicators.
CodeIndicatorDefinition and Calculation MethodStrataVIF
Ynumber of traditional villagesThe number of traditional village points located within a county areal unit in ArcGIS. (count)//
C1elevationAverage elevation of each county in southern Sichuan. C 1   =   i   =   1 n ( H i   ·   A i ) i   =   1 n A i , where H i is the elevation of grid i A   i  is its area, n is the total number of grids. (meter).Natural breaks (Jenks), 4 strata1.591643
C2river connectivityDensity of traditional villages within 5000 m of rivers. C 2 = E i N i × 100 % , where E i refers to the number of traditional villages within the 5000 m river buffer in the i-th county, and N i refers to the total number of traditional villages in that county.1.091692
C3GDPGDP of Southern Sichuan Counties in 2022. (10,000 CNY)2.497414
C4urbanization rateUrbanization rates of counties in southern Sichuan in 2022.2.994305
C5number of historical docksNumber of docks in southern Sichuan counties. (count)1.710928
C6road densityRatio of total road length to county area in southern Sichuan (km/km2)2.338274
Note: The establishment of the 5000 m river buffer distance is derived from Han Maoli’s monograph “Ten li, eight villages: A study of the rural social geography of modern Shanxi”, which identifies this range as representing the core activity sphere of ancient Chinese villagers.
Table 3. ANN Analysis Results (with Edge Correction Implemented in R).
Observed Mean Distance
  D ¯ O (m)
Expected Mean Distance
  D ¯ E (m)
ANNZp-ValueDistribution Pattern
12,415.5314,873.80.834724−2.6642010.007717 **significant clustered
** p < 0.01.
Table 4. Results of global spatial autocorrelation analysis.
Moran’s IZp-Value
0.2336252.7947640.005194 **
** p < 0.01.
Table 5. Factor detection results.
IndicatorC1C2C3C4C5C6
q-value0.0690280.3221960.0698010.1620880.0564150.081395
Table 6. The results of the top 3 interactions.
Factor InteractionInteraction Value ComparisonInteraction Results
C3∩C40.6130 > q (C3 + C4 = 0.2319)Nonlinear enhancement
C2∩C40.5961 > q (C2 + C3 = 0.3920)Nonlinear enhancement
C1∩C20.5812 > q (C1 + C2 = 0.3912)Nonlinear enhancement
Table 7. Comparison of parameters between OLS and GWR.
MethodGlobal R2Adjusted R2AICcΔAICc (OLS-GWR)
OLS0.39230.2791177.249624.3524
GWR/0.7019152.8972
Table 8. Results of K-means cluster analysis.
ClusterNumber of CountiesNumber of Traditional Villages
S11414
S21930
S3627
Note: The complete list of counties for each cluster is provided in Appendix A Table A1.
Table 9. Results of the Kruskal–Wallis test.
IndicatorCluster Median M (P25, P75)HpEffect Size (η2)
S1 (n = 14)S2 (n = 19)S3 (n = 6)
C1−0.367 (−0.4, −0.3)−0.205 (−0.4, 0.7)1.736 (0.4, 2.7)14.5860.001 **0.349611
C20.497 (0.4, 0.8)0.994 (0.8, 1.2)1.273 (1.1, 1.3)19.2470.000 ***0.479083
C30.504 (0.5, 0.6)0.491 (0.5, 0.6)0.712 (0.7, 0.8)14.3680.001 **0.343556
C4−0.948 (−1.2, −0.8)−1.282 (−1.7, −1.1)−2.140 (−2.6, −2.0)20.8060.000 ***0.522389
C5−0.186 (−0.2, −0.1)0.075 (−0.0, 0.3)0.579 (0.3, 0.9)23.3660.000 ***0.5935
C60.310 (0.2, 0.4)0.381 (0.3, 0.7)1.346 (1.1, 2.1)15.9270.000 ***0.386861
** p < 0.01, *** p < 0.001.
Table 10. Dunn’s test pairwise comparisons (adjusted p-values).
Indicator(Cluster1)
Code
(Cluster2)
Code
(Cluster1)
Median
(Cluster2)
Median
(Cluster1–2)
Median Difference
p-Value
C1S1S2−0.367−0.205−0.1620.198
S1S3−0.3671.736−2.1020.000 ***
S2S3−0.2051.736−1.940.029 *
C2S1S20.4970.994−0.4970.002 **
S1S30.4971.273−0.7760.000 ***
S2S30.9941.273−0.2790.413
C3S1S20.5040.4910.0131
S1S30.5040.712−0.2080.001 **
S2S30.4910.712−0.2210.002 **
C4S1S2−0.948−1.2820.3340.044 *
S1S3−0.948−2.141.1910.000 ***
S2S3−1.282−2.140.8580.012 *
C5S1S2−0.1860.075−0.260.003 **
S1S3−0.1860.579−0.7650.000 ***
S2S30.0750.579−0.5040.072
C6S1S20.310.381−0.0710.588
S1S30.311.346−1.0360.000 ***
S2S30.3811.346−0.9650.005 **
* p < 0.05, ** p < 0.01, *** p < 0.001.
Table 11. The Adjusted Rand index (ARI) between clusters and dialect subregions.
ClusterChengyu SubregionMinjiang SubregionRenfu Subregion
S10.0001.0000.000
S20.0530.3680.579
S30.0000.8330.167
Disclaimer/Publisher’s Note: The statements, opinions and data contained in all publications are solely those of the individual author(s) and contributor(s) and not of MDPI and/or the editor(s). MDPI and/or the editor(s) disclaim responsibility for any injury to people or property resulting from any ideas, methods, instructions or products referred to in the content.