Article

Response Patterns of Soil Organic Carbon Fractions and Storage to Vegetation Types in the Yellow River Wetland

1
Institute of Geographical Sciences, Henan Academy of Sciences, Zhengzhou 450052, China
2
School of Surveying and Land-Information Engineering, Henan Polytechnic University, Jiaozuo 454000, China
*
Author to whom correspondence should be addressed.
Shuangquan Li and Chuang Yan are co-first authors and have equal contributions to the article.
Land 2025, 14(9), 1785; https://doi.org/10.3390/land14091785
Submission received: 28 July 2025 / Revised: 23 August 2025 / Accepted: 30 August 2025 / Published: 2 September 2025
(This article belongs to the Section Land, Soil and Water)

Abstract

To promote soil carbon (C) sequestration and alleviate climate change, it is crucial to understand how vegetation types affect soil organic C (SOC) storage and stability in riverine wetlands. This study investigates the characteristics of SOC fractions and storage among different vegetation types and evaluates their soil C sequestration potential. Soil samples were collected and analyzed from four vegetation types (Typha orientalis, Tamarix chinensis, Avena sativa, and Phragmites australis) in wetlands at the junction of the middle and lower reaches of the Yellow River. Soil particulate organic C, dissolved organic C, and microbial biomass C contents of Avena sativa and Phragmites australis communities were higher than those of Tamarix chinensis and Typha orientalis communities (p < 0.001). Typha orientalis communities exhibited the highest SOC stability (4.31 ± 0.38), whereas Tamarix chinensis communities showed the lowest (1.34 ± 0.17) (p < 0.001). Soil organic C storage of Avena sativa (2.81 ± 0.32 kg m−2) and Phragmites australis (2.53 ± 0.06 kg m−2) communities was higher than that of Tamarix chinensis (0.88 ± 0.06 kg m−2) and Typha orientalis (1.35 ± 0.13 kg m−2) communities (p < 0.001). Soil electrical conductivity (EC) was significantly correlated with SOC fractions of Typha orientalis and Phragmites australis communities, while soil water content and particle size composition affected SOC fractions of Avena sativa communities (p < 0.05). Soil particle size composition affected the SOC storage of Typha orientalis, Tamarix chinensis, and Avena sativa communities (p < 0.05). Soil pH, water content, and EC influenced the SOC storage of Typha orientalis, Tamarix chinensis, and Phragmites australis communities (p < 0.05). These results demonstrate that Avena sativa and Phragmites australis communities play a vital role in maintaining C sink potential and ecological function in the Yellow River wetland. Nonetheless, the Typha orientalis community had greater C sequestration in the long term due to its high SOC stability. This research suggests that the effects of vegetation types should be considered when exploring the soil C cycle in riverine wetlands.

Graphical Abstract

1. Introduction

Sequestering carbon (C) from the atmosphere is crucial to mitigate climate change. Soil C sequestration presents one of the most inexpensive and effective options [1]. Wetlands are estimated to contain 20–30% of the earth’s soil organic C (SOC) pool, despite covering only 3.2–9.7% of the earth’s surface [2,3]. Therefore, wetland ecosystems are among the most important C sinks. As an important component of wetland ecosystems, riverine wetlands have significant C sequestration potential [4,5] and should not be overlooked in the accounting of the global SOC pool. Nonetheless, previous studies on wetland SOC fractions and storage have predominantly focused on lakes [6,7,8], estuaries [9,10], or coastal wetlands [11,12]. Soil organic C fractions and storage in riverine wetlands have been accorded minimal attention, hindering a proper understanding of their contribution to the global SOC pool.
Vegetation, as a crucial part of wetland ecosystems, plays a significant role in soil C cycle. Vegetation types can alter soil nutrient availability [9,13], microbial community composition [14], plant nutrient absorption [15], primary productivity [16], and the quantity and quality of litter and root exudate [8,14]. These vegetation-driven processes directly affect soil microbial activity, organic matter decomposition, and SOC storage [13,17,18,19], substantially influencing the SOC fractions and stability in wetlands [5,20,21]. Plant communities with high biomass and easily decomposable litter have higher readily oxidized organic C (ROC), dissolved organic C (DOC), and microbial biomass C (MBC), and their SOC is more easily decomposed, with lower stability [5,21,22,23]. In contrast, plant litter with high lignin decomposes slowly, which contributes to the formation of soil particulate organic C (POC) [20]. Plant communities with a high water table lead to anaerobic decomposition and the production of insoluble substances, which reduce the accumulation of labile organic C [24]. Plant communities with a high-salinity environment can inhibit microbial activity, slow the decomposition of POC, and promote SOC stability and accumulation [21]. However, the response patterns of SOC fractions and stability under different vegetation types have not been well-explored in the riverine wetlands, especially the Yellow River wetland.
Vegetation types influence litter quantity and quality, soil properties, nutrient stoichiometric ratio, and enzyme activity, which alter the balance of organic matter input, decomposition, and stabilization processes, consequently influencing SOC storage [11,13,18,25]. Soil texture, pH, and salinity mediate organic C retention through organo-mineral complexation and aggregation [21,26]. The soil environment of vegetation with high litter input and low bulk density, pH, and salinity is conducive to SOC storage increase in wetlands [13,27]. Generally, a litter of woody plants contain a higher proportion of lignin, which is not conducive to litter decomposition and SOC accumulation. Plant communities with higher biomass and whose SOC is physically protected by clay particles through adsorption or encapsulation exhibit higher SOC storage and C sink potential [21,24,25,28]. Additionally, organic C in soils of a vegetation type in wetlands with frequent drying–wetting alternation or flooding conditions is easily decomposed by soil microorganisms or lost [6,29]. Thus, differences in vegetation communities are likely to affect SOC sequestration [13,30]. However, the interactive effects of vegetation types with hydrologic conditions and soil physicochemical properties on SOC fractions, stability, and storage have not been fully elucidated in riverine wetlands.
The Yellow River wetland in the Zhengzhou area is located at the transition between the middle and lower reaches of the Yellow River in Henan Province, China [31]. Due to the annual flood season, the river meanders and creates large areas of mud flats and floodplains, making it an important wetland distribution area in China [32]. This region serves as a representative model for large alluvial river wetlands globally. Our study aims to deepen the understanding of the soil C cycle not only in this critical area but also to provide insights into the mechanisms of organic C stabilization and storage under varying vegetation and hydrological regimes, which is essential for predicting wetland C sink under changing environments. Our goals were to (1) explore the effects of vegetation types on SOC fractions, stability, and storage in the wetlands of the middle and lower reaches of the Yellow River; (2) quantify how wetland-specific hydrology and soil properties influence the vegetation type effects on SOC fractions, stability, and storage. Wetland hydrological conditions regulate the decomposition and accumulation rates of organic C by affecting oxygen supply and microbial activity, thereby altering SOC fractions and storage [6,24,33]. Soil physicochemical properties influence the stability and transformation of organic C through physical protection, chemical interactions, and the regulation of microbial communities, mediating the effect of vegetation types on soil C cycle [10,25,27]. Plants with high productivity, root exudate, and low-lignin litter in stable hydrology tend to accumulate more labile C and SOC storage. In contrast, plants with high-lignin litter in fluctuating hydrology may favor recalcitrant C due to slow decomposition, and their SOC was more easily lost due to water flow [5,16,34]. Thus, we hypothesized the following: (1) hydrological conditions and soil physicochemical properties regulate the effects of vegetation types on SOC fractions and storage in the Yellow River wetland; (2) compared with Typha orientalis and Tamarix chinensis communities (high-lignin input, low beach wetland with frequent flooding), Phragmites australis and Avena sativa communities (high productivity, low-lignin input, stable high beach hydrology) would exhibit higher soil labile organic C and SOC storage.

2. Materials and Methods

2.1. Study Area

The study area was located at the southern bank of the Yellow River (113°24′ E–113°25′ E, 34°58′ N–35°00′ N) in Xingyang City, Zhengzhou City, Henan Province, China, which is the junction of the middle and lower reaches of the Yellow River. This area has a warm temperate continental climate. Mean annual temperature and precipitation are 14.8 °C and 608.8 mm, respectively. This region is situated at the apex of the Yellow River’s alluvial fan, and the river flow rate decreases here. Sandy loam cambisol is the predominant soil type in this region. According to the horizontal distance from the riverbank, low beach wetland (LBW) and high beach wetland (HBW) were distributed from nearer to farther. Typha orientalis (Perennial herb, Typhaceae) and Tamarix chinensis (Perennial shrub, Tamaricaceae) communities were distributed in LBW, while Avena sativa (Annual herb, Gramineae) and Phragmites australis (Perennial herb, Gramineae) communities were distributed in HBW (Figure 1).

2.2. Sampling Methods

Typha orientalis, Tamarix chinensis, Avena sativa, and Phragmites australis communities were chosen for study. For each plant community, three 3×3 m plots were set up for sampling, with an approximate interval of 20 m between each plot. In total, 12 sample plots were established. During the plant growth season in June 2024, the height, abundance, and coverage of each plant species were recorded in each sample plot. Whereafter, three soil cores were taken out by using a soil auger with 5 cm diameter at the soil depths of 0–10, 10–20, 20–40, and 40–60 cm in each plot. After removing plant roots and stones, the soil samples from the same layer were combined into one complete sample. After being taken to the laboratory, one part of each soil sample was used to measure soil water content (SWC) and microbial biomass C (MBC), and the rest was air-dried for chemical analysis. The soil profile method and ring knife method were used to determine soil bulk density (BD).

2.3. Soil Property Measurement

Soil pH and electrical conductivity (EC) were measured in a 1:5 (w/v) soil to deionized water suspension with a pH meter and conductometer, respectively [12,13]. Fresh soil samples were weighed both before and after being dried at 105 °C to calculate soil water content (SWC). Soil organic C (SOC) was assessed by the K2Cr2O7–H2SO4 oxidation method followed by FeSO4 standard solution titration [35]. Soil particulate organic C (POC) was determined based on the method of dispersing samples in (NaPO3)6 solution, sieving with a 53 μm sieve, and quantifying via the oil bath–K2Cr2O7 titration approach [36]. Soil readily oxidized organic C (ROC) was extracted by oxidation with 333 mmol L−1 KMnO4 and measured by the colorimetric method [21]. Soil dissolved organic C (DOC) was measured by deionized water extraction followed by the oil bath–K2Cr2O7 titration method. Soil microbial biomass C (MBC) was determined using the chloroform fumigation–extraction method. Soil particle size composition was determined using the hydrometer method [37].

2.4. Data Analyses

The equation for SOC storage in i soil layer can be defined as follows [6,8,12]:
T i   =   BD i   ×   H i   ×   A i   ×   0.001
where i is the soil layer, and Ti, BDi, Hi, and Ai are the SOC storage (kg m−2), soil bulk density (kg m−3), soil depth (m), and SOC content (g kg−1) in the i soil layer, respectively. SOC storage in the 0–60 cm soil layer can be calculated as follows:
T   = T i
where T is the SOC storage (kg m−2) in the 0–60 cm soil layer. The equation for soil labile organic C (LOC) and SOC stability (CST) in the i soil layer can be defined as follows [18,21]:
L O C i   = P O C i   +   D O C i   +   M B C i
C S T i = S O C i - L O C i L O C i
where LOCi, POCi, DOCi, MBCi, and CSTi are the soil LOC, POC, DOC, MBC contents (g kg−1), and SOC stability (dimensionless) in the i soil layer, respectively.
One-way ANOVA with Tukey’s post hoc test was conducted to examine the differences among various vegetation types or different soil layers. Two-way ANOVA was used to examine the main and interactive effects of vegetation types and soil depths. Pearson correlation analysis and redundancy analysis (RDA) were used to explore the relationships among soil physicochemical properties, SOC fractions, and SOC stability. Multiple stepwise regressions were conducted to explore the influencing factors of SOC storage. All statistical analyses were performed using R software (Version 4.2.1, https://www.r-project.org/, accessed on 20 July 2025). Origin 2021 (OriginLab Corporation, Northampton, MA, USA) was used to plot figures.

3. Results

3.1. The Variations in Soil Physicochemical Properties Among Vegetation Types

Soil depths significantly affected soil pH, electrical conductivity (EC), and particle size composition (p < 0.001) but not soil water content (SWC). Soil depths marginally affected soil bulk density (BD) (p < 0.1). The soil BD of the Tamarix chinensis community was higher in 20–40 and 40–60 cm soil layers than in 0–10 and 10–20 cm soil layers (p < 0.01). In the Avena sativa community, SWC in each soil layer showed a decreasing trend with increasing soil depth (p < 0.001). In contrast, the soil pH of Tamarix chinensis, Avena sativa, and Phragmites australis communities increased with increasing soil depth (p < 0.05). Soil EC, clay content, and silt content in the four vegetation communities all generally showed a decreasing trend from the surface to deeper soil layers (p < 0.05). However, the subsoil had a higher soil sand content than the topsoil (p < 0.05) (Table 1).
In contrast, vegetation types had obvious effects on all these parameters (p < 0.05). Among the four vegetation communities, the Tamarix chinensis community had the lowest soil BD in the 0–20 cm soil layer (p < 0.05). In contrast, the SWC of the Typha orientalis community was the highest and that of Tamarix chinensis and Avena sativa communities was the lowest in each soil layer (p < 0.001). Typha orientalis and Tamarix chinensis communities exhibited higher soil pH than Avena sativa and Phragmites australis communities in 0–20 cm soil layers (p < 0.001). The soil EC of the Phragmites australis community was the highest and that of the Tamarix chinensis community was the lowest (p < 0.001). Avena sativa and Phragmites australis communities presented higher soil clay and silt contents, but Tamarix chinensis and Typha orientalis communities exhibited higher sand content in 0–10, 10–20, and 20–40 cm soil layers (p < 0.01) (Table 1).

3.2. Variations of Soil Organic C Fractions Among Various Vegetation Types

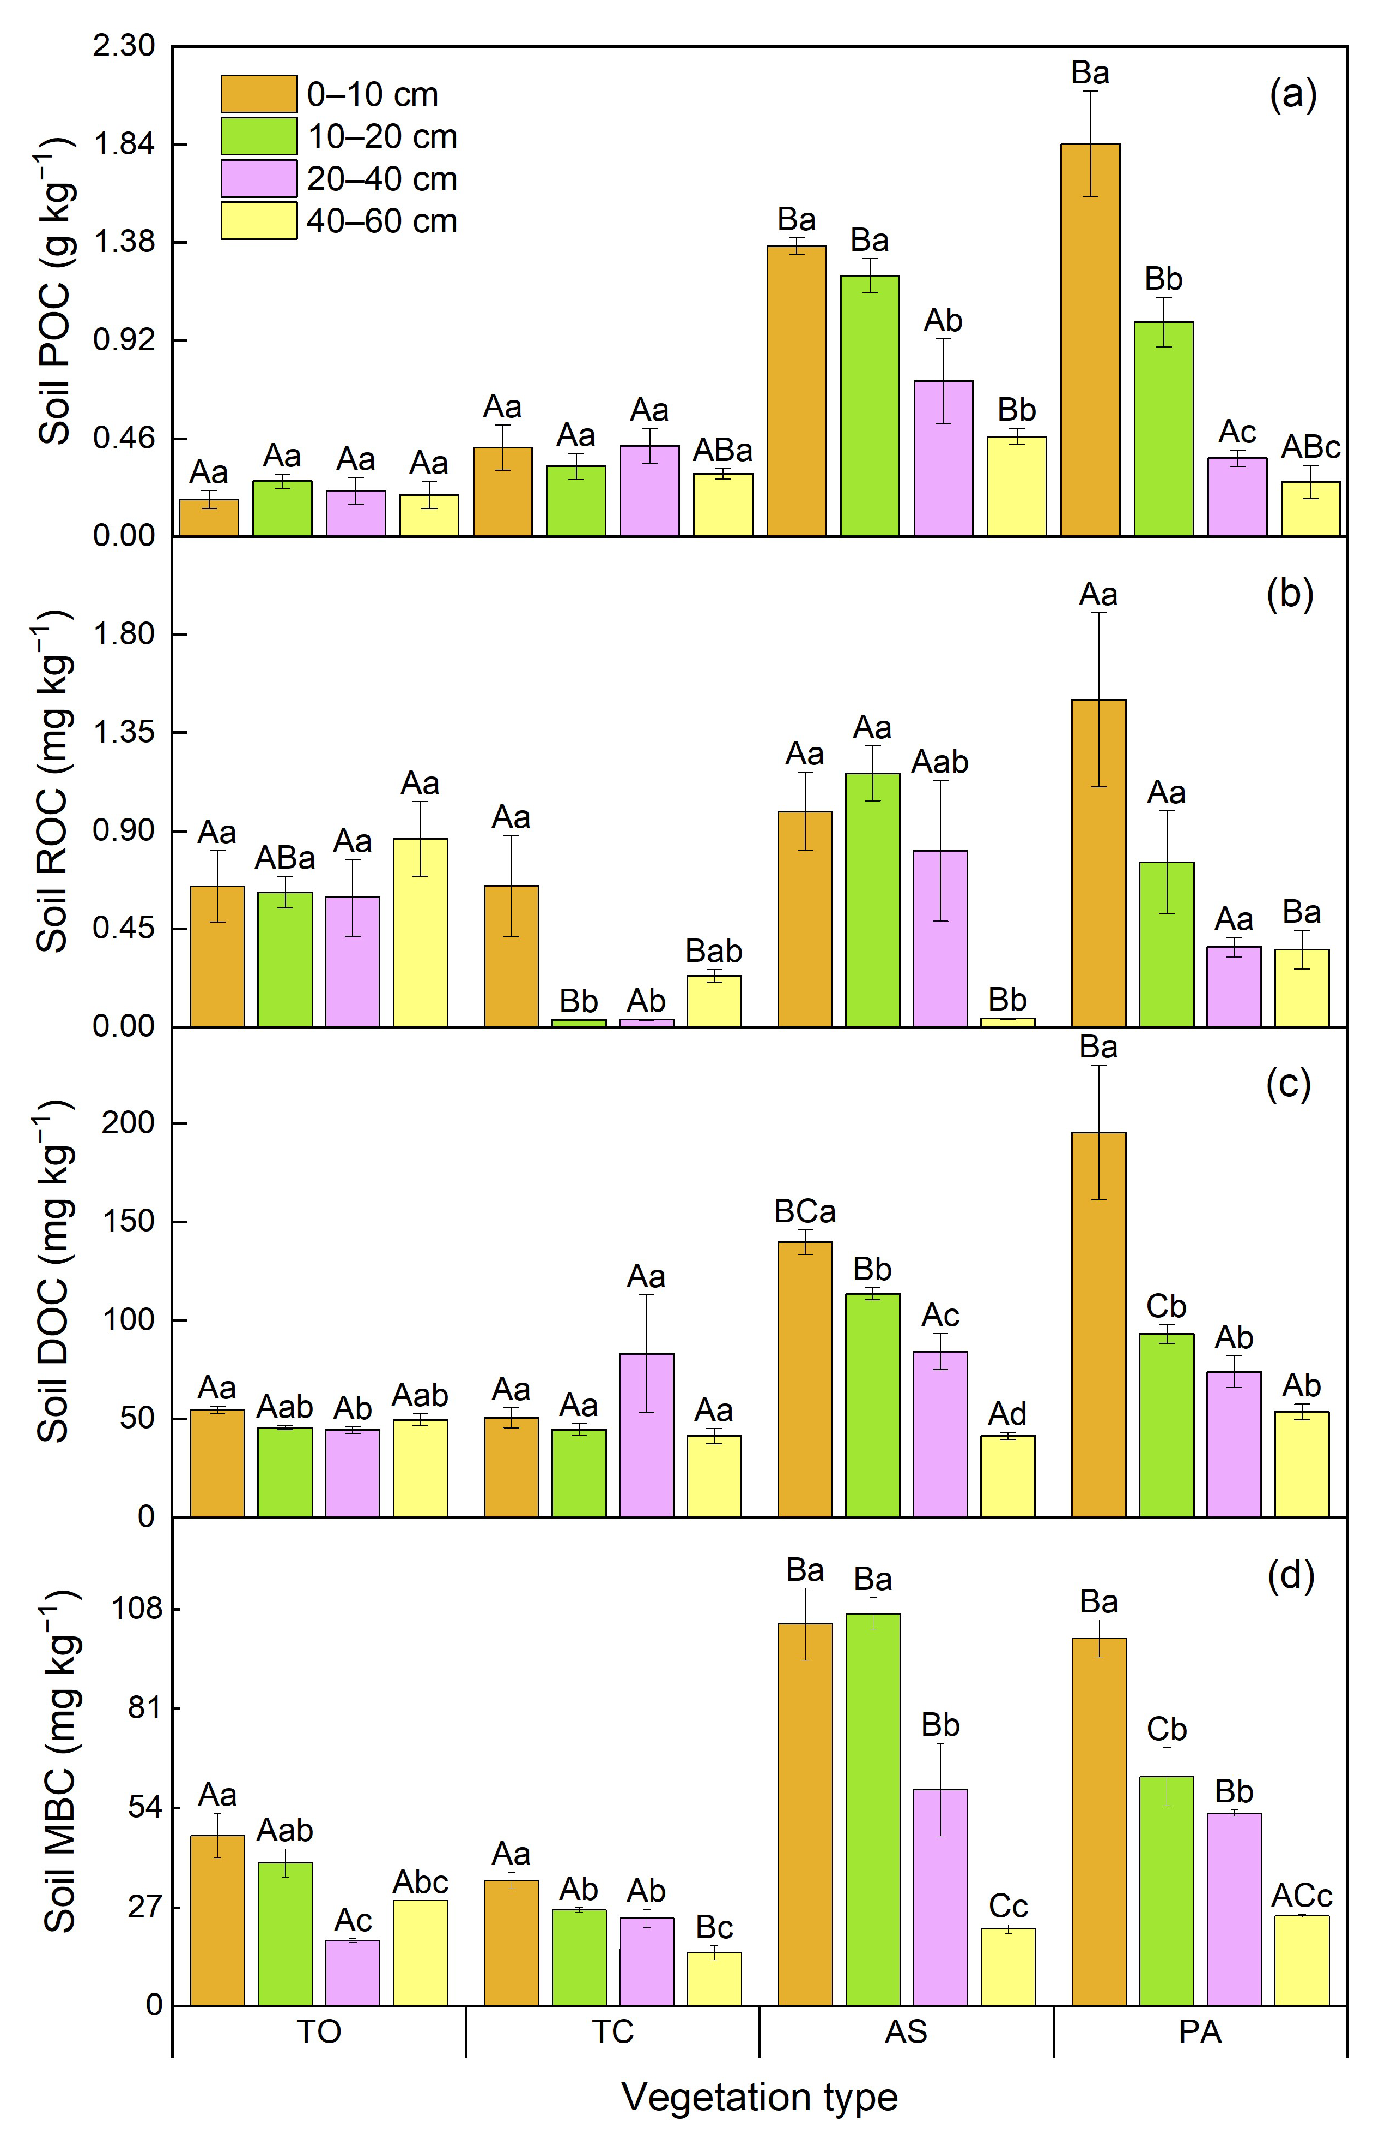
Vegetation types and soil depths both had significant impacts on soil particulate organic C (POC), readily oxidized organic C (ROC), dissolved organic C (DOC), and microbial biomass C (MBC) contents (p < 0.001). Significant interactions between vegetation type and soil depth were also observed (p < 0.01) (Table 2). The soil POC contents of Avena sativa and Phragmites australis communities were higher than those of Typha orientalis and Tamarix chinensis communities in 0–10 and 10–20 cm soil layers (p < 0.001). Analogously, the POC content of the Avena sativa community was the highest, and that of the Typha orientalis community was the lowest among the four plant communities in the 40–60 cm soil layer (p < 0.05) (Figure 2a). Compared with other vegetation communities, the soil ROC content of the Tamarix chinensis community was the lowest, but that of the Typha orientalis community was the highest in 10–20 and 40–60 cm soil layers (p < 0.001) (Figure 2b).
In 0–10 and 10–20 cm soil layers, the soil DOC contents of Phragmites australis and Avena sativa communities were higher than those of Typha orientalis and Tamarix chinensis communities (p < 0.001) (Figure 2c). The soil MBC contents of Avena sativa and Phragmites australis communities were higher than those of Typha orientalis and Tamarix chinensis communities in 0–10, 10–20, and 20–40 cm soil layers. However, in the 40–60 cm soil layer, the soil MBC content of Typha orientalis community was the highest among the four vegetation types (p < 0.01) (Figure 2d).

3.3. Differences of Soil Organic C Stability and Storage Among Diverse Vegetation Types

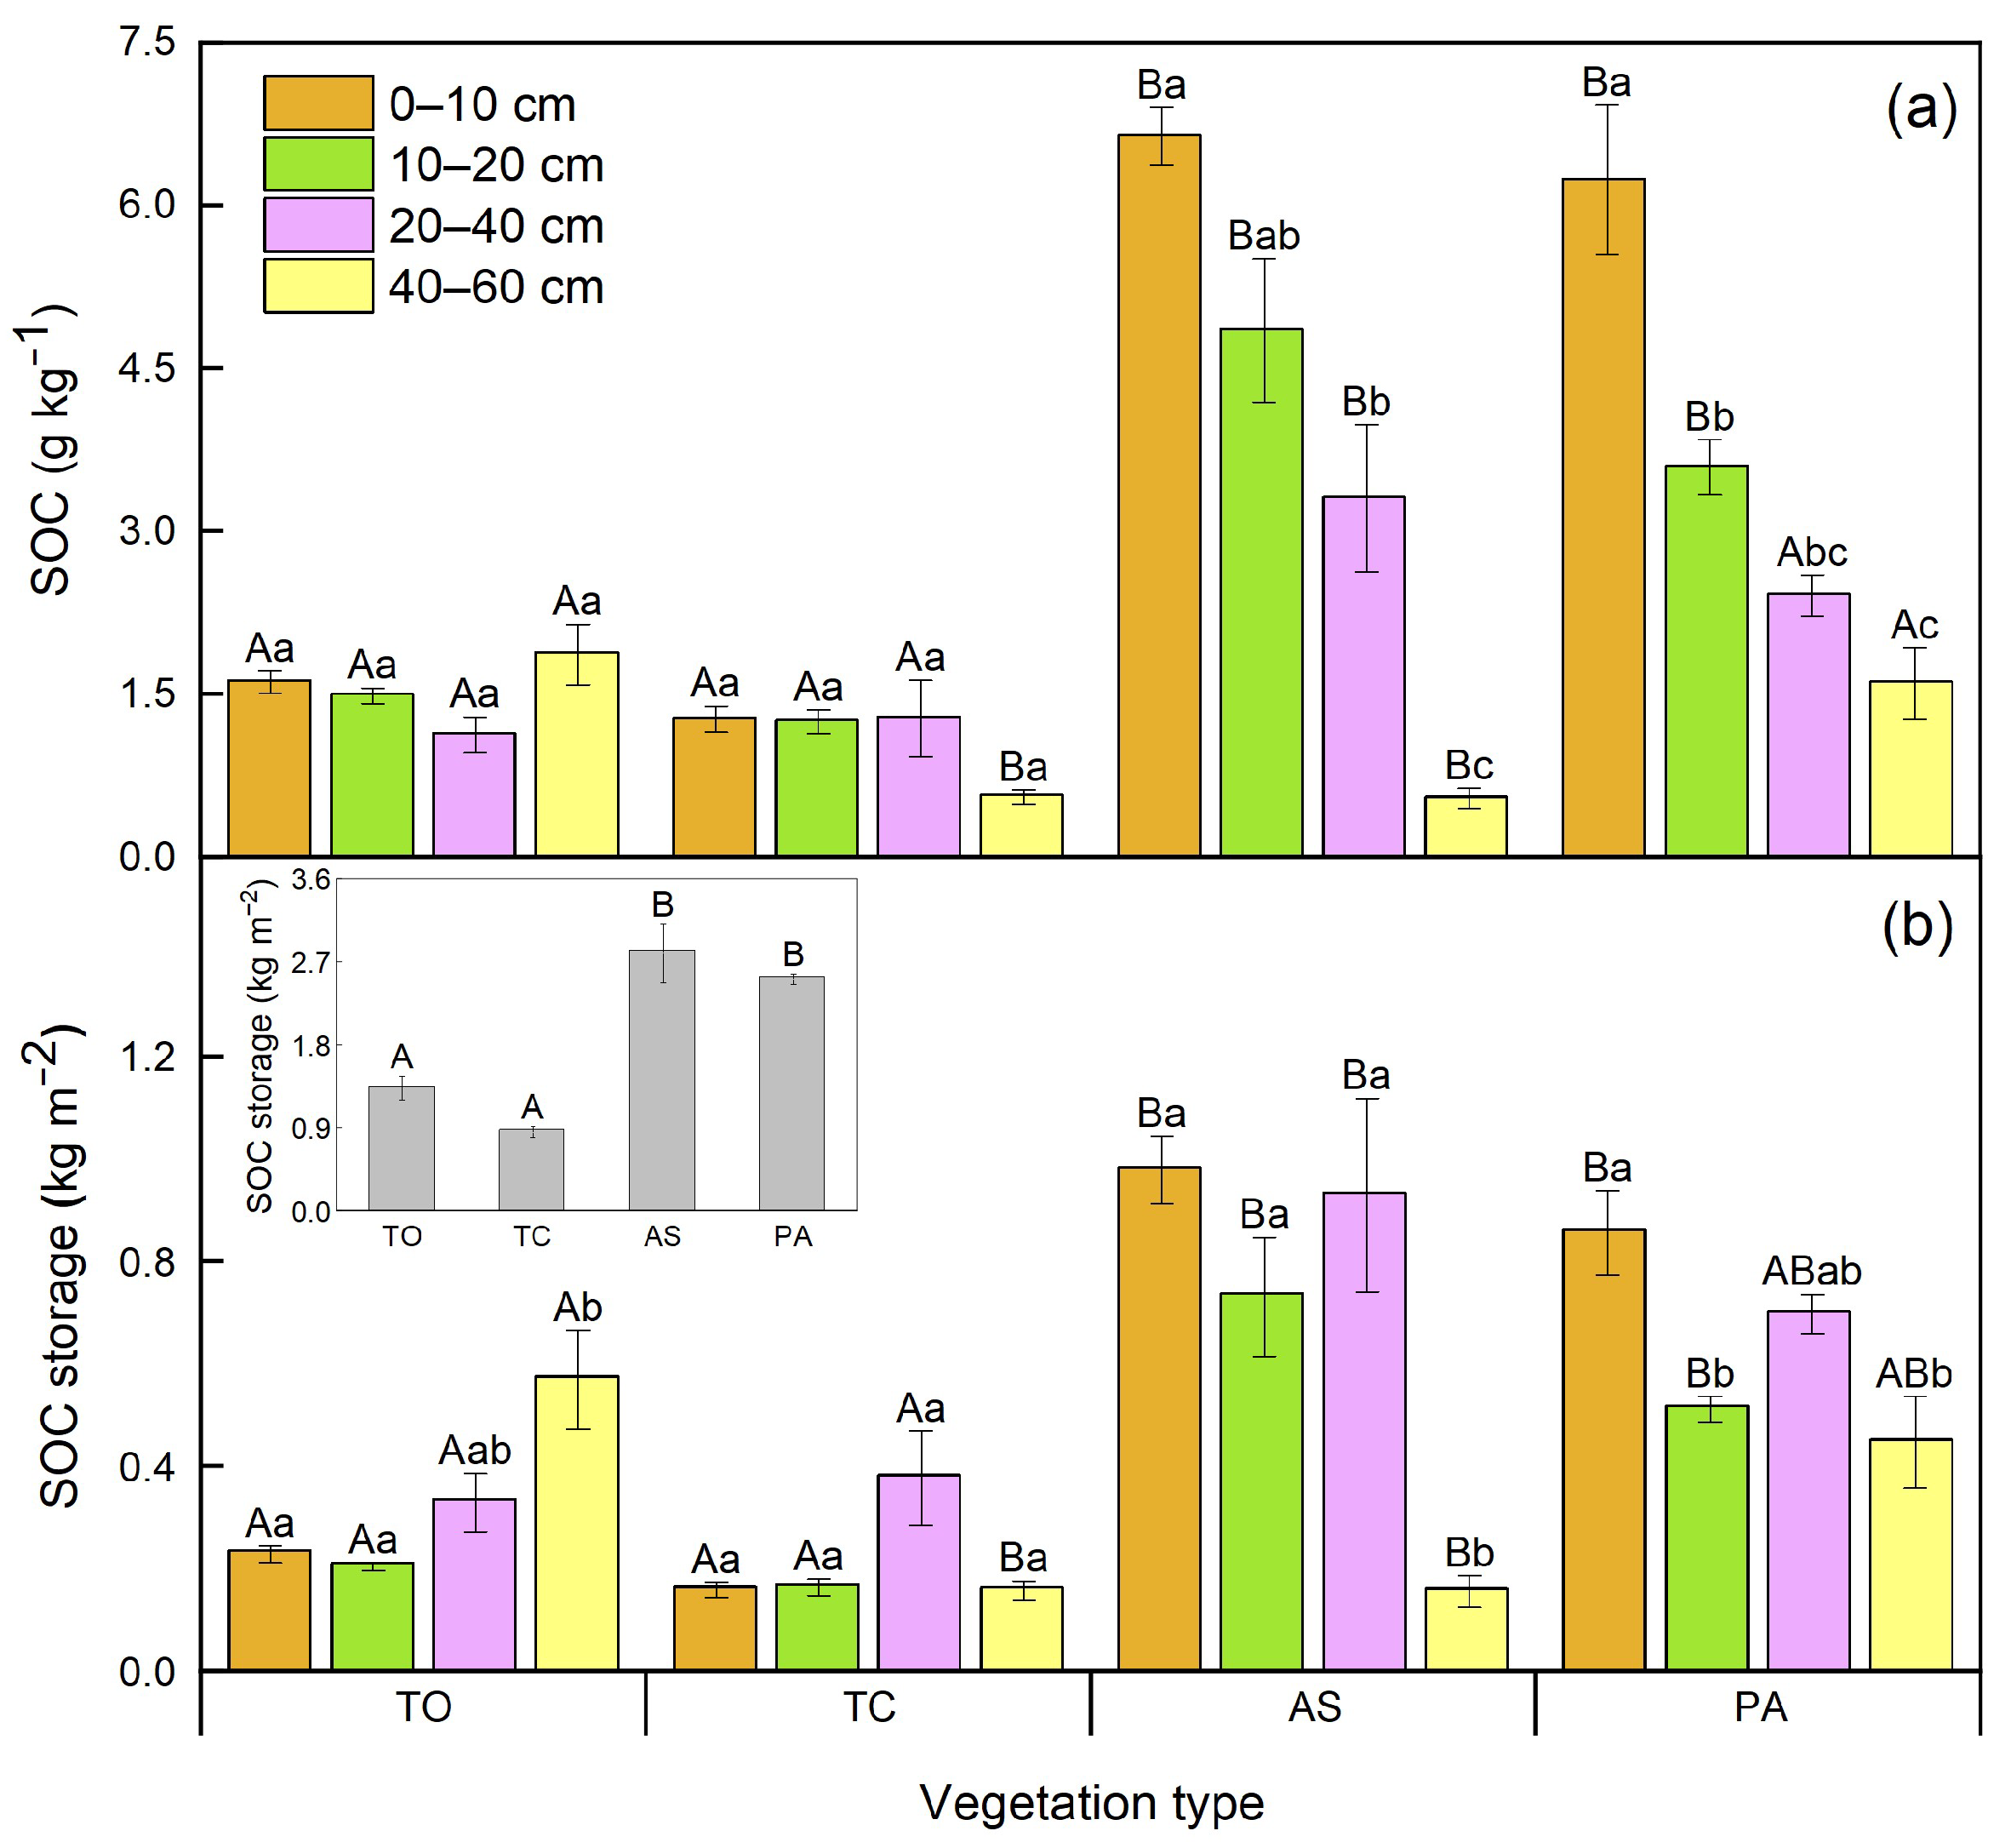
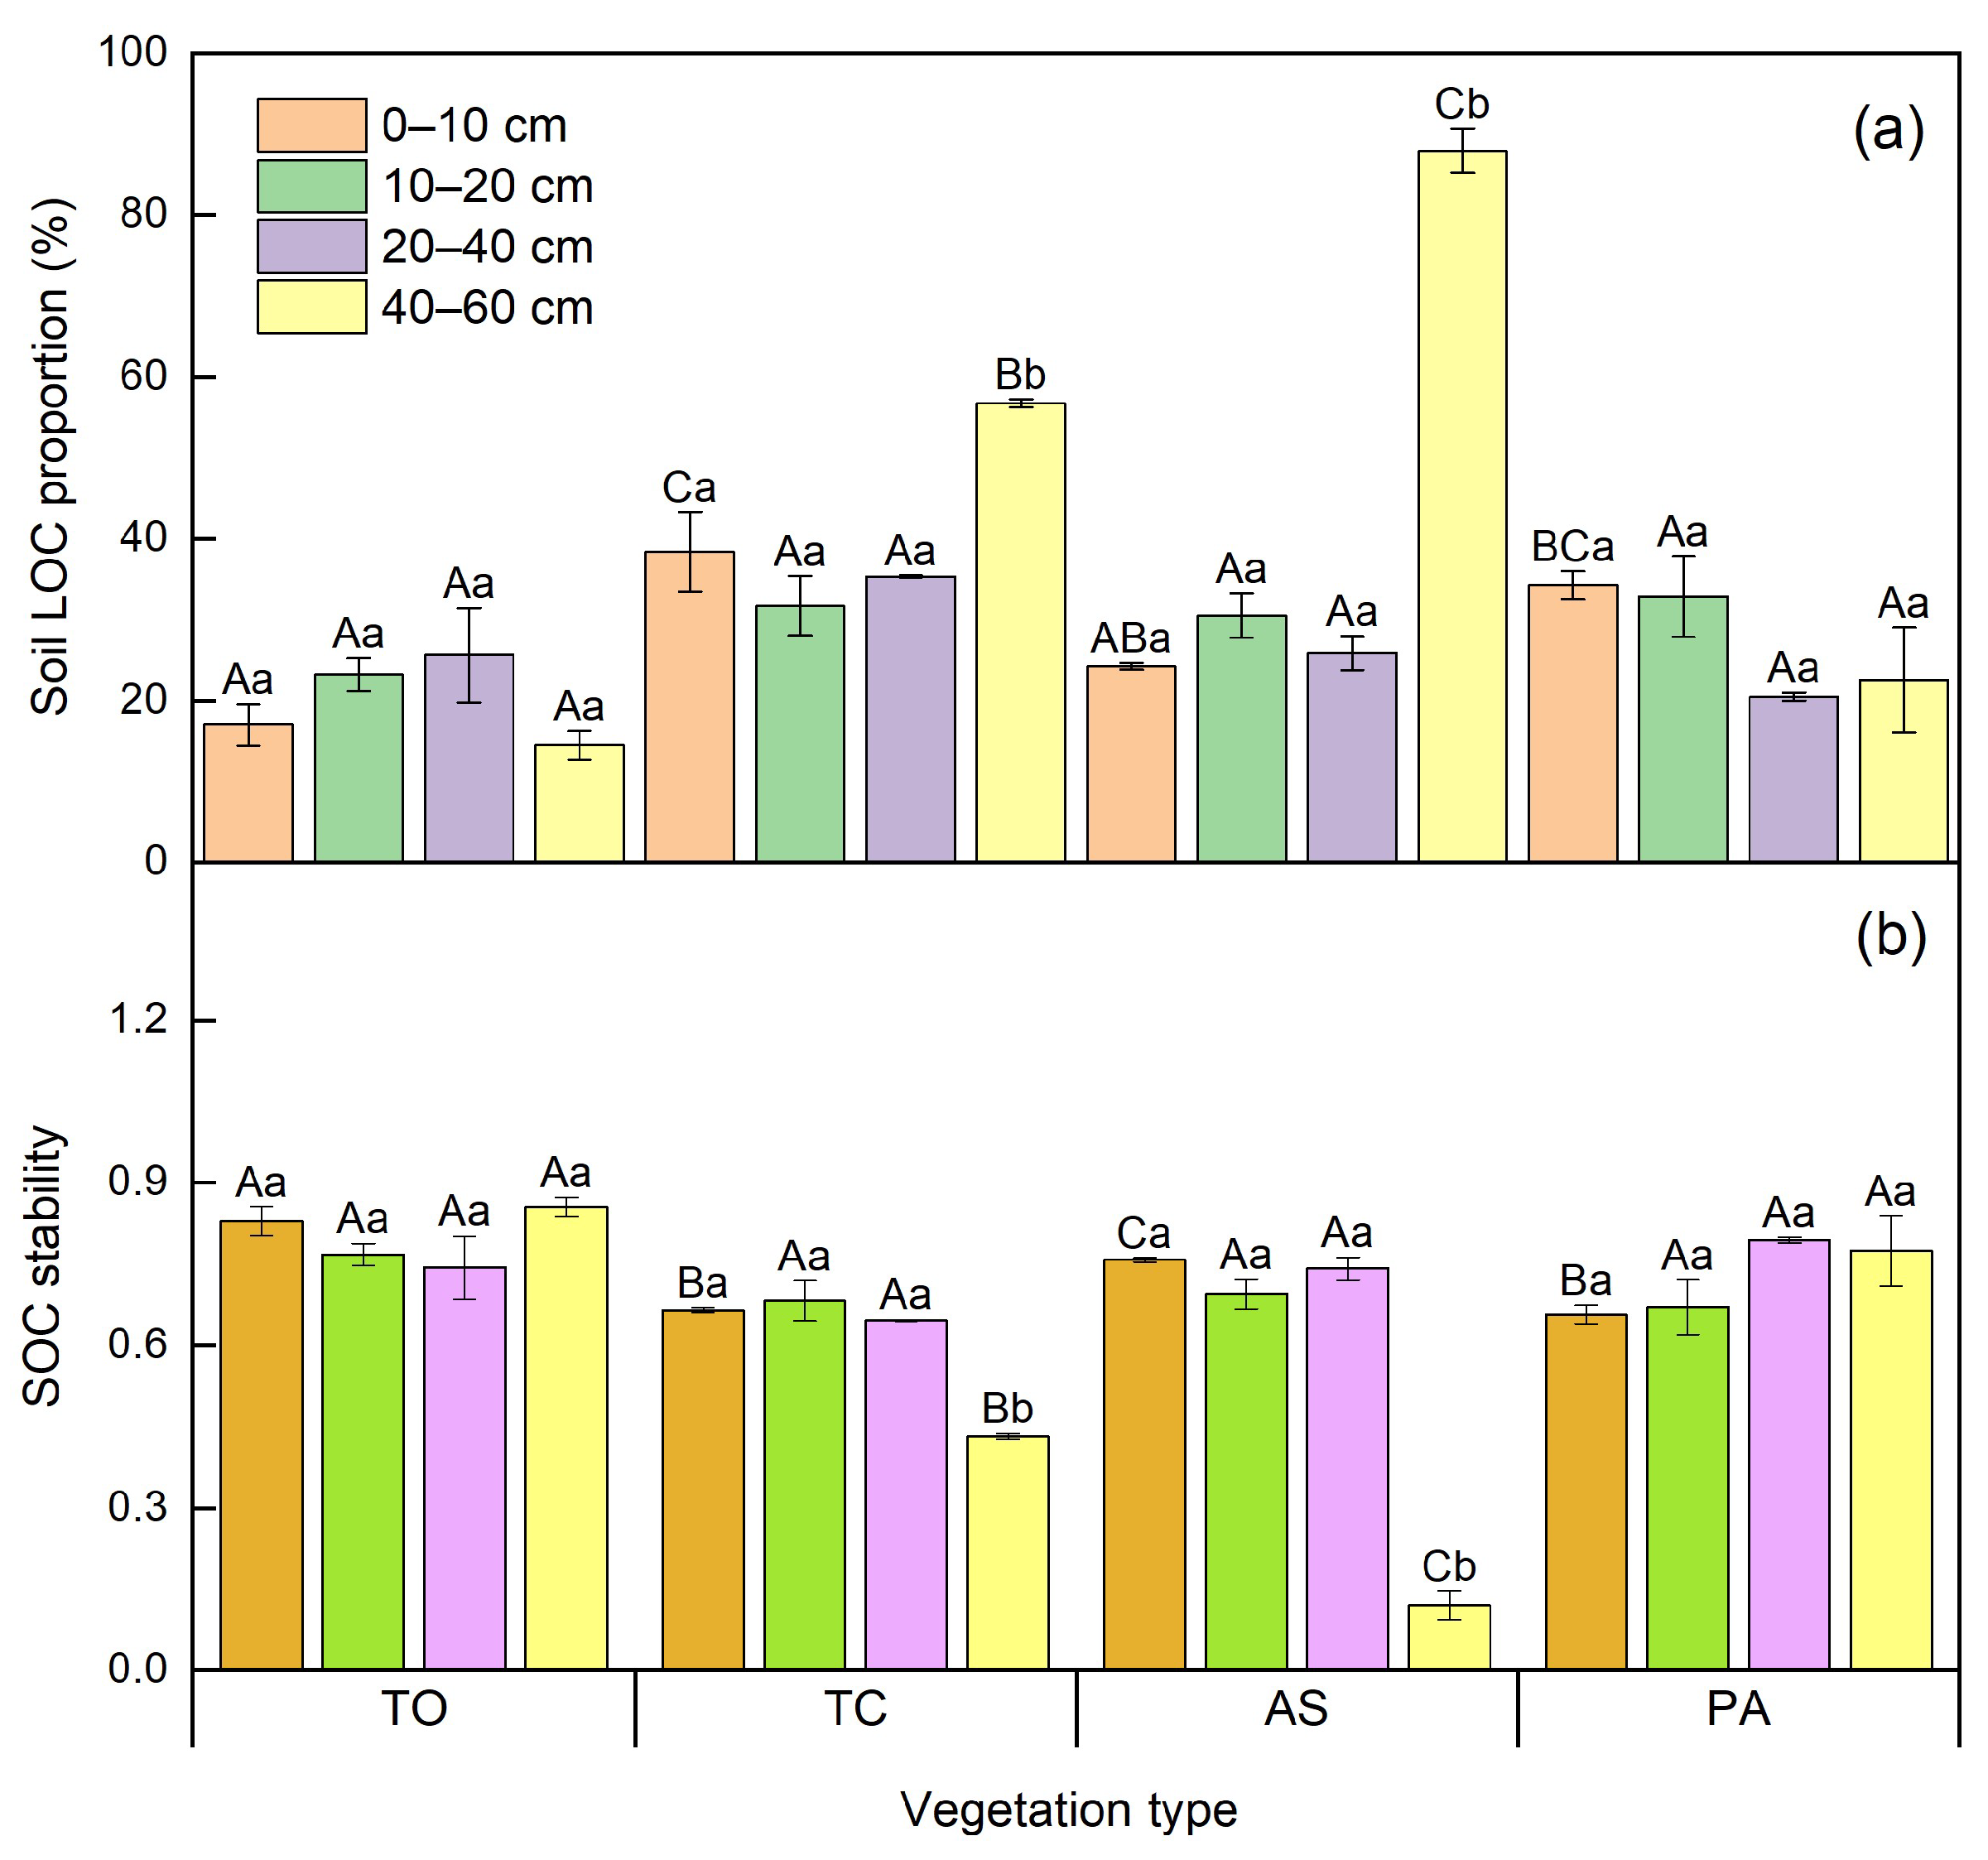
Vegetation types and soil depths had significant effects on SOC content, stability, and storage (p < 0.001) (Table 2). Significant interactions between vegetation type and soil depth were also observed (p < 0.001). Among the four vegetation communities, Avena sativa and Phragmites australis communities exhibited the highest SOC contents and storage in 0–10, 10–20, and 20–40 cm soil layers (p < 0.05). In contrast, the Typha orientalis community showed the highest SOC content and storage in the 40–60 cm soil layer (p < 0.01) (Figure 3). In the 0–60 cm soil layer, Avena sativa and Phragmites australis communities showed the highest SOC storage (p < 0.001) (Figure 3). Typha orientalis community showed the lowest soil LOC proportion, but the highest SOC stability among vegetation types in 0–10 and 40–60 cm soil layers (p < 0.001). However, no differences in SOC stability were observed among vegetation types in 10–20 and 20–40 cm soil layers (Figure 4).

3.4. The Influences of Soil Physicochemical Properties on Soil Organic C Fractions, Stability, and Storage

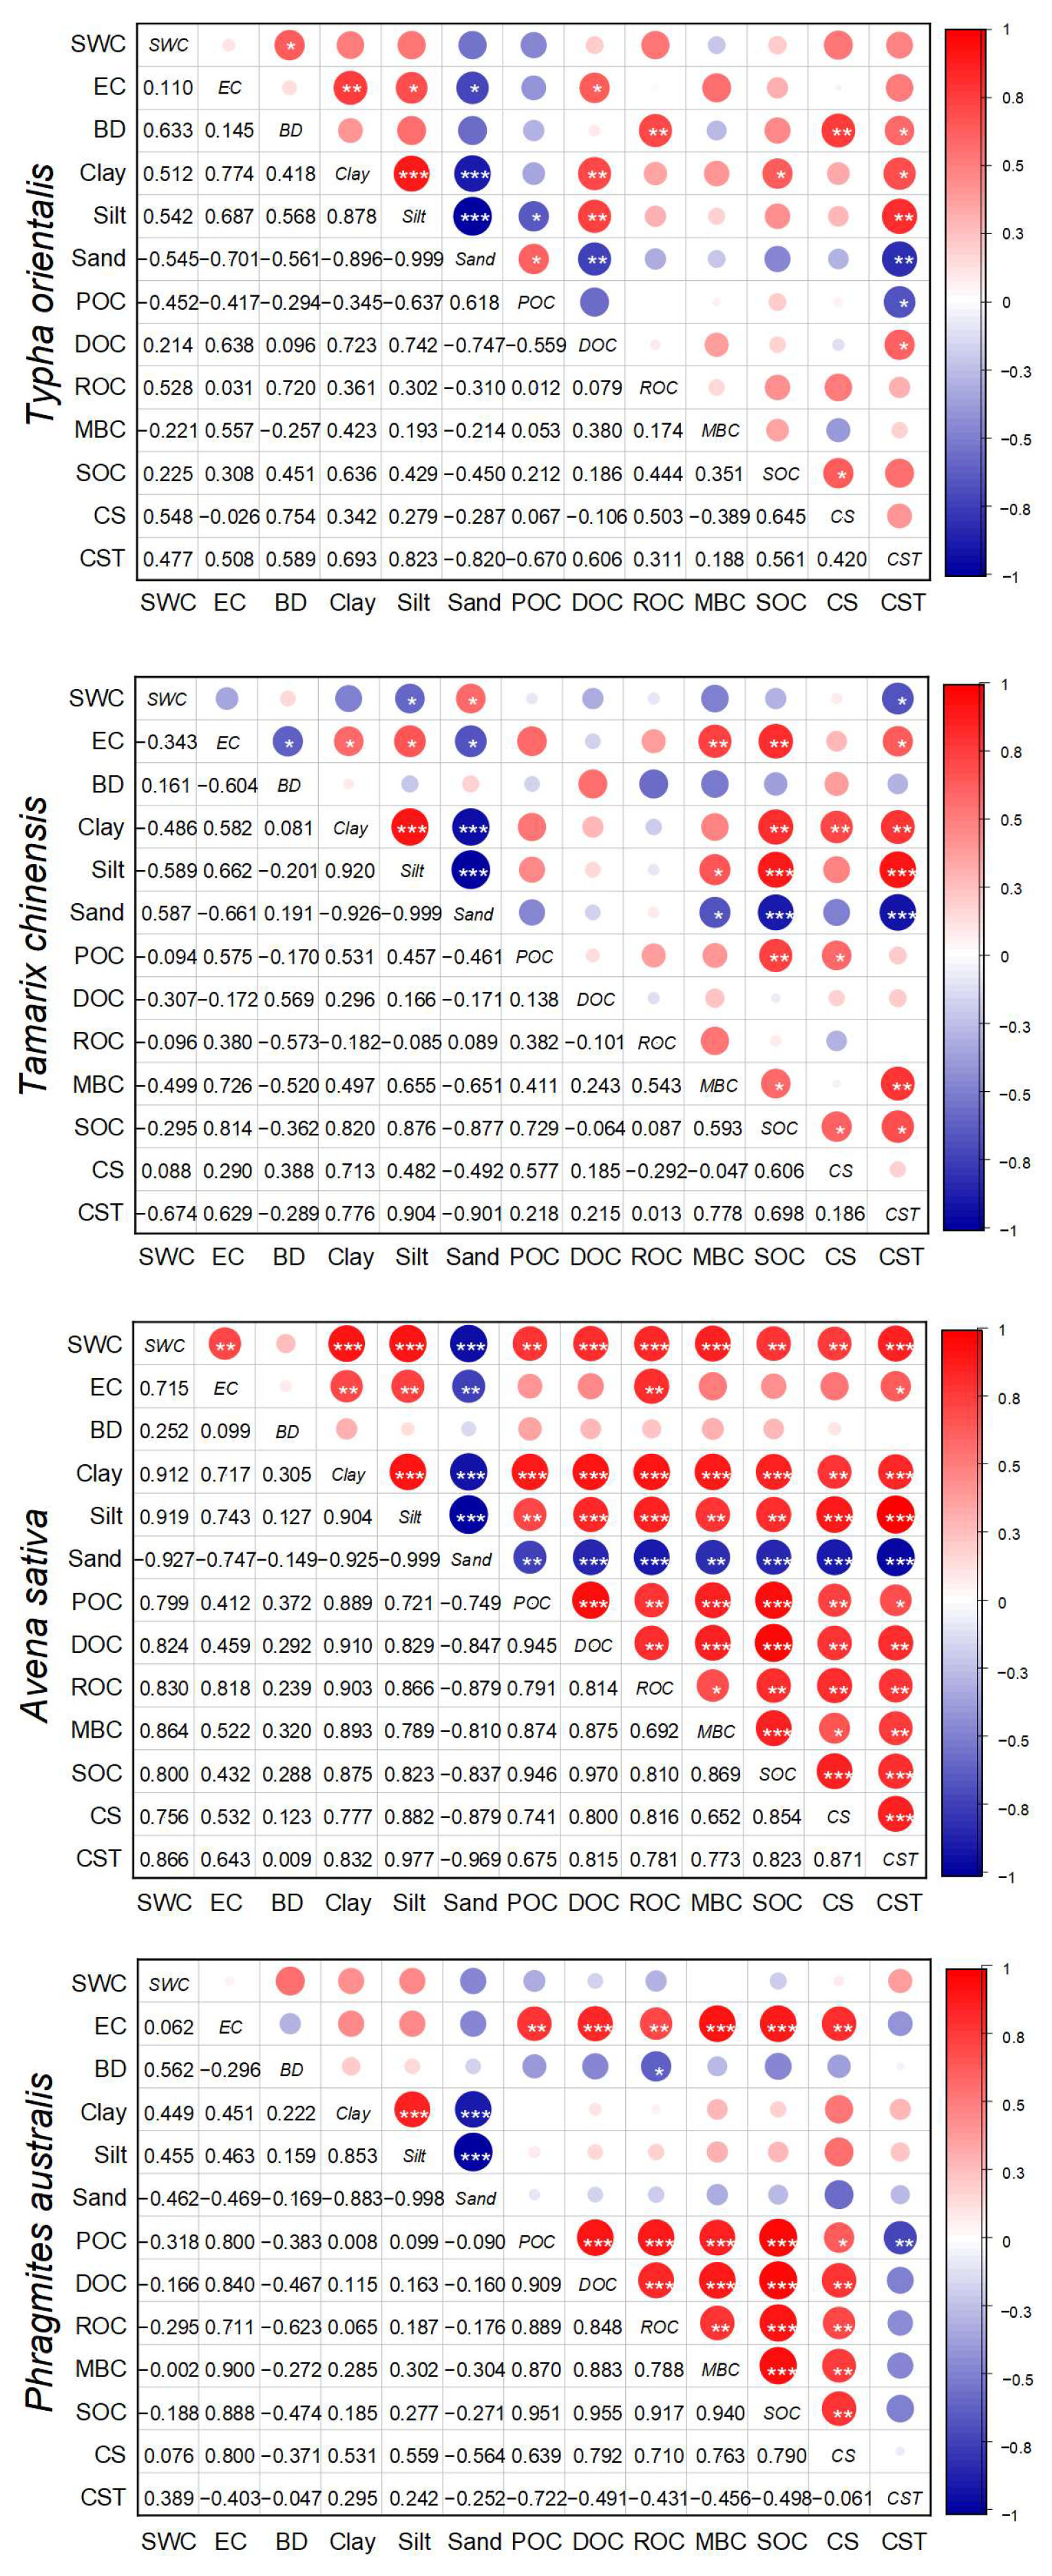
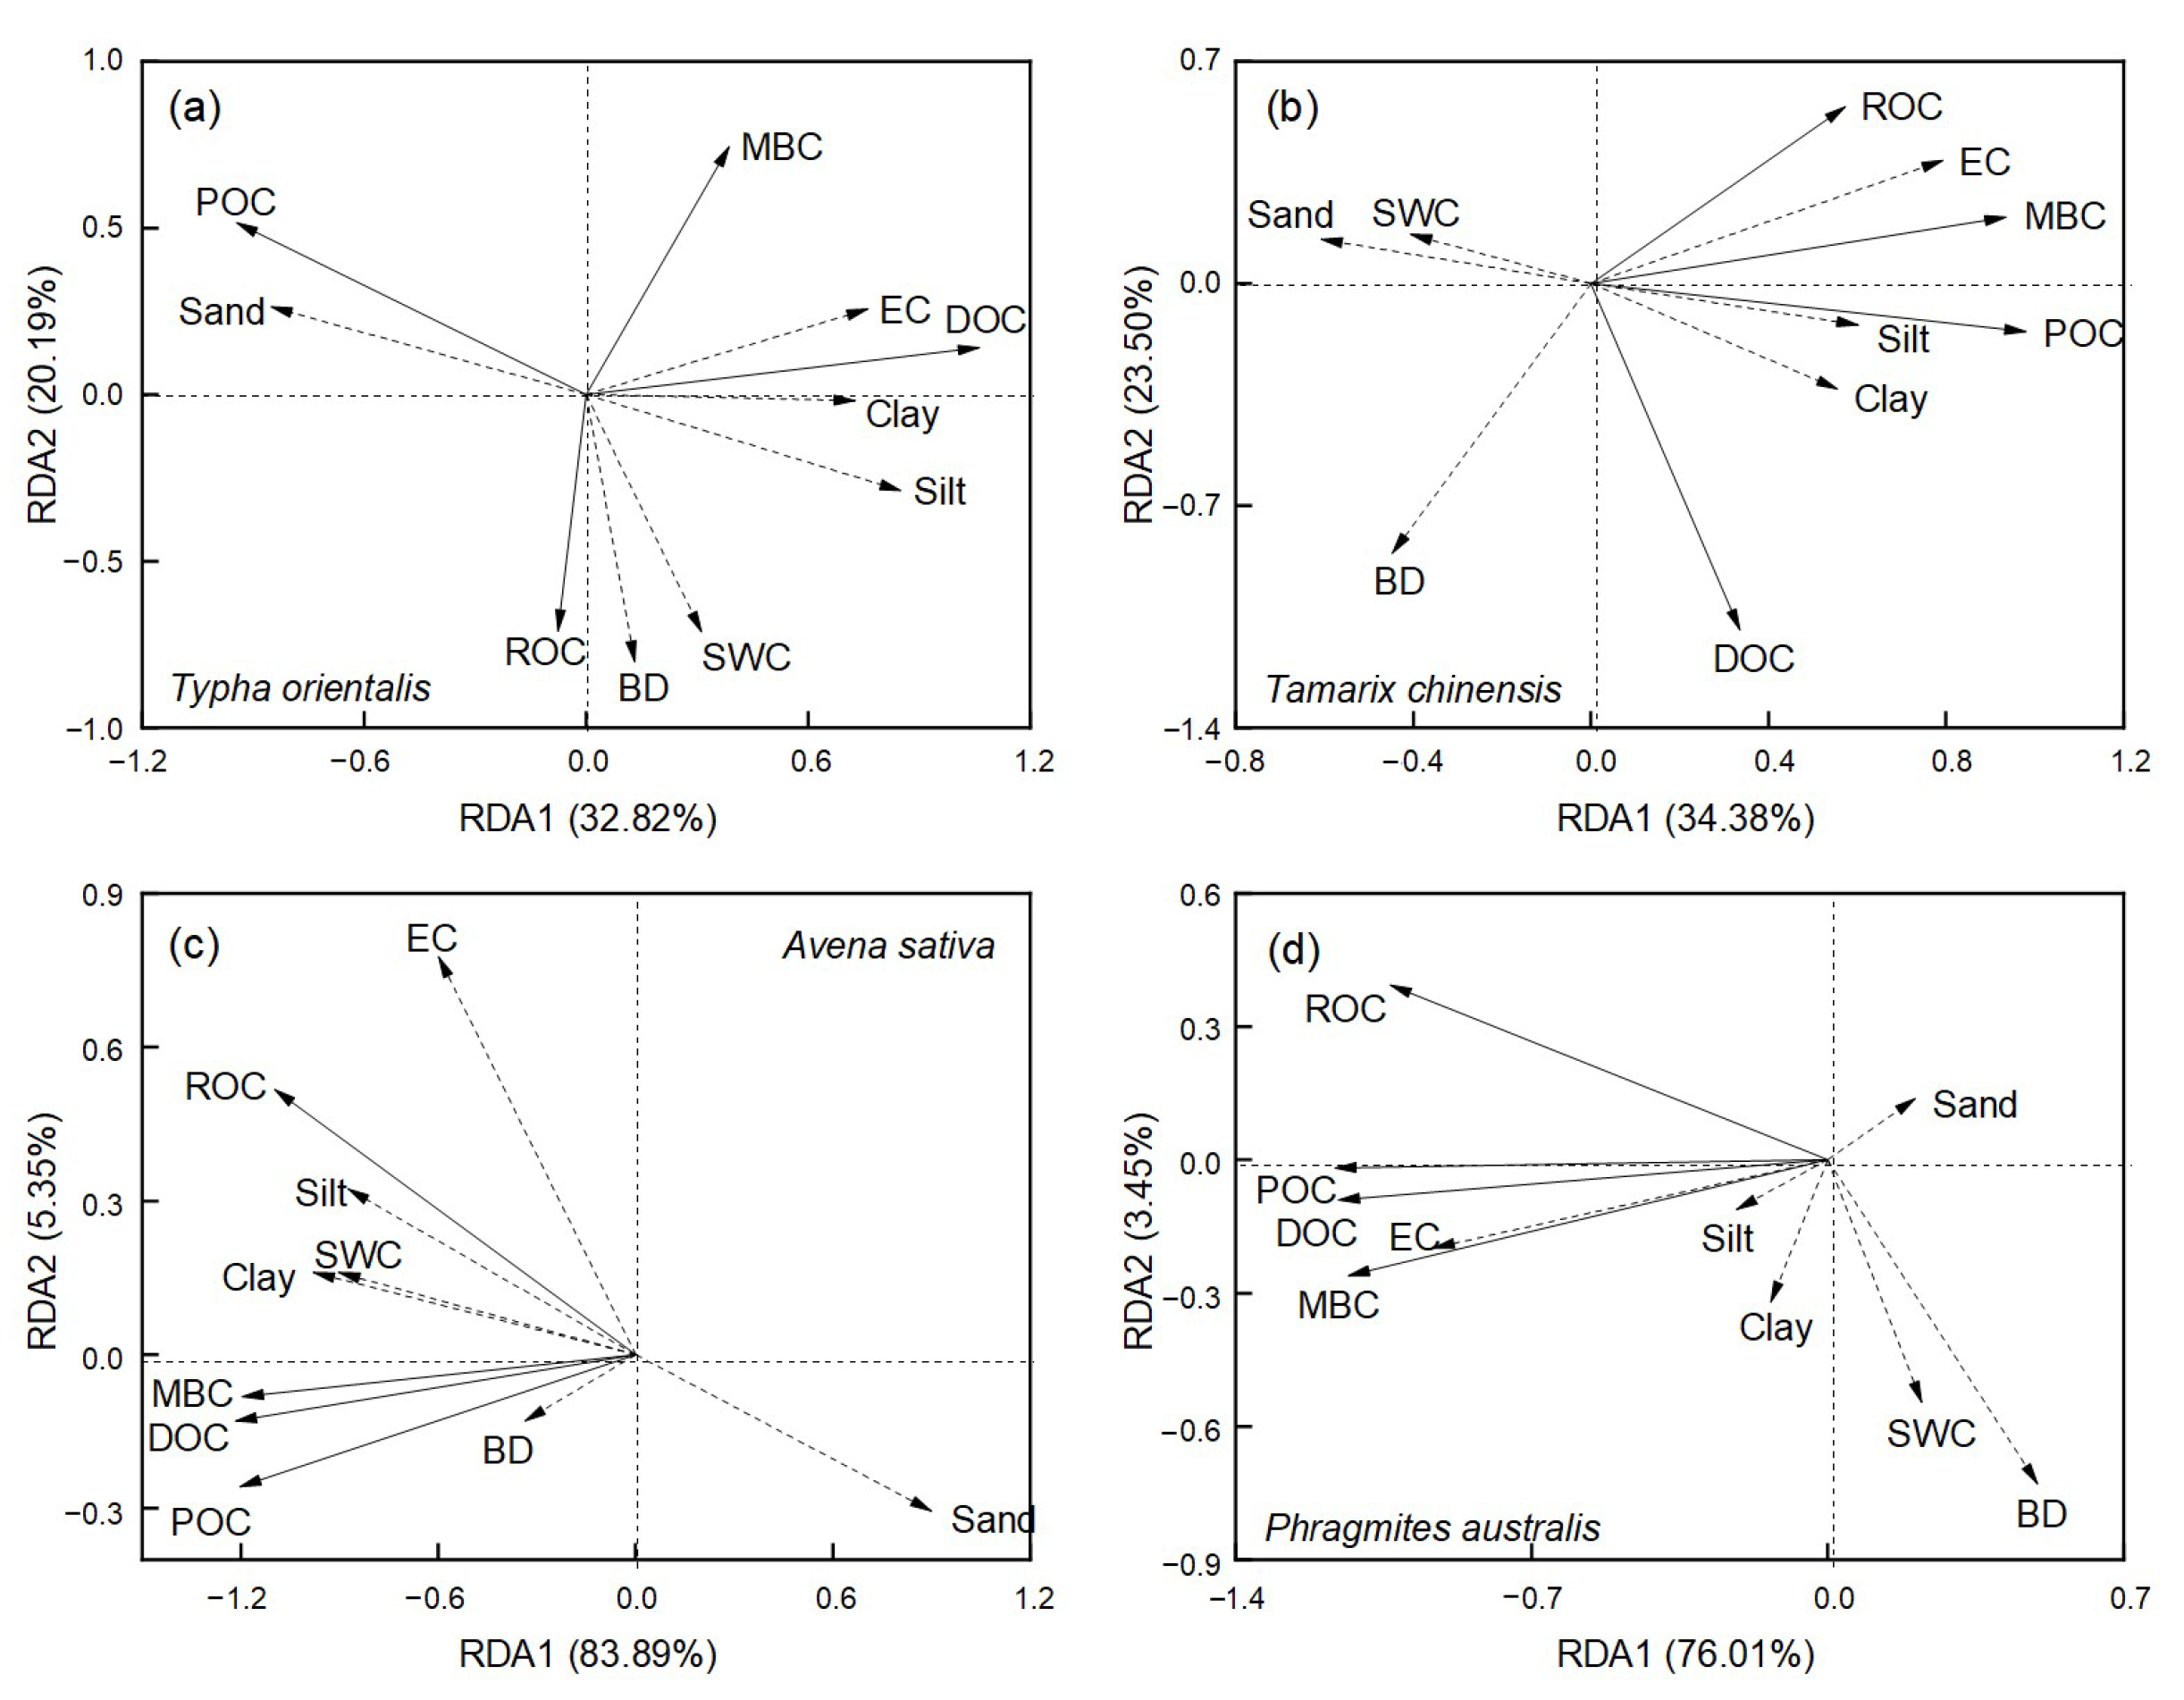
Soil POC, ROC, and DOC contents of Typha orientalis community were affected by soil BD, EC, or particle size composition (p < 0.05). However, soil EC and particle size composition only affected the soil MBC content of the Tamarix chinensis community (p < 0.05). SOC fractions of the Avena sativa community were largely influenced by SWC, soil EC, or particle size composition (p < 0.05). In contrast, soil EC and BD influenced soil POC, ROC, DOC, and MBC contents of the Phragmites australis community (p < 0.05) (Figure 5 and Figure 6).
SOC stability of Typha orientalis community was affected by soil BD and particle size composition (p < 0.05). In contrast, SOC stability of both Tamarix chinensis and Avena sativa communities was affected by SWC, soil EC, and particle size composition (p < 0.05). However, soil physicochemical properties hardly influenced the SOC stability of the Phragmites australis community (Figure 5).
The SOC storage of Typha orientalis community was affected by soil pH and soil clay content (p < 0.05), while SWC and clay content influenced the SOC storage of the Tamarix Chinensis community (p < 0.01). Soil silt content influenced the SOC storage of the Avena sativa community (p < 0.001). In contrast, the SOC storage of Phragmites australis community was largely affected by soil EC (p < 0.01) (Table 3).

4. Discussion

In this study, we investigated soil organic C (SOC) fractions and the storage of different vegetation types in the Yellow River wetland. These results support our hypothesis that SOC fractions and storage varied across vegetation types, whereas hydrological conditions and soil physicochemical properties regulated the vegetation effects in the Yellow River wetland. Compared with Typha orientalis and Tamarix chinensis communities, Phragmites australis and Avena sativa communities had higher labile SOC fractions (particulate organic C, dissolved organic C, and microbial biomass C) and SOC storage but lower SOC stability, which supports our second hypothesis.

4.1. The Responses of Soil Organic C Fractions to Vegetation Types in the Yellow River Wetland

Soils in Avena sativa and Phragmites australis communities had higher EC and clay and silt contents (Table 1), contributing to their higher particulate organic C (POC) in the 0–20 cm soil layer (Figure 5). Soil clay particles have adsorption and embedding effects on POC, thus protecting soil POC from microbial decomposition and promoting its accumulation [22,26]. Additionally, the high soil pH and electrical conductivity (EC) of Phragmites australis community adversely affect the microbial activity and decomposition of POC [38,39], which contributed to soil POC accumulation. Typha orientalis and Tamarix chinensis communities, located in low beach wetland, were often scoured by floods. Soil water table in low beach wetland was relatively high, making the soil particles more likely to be suspended and moved [40,41]. Thus, SOC was lost, leading to a lower content of soil POC in Typha orientalis and Tamarix chinensis communities. In addition, the alternation of wet and dry conditions in the soil of low beach wetland was frequent, which made POC more susceptible to decomposition [6,29,42].
Phragmites australis and Avena sativa communities had higher soil EC in topsoil, which was conducive to stimulating the production of plant root exudates and the formation of soil readily oxidized organic C (ROC) [43,44]. Higher clay and lower sand contents of these plant communities improved organic matter adsorption and contributed to ROC conservation (Figure 5) [38,45]. Additionally, these plant communities in high beach wetland had a long-term stable water table, which reduced soil erosion and prevented ROC from being lost with water flow. These processes facilitated the formation and accumulation of soil ROC in Phragmites australis and Avena sativa communities (Figure 2b). However, the sharp increase in the sand content (from 14.12% to 87.90%) of the Avena sativa community in the 40–60 cm soil layer indicates an alluvial origin of the soil. The high deposited coarser sediments (sand) reduced soil aggregation and mineral adsorption capacity, limiting the physical protection of ROC [5,11,38]. In addition, in the 40–60 cm soil layer, the lowest soil ROC of the Avena sativa community was related to the low soil EC and SWC (Figure 5). In contrast, the Typha orientalis community had higher SWC and clay content in the 40–60 cm soil layer, which led to the higher soil ROC (Figure 2b).
High soil EC and low SWC adversely affect the absorption of soil dissolved organic C (DOC) for plants and soil microorganisms, as well as the microbial decomposition of DOC [10,38,39]. These processes resulted in soil DOC accumulation [10,46]. Soil clay and silt particles can protect soil DOC from microbial utilization and decomposition, contributing to enhancing DOC content [47,48,49]. Therefore, compared with Typha orientalis and Tamarix chinensis communities, Phragmites australis and Avena sativa communities exhibited higher soil EC, soil clay, and silt contents and lower SWC had higher soil DOC in the 0–20 cm soil layer (Figure 2c). Additionally, Phragmites australis and Avena sativa community were located in high beach wetland, where soil DOC was less disturbed by hydrological factors, facilitating its accumulation.
The Phragmites australis community had more vigorous root systems than the other plant communities [5,16,34], and its roots can produce more root exudates. The rich root exudate would facilitate microbial growth, which greatly increased soil microbial biomass C (MBC) [23]. Fine-textured soils rich in silt and clay particles increased soil water-holding capacity, thus indirectly and partially reducing water stress on microbes. This water stress reduction can increase soil microbial activity, biomass, and diversity [21,50], potentially promoting the production of MBC in Phragmites australis and Avena sativa communities. Moreover, soil MBC can be stabilized by silt and clay particles [26,51]. In contrast, high soil pH inhibited the microbial growth and MBC accumulation of Typha orientalis and Tamarix chinensis communities [10]. Furthermore, the Tamarix chinensis community was relatively sparse and short-statured, resulting in less litter input and reducing the sources of MBC input. Less litter covered the soil surface of the Tamarix chinensis community, resulting in higher soil temperature and lower SWC (Table 1). Thus, these adverse factors reduced the soil microbial activity, growth, and biomass C of the Tamarix chinensis community (Figure 2d).

4.2. Vegetation Types Can Alter Soil Organic C Stability in the Yellow River Wetland

The soil labile organic C fractions (POC, ROC, DOC, and MBC) of Avena sativa and Phragmites australis communities were higher than those of Typha orientalis and Tamarix chinensis communities in the 0–20 cm soil layer, which was attributed to their higher soil EC, clay, and silt contents (Figure 5 and Figure 6). The higher soil BD of the Avena sativa community inhibited soil aeration and slowed down the decomposition rate of labile organic C by microorganisms [52]. Higher soil EC can suppress microbial activity, reducing the consumption of labile organic C by microorganisms [21]. Higher soil silt and clay contents can fix more labile organic C through physical adsorption and chemical bonding to form stable organic-inorganic complexes [38,45]. In turn, the higher soil labile organic C fractions promoted microbial activity in these gramineous plant communities, which is conducive to the enhancement of stable SOC content and SOC storage [18,53]. Typha orientalis and Tamarix chinensis communities had relatively high sand content, with large pores and weak adsorption capacity [54]. As a result, labile organic C was easily lost with water erosion or rapidly decomposed by microorganisms. A decrease in soil mineral activity with high pH led to a decrease in the ability and amount of minerals to adsorb labile organic C in Typha orientalis and Tamarix chinensis communities [21]. Furthermore, the litter of Tamarix chinensis contains more lignin and phenolic substances, which decomposed slowly and resulted in low labile SOC content [3,55].
The high soil labile organic C proportion decreased the SOC stability of the Tamarix chinensis and Phragmites australis community in topsoil (Figure 4). Although the Tamarix chinensis community had low soil labile organic C, its proportion relative to SOC was high. Therefore, SOC stability in the Tamarix chinensis community was also weak. In contrast, the Typha orientalis community had a low content and proportion of soil labile organic C in topsoil, indicating that its SOC was relatively stable (Figure 4). However, the Phragmites australis community enhanced its SOC stability in 20–40 and 40–60 cm soil layers, potentially linked to the decrease of soil POC in these layers (Figure 2a). This may be attributed to decreased organic matter input, which reduced soil POC in deeper soil layer [56]. Soil POC is a labile fraction of SOC, and a decrease in POC could indicate a shift in SOC fractions toward more stable SOC components (e.g., mineral-associated organic C) in deeper soil layers of the Phragmites australis community. The soil labile organic C proportion of the Avena sativa community was lower in the 0–40 cm soil layer than in the 40–60 cm soil layer. Therefore, the SOC stability of the Avena sativa community was higher in the 0–40 cm soil layer than in the 40–60 cm soil layer (Figure 4b). This result was related to the sharp increase in sand content due to historic natural alluviation in the 40–60 cm soil layer of the Avena sativa community (Table 1, Figure 5).

4.3. Soil Organic C Storage Varied with Vegetation Types in the Yellow River Wetland

Soil sand reduced soil aggregation and mineral adsorption capacity, limiting the physical protection of SOC [5,11,38]. Low SWC inhibited microbial growth and the formation of SOC derived from microbial sources [10,21]. Thus, low SWC and high soil sand content resulted in the lower SOC storage of the Tamarix chinensis and Avena sativa community than Typha orientalis and Phragmites australis community in the 40–60 cm soil layer (Figure 3b). Soil organic C and its storage in Avena sativa and Phragmites australis communities were higher in topsoil than in subsoil due to continuous litter input in the topsoil [8,25]. In contrast, SOC content and its storage of the Typha orientalis community were higher in the 40–60 cm than in the 0–40 cm soil layer, which was consistent with previous studies [57]. The Typha orientalis community was located in low beach wetland, close to the river channel. Its high SWC promoted soil microbial activity for SOC decomposition, and water table fluctuation induced by flooding events intensified organic C decomposition in topsoil [10,29,33,58]. Furthermore, the topsoil of the Typha orientalis community was more susceptible to flood erosion, making SOC more prone to loss. In contrast, SOC in the subsoil of the Typha orientalis community was well-preserved due to the anaerobic environment, which resulted in high SOC storage.
Soil clay and silt particles can protect SOC fractions from microbial decomposition and contribute to SOC absorption and conservation [45,47,48,49]. Avena sativa and Phragmites australis communities with higher soil clay or silt contents had higher SOC content and storage in the 0–60 cm soil layer (Table 1, Figure 3b). Moreover, high soil EC adversely affected microbial decomposition through low osmotic potential [38] and decreased the dissolution rate of soil DOC [59], which helped to increase the SOC storage of the Phragmites australis community. In contrast, Tamarix chinensis and Typha orientalis communities with the lowest soil clay content had the lowest SOC storage (Figure 3b). Additionally, the low SWC of the Tamarix chinensis community and the high soil pH of the Typha orientalis community also inhibited microbial activity, litter decomposition, or soil mineral adsorption (Table 3) [10,21,50], resulting in a slow rate of SOC generation and accumulation from litter input. Furthermore, Tamarix chinensis and Typha orientalis communities in low beach wetland were periodically flooded and scoured by river water, resulting in SOC loss.
Compared with the forb community (Typha orientalis), gramineous communities (Phragmites australis and Avena sativa) have relatively high water and nutrient use efficiency and well-developed root systems [15,16,60], which is conducive to increasing biomass and root turnover. Thus, more litter was produced to increase organic C input and accumulation [8,25], enabling these plant communities to have higher SOC content and storage than Typha orientalis and Tamarix chinensis communities in the upper soil layer. Perennial plants and shrubs such as Typha orientalis and Tamarix chinensis usually have more lignin in their litter, and they take a relatively long time for litter decomposition [3,55]. Thus, these plant communities had a relatively slow rate for SOC input and accumulation.

5. Conclusions

Soil organic C (SOC) fractions and storage varied with vegetation types in the Yellow River wetland, consistent with ecological principles of plant–soil interactions. First, hydrological conditions modulated the vertical distribution of SOC, a key feature of the wetland C cycle. The SOC storage of Avena sativa and Phragmites australis communities in high beach wetland decreased with increasing soil depth. However, the change trends were not obvious in Typha orientalis and Tamarix chinensis communities due to the complex hydrological conditions of low beach wetland that interfered with typical SOC stratification. Second, plant functional types interact with hydrological conditions to shape C input quantity, quality, and soil properties, thereby jointly regulating SOC fractions and storage. Avena sativa and Phragmites australis communities displayed the highest labile organic C content (0.98 ± 0.09 and 0.83 ± 0.05 g kg−1, respectively) and SOC storage (2.81 ± 0.32 and 2.53 ± 0.06 kg m−2, respectively). These patterns can be attributed to their higher soil clay and silt contents, elevated electrical conductivity, and stable hydrological conditions, which protected SOC from microbial decomposition and water erosion. Finally, vegetation with trait-matched C strategies can guide effective wetland C management. Avena sativa and Tamarix chinensis communities showed the lowest SOC stability (2.27 ± 0.13 and 1.34 ± 0.17, respectively), reflecting their high proportion of labile organic C. In contrast, the Typha orientalis community exhibited the highest SOC stability (4.31 ± 0.38), owing to its high proportion of recalcitrant organic C content. Therefore, we recommend Phragmites australis and Avena sativa communities for enhancing short-term C sequestration, while Typha orientalis communities are more suitable for long-term C sink capacity in the Yellow River wetland. Overall, our study demonstrates that vegetation-mediated C processes in the Yellow River wetland are governed by species-based functional traits, soil properties, and hydrological regulation. These differences in C sequestration effects across vegetation types should be considered in research on the C cycle in riverine wetlands.

Author Contributions

Formal analysis, S.L., C.Y., M.Z. and J.W.; Funding acquisition, S.L., C.Y. and F.Q.; Investigation, S.L., C.Y., M.Z., S.Y. and J.W.; Writing—original draft, C.Y.; Writing—review and editing, J.W. All authors have read and agreed to the published version of the manuscript.

Funding

This research was funded by the Fundamental Research Fund of Henan Academy of Sciences (230601066), the Soft Science Research Project of Henan Province (242400410184), and the Joint Fund of Henan Province Science and Technology R&D Program (225200810047). The funders had no role in the study design, data collection, data analysis, decision to publish, or preparation of the manuscript.

Data Availability Statement

Data are available upon request.

Conflicts of Interest

The authors declare no conflicts of interest.

Abbreviations

The following abbreviations are used in this manuscript:
SOCSoil organic C
CSTSoil organic C stability
CSSoil organic C storage
POCParticulate organic C
ROCReadily oxidized organic C
DOCDissolved organic C
MBCMicrobial biomass C
LOCLabile organic C
ECElectrical conductivity
SWCSoil water content
BDBulk density
RDARedundancy analysis

References

  1. IPCC. Climate Change—The Physical Science Basis; IPCC: Cambridge, UK, 2007; pp. 131–234. [Google Scholar]
  2. Lane, R.R.; Mack, S.K.; Day, J.W.; DeLaune, R.D.; Madison, M.J.; Precht, P.R. Fate of soil organic carbon during wetland loss. Wetlands 2016, 36, 1167–1181. [Google Scholar] [CrossRef]
  3. Villa, J.A.; Bernal, B. Carbon sequestration in wetlands, from science to practice: An overview of the biogeochemical process, measurement methods, and policy framework. Ecol. Eng. 2018, 114, 115–128. [Google Scholar] [CrossRef]
  4. Adame, M.F.; Santini, N.S.; Tovilla, C.; Vázquez-Lule, A.; Castro, L.; Guevara, M. Carbon stocks and soil sequestration rates of tropical riverine wetlands. Biogeosciences 2015, 12, 3805–3818. [Google Scholar] [CrossRef]
  5. Dong, J.Y.; Zhao, D.; Zhang, C.; Cao, Q.Q.; Fang, J.H.; Yang, R.R.; Ji, S.P.; Li, C.C.; Zhao, R.Q.; Liu, J. Factors controlling organic carbon distributions in a riverine wetland. Environ. Sci. Pollut. R. 2020, 27, 34529–34540. [Google Scholar] [CrossRef]
  6. Shen, R.C.; Yang, H.; Rinklebe, J.; Bolan, N.; Hu, Q.W.; Huang, X.Y.; Wen, X.T.; Zheng, B.F.; Shi, L. Seasonal flooding wetland expansion would strongly affect soil and sediment organic carbon storage and carbon-nutrient stoichiometry. Sci. Total Environ. 2022, 828, 154427. [Google Scholar] [CrossRef]
  7. Lu, Y.; Xu, H.W. Distribution characteristic of soil organic carbon fraction in different types of wetland in Hongze Lake of China. Sci. World J. 2014, 2014, 487961. [Google Scholar] [CrossRef] [PubMed]
  8. Huang, L.B.; Bai, J.H.; Gao, H.F.; Xiao, R.; Liu, P.P.; Chen, B. Soil organic carbon content and storage of raised field wetlands in different functional zones of a typical shallow freshwater lake, China. Soil. Res. 2012, 50, 664–671. [Google Scholar] [CrossRef]
  9. Sun, D.B.; Li, Y.Z.; Yu, J.B.; Li, B.Q.; Guan, B.; Zhou, D.; Wang, X.H.; Yang, J.S.; Ma, Y.Q.; Zhang, X.; et al. Spatial distribution of soil quality under different vegetation types in the Yellow River Delta wetland. Front. Ecol. Evol. 2022, 10, 977899. [Google Scholar] [CrossRef]
  10. Qu, W.D.; Han, G.X.; Wang, J.; Li, J.Y.; Zhao, M.L.; He, W.J.; Li, X.G.; Wei, S.Y. Short-term effects of soil moisture on soil organic carbon decomposition in a coastal wetland of the Yellow River Delta. Hydrobiologia 2021, 848, 3259–3271. [Google Scholar] [CrossRef]
  11. Zhao, Q.Q.; Bai, J.H.; Zhang, G.L.; Jia, J.; Wang, W.; Wang, X. Effects of water and salinity regulation measures on soil carbon sequestration in coastal wetlands of the Yellow River Delta. Geoderma 2018, 319, 219–229. [Google Scholar] [CrossRef]
  12. Zhong, R.; Pu, L.J.; Xie, J.Y.; Yao, J.M.; Qie, L.; He, G.L.; Wang, X.Q.; Zhang, R.; Zhai, J.H.; Gong, Z.S.; et al. Carbon storage in typical ecosystems of coastal wetlands in Jiangsu, China: Spatiotemporal patterns and mechanisms. Catena 2025, 254, 108882. [Google Scholar] [CrossRef]
  13. Yao, L.; Adame, M.F.; Chen, C.R. Resource stoichiometry, vegetation type and enzymatic activity control wetlands soil organic carbon in the Herbert River catchment, North-east Queensland. J. Environ. Manag. 2021, 296, 113183. [Google Scholar] [CrossRef]
  14. Knelman, J.E.; Legg, T.M.; O’Neill, S.P.; Washenberger, C.L.; González, A.; Cleveland, C.C.; Nemergut, D.R. Bacterial community structure and function change in association with colonizer plants during early primary succession in a glacier forefield. Soil Biol. Biochem. 2012, 46, 172–180. [Google Scholar] [CrossRef]
  15. Zhou, N.; Li, H.G.; Wang, B.L.; Rengel, Z.; Li, H.B. Differential root nutrient-acquisition strategies underlie biogeochemical niche separation between grasses and forbs across grassland biomes. Funct. Ecol. 2024, 38, 2286–2299. [Google Scholar] [CrossRef]
  16. Huang, K.L.; De Long, J.R.; Yan, X.B.; Wang, X.Y.; Wang, C.L.; Zhang, Y.W.; Zhang, Y.Y.; Wang, P.; Du, G.Z.; van Kleunen, M.; et al. Why are graminoid species more dominant? Trait-mediated plant–soil feedbacks shape community composition. Ecology 2024, 105, e4295. [Google Scholar] [CrossRef]
  17. Arnosti, C.; Bell, C.; Moorhead, D.L.; Sinsabaugh, R.L.; Steen, A.D.; Stromberger, M.; Wallenstein, M.; Weintraub, M.N. Extracellular enzymes in terrestrial, freshwater, and marine environments: Perspectives on system variability and common research needs. Biogeochemistry 2014, 117, 5–21. [Google Scholar] [CrossRef]
  18. Xia, S.P.; Song, Z.L.; Li, Q.; Guo, L.D.; Yu, C.X.; Singh, B.P.; Fu, X.L.; Chen, C.M.; Wang, Y.D.; Wang, H.L. Distribution, sources, and decomposition of soil organic matter along a salinity gradient in estuarine wetlands characterized by C:N ratio, δ13C- δ15N, and lignin biomarker. Glob. Change Biol. 2020, 27, 417–434. [Google Scholar] [CrossRef] [PubMed]
  19. Song, Y.Y.; Song, C.C.; Yang, G.S.; Wang, X.W.; Wang, L.L.; Li, Y.C.; Hou, C.C. Variation of soil enzyme activities and correlations with labile organic carbon fractions in different types of wetlands in the sanjiang plain, northeast China. Fresenius Environ. Bull. 2013, 22, 86–94. [Google Scholar]
  20. Wang, H.Y.; Wu, J.Q.; Li, G.; Yan, L.J. Changes in soil carbon fractions and enzyme activities under different vegetation types of the northern Loess Plateau. Ecol. Evol. 2020, 10, 12211–12223. [Google Scholar] [CrossRef]
  21. Wu, L.L.; Song, Z.L.; Wu, Y.T.; Xia, S.P.; Kuzyakov, Y.; Hartley, I.P.; Fang, Y.Y.; Yu, C.X.; Wang, Y.D.; Chen, J.; et al. Organic matter composition and stability in estuarine wetlands depending on soil salinity. Sci. Total Environ. 2024, 945, 173861. [Google Scholar] [CrossRef]
  22. Ji, H.; Han, J.G.; Xue, J.M.; Hatten, J.A.; Wang, M.H.; Guo, Y.H.; Li, P.P. Soil organic carbon pool and chemical composition under different types of land use in wetland: Implication for carbon sequestration in wetlands. Sci. Total Environ. 2020, 716, 136996. [Google Scholar] [CrossRef]
  23. Wang, X.L.; Xu, L.G.; Wan, R.G.; Chen, Y.W. Seasonal variations of soil microbial biomass within two typical wetland areas along the vegetation gradient of Poyang Lake, China. Catena 2016, 137, 483–493. [Google Scholar] [CrossRef]
  24. Ren, Q.; Yuan, J.H.; Wang, J.P.; Liu, X.; Ma, S.L.; Zhou, L.Y.; Miao, L.J.; Zhang, J.C. Water level has higher influence on soil organic carbon and microbial community in Poyang Lake wetland than vegetation type. Microorganisms 2022, 10, 131. [Google Scholar] [CrossRef] [PubMed]
  25. Were, D.; Kansiime, F.; Fetahi, T.; Hein, T. Soil organic carbon storage in a tropical freshwater wetland: The influence of vegetation type. Afr. J. Aquat. Sci. 2021, 46, 161–172. [Google Scholar] [CrossRef]
  26. Mao, H.R.; Cotrufo, M.F.; Hart, S.C.; Sullivan, B.W.; Zhu, X.F.; Zhang, J.C.; Liang, C.; Zhu, M.Q. Dual role of silt and clay in the formation and accrual of stabilized soil organic carbon. Soil. Biol. Biochem. 2024, 192, 109390. [Google Scholar] [CrossRef]
  27. Qiu, S.Y.; Wang, Z.Y.; Xu, J.L.; Cui, E.R.; Yan, L.M. Influence of vegetation dynamics on soil organic carbon and its fractions in a coastal wetland. Ecosyst. Health Sustain. 2023, 9, 0016. [Google Scholar] [CrossRef]
  28. Qian, L.W.; Yan, J.F.; Hu, Y.; Gao, L.Y.; Wu, P.F.; Wang, L. Spatial distribution patterns of annual soil carbon accumulation and carbon storage in the Jiuduansha wetland of the Yangtze River estuary. Environ. Monit. Assess. 2019, 191, 750. [Google Scholar] [CrossRef]
  29. Zhang, S.; Lin, J.J.; Wang, P.; Zhu, B. The direct and legacy effects of drying-rewetting cycles on active and relatively resistant soil carbon decomposition. Land Degrad. Dev. 2023, 34, 2124–2135. [Google Scholar] [CrossRef]
  30. Pendall, E.; Osanai, Y.; Williams, A.L.; Hovenden, M.J. Soil carbon storage under simulated climate change is mediated by plant functional type. Glob. Change Biol. 2011, 17, 505–514. [Google Scholar] [CrossRef]
  31. Zhang, K.L.; Feng, R.R.; Han, J.N.; Zhang, Z.C.; Zhang, H.J.; Liu, K. Temporal and spatial differentiation characteristics of ecosystem service values based on the ecogeographical division of China: A case study in the Yellow River Basin, China. Environ. Sci. Pollut. R. 2022, 30, 8317–8337. [Google Scholar] [CrossRef]
  32. Liang, G.F.; Ding, S.Y. Impacts of human activity and natural change on the wetland landscape pattern along the Yellow River in Henan Province. J. Geogr. Sci. 2004, 14, 339–348. [Google Scholar] [CrossRef]
  33. Li, X.F.; Ding, C.X.; Bu, H.; Han, L.L.; Ma, P.; Su, D.R. Effects of submergence frequency on soil C:N:P ecological stoichiometry in riparian zones of Hulunbuir steppe. J. Soils Sed. 2020, 20, 1480–1493. [Google Scholar] [CrossRef]
  34. You, C.M.; Wu, F.Z.; Gan, Y.M.; Yang, W.Q.; Hu, Z.M.; Xu, Z.F.; Tan, B.; Liu, L.; Ni, X.Y. Grass and forbs respond differently to nitrogen addition: A meta-analysis of global grassland ecosystems. Sci. Rep.-UK 2017, 7, 1563. [Google Scholar] [CrossRef]
  35. Kalembasa, S.J.; Jenkinson, D.S. A comparative study of titrimetric and gravimetric methods for the determination of organic carbon in soil. J. Sci. Food Agric. 1973, 24, 1085–1090. [Google Scholar] [CrossRef]
  36. Cambardella, C.A.; Elliott, E.T. Particulate soil organic-matter changes across a grassland cultivation sequence. Soil Sci. Soc. Am. J. 1992, 56, 777–783. [Google Scholar] [CrossRef]
  37. Bouyoucos, G.J. Hydrometer method improved for making particle size analyses of soils. Agron. J. 1962, 54, 464–465. [Google Scholar] [CrossRef]
  38. Yin, S.; Bai, J.H.; Wang, W.; Zhang, G.L.; Jia, J.; Cui, B.S.; Liu, X.H. Effects of soil moisture on carbon mineralization in floodplain wetlands with different flooding frequencies. J. Hydrol. 2019, 574, 1074–1084. [Google Scholar] [CrossRef]
  39. Mavi, M.S.; Marschner, P.; Chittleborough, D.J.; Cox, J.W.; Sanderman, J. Salinity and sodicity affect soil respiration and dissolved organic matter dynamics differentially in soils varying in texture. Soil Biol. Biochem. 2012, 45, 8–13. [Google Scholar] [CrossRef]
  40. Wang, L.X.; Nie, X.D.; Li, J.Q.; Liu, Y.J.; Wang, H.; Li, Y.Z.; Li, Z.W. Erosion-induced recovery CO2 sink offset the horizontal soil organic carbon removal at the basin scale. Sci. China Earth Sci. 2024, 67, 2019–2033. [Google Scholar] [CrossRef]
  41. Van Oost, K.; Six, J. Reconciling the paradox of soil organic carbon erosion by water. Biogeosciences 2023, 20, 635–646. [Google Scholar] [CrossRef]
  42. Liu, S.; Huang, X.J.; Gan, L.; Zhang, Z.B.; Dong, Y.; Peng, X.H. Drying-wetting cycles affect soil structure by impacting soil aggregate transformations and soil organic carbon fractions. Catena 2024, 243, 108188. [Google Scholar] [CrossRef]
  43. Chai, Y.N.; Schachtman, D.P. Root exudates impact plant performance under abiotic stress. Trends Plant Sci. 2022, 27, 80–91. [Google Scholar] [CrossRef]
  44. Shabtai, I.A.; Hafner, B.D.; Schweizer, S.A.; Höschen, C.; Possinger, A.; Lehmann, J.; Bauerle, T. Root exudates simultaneously form and disrupt soil organo-mineral associations. Commun. Earth Environ. 2024, 5, 699. [Google Scholar] [CrossRef]
  45. Bi, X.Q.; Chu, H.; Fu, M.M.; Xu, D.D.; Zhao, W.Y.; Zhong, Y.J.; Wang, M.; Li, K.; Zhang, Y.n. Distribution characteristics of organic carbon (nitrogen) content, cation exchange capacity, and specific surface area in different soil particle sizes. Sci. Rep.-UK 2023, 13, 12242. [Google Scholar] [CrossRef] [PubMed]
  46. Qu, W.D.; Li, J.Y.; Han, G.X.; Wu, H.T.; Song, W.M.; Zhang, X.S. Effect of salinity on the decomposition of soil organic carbon in a tidal wetland. J. Soils Sed. 2019, 19, 609–617. [Google Scholar] [CrossRef]
  47. Six, J.; Conant, R.T.; Paul, E.A.; Paustian, K. Stabilization mechanisms of soil organic matter: Implications for C-saturation of soils. Plant Soil 2002, 241, 155–176. [Google Scholar] [CrossRef]
  48. Mayes, M.A.; Heal, K.R.; Brandt, C.C.; Phillips, J.R.; Jardine, P.M. Relation between soil order and sorption of dissolved organic carbon in temperate subsoils. Soil Sci. Soc. Am. J. 2012, 76, 1027–1037. [Google Scholar] [CrossRef]
  49. Hartley, I.P.; Hill, T.C.; Chadburn, S.E.; Hugelius, G. Temperature effects on carbon storage are controlled by soil stabilisation capacities. Nat. Commun. 2021, 12, 6713. [Google Scholar] [CrossRef]
  50. Tang, H.; Li, Q.; Bao, Q.; Tang, B.; Li, K.; Ding, Y.; Luo, X.J.; Zeng, Q.S.; Liu, S.Z.; Shu, X.Y.; et al. Alpine wetland litter decomposition under wet and dry conditions: A comparative study of native vs. standardized litter. Ecol. Indic. 2024, 161, 111982. [Google Scholar] [CrossRef]
  51. Rakhsh, F.; Golchin, A.; Al Agha, A.B.; Nelson, P.N. Mineralization of organic carbon and formation of microbial biomass in soil: Effects of clay content and composition and the mechanisms involved. Soil. Biol. Biochem. 2020, 151, 108036. [Google Scholar] [CrossRef]
  52. Boeddinghaus, R.S.; Nunan, N.; Berner, D.; Marhan, S.; Kandeler, E. Do general spatial relationships for microbial biomass and soil enzyme activities exist in temperate grassland soils? Soil Biol. Biochem. 2015, 88, 430–440. [Google Scholar] [CrossRef]
  53. Cotrufo, M.F.; Wallenstein, M.D.; Boot, C.M.; Denef, K.; Paul, E. The Microbial Efficiency-Matrix Stabilization (MEMS) framework integrates plant litter decomposition with soil organic matter stabilization: Do labile plant inputs form stable soil organic matter? Glob. Change Biol. 2013, 19, 988–995. [Google Scholar] [CrossRef]
  54. Jia, J.C.; Zhang, P.P.; Yang, X.F.; Zhang, X.C. Feldspathic sandstone addition and its impact on hydraulic properties of sandy soil. Can. J. Soil Sci. 2018, 98, 399–406. [Google Scholar] [CrossRef]
  55. Ren, W.T.; Zhang, D.S.; Zhou, Y.; Wang, H.; Xia, L.M.; Tan, C.S.; Guo, F.; Zhang, X.X.; Yang, R.L.; Yu, Y. Lignin’s complex role in lignocellulosic biomass Recalcitrance: A case study on bamboo. Chem. Eng. J. 2024, 490, 151422. [Google Scholar] [CrossRef]
  56. Fontaine, S.; Barot, S.; Barre, P.; Bdioui, N.; Mary, B.; Rumpel, C. Stability of organic carbon in deep soil layers controlled by fresh carbon supply. Nature 2007, 450, 277–280. [Google Scholar] [CrossRef]
  57. Bernal, B.; Mitsch, W.J. Comparing carbon sequestration in temperate freshwater wetland communities. Glob. Change Biol. 2012, 18, 1636–1647. [Google Scholar] [CrossRef]
  58. Zhang, Q.J.; Wang, Z.S.; Xia, S.X.; Zhang, G.S.; Li, S.X.; Yu, D.K.; Yu, X.B. Hydrologic-induced concentrated soil nutrients and improved plant growth increased carbon storage in a floodplain wetland over wet-dry alternating zones. Sci. Total Environ. 2022, 822, 153512. [Google Scholar] [CrossRef] [PubMed]
  59. Tavakkoli, E.; Rengasamy, P.; Smith, E.; McDonald, G.K. The effect of cation-anion interactions on soil pH and solubility of organic carbon. Eur. J. Soil Sci. 2015, 66, 1054–1062. [Google Scholar] [CrossRef]
  60. Chen, Z.; Li, H.B.; Zhang, W.H.; Wang, B.L. The roles of stomatal morphologies in transpiration and nutrient transportation between grasses and forbs in a temperate steppe. Ann. Bot. 2023, 132, 229–239. [Google Scholar] [CrossRef]
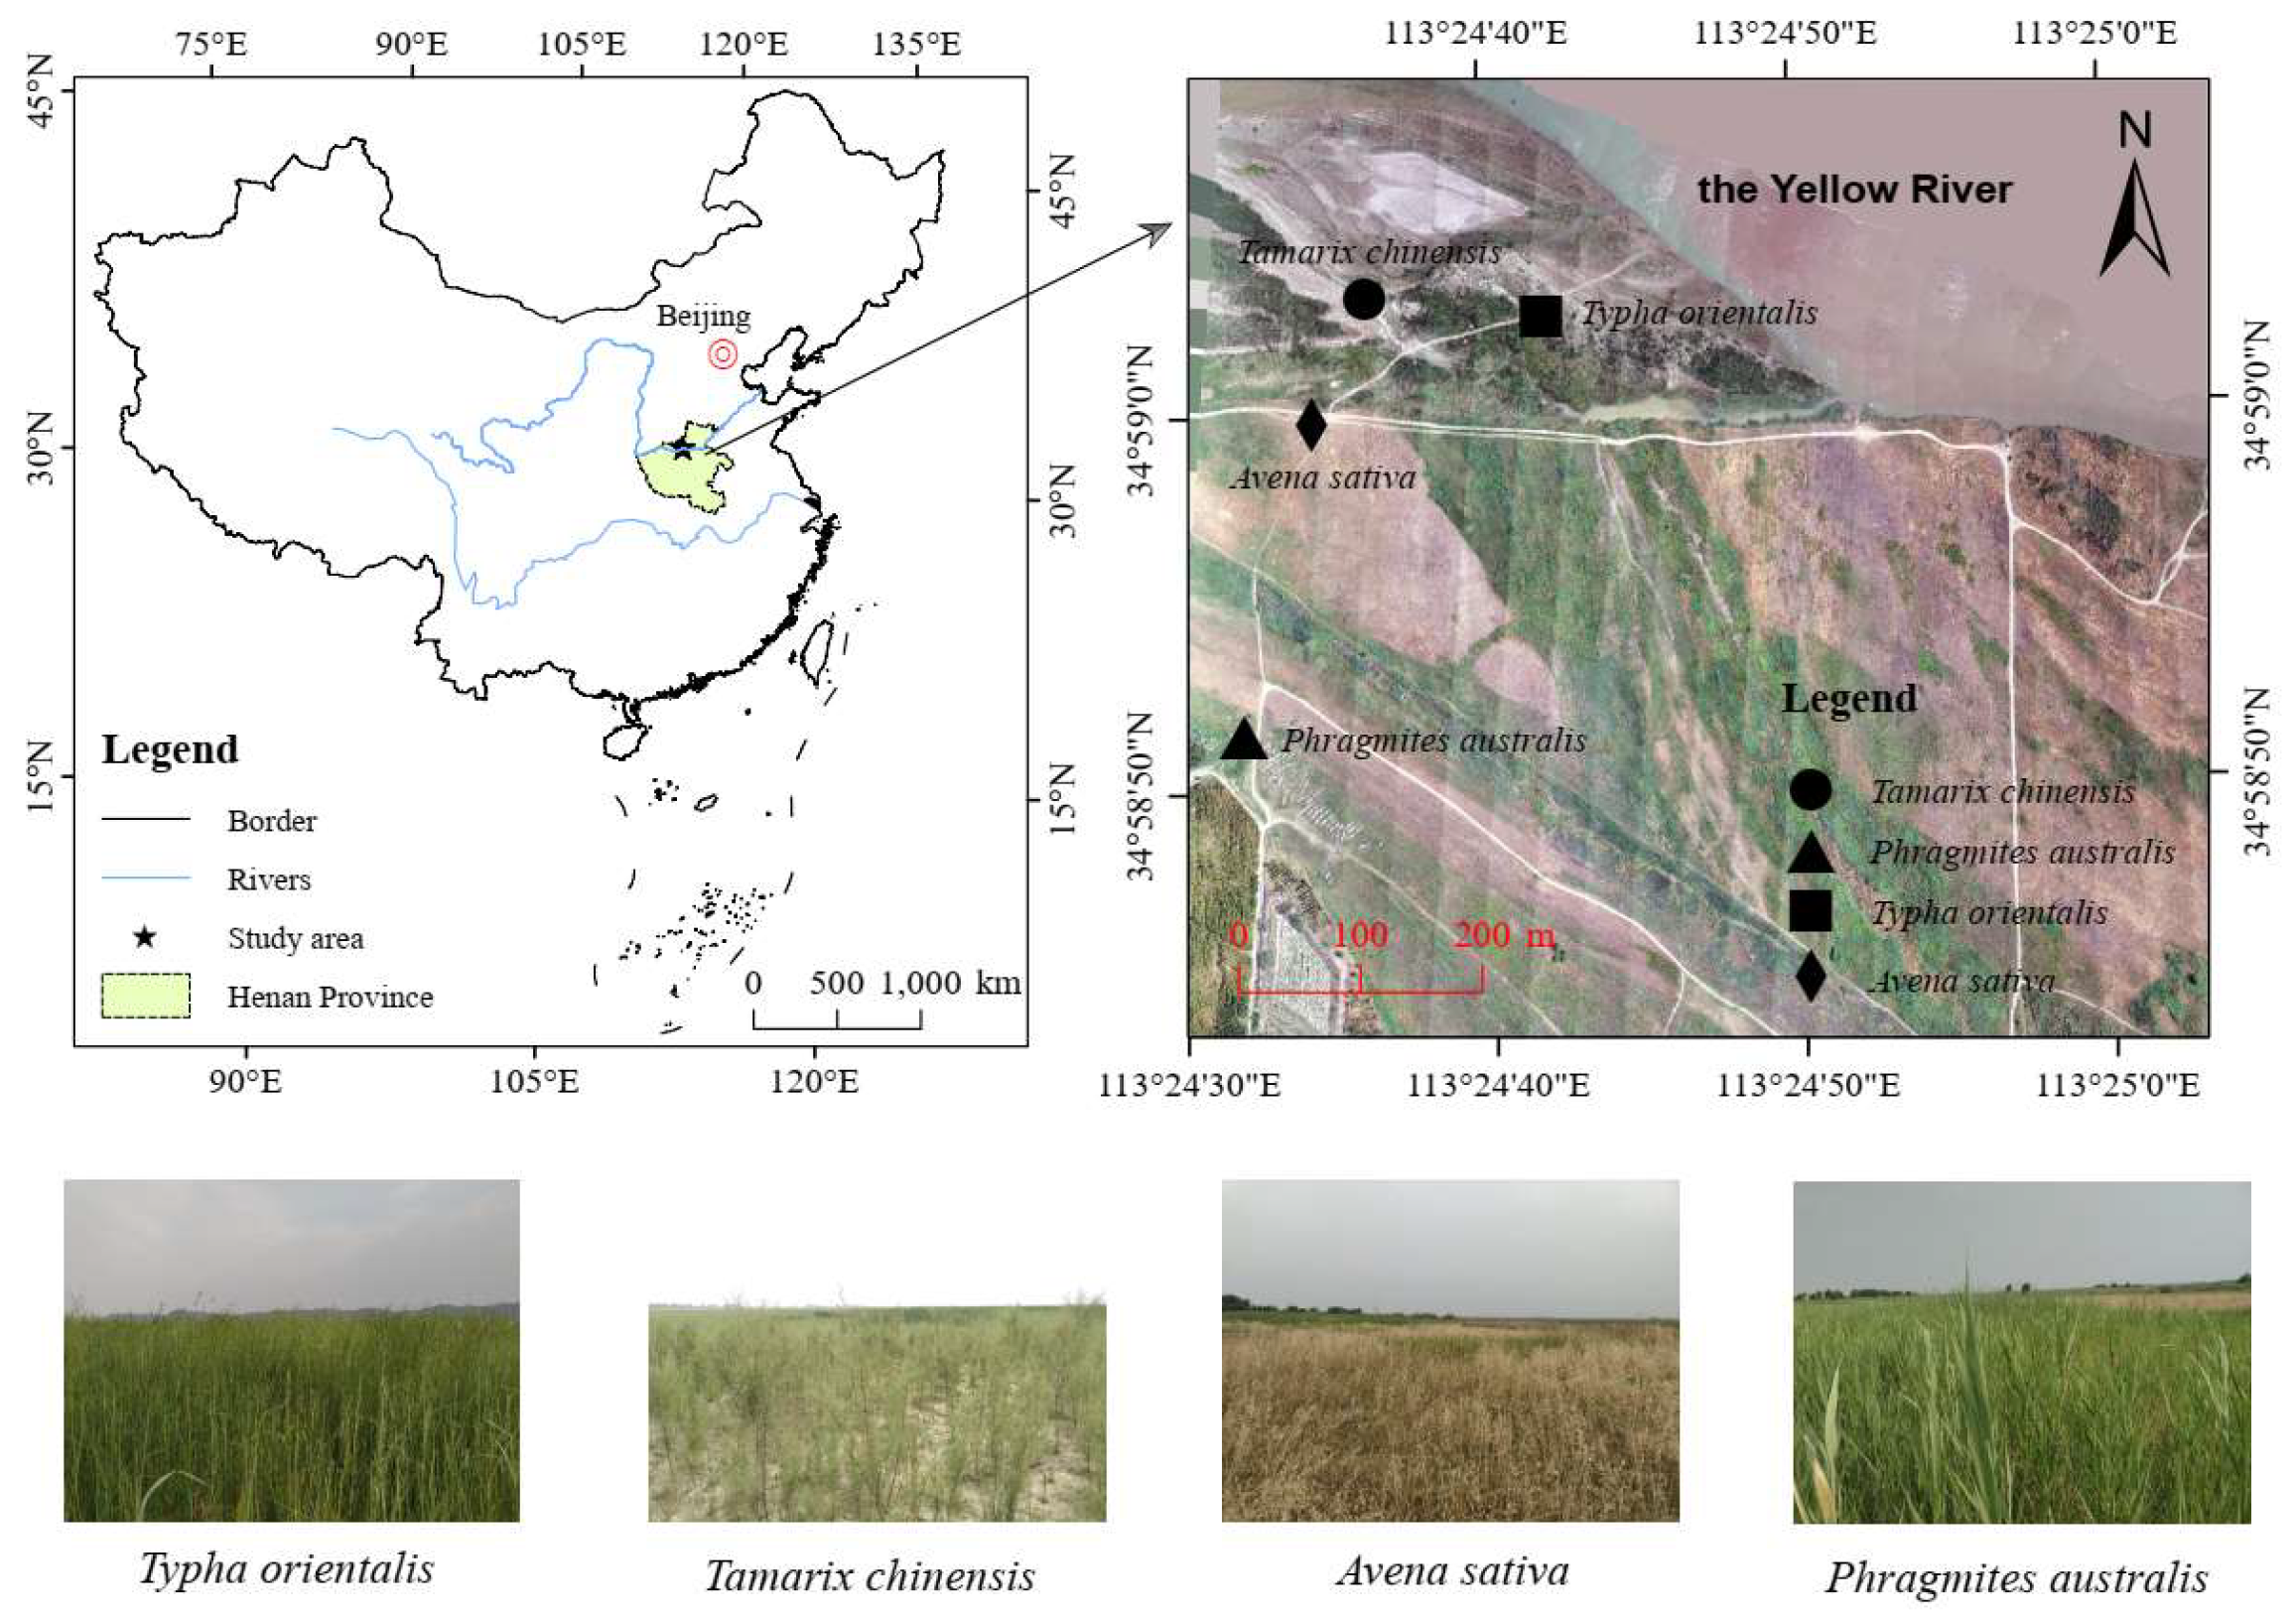
Figure 1. Distribution of sample sites in the Yellow River wetland and photos of the four vegetation types.
Land 14 01785 g001
Figure 2. Soil particulate organic C (POC) (a), readily oxidized organic C (ROC) (b), dissolved organic C (DOC) (c), and microbial biomass C (MBC) (d) in 0–10, 10–20, 20–40, and 40–60 cm soil layers of Typha orientalis (TO), Tamarix chinensis (TC), Avena sativa (AS), and Phragmites australis (PA) communities in the Yellow River wetland. Error bars represent the standard error of the mean. Different uppercase letters indicate significant variations among vegetation types within the same soil layer, and different lowercase letters indicate significant differences among soil layers within the same vegetation type (p < 0.05).
Land 14 01785 g002
Figure 3. Soil organic C (SOC) contents (a) and storage (b) in 0–10, 10–20, 20–40, and 40–60 cm soil layers of Typha orientalis (TO), Tamarix chinensis (TC), Avena sativa (AS), and Phragmites australis (PA) communities in the Yellow River wetland. Inset shows the SOC storage in 0–60 cm soil layer across all plant communities. Error bars represent the standard error of the mean. Different uppercase letters indicate significant variations among vegetation types within the same soil layer, and lowercase letters indicate significant differences among soil layers within the same vegetation type (p < 0.05).
Land 14 01785 g003
Figure 4. Soil labile organic C (LOC) proportion (a) and soil organic C (SOC) stability (b) in 0–10, 10–20, 20–40, and 40–60 cm soil layers of Typha orientalis (TO), Tamarix chinensis (TC), Avena sativa (AS), and Phragmites australis (PA) communities. Error bars represent the standard error of the mean. Different uppercase letters indicate significant variations among vegetation types within the same soil layer, and lowercase letters indicate significant differences among soil layers within the same vegetation type (p < 0.05).
Land 14 01785 g004
Figure 5. Correlation analysis of soil organic C (SOC) fractions, stability (CST), and storage (CS) with soil physicochemical factors of Typha orientalis, Tamarix chinensis, Avena sativa, and Phragmites australis communities in the Yellow River wetland. Soil physicochemical factors include water content (SWC), electrical conductivity (EC), bulk density (BD), clay content (Clay), silt content (Silt), sand content (Sand). Soil fractions include particulate organic C (POC), readily oxidized organic C (ROC), microbial biomass C (MBC), and dissolved organic C (DOC). Values in the figures represent correlation coefficients, with significance levels denoted as *, p < 0.05; **, p < 0.01; ***, p < 0.001.
Land 14 01785 g005
Figure 6. Redundancy analysis (RDA) of the relationships between soil organic C (SOC) fractions and soil physicochemical properties of Typha orientalis (a), Tamarix chinensis (b), Avena sativa (c), and Phragmites australis (d) communities. SOC fractions include particulate organic C (POC), readily oxidized organic C (ROC), dissolved organic C (DOC), and microbial biomass C (MBC). Soil physicochemical properties include electrical conductivity (EC), water content (SWC), and contents of clay (Clay), silt (Silt), and sand (Sand). The RDA ordination illustrates the contribution of each soil physicochemical factor to the variation in SOC fractions for each vegetation community.
Land 14 01785 g006
Table 1. Soil bulk density (BD), water content (SWC), pH, electrical conductivity (EC), and contents of clay, silt, and sand of Typha orientalis (TO), Tamarix chinensis (TC), Avena sativa (AS), and Phragmites australis (PA) communities in the Yellow River wetland (mean ± S.E.).
Vegetation TypesSoil Layer (cm)BD
(kg m−3)
SWC
(%)
pHEC
(μs cm−1)
Clay
(%)
Silt
(%)
Sand
(%)
TO0–101443.47 ± 13.70 Aa 29.84 ± 0.76 Aa9.25 ± 0.06 Aa158.97 ± 5.92 Aa3.38 ± 0.12 ABa72.54 ± 2.95 Aa24.08 ± 3.06 Aa
10–201407.10 ± 14.92 ABa27.67 ± 2.06 Aa9.29 ± 0.06 Aa104.30 ± 0.15 Ab2.07 ± 0.10 Ab58.97 ± 1.62 Aa38.96 ± 1.71 Aa
20–401466.53 ± 65.06 Aa29.90 ± 1.31 Aa9.14 ± 0.21 Aa110.00 ± 3.72 Ab2.13 ± 0.14 Ab62.43 ± 4.77 ABa35.44 ± 4.91 Aa
40–601519.63 ± 32.01 Aa32.16 ± 0.91 Aa9.01 ± 0.06 Aa127.33 ± 11.34 Ab3.02 ± 0.19 Aa68.03 ± 0.70 Aa28.95 ± 0.88 Aa
TC0–101279.90 ± 19.65 Ba1.32 ± 0.27 Ba9.21 ± 0.07 Aa121.87 ± 7.02 Aa1.81 ± 0.06 Ba42.72 ± 0.49 Ba55.47 ± 0.44 Ba
10–201340.03 ± 14.66 Bab2.09 ± 0.14 Ba9.27 ± 0.06 Aa98.10 ± 1.96 Aab1.87 ± 0.06 Aa46.64 ± 4.64 Ba51.49 ± 4.68 Ba
20–401514.30 ± 53.58 Abc2.08 ± 0.90 Ba9.33 ± 0.09 Aab98.50 ± 13.51 Aab2.51 ± 0.24 Ab48.06 ± 6.09 Ba49.44 ± 6.33 Aa
40–601428.37 ± 13.99 Ac4.98 ± 1.72 Ba9.62 ± 0.03 Bb77.23 ± 2.58 Ab0.75 ± 0.04 Bc8.50 ± 0.90 Bb90.75 ± 0.87 Bb
AS0–101477.00 ± 49.86 Aa 7.95 ± 0.51 Ca8.55 ± 0.01 Ba142.03 ± 11.78 Aa9.23 ± 1.19 Cab78.38 ± 4.68 Aa12.39 ± 5.73 Aa
10–201507.30 ± 33.65 Aa 10.03 ± 0.32 Cb8.58 ± 0.02 Ba234.53 ± 46.30 Bab10.52 ± 0.45 Ba82.52 ± 1.77 Ca6.96 ± 1.43 Ca
20–401410.10 ± 32.08 Aa7.29 ± 0.67 Ba8.92 ± 0.12 Ab194.20 ± 24.44 Aab6.28 ± 1.24 Bb79.60 ± 3.12 Aa14.12 ± 4.30 Ba
40–601455.87 ± 58.78 Aa2.06 ± 0.44 Bc9.61 ± 0.09 Bc78.40 ± 1.14 Ab0.51 ± 0.17 Bc11.59 ± 1.72 Bb87.90 ± 1.88 Bb
PA0–101383.10 ± 19.91 ABa17.58 ± 1.73 Da8.44 ± 0.03 Ba1030.00 ± 23.54 Ba4.78 ± 0.05 Aab73.13 ± 0.90 Aa22.10 ± 0.93 Aa
10–201440.63 ± 32.30 ABa 16.98 ± 3.10 Da8.57 ± 0.08 Bab728.33 ± 38.95 Cb5.02 ± 0.23 Cab74.96 ± 1.88 Ca20.02 ± 2.09 Da
20–401458.10 ± 33.89 Aa21.99 ± 4.46 Aa8.73 ± 0.08 Ab677.67 ± 86.58 Bb6.11 ± 0.57 Ba78.56 ± 0.33 Aa15.34 ± 0.87 Ba
40–601403.43 ± 15.94 Aa17.94 ± 2.60 Ca8.81 ± 0.05 Ab487.00 ± 88.39 Bb3.57 ± 0.79 Ab64.88 ± 10.11 Aa31.54 ± 10.88 Aa
Note: Different uppercase letters indicate significant variations among vegetation types within the same soil layer, and different lowercase letters indicate significant differences among soil layers within the same vegetation type (p < 0.05).
Table 2. Two-way ANOVA of main and interactive effects of vegetation types (V) and soil depths (D) on soil organic C (SOC), particulate organic C (POC), readily oxidized organic C (ROC), dissolved organic C (DOC), microbial biomass C (MBC) contents, SOC stability (CST), and SOC storage (CS) in the Yellow River wetland.
IndexVariablesSOCPOCROCDOCMBCCSTCS
FV62.4351.217.3621.0275.2244.5536.82
D46.7632.007.9118.5369.6232.979.96
V × D14.8312.293.797.6712.1929.439.01
p valueV<0.001<0.001<0.001<0.001<0.001<0.001<0.001
D<0.001<0.001<0.001<0.001<0.001<0.001<0.001
V × D<0.001<0.0010.002<0.001<0.001<0.001<0.001
Notes: Data represent F and p values.
Table 3. Results of multiple stepwise regressions for the relationships between soil organic C storage of the four vegetation types and soil physicochemical properties in the Yellow River wetland. Soil physicochemical properties include PH, electrical conductivity (EC), water content (SWC), and contents of clay (Clay), silt (Silt), and sand (Sand).
Vegetation Types Partial Correlation CoefficientsF Valuep ValueR2
SWCpHECClaySiltSand
Typha orientalisns−0.832ns0.786nsns6.708<0.050.675
Tamarix chinensis0.633nsns0.821nsns12.4000.0020.757
Avena sativansnsnsns0.870ns35.140<0.0010.756
Phragmites australisnsns0.777nsnsns17.8100.0020.604
Disclaimer/Publisher’s Note: The statements, opinions and data contained in all publications are solely those of the individual author(s) and contributor(s) and not of MDPI and/or the editor(s). MDPI and/or the editor(s) disclaim responsibility for any injury to people or property resulting from any ideas, methods, instructions or products referred to in the content.