Article

Exploring the Coordinated Development of Water-Land-Energy-Food System in the North China Plain: Spatio-Temporal Evolution and Influential Determinants

1
School of Land Science and Technology, China University of Geosciences, Beijing 100083, China
2
Key Laboratory of Land Consolidation and Rehabilitation, Ministry of Land and Resources, Beijing 100035, China
*
Author to whom correspondence should be addressed.
Land 2025, 14(9), 1782; https://doi.org/10.3390/land14091782
Submission received: 25 July 2025 / Revised: 24 August 2025 / Accepted: 30 August 2025 / Published: 2 September 2025
(This article belongs to the Special Issue Connections Between Land Use, Land Policies, and Food Systems)

Abstract

Water, land, energy, and food are fundamental resources for human survival and ecological stability, yet they face intensifying pressure from surging demands and spatial mismatches. Integrated governance of their interconnected nexus is pivotal to achieving sustainable development. In this study, we analyze the water-land-energy-food (WLEF) nexus synergies in China’s North China Plain, a vital grain base for China’s food security. We develop a city-level WLEF evaluation framework and employ a coupling coordination model to assess spatiotemporal patterns of the WLEF system from 2010 to 2022. Additionally, we diagnose critical internal and external influencing factors of the WLEF coupling system, using obstacle degree modeling and geographical detectors. The results indicate that during this period, the most critical internal factor was per capita water resource availability. The impact of the external factor—urbanization level—was characterized by fluctuation and a general upward trend, and by 2022, it had become the dominant influencing factor. Results indicated that the overall development of the WLEF system exhibited a fluctuating trend of initial increasing then decreasing during the study period, peaking at 0.426 in 2016. The coupling coordination level of the WLEF system averaged around 0.5, with the highest value (0.526) in 2016, indicating a marginally coordinated state. Regionally, a higher degree of coordination was presented in the southern regions of the North China Plain compared with the northern areas. Anhui province achieved the optimal coordination, while Beijing consistently ranked lowest. The primary difference lies in the abundant water resources in Anhui, in contrast to the water scarcity in Beijing. Internal diagnostic analysis identified per capita water availability as the primary constraint on system coordination. External factors, including urbanization rate, primary industry’s added value, regional population, and rural residents’ disposable income, exhibited growing influence on the system over time. This study provides a theoretical framework for WLEF system coordination and offers decision-making support for optimizing resource allocation and promoting sustainable development in comparable regions.

1. Introduction

The rapid advancement of urbanization and socio-economic development is expected to drive significant surges in worldwide requirements for water, energy, and food resources by mid-century, with respective projected increments of 80%, 55%, and 60% compared to current levels [1]. These three fundamental resources maintain critical importance for both societal welfare and environmental equilibrium [2], existing in a complex nexus of interdependencies. Agricultural systems and dietary practices are heavily dependent on both water and energy inputs, while the withdrawal and utilization of hydrological resources simultaneously consume considerable power supplies. Conversely, energy generation processes require substantial water resources and agricultural byproducts to operate effectively [3]. Furthermore, organic waste streams such as discarded food items, seed residues, and farming byproducts serve as viable feedstocks for bioenergy production [4,5]. Studies indicate that the water-energy-food nexus (WEF Nexus) framework has become a central focus for interdisciplinary research and policy development since it was first conceptualized in 2011 [6]. Scholars have emphasized that holistic approaches coordinating food production, water management, and energy systems can effectively address resource security issues while enhancing productivity and optimizing resource utilization [7]. Subsequent analyses have investigated how socio-economic development, spatial allocation of resources, and consumption behaviors shape the dynamics of interconnected water-energy-food systems across different regions [8].
By 2050, escalating global food demands and evolving lifestyles are projected to lead nearly 40% of humanity to inhabit nations grappling with water scarcity and diminished arable land [9], threatening societal sustainability through resource constraints. As a foundational natural asset, terrestrial resources critically enable the integration and synergy between hydrological, energy, and agricultural systems [10], forming an interdependent nexus of water-soil-energy-food relationships. This interconnected framework reveals that both agricultural and energy production remain heavily contingent upon hydrological availability and soil fertility, while concurrently, land resources facilitate watershed management, renewable energy installations, and crop cultivation [8]. Quantitative empirical evidence further illustrates the strong interdependence between land use and the water-energy-food nexus. For example, from 1980 to 2020, the irrigation water demand (IWR) for major food crops in China—such as wheat, rice, and corn—increased significantly as the planting area expanded. In 71% of the provinces, the expansion of the planting area was identified as the primary driver of IWR changes, with its impact surpassing that of climate variability and planting structure [11]. On a global scale, irrigation accounts for 15% of greenhouse gas emissions and energy consumption in agricultural activities. It is projected that continued expansion of irrigation areas could lead to a 28% increase in energy usage [12]. Furthermore, studies indicate that the large-scale cultivation of energy crops competes with food production for arable land; however, through irrigation optimization, the land area required per megajoule of energy can be reduced from 0.56 square meters to 0.32 square meters, thereby alleviating land use pressure [11].
To address the growing challenges in resource management, integrating land resources into an interconnected water-energy-food (WEF) network and establishing a comprehensive coordination mechanism is essential. This approach addresses systemic interdependencies by merging spatial planning with resource management strategies, thereby enhancing synergies across water allocation, energy production, and agricultural sustainability while mitigating cross-sectoral conflicts. The system can be divided into six subsystems: water-land, water-food, water-energy, energy-land, energy-food, and food-land. Changes in one subsystem trigger a “chain reaction,” affecting the stability of the entire system. In the water-land subsystem, land use directly influences water distribution. Urbanization, for example, expands construction land, increasing industrial and domestic water demand, reducing agricultural water use, and shrinking cultivated land, which indirectly impacts food production [13]. Simultaneously, water regulates soil moisture, affecting soil quality and creating a reverse effect on land. The water-food subsystem shows that water availability limits irrigation efficiency, impacting food production scale and stability. Excessive use of pesticides and fertilizers, however, causes non-point source pollution, which damages water quality and creates a feedback effect from food to water [8]. In the water-energy subsystem, energy extraction and processing require significant water resources, while water extraction, purification, and transport depend on energy [14]. Water scarcity reduces both energy extraction and water treatment efficiency. The energy-land subsystem highlights that energy extraction requires substantial land, and changes in land use affect energy consumption intensity and facility layout. In the energy-food subsystem, food production and transportation rely on energy, while biomass energy cultivation may compete with food crops for land, disrupting food supply stability [11]. Finally, the food-land subsystem shows that land provides essential resources for food production, and excessive cultivation can degrade land, reducing output. The specific interrelationships among these components are illustrated in Figure 1.
As a leading agricultural producer worldwide, China supports close to one-fifth of the global population while utilizing merely 7% of Earth’s cultivable land [15]. The 2025 Central Document No. 1 highlights the urgency of strengthening supply chain stability for essential agricultural products, with special focus on staple food crops. Accounting for roughly 24.5% of national grain production, the North China Plain (NCP) plays a vital role in China’s agricultural output [16]. However, this agricultural heartland faces substantial resource constraints. The area suffers from severe water scarcity, with annual per capita water resources barely reaching 300 cubic meters—equivalent to just 1% of China’s national per capita average [17]. Recent decades have witnessed intensified “warm drying” trends in the region. Between 1998 and 2020, precipitation levels dropped by 12.3%, coupled with annual groundwater overdraft reaching 2.45 × 10⁶ cubic meters, resulting in the formation of the planet’s most extensive groundwater depletion area. Changming et al. (2001, 2025) [17,18] identified groundwater overexploitation as a key factor exacerbating land sinking phenomena, with Xu et al. (2025a) [19] further confirming this environmental impact. The uneven allocation of aquatic and terrestrial resources has increasingly posed major constraints on agricultural productivity, as demonstrated through longitudinal studies by Liu et al. (2017, 2019) [20,21]. Huang et al. (2025) [17] emphasize that China’s North China Plain simultaneously functions as both the nation’s most densely populated region and its most dynamic economic hub. Accelerated metropolitan expansion has triggered dual consequences: the depletion of premium agricultural zones and substantial shrinkage of cultivable areas [22,23], with concurrent industrial advancement amplifying energy consumption requirements and land utilization conflicts. These compounding factors necessitate developing a comprehensive structure for the “water–land–energy–grain” (WLEF) nexus. Such systemic integration facilitates enhanced comprehension of cross-sectoral relationships, promotes synergistic resource management strategies, alleviates material deficits, and optimizes regulatory efficiency [24].
In recent years, cross-disciplinary methodologies and holistic assessment models have garnered increasing interest within studies on the water-energy-food nexus [25]. Diverse quantitative methods have been applied to improve comprehension and governance of resource interdependencies. For instance, metrics like the Gini coefficient and resource disparity index have been implemented to analyze water allocation inequalities and assess sectoral competition for scarce hydrological supplies between agricultural and energy systems [26]. The scenario-driven fuzzy interval optimization technique (STFIP) has been applied to streamline agricultural water allocation, energy distribution, crop yield optimization, and land use planning [1]. Within animal production systems, studies have explored the integration of renewable energy systems and eco-efficient strategies to maintain sectoral viability under WEF constraints [27].
Recent scholarly investigations increasingly emphasize the interconnected relationships between water, energy, and food systems. Certain analyses employ system dynamics (SD) frameworks integrated with WEF nexus methodologies to model complex interactions and assess policy effectiveness across diverse scenarios [28]. Parallel research employs resilience theory to investigate WEF system reactions to climatic fluctuations and socioeconomic challenges, highlighting critical elements affecting adaptive capacities [29]. Through multi-regional input-output (MRIO) analysis, scholars have investigated the role of international supply networks in shaping resource utilization patterns across East Asian economies and their ecological consequences [30]. Additional investigations quantify hydrological pressures through stress-state metrics, explore the South-to-North Water Diversion Project’s implications for watershed management [31], and implement Bayesian network (BN) methodologies to evaluate resource allocation vulnerabilities under various scenarios [32]. In recent years, the Coupling Coordination Model (CCM) has emerged as a key analytical tool for examining the interactions within resource systems. This model quantifies both the degree of coupling and the coordination status among different subsystems, thereby revealing the interrelationships and interdependencies within the system. In complex, multi-dimensional contexts, CCM enables the assessment of coordination levels and the formulation of optimization strategies across resource domains. For example, one study employed comprehensive evaluation indices along with the coupling coordination degree to measure the coupling and coordination of the water-energy-food (WEF Nexus) system across Chinese provinces and explored the mutual influences among water, energy, and food subsystems in different regional settings [33].
As the importance of land resources in correlation studies becomes increasingly evident, recent research has placed greater emphasis on integrating land-related components into system analysis frameworks to advance comprehensive resource management approaches. For instance, scholars apply the Gini coefficient and the water-land matching coefficient to investigate the interconnections among water, land, and food (WLF) and evaluate the compatibility of water, land, and food production structures [34]. Alternatively, the coupling coordination degree model is utilized to examine the interactions within the water-land-ecology (WLE) system and identify key internal factors that constrain coordination efficiency [35]. Moreover, the EEMRIO model has been employed to trace the flows of agricultural virtual water, land, and carbon emissions and to assess dynamic changes under various scenarios [30]. In addition, land is regarded as a crucial factor in optimizing the water-energy-food nexus and has garnered significant scholarly attention. Researchers have developed computational models based on mixed integer nonlinear programming (MINLP) to facilitate strategic land resource allocation under multiple resource constraints [36].
Although existing research has achieved notable progress in systematic analysis and development, several limitations remain. First, at the theoretical level, most studies focus on the triadic relationships among water-energy-food, water-land-food, and water-land-ecology systems, with insufficient in-depth investigation into the coordinated relationship between land and the water-energy-food (WEF) system. Moreover, land is often treated as an external influencing factor or a response indicator in WEF-related research, rather than being integrated as an interactive component, thereby neglecting the mutual influences between land and the WEF system. Second, at the methodological level, current approaches primarily emphasize the analysis of system evolution and its temporal and spatial patterns. However, there is still limited exploration of the underlying causes behind these spatial and temporal differences. For example, although system dynamics models can simulate the dynamic evolution of complex systems, they face challenges in effectively capturing the coupling and coordination relationships within such systems. Additionally, their high dependence on parameter settings limits the ability to clearly identify the specific driving forces behind system coupling and coordination. Some studies rely solely on the degree-of-obstruction model, which, while capable of identifying internal influencing factors, fails to account for external drivers. Furthermore, most existing studies are conducted at the national, river basin, or provincial scale. Research focusing on resource coupling and coordination at the urban level remains relatively limited, which restricts the applicability of current findings in guiding local-level resource allocation decisions.
To address these limitations, this study selects the North China Plain as the research area and expands the WEF framework by incorporating land as a core element, forming a “Water-Land-Energy-Food (WLEF)” assessment system. This approach enriches the theoretical perspective of resource coupling and coordination research. First, by comprehensively considering the interrelationships among key indicators, a WLEF indicator system encompassing water resources, land, energy, and food subsystems is established. Subsequently, the coupling coordination degree model is applied to evaluate the comprehensive development level and coupling coordination status of the WLEF system in the study area from both temporal and spatial perspectives between 2010 and 2022. Additionally, the obstacle degree model and the geographical detector model are employed to identify the key internal and external factors influencing the system’s coupling coordination development. These methods offer strong capabilities in quantitative analysis and dynamic evaluation, effectively addressing the limitations of traditional approaches in explaining system mechanisms. Finally, by focusing on the urban scale, this study provides targeted decision-making support for resolving resource conflicts, optimizing resource allocation, and promoting sustainable development in water-scarce grain-producing regions.

2. Materials and Methods

2.1. Study Area

The North China Plain (NCP) spans latitudes from 32° N to 40° N and longitudes from 114° E to 121° E. Characterized by low-lying terrain, abundant sunlight, and fertile soil, it covers a total area of approximately 300,000 square miles, accounting for about 8.1% of China’s total land area (Figure 2) [37]. Administratively, the region includes Beijing, Tianjin, and the provinces of Hebei, Henan, Shandong, Anhui, and Jiangsu. The climate is warm temperate, with annual precipitation ranging from 500 to 1000 mm and an average temperature between 14 and 15 °C. The climatic pattern transitions from semi-arid in the north to semi-humid in the south, with more than 70% of annual rainfall occurring during the summer months [38]. The region serves as a critical center for China’s manufacturing and urban development and simultaneously plays a vital role in agricultural production, particularly in grain cultivation and animal husbandry. As one of the nation’s primary grain-producing regions, it encompasses 20.4% of China’s total arable land and contributes approximately 24.5% to the country’s overall grain output [16,39]. The primary crops grown in the region include corn, wheat, and rice [39]. However, water resources in the NCP are limited, with an annual average of only 23.27 billion cubic meters, representing just 7.44% of the nation’s total water resources (data from 2000 to 2020) [40]. As a result, groundwater extraction in the region is extremely high, making it a globally recognized area of groundwater depletion [41]. Moreover, energy consumption for irrigation-related groundwater pumping has increased significantly, reaching 2.9 times the level recorded in 1986, positioning the NCP among the regions with the highest energy consumption for groundwater irrigation worldwide [42].
In recent years, rapid urbanization has intensified the imbalance between resource supply and demand, reducing resource allocation efficiency and undermining the region’s capacity for sustainable socio-economic development. To ensure long-term sustainability, it is essential to implement strategic resource management, improve the efficiency of resource allocation and utilization, and conduct in-depth research on the interconnections and synergies within the water-land-energy-food (WLEF) system. Identifying key internal and external drivers of system coordination and formulating cross-sectoral resource governance strategies are critical steps toward maintaining stable and sustainable socio-economic development.

2.2. Data Sources

This study gathered multi-source data from 75 cities in the NCP spanning 2010 to 2022 to develop the WLEF evaluation index system. Water-related indicators, such as industrial and agricultural water use, total water resources, and total water consumption, were obtained from the “Water Resources Bulletins” of each province and municipality. Energy-related indicators, including industrial sulfur dioxide emissions, energy consumption, total societal electricity consumption, agricultural machinery power, and industrial solid waste utilization rates, were sourced from the “Statistical Yearbook,” “Energy Statistical Yearbook,” and “China Urban Statistical Yearbook” of the respective provinces and cities. Land-related data, like the total administrative area, year-end cultivated land area, total construction land area, and industrial wastewater discharge volume, were extracted from the “Statistical Yearbook” and “China Urban Statistical Yearbook.” Food-related indicators, such as grain output, sown area, pesticide and fertilizer application rates, effective irrigation area, and the Engel’s coefficient, were also drawn from the “Statistical Yearbook” of each province and municipality. External factors like rural population, total resident population, GDP, and the value added by the primary industry were sourced from the relevant statistical yearbooks. Data gaps in specific years were addressed by applying linear interpolation techniques to maintain dataset integrity.

2.3. Methods

2.3.1. Development of the Indicator System

This study focuses on the urban agglomeration in the North China Plain (NCP), which has been selected as the main research area. Given the interconnected nature of the water-land-energy-food (WLEF) system in the region, and guided by the principles of comprehensiveness, representativeness, scientific accuracy, and practical feasibility, a multi-dimensional set of evaluation indicators has been developed. These indicators are based on previous research [10,43,44] and have been tailored to reflect the unique characteristics of each subsystem. The indicators for the water resources subsystem were selected based on aspects such as total regional water resources, water use structure, and overall water use status [10,44]. For the energy subsystem, indicators cover dimensions including energy consumption, supply status, and long-term sustainability [10,44]. The land resource subsystem incorporates indicators related to land carrying capacity, human livelihoods, and socio-economic conditions [10]. The food subsystem includes indicators that address production supply, food security status, production efficiency and input, and consumer demand [10,44]. Ultimately, a total of 20 evaluation indicators were identified, with five indicators corresponding to each subsystem, as detailed in Table 1. The sources of these indicators are listed in Table S1. The symbol “+” denotes a favorable (positive) indicator, while “−” indicates an unfavorable (negative) indicator.

2.3.2. The Framework of the WLEF Indicator System

(1)
Normalization of Original Data
To improve the precision and reliability of the assessment results, it is essential to normalize the raw data. This step eliminates inconsistencies in measurement units, scales, and directional biases (positive or negative) across indicators. Based on their overall impact, the indicators are categorized as either positive or negative. The normalization technique follows established research methods and is defined as follows:
Positive indicator:
Y = X X min X max X min
Negative indicator:
Y = X max X X max X min
Here, Y represents the standardized value of the WLEF assessment index. X denotes the original data value. Xmax and Xmin represent the maximum and minimum values of each index, respectively.
(2)
Following this, the entropy weight for indicator j is calculated using the steps described in Equations (3)–(6).
There are several weight calculation methods available, including the Analytic Hierarchy Process (AHP), the Entropy Method (EM), and the Deviation Maximization Method [45]. Among these, the Entropy Method determines indicator weights by measuring their dispersion, thereby objectively reflecting the information content of the data and eliminating biases associated with subjective weighting approaches. Entropy, defined as a “measure of uncertainty,” indicates that a lower entropy value corresponds to greater variability in the indicator, more informative content, and a higher assigned weight [46]. Compared to subjective methods such as AHP, the Entropy Method is computationally more efficient, relying solely on objective data without incorporating personal preferences [45]. It is particularly suitable for scenarios involving complex datasets or limited expert input, where its adaptability and objectivity provide significant advantages. The corresponding calculation equation is as follows:
P ij = Z ij i = 1 n Z i j
E j = 1 I n n i = 1 n P i j I n P i j
G j = 1 E j
W j = G j j = 1 m G j
(3)
Following this, the overall evaluation index for each subsystem is computed through the multi-index weighted aggregation approach. The detailed mathematical expressions are provided below (Equations (7)–(10)):
W ( x ) = = 1 5 w X t
L ( y ) = β = 1 5 w β Y β t
E ( z ) = γ = 1 5 w γ Z γ t
F ( p ) = η = 1 5 w η P η t
Among them, W(x), L(y), E(z), and F(p) represent the comprehensive evaluation indicators for the water, land, energy, and food subsystems, respectively. α, β, γ, and δ denote the number of indicators in each corresponding subsystem. X α t , Y β t , Z γ t , and P η t are the standardized values of the respective indicators in the water, land, energy, and food subsystems. w α , w β , w γ , and w η represent the weights of the respective indicators in the water, land, energy, and food subsystems in the t-th year.
(4)
Lastly, the integrated assessment index for the water-land-energy-food (WLEF) nexus is determined, as shown in Equation (11).
T = a 1 W ( x ) + a 2 L ( y ) + a 3 E ( z ) + a 4 F ( p )
T represents the comprehensive evaluation index of the system, where a1, a2, a3, and a4 denote the respective weights of the water, land, energy, and food subsystems. Numerous studies have demonstrated that the water, energy, and food subsystems are interrelated, and this research assumes that they carry equal importance [47]. Meanwhile, the land subsystem provides spatial and resource support for economic, social, and human activities and serves as a foundational component for the other subsystems [48]. However, compared to the water, energy, and food subsystems, the land subsystem exerts a more indirect and long-term influence on the coordinated development of the socio-economy. Therefore, in the analysis of the water-energy-food-land system, the weights of the water, energy, and food subsystems are set as a1 = a2 = a3 = 0.3, and the weight of the land subsystem is set as a4 = 0.1 [8].

2.3.3. Coupling Coordination Model

The Coupling Coordination Degree Model (CCDM) is utilized to examine the interrelationships, interactions, and synergistic development among subsystems within complex systems [49]. This model provides a comprehensive assessment of subsystem behavior and performance by considering their interdependencies and feedback loops. Through the analysis of coupling relationships and coordination patterns, the model uncovers the underlying dynamics of the system, thereby enhancing its overall functionality and capacity to withstand external risks [50]. In this study, coupling degree measures the intensity of interconnection and interaction among components or subsystems, while coordination degree assesses the extent of synchronized and collaborative development among them [10]. The mathematical formulations for calculating coupling degree and coordination degree are given in Equations (12) and (13), respectively.
C = 4 W ( x ) × L ( y ) × E ( z ) × F ( p ) 4 W ( x ) + L ( y ) + E ( z ) + F ( p )
D = C × T
In this context, C represents the coupling degree, which varies between 0 and 1. A value of C = 0 indicates complete disconnection between the subsystems, while C = 1 represents a high level of interconnection among them [51]. Based on the classification criteria outlined in previous studies [49,52], this study classifies both the coupling degree and the coupling coordination degree into specific levels (see Tables S2 and S3).

2.3.4. Obstacle Degree Model

The obstacle degree model serves as a widely utilized analytical tool for identifying critical factors that impede the development of a system [53]. In this research, the model is employed to uncover the primary internal barriers that limit the coupling coordination level of the water-land-energy-food (WLEF) system, with the goal of revealing potential strategies for system enhancement. The model’s analysis is based on three key indicators: factor contribution degree, index deviation degree, and obstacle degree. The mathematical expressions for these calculations are provided in Equation (14).
O ij = R ij . ω i j j = 1 n R i j . ω i j
In this context, Oij denotes the obstacle degree (OD) of the j-th evaluation indicator in the i-th year with respect to the WLEF system. A higher OD value signifies a stronger constraint imposed by that particular indicator on the coordinated and balanced development of the WLEF coupling system. The factor contribution degree, Rij, reflects how much an individual factor influences the overall goal, typically represented by the weight assigned to the corresponding indicator. The deviation degree of the indicator measures the difference between the actual value of the j-th indicator in the i-th year and its ideal target. The calculation formula is as follows, where Hij represents the normalized value of a specific indicator, and n represents the overall count of indicators [44,53].

2.3.5. Geographic Detector

The Geodetector is a novel statistical method developed to examine spatial variability, reveal the effects of both natural and human-made factors in a region, and identify the key internal mechanisms shaping these patterns [54]. The model includes four modules: factor detection, interaction detection, risk detection, and ecological detection. In this study, five external factors are selected as independent variables, with the coupling coordination degree of the WLEF system as the dependent variable. Using factor and interaction detection, the model identifies the key drivers and their interactions affecting the WLEF system’s coordination in the NCP.
Factor Detection
The factor detector computation utilizes the q-statistic derived from the geographical detector, with its mathematical expression provided in Equation (15) as follows:
q = 1 h = 1 L N h σ h 2 N σ 2
The parameter q reflects the strength of spatial heterogeneity in explaining the variation of the dependent variable across geographical space, with q ranging between 0 and 1. As the q value approaches 1, the greater the influence of the corresponding factor on the coupling coordination level of the system [44]. In this context, N refers to the total number of spatial units in the study area (specifically, cities in this research); Nh represents the number of samples within sub-layer h; and σ h 2 and σ h 2 denote the overall variance and the variance within sub-layer h, respectively [55].
Interaction Detection
The interaction detector analyzes the combined effects of two factors (X1 and X2), determining whether their interaction strengthens or weakens their influence on the dependent variable Y, or if their effects on Y are independent [56]. The q values for X1 and X2 are first computed using the factor detector in Equation (15), resulting in q(X1) and q(X2), respectively. By intersecting the stratifications of X1 and X2 (represented as X1 ∩ X2), new spatial stratifications and regional groupings are formed, enabling the calculation of the interaction q value, q(X1 ∩ X2). Comparing this interaction q value with the individual q values allows for the classification of five types of interactive relationships between the factors [55], with detailed classification criteria provided in Table S4. Based on the study area’s characteristics, this research chose five socio-economic factors as independent variables (X) and used the Geodetector to assess their impact on the WLEF system’s coupling coordination level (Y) (see Table 2 for details).

3. Results

3.1. Spatial and Temporal Variation Characteristics of Coordinated Development of Water-Land-Energy-Food Nexus

3.1.1. Spatio-Temporal Evolution Analysis of the Integrated Development Level of the Water-Land-Energy-Food Nexus

Between 2010 and 2022, the overall development level of the water-land-energy-food (WLEF) system in the NCP remained largely stable, oscillating around the value of 0.4. During this period, a gradual upward trend was observed from 2010 to 2016, with the peak value reaching 0.426 in 2016. Following this, a steady decline occurred, bringing the level down to 0.4 by 2019, followed by a slight recovery to 0.406 in 2022. Among the individual subsystems, the water system consistently showed the lowest average comprehensive development level at approximately 0.145, with notable year-to-year variations reflecting a high degree of instability. It decreased from 0.154 in 2010 to 0.128 in 2013, then sharply increased to 0.185 in 2016. However, it dropped to 0.122 in 2019 and rose slightly to 0.135 in 2022. The peak of the water system coincided to some extent with the peak of the overall comprehensive development level, suggesting its influence on the overall system performance. The land subsystem steadily increased, from 0.2 in 2010 to 0.214 in 2022. Among all the subsystems, the energy system achieved the highest average comprehensive development level, at approximately 0.79. Despite experiencing some annual variations, its overall trend revealed a minor decrease from 0.798 in 2010 to 0.792 in 2013, followed by a notable rise to 0.81 by 2016. Following this, the energy system gradually decreased to 0.773 by 2022. This pattern of fluctuation was comparable to that observed in the water system, suggesting a strong interconnection between the two. The food subsystem maintained an average development level of approximately 0.364, with significant year-to-year variability. It rose from 0.342 in 2010 to 0.384 in 2013, then dropped to 0.356 in 2016, before steadily increasing to 0.376 in 2022. The food system’s fluctuation trend was largely opposite to that of the water and energy subsystems, indicating both cooperative and conflicting dynamics among the system’s components.
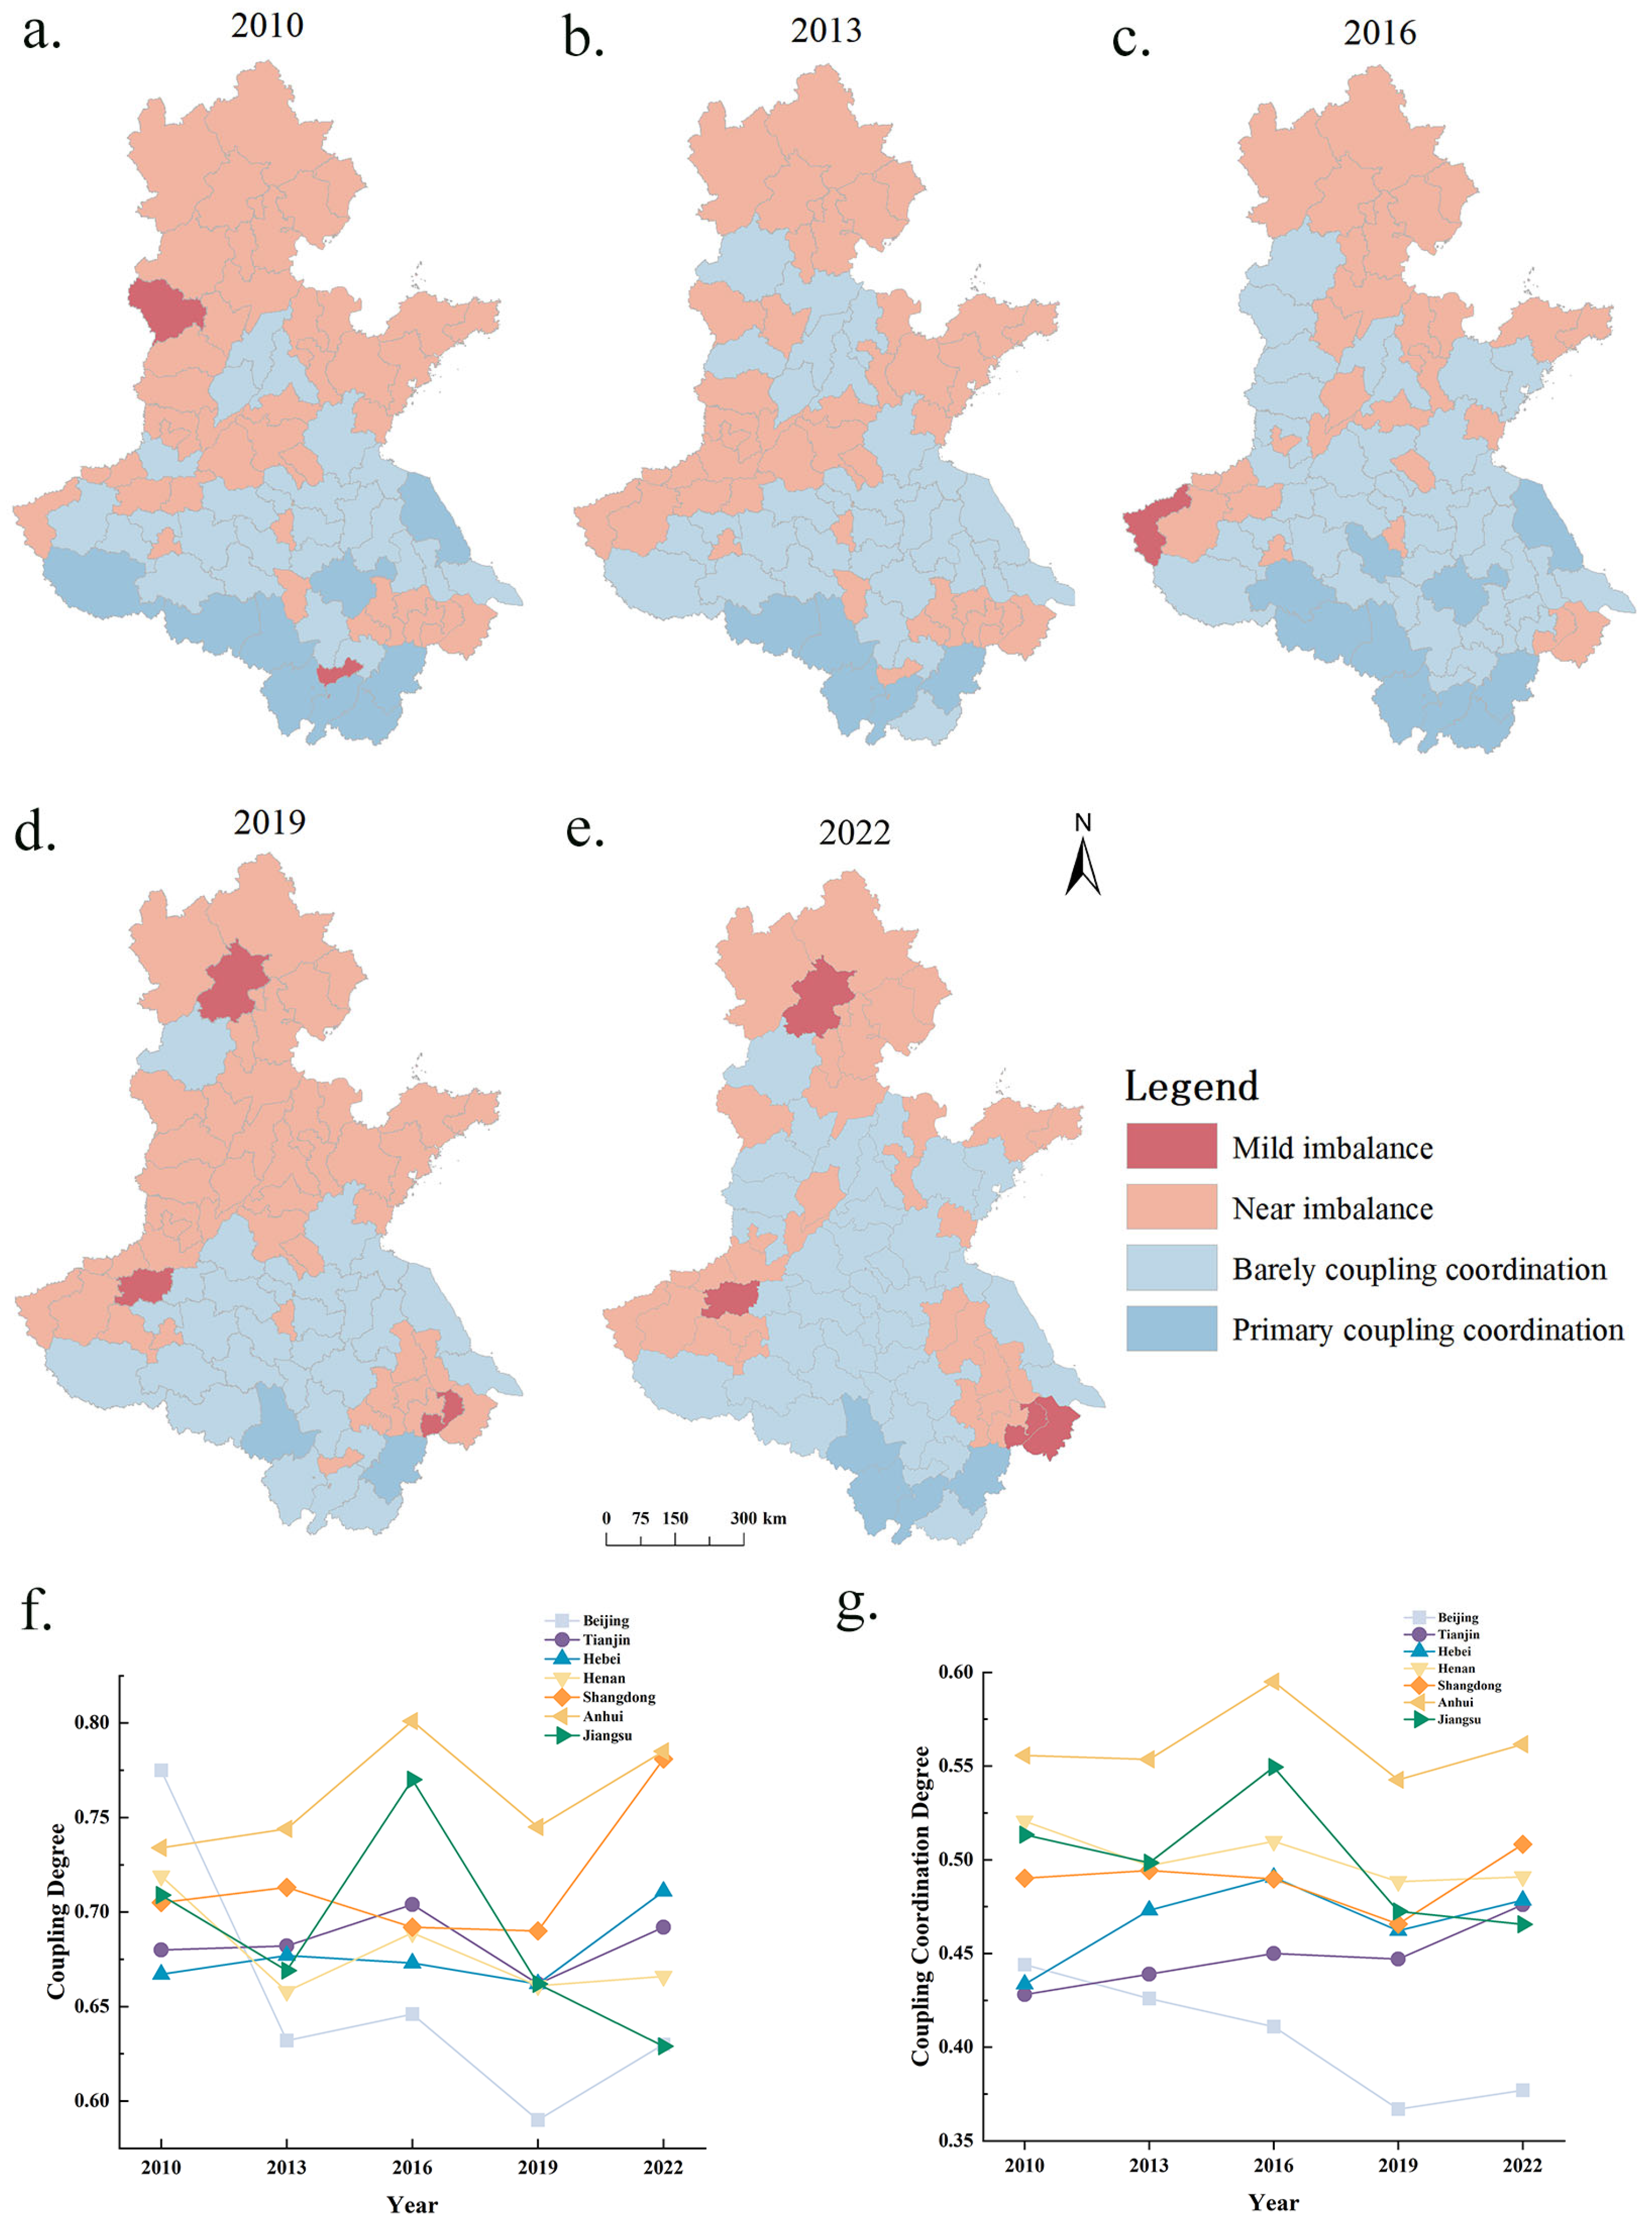
From a regional standpoint, as illustrated in Figure 3b, Anhui Province demonstrates the highest comprehensive development level of the water-land-energy-food (WLEF) system among the seven provinces and municipalities in the NCP, whereas Beijing records the lowest level. Among these regions, Anhui, Jiangsu, and Hebei show similar developmental trends in the WLEF system from 2010 to 2022. All three regions—Anhui, Jiangsu, and Hebei—showed a rising trajectory between 2010 and 2016, followed by a downturn, and then a gradual recovery from 2019 to 2022. Similarly, the WLEF systems in Beijing, Henan, and Shandong displayed comparable dynamics, characterized by a rapid increase from 2010 to 2013, a steady decline from 2013 to 2019, and a slow upward trend from 2019 to 2022. Tianjin experienced a significant increase in its comprehensive development level from 2010 to 2013 and has since maintained a level around 0.35, with a slight upward trend year by year. From the regional subsystem perspective, as shown in Figure 3c, the circles in the box plots represent the average values of prefecture-level cities in each province or centrally governed municipality, with horizontal lines indicating the median values. Regarding water resource development, Anhui Province recorded the highest average level between 2010 and 2022, while Hebei Province had the lowest. Notably, Anhui’s level of water resource development dropped considerably from 2016 to 2022, and the variations among cities within the province have begun to decrease. Regarding land development, Hebei Province had the highest average level from 2010 to 2022, while Tianjin had the lowest in 2010. From 2016 to 2022, Beijing had the lowest land development level. In energy development, Anhui Province ranked highest from 2010 to 2022, while Tianjin had the lowest in 2016. In both 2010 and 2022, Hebei Province had the lowest energy development level. As for grain development, Hebei Province had the highest average level from 2010 to 2016, while Henan Province became the leading region in 2022. As these two provinces are key grain-producing regions, their total cultivated land area in 2022 represented around 45% of the overall cultivated land in the NCP, highlighting a solid agricultural base. In contrast, Beijing maintained the lowest level of grain development throughout the entire period from 2010 to 2022.

3.1.2. Examination of the Spatiotemporal Development of the Coupling Coordination Degree Within the Water-Land-Energy-Food System

During the period spanning 2010–2020, the integrated interaction level among water, land, energy, and food resources within the North China Plain maintained an annual average of approximately 0.7, reflecting that the system underwent an adaptive adjustment phase. This numerical pattern further reveals substantial interconnectedness among these essential resource elements. As demonstrated in Figure 4f, spatial variations showed Anhui Province achieving the peak coupling measurement, contrasting with Beijing’s minimal recorded value. The coordination equilibrium within the WLEF framework exhibited oscillatory patterns near the 0.5 threshold from 2010 through 2022, indicating the system remained near a state of imbalance. As shown in Figure 4g, the coupling coordination level stood at 0.505 in 2010, slightly declined to 0.503 in 2013, then rose to 0.526 in 2016, before dropping to 0.486 in 2019. By 2022, it had gradually recovered to 0.502. Regionally, the coupling coordination trends in Anhui, Jiangsu, and Henan provinces were broadly similar, all following a “W”-shaped trajectory—marked by alternating periods of increase and decrease. Each of these provinces reached its peak coupling coordination level around 2016.In contrast, Shandong, Hebei, and Tianjin showed a similar “N”-shaped pattern, with an initial rise followed by a decline. These regions achieved their highest coupling coordination levels in 2022, reflecting an overall fluctuating but upward trend. Beijing experienced a continuous decline in its coupling coordination level, dropping from 0.444 in 2010 to 0.376 in 2019, with only a minor rebound to 0.377 in 2022. Overall, its system remained between the thresholds of near imbalance and mild imbalance. Among all the WLEF systems in the NCP, Anhui Province demonstrated the highest degree of coupling coordination, while Beijing recorded the lowest.
A closer look at the municipal level, shown in Figure 4a–e, illustrates the spatiotemporal changes in the coupling coordination degree of the WLEF system across NCP cities from 2010 to 2022. In 2010, the majority of Beijing, Tianjin, Hebei, and Shandong were categorized as being in a near-imbalance state, whereas most areas in Henan, Anhui, and Jiangsu were at the barely coordinated stage. A few southern regions had reached the initial stage of coordinated development. Only two cities—Shijiazhuang and Tongling—were identified as being in the mild imbalance stage. Between 2010 and 2016, the number of cities experiencing near imbalance gradually declined, with many transitioning into the barely coordinated stage, especially in northern Hebei and Shandong. By 2013, no cities remained in the mild imbalance stage, and by 2016, only Sanmenxia was still classified under that category. In 2019, a noticeable decline in the overall coupling coordination level across the NCP became apparent. Most areas of Hebei (excluding Baoding), Shandong, and Henan had reverted to a near-imbalance state. Meanwhile, Beijing had shifted from near imbalance to mild imbalance. Additionally, Zhengzhou and Wuxi also entered the mild imbalance phase. By 2022, there was an overall improvement in the coupling coordination level. Many areas in northern Hebei and the entirety of Shandong Province transitioned from near imbalance to the barely coordinated stage. In addition to the three cities already in the mild imbalance state in 2019, Suzhou also joined this category. Throughout the entire period from 2010 to 2022, the southern parts of Henan and Anhui provinces consistently maintained relatively high coupling coordination levels. Notably, Xuancheng and Lu’an remained in the early stage of coordinated development throughout the study period.

3.2. Key Drivers Affecting the Coupling Coordination Degree of the WLEF System

3.2.1. Examination of Internal Driving Mechanisms Behind the Coupled and Coordinated Development of Water, Land, Energy, and Food Resources

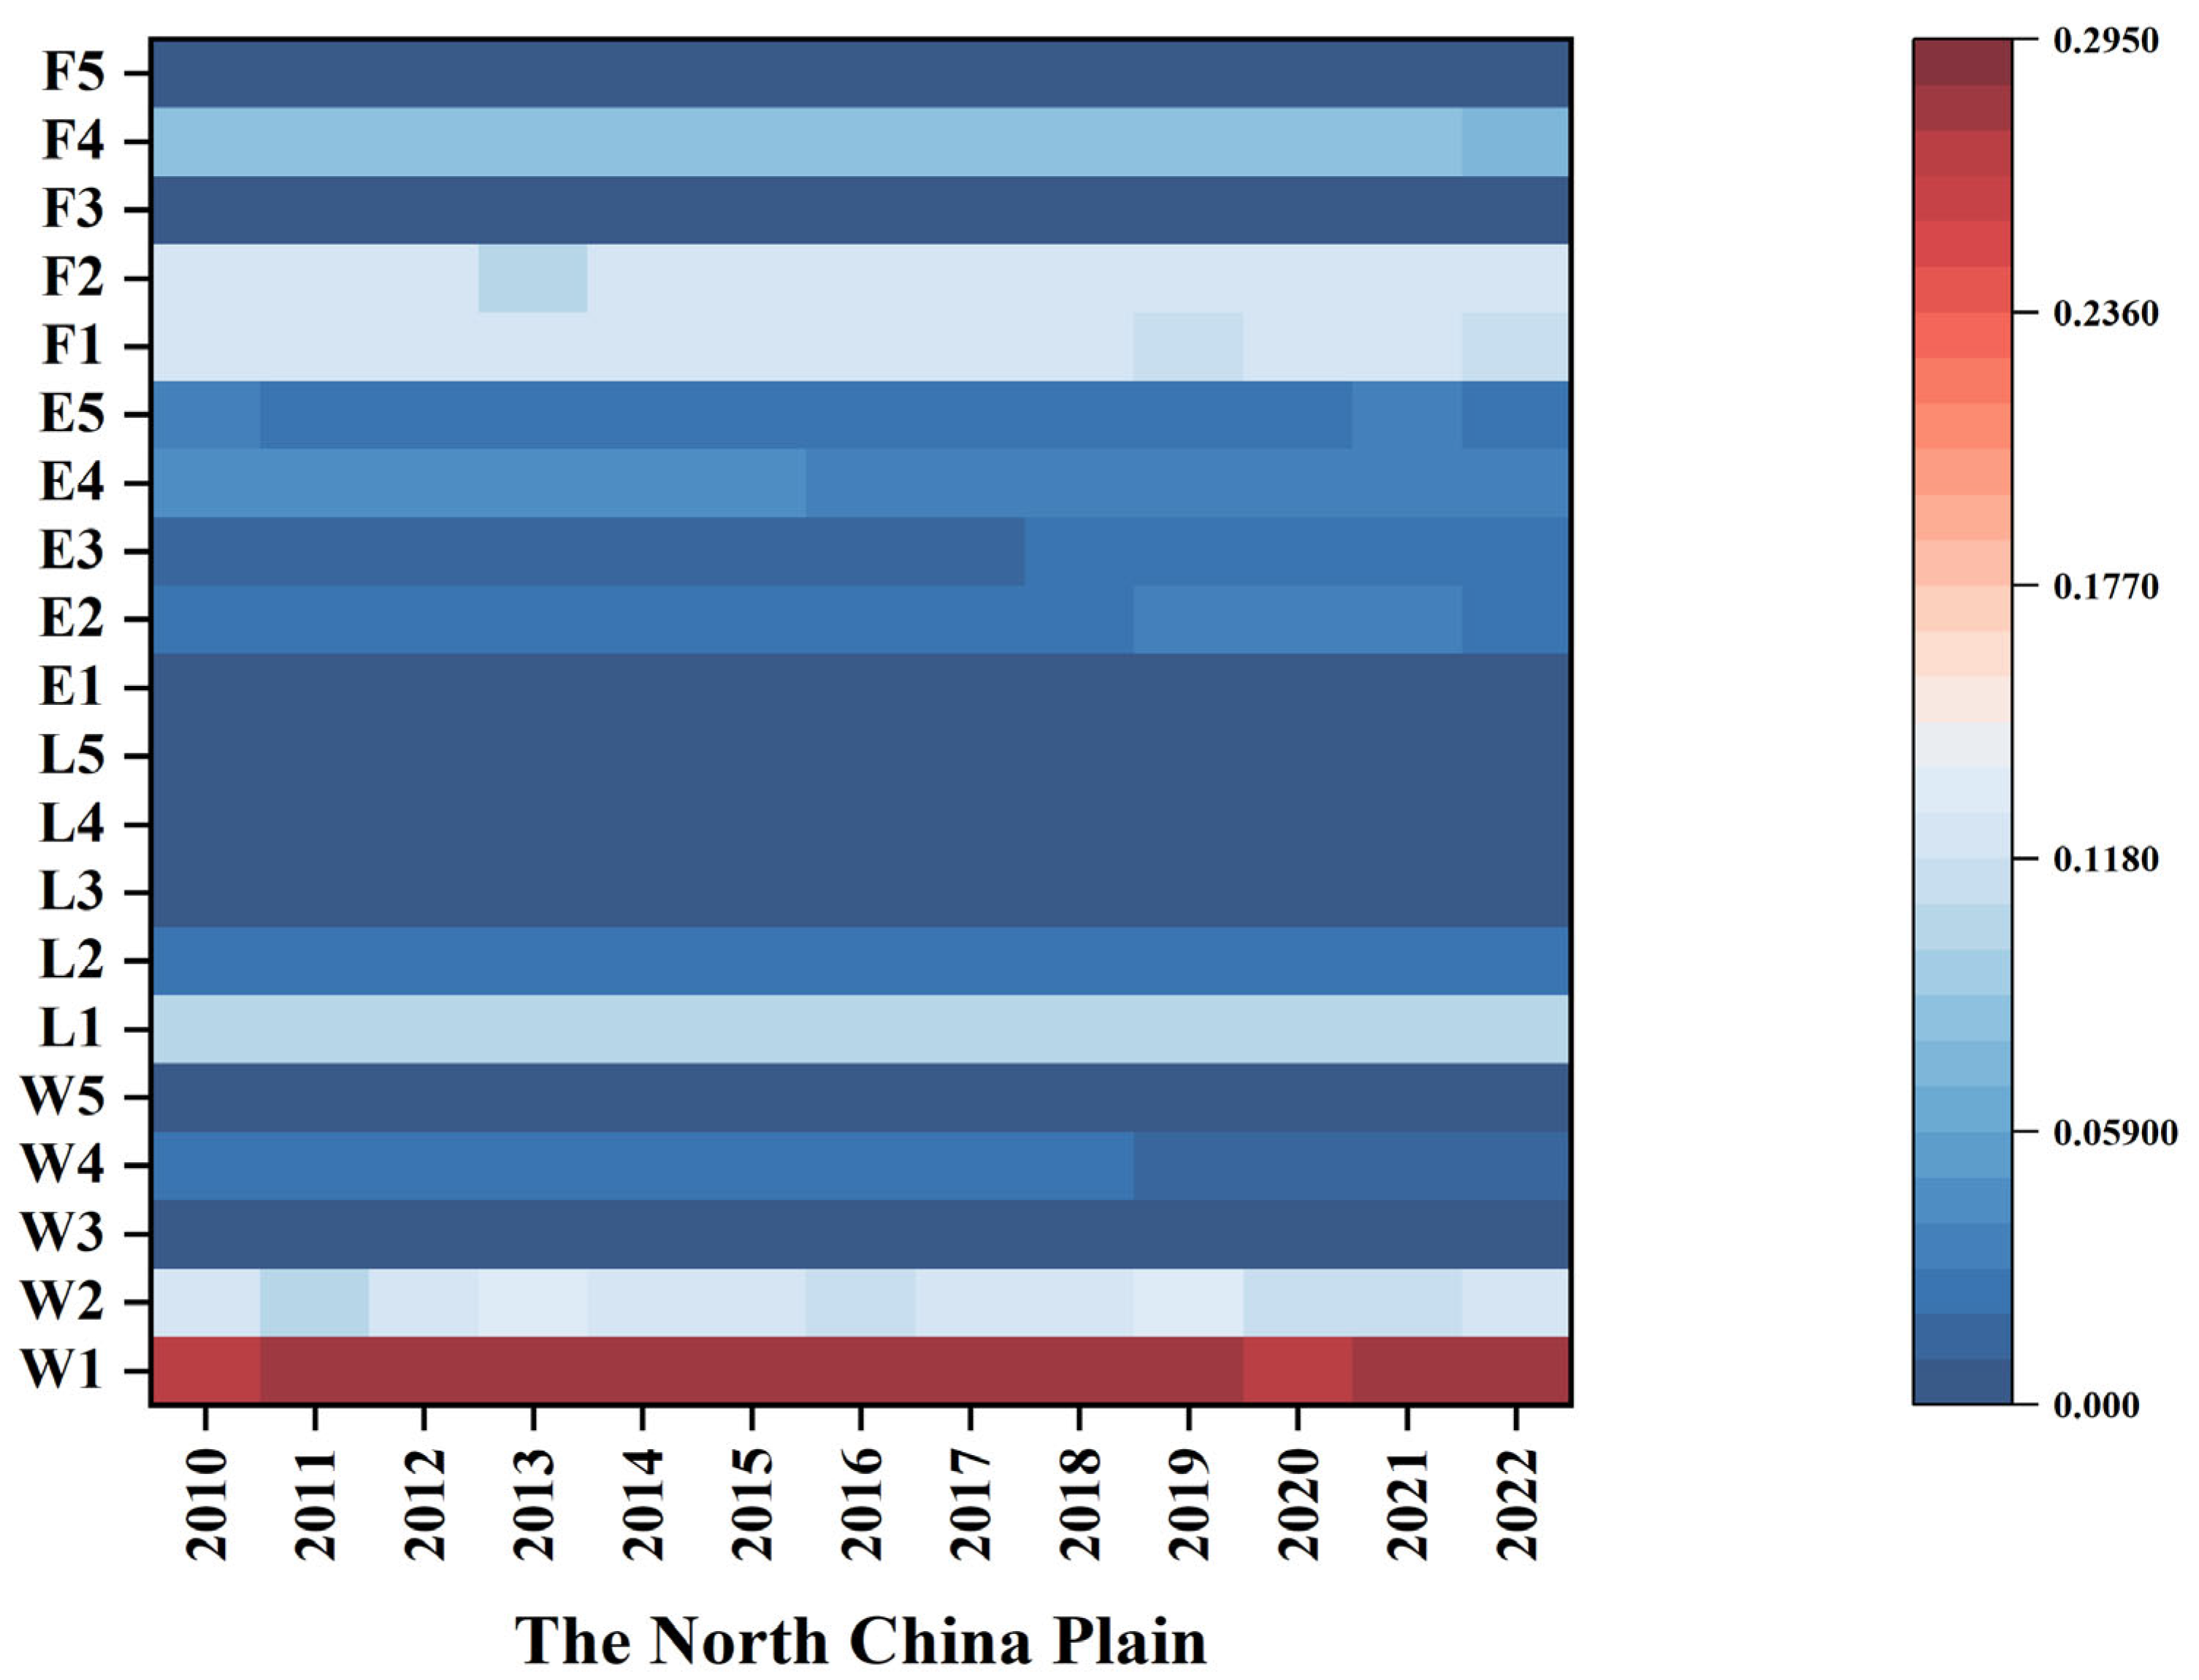
Findings reveal that during the period spanning 2010 to 2022, the coordinated coupling development of the WLEF system within the NCP faced its most significant constraint in water resource availability per capita (W1), which registered an impediment value of 0.279 according to the data visualization presented in Figure 5. This hydrological parameter emerged as the predominant limiting factor affecting systemic integration efficiency throughout the observed timeframe. Following this, the next four most influential factors, listed in order of decreasing impact, were the area of grain sown (F2) at 0.122, the water production coefficient (W2) at 0.120, grain yield (F1) at 0.119, and per capita construction land area (L1) at 0.100. The NCP is one of China’s most economically active regions, with the highest population density and significant grain production. However, the region possesses only about 1% of the country’s total water resources, which likely accounts for the significantly higher obstacle degree of per capita water resource availability (W1) compared to other internal factors in the WLEF system. This water-related constraint persisted throughout the study period from 2010 to 2022, emphasizing that water scarcity is a critical, ongoing issue. It poses a major challenge that requires urgent policy attention and effective management strategies, yet remains difficult to mitigate in the short term.
Based on previous research findings, the coupling coordination level of the North China Plain (NCP) continued to improve from 2010 to 2016, reaching a historical peak by the end of this period. However, between 2016 and 2019, this upward trend experienced a sharp decline, followed by a gradual recovery from 2019 to 2022. Notably, despite this rebound, the system’s coordination capacity has not yet returned to the 2016 peak level. Given that 2016 marked a critical turning point in system dynamics, this study selected 2016 as the baseline year to compare the dynamic constraints during two distinct periods: the growth phase (2010–2016) and the fluctuation phase (2016–2022). During the analysis, data from each period were compared using annual average values.
Figure 6a visually represents these temporal variations in obstruction intensities among different system indicators. Analysis reveals multiple parameters that progressively intensified their restrictive effects on WLEF coordination, particularly the modulus of water production(W2) and per capita energy consumption (E2), along with per capita energy consumption (E2). From a regional perspective, the five primary constraints identified as per capita water resources (W1), grain sown area (F2), modulus of water production (W2), grain output (F1), and per capita construction land area (L1) exhibited temporal variations in their influence. Notably, W1 demonstrated heightened significance during 2016–2022 compared to 2010–2016 in specific provinces, including Tianjin, Hebei, Henan, and Anhui, contrasting with diminished impacts observed elsewhere. Concurrently, W2 manifested intensified effects, particularly across Beijing, Tianjin, and Hebei. Analysis of indicator dynamics reveals divergent temporal patterns: parameters such as per capita energy consumption (E3), industrial solid waste recycling efficiency (E5), and cultivated grain acreage (F2) showed progressive influence amplification. Conversely, multiple metrics, including agricultural water allocation ratio (W4), rural per capita arable land (L2), urban green coverage (L4), agricultural mechanization capacity (E4), grain production volume (F1), and effective irrigation area (F4), experienced gradual impact attenuation. This pattern suggests shifting environmental and socioeconomic priorities across regions, with water resource availability and agricultural productivity indicators demonstrating particularly dynamic spatial-temporal variations. The impact showed growth in Anhui and Jiangsu, whereas reductions were noted in other regions. Regarding F1, the effect predominantly rose in Beijing and Hebei provinces, contrasting with diminished levels observed across remaining areas. The effect of per capita construction land area (L1) increased in Tianjin, Hebei, Henan, Shandong, and Anhui, while it decreased in other areas. From 2010 to 2022, the key factors affecting the coupling coordination of the WLEF system across water, land, energy, and food subsystems were per capita water resources (W1), per capita construction land area (L1), total agricultural machinery power (E4), and grain sown area (F2). The water and food subsystems were the main factors influencing the coupling coordination of the WLEF system in the NCP. This outcome aligns with the region’s role as a major grain producer and its ongoing water scarcity. Thus, improving water use efficiency while ensuring stable food production is essential for sustainable development.

3.2.2. Assessment of External Influencing Factors on the Coordinated Development of the WLEF Coupling System

Identification and Examination of Influencing Elements
As shown in Table 3, from 2010 to 2022, certain external factors increasingly influenced the WLEF system. Notably, the added value of the primary industry (X2), total regional population (X4), and per capita disposable income of rural residents (X5) became more significant. The impact of urbanization level (X3) initially declined from 0.283 in 2010 to 0.213 in 2016 but then rose sharply to 0.369 by 2022. In contrast, the influence of per capita gross domestic product (X1) on the WLEF system steadily diminished over the same period. This trend implies a certain degree of non-linear correlation between economic growth and resource utilization efficiency. In areas with high GDP, excessive investment in non-agricultural sectors may lead to the diversion of resources away from agriculture. In 2010, per capita GDP (X1) emerged as the key factor affecting the WLEF system’s coordination, emphasizing the strong link between economic development and system balance. Economically advanced regions typically demonstrate more efficient resource management, including optimized water use, effective land allocation, and mechanized agricultural production. Although X1 remained the dominant factor in 2016, by 2022, urbanization level (X3) and rural residents’ disposable income (X5) had become the leading determinants of system coordination. This transformation can be partially attributed to ongoing population growth and the acceleration of urbanization, both of which increasingly affect the supply and demand dynamics of water, land, energy, and food. Moderate urban expansion can also elevate rural income levels. As rural purchasing power rises, consumer behavior shifts, and the adoption of modern technologies can drive agricultural modernization. When income from wages exceeds that from traditional farming, it may encourage more efficient and intensive agricultural practices. However, unchecked urbanization may reduce arable land, threatening food system sustainability and national food security, thereby disrupting the WLEF system’s coordination.
Examination of Interactions Between Influencing Factors
Since the interaction detector can test the interactions among different factors and determine whether their combined effect on the dependent variable is enhanced, weakened, or independent, this study identifies the types of interaction relationships based on previous research, as summarized in Table S4. Specifically, the dual-factor enhancement effect refers to a situation in which the combined explanatory power of two interacting factors exceeds the maximum explanatory power of either factor acting alone. In contrast, the nonlinear enhancement effect is characterized by the explanatory power of the interaction being greater than the sum of the explanatory powers of the two factors when acting independently.
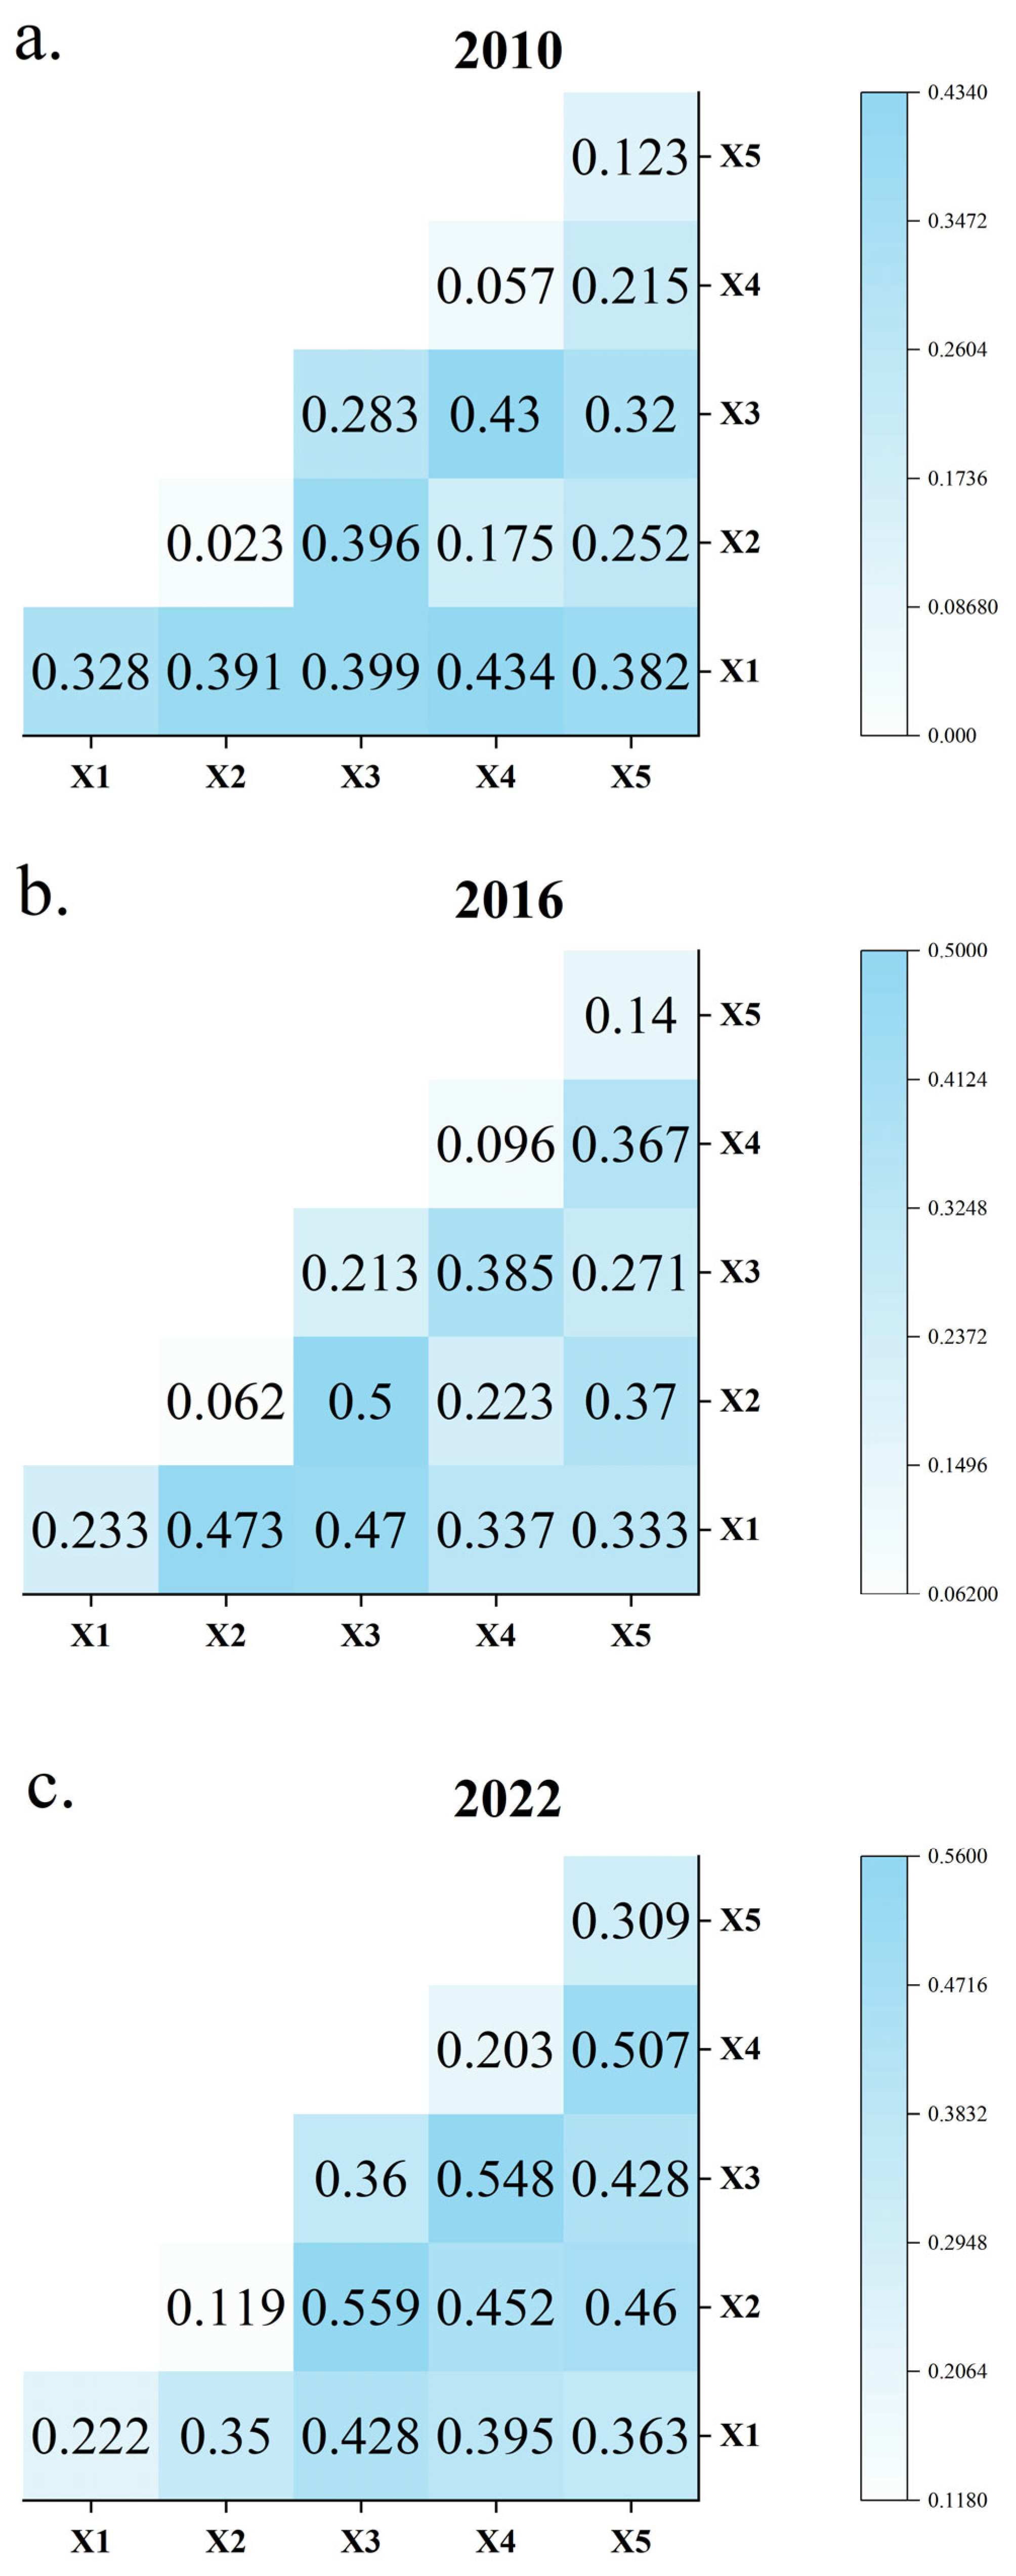
The interactive analysis using the geographical detector method (Figure 7) reveals that the q-values of all interacting factor pairs are significantly higher than those of individual factors, indicating the presence of both dual-factor enhancement and nonlinear enhancement effects. This suggests that the coupling coordination level of the water-land-energy-food (WLEF) system in the urban agglomeration of the North China Plain results from the combined influence of multiple factors. Data from 2010 show that per capita GDP (X1) exhibits a strong independent influence and significant interactions with other factors, with the interaction effect surpassing the individual effects of each factor. Notably, its interaction with total population (X4) is the strongest, reaching 0.434. This indicates that economic development had a substantial impact on population size during the early stage and played a key role in shaping the system’s coupling coordination level. By 2016, the interaction between the first industry’s added value (X2) and other factors became more pronounced. Although the single-factor influence of X2 was only 0.062, and that of urbanization level (X3) was 0.213, their interaction effect reached 0.5. In 2022, the interaction effect between X2 and X3 further increased to 0.559, significantly exceeding both their individual effects and their interactions with other factors, which indicates a strong nonlinear enhancement effect. This suggests that over time, the interaction between X2 and X3 has increasingly influenced the coupling and coordination of the WLEF system. Specifically, the relationship between X2 and X3 involves both positive synergy effects and negative conflicts. The positive effects include the enhancement of agricultural total factor productivity through technology diffusion driven by urbanization—such as the adoption of efficient irrigation systems—as well as the provision of human resources and material support for urban development. The negative effects are manifested in the encroachment of urbanization on farmland, the reduction in agricultural production space, and the intensified competition for water resources between agriculture (which accounts for 70% of total water consumption in North China) and urban areas, thereby worsening water scarcity. The nonlinear enhancement effect indicates that the positive synergies of the X2–X3 interaction outweigh the negative conflicts in promoting the coupling and coordination of the WLEF system. Therefore, delineating farmland protection red lines and urban development boundaries, curbing the uncontrolled expansion of construction land, and advancing agricultural modernization through urbanization and technological innovation can effectively enhance the coupling and coordination level of the water-land-energy-food system.

4. Discussion

4.1. Advantages of the Research

Taking into account the interconnectedness of land, water, energy, and food resources, this research incorporates land as a core component within the system framework. Earlier studies have approached land use either as a contextual setting for projecting changes in the water-energy-food system [32] or as an external variable influencing the interactions among water, energy, and food [57]. Nevertheless, in those analyses, land has not been recognized as an integral subsystem that dynamically interacts with the other three elements. Moreover, existing studies on this system are predominantly conducted at the regional level, with a concentration on economically advanced zones such as the Yangtze River Economic Belt [10,43], as well as areas characterized by ecological fragility [58]. The North China Plain (NCP), referenced in recent studies, faces multifaceted challenges as China’s crucial agricultural zone due to rapid urban expansion. This region experiences heightened conflicts over water, land, and energy resource distribution amid growing urbanization pressures. Current scholarly work on the water-land-energy-food (WLEF) nexus across the region remains limited, with prior investigations having largely concentrated on provincial-scale examinations [14] rather than adopting comprehensive regional assessments. Earlier analyses primarily examined system coordination drivers through internal mechanisms [35], whereas the present research implements a novel dual-perspective framework that simultaneously considers both endogenous and exogenous factors. This methodological advancement enhances comprehension of systemic coordination dynamics while supporting the formulation of holistic resource management strategies.

4.2. Research Findings and Rationality Analysis

The effective integration of water, energy, food, and land resources plays a crucial role in mitigating the impacts of resource scarcity on regional sustainability. Research data indicate that from 2010 to 2022, the coupling coordination degree of the water-land-energy-food (WLEF) system in the North China Plain fluctuated around 0.5, suggesting that the system has been gradually transitioning toward an imbalanced state. The coordination degree peaked in 2016. Since then, the system has experienced a period of deterioration followed by partial recovery; however, the coordination level has remained below the 2010 baseline. The overall trend shows a continuous decline, which aligns with the findings of Li Qiu et al. (2022) [59], who reported a sustained decrease in the coordination degree of the provincial water-energy-food linkage system in China. As shown in the time trend analysis in Figure 3 and Figure 4, the development levels of the WLEF system varied significantly across provinces and cities between 2010 and 2022. This variation was closely linked to national development policies and regulatory changes. Particularly from 2010 to 2016, many regions exhibited an upward trend, which can be attributed to the implementation of resource integration policies during China’s 12th Five-Year Plan. During this period, the North China Plain adopted a water resource management model centered on infrastructure development, including the construction of pipeline water delivery networks and the widespread adoption of sprinkler and drip irrigation technologies. Moreover, the South-to-North Water Diversion Project, implemented through the eastern and central routes (2013–2014), effectively alleviated water shortages in the Beijing-Tianjin-Hebei region by replacing degraded groundwater reserves and enhancing the reliability of water supply. Concurrently, food security policies emphasized irrigation and agricultural technological innovation, significantly increasing grain yield per unit area. At the same time, advances in agricultural mechanization reduced energy consumption per unit of output and improved resource reuse efficiency. However, during the 13th Five-Year Plan period (2016–2020), the acceleration of urbanization and the expansion of construction land increased pressure on arable land. Furthermore, the fallow policy implemented in areas with excessive groundwater extraction may have negatively affected food production capacity and land use efficiency. The cumulative effects of climate change [17] could further undermine the coordination level of the coupled system. These trends indicate that resource management strategies, policy implementation, and climate change have significant and lasting impacts on the overall coordination and stability of the WLEF system.
The coupling coordination level of the water-land-energy-food (WLEF) system in the North China Plain exhibits significant regional disparities. Geographically, the Beijing-Tianjin-Hebei urban agglomeration shows a notably low coordination level, with most areas approaching an imbalanced state. This observation is consistent with the findings of Wang and Sun (2022) [8]. In contrast, Anhui and Jiangsu demonstrate relatively high coordination levels, with most regions at the initial coordination stage and some having progressed to the intermediate stage. Anhui has the highest coordination level, which has shown a fluctuating upward trend from 2010 to 2022, aligning with the results reported by Zhu et al. (2022) [40]. Furthermore, Shandong Province experienced a fluctuating upward trend in coupling coordination throughout the study period, whereas Henan Province exhibited a fluctuating decline.
Overall, the coordination levels of the water-land-energy-food (WLEF) system across the provinces (municipalities) in the North China Plain exhibit a clear gradient: Anhui > Jiangsu > Henan > Shandong > Hebei > Tianjin > Beijing. This spatial disparity may result from the combined influence of multiple factors, including natural endowments, climatic characteristics, and regional policies. With regard to natural endowments, the distribution of water resources serves as the primary driver of regional differences. Anhui and Jiangsu are located in the Yangtze River Basin, where rainfall is abundant, water resources are relatively plentiful, and the water subsystem remains stable. In contrast, Beijing, Tianjin, and Hebei are situated in the Haihe River Basin, where total water resources accounted for only 0.5% of the national total in 2019, and per capita water availability is significantly lower than the national average. Regarding land resources, Anhui and Henan possess high-quality arable land with strong grain production capacity, whereas the arable land in Shandong and Hebei is affected by salinization and pollution, resulting in lower land use efficiency compared to the southern provinces. From 2005 to 2018, the Beijing-Tianjin-Hebei region experienced a reduction in arable land exceeding 10,458.22 km2 [8]. In Beijing, arable land constitutes less than 10% of the total area, leading to limited grain self-sufficiency. In terms of climatic conditions, precipitation in Beijing, Hebei, and Shandong exhibits significant interannual variability, resulting in pronounced fluctuations in water resource availability. This variability leads to frequent instability in the evaluation of the water subsystem and undermines the overall coordination level. In contrast, Anhui and Jiangsu experience more consistent precipitation patterns, which contribute to a more stable water subsystem and facilitate coordinated development. At the policy level, Anhui and Jiangsu have effectively curbed land occupation through the implementation of “Ecology First” and “Farmland Protection” policies. Industrial upgrading in these regions has also improved resource utilization efficiency, thereby promoting higher system coordination. In contrast, the Beijing-Tianjin-Hebei region, particularly Beijing and Tianjin, initially prioritized economic growth and urbanization, which resulted in the preferential expansion of construction land at the expense of timely farmland protection.
Although Beijing’s service sector does not directly consume arable land or agricultural water resources, its large-scale development relies heavily on energy and water resources, thereby increasing external resource dependency. Moreover, infrastructure expansion has further accelerated the growth of construction land, indirectly encroaching upon arable and ecological land, which intensifies the challenges of system coordination. Due to the combined effects of resource supply-demand imbalances and other influencing factors, Beijing’s water-land-energy-food (WLEF) system continues to exhibit the lowest coordination level among all provinces.
Further analysis of intrinsic drivers affecting coupled system coordination identified five predominant barriers ranked by obstacle intensity: grain production volume (F1), cultivated land area (F2), water resources per capita (W1), modulus of water production (W2), and per capita construction land (L1). Notably, water resources per capita (W1) represented the most substantial constraint, a finding consistent with chronic hydrological deficits documented in North China Plain studies [19]. Regarding exogenous drivers, GDP per capita (X1) emerged as the primary external driver of coordination enhancement between 2010 and 2016. Subsequent temporal analysis revealed urbanization level (X3) and rural residents’ income capacity (X5) superseded other factors by 2022. This transition reflects the increasing role of urban expansion patterns and rural economic conditions in shaping systemic synergies, indicating dynamic evolution in coordination mechanisms across temporal dimensions. The findings align closely with the results reported in prior research on the “Water-Energy-Food-Ecology” system [44].

4.3. Policy Implications

Given the spatial differences observed in coupling coordination patterns across the NCP, tailored policy frameworks need to be formulated to address distinct regional characteristics and local requirements.
In the Beijing-Tianjin-Hebei area, which faces imminent imbalances, spatial planning strategies must emphasize urban construction land expansion alongside farmland conservation and utilization efficiency enhancement. Urban growth initiatives should redirect development from major urban centers such as Beijing, Tianjin, Baoding, and Langfang toward peripheral municipalities, alleviating conflicts between urban expansion and agricultural land preservation. For cities constrained by land scarcity, policy priorities should concentrate on tertiary industry advancement, renewable energy adoption, and technological upgrades for industries with intensive water and energy demands. Adopting drought-tolerant, high-productivity crop strains could simultaneously decrease resource consumption across water, energy, and land systems [8]. Henan and Shandong provinces, boasting fertile soils and agricultural advantages, maintain grain production as the central component within their water-land-energy-food nexus. Although challenged by restricted water and energy availability, these regions can attain sustainability through restructuring resource allocation patterns and enhancing utilization effectiveness. The progress in emerging urban development should prioritize strengthening the adaptability and overall performance of water-energy-food systems. Targeted modifications in land utilization patterns can effectively propel superior regional growth [60]. In Anhui and Jiangsu provinces, despite relatively sufficient water reserves, suboptimal water utilization poses a significant challenge. Jiangsu requires comprehensive solutions to reconcile water accessibility with agricultural demands through concentrated water management approaches and crop pattern modifications, thereby boosting hydrological and terrestrial resource productivity. Anhui’s strategy should emphasize systematic enhancement of integrated resource governance for water, energy, and land assets. Scientific water distribution mechanisms, upgraded energy configuration frameworks, and refined spatial planning methodologies could substantially elevate resource optimization levels. Implementation of smart water conveyance infrastructure, for example, could optimize water distribution networks while enabling diversified land applications [61].
Finally, as a vital agricultural zone facing water scarcity challenges, the North China Plain (NCP) must optimize its water and nutrient management approaches, especially amid accelerating urban expansion. The role of technological progress in enhancing agricultural resilience and sustainable environmental practices must be acknowledged and effectively utilized [62]. Simultaneously, enhancing rural household earnings, advancing contemporary and intensive farming systems, and integrating adaptive measures for climate change constitute essential strategies for formulating more flexible and dynamic agricultural management approaches [40].

4.4. Limitations and Future Work

This research constructs an evaluation framework for the water-land-energy-food (WLEF) nexus in the North China Plain (NCP), emphasizing the interdependencies between these elements through existing datasets. Although the framework offers holistic insights, certain critical metrics were omitted owing to data accessibility constraints. Subsequent investigations could refine this framework by integrating supplementary parameters and adapting it to geographical specificities, such as implementing the DPSIR conceptual model [63] for structural enhancement. The entropy weighting technique employed for metric prioritization demonstrates an unbiased approach yet overlooks localized contextual factors. Enhanced objectivity could be achieved through combining this quantitative method with qualitative assessments or domain expertise, supplemented by sensitivity testing to evaluate weighting scheme influences on outcomes [14]. Furthermore, given that the weight allocation of subsystems in the current study—including the water, energy, food, and land subsystems—is inherently subjective, future research could incorporate the Monte Carlo simulation method to investigate how different weight allocation schemes influence the comprehensive evaluation of the system. By employing random sampling and statistical analysis, the Monte Carlo simulation can effectively minimize subjectivity and enhance the scientific rigor and robustness of the model [64]. Beyond socioeconomic parameters, incorporating environmental variables, including geomorphological features, rainfall patterns, and climatic variations [17], would enable deeper comprehension of fundamental drivers within the WLEF nexus. Enhancing the indicator framework through the integration of additional environmental variables, performing regional variability studies, and implementing sensitivity evaluations will boost model precision and policy applicability. Moreover, extended exploration of interdepartmental collaboration frameworks and comprehensive strategy development for the WLEF system is required to strengthen synergistic coordination across the region.

5. Conclusions

This study incorporates land as a core interactive component into the traditional Water-Energy-Food (WEF) nexus framework, constructing a “Water-Land-Energy-Food (WLEF)” assessment system for the North China Plain. This enhancement expands the scope of research on multi-sectoral coupling and coordination within resource systems. To overcome the limitations of previous single-model approaches, the study integrates the coupling coordination degree model, the obstacle degree model, and the geographical detector model, thereby establishing a more comprehensive and robust quantitative analytical framework. It systematically evaluates the current coordination status and spatiotemporal distribution patterns of the WLEF system while identifying key internal and external factors influencing system coordination. In addition, the study focuses on the urban agglomeration scale, addressing the gaps in resource coupling coordination research at this scale and enhancing the applicability of related research findings to guide local resource allocation decisions. The main findings are as follows:
(1)
WLEF system coordination status: The overall WLEF coupling coordination degree fluctuated near the imbalance threshold (around 0.5), peaking in 2016 but declining overall after that. The water resources subsystem remained at a low level, while the energy subsystem showed notable growth. Southern cities in the North China Plain, especially Anhui province, demonstrated higher coordination levels than northern areas like Beijing. Some cities (e.g., Beijing, Zhengzhou, Wuxi, and Suzhou) entered mild imbalance by 2022, requiring targeted intervention.
(2)
Key Influencing Factors: Internally, severe water scarcity, indicated by per capita water availability as the primary obstacle, critically constrains coordination of the WLEF system. Other factors, such as grain sown area, water production capacity, and grain output, also play significant roles, underscoring the challenge of balancing high agricultural demands with limited water resources. Externally, primary industry’s added value, regional population, rural residents’ income, and urbanization rate increasingly influenced coupling coordination. Among factor interactions, after 2016, the interaction involving primary industry value significantly enhanced its explanatory power for the WLEF system’s coupling coordination—surpassing the individual effects of the two factors in the interaction (i.e., primary industry value and its paired factor). Additionally, the synergistic effect between primary industry value and urbanization rate further promoted system coordination.
(3)
Policy insights: Mitigating water scarcity is paramount, which requires regionally tailored strategies. In water-stressed areas, such as Beijing-Tianjin-Hebei, integrated land-use planning and the adoption of drought-tolerant, high-yield crops are needed to ease WLEF system pressures. For higher rainfall areas, including Anhui and Jiangsu, the emphasis should be on enhancing water infrastructure, optimizing the distribution of water resources, and encouraging diversified land-use practices. Concurrently, policies should support the industries with low water and energy consumption, advance agricultural modernization and intensive production, and foster the efficient, synergistic use of resources.

Supplementary Materials

The following supporting information can be downloaded at: https://www.mdpi.com/article/10.3390/land14091782/s1, Table S1: Evaluation system of water-land-energy-food (WLEF) nexus indicators for the North China Plain (NCP) and their data sources; Table S2: Classification of WLEF coupling levels; Table S3: Classification of WLEF coordination levels; Table S4: Interaction categories between two independent variables. Reference [65] has been cited in main text.

Author Contributions

Conceptualization, Z.D. and J.W.; methodology, Z.D. and J.W.; software, Z.D. and J.Y.; validation, J.Y., X.X. and W.F.; data curation, Z.D. and J.Y.; writing—original draft preparation, Z.D.; writing—review and editing, J.W. and Z.D.; visualization, Z.D. and X.X.; supervision, J.W.; project administration, Z.D.; funding acquisition, J.W. and W.F. All authors have read and agreed to the published version of the manuscript.

Funding

This research was supported by the Fundamental Research Funds for the Central Universities [Grant No. 2-9-2023-070], the Open-ended Fund of Key Laboratory of Land Surface Pattern and Simulation, Chinese Academy of Sciences [Grant No. LB2021001], the Fundamental Research Funds for the Central Universities [Grant No. 2-9-2020-022]. China University of Geosciences (Beijing) University Student Innovation and Entrepreneurship Training Program [Grant No. 202411415084].

Data Availability Statement

The data presented in this study are available on request from the corresponding author.

Acknowledgments

We are so grateful to the anonymous reviewers and editors for their suggestions.

Conflicts of Interest

The authors declare that they have no known competing financial interests or personal relationships that could have appeared to influence the work reported in this paper.

Abbreviations

The following abbreviations are used in this manuscript:
NCPNorth China Plain
WLEFWater-Land-Energy-Food

References

  1. Zuo, Q.; Wu, Q.; Yu, L.; Li, Y.; Fan, Y. Optimization of Uncertain Agricultural Management Considering the Framework of Water, Energy and Food. Agric. Water Manag. 2021, 253, 106907. [Google Scholar] [CrossRef]
  2. Li, J.; Cui, J.; Sui, P.; Yue, S.; Yang, J.; Lv, Z.; Wang, D.; Chen, X.; Sun, B.; Ran, M.; et al. Valuing the synergy in the water-energy-food nexus for cropping systems: A case in the North China Plain. Ecol. Indic. 2021, 127, 107741. [Google Scholar] [CrossRef]
  3. Cheng, Y.; Wang, J.; Shu, K. The Coupling and Coordination Assessment of Food-Water-Energy Systems in China Based on Sustainable Development Goals. Sustain. Prod. Consum. 2023, 35, 338–348. [Google Scholar] [CrossRef]
  4. AbdelHady, R.S.; Fahmy, H.S.; Pacini, N. Valuing of Wadi El-Rayan Ecosystem through Water–Food–Energy Nexus Approach. Ecohydrol. Hydrobiol. 2017, 17, 247–253. [Google Scholar] [CrossRef]
  5. Sharifi Moghadam, E.; Sadeghi, S.H.; Zarghami, M.; Delavar, M. Developing Sustainable Land-Use Patterns at Watershed Scale Using Nexus of Soil, Water, Energy, and Food. Sci. Total Environ. 2023, 856, 158935. [Google Scholar] [CrossRef] [PubMed]
  6. Wolde, Z.; Wei, W.; Likessa, D.; Omari, R.; Ketema, H. Understanding the Impact of Land Use and Land Cover Change on Water–Energy–Food Nexus in the Gidabo Watershed, East African Rift Valley. Nat. Resour. Res. 2021, 30, 2687–2702. [Google Scholar] [CrossRef]
  7. Rasul, G. Food, Water, and Energy Security in South Asia: A Nexus Perspective from the Hindu Kush Himalayan Region☆. Environ. Sci. Policy 2014, 39, 35–48. [Google Scholar] [CrossRef]
  8. Wang, Y.; Sun, R. Impact of land use change on coupling coordination degree of regional water-energy-food system: A case study of Beijing-Tianjin-Hebei Urban Agglomeration. J. Nat. Resour. 2022, 37, 582. [Google Scholar] [CrossRef]
  9. Ibarrola-Rivas, M.J.; Granados-Ramírez, R.; Nonhebel, S. Is the Available Cropland and Water Enough for Food Demand? A Global Perspective of the Land-Water-Food Nexus. Adv. Water Resour. 2017, 110, 476–483. [Google Scholar] [CrossRef]
  10. Qin, Q.; He, W.; Yuan, L.; Degefu, D.M.; Ramsey, T.S. Coupled and Coordinated Development of Water-Energy-Food-Ecology-Land System in the Yangtze River Delta, China. npj Clean Water 2025, 8, 38. [Google Scholar] [CrossRef]
  11. Shi, X.; Zhu, W. Spatio-Temporal Patterns and Drivers of Irrigation Water Requirement in Mainland China. Agric. Water Manag. 2025, 308, 109283. [Google Scholar] [CrossRef]
  12. Qin, J.; Duan, W.; Zou, S.; Chen, Y.; Huang, W.; Rosa, L. Global Energy Use and Carbon Emissions from Irrigated Agriculture. Nat. Commun. 2024, 15, 3084. [Google Scholar] [CrossRef]
  13. Li, M.; Cao, X.; Liu, D.; Fu, Q.; Li, T.; Shang, R. Sustainable Management of Agricultural Water and Land Resources Under Changing Climate and Socio-Economic Conditions: A Multi-Dimensional Optimization Approach. Agric. Water Manag. 2022, 259, 107235. [Google Scholar] [CrossRef]
  14. Chang, H.; Zhang, B.; Han, J.; Zhao, Y.; Cao, Y.; Yao, J.; Shi, L. Evaluation of the Coupling Coordination and Sustainable Development of Water–Energy–Land–Food System on a 40-Year Scale: A Case Study of Hebei, China. Land 2024, 13, 1089. [Google Scholar] [CrossRef]
  15. Bai, Y.; Wang, Y.; Xuan, X.; Weng, C.; Huang, X.; Deng, X. Tele-Connections, Driving Forces and Scenario Simulation of Agricultural Land, Water Use and Carbon Emissions in China’s Trade. Resour. Conserv. Recycl. 2024, 203, 107433. [Google Scholar] [CrossRef]
  16. Huang, F.; Yang, X.; Fang, Y.; Wang, S.; Kang, S. Exploring Water-and-Land-Adapted Spatial Layout of Crop Planting in North China. Chin. J. Eng. Sci. 2022, 24, 89. [Google Scholar] [CrossRef]
  17. Huang, Z.; Huo, Z.; Wang, W.; Zhu, J.; Zhang, C.; Xi, R. Analysis of Driving Factors for Land Subsidence in Typical Cities of the North China Plain Based on Geodetector Technology. J. Groundw. Sci. Eng. 2025, 13, 74–89. [Google Scholar] [CrossRef]
  18. Changming, L.; Jingjie, Y.; Kendy, E. Groundwater Exploitation and Its Impact on the Environment in the North China Plain. Water Int. 2001, 26, 265–272. [Google Scholar] [CrossRef]
  19. Xu, H.; Li, M.; Wang, T.; Ge, D.; Pan, Y. Decadal Water Management Measures Moderated the Subsidence of North China Plain. Sci. Bull. 2025, 70, 1538–1541. [Google Scholar] [CrossRef] [PubMed]
  20. Liu, Y.; Hu, X.; Zhang, Q.; Zheng, M. Improving Agricultural Water Use Efficiency: A Quantitative Study of Zhangye City Using the Static CGE Model with a CES Water−Land Resources Account. Sustainability 2017, 9, 308. [Google Scholar] [CrossRef]
  21. Liu, Y.; Wang, S.; Chen, B. Water–Land Nexus in Food Trade Based on Ecological Network Analysis. Ecol. Indic. 2019, 97, 466–475. [Google Scholar] [CrossRef]
  22. Chen, C.; Park, T.; Wang, X.; Piao, S.; Xu, B.; Chaturvedi, R.K.; Fuchs, R.; Brovkin, V.; Ciais, P.; Fensholt, R.; et al. China and India Lead in Greening of the World Through Land-Use Management. Nat. Sustain. 2019, 2, 122–129. [Google Scholar] [CrossRef]
  23. Shirzad, H.; Barati, A.A.; Ehteshammajd, S.; Goli, I.; Siamian, N.; Moghaddam, S.M.; Pour, M.; Tan, R.; Janečková, K.; Sklenička, P.; et al. Agricultural Land Tenure System in Iran: An Overview. Land Use Policy 2022, 123, 106375. [Google Scholar] [CrossRef]
  24. Yao, X.; Chen, W.; Song, C.; Gao, S. Sustainability and Efficiency of Water-Land-Energy-Food Nexus Based on Emergy-Ecological Footprint and Data Envelopment Analysis: Case of an Important Agriculture and Ecological Region in Northeast China. J. Clean. Prod. 2022, 379, 134854. [Google Scholar] [CrossRef]
  25. Zhuang, J.; Löffler, F.; Sayler, G. Closing Transdisciplinary Collaboration Gaps of Food-Energy-Water Nexus Research. Environ. Sci. Policy 2021, 126, 164–167. [Google Scholar] [CrossRef]
  26. Li, Y.; Zhang, L.; Zhang, P.; Li, X.; Hao, Y. Water-Energy-Food Nexus in China: An Interregional Comparison. Agric. Water Manag. 2024, 301, 108964. [Google Scholar] [CrossRef]
  27. Sobrosa Neto, R.D.C.; Berchin, I.I.; Magtoto, M.; Berchin, S.; Xavier, W.G.; Guerra, J.B.S.O.D.A. An Integrative Approach for the Water-Energy-Food Nexus in Beef Cattle Production: A Simulation of the Proposed Model to Brazil. J. Clean. Prod. 2018, 204, 1108–1123. [Google Scholar] [CrossRef]
  28. Afkhami, S.; Massah Bavani, A.R.; Gohari, A.; Naderi, M.M.; Saadi, T. Sustainability Analysis of Single vs. Multiple Adaptation Strategies in Tackling the Adverse Impacts of Climate Change on Groundwater Resources Using Water-Food-Energy Nexus Approach. J. Clean. Prod. 2024, 459, 142532. [Google Scholar] [CrossRef]
  29. Tian, G.; Li, J.; Wu, Z.; Zhao, Q.; Xia, Q.; Zhang, J.; Niu, X. Unveiling the Resilience of the Water-Energy-Food Nexus: A Context-Specific Framework and Evolutionary Insights for the Yellow River Basin. Agric. Water Manag. 2025, 315, 109514. [Google Scholar] [CrossRef]
  30. White, D.J.; Hubacek, K.; Feng, K.; Sun, L.; Meng, B. The Water-Energy-Food Nexus in East Asia: A Tele-Connected Value Chain Analysis Using Inter-Regional Input-Output Analysis. Appl. Energy 2018, 210, 550–567. [Google Scholar] [CrossRef]
  31. Liu, J.; Li, M.; Wu, M.; Luan, X.; Wang, W.; Yu, Z. Influences of the South–to-North Water Diversion Project and Virtual Water Flows on Regional Water Resources Considering Both Water Quantity and Quality. J. Clean. Prod. 2020, 244, 118920. [Google Scholar] [CrossRef]
  32. Yuan, W.; Wang, H.; Guo, W. Supply–Demand Synergy Assessment of the Water–Energy–Food Nexus in the Hanjiang River Basin Under Future Land Scenarios. Ecohydrology 2025, 18, e2762. [Google Scholar] [CrossRef]
  33. Qi, Y.; Farnoosh, A.; Lin, L.; Liu, H. Coupling Coordination Analysis of China’s Provincial Water-Energy-Food Nexus. Environ. Sci. Pollut. Res. 2022, 29, 23303–23313. [Google Scholar] [CrossRef]
  34. Bai, Y.; Xuan, X.; Wang, Y.; Weng, C.; Huang, X.; Deng, X. Revealing the Nexus Profile of Agricultural Water–Land–Food–GHG Flows in China. Resour. Conserv. Recycl. 2024, 204, 107528. [Google Scholar] [CrossRef]
  35. Chen, L.; Wang, X.; Lv, M.; Su, J.; Yang, B. Coupling Coordination and Spatial–Temporal Evolution of the Water–Land–Ecology System in the North China Plain. Agriculture 2024, 14, 1636. [Google Scholar] [CrossRef]
  36. Nie, Y.; Avraamidou, S.; Xiao, X.; Pistikopoulos, E.N.; Li, J.; Zeng, Y.; Song, F.; Yu, J.; Zhu, M. A Food-Energy-Water Nexus Approach for Land Use Optimization. Sci. Total Environ. 2019, 659, 7–19. [Google Scholar] [CrossRef]
  37. Wei, X.; Ye, Y.; Zhang, Q.; Li, B.; Wei, Z. Reconstruction of Cropland Change in North China Plain Area over the Past 300 Years. Glob. Planet. Chang. 2019, 176, 60–70. [Google Scholar] [CrossRef]
  38. Mo, X.; Liu, S.; Lin, Z.; Guo, R. Regional Crop Yield, Water Consumption and Water Use Efficiency and Their Responses to Climate Change in the North China Plain. Agric. Ecosyst. Environ. 2009, 134, 67–78. [Google Scholar] [CrossRef]
  39. Yin, J.; Yan, D.; Yang, Z.; Yuan, Z.; Yuan, Y.; Zhang, C. Projection of Extreme Precipitation in the Context of Climate Change in Huang-Huai-Hai Region, China. J. Earth Syst. Sci. 2016, 125, 417–429. [Google Scholar] [CrossRef]
  40. Zhu, L.; Bai, Y.; Zhang, L.; Si, W.; Wang, A.; Weng, C.; Shu, J. Water–Land–Food Nexus for Sustainable Agricultural Development in Main Grain-Producing Areas of North China Plain. Foods 2023, 12, 712. [Google Scholar] [CrossRef] [PubMed]
  41. Zhang, J.; Hu, L.; Sun, J.; Wang, D. Reconstructing Groundwater Storage Changes in the North China Plain Using a Numerical Model and GRACE Data. Remote Sens. 2023, 15, 3264. [Google Scholar] [CrossRef]
  42. Chen, X.; Thorp, K.R.; Ouyang, Z.; Hou, Y.; Zhou, B.; Li, Y. Energy Consumption Due to Groundwater Pumping for Irrigation in the North China Plain. Sci. Total Environ. 2019, 669, 1033–1042. [Google Scholar] [CrossRef]
  43. Jing, P.; Hu, T.; Sheng, J.; Mahmoud, A.; Liu, Y.; Yang, D.; Guo, L.; Li, M.; Wu, Y. Coupling Coordination and Spatiotemporal Dynamic Evolution of the Water-Energy-Food-Land (WEFL) Nexus in the Yangtze River Economic Belt, China. Environ. Sci. Pollut. Res. 2022, 30, 34978–34995. [Google Scholar] [CrossRef]
  44. Zhen, J.; Guo, Y.; Wang, Y.; Li, Y.; Shen, Y. Spatial-Temporal Evolution and Driving Factors of Water-Energy-Food-Ecology Coordinated Development in the Tarim River Basin. J. Hydrol. Reg. Stud. 2025, 58, 102288. [Google Scholar] [CrossRef]
  45. Chen, P. Effects of the Entropy Weight on TOPSIS. Expert Syst. Appl. 2021, 168, 114186. [Google Scholar] [CrossRef]
  46. Sun, J.; Yang, Y.; Qi, P.; Zhang, G.; Wu, Y. Development and Application of a New Water-Carbon-Economy Coupling Model (WCECM) for Optimal Allocation of Agricultural Water and Land Resources. Agric. Water Manag. 2024, 291, 108608. [Google Scholar] [CrossRef]
  47. Zou, S.; Liao, Z.; Liu, Y.; Fan, X. Research on the Impact of Heterogeneous Environmental Regulation on the Coordinated Development of China’s Water–Energy–Food System from a Spatial Perspective. Sustainability 2024, 16, 818. [Google Scholar] [CrossRef]
  48. Chen, A.; Hao, Z.; Wang, R.; Zhao, H.; Hao, J.; Xu, R.; Duan, H. Cultivated Land Sustainable Use Evaluation from the Perspective of the Water–Land–Energy–Food Nexus: A Case Study of the Major Grain-Producing Regions in Quzhou, China. Agronomy 2023, 13, 2362. [Google Scholar] [CrossRef]
  49. Xing, L.; Xue, M.; Hu, M. Dynamic Simulation and Assessment of the Coupling Coordination Degree of the Economy–Resource–Environment System: Case of Wuhan City in China. J. Environ. Manag. 2019, 230, 474–487. [Google Scholar] [CrossRef]
  50. Jiang, L.; Wu, Y.; He, X.; Fu, Q.; Wang, Z.; Jiang, Q. Dynamic Simulation and Coupling Coordination Evaluation of Water Footprint Sustainability System in Heilongjiang Province, China: A Combined System Dynamics and Coupled Coordination Degree Model. J. Clean. Prod. 2022, 380, 135044. [Google Scholar] [CrossRef]
  51. Cui, Y.; Zhang, J.; Xie, X.; Zhou, L.; Wu, W.; Yang, L. Evaluation of Comprehensive Benefits and the Degree of Coupling Coordination for Soil Health Products: A Case Study in Weifang City, China. Sci. Rep. 2025, 15, 11089. [Google Scholar] [CrossRef]
  52. Shi, T.; Yang, S.; Zhang, W.; Zhou, Q. Coupling Coordination Degree Measurement and Spatiotemporal Heterogeneity Between Economic Development and Ecological Environment—Empirical Evidence from Tropical and Subtropical Regions of China. J. Clean. Prod. 2020, 244, 118739. [Google Scholar] [CrossRef]
  53. Wang, D.; Shen, Y.; Zhao, Y.; He, W.; Liu, X.; Qian, X.; Lv, T. Integrated Assessment and Obstacle Factor Diagnosis of China’s Scientific Coal Production Capacity Based on the PSR Sustainability Framework. Resour. Policy 2020, 68, 101794. [Google Scholar] [CrossRef]
  54. Chen, J.; Wang, S.; Han, Y.; Zhang, Y.; Li, Y.; Zhang, B.; Li, X.; Zhang, J. Geodetector Analysis of Individual and Joint Impacts of Natural and Human Factors on Maternal and Child Health at the Provincial Scale. Sci. Rep. 2024, 14, 1643. [Google Scholar] [CrossRef]
  55. Bai, L.; Jiang, L.; Yang, D.; Liu, Y. Quantifying the Spatial Heterogeneity Influences of Natural and Socioeconomic Factors and Their Interactions on Air Pollution Using the Geographical Detector Method: A Case Study of the Yangtze River Economic Belt, China. J. Clean. Prod. 2019, 232, 692–704. [Google Scholar] [CrossRef]
  56. Lin, J.; Chen, W.; Qi, X.; Hou, H. Risk Assessment and Its Influencing Factors Analysis of Geological Hazards in Typical Mountain Environment. J. Clean. Prod. 2021, 309, 127077. [Google Scholar] [CrossRef]
  57. Li, W.; Liang, Y.; Liu, L.; He, Q.; Huang, J.; Yin, Z. Spatio-Temporal Impacts of Land Use Change on Water-Energy-Food Nexus Carbon Emissions in China, 2011–2020. Environ. Impact Assess. Rev. 2024, 105, 107436. [Google Scholar] [CrossRef]
  58. Elagib, N.A.; Al-Saidi, M. Balancing the Benefits from the Water–Energy–Land–Food Nexus through Agroforestry in the Sahel. Sci. Total Environ. 2020, 742, 140509. [Google Scholar] [CrossRef] [PubMed]
  59. Li, Q.; Yang, L.; Jiang, F.; Liu, Y.; Guo, C.; Han, S. Distribution Characteristics, Regional Differences and Spatial Convergence of the Water-Energy-Land-Food Nexus: A Case Study of China. Land 2022, 11, 1543. [Google Scholar] [CrossRef]
  60. Zhang, Y.; Wang, Y. Evaluation and Prediction of Water-Energy-Food Nexus Under Land Use Changes in the Yellow River Basin, China. Sustain. Futures 2024, 8, 100307. [Google Scholar] [CrossRef]
  61. Yuan, Y.; Wei, S.; Wan, D.; Liu, D. A Study of Land-Economy-Society-Ecology Coordination in the Yangtze River Delta Based on Coupled Coordination Degree Model. Int. Rev. Econ. Financ. 2024, 95, 103474. [Google Scholar] [CrossRef]
  62. Gu, W.; Ma, G.; Wang, R.; Scherer, L.; He, P.; Xia, L.; Zhu, Y.; Bi, J.; Liu, B. Climate Adaptation Through Crop Migration Requires a Nexus Perspective for Environmental Sustainability in the North China Plain. Nat. Food 2024, 5, 569–580. [Google Scholar] [CrossRef] [PubMed]
  63. Psomas, A.; Vryzidis, I.; Spyridakos, A.; Mimikou, M. MCDA Approach for Agricultural Water Management in the Context of Water–Energy–Land–Food Nexus. Oper. Res. Int. J. 2021, 21, 689–723. [Google Scholar] [CrossRef]
  64. Mazurek, J.; Strzałka, D. On the Monte Carlo Weights in Multiple Criteria Decision Analysis. PLoS ONE 2022, 17, e0268950. [Google Scholar] [CrossRef]
  65. Wang, S.; Yang, R.; Shi, S.; Wang, A.; Liu, T.; Yang, J. Characteristics and Influencing Factors of the Spatial and Temporal Variability of the Coupled Water–Energy–Food Nexus in the Yellow River Basin in Henan Province. Sustainability 2023, 15, 13977. [Google Scholar] [CrossRef]
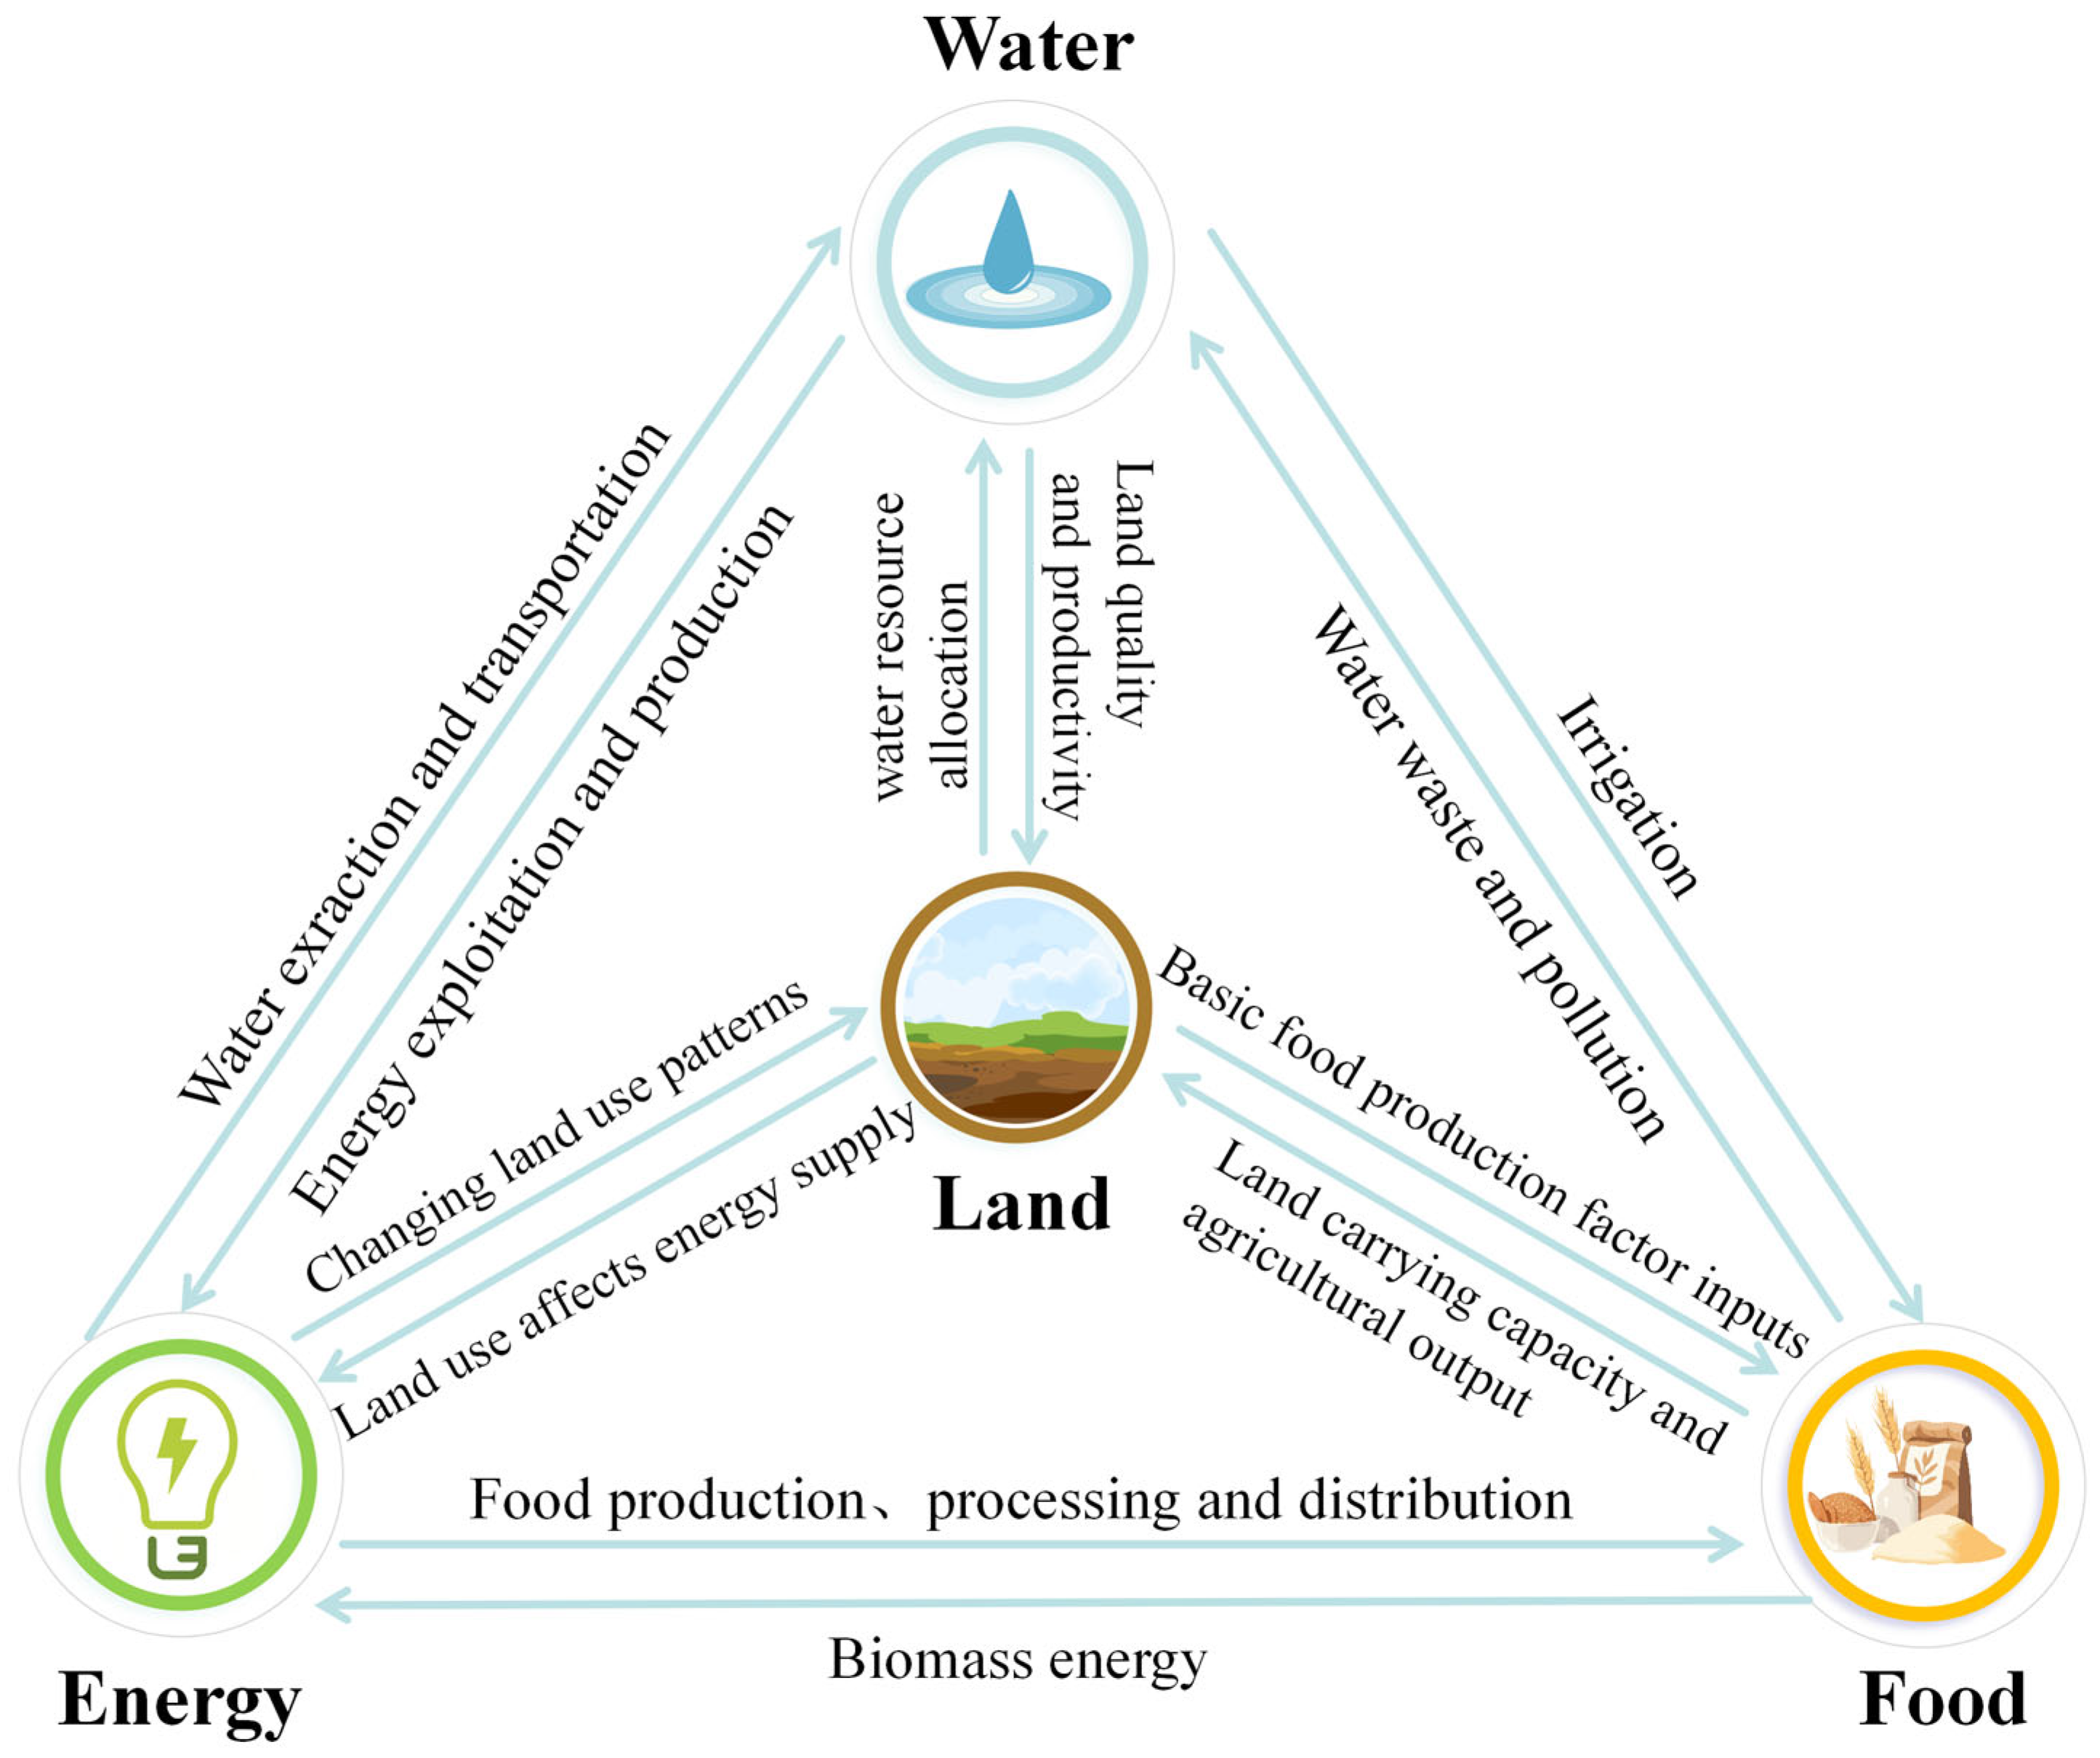
Figure 1. Mechanism of WLEF.
Land 14 01782 g001
Figure 2. Study area.
Land 14 01782 g002
Figure 3. Spatio-temporal dynamics of the comprehensive development level of the water, Land, energy, and food (WLEF) systems in the North China Plain: (a) Comprehensive development level of the WLEF system in the North China Plain in 2010, 2013, 2016, 2019, and 2022; (b) Changes in the comprehensive development level of the WLEF system across regions in the North China Plain from 2010 to 2022; (c) Regional variations in the comprehensive development levels of water, land, energy, and food systems in the North China Plain in 2010, 2016, and 2022.
Land 14 01782 g003
Figure 4. Spatiotemporal evolution characteristics of the coupling coordination degree within the WLEF system in the North China Plain: (ae) Spatial evolution of the coupling coordination level of the WLEF system across regions in the North China Plain from 2010 to 2022. (f) Line graph illustrating the coupling level of the WLEF system in the North China Plain over the period 2010–2022. (g) Line graph depicting the changes in the coupling coordination level of the WLEF system in the North China Plain during the same time frame.
Land 14 01782 g004
Figure 5. Key internal drivers affecting the coupled coordination development of water, land, energy, and food systems in the North China Plain between 2010 and 2022.
Land 14 01782 g005
Figure 6. The internal driving factors of the coupling coordination degree of the WLEF system in the North China Plain and its provincial administrative regions during the periods 2010–2016 and 2016–2022: (a) The evolution of internal obstacles affecting the coupling coordination level of the WLEF system in the North China Plain during the periods 2010–2016 and 2016–2022. (bh) The evolution of internal obstacles affecting the coupling coordination level of the WLEF system in Beijing, Tianjin, Hebei, Henan, Shandong, Anhui, and Jiangsu during the periods 2010–2016 and 2016–2022.
Land 14 01782 g006
Figure 7. Detection results of interaction factors influencing the coupling coordination degree of the WLEF system in the North China Plain in 2010, 2016, and 2022: (a) Detection results of interaction factors influencing the coupling coordination degree of the WLEF system in 2010. (b) Detection results of interaction factors influencing the coupling coordination degree of the WLEF system in 2016. (c) Detection results of interaction factors influencing the coupling coordination degree of the WLEF system in 2022.
Land 14 01782 g007
Table 1. Evaluation system of water-land-energy-food (WLEF) indicator in the north China plain (NCP).
SystemIndicatorsUnitsNatureWeight
Water
subsystem
Per capita water resources (W1)Total water resources/Total population (m3/cap)+0.60
Modulus of water production (W2)Total water resources/Total area (10,000
m3/km2)
+0.29
Proportion of industrial water consumption (W3)Industrial water use/Total water use (%)0.01
Proportion of agricultural water consumption (W4)Agricultural water use/Total water use (%)0.08
Per capita water consumption (W5)Total water use/Total population (m3/cap)0.02
Land
subsystem
Per capita construction land area (L1)Total population/Total construction area (ha/cap)+0.69
Per capita cultivated land area of rural households (L2)Cultivated land/Rural population (ha/cap)+0.18
Density of population (L3)Total population/Total area (cap/ha)0.08
Green coverage rate of built-up area (L4)Statistical data (%)+0.04
Discharge of industrial wastewater per area (L5)Total industrial wastewater discharge/Total area (10,000 tons/km2)0.01
Energy
subsystem
Industrial SO2 emissions (E1)Statistical data (10,000 t)0.06
Per capita Energy consumption (E2)Total energy consumption/Total population (tons of SC/cap)0.21
Total electricity use (E3)Statistical data (10,000 KW)0.15
Total power of agricultural machinery (E4)Statistical data (10,000 KW)0.34
Ratio of industrial solid wastes treated and utilized (E5)Statistical data (%)+0.25
Food
subsystem
Output of grain (F1)Statistical data (10,000 t)+0.34
Grain sown area (F2)Statistical data (1000 ha)+0.33
Intensity of pesticide and fertilizer application (F3)Application amount of agricultural pesticide and fertilizer/sowing area of main crops (t/ha)0.02
Effective irrigated area (F4)Statistical data (1000 ha)+0.27
Engel coefficient (F5)Statistical data (%)0.05
Table 2. Key influencing factors on the coupling coordination level of the WLEF system.
Impact FactorIndicators NameDescription of Indicators
X1GDP per capitaAs a key measure of economic development, per capita GDP impacts the WLEF system by shaping patterns of capital distribution and the level of technological investment.
X2Value Added of the Primary IndustryAs a crucial indicator reflecting the economic contribution of agricultural production, the value-added of the primary industry generates both positive driving effects and potential pressures on the WLEF system.
X3Urbanization levelUrbanization drives the evolution of the WLEF system by fostering population concentration and increasing land use competition.
X4Total regional populationPopulation size reflects regional demand and impacts the WLEF system’s overall carrying capacity.
X5Rural disposable income per capitaFluctuations in income influence farmers’ decision-making processes, thereby affecting the agricultural production system. The role of rural households in shaping the WLEF system should be examined from an individual-level perspective.
Table 3. Findings on influencing factors in 2010, 2016, and 2022.
Impact Factor2010 2016 2022
q-valuerankq-valuerankq-valuerank
X10.32810.23310.2222
X20.02340.06230.1193
X30.28320.21310.3601
X40.05740.09630.2032
X50.12330.14020.3091
Disclaimer/Publisher’s Note: The statements, opinions and data contained in all publications are solely those of the individual author(s) and contributor(s) and not of MDPI and/or the editor(s). MDPI and/or the editor(s) disclaim responsibility for any injury to people or property resulting from any ideas, methods, instructions or products referred to in the content.