Article

Research on the Spatiotemporal Evolution Characteristics and Driving Factors of Cropland in Tanzania from 1990 to 2020

1
Social Development Research Center, Zhengzhou University of Light Industry, Zhengzhou 450001, China
2
School of Computer Science and Technology, Zhengzhou University of Light Industry, Zhengzhou 450001, China
3
Henan International Joint Laboratory of Computer Animation Implementation Technologies, Zhengzhou University of Light Industry, Zhengzhou 450001, China
*
Authors to whom correspondence should be addressed.
Land 2025, 14(9), 1771; https://doi.org/10.3390/land14091771
Submission received: 28 July 2025 / Revised: 24 August 2025 / Accepted: 29 August 2025 / Published: 31 August 2025
(This article belongs to the Section Land Socio-Economic and Political Issues)

Abstract

Understanding the spatiotemporal dynamics of croplands is crucial for guiding agricultural transformation, food security, and sustainable land use in Africa. This study employs 30 m resolution land cover data and multi-source datasets to examine the spatiotemporal changes in rainfed and irrigated cropland and their driving factors in Tanzania from 1990 to 2020 through multiple GIS spatial analysis methods. The results indicate a net increase in Tanzania’s total cropland area, primarily driven by the expansion of irrigated cropland that has offset the volatile decline of rainfed cropland. From 1990 to 2000, rainfed cropland showed intense bidirectional conversion with shrubland and forest; thereafter, the scale of this conversion continued to decrease. In contrast, irrigated cropland expansion exhibited phased fluctuations. Spatially, rainfed cropland dominates the central, lake, and western zones, while irrigated cropland is predominantly concentrated in the western and southern highland. Hotspots of rainfed cropland shifted from extensive expansion in the central and western zones during the 1990s to localized growth in mountainous areas by the 2010s. Concurrently, irrigated cropland hotspots evolved from a lakeside-concentrated pattern to contiguous development in the central and western zones. Both cropland types exhibit a northwest–southeast spatial orientation. The center of rainfed cropland shifted northwest before moving southeast, while that of irrigated cropland migrated southeastward and then stabilized. Rainfall is a key determinant of rainfed cropland distribution, whereas river network and road network density exert a growing influence on irrigated cropland.

1. Introduction

Africa is a critical region for global agricultural development, as agriculture significantly contributes to its economic growth, employment, and food security [1]. By 2050, Africa’s population is projected to double, which will place unprecedented pressure on agricultural land and food production systems [2]. This pressure will be further intensified by rapid urbanization, climate change, and shifting land use patterns—all of which drive cropland transformation [3]. For sustainable development in the region, understanding cropland dynamics has thus become a core issue. Tanzania, as an agrarian economy in East Africa, relies heavily on agriculture: the sector accounts for over 25% of its Gross Domestic Product (GDP) and employs more than 60% of the population. The country’s cropland, including rainfed and irrigated cropland, serves as the foundation of food production and rural livelihoods.
Amid accelerating climate change, population growth, and urbanization, understanding the spatiotemporal dynamics of cropland and their underlying drivers is critical for sustainable land management, especially in agricultural countries in sub-Saharan Africa. Previous research on cropland changes across different countries and regions has explored patterns, processes, and mechanisms from multiple perspectives, including land use transformation, food security, and human–environment interactions [4,5,6]. With advancements in Remote Sensing (RS), Geographic Information System (GIS), and big data analytics, high-resolution, long-term cropland datasets have become increasingly accessible. These datasets enable more precise quantification of cropland extent, quality, and transformation trajectories, providing a solid foundation for addressing regional food security challenges and promoting sustainable agricultural development [7,8,9]. Relevant research can be categorized into three main themes.
Spatial distribution patterns of cropland: Research on cropland spatial patterns focuses on characterizing the geographic distribution of cropland across landscapes, aiming to reveal its associations with natural conditions and human activities [10,11]. Scholars typically use high-resolution RS imagery and spatial statistical models to map cropland distribution and analyze its aggregation, fragmentation, and zonation [12,13,14]. For instance, studies in East Africa have identified that cropland in the region is predominantly concentrated in low-elevation plains with fertile soils and sufficient rainfall, such as the Lake Victoria basin [15]. In contrast, cropland in arid and semi-arid regions tends to be scattered, as it is limited by water availability [16]. These studies not only clarify the basic geographic attributes of cropland but also provide essential data for optimizing agricultural layout, conserving arable land, and mitigating land degradation. Additionally, research has explored cropland classification and their distinct spatial characteristics [17,18], highlighting the diversity of agricultural systems under different socioeconomic contexts.
Spatiotemporal evolution of cropland: Based on long-term time-series data, numerous studies have examined the temporal and spatial dynamics of cropland, including its expansion, contraction, and conversion to other land uses [19,20,21]. These studies often employ methods such as land use transfer matrices, trend analysis, and landscape metrics to quantify changes in cropland area, fragmentation, and connectivity over time [22,23]. For example, research in sub-Saharan Africa has shown that cropland expansion has accelerated since the 1990s. This expansion is primarily driven by population growth and the need to meet food demand, with significant spatial variability: in humid regions, cropland has expanded at the expense of forests; in semi-arid regions, cropland contraction is prevalent due to desertification and soil degradation [24,25]. In Tanzania specifically, preliminary studies indicate that cropland has expanded in the southern highlands and along the Rufiji River basin (partly replacing natural vegetation), while in peri-urban areas, cropland has been encroached upon by urban sprawl [26,27]. By comparing cropland changes across different periods, researchers have also evaluated the impacts of specific events or policies—such as agricultural reforms, droughts, or international food price fluctuations—on cropland dynamics [28,29]. These evaluations provide insights into the resilience of agricultural systems in the face of external shocks.
Drivers of cropland changes: Identifying the factors influencing cropland dynamics is a core focus of land system research, involving both natural and socioeconomic drivers. Scholars have employed statistical methods such as multiple regression, geographically weighted regression, and geographic detectors to disentangle the relative contributions of these factors [30,31,32]. Natural factors, including rainfall variability, temperature changes, and soil fertility, are critical for determining cropland suitability and productivity. For example, prolonged droughts in East Africa have been shown to reduce cropland productivity, driving farmers to clear new lands in more humid areas [33,34]. Socioeconomic factors, however, often play a more dominant role in cropland transformation. Population growth, for instance, increases demand for food and livelihoods, often leading to cropland expansion [35,36]. Urbanization and infrastructure development also contribute to cropland loss, as peri-urban areas are frequently converted to residential or industrial use [37,38]. Additionally, policies such as land tenure systems, agricultural subsidies, and international investment in large-scale commercial farming have significant impacts on cropland dynamics, with varying effects across regions [39,40]. In Tanzania, for example, the liberalization of agricultural markets in the 1990s promoted the expansion of cash crop cultivation, altering traditional cropland patterns [41,42].
Despite these advancements, research on cropland dynamics in sub-Saharan Africa—particularly in Tanzania—remains limited in three key respects. First, long-term, high-resolution studies covering the entire country are scarce; most focus on specific regions rather than national-scale patterns, which hinders a comprehensive understanding of national cropland trends. Second, existing research often emphasizes single drivers while neglecting the complex interactions between natural and socioeconomic factors, making it difficult to fully explain cropland change mechanisms. Third, historical analyses have mapped broad land cover changes but failed to disentangle rainfed versus irrigated cropland dynamics, overlooking critical distinctions between these two agricultural systems (e.g., their differing reliance on water resources and vulnerability to climate change). As an agricultural country, Tanzania needs to ensure its food security and sustainable land use amidst global change. This requires a systematic exploration of the spatiotemporal evolution of its rainfed and irrigated cropland and the identification of key drivers.
More specifically, Tanzania was selected as the study area for three key reasons. First, agricultural significance: Agriculture is the backbone of Tanzania’s economy. The country’s reliance on both rainfed and irrigated cropland makes it a representative case for studying cropland dynamics in sub-Saharan Africa [43]. Second, geographical and climatic diversity: Tanzania spans diverse landscapes, from the arid central plateau to the fertile lake basins and humid southern highlands [44]. This diversity leads to distinct cropland patterns, providing a comprehensive context for analyzing regional disparities in cropland change. Third, policy relevance: Tanzania has implemented major agricultural policies since the 1990s that have directly influenced cropland changes [45]. Studying these dynamics can inform policy adjustments to support sustainable agriculture.
Given the above background, this study focuses on investigating the spatiotemporal dynamics of rainfed and irrigated cropland from 1990 to 2020 in Tanzania and their driving factors. Specifically, the study aims to achieve the following: (1) analyze the spatiotemporal evolution of rainfed and irrigated cropland in Tanzania, including changes in area, conversion patterns, and regional differences; (2) identify hotspots and directional trends of cropland change using spatial statistical methods; (3) disentangle the relative impacts of natural factors and socioeconomic factors on cropland dynamics; and (4) provide scientific support for agricultural planning, irrigation infrastructure development, and food security strategies in Tanzania. This study will contribute to a deeper understanding of cropland transformation in East Africa and will fill the gap in long-term, high-resolution research on rainfed and irrigated cropland differentiation.

2. Materials and Methods

2.1. Overview of the Study Area

Tanzania is located in East Africa, south of the equator, at latitude 0°29′–11.44° S and longitude 29.14°–40.30° E. It consists of two parts: Tanganyika (mainland) and Zanzibar (island), with a total territory of 945,000 km2. It borders Kenya and Uganda in the north; Zambia, Malawi, and Mozambique in the south; Rwanda, Burundi, and the Democratic Republic of the Congo in the west; and the Indian Ocean in the east. Tanzania is divided into 31 Regions, including 26 on the mainland and 5 in Zanzibar. There are currently 195 districts in the country. The national capital is Dodoma City. According to the geographical environment, Tanzania can be divided into seven zones, namely, the eastern zone, northern zone, lake zone, western zone, central zone, southern highlands zone, and southern zone (Figure 1).

2.2. Data Source and Processing

The data used in the research are shown in Table 1. The land cover data is sourced from a global 30 m fine surface cover product, which is produced by the Aerospace Information Research Institute, Chinese Academy of Sciences [46]. It divides global land cover into 29 types, including rainfed cropland, irrigated cropland, and impervious surfaces. According to the research contents and attributes of these land cover types, they are reclassified into 11 categories: rainfed cropland, irrigated cropland, grassland, forest, shrubland, wetland, water body, moss, impervious surfaces, bare land, and permanent ice and snow. Moss and permanent ice and snow cover a relatively small area, which is not listed in the subsequent analysis.
The rainfall and temperature data are sourced from the World Bank Climate Change Knowledge Portal. The soil type data is sourced from the International Livestock Research Institute. The elevation data is sourced from SRTM (Shuttle Radar Topography Mission), and slope and relief amplitude are calculated based on it. The river and road network data are sourced from the OpenStreetMap, and river and road network density are calculated, respectively. The population and GDP data are sourced from the GHSL (Global Human Settlement Layer) and Scientific Data website, respectively. The above raster data has been processed through seamless stitching, cropping, and unified projection.
The administrative division data and socioeconomic statistics data are sourced from the Tanzania National Bureau of Statistics.

2.3. Research Method

2.3.1. Land Use Transfer Matrix

The land use transfer matrix is a quantitative tool that describes the conversion relationships between different land use types over a specific period. It uses a matrix form to represent the area of one land type converted to another, reflecting the direction, intensity, and temporal characteristics of land use changes [47]. The land use transfer matrix was constructed using land cover data from 1990 to 2020 and calculated via ArcGIS 10.8 with post-processing in Microsoft Excel 2019 to extract key conversion pathways. It quantifies the scale of mutual conversion, identifies key source and sink land types for cropland changes, and reveals the stage-specific dynamics of cropland expansion or contraction.

2.3.2. Hotspot Analysis

Hotspot analysis is a spatial statistical method that identifies areas with significant clustering of high-value (hotspots) or low-value (coldspots) changes in a geographic phenomenon. It typically uses the Getis-Ord Gi* statistic to measure the spatial agglomeration degree of attribute values, enabling the detection of spatial heterogeneity in change intensity. The asterisk (*) in this statistic indicates that it is a z-score-based measure that incorporates spatial autocorrelation, distinguishing it from other variants of the Getis-Ord statistic. The reliability of the results is verified by statistical significance tests (such as z-score and p-value). According to the z-score and p-value of the element, it can be divided into three types of results. If the z-score of the element is high and the p-value is small, it indicates the existence of high-value spatial clustering; if the z-score of the element is a low negative value and the p-value is small, it indicates the existence of low-value spatial clustering; if the z-score is close to zero, it indicates that there is no obvious spatial clustering [48]. Hotspot analysis was conducted in ArcGIS 10.8 by using the “Hotspot Analysis” tool to locate spatial agglomerations of rainfed and irrigated cropland expansion in Tanzania from 1990 to 2020.

2.3.3. Standard Deviation Ellipse Analysis

The standard deviation ellipse (SDE) analysis is a method by which to characterize the spatial distribution pattern of geographic elements. It uses parameters such as the center, azimuth, semi-major axis, semi-minor axis, and oblateness of the ellipse to reflect the central tendency, directional trend, and spatial concentration of the elements. The center of the ellipse represents the center position of the whole data. The azimuth represents the included angle formed by clockwise rotation from the true north direction to the long axis of the ellipse. The semi-major axis represents the direction of data distribution. The semi-minor axis represents the range of data distribution. The greater the difference between the values of the major and minor axes, the greater of the oblateness, and the more obvious the directionality of the data. A smaller ellipse area indicates higher spatial concentration [49]. SDE parameters were computed using the “Directional Distribution” tool in ArcGIS 10.8, with annual cropland data as input, to explore the spatial distribution orientation, central movement, and concentration changes of rainfed and irrigated cropland in Tanzania from 1990 to 2020.

2.3.4. Geographic Detector

The geographic detector is a statistical method used to identify the driving factors behind the spatial differentiation of geographic phenomena. Its basic idea is as follows: suppose the study area is divided into several sub-regions; if the sum of the variance of sub-regions is less than the total variance of regions, there is spatial heterogeneity. It calculates the q-statistic to measure the explanatory power of influencing factors on the spatial pattern of the target variable, with a range of values of [0, 1]. The larger the value, the stronger the explanatory power [50]. The geographic detector was performed in Geodetector software in Excel to quantify the impacts of natural factors and socioeconomic factors on the spatial distribution of rainfed and irrigated cropland. The former includes rainfall, temperature, soil type, elevation, slope, relief amplitude, and river network density. The latter includes population density, GDP density, road network density, and sub-regional types (which are divided into cities, municipalities, counties, and towns).

3. Results

3.1. Overall Situation of Cropland Changes

3.1.1. Changes in Cropland Area

The land cover types and areas in Tanzania from 1990 to 2020 are shown in Table 2. From the results, it can be seen that from 1990 to 2020 the area of various land cover types in Tanzania showed different trends of change. Among them, the areas of irrigated cropland, grassland, wetland, impervious surfaces, and bare land are all showing an increasing trend. The water body area is showing a decreasing trend. The areas of rainfed cropland, forest, and shrubland have fluctuated, with an overall decrease in rainfed cropland and forest area, and an increase in shrubland area.
Among the land types with increased area, irrigated cropland has grown the most, with an increase in area of about 16.3 times over the past 30 years. The area of impervious surfaces has also increased substantially, with a high growth rate. Among the land types with reduced area, the forest area decreased obviously from 1990 to 2000, slightly rebounded from 2000 to 2010, and then decreased again from 2010 to 2020, showing an overall decreasing trend. Overall, the cropland area has increased over the past 30 years, mainly due to the increase in irrigated cropland, offsetting the decrease in rainfed cropland. The area of rainfed cropland has long been much higher than that of irrigated cropland, but this gap has been gradually narrowing over time.

3.1.2. Transformation of Cropland

The land use transfer matrix in Tanzania from 1990 to 2020 was calculated. From the results (Table 3 and Table 4), it can be seen that the mutual transformation between rainfed and irrigated cropland and other land types shows a decreasing scale, but fluctuating stage characteristics overall. In comparison, changes in rainfed cropland tend to slow down, while changes in irrigated cropland are more unstable.
Specifically, the transformation of rainfed cropland is mainly manifested by strong interactions with shrubland and forest. From 1990 to 2000, the area of rainfed cropland transferred out was 62,693.01 km2, and the area transferred in was 70,999.03 km2, indicating an evident net increase. However, with the passage of time, the intensity of transformation sharply weakened: from 2000 to 2010, the area of rainfed cropland transferred out and in decreased apparently, and it further decreased from 2010 to 2020. The overall trend shows that the conversion scales between rainfed cropland and other land use types have reduced.
The transformation of irrigated cropland is closely related to rainfed cropland and shrubland. From 1990 to 2000, irrigated cropland had a much larger transfer in area (14,807.38 km2) than transfer out area (932.36 km2). However, from 2000 to 2010, there was a marked decrease in both inflows (2543.63 km2) and outflows (168.59 km2). From 2010 to 2020, there was a partial rebound in the inflow (3405.12 km2), but there was an increase in the conversion to grassland and wetland during the outflow. The overall trend indicates that the area of irrigated cropland continues to increase, but the scale of growth fluctuates.
From the above analysis, it can be seen that forest and shrubland are the main sources and sinks for the conversion of rainfed and irrigated cropland. After large-scale cultivation from 1990 to 2000, the scale of conversion shrank, but it remained the core area of land type change. The area of rainfed cropland converted to impervious surfaces has distinctly increased since 2000 (from 77.68 km2 in 2000 to 279.04 km2 in 2010). The area of irrigated cropland transferred has rebounded since 2010, and the sources are diversified.

3.2. Distribution and Spatiotemporal Evolution of Cropland

3.2.1. Overall Distribution of Cropland

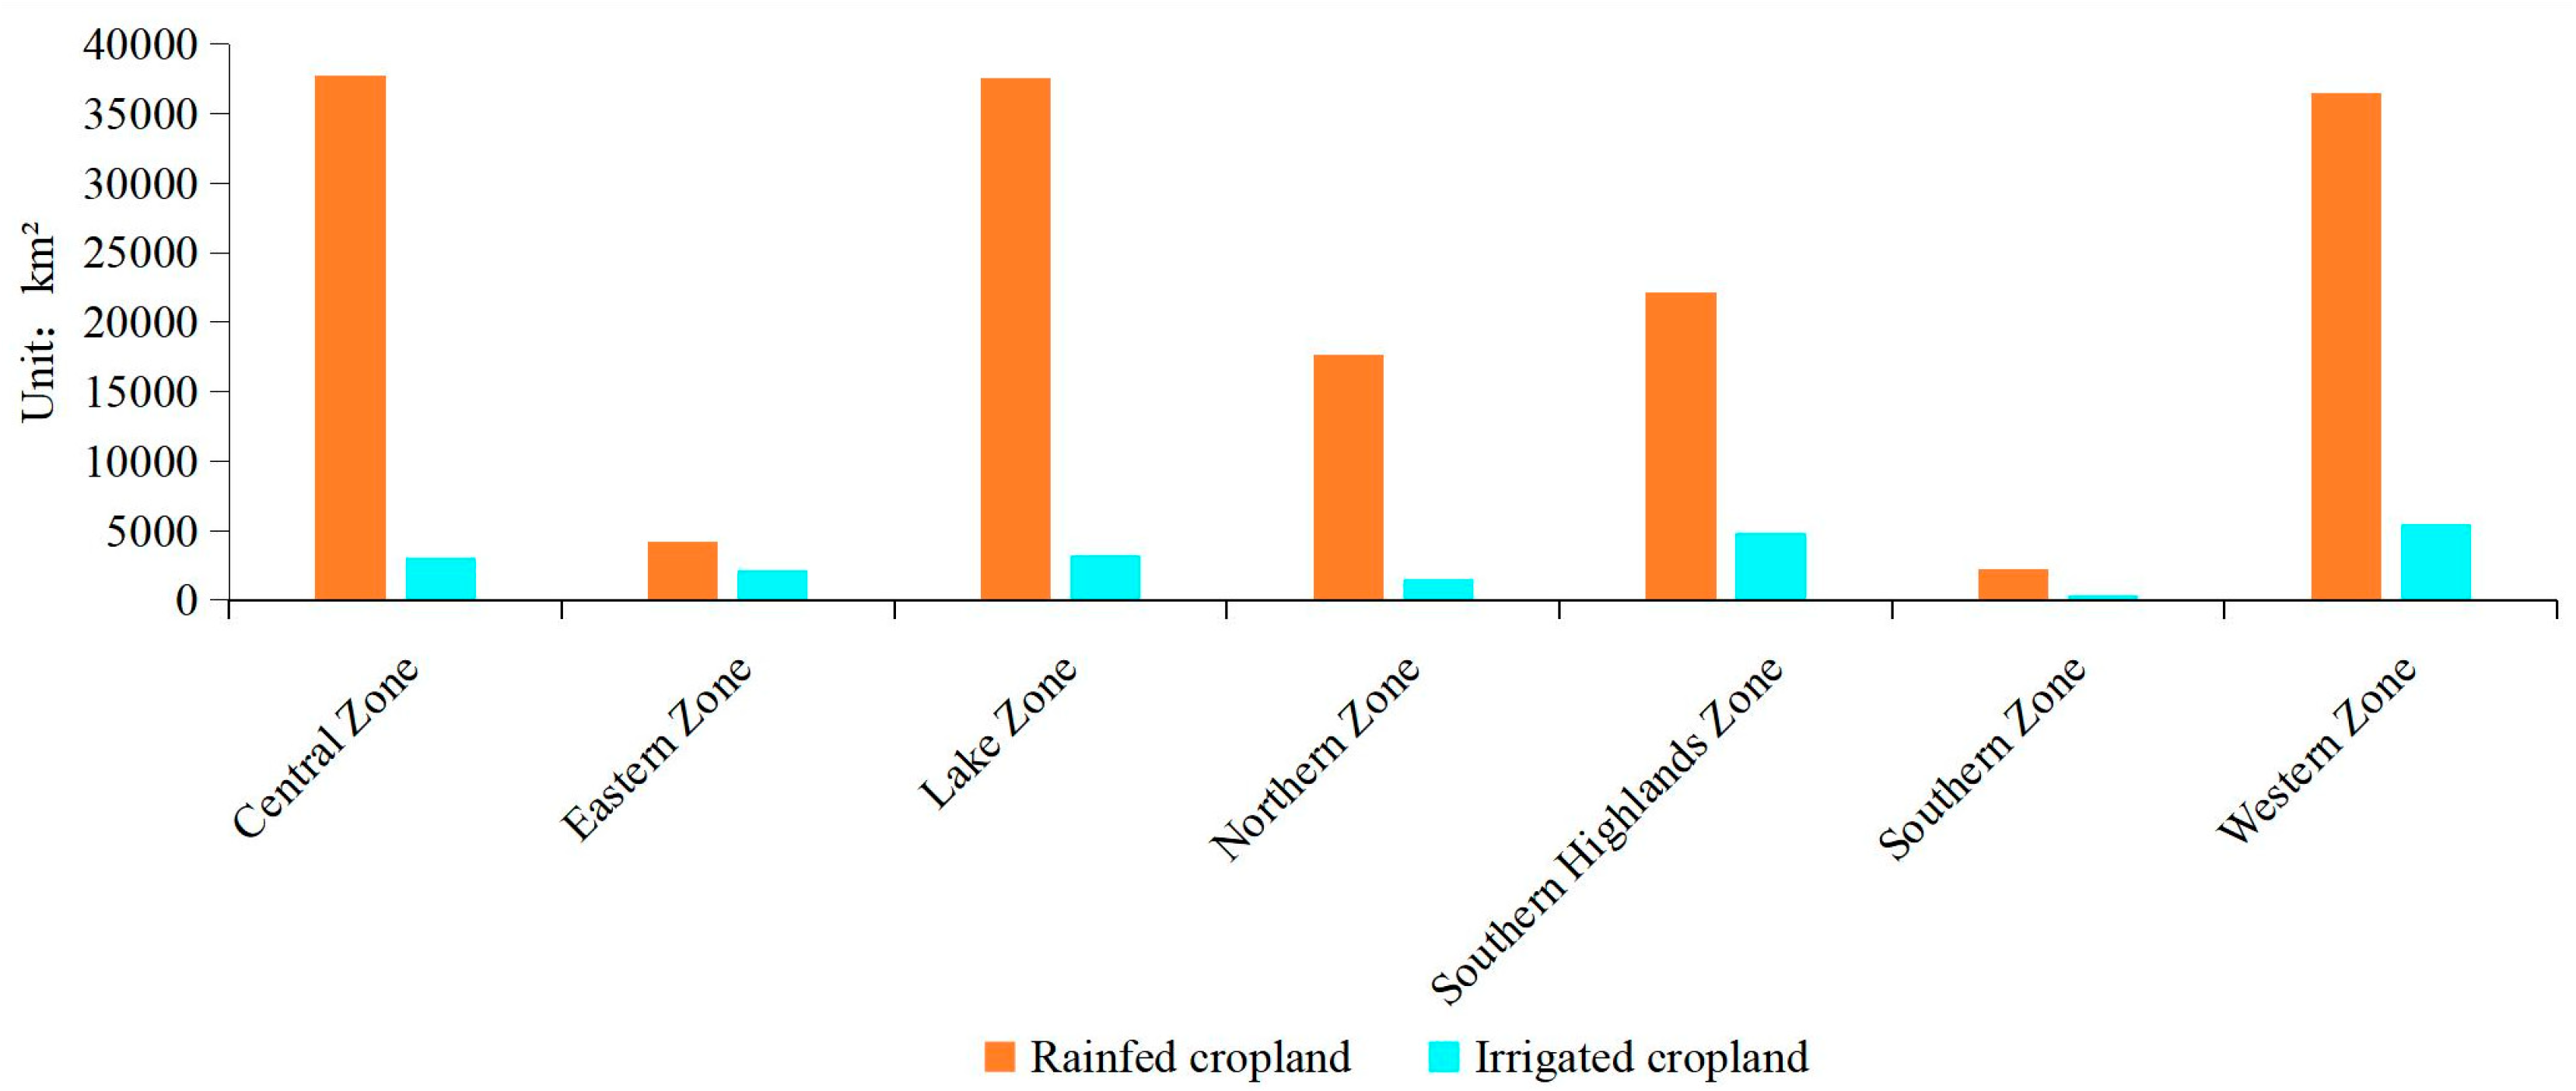
The spatial distribution of cropland and the area of cropland in the seven zones of Tanzania are shown in Figure 2 and Figure 3, respectively. According to the results of 2020, there are significant regional differences in the distribution of cropland in Tanzania, with significant variations in the proportion and total amount of rainfed and irrigated cropland in different regions. The rainfed cropland shows significant regional concentration, and is highly concentrated in the central and western inland regions and along the lake areas. The central, lake, and western zones are the three largest zones in terms of rainfed cropland area, accounting for the absolute majority of rainfed cropland in the country. Among them, the central zone has the largest rainfed cropland area, mainly from the Dodoma and Singida regions; the lake zone follows closely behind, with regions such as Mara, Geita, and Mwanza having large areas of rainfed cropland distribution; and the western zone ranks third, with the Tabora region contributing the most, accounting for 71.27% of the total rainfed cropland area in the zone. In contrast, the eastern zone and southern zone have the smallest rainfed cropland area, especially in coastal and island regions such as Dar es Salaam and Kaskazini Pemba.
The distribution of irrigated cropland is different from that of rainfed cropland, with relatively low regional concentration. The western zone still dominates, with an area of 5452.19 km2, with the Shinyanga and Tabora regions contributing over 97% in total. The southern highlands zone is the second largest, with a total irrigated cropland area of 4805.24 km2, and Mbeya is the core region with irrigated cropland distribution in this zone. In addition, regions such as Morogoro in the eastern zone and Simiyu in the lake zone also have a significant distribution of irrigated cropland. The regions with the smallest irrigated cropland area are mainly coastal regions and regions in Zanzibar.

3.2.2. Hotspot Analysis of Cropland Changes

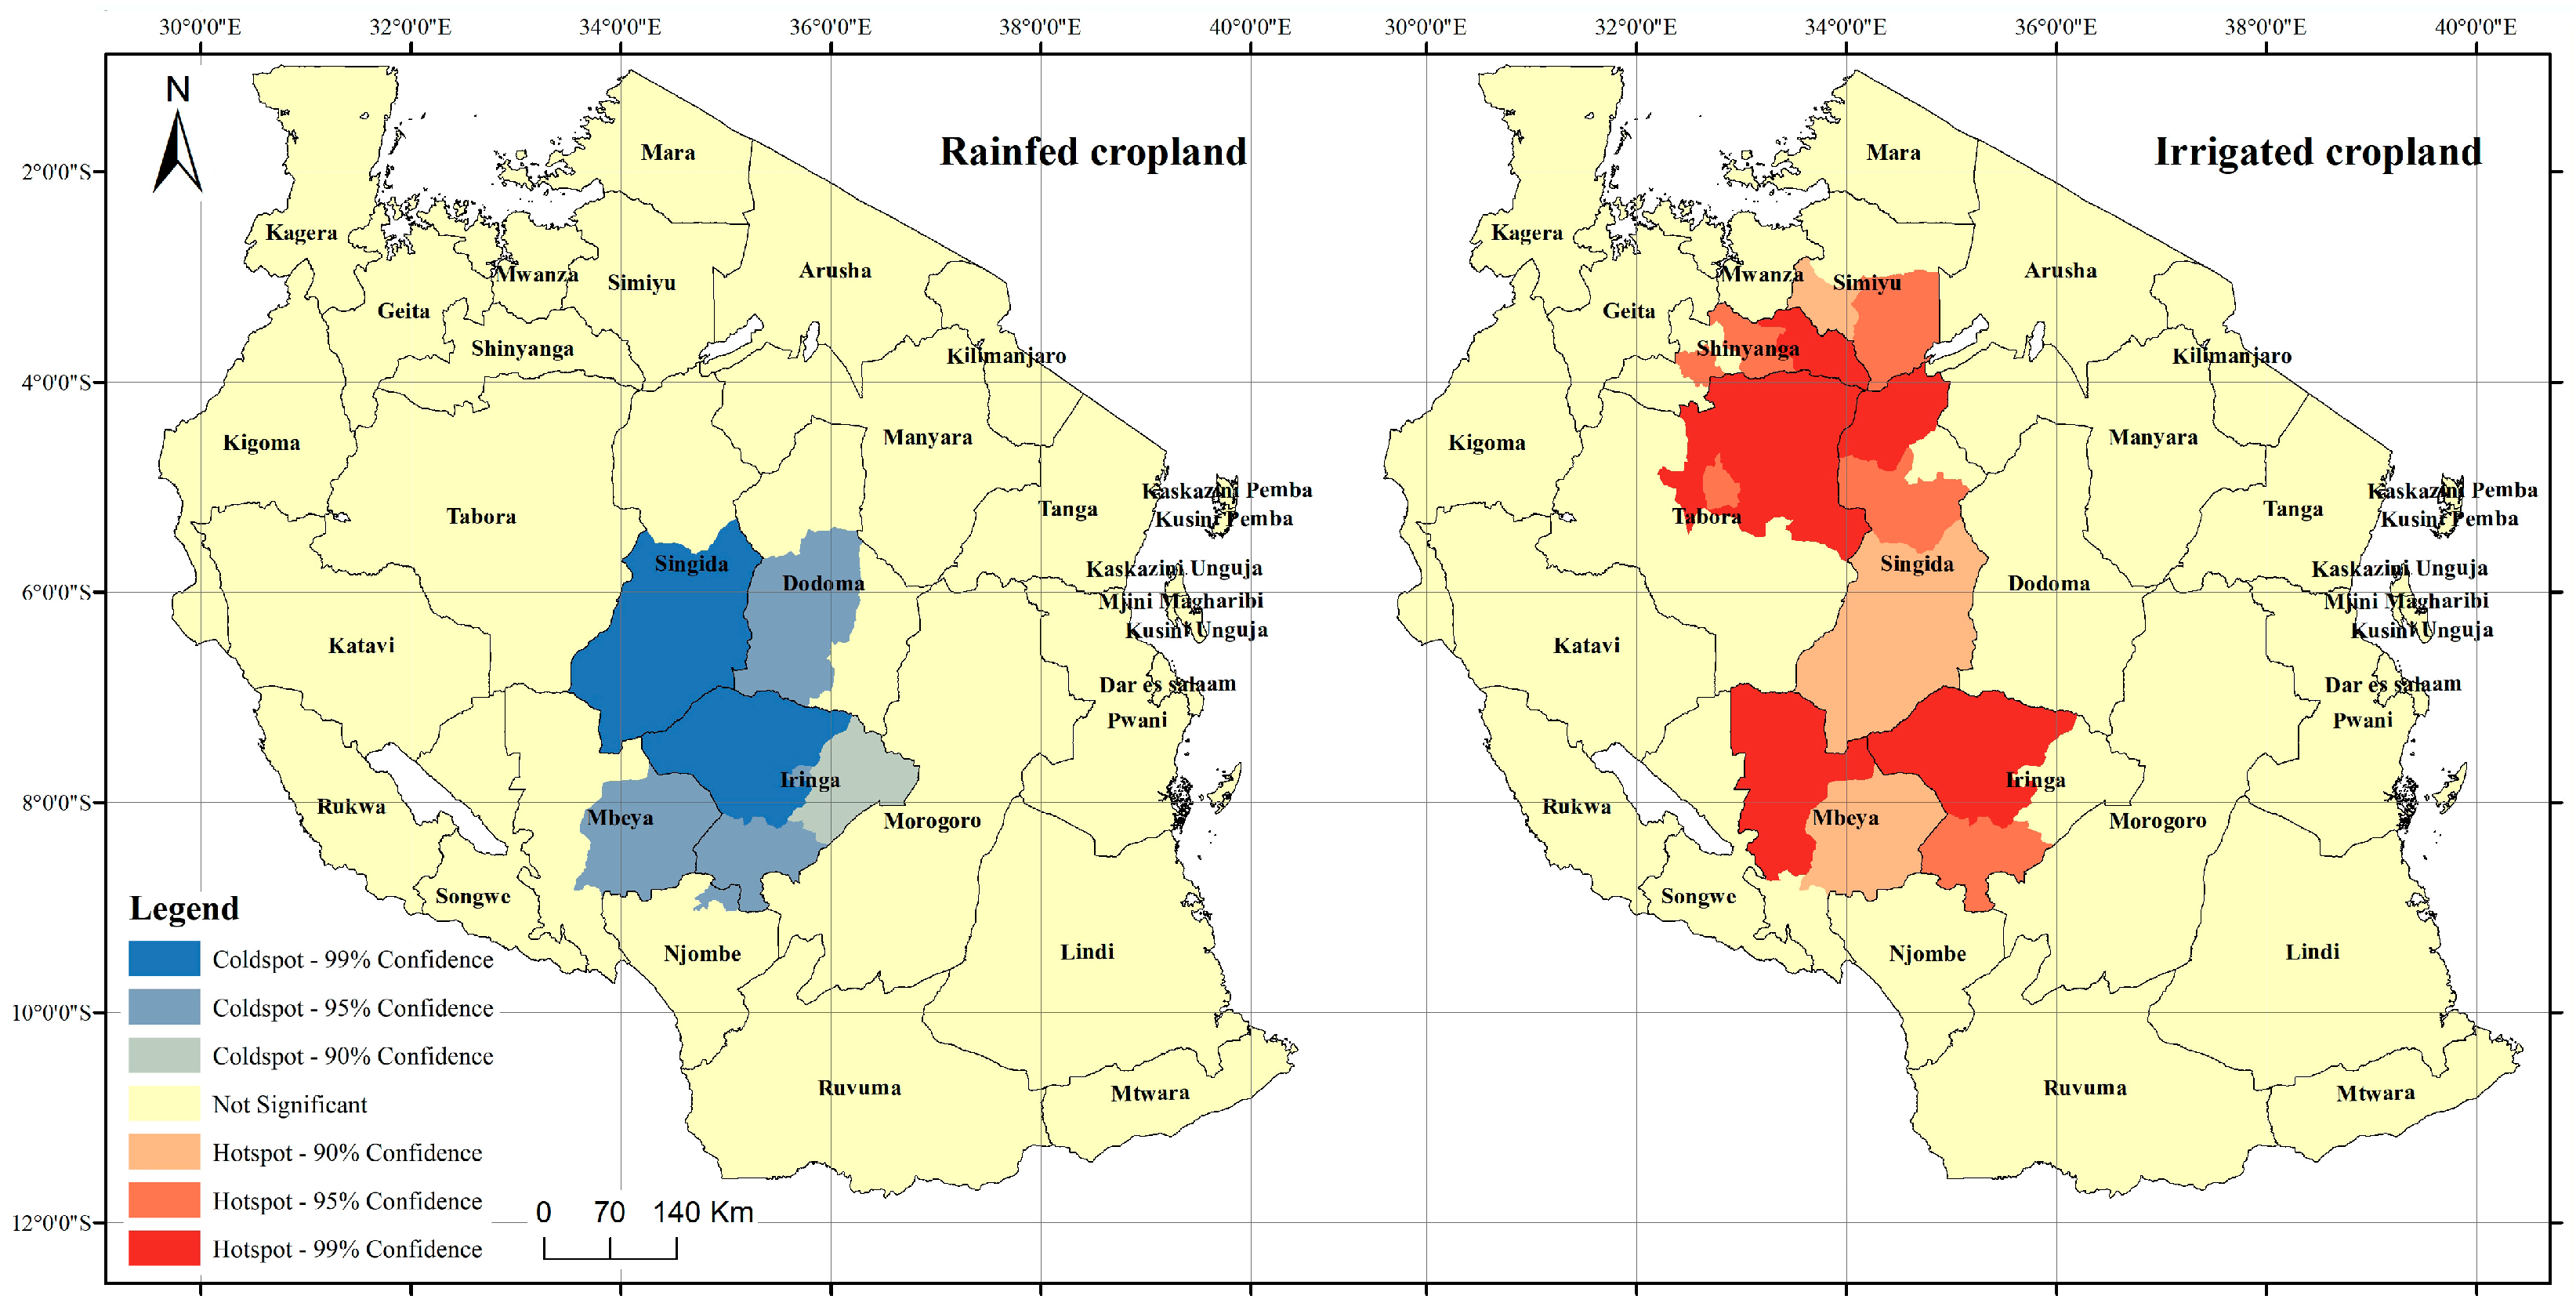
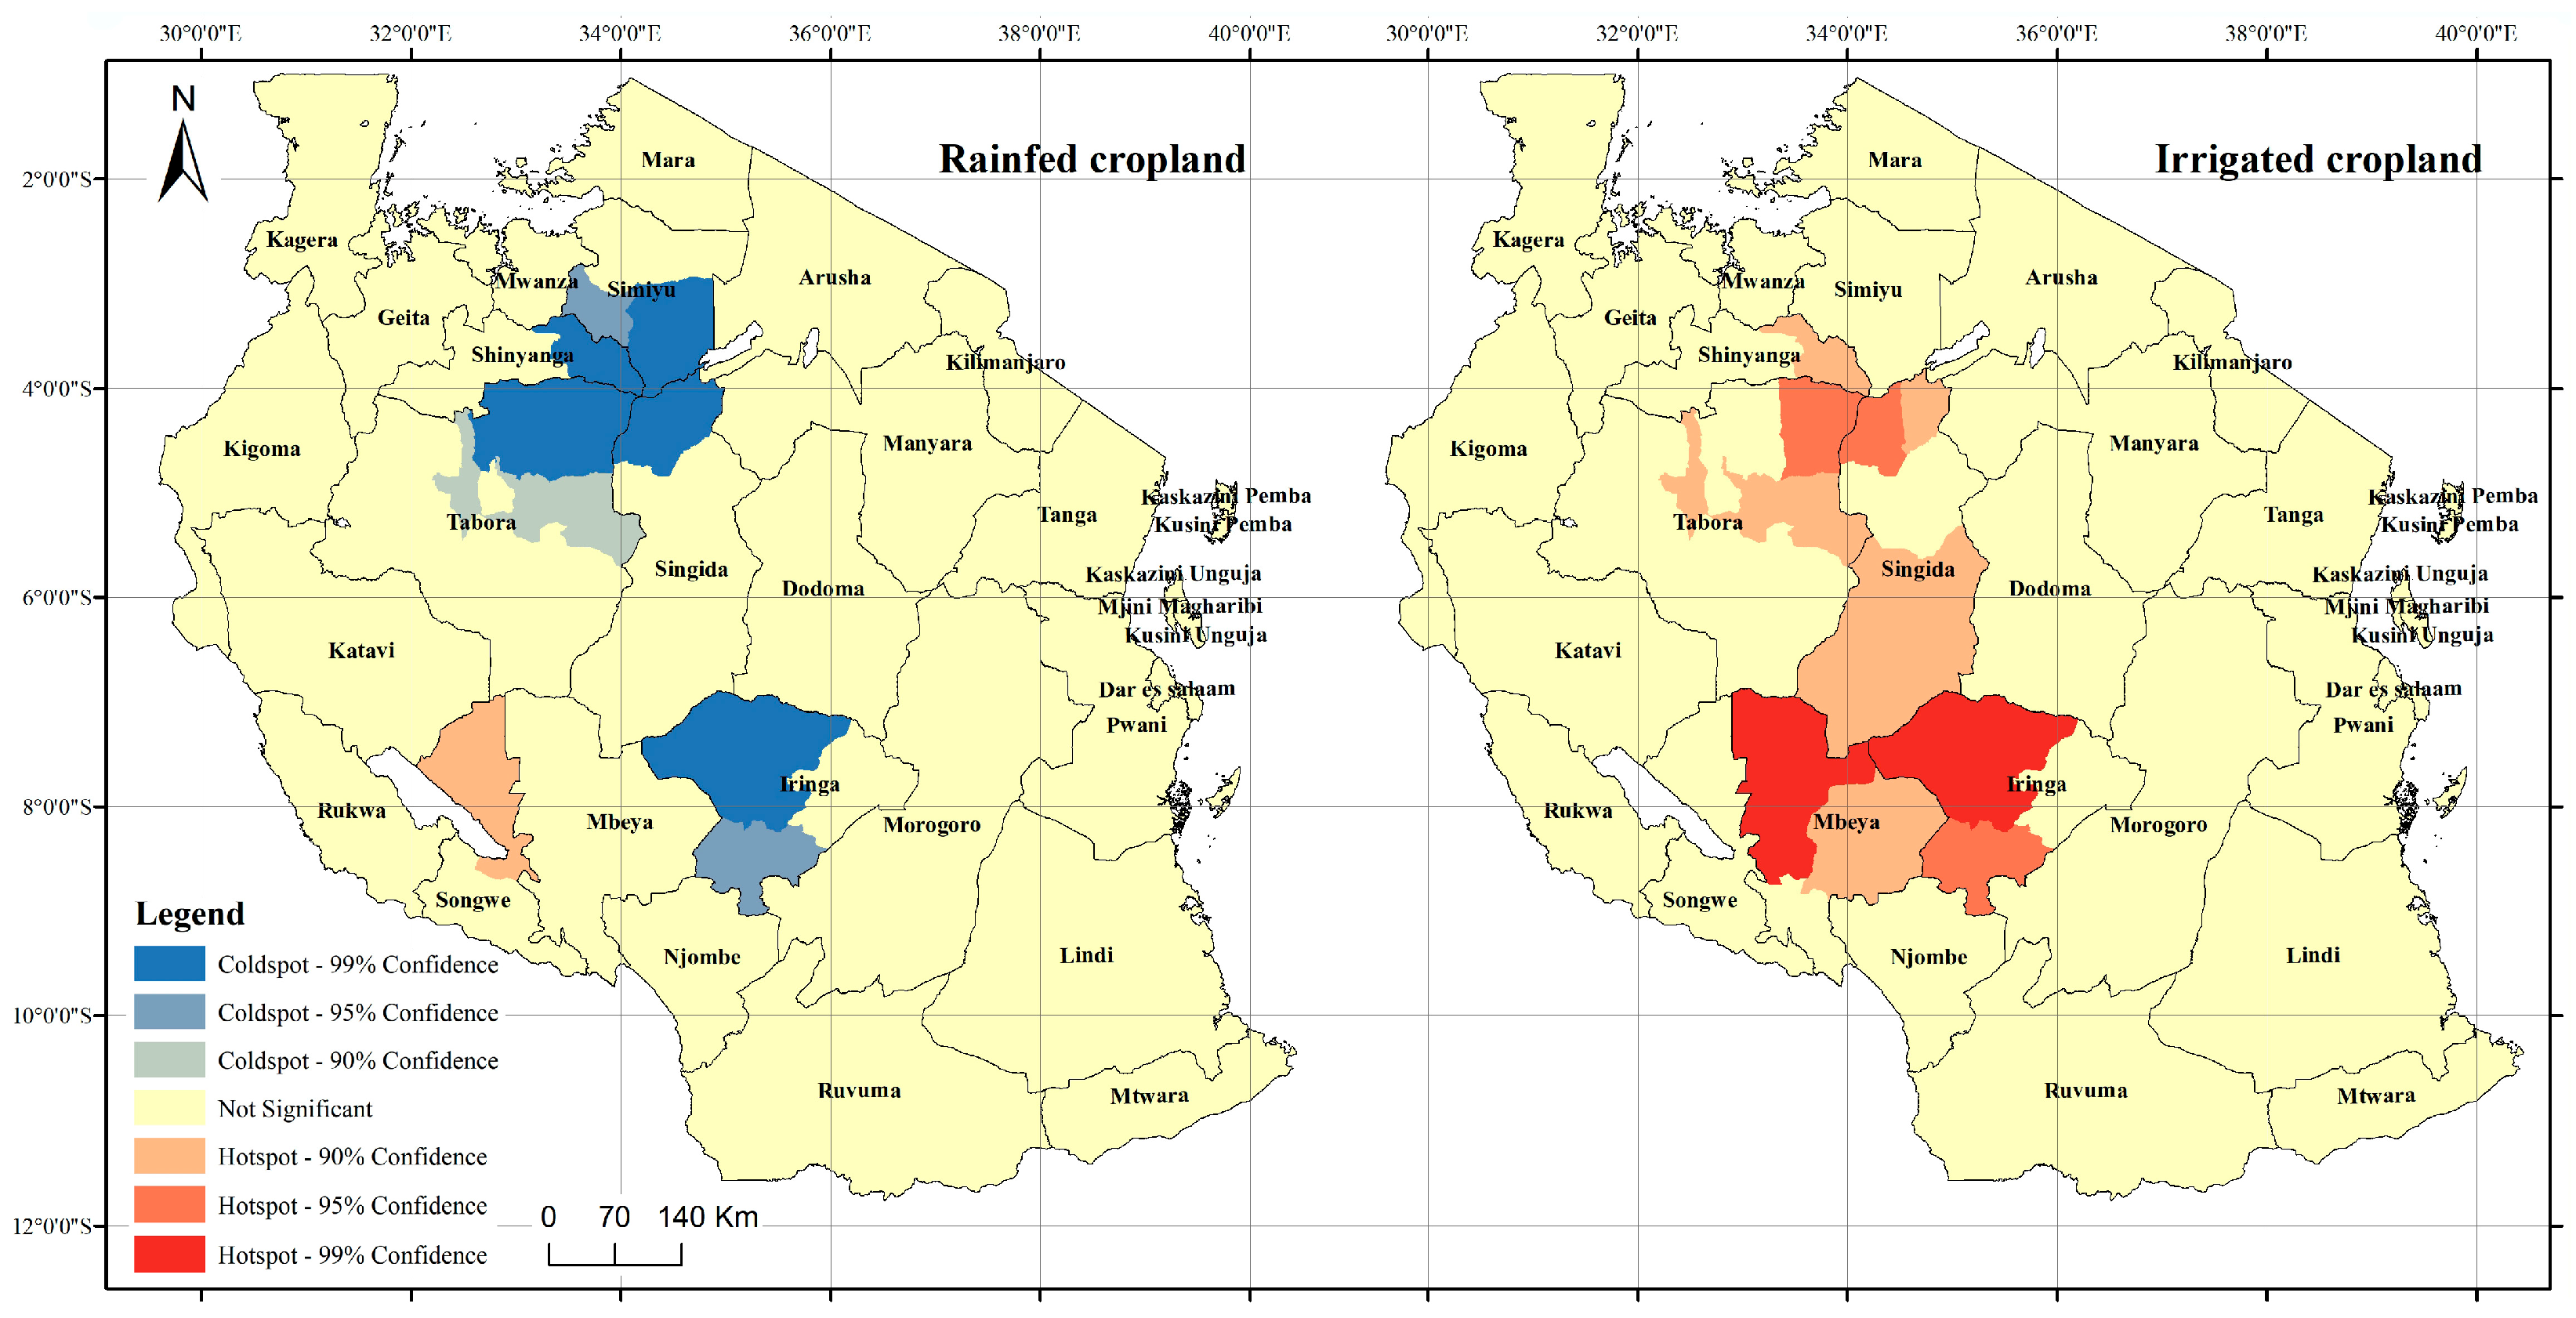
The hotspots analysis results of the changes in Tanzania’s rainfed and irrigated cropland from 1990 to 2020 are shown in Figure 4, Figure 5 and Figure 6. The specific analysis is as follows.
(1) From 1990 to 2000
Through combined analysis of the changes in rainfed and irrigated cropland areas in various regions and periods, it can be seen that from 1990 to 2000 the increase in rainfed cropland hotspots was relatively concentrated, mainly located in the central and western regions of Tanzania, including most areas of Tabora, Katavi, Singida, and Dodoma. The rainfed cropland reduction coldspots were concentrated in the lakeside areas, including most of the regions of Mwanza, Simiyu, and Mara, as well as some areas of Kagera, Geita, Shinyanga, and Arusha.
The increased irrigated cropland hotspots were also relatively concentrated, mainly located in the central and western parts of Tanzania and along the lake, including Tabora and Shinyanga in the west, Singida in the middle, Mwanza, Simiyu, and Mara along the lake, and Iringa in the southern highlands. The coldspots for the increase in irrigated land were mainly located along the eastern coast, where the increase in irrigated cropland area was relatively small, including the Tanga, Dar es Salaam, and regions in Zanzibar.
(2) From 2000 to 2010
Between 2000 and 2010, the rainfed cropland area in most regions decreased, while the irrigated cropland area in all regions increased. Compared with the previous period, the increased rainfed cropland hotspots in the central and western regions, as well as the decreased rainfed cropland coldspots along the lake, have not appeared. The Singida and Dodoma regions have shifted from increasing rainfed cropland hotspots to decreasing rainfed cropland coldspots, while parts of the Iringa and Mbeya regions have also transformed into coldspots, resulting in a significant concentration of rainfed cropland reduction in these regions.
The central and western regions are still hotspots for the increase in irrigated cropland, while the lake area has changed from a significant hotspot to a non-statistically significant one. The Mbeya region in the southern highlands zone has become a new hotspot for the growth of irrigated cropland. The coldspots on the eastern coast, where the irrigated cropland increased in the previous period, have also become statistically insignificant during this period. After expansion in the 1990s, the growth of irrigated cropland along the lake area slowed down.
(3) From 2010 to 2020
From 2010 to 2020, the rainfed cropland area in most regions continued to decrease, while the irrigated cropland area in each region continued to increase. Compared with the previous period, the rainfed cropland coldspots in Singida and Dodoma regions have disappeared, while the areas at the border of the Simiyu, Shinyanga, Tabora, and Singida regions have become new coldspots, especially in the northeast of Tabora and the south of Simiyu. Most areas in the Iringa region remain coldspots. The northern part of the Songwe region has become a new hotspot for the growth of rainfed cropland.
The hotspots for the growth of irrigated cropland have further narrowed. This is mainly due to the reduction in hotspots in some areas at the junction of the Simiyu, Shinyanga, Tabora, and Singida regions in the central and western zones. The Singida, Mbeya, and Iringa regions remain hotspots for irrigated cropland growth.

3.2.3. Distribution Direction and Center of Cropland

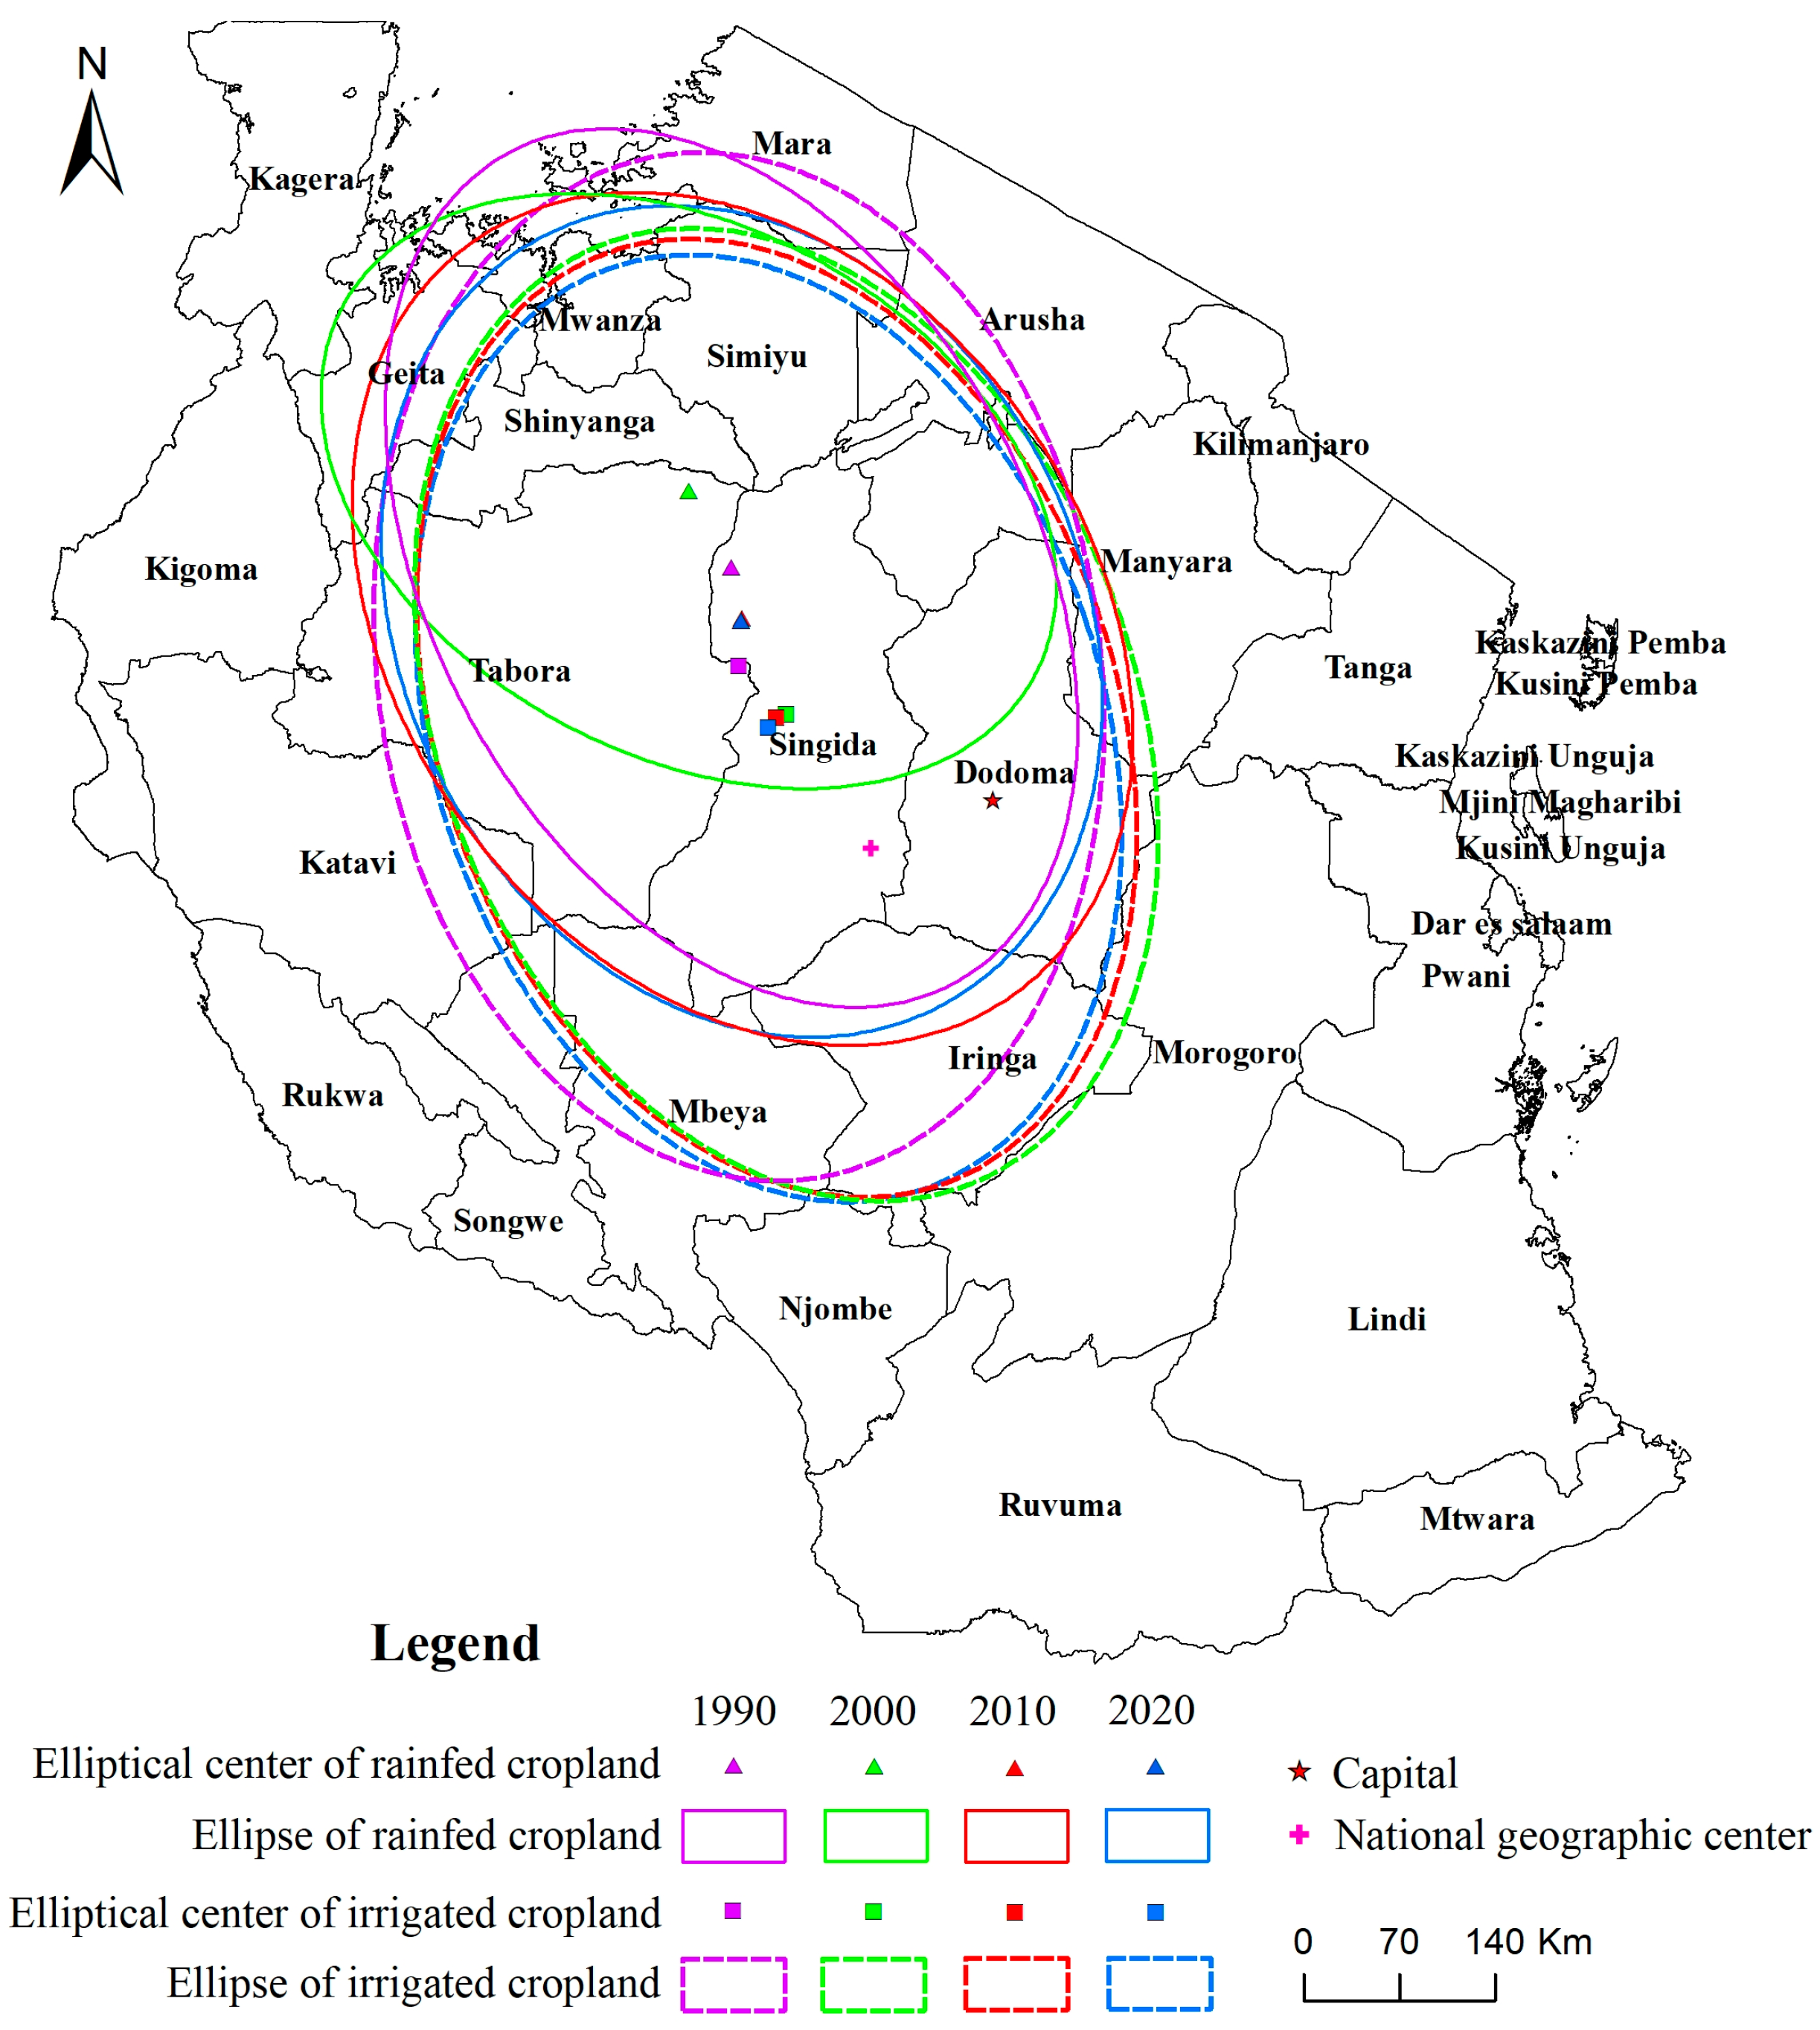
The standard deviation ellipse analysis map and results of Tanzania’s rainfed and irrigated cropland from 1990 to 2020 are shown in Figure 7 and Table 5. Tanzania’s rainfed and irrigated cropland are mainly concentrated in the central and western zones, as well as along the lake. The concentration of the rainfed cropland is higher than that of the irrigated cropland. Both follow the spatial distribution trend of “northwest–southeast”, which is consistent with the overall terrain trend and urban–rural settlement distribution trend of Tanzania [51].
Specifically, the elliptical center of the rainfed cropland is located in the central north, and has moved 64 km northwest and 38 km southeast over the past 30 years, gradually stabilizing in the northwest of the Singida region. In 2020, it was 190 km away from the geographical center of Tanzania. The ellipse area first decreased, then increased, and then finally stabilized. The ellipse of about 250,000 km2 covers 68% of Tanzania’s rainfed cropland area. The oblateness of the ellipses continued to decrease, indicating a gradual weakening of the directional characteristics of rainfed cropland distribution.
The elliptical center of the irrigated cropland is closer to the central part of Tanzania. Over the course of 30 years, it first moved southeast by 49 km and then slightly moved southwest, gradually stabilizing in the central western part of the Singida region. In 2020, it was 115 km away from the geographical center of Tanzania. Compared to rainfed cropland, the irrigated cropland ellipse covers an additional area including the Mbeya and Iringa regions. The elliptical area of irrigated cropland is gradually decreasing, indicating that its spatial distribution is becoming more concentrated. The ellipse of about 280,000 km2 covers 68% of Tanzania’s irrigated cropland area. The oblateness of the ellipse first increases and then remains unchanged, indicating that the directionality of the irrigated cropland distribution first increases and then tends to stabilize.

3.3. Causes of Spatial Differentiation of Cropland

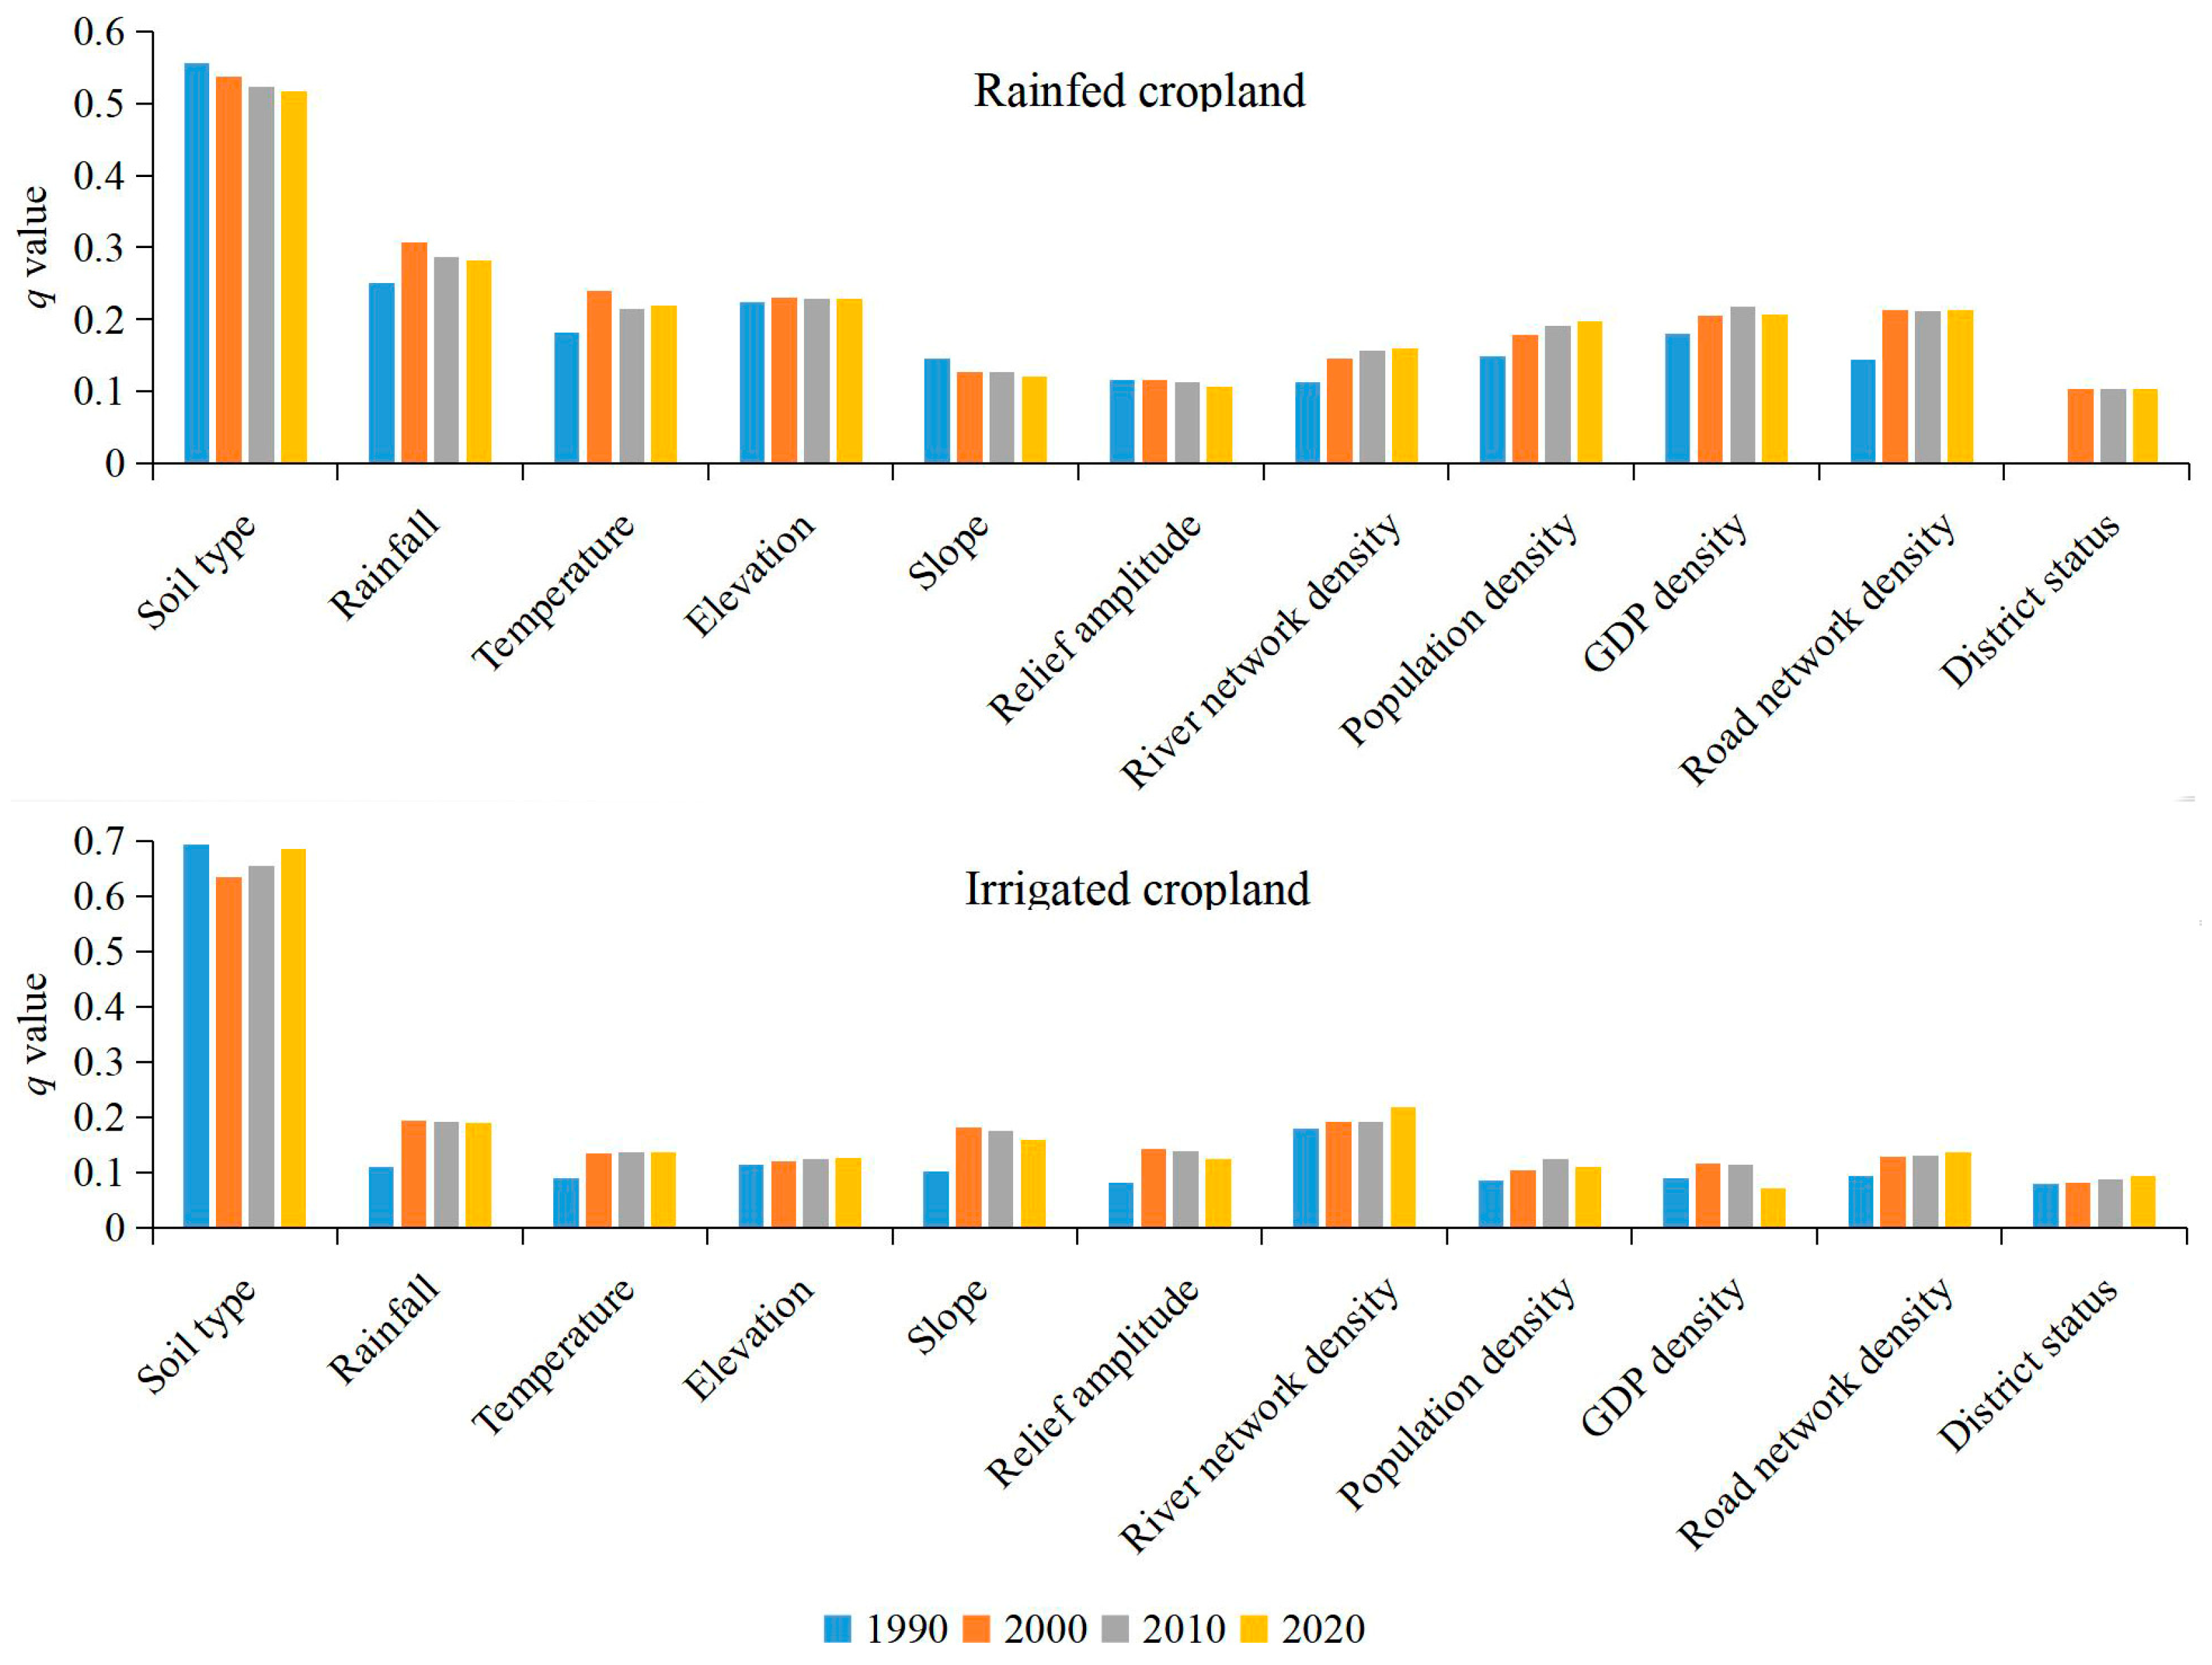
We used the geographic detector model to analyze the causes of the spatial differentiation of rainfed and irrigated cropland in Tanzania. Figure 8 shows the factors that significantly affect each type (p-value < 0.05). The results indicate that different influencing factors have varying degrees of impact on different types of cropland. Overall, whether it is rainfed or irrigated cropland, natural environmental factors (especially soil type) have always been the strongest driving force in explaining their spatial distribution patterns. Over the past 30 years, the explanatory power of socioeconomic factors on the distribution of the two types of cropland has generally shown an upward trend. The q-values of most natural environmental factors are relatively stable or have small fluctuations. However, the q-values of some key climate factors fluctuate between different years and cropland types. The q-value of sub-regional types is always the lowest between the two cropland types.
Specifically, soil type is the decisive factor in the distribution of rainfed cropland, although its explanatory power has slightly decreased over the past 30 years. Rainfall is the second largest influencing factor after soil type. The explanatory power of terrain factors is relatively stable and low. The q-value of relief amplitude has slightly decreased. The explanatory power of temperature is slightly lower than that of rainfall. The q-value of the river network density has continued to rise. The driving force of socioeconomic factors has significantly increased. The continuous and significant increase in the q-value of population density indicates that population pressure is an important force driving the expansion of rainfed cropland. The overall trend in the q-value of GDP density and road network density is on the rise.
Soil type explains the distribution of irrigated cropland better than that of rainfed cropland. Compared with rainfed cropland, the explanatory power of rainfall and temperature on the distribution of irrigated cropland is lower. The explanatory power of terrain factors on irrigated land gradually decreased after an increase in 2000. The explanatory power of river network density continues to increase, highlighting the deep dependence of Tanzania’s irrigated agriculture on natural surface water systems. The road network density is a core and continuously increasing socioeconomic driving factor, which is more important than population density and GDP density.

4. Discussion

The spatiotemporal evolution characteristics of cropland in Tanzania revealed in this study deeply reflect the complex interaction between natural endowment, population pressure, and policy intervention in the process of agricultural transformation in Africa. Its pattern not only conforms to the common trend of global agricultural development, but also presents a unique path due to regional specificity, providing a typical case for understanding the land use transformation of sub-Saharan African countries.

4.1. Alignment and Differentiation with Agricultural Development Theory

Tanzania’s cropland has evolved from rainfed dominance and extensive expansion toward more irrigated and precise development. This trajectory confirms, in line with the development stage theory, a national transformation from “survival agriculture” to “technology-driven agriculture” [52]. The large-scale bidirectional conversion between rainfed cropland and forest/shrubland in the 1990s, coupled with a net area increase, was primarily driven by land reclamation under rapid population growth. This trend aligns with the marginal land reclamation model of African agrarian economies during food shortages [53]. A classic example is the expansion of cropland into grasslands in Ethiopia from 1990 to 2010 [54]. The subsequent weakening of rainfed cropland transformation intensity reflects the constraint of environmental protection policies and the optimization of land use structure, as Tanzania began to regulate excessive reclamation of natural vegetation in the 2000s. Tanzania’s policy-driven, phased expansion of irrigated cropland after 2000 reflects the induced technological innovation theory, which explains how societies use technology to boost productivity when facing population pressure. This mirrors the transformation path of Kenya’s “National Irrigation Plan” [55,56].
However, the phenomenon of fluctuating irrigated cropland growth discovered in this study differs from the traditional linear progress assumption [57]. The stagnation of irrigated cropland development from 2000 to 2010 reflects the fragility of Africa’s agricultural transformation: irrigated agriculture is limited by both the distribution of water resources and policy continuity [58]. This non-linear characteristic of “progress–stagnation–recovery” echoes the periodic fluctuations in Zambia’s irrigated agriculture caused by drought and funding shortages [59], highlighting the resource constraints and external dependence difficulties faced by low-income countries in the process of agricultural modernization.

4.2. Stage Effect and Regional Differences of Policy Intervention

The spatiotemporal patterns of changes in cropland clearly demonstrate the shaping effect of policy tools on land use. In the 1990s, the “Small-Scale Irrigation Plan” promoted the initial expansion of irrigated land in the central and western zones. In 2000, the “Agricultural Modernization Plan” accelerated the transformation of rainfed cropland into irrigated cropland. The emergence of Mbeya as a new hotspot of irrigated cropland increase in the 2000s is attributed to the “Southern Highlands Irrigation Plan”, which leveraged the region’s abundant mountain runoff to build supporting irrigation facilities. In 2010, the “Cross-Regional Irrigation Integration Project” promoted contiguous development. The policy focus shifted from decentralized pilot policies to systematic promotion, directly leading to the spread of hotspot areas from single points along lakes to contiguous distribution in the central and western zones. This policy-driven transformation echoes the institutional “growth pole strategy’s guiding role in urban expansion” in Tanzania’s urban–rural settlement research [51], and it is also similar to Ghana’s practice of promoting agricultural centralization through the “Rural Development Plan” [60].
In terms of regional differences, the areas along the lake have taken the lead in achieving the transformation of irrigated cropland with the advantage of water resources, while the eastern coastal areas have experienced a decline in arable land due to urbanization pressure, and the central and western zones have gradually narrowed the gap through policy inclinations. This pattern is similar to the phenomenon of agricultural differentiation in north and south Nigeria: the northern region relies on irrigation projects to develop intensive agriculture, while the southern region suffers from fragmented farmland due to urbanization [61]. But Tanzania’s uniqueness lies in its policy interventions that focus more on cross-regional resource integration, which contrasts with Uganda’s overreliance on a single regional irrigation model and provides a reference for balanced regional development [62].

4.3. Dynamic Balance Driven by Nature and Socioeconomic Factors

The driving mechanism of cropland evolution shows a long-term trend of weakening natural constraints and strengthening human-driven factors. The influence of soil type, as a fundamental factor in the distribution of arable land, has slowly decreased with the advancement of irrigation technology. The explanatory power of socioeconomic factors such as population density and road network density continues to rise, reflecting the enhanced ability of human activities to regulate land use. This transformation echoes the conclusion that “socioeconomic factors dominate spatial differentiation” in Tanzanian settlement research across multiple scales [51,63], and it is also consistent with the law of coupled development of “population–transportation–farmland” in South Africa [64]. The prominent role of road network density in driving irrigated cropland distribution highlights the commercial attributes of irrigated agriculture: irrigated crops (often high-value cash crops) require efficient transportation to connect to markets, so road accessibility becomes a key location factor.
It is worth noting that the river network density has a significantly higher impact on irrigated cropland than on rainfed cropland, indicating that irrigated agriculture still relies heavily on natural water systems, which is different from Egypt’s model of achieving irrigation independence through the Nile River artificial canal network [65]. This path dependence on natural water sources makes irrigated cropland vulnerable to climate change. For example, rainfall fluctuations from 2000 to 2010 led to a stagnation in its growth. This stagnation synergistically aligns with agricultural production reductions caused by water level drops in irrigation areas around Lake Victoria in Kenya [66]. Together, these phenomena highlight the critical constraints imposed by ecological fragility on agricultural systems.

4.4. Sustainability Challenges and Policy Implications of Agricultural Transformation

The contradiction between cropland expansion and ecological protection is becoming increasingly prominent. The large-scale conversion of rainfed cropland and forest from 1990 to 2000 led to a reduction in vegetation cover in ecologically sensitive areas in the western region. Although the scale of conversion has shrunk since 2010, the expansion of irrigated cropland to wetland and grassland still poses a threat to biodiversity, which is similar to the problem of forest fragmentation caused by agricultural expansion in the Congo Basin [67], highlighting the trade-off between agricultural development and ecological protection.
The research results have policy implications in the following respects. First, it is necessary to establish a “cropland–ecology” collaborative management mechanism, promote efficient water-saving technologies in the central and western irrigation areas, and reduce the occupation of natural vegetation. Second, policy coherence should be strengthened by incorporating irrigation projects into the country’s long-term development plan to avoid fluctuations caused by international aid dependence. Third, in response to the development gap between the eastern coastal areas and the central and western zones, it is necessary to promote the flow of resource elements and reduce regional imbalances through integrated investment in road network and irrigation. From the perspective of international cooperation, as an important node of the “the Belt and Road” initiative, Tanzania’s irrigation agriculture development needs are highly consistent with China’s technological advantages in water conservancy projects. Drawing on the regional differences revealed in this study, cooperation should be prioritized in areas such as Singida and Mbeya to enhance food security capabilities and promote sustainable agricultural transformation, demonstrating the protection and utilization of arable land on the African continent.

4.5. Limitations of the Research

There are still some limitations to this study. First, the impact of micro-level farmers’ behavior on cropland changes, such as the differences in irrigation technology adoption between small and large farms, which has been proven to be important in agricultural research in Ethiopia [68], was not analyzed. Second, there was a lack of quantitative analysis on the correlation between climate change and farmland productivity, which has been shown to be key in explaining the yield fluctuations reported in research in Malawi [69]. Third, the specific impact mechanism of changes in cropland on food security has not been explored. Similar studies in Burkina Faso have revealed a direct correlation between cropland quality and the food self-sufficiency rate [70]. Future research can combine farmer survey data to construct a multi-scale “macro pattern–micro behavior–ecological effects” analysis framework and strengthen comparative studies investigating East African countries such as Kenya and Uganda to reveal the common laws and unique paths underlying regional agricultural transformation. At the same time, ecosystem service assessment tools can be introduced to quantify the ecological costs of cropland expansion, providing more accurate scientific support for sustainable development goals.

5. Conclusions

Over the past 30 years, Tanzania’s total cropland area has increased, driven primarily by the substantial expansion of irrigated cropland, which offset the fluctuating decline in rainfed cropland. Rainfed cropland’s mutual conversion with shrubland/forest slowed after 2000, indicating a weakened momentum of agricultural expansion. Irrigated cropland showed phased growth tied to irrigation facilities, water resources, and policies.
Tanzania’s cropland exhibits distinct spatial patterns and dynamic hotspot shifts that reflect agricultural transformation paths. Rainfed cropland dominates the central, lake, and western zones, while irrigated cropland is concentrated in the western and southern highland zones. Rainfed cropland hotspots shifted from extensive expansion (1990s) to localized mountain growth (2010s), and irrigated cropland hotspots evolved from lakeside concentration to contiguous development in central-western regions, revealing agriculture’s shift from “natural dependence” to “policy-driven” and then “resource-constrained” modes.
Both cropland types in Tanzania show a northwest–southeast distribution trend, with central shifts reflecting cultivation focus adjustments. The rainfed cropland center first moved northwest, then southeast, while the irrigated cropland center stabilized after a southeast shift. Spatially, irrigated cropland continued to concentrate, while rainfed cropland’s concentration first increased then decreased.
Among driving factors, natural endowments (e.g., soil type as the core factor for cropland suitability, rainfall for rainfed cropland) lay the foundation, while socioeconomic factors (population density, GDP density, road network density) grow in influence. Notably, river network density’s impact on irrigated cropland increased, and road network density also exerted a prominent effect on irrigated cropland, highlighting infrastructure’s role in shaping agricultural patterns.
The evolution pattern of cropland in Tanzania revealed in this study reflects the complex interaction between natural constraints and human intervention in Africa’s agricultural transformation. The results could provide a scientific basis for Tanzania’s food security strategies, irrigation planning, and ecological protection policies.

Author Contributions

Conceptualization, J.Z., Z.D., and H.L.; methodology, J.Z., Z.D., and H.L.; software, J.Z., Y.L., R.Z., and J.F.; validation, J.Z., Z.D., and H.L.; formal analysis, J.Z., Y.L., R.Z., and J.F.; investigation, J.Z., Y.L., R.Z., and J.F.; resources, J.Z., Z.D., and H.L.; data curation, J.Z., Y.L., R.Z., and J.F.; writing—original draft preparation, J.Z., Y.L., R.Z., and J.F.; writing—review and editing, J.Z., Z.D., and H.L.; visualization, J.Z. and Y.L.; supervision, J.Z., Z.D., and H.L.; project administration, J.Z., Z.D., and H.L.; funding acquisition, J.Z., Z.D., and H.L. All authors have read and agreed to the published version of the manuscript.

Funding

This research was funded by the National Natural Science Foundation of China, grant number 42101309; 42161144003; 42301314, the Annual Projects of the Philosophy and Social Sciences Planning of Henan Province, grant number 2024BSH037; 2022HSH026, the Major Project of Basic Research on Philosophy and Social Sciences in Universities of Henan Province, grant number 2023-JCZD-21, the Training Plan for Young Backbone Teachers in Higher Education Institutions in Henan Province, grant number 82, and the Research and Practice Project on Higher Education Teaching Reform in Henan Province, grant number 2024SJGLX0369; 2024SJGLX0370.

Data Availability Statement

The data that support the findings of this study are available from the corresponding author upon reasonable request.

Conflicts of Interest

The authors declare no conflicts of interest.

Abbreviations

The following abbreviations are used in this manuscript:
GDPGross Domestic Product
GISGeographic Information System
RSRemote Sensing
SRTMShuttle Radar Topography Mission
GHSLGlobal Human Settlement Layer

References

  1. Pawlak, K.; Kolodziejczak, M. The Role of Agriculture in Ensuring Food Security in Developing Countries: Considerations in the Context of the Problem of Sustainable Food Production. Sustainability 2020, 12, 5488. [Google Scholar] [CrossRef]
  2. Simane, B.; Kapwata, T.; Naidoo, N.; Cisse, G.; Wright, C.Y.; Berhane, K. Ensuring Africa’s Food Security by 2050: The Role of Population Growth, Climate-Resilient Strategies, and Putative Pathways to Resilience. Foods 2025, 14, 262. [Google Scholar] [CrossRef]
  3. Akinyemi, F.O.; Speranza, C.I. Agricultural Landscape Change Impact on the Quality of Land: An African Continent-Wide Assessment in Gained and Displaced Agricultural Lands. Int. J. Appl. Earth Obs. Geoinf. 2022, 106, 102644. [Google Scholar] [CrossRef]
  4. Li, H.; Song, W. Spatial Transformation of Changes in Global Cultivated Land. Sci. Total Environ. 2023, 859, 160194. [Google Scholar] [CrossRef] [PubMed]
  5. Song, F.; Wang, S.; Bai, X.; Wu, L.; Wang, J.; Li, C.; Chen, H.; Luo, X.; Xi, H.; Zhang, S.; et al. A New Indicator for Global Food Security Assessment: Harvested Area Rather than Cropland Area. Chin. Geogr. Sci. 2022, 32, 204–217. [Google Scholar] [CrossRef]
  6. Zhang, Q.; Sannigrahi, S.; Bilintoh, T.M.; Zhang, R.; Xiong, B.; Tao, S.; Bilsborrow, R.; Song, C. Understanding Human-Environment Interrelationships under Constrained Land-Use Decisions with a Spatially Explicit Agent-Based Model. Anthropocene 2022, 38, 100337. [Google Scholar] [CrossRef]
  7. Radocaj, D.; Jurisic, M. GIS-Based Cropland Suitability Prediction Using Machine Learning: A Novel Approach to Sustainable Agricultural Production. Agronomy 2022, 12, 2210. [Google Scholar] [CrossRef]
  8. Li, R.; Wei, C.; Afroz, M.D.; Lyu, J.; Chen, G. A GIS-Based Framework for Local Agricultural Decision-Making and Regional Crop Yield Simulation. Agric. Syst. 2021, 193, 103213. [Google Scholar] [CrossRef]
  9. Gao, H.; Gong, J.; Ye, T.; Maier, M.; Liu, J. Constructing Cropland Ecological Stability Assessment Method Based on Disturbance-Resistance-Response Processes and Classifying Cropland Ecological Types. Sci. Total Environ. 2024, 930, 172673. [Google Scholar] [CrossRef]
  10. Kuang, W.; Liu, J.; Tian, H.; Shi, H.; Dong, J.; Song, C.; Li, X.; Du, G.; Hou, Y.; Lu, D.; et al. Cropland Redistribution to Marginal Lands Undermines Environmental Sustainability. Natl. Sci. Rev. 2022, 9, nwab091. [Google Scholar] [CrossRef]
  11. Potapov, P.; Turubanova, S.; Hansen, M.C.; Tyukavina, A.; Zalles, V.; Khan, A.; Song, X.-P.; Pickens, A.; Shen, Q.; Cortez, J. Global Maps of Cropland Extent and Change Show Accelerated Cropland Expansion in the Twenty-First Century. Nat. Food 2022, 3, 19–28. [Google Scholar] [CrossRef]
  12. Li, X.; Wu, K.; Hao, S.; Yue, Z.; Ran, Z.; Ma, J. Mapping Cropland Suitability in China Using Optimized MaxEnt Model. Field Crops Res. 2023, 302, 109064. [Google Scholar] [CrossRef]
  13. Lark, T.J.; Schelly, I.H.; Gibbs, H.K. Accuracy, Bias, and Improvements in Mapping Crops and Cropland across the United States Using the USDA Cropland Data Layer. Remote Sens. 2021, 13, 968. [Google Scholar] [CrossRef]
  14. Tariq, A.; Yan, J.; Gagnon, A.S.; Khan, M.R.; Mumtaz, F. Mapping of Cropland, Cropping Patterns and Crop Types by Combining Optical Remote Sensing Images with Decision Tree Classifier and Random Forest. Geo Spat. Inf. Sci. 2023, 26, 302–320. [Google Scholar] [CrossRef]
  15. Bullock, E.L.; Healey, S.P.; Yang, Z.; Oduor, P.; Gorelick, N.; Omondi, S.; Ouko, E.; Cohen, W.B. Three Decades of Land Cover Change in East Africa. Land 2021, 10, 150. [Google Scholar] [CrossRef]
  16. Omuto, C.T.; Kome, G.K.; Ramakhanna, S.J.; Muzira, N.M.; Ruley, J.A.; Jayeoba, O.J.; Raharimanana, V.; Ansah, A.O.; Khamis, N.A.; Mathafeng, K.K.; et al. Trend of Soil Salinization in Africa and Implications for Agro-Chemical Use in Semi-Arid Croplands. Sci. Total Environ. 2024, 951, 175503. [Google Scholar] [CrossRef]
  17. Chen, C.; Dong, T.; Wang, Z.; Wang, C.; Song, W.; Zhang, H. Exploring Optimal Features and Image Analysis Methods for Crop Type Classification from the Perspective of Crop Landscape Heterogeneity. Remote Sens. Appl. Soc. Environ. 2024, 36, 101308. [Google Scholar] [CrossRef]
  18. Bofana, J.; Zhang, M.; Nabil, M.; Wu, B.; Tian, F.; Liu, W.; Zeng, H.; Zhang, N.; Nangombe, S.S.; Cipriano, S.A.; et al. Comparison of Different Cropland Classification Methods under Diversified Agroecological Conditions in the Zambezi River Basin. Remote Sens. 2020, 12, 2096. [Google Scholar] [CrossRef]
  19. Tian, G.; Duan, J.; Yang, L. Spatio-Temporal Pattern and Driving Mechanisms of Cropland Circulation in China. Land Use Policy 2021, 100, 105118. [Google Scholar] [CrossRef]
  20. Luo, L.; Li, Y.; Ma, W.; Rong, J.; Wei, J.; Cui, Y.; Qu, T. Temporal-Spatial Dynamics and Collaborative Effects of Cropland Resilience in China. Land 2025, 14, 108. [Google Scholar] [CrossRef]
  21. Wang, M.; Wang, C.; Hu, Q.; Wei, H.; Li, X.; Li, Z.; Zhu, N.; Xue, B.; Li, S.; Xu, B. Spatial-Temporal Patterns of Cultivated Land Expansion and Intensification in Africa from 2000 to 2020. Int. J. Agric. Sustain. 2025, 23, 2476220. [Google Scholar] [CrossRef]
  22. Hu, X.; Dong, C.; Zhang, Y. Impacts of Cropland Utilization Patterns on the Sustainable Use Efficiency of Cropland Based on the Human-Land Perspective. Land 2024, 13, 863. [Google Scholar] [CrossRef]
  23. Nelson, K.S.; Burchfield, E.K. Landscape Complexity and US Crop Production. Nat. Food 2021, 2, 330–338. [Google Scholar] [CrossRef]
  24. Nabil, M.; Zhang, M.; Bofana, J.; Wu, B.; Stein, A.; Dong, T.; Zeng, H.; Shang, J. Assessing Factors Impacting the Spatial Discrepancy of Remote Sensing Based Cropland Products: A Case Study in Africa. Int. J. Appl. Earth Obs. Geoinf. 2020, 85, 102010. [Google Scholar] [CrossRef]
  25. Nzabarinda, V.; Bao, A.; Xu, W.; Uwamahoro, S.; Huang, X.; Gao, Z.; Umugwaneza, A.; Kayumba, P.M.; Maniraho, A.P.; Jiang, Z. Impact of Cropland Development Intensity and Expansion on Natural Vegetation in Different African Countries. Ecol. Inf. 2021, 64, 101359. [Google Scholar] [CrossRef]
  26. Nzunda, E.F.; Midtgaard, F. Deforestation and Loss of Bushland and Grassland Primarily Due to Expansion of Cultivation in Mainland Tanzania (1995–2010). J. Sustain. For. 2019, 38, 509–525. [Google Scholar] [CrossRef]
  27. Doggart, N.; Morgan-Brown, T.; Lyimo, E.; Mbilinyi, B.; Meshack, C.K.; Sallu, S.M.; Spracklen, D.V. Agriculture Is the Main Driver of Deforestation in Tanzania. Environ. Res. Lett. 2020, 15, 034028. [Google Scholar] [CrossRef]
  28. Kennedy, J.; Hurtt, G.C.; Liang, X.-Z.; Chini, L.; Ma, L. Changing Cropland in Changing Climates: Quantifying Two Decades of Global Cropland Changes. Environ. Res. Lett. 2023, 18, 064010. [Google Scholar] [CrossRef]
  29. Zhai, J.; Xiao, C.; Feng, Z.; Liu, Y. Spatio-Temporal Patterns of Land-Use Changes and Conflicts between Cropland and Forest in the Mekong River Basin during 1990–2020. Land 2022, 11, 927. [Google Scholar] [CrossRef]
  30. Zhong, H.; Liu, Z.; Wang, J. Understanding Impacts of Cropland Pattern Dynamics on Grain Production in China: A Integrated Analysis by Fusing Statistical Data and Satellite-Observed Data. J. Environ. Manag. 2022, 313, 114988. [Google Scholar] [CrossRef]
  31. Khan, S.N.; Li, D.; Maimaitijiang, M. A Geographically Weighted Random Forest Approach to Predict Corn Yield in the US Corn Belt. Remote Sens. 2022, 14, 2843. [Google Scholar] [CrossRef]
  32. Zhao, Y.; Feng, Q. Identifying Spatial and Temporal Dynamics and Driving Factors of Cultivated Land Fragmentation in Shaanxi Province. Agric. Syst. 2024, 217, 103948. [Google Scholar] [CrossRef]
  33. Ojara, M.A.; Lou, Y.; Babaousmail, H.; Sempa, A.K.; Ayugi, B.; Ogwang, B.A. Evaluation of Drought, Wet Events, and Climate Variability Impacts on Maize Crop Yields in East Africa during 1981–2017. Int. J. Plant Prod. 2022, 16, 41–62. [Google Scholar] [CrossRef]
  34. Choi, Y.-W.; Eltahir, E.A.B. Near-Term Climate Change Impacts on Food Crops Productivity in East Africa. Theor. Appl. Climatol. 2023, 152, 843–860. [Google Scholar] [CrossRef]
  35. Li, X.; Zhang, X.; Jin, X. Spatio-Temporal Characteristics and Driving Factors of Cultivated Land Change in Various Agricultural Regions of China: A Detailed Analysis Based on County-Level Data. Ecol. Indic. 2024, 166, 112485. [Google Scholar] [CrossRef]
  36. Zhang, B.; Li, W.; Zhang, C. Analyzing Land Use and Land Cover Change Patterns and Population Dynamics of Fast-Growing US Cities: Evidence from Collin County, Texas. Remote Sens. Appl. Soc. Environ. 2022, 27, 100804. [Google Scholar] [CrossRef]
  37. Mao, C.; Feng, S.; Zhou, C. Cropland Loss under Different Urban Expansion Patterns in China (1990–2020): Spatiotemporal Characteristics, Driving Factors, and Policy Implications. Land 2025, 14, 343. [Google Scholar] [CrossRef]
  38. Huang, Q.; Liu, Z.; He, C.; Gou, S.; Bai, Y.; Wang, Y.; Shen, M. The Occupation of Cropland by Global Urban Expansion from 1992 to 2016 and Its Implications. Environ. Res. Lett. 2020, 15, 084037. [Google Scholar] [CrossRef]
  39. Polizel, S.P.; Vieira, R.M.d.S.P.; Pompeu, J.; Ferreira, Y.d.C.; Sousa-Neto, E.R.d.; Barbosa, A.A.; Balbaud, J.P.H. Analysing the Dynamics of Land Use in the Context of Current Conservation Policies and Land Tenure in the Cerrado-MATOPIBA Region (Brazil). Land Use Policy 2021, 109, 105713. [Google Scholar] [CrossRef]
  40. Dramstad, W.E.; Sang, N.; Forsberg-Mathiesen, H.; Bryn, A. Five Ways of Characterizing Agricultural Land Use Dynamics and Abandonment from Subsidy Data. Land 2021, 10, 1136. [Google Scholar] [CrossRef]
  41. Belair, J. Farmland Investments in Tanzania: The Impact of Protected Domestic Markets and Patronage Relations. World Dev. 2021, 139, 105298. [Google Scholar] [CrossRef]
  42. Uisso, A.M.; Tanrivermis, H. Driving Factors and Assessment of Changes in the Use of Arable Land in Tanzania. Land Use Policy 2021, 104, 105359. [Google Scholar] [CrossRef]
  43. Jones, K.; Nowak, A.; Berglund, E.; Grinnell, W.; Temu, E.; Paul, B.; Renwick, L.L.R.; Steward, P.; Rosenstock, T.S.; Kimaro, A.A. Evidence Supports the Potential for Climate-Smart Agriculture in Tanzania. Glob. Food Secur. Agric. Policy 2023, 36, 100666. [Google Scholar] [CrossRef]
  44. Sigalla, O.Z.; Valimba, P.; Selemani, J.R.; Kashaigili, J.J.; Tumbo, M. Analysis of Spatial and Temporal Trend of Hydro-Climatic Parameters in the Kilombero River Catchment, Tanzania. Sci. Rep. 2023, 13, 7864. [Google Scholar] [CrossRef] [PubMed]
  45. Wineman, A.; Jayne, T.S.; Modamba, E.I.; Kray, H. The Changing Face of Agriculture in Tanzania: Indicators of Transformation. Dev. Policy Rev. 2020, 38, 685–709. [Google Scholar] [CrossRef]
  46. Liu, L.; Zhang, X.; Chen, X.; Gao, Y.; Mi, J. GLC_FCS30-2020:Global Land Cover with Fine Classification System at 30m in 2020; Institute of Aerospace Information Innovation, Chinese Academy of Sciences: Beijing, China, 2020. [Google Scholar]
  47. Li, C.; Wu, J. Land Use Transformation and Eco-Environmental Effects Based on Production-Living-Ecological Spatial Synergy: Evidence from Shaanxi Province, China. Environ. Sci. Pollut. Res. 2022, 29, 41492–41504. [Google Scholar] [CrossRef] [PubMed]
  48. Kucukpehlivan, T.; Cetin, M.; Aksoy, T.; Kurkcuoglu, M.A.S.; Cabuk, S.N.; Pekkan, O.I.; Dabanli, A.; Cabuk, A. Determination of the Impacts of Urban-Planning of the Urban Land Area Using GIS Hotspot Analysis. Comput. Electron. Agric. 2023, 210, 107935. [Google Scholar] [CrossRef]
  49. Zhao, Y.; Wu, Q.; Wei, P.; Zhao, H.; Zhang, X.; Pang, C. Explore the Mitigation Mechanism of Urban Thermal Environment by Integrating Geographic Detector and Standard Deviation Ellipse (SDE). Remote Sens. 2022, 14, 3411. [Google Scholar] [CrossRef]
  50. Zhang, Z.; Song, Y.; Wu, P. Robust Geographical Detector. Int. J. Appl. Earth Obs. Geoinf. 2022, 109, 102782. [Google Scholar] [CrossRef]
  51. Zhang, J.; Zhang, R.; Fan, J.; Guan, X.; Liang, H. Spatiotemporal Dynamics of Urban and Rural Settlements in Tanzania (1975–2020): Drivers, Patterns, and Regional Disparities. Land 2025, 14, 1205. [Google Scholar] [CrossRef]
  52. Kirui, O.K.; Kornher, L.; Beckchanov, M. Productivity Growth and the Role of Mechanisation in African Agriculture. Agrekon 2023, 62, 80–97. [Google Scholar] [CrossRef]
  53. Csikos, N.; Toth, G. Concepts of Agricultural Marginal Lands and Their Utilisation: A Review. Agric. Syst. 2023, 204, 103560. [Google Scholar] [CrossRef]
  54. Maru, M.; Assen, M.; Mekuriaw, A.; Alemayehu, A. Land Use/Cover Dynamics and Its Implication in Alwero Watershed, Western Ethiopia. Proc. Natl. Acad. Sci. India A Phys. Sci. 2023, 93, 377–389. [Google Scholar] [CrossRef]
  55. Kanda, E.K.; Lutta, V.O. The Status and Challenges of a Modern Irrigation System in Kenya: A Systematic Review. Irrig. Drain. 2022, 71, 27–38. [Google Scholar] [CrossRef]
  56. Ke, X.; Chen, J.; Zuo, C.; Wang, X. The Cropland Intensive Utilisation Transition in China: An Induced Factor Substitution Perspective. Land Use Policy 2024, 141, 107128. [Google Scholar] [CrossRef]
  57. Ustaoglu, E.; Williams, B. Institutional Settings and Effects on Agricultural Land Conversion: A Global and Spatial Analysis of European Regions. Land 2023, 12, 47. [Google Scholar] [CrossRef]
  58. Darko, R.O.; Liu, J.; Yuan, S.; Sam-Amoah, L.K.; Yan, H. Irrigated Agriculture for Food Self-Sufficiency in the Sub-Saharan African Region. Int. J. Agric. Biol. Eng. 2020, 13, 1–12. [Google Scholar] [CrossRef]
  59. Hamududu, B.H.; Ngoma, H. Impacts of Climate Change on Water Resources Availability in Zambia: Implications for Irrigation Development. Environ. Dev. Sustain. 2020, 22, 2817–2838. [Google Scholar] [CrossRef]
  60. Forkuor, D.; Korah, A. NGOs and Sustainable Rural Development: Experience from Upper West Region of Ghana. Environ. Dev. Sustain. 2023, 25, 351–374. [Google Scholar] [CrossRef]
  61. Ononogbo, C.; Ohwofadjeke, P.O.; Chukwu, M.M.; Nwawuike, N.; Obinduka, F.; Nwosu, O.U.; Ugenyi, A.U.; Nzeh, I.C.; Nwosu, E.C.; Nwakuba, N.R.; et al. Agricultural and Environmental Sustainability in Nigeria: A Review of Challenges and Possible Eco-Friendly Remedies. Environ. Dev. Sustain. 2024, 26, 1–47. [Google Scholar] [CrossRef]
  62. Wanyama, J.; Bwambale, E.; Nakawuka, P. Comparative Performance Assessment of Pilot Irrigation Schemes in Uganda. Heliyon 2024, 10, e31600. [Google Scholar] [CrossRef]
  63. Zhang, J.; Chen, S.S.; Gao, Q.; Shen, Q.; Kimirei, I.A.; Mapunda, D.W. Morphological Characteristics of Informal Settlements and Strategic Suggestions for Urban Sustainable Development in Tanzania: Dar Es Salaam, Mwanza, and Kigoma. Sustainability 2020, 12, 3807. [Google Scholar] [CrossRef]
  64. Waldeck, L.; Holloway, J.; Van Heerden, Q. Integrated Land Use and Transportation Modelling and Planning: A South African Journey. J. Transp. Land Use 2020, 13, 227–254. [Google Scholar] [CrossRef]
  65. Fuglie, K.; Dhehibi, B.; El Shahat, A.A.I.; Aw-Hassan, A. Water, Policy, and Productivity in Egyptian AgricultureJEL Codes. Am. J. Agric. Econ. 2021, 103, 1378–1397. [Google Scholar] [CrossRef]
  66. Kogo, B.K.; Kumar, L.; Koech, R. Climate Change and Variability in Kenya: A Review of Impacts on Agriculture and Food Security. Environ. Dev. Sustain. 2021, 23, 23–43. [Google Scholar] [CrossRef]
  67. Hufkens, K.; de Haulleville, T.; Kearsley, E.; Jacobsen, K.; Beeckman, H.; Stoffelen, P.; Vandelook, F.; Meeus, S.; Amara, M.; Van Hirtum, L.; et al. Historical Aerial Surveys Map Long-Term Changes of Forest Cover and Structure in the Central Congo Basin. Remote Sens. 2020, 12, 638. [Google Scholar] [CrossRef]
  68. Gebrehiwot, T.; van der Veen, A. Farmers’ Drought Experience, Risk Perceptions, and Behavioural Intentions for Adaptation: Evidence from Ethiopia. Clim. Dev. 2021, 13, 493–502. [Google Scholar] [CrossRef]
  69. Li, C.; Kandel, M.; Anghileri, D.; Oloo, F.; Kambombe, O.; Chibarabada, T.P.; Ngongondo, C.; Sheffield, J.; Dash, J. Recent Changes in Cropland Area and Productivity Indicate Unsustainable Cropland Expansion in Malawi. Environ. Res. Lett. 2021, 16, 084052. [Google Scholar] [CrossRef]
  70. Bationo, L.J.; Diallo, A.; Topan, G.J. Heterogeneous and Average Effects of the Adoption of Sustainable Agricultural Practices on the Dietary Diversity of Smallholder Farmers in Burkina Faso. Food Energy Secur. 2025, 14, e70069. [Google Scholar] [CrossRef]
Figure 1. Location map of Tanzania.
Land 14 01771 g001
Figure 2. Spatial distribution of cropland in Tanzania from 1990 to 2020.
Land 14 01771 g002
Figure 3. Cropland area of seven zones in Tanzania of 2020.
Land 14 01771 g003
Figure 4. Spatial distribution of hotspots and coldspots in relation to cropland changes from 1990 to 2000.
Land 14 01771 g004
Figure 5. Spatial distribution of hotspots and coldspots in relation to cropland changes from 2000 to 2010.
Land 14 01771 g005
Figure 6. Spatial distribution of hotspots and coldspots in relation to cropland changes from 2010 to 2020.
Land 14 01771 g006
Figure 7. Standard deviation ellipse analysis map of rainfed and irrigated cropland in Tanzania.
Land 14 01771 g007
Figure 8. q-value of cropland distribution influencing factors in Tanzania from 1990 to 2020.
Land 14 01771 g008
Table 1. Data used in the research.
Data TypeData NameData SourceRaw Data Format
Land cover dataLand coverhttps://zenodo.org/records/4280923
(accessed on 2 March 2025)
GeoTIFF
Natural environment dataRainfallhttps://climateknowledgeportal.worldbank.org/
(accessed on 5 March 2025)
NetCDF
Temperaturehttps://climateknowledgeportal.worldbank.org/ (accessed on 5 March 2025)NetCDF
Soil typehttps://www.ilri.org/
(accessed on 10 March 2025)
Shapefile
Elevationhttps://earthexplorer.usgs.gov/
(accessed on 10 March 2025)
GeoTIFF
River networkhttps://download.geofabrik.de/index.html
(accessed on 15 March 2025)
Shapefile
Socioeconomic dataRoad networkhttps://download.geofabrik.de/index.html
(accessed on 15 March 2025)
Shapefile
Populationhttps://ghsl.jrc.ec.europa.eu/
(accessed on 15 March 2025)
GeoTIFF
GDPhttps://www.nature.com/articles/s41597-022-01322-5 (accessed on 15 March 2025)GeoTIFF
Statistics datahttp://www.nbs.go.tz
(accessed on 18 March 2025)
CSV
Administrative divisions dataAdministrative divisionshttp://www.nbs.go.tz
(accessed on 18 March 2025)
Shapefile
Table 2. Land cover types and areas in Tanzania from 1990 to 2020 (unit: km2).
Land Cover Types1990200020102020
Rainfed cropland161,185.85 169,491.87 161,735.97 159,665.01
Irrigated cropland1265.67 15,140.69 17,515.74 20,643.70
Grassland24,963.58 50,661.09 52,924.53 55,864.86
Forest496,759.22 429,299.47 432,404.18 428,184.65
Shrubland195,764.27 213,101.48 212,162.62 210,287.21
Wetland7647.06 8271.27 8568.73 9464.35
Water body4626.58 3692.80 3397.88 3111.20
Impervious surfaces921.92 1141.06 1754.78 2375.52
Bare land3076.49 5410.57 5745.86 6613.78
Table 3. Conversion of rainfed and irrigated cropland to other land types from 1990 to 2020 (unit: km2).
2000Rainfed CroplandIrrigated CroplandGrasslandForestShrublandWetlandWater BodyImpervious SurfacesBare Land
1990
Rainfed cropland98,492.83 6446.52 4380.89 16,810.33 33,444.11 1049.05 96.31 77.68 388.11
Irrigated cropland334.97 333.31 111.72 114.60 298.57 37.87 3.73 0.95 29.96
2010Rainfed croplandIrrigated croplandGrasslandForestShrublandWetlandWater bodyImpervious surfacesBare areas
2000
Rainfed cropland154,683.75 1698.63 1027.87 3493.36 7872.06 222.18 46.49 279.04 168.49
Irrigated cropland60.15 14,972.10 23.31 8.21 57.39 10.56 2.94 0.68 5.35
2020Rainfed croplandIrrigated croplandGrasslandForestShrublandWetlandWater bodyImpervious surfacesBare areas
2010
Rainfed cropland153,005.94 1947.21 1112.38 1174.42 3560.26 395.45 12.23 245.62 282.46
Irrigated cropland44.01 17,238.57 92.99 3.43 61.86 45.10 1.42 1.29 27.05
Table 4. Conversion of other land types to rainfed and irrigated cropland from 1990 to 2020 (unit: km2).
2000Rainfed CroplandIrrigated Cropland 2010Rainfed CroplandIrrigated Cropland 2020Rainfed CroplandIrrigated Cropland
1990 2000 2010
Grassland704.81407.72Grassland112.0944.58Grassland42.2370.31
Forest33,648.143330.02Forest2426.71154.00Forest2698.57281.93
Shrubland35,683.544367.29Shrubland4246.04581.54Shrubland3854.901077.24
Wetland363.26139.60Wetland118.7831.19Wetland13.2810.02
Water body184.0265.11Water body75.5030.02Water body4.9016.03
Impervious surfaces00Impervious surfaces00Impervious surfaces0.380.71
Bare land80.3051.11Bare land12.953.66Bare land0.801.68
Table 5. Analysis results of standard deviation ellipse analysis for rainfed and irrigated cropland in Tanzania.
YearCentral CoordinatesSemi-Major Axis (km)Semi-Minor Axis (km)Azimuth
(°)
Area
(104 Km2)
Oblateness
Rainfed cropland199034°3′39″, 4°36′1″342.51219.56151.6823.620.36
200033°46′44″, 4°5′41″285.69192.21117.8017.250.33
201034°8′9″, 4°56′19″337.09251.59143.5926.640.25
202034°7′35″, 4°56′52″314.81247.42152.7224.470.21
Irrigated cropland199034°6′30″, 5°14′12″375.50263.43171.5131.070.30
200034°25′19″, 5°32′47″366.48252.82158.3229.110.31
201034°21′36″, 5°34′6″359.52246.57159.8027.850.31
202034°18′4″, 5°38′12″353.29244.35161.3727.120.31
Disclaimer/Publisher’s Note: The statements, opinions and data contained in all publications are solely those of the individual author(s) and contributor(s) and not of MDPI and/or the editor(s). MDPI and/or the editor(s) disclaim responsibility for any injury to people or property resulting from any ideas, methods, instructions or products referred to in the content.