Article

Spatial and Functional Heterogeneity in Regional Resilience: A GIS-Based Analysis of the Chengdu–Chongqing Economic Mega Region

1
College of Geography and Planning, Chengdu University of Technology, Chengdu 610059, China
2
Research Center for Human Geography of Tibetan Plateau and Its Eastern Slope, Chengdu University of Technology, Chengdu 610059, China
3
Department of Regional and City Planning, College of Architecture and Civil Engineering, Zhejiang University, Hangzhou 310058, China
4
Surveying and Mapping Geographic Information Center, Sichuan Institute of Geological Survey, Chengdu 610072, China
*
Author to whom correspondence should be addressed.
Land 2025, 14(9), 1769; https://doi.org/10.3390/land14091769
Submission received: 13 July 2025 / Revised: 16 August 2025 / Accepted: 27 August 2025 / Published: 30 August 2025

Abstract

The Chengdu–Chongqing Economic Mega Region (CCEMR), as a strategic economic hub in Western China, is increasingly facing challenges in balancing urban growth, agricultural stability, and ecological conservation within its territorial spatial planning framework. This study addresses the critical need to integrate multidimensional resilience assessment into China’s territorial spatial planning system. A framework for functional resilience assessment was developed through integrated GIS spatial analysis, with three resilience dimensions explicitly aligned to China’s “Three Zones and Three Lines” (referring to urban, agricultural, and ecological space and spatial control lines) territorial planning system: urban resilience was evaluated using KL-TOPSIS ranking, where weights were derived from combined Delphi expert consultation and AHP; agricultural resilience was quantified through the entropy method for weight determination and GIS raster calculation; and ecological resilience was assessed via a Risk–Recovery–Potential (RRP) model integrating Ecosystem Risk, Recovery Capacity (ERC), and Service Value (ESV) metrics, implemented through GIS spatial analysis and raster operations. Significant spatial disparities emerge, with only 1.29% of CCEMR exhibiting high resilience (concentrated in integrated urban–ecological zones like Chengdu). Rural and mountainous areas demonstrate moderate-to-low resilience due to resource constraints, creating misalignments between resilience patterns and current territorial spatial zoning schemes. These findings provide scientific evidence for optimizing the delineation of the Three Major Spatial Patterns: urbanized areas, major agricultural production zones, and ecological functional zones. In this research, a transformative methodology is established for translating resilience diagnostics directly into territorial spatial planning protocols. By bridging functional resilience assessment with statutory zoning systems, this methodology enables the following: (1) data-driven resilience construction for the Three Major Spatial Patterns (urbanized areas, major agricultural production zones, and ecological functional zones); (2) strategic infrastructure prioritization; and (3) enhanced cross-jurisdictional coordination mechanisms. The framework positions spatial planning as a proactive tool for adaptive territorial governance without requiring plan revision.

1. Introduction

Spatial conflicts among urbanization, agriculture, and ecological systems represent a globally widespread phenomenon. Cropland expansion and urban expansion both contribute to the loss and degradation of natural habitats [1,2], while urban expansion may also lead to reductions in farmland [3,4]. The loss of natural habitats, in turn, compromises the security of agriculture [5,6] and urban areas [7,8] during the outbreak of natural disasters.
This global challenge is especially pronounced in rapidly developing nations such as China. Since the early 21st century, China’s rapid urbanization and industrialization have fundamentally reshaped national spatial patterns, creating simultaneous growth in mega-cities (>10 million people) and depopulated rural areas. This transformation has exposed regions to interconnected challenges—natural disasters, food insecurity, economic volatility, and social strains—amplified by global climate change. Enhancing regional resilience is now critical for sustainable development and risk mitigation [9,10], particularly in strategic economic hubs like Western China’s Chengdu–Chongqing Economic Mega Region (CCEMR).
As a rapidly growing [11], urbanizing [12], and industrializing [13] economic zone facing ecological degradation [14], economic disparities [15], and disaster vulnerability [16], the CCEMR exemplifies these pressures. Consequently, China has prioritized it for resilience-building through territorial spatial governance, aligning with national strategies to establish a new pattern of spatial development characterized by urbanized areas, major agricultural production zones, and ecological functional zones [17].
While regional resilience—defined as a region’s capacity to prepare for, absorb, and adapt to disruptions—is widely recognized [18,19], this further encompasses capacities for adaptation and proactive transformation [20,21]. However, critical limitations persist in current assessments [22,23,24,25,26]: they are often disconnected from China’s Three Major Spatial Patterns (urbanized areas, major agricultural production zones, and ecological functional zones); they isolate social, economic, infrastructural, or ecological dimensions while neglecting their interdependencies; and they underintegrate ecological security despite its foundational role. To address these gaps, in this study, we develop a novel urban–agricultural–ecological functional integration framework for the Chengdu–Chongqing Economic Mega Region (CCEMR) that advances spatial governance priorities by quantifying ecological security’s contribution to regional resilience.
Accordingly, this study is guided by the following specific objectives: (1) to develop a multidimensional, GIS-based framework for assessing regional resilience that integrates urban, agricultural, and ecological dimensions; (2) to quantify and map the spatial heterogeneity and functional stratification of resilience across the CCEMR, with explicit identification of transitional and vulnerable zones; (3) to analyze the impact of different governance priorities and weighting schemes on resilience patterns, revealing policy-sensitive spatial mismatches; and (4) to translate resilience assessment results into actionable territorial spatial zoning recommendations, supporting adaptive governance and cross-jurisdictional coordination. These objectives provide a clear basis for evaluating the relevance and applicability of the results presented in this study.
Our approach provides policymakers and planners with robust tools for evidence-based spatial governance. The structure of this paper is as follows: Section 2 provides a review of the relevant literature on regional resilience, identifies existing research gaps, and clarifies the positioning and innovations of this study. In Section 3, we outline the geographical and economic context of the study area—the CCEMR—detailing the data sources and preprocessing procedures. In Section 4, we introduce the research framework, discuss the GIS spatial analysis methods, and explain the construction of the comprehensive resilience evaluation index system. In Section 5, we present the spatial distribution of regional resilience within the CCEMR, evaluate the influence of various indicators, and analyze temporal changes in resilience levels. In Section 6, we offer an in-depth interpretation of the results, discuss their implications, compare them with existing literature, and identify the limitations of the study. Finally, in Section 7, we summarize the main findings, offer policy recommendations to enhance regional resilience, and suggest potential avenues for future research.

2. Concise Literature Review

2.1. Conceptual Evolution Toward Functional Integration

Resilience theory originated in ecology [27], emphasizing systems’ capacity to maintain functions under stress. Over time, the concept has evolved to encompass multiple types of resilience, each reflecting distinct theoretical perspectives and practical implications:
  • Engineering resilience focuses on the speed and efficiency with which a system returns to equilibrium after disturbance, emphasizing recovery and stability [27,28];
  • Ecological resilience highlights a system’s ability to absorb shocks and reorganize while undergoing change, maintaining critical functions and structures [28,29];
  • Evolutionary (or adaptive) resilience extends the concept further, emphasizing the capacity for transformation, learning, and adaptation in response to ongoing or novel disturbances [30,31].
Contemporary scholarship defines regional resilience (RR) as a territory’s capacity to anticipate, absorb, adapt to, and transform amid disturbances [32,33]. Critically, this reflects a threefold paradigm shift from recovery-centric models (e.g., engineering resilience) toward adaptive capacity integrating economic, social, and ecological dimensions [28,31], yet neglecting China’s Three Major Spatial Patterns—urbanized areas, major agricultural production zones, and ecological functional zones—as operational resilience units [17].
This evolution reconceptualizes resilience in the following ways: first as an adaptive process enabling transformation—not mere recovery [30]; second as demanding the integration of social, economic, ecological, and governance dimensions [22,34]; and third as having acute gaps in ecological–functional integration, where urban-centric frameworks underprioritize biodiversity and resource security [12,35].

2.2. Overview and Limitations of Regional Resilience Frameworks

A variety of frameworks have been developed globally to assess regional resilience, each reflecting different disciplinary perspectives and practical priorities. Key approaches include the following:
  • Sustainable Livelihood Approach (SLA): Focuses on rural livelihood assets and vulnerability [26], but neglects urban–ecological synergies essential for territorial planning.
  • PEOPLES Framework: Integrates population, infrastructure, economy, and social dimensions [24], yet overlooks agricultural functional resilience, a core pillar of China’s Three Major Spatial Patterns.
  • Pressure–State–Response (PSR) Model: Emphasizes ecological dynamics and environmental stressors [25] but demonstrates weak integration of socioeconomic systems.
  • Regional Resilience Process–Outcome (RRPO) Framework: Captures temporal changes and adaptive processes [23] but fails to bridge urban–agricultural–ecological interdependencies.
  • Community Resilience Frameworks: Highlight social capital, governance, and adaptive capacity [34].
  • Urban Resilience Index (URI): Quantifies urban infrastructure and service robustness [36].
  • Other integrated models: Such as the Resilience Alliance’s panarchy model [29], and the Rockefeller Foundation’s City Resilience Framework [37].
These frameworks vary in their emphasis on social, economic, infrastructural, and ecological dimensions, and in their ability to capture cross-system interdependencies and spatial heterogeneity. However, when applied to integrated spatial governance contexts, most existing frameworks remain siloed and prove inadequate for operationalizing China’s paradigm, where urban development zones, agricultural production bases, and ecological conservation areas function as synergistic components of resilient territories.

2.3. GIS as a Tool for Functional Integration

While probabilistic models oversimplify system dynamics [38] and structural approaches (e.g., fuzzy logic) encounter data-intensity barriers [39], GIS spatial analysis emerges as a critical methodological enabler for functional resilience assessment. It quantifies cross-dimensional resilience through spatially explicit indicators—such as green infrastructure connectivity (urban), cropland stability (agricultural), and habitat integrity (ecological) [40]—while enabling functional synergy mapping (e.g., visualizing ecological corridors that mitigate urban flood risks while preserving farmland productivity). This capability positions GIS as a transformative tool for operationalizing China’s integrated spatial governance paradigm, though its efficacy remains contingent on high-resolution data across all functional zones.

2.4. Research Gap: Lack of Functional Integration Metrics

Although the multidimensional nature of regional resilience has been recognized [41,42], critical gaps persist: current assessments fail to operationalize China’s urban–agricultural–ecological functional zoning as an integrated resilience metric, while prevailing methodologies fragment evaluations across economic, social, and ecological dimensions rather than capturing their synergies [33,35,43]. Internationally, similar limitations are observed in resilience studies that focus on single-sector or administrative-boundary analyses, often neglecting cross-system interactions and spatial functional integration [44,45,46,47]. For example, Cutter et al. [44] and Meerow et al. [45] highlight the lack of operational metrics for integrated resilience across urban, agricultural, and ecological domains, while Levin et al. [46] and Gu et al. [47] emphasize the need for frameworks that capture spatial heterogeneity and functional linkages.
To address these dual limitations, this study proposes a GIS-based functional integration framework that quantifies resilience through spatial interactions across three core zones: (1) urbanized areas (economic density, infrastructure robustness); (2) major agricultural production zones (production stability, soil conservation); and (3) ecological functional zones (biodiversity, water/air purification). This approach uniquely quantifies cross-functional dependencies, such as the impacts of urban sprawl on agricultural resilience. It provides the first operational model that aligns regional resilience assessment with China’s spatial governance imperatives.

2.5. Research Objectives for Functional Integration

In light of the identified gaps in current regional resilience assessments and the need for functional integration, this study is guided by the following objectives: (1) to develop a multidimensional, GIS-based framework for assessing regional resilience that integrates urban, agricultural, and ecological dimensions; (2) to quantify and map the spatial heterogeneity and functional stratification of resilience across the CCEMR, with an explicit identification of transitional and vulnerable zones; (3) to analyze the impact of different governance priorities and weighting schemes on resilience patterns, revealing policy-sensitive spatial mismatches; and (4) to translate resilience assessment results into actionable territorial spatial zoning recommendations, supporting adaptive governance and cross-jurisdictional coordination. These objectives provide a clear basis for evaluating the relevance and applicability of the results presented in subsequent sections.

3. Study Region and Relevant Data

3.1. Region Overview

The study area, known as the CCEMR, covers two key regions in western China: Chongqing Municipality and Chengdu, the capital of Sichuan Province. Spanning about 185,000 square kilometers, this region is home to over 90 million people, making it one of China’s most densely populated and economically significant areas. As of 2018, the population of the CCEMR was approximately 94.91 million, with varying population densities across the region. Chengdu has a population density of around 1139 people per square kilometer, while Yuzhong District in Chongqing, one of the most urbanized areas, has an exceptionally high density of about 28,000 people per square kilometer [48,49]. Such high densities create challenges for disaster management and emergency evacuations, making the region more vulnerable to large-scale disruptions.
Economically, the CCEMR is a crucial part of China’s development, contributing significantly to both national and regional GDP. In 2018, the region’s GDP reached 5.5 trillion CNY, representing 6% of China’s national GDP and 28.4% of the GDP of Western China [48,49]. The urbanization rate exceeds 60% [50], with cities like Chengdu and Chongqing emerging as centers of technological innovation and economic activity. These cities serve as vital links between China’s wealthier eastern regions and the less-developed western regions, driving economic growth and helping to balance national development.
Geographically, the CCEMR is diverse, featuring landscapes ranging from the Western Sichuan Plateau to the plains and hills of central and Eastern Sichuan. This diversity presents challenges for infrastructure development, particularly in the mountainous areas where building transportation and communication networks is difficult. The region experiences a subtropical monsoon climate, with hot, humid summers and mild, humid winters. Average annual temperatures range from 16 °C to 18 °C, and rainfall is between 900 and 1200 mm [51,52]. These conditions are ideal for agriculture, especially in the fertile plains where crops like rice, corn, and wheat are grown. The region also has a high forest coverage rate of 41.9% [53], which supports biodiversity conservation and ecological stability.
The CCEMR plays an important role in China’s spatial planning strategy, which seeks to balance urban growth, agricultural production, and environmental preservation. The region is divided into three main zones: urbanized areas focused on economic and technological growth, agricultural zones that ensure food security, and ecological zones located in the mountains and forests, which are dedicated to environmental conservation. This zoning approach helps promote sustainable development without compromising the region’s ecological health.
The study covers 15 cities in Sichuan, including Chengdu, Zigong, Yibin, and Deyang, and 28 districts and counties in Chongqing, such as Hechuan, Yuzhong, and Nan’an, all within the 185,000 square kilometers under investigation (see Figure 1). However, the region faces several challenges, such as natural disasters like earthquakes, floods, and landslides. Social issues like an aging population, rural depopulation, and a shrinking agricultural workforce also pose risks. The region’s varied terrain complicates infrastructure development, making it more vulnerable to both environmental and social disruptions.

3.2. Data Sources and Preprocessing

In this study, a wide range of data were used to assess the economic, social, and environmental conditions of the CCEMR. Geographic data, including administrative boundaries, were obtained from the Resource and Environmental Science Data Registration and Publishing System [54]. Socioeconomic and environmental data were mostly sourced from statistical yearbooks published by Sichuan Province, Chongqing Municipality, and local districts [48,49]. These provide detailed insights into demographics, economic performance, and environmental conditions.
For spatial analysis, key datasets were obtained from the Chinese Academy of Sciences and other institutions, including land-use data [55], climate records [56], soil composition [57], and vegetation indices such as NDVI and NPP [58,59]. Soil organic carbon content was sourced from the World Soil Database, while biodiversity information was drawn from the China Biodiversity Baseline Assessment Report [60]. These environmental datasets support the evaluation of ecological health and agricultural potential. Additionally, agricultural price data for staple crops (rice, corn, potatoes) were collected from the China Yearbook of Agricultural Price Survey (2019) [61] to inform the region’s agricultural economic analysis.
All spatial data were standardized to compatible coordinate systems (UTM Zone 49N and WGS84), and statistical data were linked to administrative boundaries at the prefecture level. Due to differences in data units, all datasets were normalized prior to analysis. This allowed the use of ArcGIS Pro software (version 3.5.2) for detailed spatial analysis and visualization. By combining these datasets, the study forms a solid foundation for understanding the region’s challenges and opportunities, supporting decision-making for sustainable development.

4. Methods and Models

4.1. Integrated Functional Resilience Framework

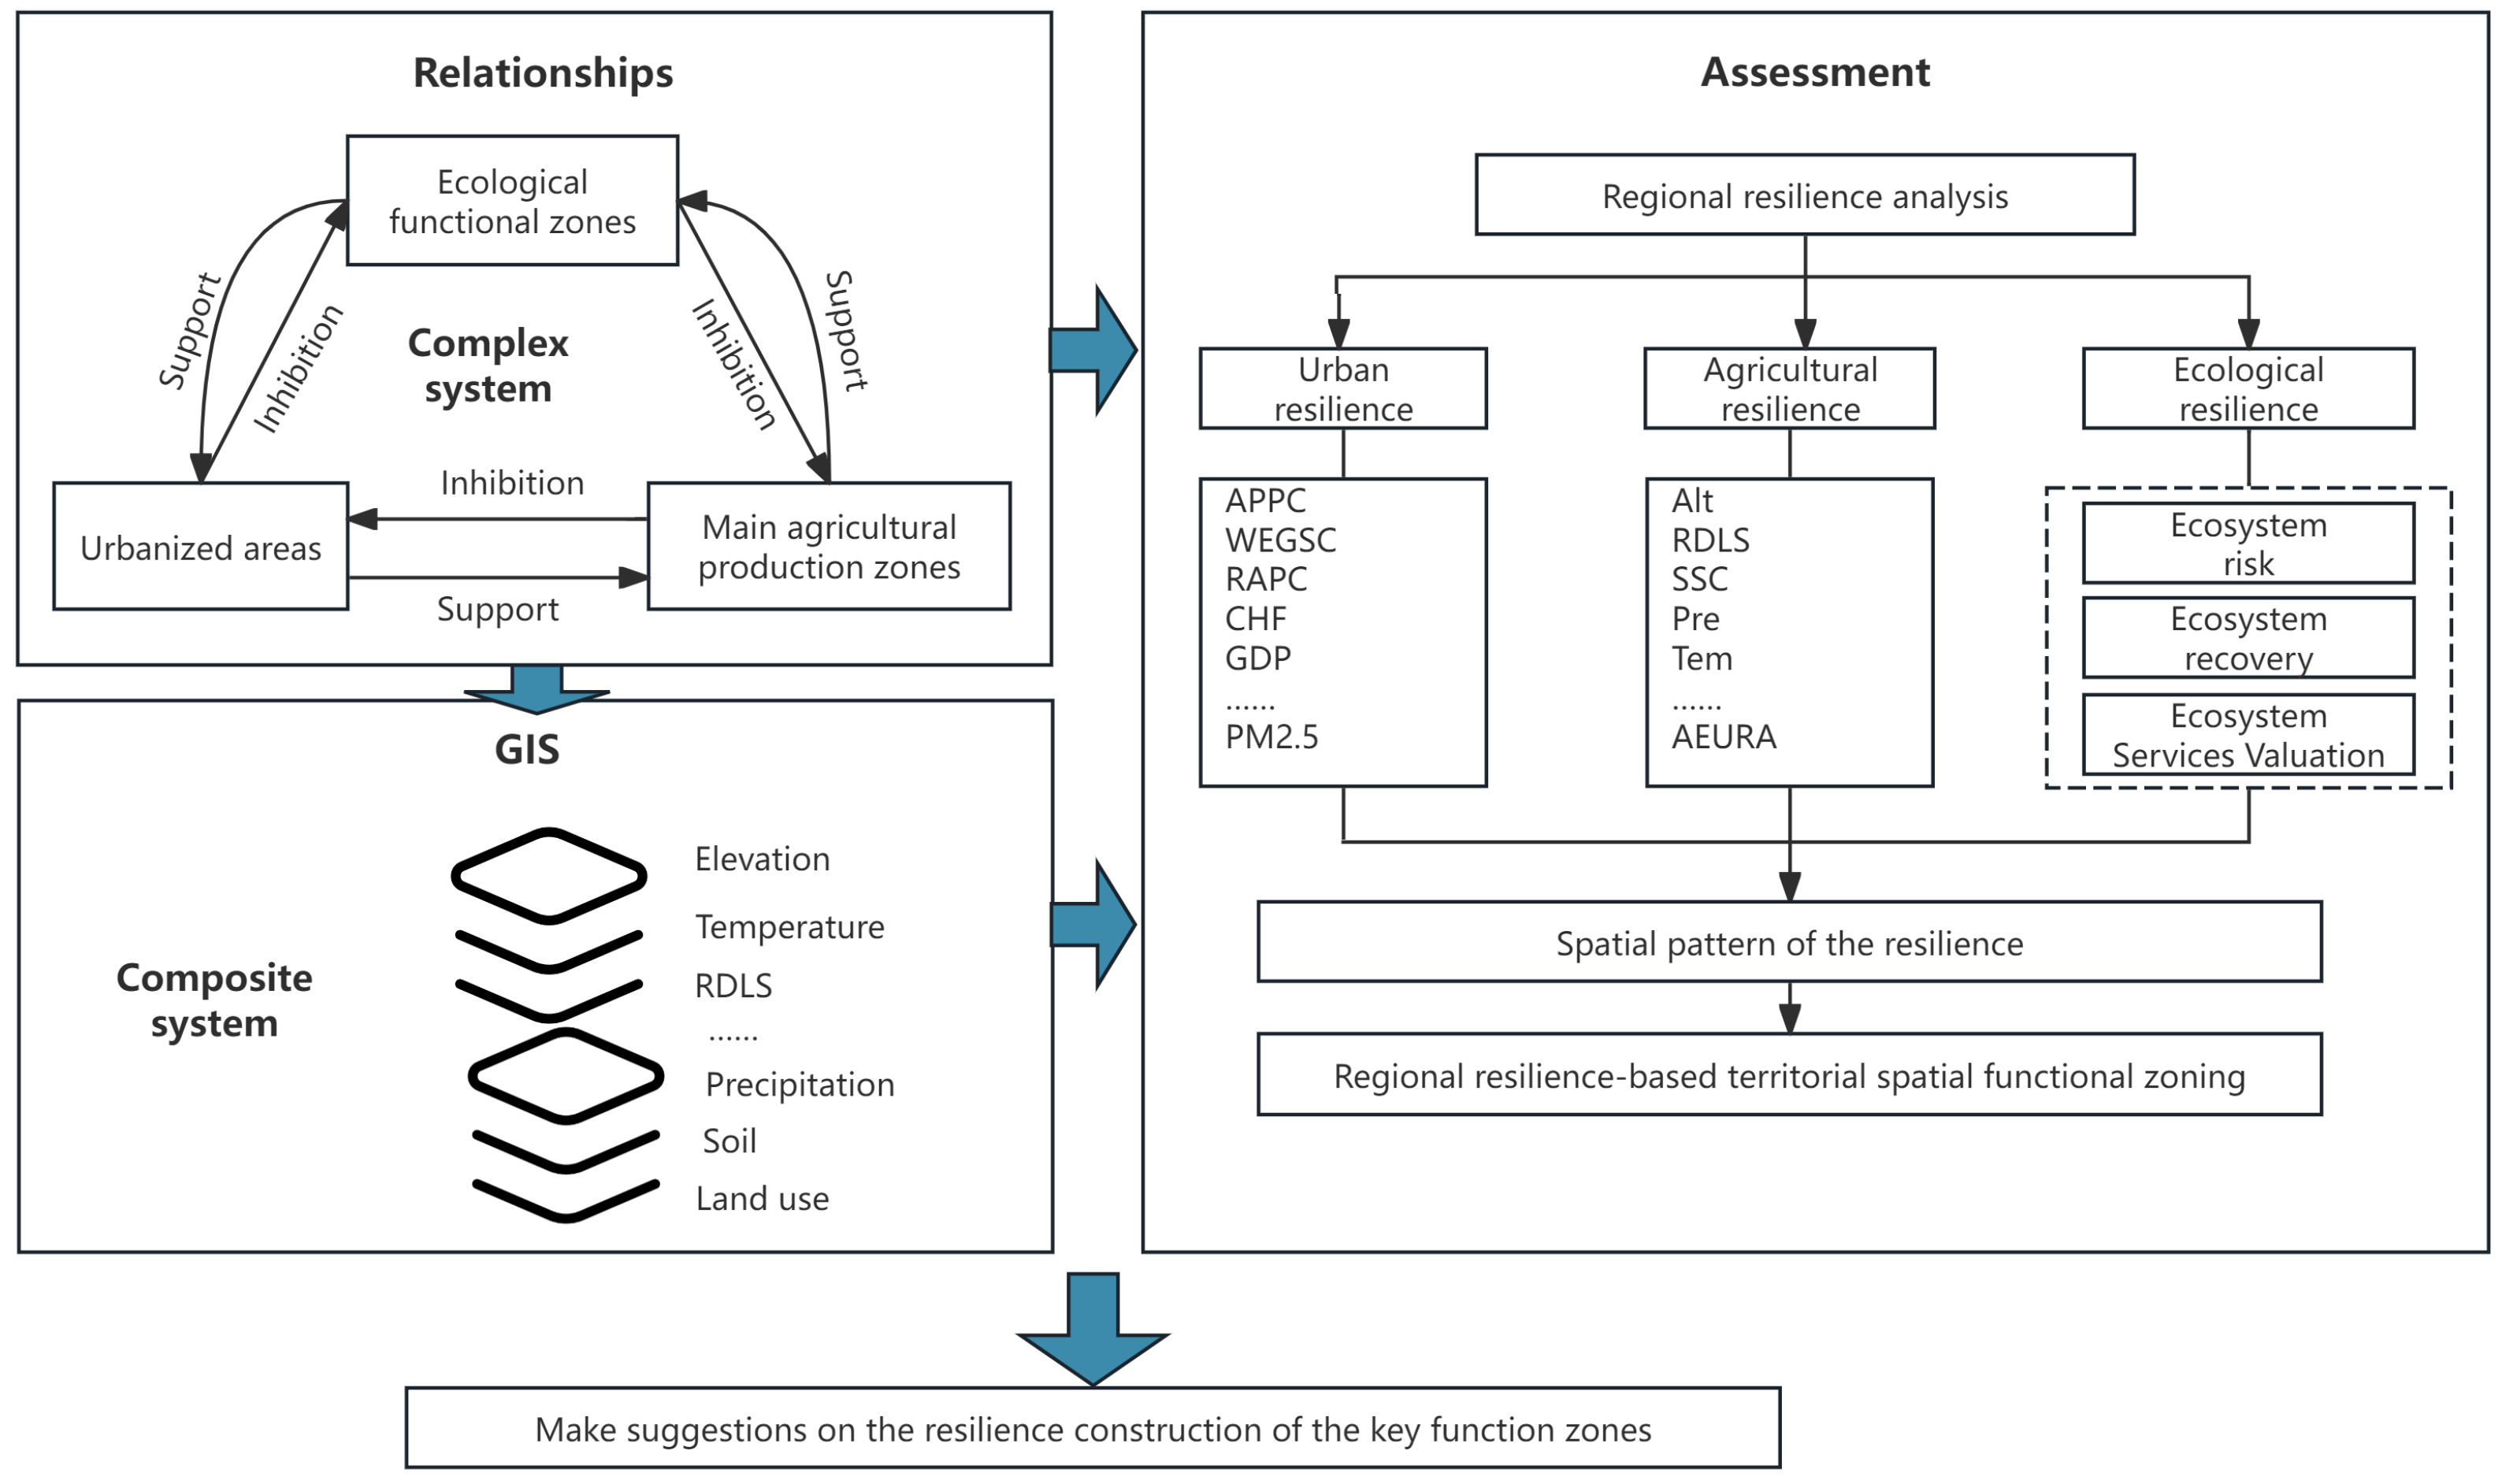
Regional resilience in the CCEMR is evaluated through a GIS-integrated functional zoning approach dividing resilience into three spatially explicit dimensions (Figure 2): (1) Urban Resilience: the capacity of urbanized areas to withstand economic/social shocks; (2) Agricultural Resilience: the stability of major agricultural production zones; and (3) Ecological Resilience: the adaptive capacity of ecological functional zones. This framework operationalizes China’s Three Major Spatial Patterns through quantifiable spatial interactions (e.g., urban–agricultural encroachment dynamics).
Figure 2 provides an overview of the integrated research framework guiding this study. It highlights the dynamic relationships among urban, agricultural, and ecological functional zones, and demonstrates how multi-source spatial data are synthesized within a GIS environment to support resilience assessment. The framework organizes the evaluation of urban, agricultural, and ecological resilience through targeted indicators, integrates these assessments to reveal spatial patterns, and informs the delineation of key functional zones. This schematic serves as the foundation for the study’s methodological design and underpins the translation of resilience diagnostics into actionable spatial planning strategies.

4.2. Resilience Assessment Protocol

A standardized five-stage workflow was implemented consistently across all resilience dimensions:
(1)
Indicator Selection. Domain-specific metrics identified through literature review and policy alignment.
(2)
Data Normalization. Min–Max scaling applied to all indicators:
X norm = X X min X max X min
(3)
Weight Assignment. For urban resilience, a Delphi–AHP hybrid approach combined expert judgment with hierarchical pairwise comparisons; for agricultural resilience, the entropy method objectively weighted indicators based on inter-district variability; and for ecological resilience, literature-derived weights were synthesized from established ecosystem valuation studies.
(4)
Dimension-Specific Modeling. Dimension-specific modeling approaches were implemented: KL-TOPSIS quantified urban resilience through multi-criteria decision analysis under uncertainty; categorical scoring with tiered classification assessed agricultural resilience across discrete environmental conditions; and ecological resilience was computed through the integrated synthesis of Risk–Recovery–Potential (RRP) components. Each methodology was deliberately aligned with the functional characteristics of its respective spatial zone.
(5)
GIS Integration. The final stage employed GIS integration to synthesize all dimension-specific outputs through raster-based spatial analysis at 1000 m resolution, ensuring consistent cross-dimensional comparability while enabling the precise mapping of functional zone interactions across the CCEMR.
Data sources and weighting methods per dimension summarized in Table 1.

4.3. Urban Resilience Assessment

4.3.1. Indicator System

The urban resilience assessment framework integrates 20 indicators across four dimensions (see Figure 3), building on established methodologies [36,62,63,64]. The indicators were categorized into four dimensions as follows:
  • Infrastructure: Area of parkland per capita (APPC), water, electricity, and gas supply capacity (WEGSC), road area per capita (RAPC), and conditions in health facilities (CHF).
  • Economic: Gross domestic product (GDP), GDP per capita, public financial expenditure (PFE), fixed assets investment in public facilities (FAIPF), and residents’ savings deposit balance (RSDB).
  • Social: Population, population density (PD), leadership levels (LSL), urbanization rates (UR), community self-organization (CSO), and housing area per capita (HAPC).
  • Environmental: Sewage treatment rate (STR), domestic waste disposal rate (DWDR), green rate (GR), industrial solid waste utilization rate (ISWUR), and PM2.5 concentration.

4.3.2. Weight Assignment

In this study, we combine Delphi expert consultation (policy relevance) and AHP (pairwise consistency CR < 0.1) [65,66]. Weights are validated via sensitivity analysis and are presented in Table 2.

4.3.3. Modeling

The KL-TOPSIS method (detailed in Appendix A) is applied to address skewed indicator distributions, quantify multidimensional distance to an ideal resilience state, and generate normalized resilience indices within the [0,1] range, enabling the robust cross-dimensional comparability of urban resilience performance.

4.4. Agricultural Resilience Assessment

4.4.1. Indicator System

Referencing related studies [67,68,69], an agricultural resilience evaluation index system is constructed using indicators from two dimensions: natural conditions and human activities.
  • Natural Factors: altitude (Alt), relief degree of land surface (RDLS), soil sand content (SSC), precipitation (Pre), temperature (Tem), and hours of sunshine (HSSs);
  • Human Factors: the amount of investment in farming, forestry, animal husbandry, and fishery (AIFFAHF), the amount of fertilizer applied (AFA), and rural electricity consumption (AEURA).

4.4.2. Weight Assignment

The entropy method [70,71] objectively weights indicators based on inter-regional variability to calculate the weights of the indicators. By measuring the uncertainty of information, the entropy method evaluates the degree of dispersion among indicators. Indicators with higher variability contribute more significantly to the overall evaluation and are assigned greater weights, while those with lower variability have smaller weights [72].
The indicators for agricultural resilience assessment and their respective weights are presented in Table 3.

4.4.3. Modeling

Each agricultural resilience indicator is classified into three levels (e.g., low, medium, and high), with corresponding scores of 1, 2, and 3, respectively. It is calculated using the following formula:
A R = 1 3 i = 1 n w i · S i
where S i is the score of the i-th indicator.
Sensitivity analysis confirms robustness to classification thresholds.

4.5. Ecological Resilience Assessment

It is important to note that, in this study, ‘ecological resilience’ refers to a composite metric integrating ecosystem risk, recovery capacity, and ecosystem service value, rather than the traditional ecological resilience concept focused solely on the ability of ecosystems to recover from disturbances [28,29]. This multidimensional approach enables a more comprehensive evaluation of ecological functions within the regional context.

4.5.1. Risk–Recovery–Potential Model Framework

Building on the established Pressure–State–Response (PSR) paradigm for ecological resilience assessment [35,73,74], this study develops the Risk–Recovery–Potential (RRP) model (Figure 4) with the following conceptual mapping:
  • Risk (Pressure): Land-use disturbance intensity;
  • Recovery (State): Autonomous regeneration capacity;
  • Potential (Response): Ecosystem service value provision.
Ecosystem risk is quantified through the Ecosystem Risk Index (ERI), which assigns land-use-specific weights to disturbance impacts—where anthropogenic land types (e.g., construction) increase risk, while natural covers (e.g., forests) mitigate it [75,76,77], with detailed weights in Table 4.
Ecological recovery is assessed using five key factors derived from regional studies [78,79,80]: soil organic carbon content, soil quality, air temperature, precipitation, and biodiversity (quantified via Species Diversity Index, SDI). Simultaneously, ecosystem service values are calculated based on land-use-specific economic valuations of ecological services per unit area.

4.5.2. Component Quantification

(1)
Ecosystem Risk Index (ERI)
E R I = i = 1 m A i W i A
where E R I is the Ecosystem Risk Index, A i is the area of the i-th land-use type, A is the total area of the grid, and W i is the weight representing the ecological risk intensity of the corresponding land-use type.
Computations are performed across 2098 hexagonal grid cells (10 km × 10 km), with each cell’s centroid representing localized risk.
(2)
Ecosystem Recovery (ERC)
The weighted synthesis of soil/climate/biodiversity factors is presented in Table 5.
The five recovery factors are integrated using weighted summation:
E R C = k = 1 5 w k · a k 4
where a k is the factor value, w k is the corresponding weight (Table 5), and division by 4 normalizes output to [0,1].
(3)
Ecosystem Service Value (ESV)
Referring to previous research [81,82], the formula for calculating the value of ecosystem services is as follows:
E S V k = A k i = 1 n E i
where E S V k represents the ecosystem service value of the k-th land-use type, A k is the area of land-use type k, and E i represents the ecosystem service value per unit area for the i-th ecosystem service type (CNY/ha).
The value of the per unit ecosystem service equivalent factor is defined as one-seventh of the economic value of the average grain yield per unit area in the given year [83], calculated as follows:
C = P × Q × 1 7
where C is the value of the ecosystem services equivalent factor (CNY/ha), P is the average grain price in the study area (CNY/kg), and Q is the grain yield per unit area in the study area (kg/ha).
The economic value of farmland ecosystem services is calculated at 2378.37 CNY/ha based on the study area’s average grain yield (5494.6 kg/ha) and crop price (3.03 CNY/kg) from 2018 data sources. Monetary values for all land-use types are derived using China’s standardized ecosystem service equivalents [84], with comprehensive results presented in Table 6.

4.5.3. Integration

Building on component analyses (Ecosystem risk, recovery, and service value), ecological resilience is calculated as follows:
E R = ( 1 E R I ^ ) + E R C ^ + E S V ^ 3
where E R represents ecological resilience, E R I ^ is the normalized ecosystem risk index, E R C ^ is the normalized ecosystem recovery, and E S V ^ is the normalized ecosystem services value.
Prior to raster calculation in ArcGIS Pro, all input datasets undergo critical harmonization: hexagonal-grid Ecosystem Risk Index (ERI) values are inverted and normalized; ecological recovery (ERC) and ecosystem service value (ESV) rasters are Min–Max standardized to [0,1]; and all layers are resampled to a consistent 1000 m resolution, ensuring dimensional compatibility and unitless comparability for integrated analysis.

4.6. Regional Resilience Integration

All dimension-level rasters (UR, AR, ER) undergo normalized preprocessing: resampled to 1000 m resolution, Min–Max normalized to [0,1], and integrated via equi-weighted summation using ArcGIS Pro’s raster calculator:
R R = U R ^ + A R ^ + E R ^ 3
where R R represents regional resilience, U R ^ is normalized urban resilience, A R ^ is normalized agricultural resilience, and E R ^ is normalized ecological resilience.

4.7. Methods Synthesis

This integrated methodological approach ensures that each resilience dimension is evaluated in a manner consistent with the theoretical framework, enabling direct comparison and synthesis in the results section. The use of GIS-based spatial analysis and multi-criteria decision methods provides a robust foundation for interpreting the spatial heterogeneity and functional integration of resilience, as highlighted in the literature review.

5. Results

5.1. Dimension-Specific Resilience Patterns

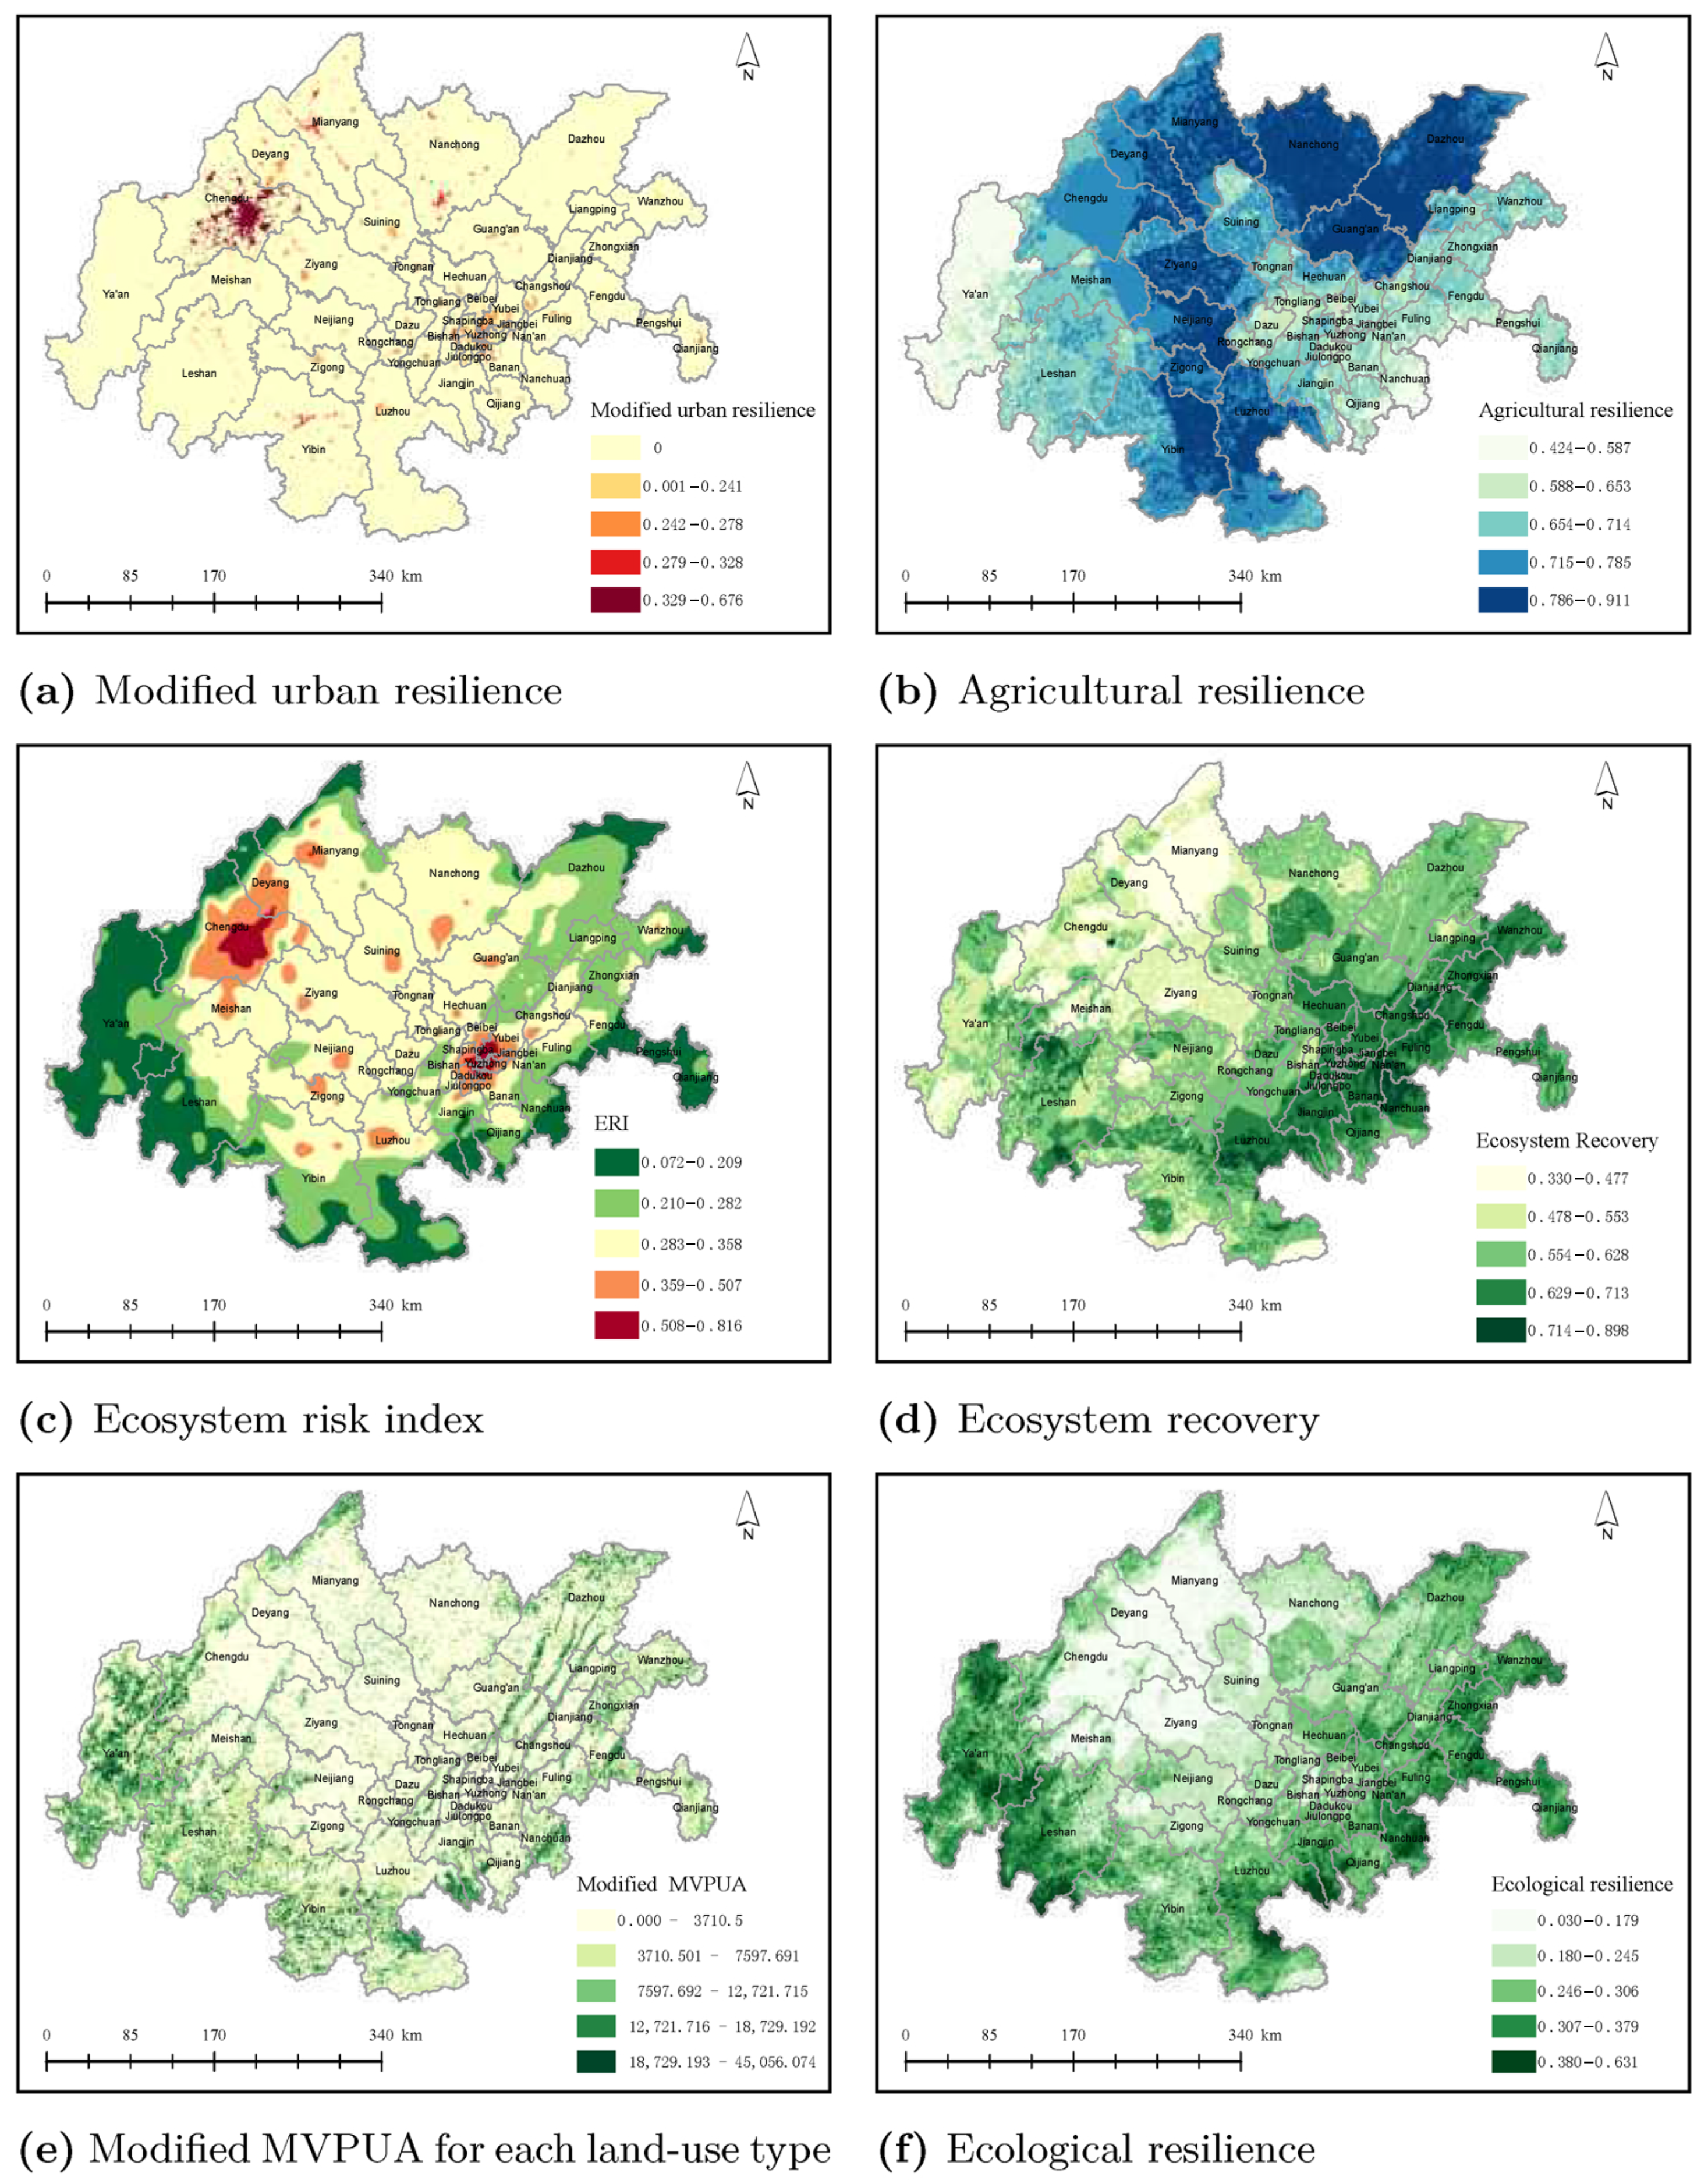
Urban resilience assessment initially follows administrative boundaries (prefecture-level cities in Sichuan province parts, and districts/counties in Chongqing city part). However, spatial misalignment with actual built-up areas is observed. Refinement using land-use data corrects this discrepancy, yielding a spatially explicit resilience map aligned with functional urban zones. The resulting urban resilience exhibits core–periphery stratification (Figure 5a), peaking in Chengdu’s metropolitan center (0.33–0.68) due to infrastructure robustness, economic density, and higher levels of urban governance, while revealing hidden vulnerabilities in western mountainous districts previously masked by administrative averaging. In contrast, agricultural resilience is highest in the hilly regions of the central Sichuan Basin (Figure 5b), where optimal climate and soil quality support crop stability, as opposed to the low resilience observed in western mountain areas.
Ecological resilience (Figure 5f) is not a standalone measure but rather a synthesis of three critical factors: the ecosystem risk index (Figure 5c), ecosystem recovery (Figure 5d), and ecosystem service value (Figure 5e). In this study, ecological resilience is calculated by integrating the normalized values of these three components, thereby ensuring that both vulnerability and adaptive capacity are reflected in the final resilience map. Consequently, regions with low ecosystem risk, strong recovery capacity, and high ecosystem service value—such as the peripheral mountains—demonstrate superior ecological resilience. Conversely, peri-urban areas and major agricultural zones, which are characterized by higher risk, reduced recovery, and lower service value, exhibit constrained ecological resilience due to anthropogenic disturbances. This comprehensive approach thus provides a more accurate representation of ecological resilience patterns and their underlying drivers within the CCEMR.

5.2. Integrated Regional Resilience

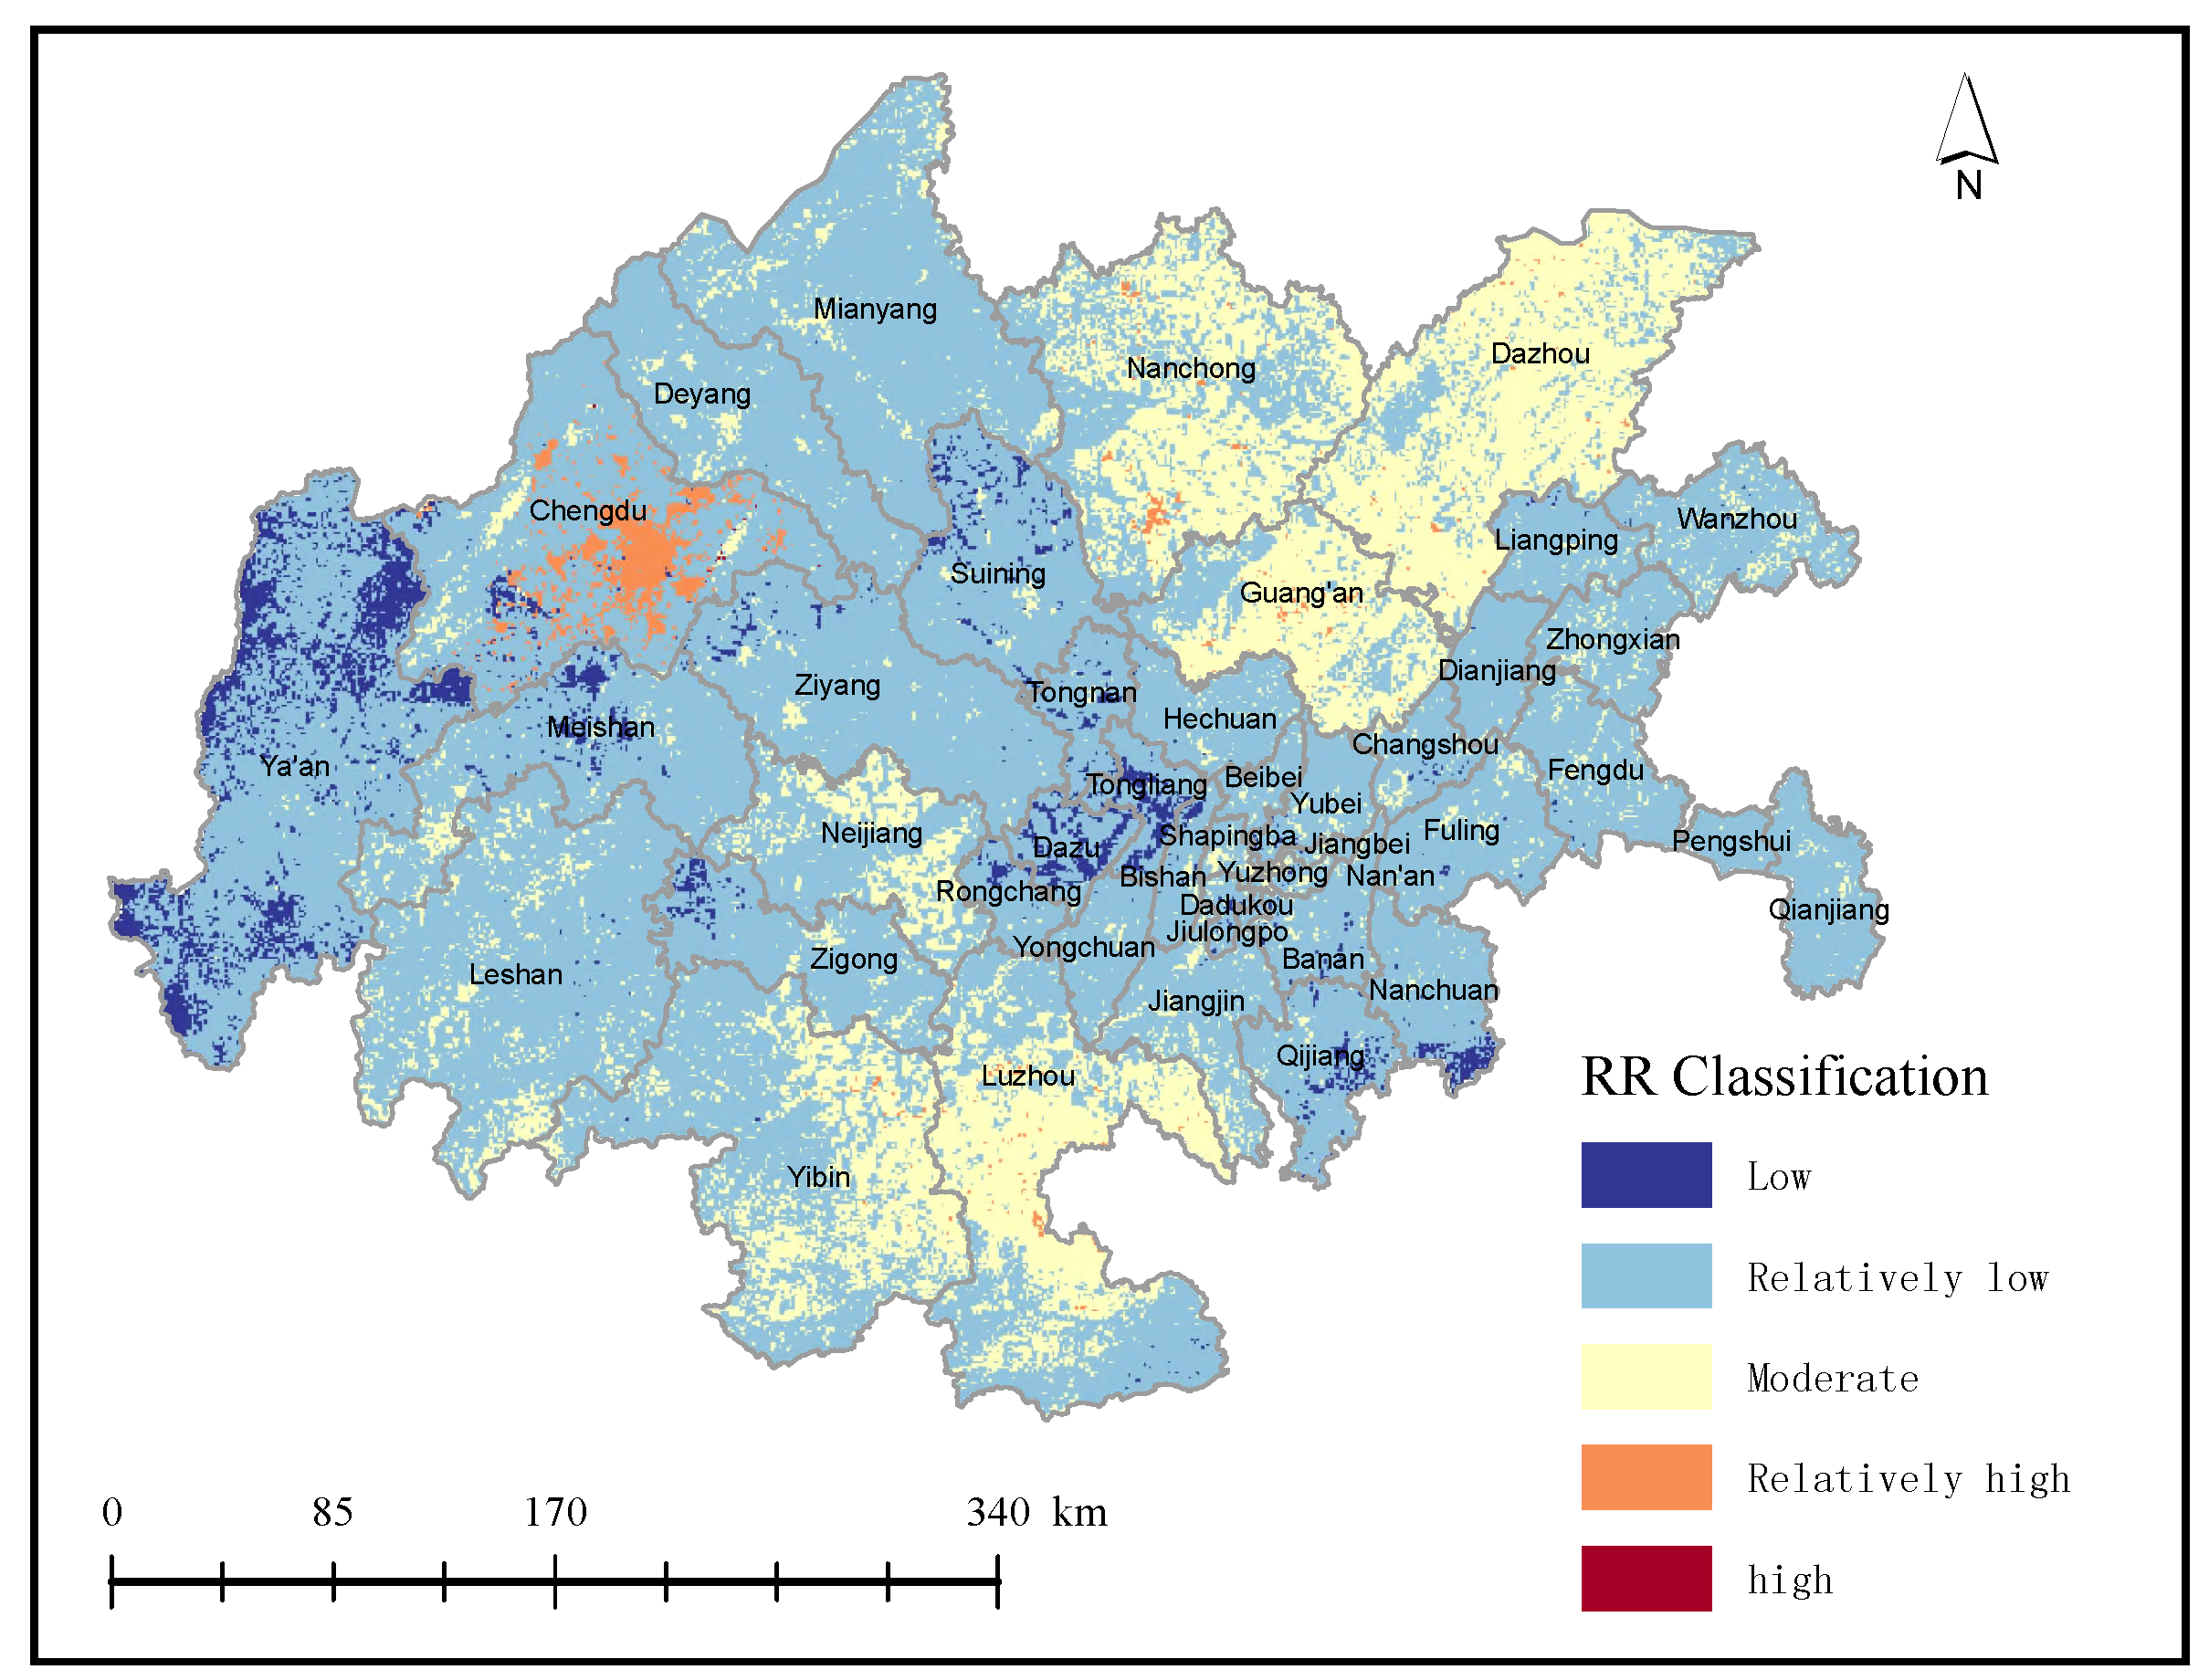
The baseline regional resilience (RR) under equal weights, calculated using Equation (8), ranges from 0.125 to 0.748 and was classified into five categories (Low, Relatively Low, Moderate, Relatively High, and High) using the equal intervals method. Thresholds are determined by the minimum and maximum RR index values across all weighting schemes (0.07–0.85), resulting in the following intervals: Low (0.07–0.23), Relatively Low (0.23–0.38), Moderate (0.38–0.54), Relatively High (0.54–0.69), and High (0.69–0.85). This approach ensures comparability across different governance scenarios. The corresponding statistics are summarized in Table 7.
  • Low (0.07–0.23): Ya’an mountains (3.73%, 6907 km 2 );
  • Relatively Low (0.23–0.38): 72.72% of CCEMR, 134 , 514 km 2 ;
  • Moderate (0.38–0.54): Transitional farmlands (22.26%, 41 , 179 km 2 );
  • Relatively High (0.54–0.69): Nanchong/Guang’an (1.28%, 2361 km 2 );
  • High (0.69–0.85): Chengdu’s core (0.01%, 15 km 2 ).
In Figure 6, spatially, relatively low resilience (light blue) dominates the CCEMR, mainly distributed in the central and eastern regions, including extensive peri-urban and agricultural zones. Moderate resilience areas (yellow-green) are primarily located in transitional farmlands and some urban peripheries. Low-resilience zones (dark blue) are concentrated in the western and southern mountainous regions, such as Ya’an, where the complex terrain and limited infrastructure contribute to vulnerability. Relatively high-resilience areas (orange) are scattered in cities like Nanchong and Guang’an, reflecting localized strengths in infrastructure and governance. High-resilience zones (red), though extremely limited, are almost exclusively found in the core metropolitan area of Chengdu, highlighting the concentration of robust infrastructure, economic density, and advanced urban management.
This spatial pattern reveals pronounced heterogeneity and functional stratification in regional resilience. The results indicate that resilience is not evenly distributed but is shaped by the interplay of urban, agricultural, and ecological factors. The prevalence of relatively low and moderate resilience areas highlights the need for targeted interventions in transitional and vulnerable zones, while the concentration of high resilience in metropolitan cores underscores the critical role of urban infrastructure and governance in enhancing regional resilience.

5.3. Policy-Weighting Sensitivities

To assess the impact of governance priorities on regional resilience, we conduct a sensitivity analysis using the baseline scheme and six alternative policy-driven weighting combinations (see Table 8), simulating ecological, agricultural, and urban development scenarios. All results are classified using consistent equal-interval thresholds, ensuring comparability across governance scenarios.
The spatial patterns under different weighting schemes (Figure 7) reveal that ecological and agricultural priorities tend to expand moderate and high-resilience zones, while urban-priority schemes concentrate resilience in metropolitan cores but increase vulnerability elsewhere. These results highlight the trade-offs and spatial reconfigurations inherent in policy-driven governance.
Figure 7 illustrates the spatial distribution of regional resilience under six alternative weighting schemes, each representing different governance priorities for urban (UR), agricultural (AR), and ecological (ER) resilience. Each weighting scheme produces distinct spatial patterns: ecological-priority schemes (Scheme 1) expand moderate-resilience areas (Figure 7a), agricultural-priority schemes (Scheme 3) concentrate high resilience in farmland regions (Figure 7c), and urban-priority schemes (Scheme 6) result in widespread low resilience except for small urban cores (Figure 7f). Balanced schemes (Schemes 2, 4 and 5) show intermediate patterns, reflecting trade-offs between development and stability (Figure 7b,d,e).
As shown in Table 9, agro-ecological balanced schemes significantly reduce vulnerable areas (Low + Relatively low) from 76.45% in the baseline to 42.40%, and expand moderate resilience to 54.12%, while urban intensification increases both high-resilience urban cores areas to 1.03% and low-resilience peripheral zones to 75.31%.
These findings demonstrate that weighting choices do not merely redistribute resilience but fundamentally reconfigure landscape functionality. The integrated, multidimensional assessment framework enables consistent and comparable classification across governance scenarios, providing spatial planners with a decision-support tool for customizing resilience strategies. Sensitivity analysis thus highlights the necessity of flexible, scenario-based planning approaches to optimize territorial spatial resilience in response to shifting policy priorities.

5.4. Bivariate Local Moran’s I Analysis of Resilience Dimension Associations

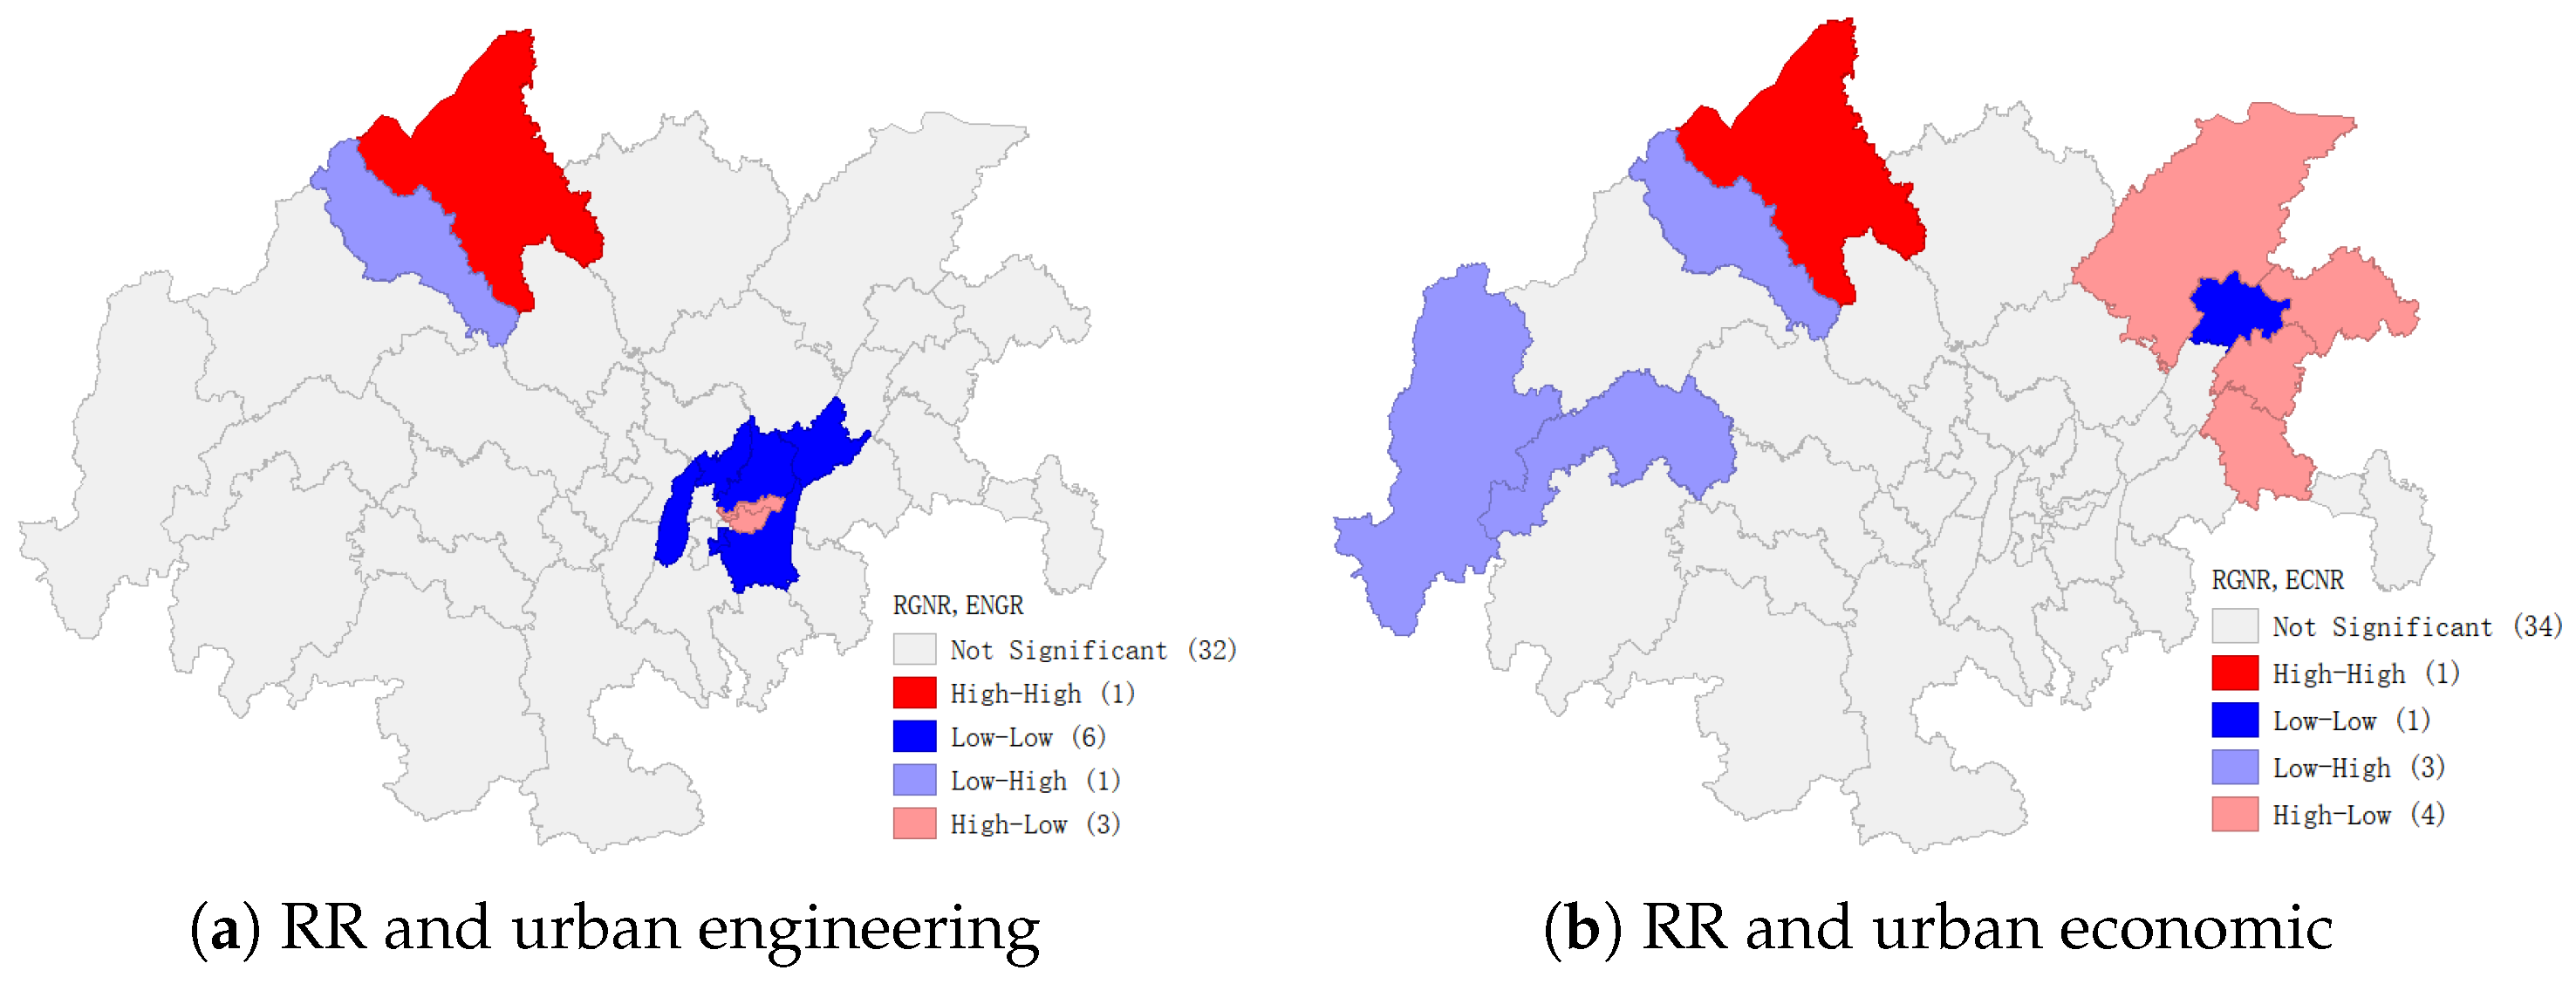
The Bivariate Local Indicators of Spatial Association (LISA) analysis reveals significant spatial interdependencies between regional resilience and constituent dimensions across the CCEMR’s 43 administrative units (see Figure 8).
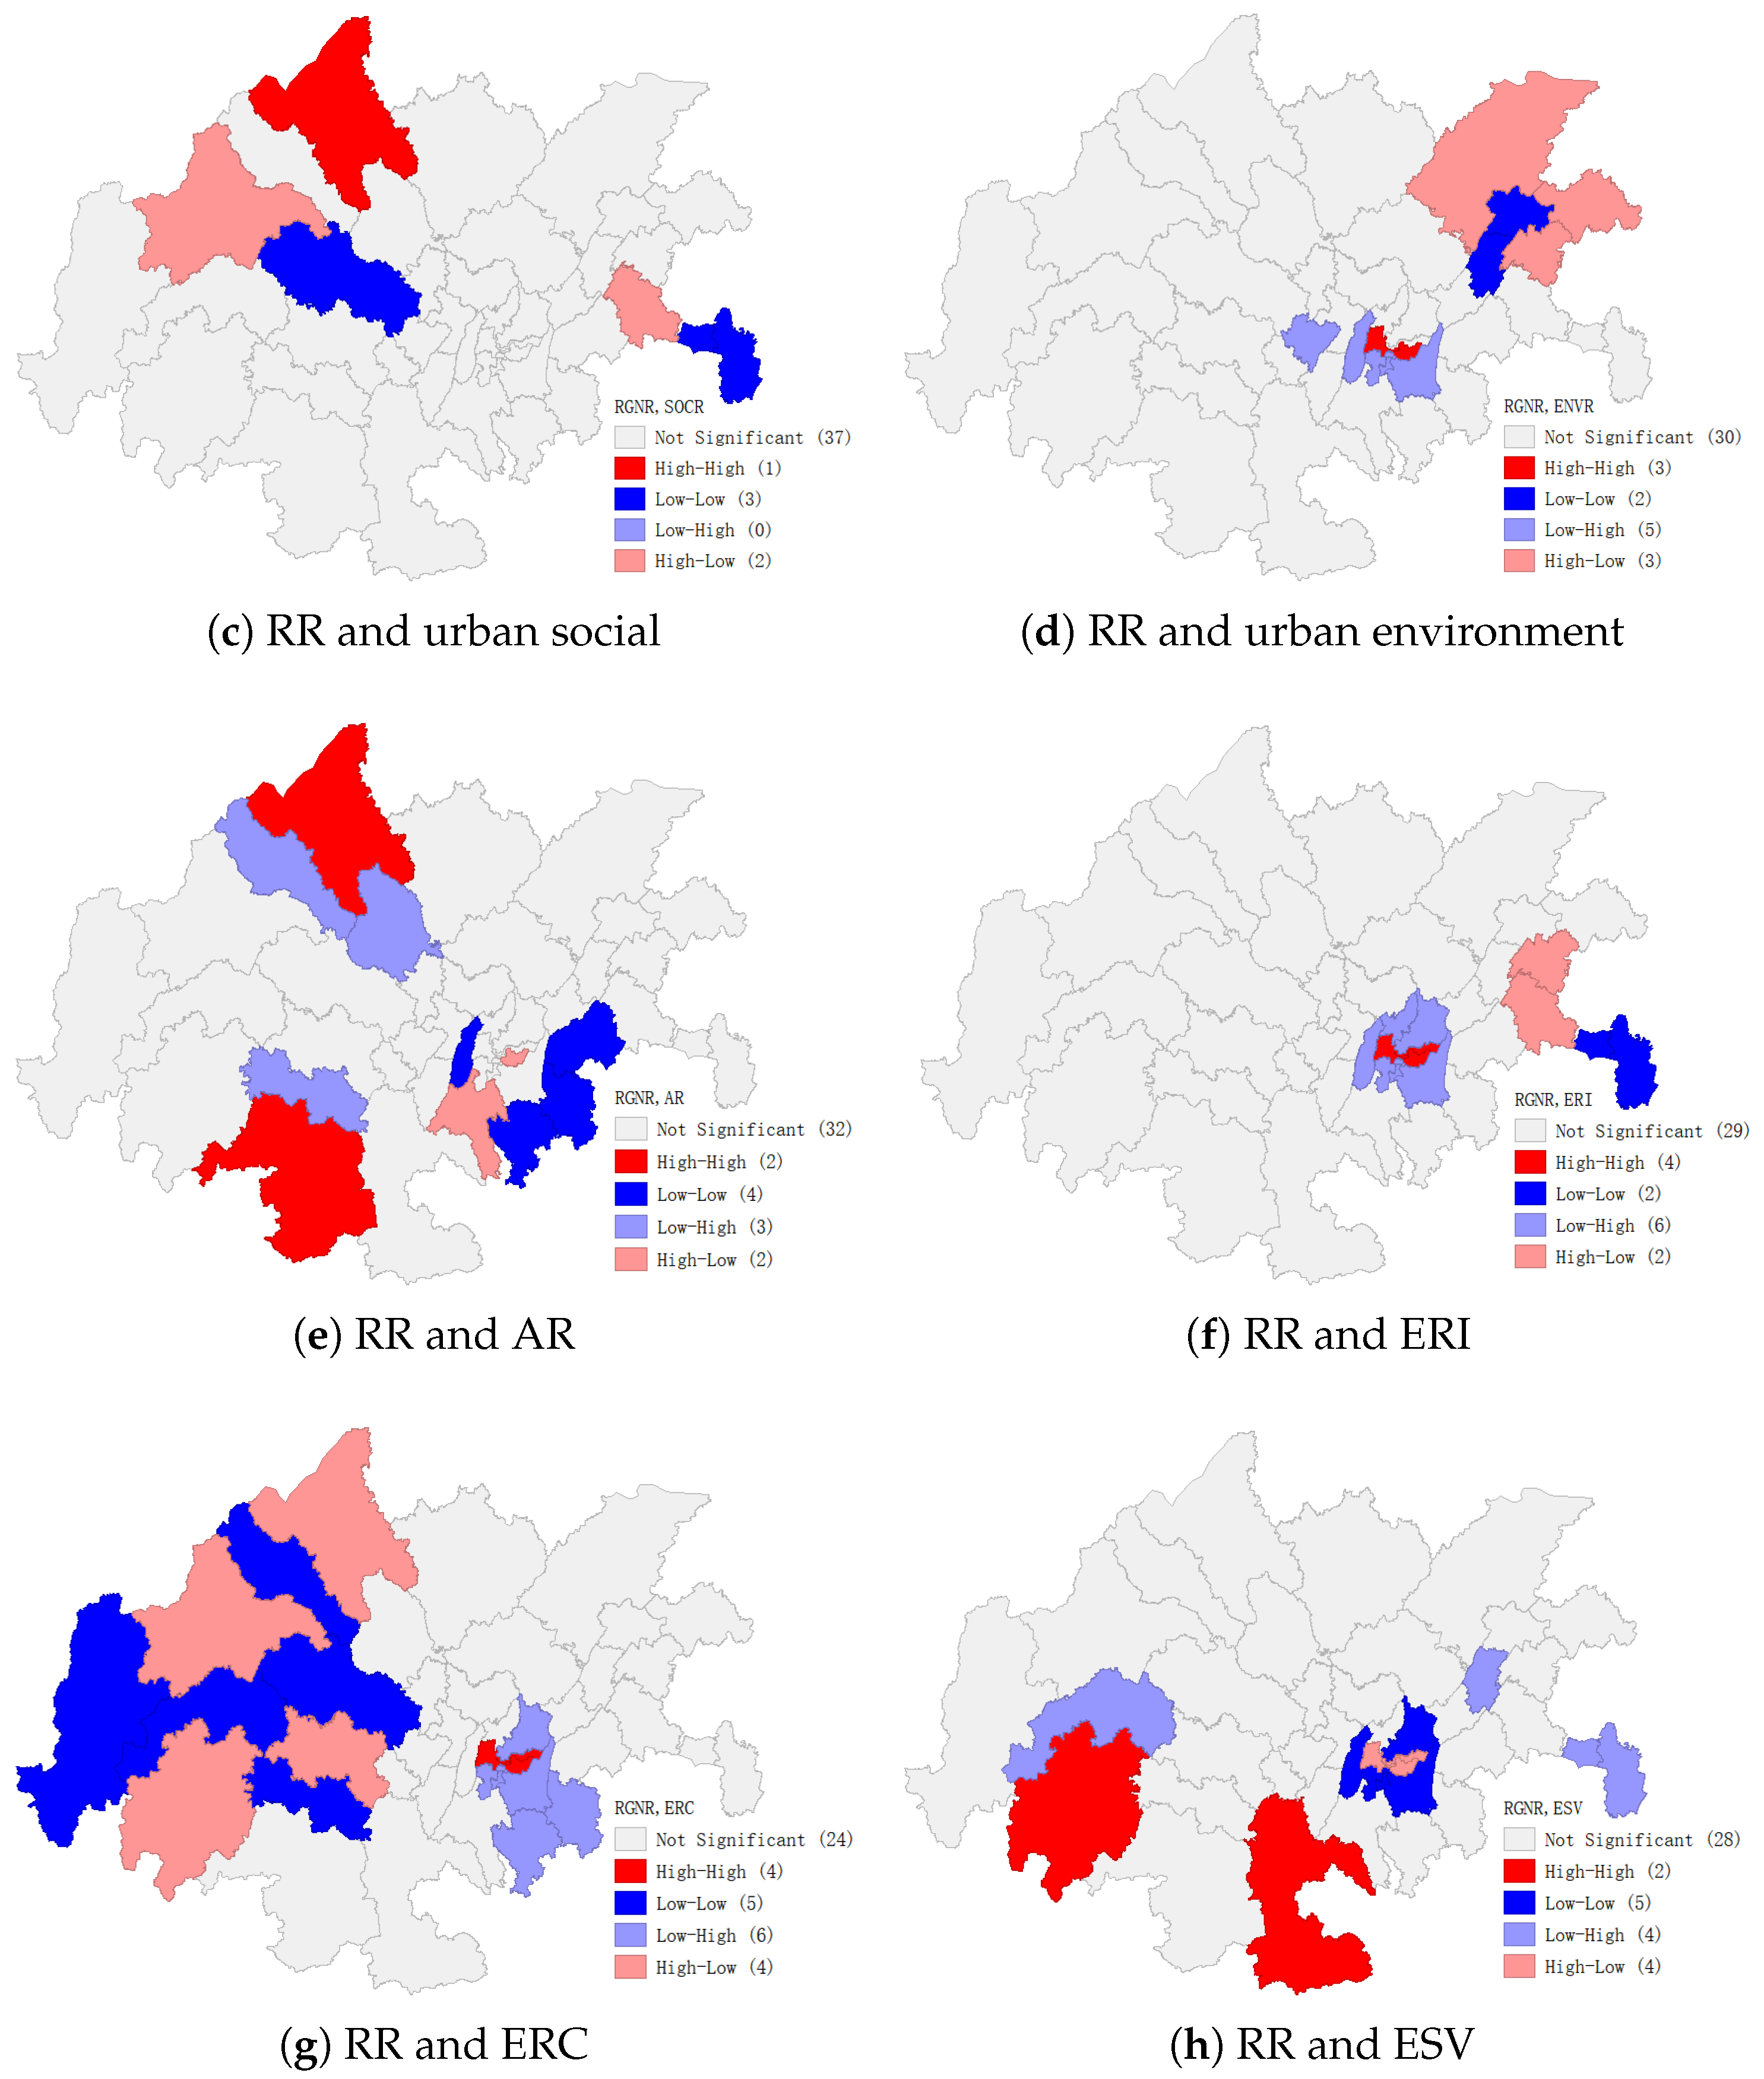
Figure 8 presents the Bivariate LISA maps for RR and each dimension, highlighting four types of spatial clusters: High–High (HH), Low–Low (LL), Low–High (LH), and High–Low (HL).
The patterns demonstrate three distinct spatial mechanisms:
(1) Synergistic enhancement zones (HH), where high-regional-resilience units are surrounded by high-dimension-resilience neighbors, exemplified by Mianyang’s consistent HH clustering across urban engineering, urban economic, and urban social dimensions, forming a multifunctional resilience hub.
(2) Vulnerability lock-in belts (LL), characterized by low-regional-resilience units encircled by low-resilience neighbors, notably the peri-urban LL cluster spanning Bishan, Beibei, Yubei, Changshou, and Banan in engineering resilience, reflecting institutional fragmentation across jurisdictional boundaries.
(3) Spatial mismatch anomalies, including LH patterns like Deyang (engineering dimension) where low regional resilience persists amid high-resilience neighbors, indicating governance coordination failures, and HL configurations such as Chengdu (social dimension) where high regional resilience is surrounded by low-resilience neighbors, revealing urban–rural service disparities.
In the ecological dimensions, western and southern mountainous regions show HH clusters for RR and ERC/ESV, confirming that ecological recovery and service value are key drivers of resilience in these areas. Conversely, central urban clusters such as Shapingba, Yuzhong, Jiangbei, and Nan’an display HL clusters for RR and ERI, indicating high regional resilience despite elevated ecological risk—likely due to infrastructure-mediated risk compensation. The persistent LL vulnerability belt encircling urban cores across multiple dimensions underscores systemic fragmentation in transitional zones.
Overall, these spatial associations collectively highlight how cross-jurisdictional synergies or deficiencies propagate through the urban–agricultural–ecological continuum, providing a nuanced understanding of resilience distribution and informing more effective, context-sensitive spatial planning strategies.

5.5. Resilience-Informed Functional Zoning Framework

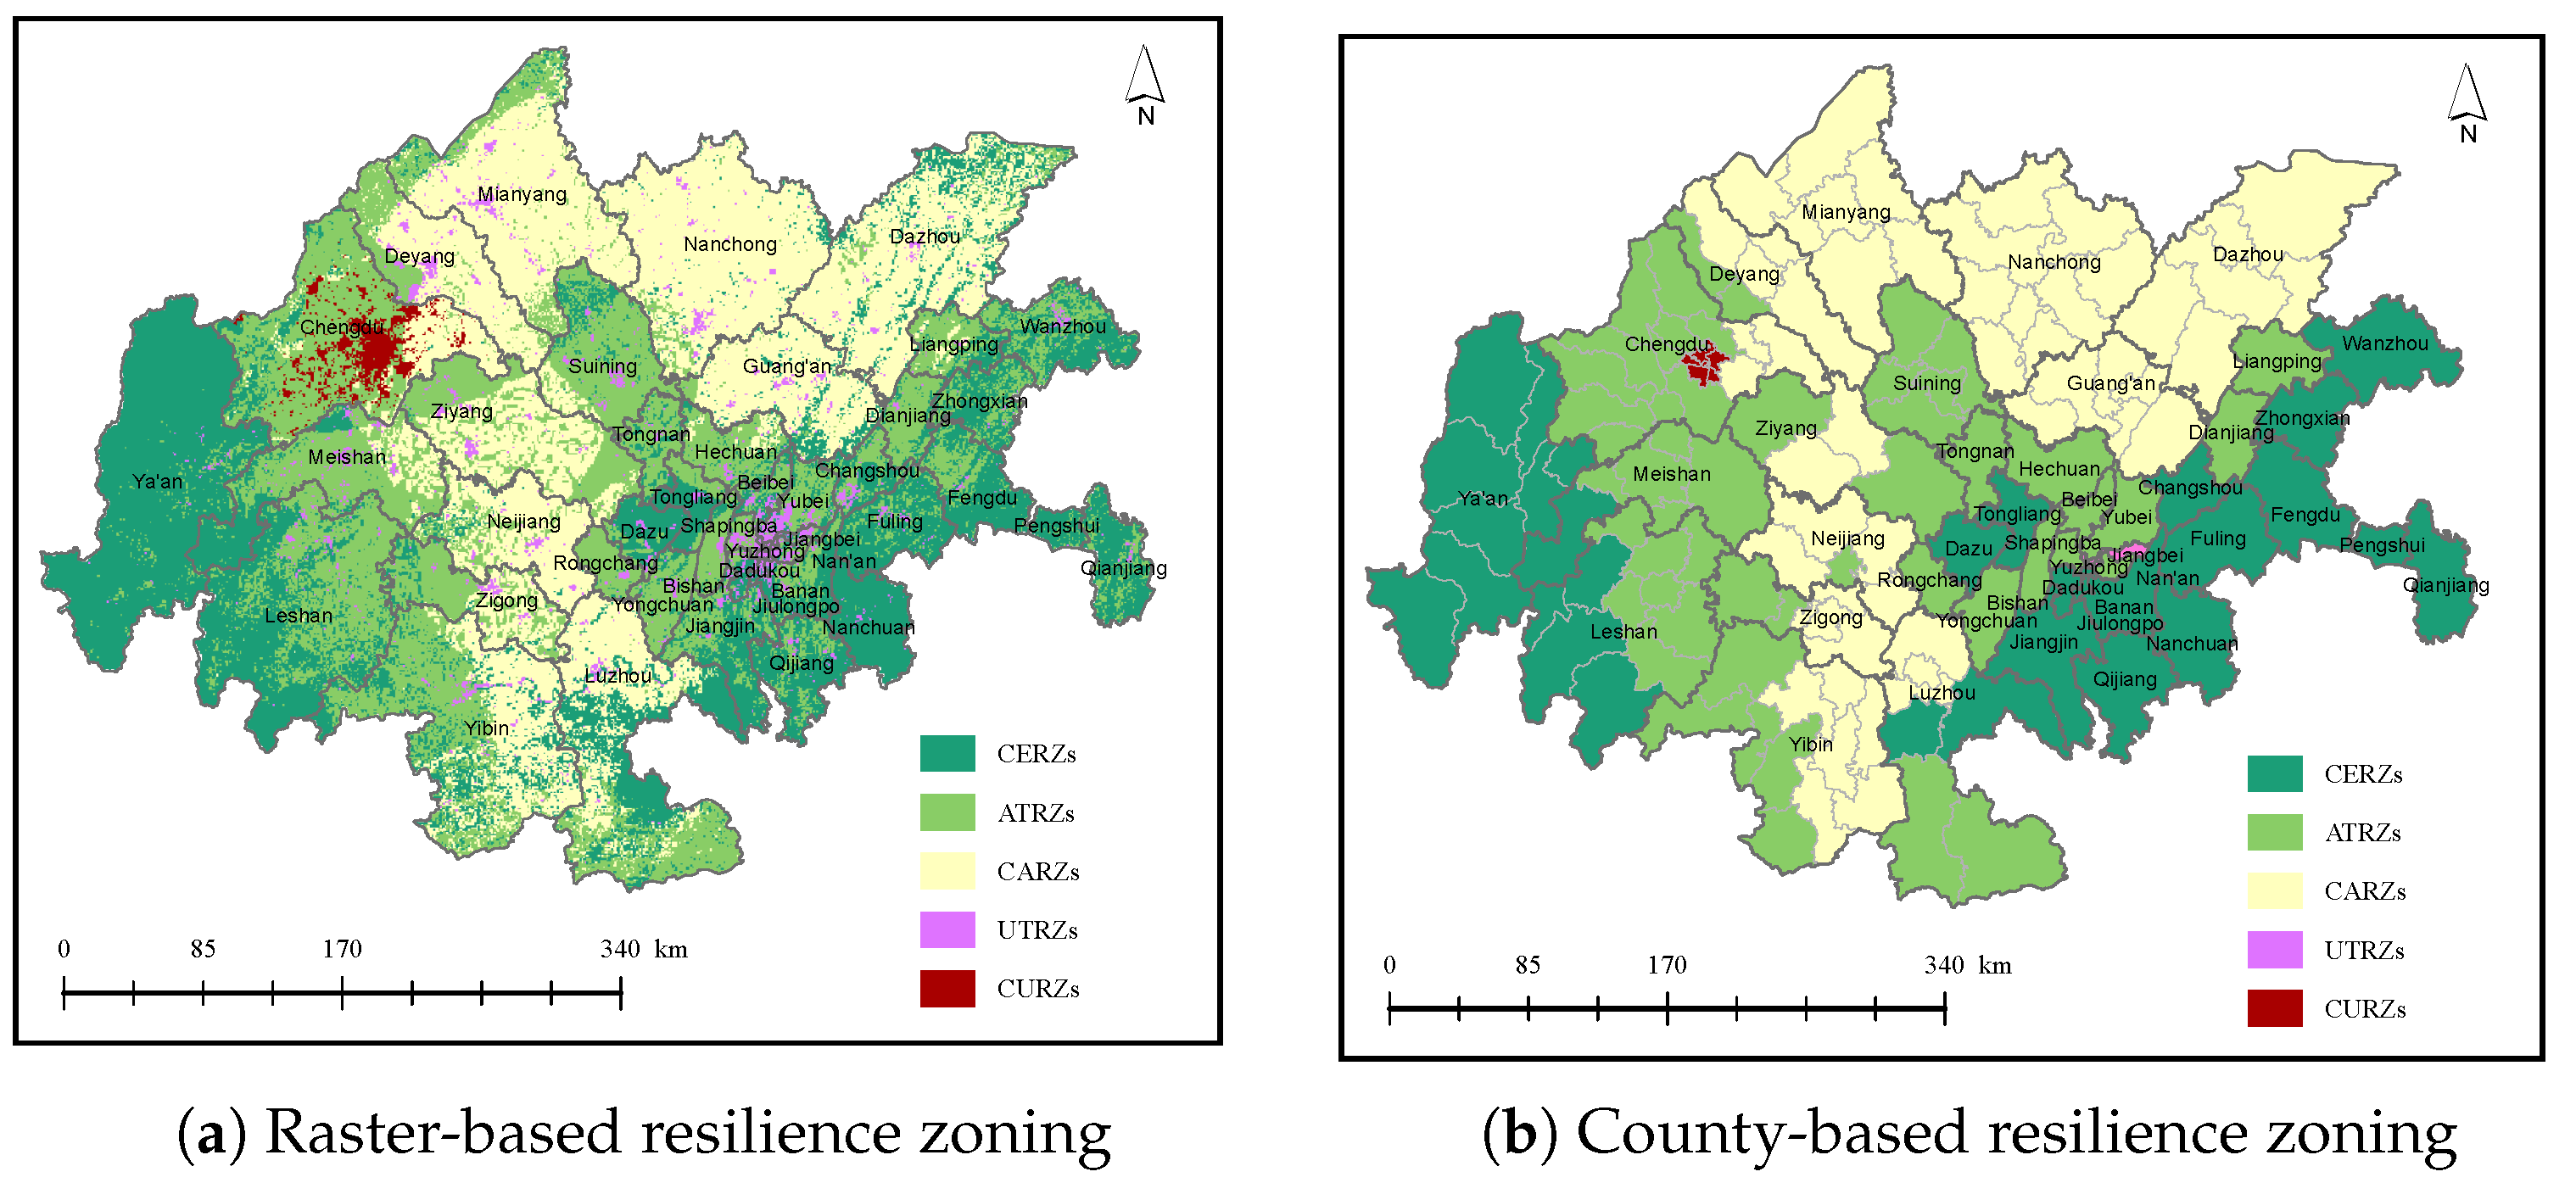
Building on China’s Three Major Spatial Patterns [85], this study establishes a resilience-optimized zoning framework by integrating urban, agricultural, and ecological resilience assessments (Figure 9). The raster-based analysis identifies five functional zones with distinct spatial and resilience characteristics (Figure 9a): Core Ecological Resilience Zones (CERZs) (31.25% of the study area), concentrated in western/southeastern highlands with dominant ecological resilience, function as biodiversity conservation corridors; Agro-Transition Resilience Zones (ATRZs) (31.95%) encircling CERZ peripheries maintain agricultural–ecological balance; Core Agricultural Resilience Zones (CARZs) (33.29%) dominate central Sichuan’s fertile plains with agricultural resilience as primary food security bases; Urban-Transition Resilience Zones (UTRZs) (2.48%) in urban peripheries like central Chongqing exhibit moderate urban resilience; and Core Urban Resilience Zones (CURZs) (1.03%) in metropolitan cores like Chengdu demonstrate high urban resilience. Key spatial patterns include ATRZs serving as transition zones between CERZs and CARZs, limited urban expansion as indicated by the small combined footprint of CURZs and UTRZs, and ecological dominance in the western highlands. Zone boundaries are determined using Natural Breaks classification of resilience indices, with thresholds detailed in Table 10.
Furthermore, county-based resilience zoning (Figure 9b) is generated by applying the Zonal Statistics (Majority) tool in ArcGIS Pro, which aggregates the reclassified raster values within each county administrative boundary. This approach enables the integration of resilience assessment results into statutory territorial spatial planning at the county level, thereby enhancing the operational feasibility and policy relevance of resilience-based spatial governance. By mapping functional resilience zones directly onto county units, the study provides a practical pathway for embedding resilience construction into existing planning frameworks and supports more targeted, actionable decision-making for local governments.

6. Discussion

In line with previous works on regional resilience [86,87,88], this study advances the field by establishing a pioneering framework for urban–agricultural–ecological functional integration. Distinct from conventional approaches that focus on single-dimensional assessments or administrative-boundary analyses, our GIS-based spatial analysis integrated with deterministic-fuzzy hybrid modeling enables the quantification of cross-system dependencies and functional synergies across urban, agricultural, and ecological zones. By aligning with China’s ongoing territorial spatial planning and the “Three Zones and Three Lines” paradigm, our framework provides a multidimensional and spatially explicit evaluation, revealing spatial mismatches and synergies that conventional models may overlook, and supports the formulation of policies at the regional level to promote resilience zoning.
Building on this foundation, these findings directly address the research gaps identified in the literature review, particularly the lack of functional integration metrics and the limitations of siloed frameworks [35,42,43]. By operationalizing the “Three Zones and Three Lines” paradigm, the study demonstrates the value of multidimensional resilience assessment for spatial governance, as advocated by recent theoretical developments [12,33].
The spatially explicit analysis presented here is consistent with the literature in highlighting pronounced spatial heterogeneity in resilience distribution across the CCEMR. However, our findings are distinct in demonstrating that targeted interventions based on functional zoning are essential for effective spatial governance. Practical implications include the need for urban cores like Chengdu and Chongqing to leverage infrastructure robustness for developing ecological networks aligned with “ecological conservation redlines” policy; ATRZs should implement conservation tillage, increase investment in agricultural infrastructure to enhance disaster resilience and promote facility agriculture, and in low-resilience areas, develop ecological agriculture to balance agricultural productivity with ecological benefits. Peripheral ecological reserves require enhanced habitat connectivity and measures to counter fragmentation effects, directly supporting national “ecological security barrier” strategies.
This multidimensional assessment exposes functional mismatches in a significant proportion of low-resilience areas, contrasting sharply with sector-siloed frameworks and evidencing the imperative to embed resilience metrics within China’s territorial spatial planning. Functional zoning must drive adaptive governance through optimizing economic density in urban clusters, securing production stability in agricultural zones, and maintaining systemic buffers in ecological corridors.
The practical significance of our findings lies in their direct applicability to territorial spatial planning. By mapping resilience patterns onto statutory zoning systems, our methodology provides actionable guidance for optimizing the delineation of urbanized areas, major agricultural production zones, and ecological functional zones. In view of the complexity of resilience building, we fully consider the flexibility required for policy formulation and implementation, and proposed five categories of territorial spatial functional resilience zones: in addition to the three major functional patterns, we introduce ATRZs and UTRZs to address the interactions and influences among urban, agricultural, and ecological systems. Furthermore, these functional zones are integrated at the county level, which facilitates the incorporation of resilience-building measures into county-level territorial spatial planning and enhances the capacity of local governments to operationalize resilience strategies. These insights can inform adaptive governance strategies, cross-jurisdictional coordination, and infrastructure prioritization, thereby advancing the goals of China’s national spatial planning and ecological civilization construction. This approach enhances the operational feasibility of resilience construction and provides a practical pathway for embedding resilience into statutory planning frameworks.

7. Conclusions

This study establishes an integrated resilience assessment framework for the CCEMR, advancing the operationalization of resilience theory in spatial planning through three key innovations: the novel integration of urban–agricultural–ecological coupling mechanisms into zoning protocols, the demarcation of transitional zones addressing critical resilience interfaces, and the development of adaptive governance pathways synchronized with China’s “Territorial Spatial Planning (2021-2035)”. The proposed functional zoning framework—encompassing CURZs, UTRZs, CARZs, ATRZs, and CERZs—provides actionable spatial guidance for implementation.
To facilitate practical application, the following recommendations are proposed: (1) CURZs: Prioritize infrastructure redundancy, upgrade emergency response systems, and invest in resilient public utilities to mitigate urban disaster risks; (2) UTRZs: Strengthen cross-jurisdictional coordination, especially for flood risk management, through the joint operation of upstream detention basins and downstream floodways; (3) CARZs: Focus on soil conservation, precision irrigation, and climate-smart agricultural technologies to ensure stable food production and reduce sensitivity to environmental shocks; (4) ATRZs: Promote contour-based agroforestry systems and ecological agriculture, and invest in agricultural infrastructure to improve disaster resilience; and (5) CERZs: Enforce ecological redlines, enhance habitat connectivity, conserve biodiversity, and restore degraded ecosystems to maintain ecological security.
Integrating these functional zones into county-level territorial spatial planning will enable local governments to embed resilience-building measures into statutory frameworks, improve cross-sector coordination, and support adaptive governance. The framework can be operationalized through targeted investment, regulatory adjustments, and the development of monitoring systems for real-time resilience assessment. By following these recommendations, policymakers and planners can directly translate resilience diagnostics into spatial planning actions, thereby enhancing the adaptability and effectiveness of territorial governance in the CCEMR and similar regions.
Despite the constraints of static indicator dynamics (2018 baseline), this work identifies critical future directions, including real-time resilience monitoring via satellite–ground sensor networks and agent-based modeling of population–climate interactions. These findings collectively provide a transferable toolkit for mountainous mega regions globally, directly supporting UN SDG 11.5 on disaster-resilient infrastructure, China’s “Dual Circulation” development strategy, and ecological civilization construction in the Yangtze River Basin.
Overall, the study bridges the gap between theoretical modeling and practical spatial governance. The results presented not only validate the proposed integrated framework but also demonstrate its practical utility in identifying spatial mismatches and guiding targeted interventions. By linking empirical findings to theoretical insights, the study advances both the conceptual understanding and operationalization of regional resilience in territorial spatial planning.
Looking ahead, further research should address the limitations of static indicator dynamics and cross-sectional analysis by incorporating more algorithmic methods, such as machine learning for indicator selection and weight assignment, to improve precision and reduce subjectivity. Real-time resilience monitoring and anomaly detection, enabled by satellite–ground sensor networks and agent-based modeling, will be essential for capturing the dynamic nature of regional systems. Additionally, developing standardized indicators compatible with digital platforms such as the “Three Zones and Three Lines” system will facilitate the translation of theoretical modeling into applied spatial governance. These future directions will help refine resilience assessments and enhance the adaptability and effectiveness of territorial spatial planning.

Author Contributions

X.H.: Conceptualization, Project administration, Investigation, Supervision, Methodology, Formal analysis, Writing—review and editing; B.W.: Conceptualization, Project administration, Supervision; G.S.: Conceptualization, Supervision, Methodology, Review and editing; T.F.: Investigation, Methodology, Writing. All authors have read and agreed to the published version of the manuscript.

Funding

This research was funded by the International School-level Quality Courses of Chengdu University of Technology.

Data Availability Statement

The data presented in this study are available upon request from the corresponding author.

Conflicts of Interest

The authors declare no conflicts of interest.

Appendix A. Detailed Calculation Steps for the KL-TOPSIS Model

The main steps of the KL-TOPSIS model, including data normalization, weight assignment, and calculation of relative closeness, are summarized as follows:
Step 1: Normalizing the Decision Matrix. Normalize the decision matrix A = a i j m × n to obtain the normalized decision matrix B = b i j m × n . The decision matrix is normalized using vector normalization:
b i j = a i j i = 1 m a i j 2 , i = 1 , 2 , m ; j = 1 , 2 , n
Step 2: Computing the Weighted Normalized Decision Matrix C = b i j m × n . Assign weights w j to each criterion, ensuring that the sum of all weights is 1. Let the weight vector of each attribute given by the decision-maker be w = w 1 , w 2 , w n T ; then
c i j = w j b i j , i = 1 , 2 , m ; j = 1 , 2 , n
Step 3: Identifying the Positive-Ideal and Negative-Ideal Solutions. Determine the positive-ideal solution C + and the negative-ideal solution C . The j-th attribute value of the positive-ideal solution C + is defined as follows:
c j + = max i c i j for benefit criteria min i c i j for cos t criteria
where c i j represents the performance value of the i-th alternative on the j-th criterion, adjusted for whether the criterion is a benefit (higher is better) or a cost (lower is better).
The j-th attribute value of the negative-ideal solution C is defined as follows:
c j = min i c i j for benefit criteria max i c i j for cos t criteria
Step 4: Calculating the separation measures using KL distance. Calculate the separation of each alternative from the positive-ideal solution and the negative-ideal solution using the KL distance formula:
D i + = j = 1 n c i j ln c i j c j +
where D i + is the KL distance from the positive-ideal solution for the i-th alternative. c i j is the value of the i-th alternative for the j-th criterion after normalization and weighting. c j + is the component of the positive-ideal solution for the j-th criterion, calculated as either the maximum or minimum of c i j across all alternatives, depending on whether the criterion is a benefit or a cost criterion, respectively.
The KL distance from the negative-ideal solution in KL-TOPSIS measures the dissimilarity between each alternative and the least desirable solution across all criteria. Here is the mathematical expression for computing this distance:
D i = j = 1 n c i j ln c i j c j
where D i is the KL distance from the negative-ideal solution for the i-th alternative. c i j is the value of the i-th alternative for the j-th criterion after normalization and weighting. c j is the component of the negative-ideal solution for the j-th criterion, calculated as either the minimum or maximum of c i j across all alternatives, depending on whether the criterion is a benefit or a cost criterion, respectively.
Steps 5: Calculating the Relative Closeness to the Ideal Solution. Calculating the relative closeness of each alternative to the ideal solution using the following formula:
C i = D i D i + + D i
where Ci is the relative closeness of the i-th alternative to the ideal solution, D i + is the KL distance from the positive-ideal solution for the i-th alternative, and D i is the KL distance from the negative-ideal solution for the i-th alternative.
Steps 6: Ranking the Alternatives. Rank the alternatives based on the relative closeness values Ci, with higher values indicating greater resilience. This ranking provides a clear order of preference among the alternatives, helping to identify the most resilient urban areas in the study region.

References

  1. Tang, L.; Ke, X.; Chen, Y.; Wang, L.; Zhou, Q.; Zheng, W.; Xiao, B. Which impacts more seriously on natural habitat loss and degradation? Cropland expansion or urban expansion? Land Degrad. Dev. 2021, 32, 946–964. [Google Scholar] [CrossRef]
  2. Liu, N.; Liu, Z.; Wu, Y. Direct and Indirect Impacts of Urbanization on Biodiversity Across the World’s Cities. Remote Sens. 2025, 17, 956. [Google Scholar] [CrossRef]
  3. d’Amour, C.B.; Reitsma, F.; Baiocchi, G.; Barthel, S.; Güneralp, B.; Erb, K.H.; Haberl, H.; Creutzig, F.; Seto, K.C. Future urban land expansion and implications for global croplands. Proc. Natl. Acad. Sci. USA 2017, 114, 8939–8944. [Google Scholar] [CrossRef]
  4. UNCCD, Urbanization. Global Land Outlook; United Nations Convention to Combat Desertification: Bonn, Germany, 2017; Chapter 11; pp. 226–245. [Google Scholar]
  5. Saleem, A.; Anwar, S.; Nawaz, T.; Fahad, S.; Saud, S.; Ur Rahman, T.; Khan, M.N.R.; Nawaz, T. Securing a sustainable future: The climate change threat to agriculture, food security, and sustainable development goals. J. Umm -Qura Univ. Appl. Sci. 2024, 11, 595–611. [Google Scholar] [CrossRef]
  6. Lankoski, J.; Nales, E.; Valin, H. Assessing the impacts of agricultural support policies on the environment: Economic analysis, literature findings and synthesis. OECD Food, Agric. Fish. Pap. 2025, 223. [Google Scholar] [CrossRef]
  7. Vernick, D. Is Climate Change Increasing the Risk of Disasters? 2025. Available online: https://www.worldwildlife.org/stories/is-climate-change-increasing-the-risk-of-disasters (accessed on 15 August 2025).
  8. Wulandari, S.; Pratama, F.; Andika, N.; Wongso, P.; Wijayasari, W.; Rohmat, F. Identifying dominant river contributions to urban flooding: A scenario-based study of Makassar City. Front. Built. Environ. 2025, 11, 1612416. [Google Scholar] [CrossRef]
  9. Tozzi, A. An approach to pluralizing socionatural resilience through assemblages. Prog. Hum. Geogr. 2021, 45, 1083–1104. [Google Scholar] [CrossRef]
  10. Zhong, F.; Chen, R.; Luo, X.; Song, X.; Ullah, A. Assessing regional resilience in China using a sustainable livelihoods approach: Indicators, influencing factors, and the relationship with economic performance. Ecol. Indic. 2024, 158, 111588. [Google Scholar] [CrossRef]
  11. Xiao, H.; Cui, X.; Sarker, M.N.I.; Firdaus, R.R. Impact of industry-university-research collaboration and convergence on economic development: Evidence from chengdu-chongqing economic circle in China. Heliyon 2023, 9, e21082. [Google Scholar] [CrossRef] [PubMed]
  12. Lei, Y.; Xiao, Y.; Wang, F.; Wang, R.; Huang, H. Investigation on the complex relationship between urbanization and eco-efficiency in urban agglomeration of China: The case study of Chengdu-Chongqing urban agglomeration. Ecol. Indic. 2024, 159, 111704. [Google Scholar] [CrossRef]
  13. Chen, X.; Wang, H. Spatial–Temporal Evolution and Driving Factors of Industrial Land Marketization in Chengdu–Chongqing Economic Circle. Land 2024, 13, 972. [Google Scholar] [CrossRef]
  14. Liu, Z. Research on Water Resources Value Accounting and Compensation Mechanism in the Chengdu-Chongqing Twin-City Economic Circle. Acad. J. Manag. Soc. Sci. 2025, 11, 99–109. [Google Scholar] [CrossRef]
  15. Yang, J.; Li, Z.; Zhang, D.; Zhong, J. An empirical analysis of the coupling and coordinated development of new urbanization and ecological welfare performance in China’s Chengdu–Chongqing economic circle. Sci. Rep. 2024, 14, 13197. [Google Scholar] [CrossRef] [PubMed]
  16. Zhang, X.; Luo, H.; Zeng, X.; Zhou, C.; Shu, Z.; Li, H.; Fei, Z.; Liu, G. Research on regional economic development and natural disaster risk assessment under the goal of carbon peak and carbon neutrality: A case study in Chengdu-Chongqing economic circle. Land Use Policy 2024, 143, 107206. [Google Scholar] [CrossRef]
  17. Agency, X.N. Outline of the 14th Five-Year Plan (2021–2025) for National Economic and Social Development and Vision 2035 of the People’s Republic of China. 2021. Available online: https://www.gov.cn/xinwen/2021-03/13/content_5592681.htm (accessed on 4 May 2025).
  18. Foster, K.A. A Case Study Approach to Understanding Regional Resilience; Technical Report; Institute of Urban and Regional Development, University of California: Berkeley, CA, USA, 2006. [Google Scholar]
  19. Masik, G.; Grabkowska, M. Practical dimension of urban and regional resilience concepts: A proposal of resilience strategy model. Misc. Geogr. – Reg. Stud. Dev. 2020, 24, 30–34. [Google Scholar] [CrossRef]
  20. Martin, R. Regional economic resilience, hysteresis and recessionary shocks. J. Econ. Geogr. 2012, 12, 1–32. [Google Scholar] [CrossRef]
  21. Martin, R.; Sunley, P. Regional economic resilience: Evolution and evaluation. In Handbook on Regional Economic Resilience; Edward Elgar Publishing: Cheltenham, UK, 2020; pp. 10–35. [Google Scholar]
  22. Cutter, S.L.; Burton, C.G.; Emrich, C.T. Disaster Resilience Indicators for Benchmarking Baseline Conditions. J. Homel. Secur. Emerg. Manag. 2010, 7, published. [Google Scholar] [CrossRef]
  23. Palekiene, O.; Simanaviciene, Z.; Bruneckiene, J. The application of resilience concept in the regional development context. Procedia-Soc. Behav. Sci. 2015, 213, 179–184. [Google Scholar] [CrossRef]
  24. Renschler, C.S. The Peoples Resilience Framework: An Integrated Quantitative Measure and Modeling of Sustainable Development and Disaster Risk Reduction; Working Paper; UNDRR: New York, NY, USA, 2013. [Google Scholar]
  25. Boori, M.S.; Choudhary, K.; Paringer, R. Eco-environmental quality assessment based on pressure-state-response framework by remote sensing and GIS. Remote Sens. Appl. Soc. Environ. 2021, 23, 100530. [Google Scholar] [CrossRef]
  26. Tambe, S. Sustainable Livelihoods Approach. In Teaching and Learning Rural Livelihoods: A Guide for Educators, Students, and Practitioners; Springer International Publishing: Cham, Switzerland, 2022; pp. 45–56. [Google Scholar] [CrossRef]
  27. Holling, C.S. Resilience and Stability of Ecological Systems. Annu. Rev. Ecol. Syst. 1973, 4, 1–23. [Google Scholar] [CrossRef]
  28. Folke, C.; Carpenter, S.; Walker, B.; Scheffer, M.; Elmqvist, T.; Gunderson, L.; Holling, C.S. Regime shifts, resilience, and biodiversity in ecosystem management. Annu. Rev. Ecol. Evol. Syst. 2004, 35, 557–581. [Google Scholar] [CrossRef]
  29. Walker, B.; Holling, C.S.; Carpenter, S.R.; Kinzig, A. Resilience, adaptability and transformability in social–ecological systems. Ecol. Soc. 2004, 9, 5. [Google Scholar] [CrossRef]
  30. Keck, M.; Sakdapolrak, P. What is social resilience? Lessons learned and ways forward. Erdkunde 2013, 67, 5–19. [Google Scholar] [CrossRef]
  31. Martin, R.; Sunley, P. On the notion of regional economic resilience: Conceptualization and explanation. J. Econ. Geogr. 2015, 15, 1–42. [Google Scholar] [CrossRef]
  32. Eraydin, A. Attributes and characteristics of regional resilience: Defining and measuring the resilience of Turkish regions. Reg. Stud. 2016, 50, 600–614. [Google Scholar] [CrossRef]
  33. Han, S.; Liu, B.; Shu, J.; He, Z.; Xia, X.; Pan, K.; Ren, H. Quantitative assessment and dynamic characteristic measurement of regional resilience: From the perspective of post-earthquakes effects. J. Comput. Sci. 2024, 83, 102461. [Google Scholar] [CrossRef]
  34. Berkes, F.; Ross, H. Community Resilience: Toward an Integrated Approach. Soc. Nat. Resour. 2012, 26, 5–20. [Google Scholar] [CrossRef]
  35. Lai, S.; Sha, J.; Eladawy, A.; Li, X.; Wang, J.; Kurbanov, E.; Lin, Z.; Wu, L.; Han, R.; Su, Y.C. valuation of ecological security and ecological maintenance based on pressure-state-response (PSR) model, case study: Fuzhou city, China. Hum. Ecol. Risk Assess. Int. J. 2022, 28, 734–761. [Google Scholar] [CrossRef]
  36. Jha, A.K.; Miner, T.W.; Stanton-Geddes, Z. Building Urban Resilience: Principles, Tools, and Practice; World Bank Publications: Washington, DC, USA, 2013. [Google Scholar]
  37. Foundation, R. City Resilience Framework; Technical Report; ARUP International Development: London, UK, 2014. [Google Scholar]
  38. Kammouh, O.; Noori, A.Z.; Taurino, V.; Mahin, S.A.; Cimellaro, G.P. Deterministic and fuzzy-based methods to evaluate community resilience. Earthq. Eng. Eng. Vib. 2018, 17, 261–275. [Google Scholar] [CrossRef]
  39. Faiz, T.I.; Harrison, K.W. A risk-averse stochastic optimization model for community resilience planning. Socio-Econ. Plan. Sci. 2024, 92, 101835. [Google Scholar] [CrossRef]
  40. Tayyab, M.; Zhang, J.; Hussain, M.; Ullah, S.; Liu, X.; Khan, S.N.; Baig, M.A.; Hassan, W.; Al-Shaibah, B. GIS-based urban flood resilience assessment using urban flood resilience model: A case study of peshawar city, khyber pakhtunkhwa, pakistan. Remote Sens. 2021, 13, 1864. [Google Scholar] [CrossRef]
  41. Arghir, D.C. Regional Resilience through a Multidimensional Lens: Exploring Romanian Counties. Econ. Inform. J. 2023, 1, 1. [Google Scholar]
  42. Lin, Y.; Peng, C.; Chen, P.; Zhang, M. Conflict or synergy? Analysis of economic-social-infrastructure-ecological resilience and their coupling coordination in the Yangtze River economic Belt, China. Ecol. Indic. 2022, 142, 109194. [Google Scholar] [CrossRef]
  43. Arsyad, M.; Gultom, L.M. The Potential and Problems of Bakutaru Disadvantaged Villages: Economic, Social, and Ecological Resilience in a Sociological Perspective. Int. J. Integr. Sci. 2024, 3, 987–1006. [Google Scholar] [CrossRef]
  44. Cutter, S.L. Resilience to What? Resilience for Whom? Geogr. J. 2016, 182, 110–113. [Google Scholar] [CrossRef]
  45. Meerow, S.; Newell, J.P.; Stults, M. Defining urban resilience: A review. Landsc. Urban Plan. 2016, 147, 38–49. [Google Scholar] [CrossRef]
  46. Levin, S.; Xepapadeas, T.; Crépin, A.S.; Norberg, J.; de Zeeuw, A.; Folke, C.; Hughes, T.; Arrow, K.; Barrett, S.; Daily, G.; et al. Social-ecological systems as complex adaptive systems: Modeling and policy implications. Environ. Dev. Econ. 2013, 18, 111–132. [Google Scholar] [CrossRef]
  47. Gu, T.; Zhao, H.; Yue, L.; Liu, Y.; Guo, J.; Tang, J.; Zhao, P. Spatial heterogeneity of urban resilience: Quantifying key determinants by spatial machine learning model embedded in density-structure-function framework. Cities 2025, 167, 106305. [Google Scholar] [CrossRef]
  48. Statistical Bureau of Sichuan and NBS Survey Office in Sichuan (Ed.) Sichuan Statistical Yearbook 2019; China Statistics Press: Beijing, China, 2019. [Google Scholar]
  49. Chongqing Municipal Bureau of Statistics and NBS Survey Office in Chongqing (Ed.) Chongqing Statistical Yearbook 2019; China Statistics Press: Beijing, China, 2019. [Google Scholar]
  50. Central Committee of the Communist Party of China and State Council of the People’s Republic of China. Outline of the Planning for the Construction of the Chengdu-Chongqing Economic Circle. 2021. Available online: https://www.gov.cn/zhengce/2021-10/21/content_5643875.htm (accessed on 21 July 2024).
  51. Chen, F.; Sun, R.; Liang, S. Dynamics of vegetation carbon reserves and carbon strategy in Cheng-Yu economic region. Environ. Sci. Manag. 2017, 42, 164–166. [Google Scholar]
  52. Li, X.R.; Yang, D.; Feng, L.; Huang, Y.Y.; Yi, W. Dynamics of vegetation NDVI in Chengdu-Chongqing Economic Circle from 2000 to 2018. Chin. J. Ecol. 2021, 40, 2967. [Google Scholar]
  53. Ministry of Ecology and Environment of the People’s Republic of China. Eco-Environmental Protection Planning for the Chengdu-Chongqing Economic Circle. 2022. Available online: https://www.mee.gov.cn/xxgk2018/xxgk/xxgk03/202202/W020220215360640578012.pdf (accessed on 21 July 2024).
  54. Xu, X. China Multi-Year City Administrative Division Boundary Data. Resources and Environment Science Data Registration and Publishing System. 2018. Available online: https://www.resdc.cn/DOI/doi.aspx?DOIid=121 (accessed on 10 September 2021). [CrossRef]
  55. Xu, X.; Liu, J.; Zhang, S.; Li, R.; Yan, C.; Wu, S. China Multi-Period Land Use Remote Sensing Monitoring Dataset (CNLUCC). Resources and Environment Science Data Registration and Publishing System. 2018. Available online: https://www.resdc.cn/doi/doi.aspx?DOIid=54 (accessed on 10 September 2021). [CrossRef]
  56. Xu, X. China Spatial Interpolation Dataset of Average Meteorological Conditions. Resources and Environment Science Data Registration and Publishing System. 2017. Available online: https://www.resdc.cn/doi/doi.aspx?DOIid=39 (accessed on 3 December 2020). [CrossRef]
  57. Resource and Environment Science Data Platform. Spatial Distribution Data of Soil Texture in China. 2015. Available online: https://www.resdc.cn/data.aspx?DATAID=260 (accessed on 22 December 2020).
  58. Xu, X. China Annual NDVI and EVI 1KM Dataset. Resources and Environment Science Data Registration and Publishing System. 2018. Available online: https://www.resdc.cn/doi/doi.aspx?DOIid=49 (accessed on 10 September 2021). [CrossRef]
  59. Resource and Environment Science Data Platform. China Annual NPP, GPP 1KM Dataset. 2018. Available online: https://www.resdc.cn/data.aspx?DATAID=204 (accessed on 10 September 2021).
  60. Xu, H.; Cao, M.; Wu, J.; Ding, H. China Biodiversity Baseline Assessment Report; Science Press: Beijing, China, 2013. [Google Scholar]
  61. Rural Socio-Economic Survey Department, National Bureau of Statistics (Ed.) China Yearbook of Agricultural Price Survey 2019; China Statistics Press: Beijing, China, 2019. [Google Scholar]
  62. Sharifi, A.; Yamagata, Y. Major Principles and Criteria for Development of an Urban Resilience Assessment Index. In Proceedings of the 2014 International Conference and Utility Exhibition on Green Energy for Sustainable Development (ICUE), Pattaya City, Thailand, 19–21 March 2014; pp. 1–5. [Google Scholar]
  63. Xu, Z.; Tian, J.; Zhang, J. Urban resilience evaluation system and optimization strategy from perspective of disaster prevention. China Saf. Sci. J. 2019, 29, 1–7. [Google Scholar]
  64. Anelli, D.; Tajani, F.; Ranieri, R. Urban Resilience against Natural Disasters: Mapping the Risk with an Innovative Indicators-Based Assessment Approach. J. Clean. Prod. 2022, 371, 133496. [Google Scholar] [CrossRef]
  65. Karayalcin, I.I. The analytic hierarchy process: Planning, priority setting, resource allocation: Thomas L. SAATY McGraw-Hill, New York, 1980, xiii + 287 pages, £15.65. Eur. J. Oper. Res. 1982, 9, 97–98. [Google Scholar] [CrossRef]
  66. Xavier Belem, M.J.; Vieira Junior, M.; Mummolo, G.; Facchini, F. An AHP-Based Procedure for Model Selection for Eco-Efficiency Assessment. Sustainability 2021, 13, 12121. [Google Scholar] [CrossRef]
  67. Zhang, M.; Hui, L. Spatial Differences and Identification of Influencing Factors of China’s Agricultural Economic Resilience. World Agric. 2022, 1, 2022-01. [Google Scholar]
  68. Meuwissen, M.P.; Feindt, P.H.; Spiegel, A.; Termeer, C.J.; Mathijs, E.; De Mey, Y.; Finger, R.; Balmann, A.; Wauters, E.; Urquhart, J.; et al. A framework to assess the resilience of farming systems. Agric. Syst. 2019, 176, 102656. [Google Scholar] [CrossRef]
  69. Zong, X.; Liu, X.; Chen, G.; Yin, Y. A deep-understanding framework and assessment indicator system for climate-resilient agriculture. Ecol. Indic. 2022, 136, 108597. [Google Scholar] [CrossRef]
  70. Kong, X.; Yong, C.; Wang, C.; Li, P.; Yu, L.; Chen, Y. Multi-objective power supply capacity evaluation method for active distribution network in power market environment. Int. J. Electr. Power Energy Syst. 2020, 115, 105–467. [Google Scholar] [CrossRef]
  71. Mao, Y.; Hou, L.; Zhang, Z. Spatial-temporal evolution and relationship between urbanization level and ecosystem service from a dual-scale perspective: A case study of the pearl river delta urban agglomeration. Sustainability 2021, 13, 8537. [Google Scholar] [CrossRef]
  72. Samala, T.; Manupati, V.K.; Machado, J.; Khandelwal, S.; Antosz, K. A systematic simulation-based multi-criteria decision-making approach for the evaluation of semi–fully flexible machine system process parameters. Electronics 2022, 11, 233. [Google Scholar] [CrossRef]
  73. Bai, X.; Tang, J. Ecological Security Assessment of Tianjin by PSR Model. Procedia Environ. Sci. 2010, 2, 881–887. [Google Scholar] [CrossRef]
  74. Cheng, L.H.; Zhang, Y.H.; Wang, Z.Y. Construction of risk evaluation index system of housing construction project based on PSR theory. IOP Conf. Ser. Mater. Sci. Eng. 2019, 592, 012121. [Google Scholar] [CrossRef]
  75. Du, J.; Yang, Q. An Analysis of Regional Ecological Risk Based on Land Use Change and Spatial Statistics: A Case Study in Wuhan, Hubei Province. Remote Sens. Land Resour. 2010, 22, 102–106. [Google Scholar]
  76. Ye, C.; Feng, Y. Ecological risk assessment for Pearl River Delta based on land use change. Trans. Chin. Soc. Agric. Eng. (Trans. CSAE) 2013, 29, 224–232. [Google Scholar] [CrossRef]
  77. Xu, Y.; Zhong, Y.; Feng, X.; Xu, L.; Zheng, L. Ecological risk pattern of Poyang Lake basin based on land use. Acta Ecol. Sin. 2016, 36, 7850–7857. [Google Scholar] [CrossRef]
  78. Zhang, Y.; Yang, Y.; Chen, Z.; Zhang, S. Multi-criteria assessment of the resilience of ecological function areas in China with a focus on ecological restoration. Ecol. Indic. 2020, 119, 106862. [Google Scholar] [CrossRef]
  79. Han, W.; Zhou, M.; Luo, R. Comprehensive Evaluation of Ecosystem Resilience at the County Scale. Agric. Technol. 2022, 42, 86–90. [Google Scholar]
  80. Zhang, Y.; Zhang, S.; Yang, Y.; Hou, H. Assessment of social-ecological resilience based on the scale of ecological function area. J. Agric. Resour. Environ. 2022, 39, 1059–1068. [Google Scholar]
  81. Costanza, R.; d’Arge, R.; De Groot, R.; Farber, S.; Grasso, M.; Hannon, B.; Limburg, K.; Naeem, S.; O’neill, R.V.; Paruelo, J.; et al. The value of the world’s ecosystem services and natural capital. Nature 1997, 387, 253–260. [Google Scholar] [CrossRef]
  82. Xie, G.; Zhen, L.; Lu, C.; Xiao, Y.; Chen, C. Expert Knowledge Based Valuation Method of Ecosystem Services in China. J. Nat. Resour. 2008, 23, 911–919. [Google Scholar] [CrossRef]
  83. Chen, M.; Gao, B.; Liu, S. Response of Ecosystem Service Value to the Changes of Landscape Pattern of Land Use. For. Resour. Manag. 2018, 2, 103–110. [Google Scholar]
  84. Xie, G.D.; Xiao, Y.; Zhen, L.; Lu, C.X. Study on ecosystem services value of food production in China. Chin. J. Eco-Agric. 2005, 13, 10–13. [Google Scholar]
  85. National Development and Reform Commission (NDRC), People’s Republic of China. The Outline of the 14th Five-Year Plan for Economic and Social Development (2021–2025). 2022. Available online: https://en.ndrc.gov.cn/policies/index_4.html (accessed on 21 July 2024).
  86. Zhang, M.; Chen, W.; Cai, K.; Gao, X.; Zhang, X.; Liu, J.; Wang, Z.; Li, D. Analysis of the Spatial Distribution Characteristics of Urban Resilience and Its Influencing Factors: A Case Study of 56 Cities in China. Int. J. Environ. Res. Public Health 2019, 16, 4442. [Google Scholar] [CrossRef]
  87. Wang, X.; Xu, S.; Wang, D. Analysis of regional resilience network from the perspective of relational and dynamic equilibrium. J. Clean. Prod. 2023, 425, 138859. [Google Scholar] [CrossRef]
  88. Farahmand, H.; Yin, K.; Hsu, C.W.; Savadogo, I.; Espinet Alegre, X.; Mostafavi, A. Integrating climate projections and probabilistic network analysis into regional transport resilience planning. Transp. Res. Part D Transp. Environ. 2024, 133, 104229. [Google Scholar] [CrossRef]
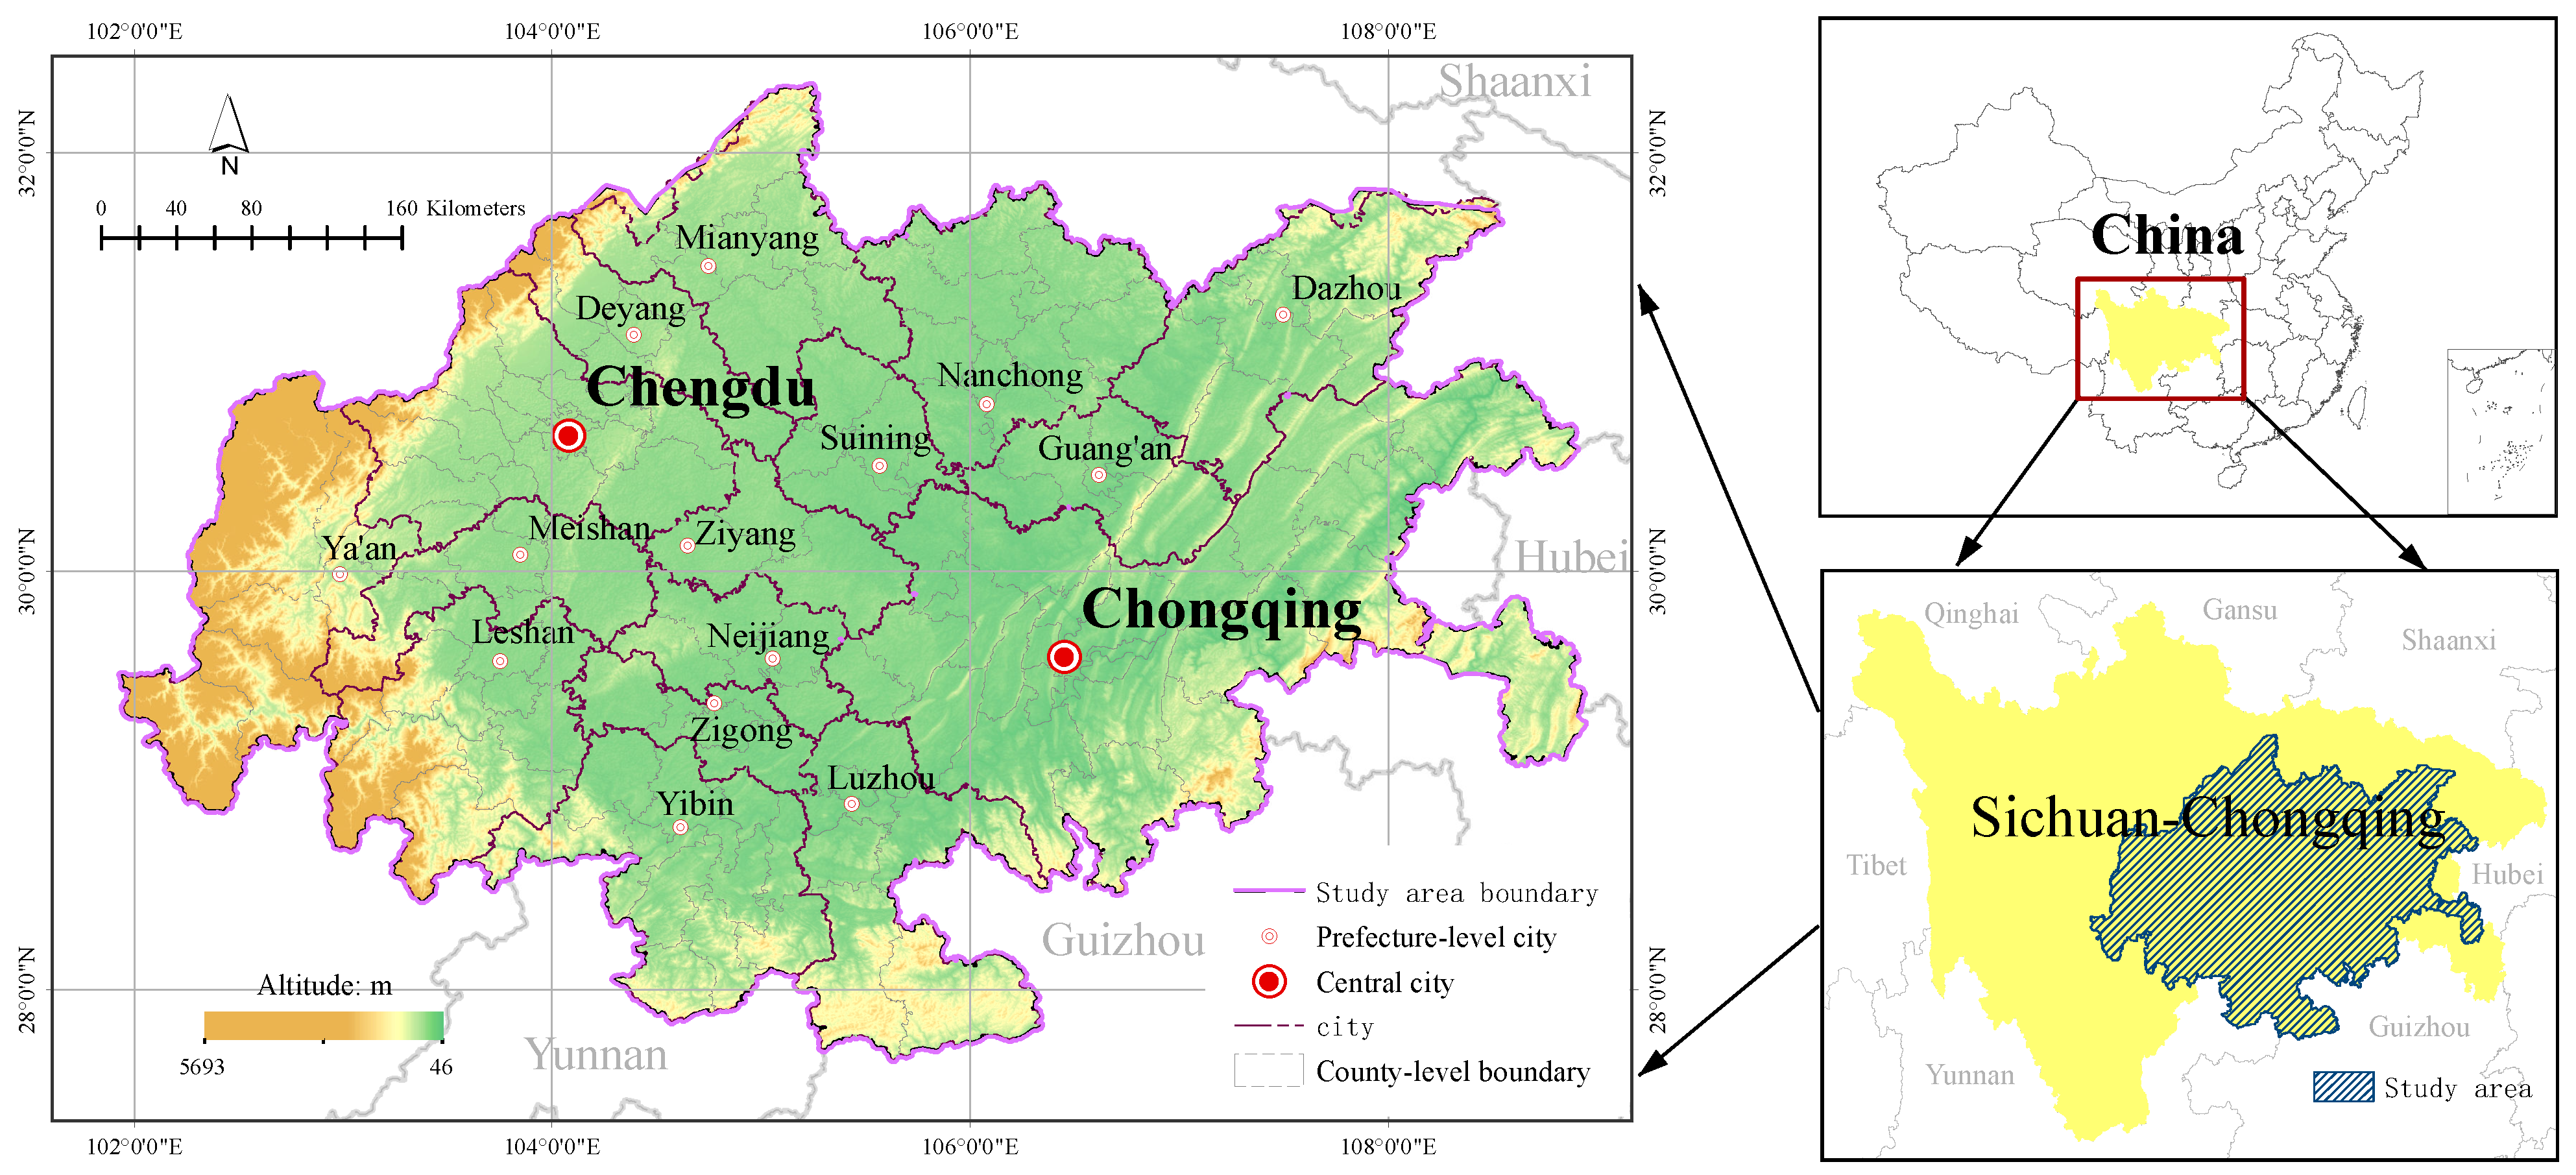
Figure 1. Location map of study area.
Land 14 01769 g001
Figure 2. The schematic diagram of the research framework.
Land 14 01769 g002
Figure 3. Hierarchical urban resilience indicators.
Land 14 01769 g003
Figure 4. RRP framework for ecological resilience assessment.
Land 14 01769 g004
Figure 5. Spatial distribution of urban, agricultural, and ecological resilience in the study area.
Land 14 01769 g005
Figure 6. Regional resilience classification map.
Land 14 01769 g006
Figure 7. Different weighting schemes for regional resilience.
Land 14 01769 g007
Figure 8. Bivariate Local Moran cluster map of regional resilience and Constituent Dimensions.
Land 14 01769 g008aLand 14 01769 g008b
Figure 9. Regional resilience-based territorial spatial functional zoning map.
Land 14 01769 g009
Table 1. Resilience assessment framework by functional zone.
DimensionKey IndicatorsWeight MethodData Sources
UrbanAPPC, WEGSC, RAPC, 
CHF, GDP, GDP per capita,  
PFE, FAIPF, RSDB,  
Population, PD, LSL, UR,  
CSO, HAPC, STR, DWDR,  
GR, ISWUR, PM 2.5
Delphi, AHPStatistical yearbooks 2019,  
Administrative-boundary data,  
land-use
AgriculturalAlt, RDLS, SSC, Pre, Tem,  
HSS, AIFFAHF, AFA, AEURA
EntropyDEM, the World Soil Database,  
Climate dataset
EcologicalLand-use type, Soil fertility, 
Soil texture, Climate, Biodiversity
Adopted from papersLand-use, NDVI, NPP  
the World Soil Database,  
Climate dataset
Note: Abbreviations for key indicators listed in this table are defined and described in detail in the subsequent indicator system subsections of each resilience assessment dimension.
Table 2. Urban resilience evaluation index.
Target LevelCriteria LevelWeightsAlternatives LevelWeights
urban resilienceinfrastructure resilience0.3124APPC0.0615
WEGSC0.0936
RAPC0.0694
CHF0.0879
economic resilience0.2562GDP0.0426
RSDB0.0407
PFE0.0669
GDP per capita0.0448
FAIPF0.0612
social resilience0.2335population0.0426
LSL0.0417
PD0.0426
UR0.0351
CSO0.0322
HAPC0.0393
environmental resilience0.1979STR0.0358
DWDR0.0269
GR0.0345
ISWUR0.0412
PM2.50.0585
Table 3. Agricultural resilience evaluation indicators.
Tier 1 IndicatorsTier 2 IndicatorsTier 3 IndicatorsTypesWeights
agricultural resiliencePhysical factorsAlt0.094
RDLS0.091
SSC0.088
Pre+0.162
Tem+0.142
HSS+0.153
Human factorsAIFFAHF+0.097
AFA+0.091
AEURA+0.082
Table 4. The table of ERI weights for each land-use type.
Land-Use 
Type
WoodlandGrasslandsFarmlandWater BodyUnused  
Land
Construction 
Land
ERI weight0.120.160.320.530.820.85
Table 5. Ecological recovery assessment indicators.
IndicatorsResponses CharacteristicsDataWeights
Soil fertilitySlow variableOrganic carbon content0.1382
Soil textureSoil texture0.2352
ClimateAverage annual temperature0.1365
Average annual precipitation0.1694
BiodiversityDiversitySpecies diversity index0.3207
Table 6. Monetary values per hectare of different land types in the study area (Unit: CNY/ha).
Function TypesFarmlandWoodlandGrasslandWater BodyUnused LandConstruction Land
Supply servicesFood production1553.51512.66668.01823.3631.070
Raw material production605.874629.47559.26543.7362.140
Regulatory servicesAir conditioning1118.536711.172330.27792.2993.210
Climate conditioning1506.916322.792423.483200.24201.960
Hydrological conditioning1196.26353.862361.3429,159.42108.750
Waste treatment2159.382672.042050.6423,069.66403.910
Support ServicesSoil conservation2283.666245.123479.87636.94264.10
Maintaining biodiversity1584.587006.342905.075328.55621.40
Cultural servicesProviding an aesthetic landscape264.113231.311351.556897.59372.840
Total12,272.7543,684.7618,129.4970,451.782159.380
Table 7. Table of area in different levels of regional resilience in the study area.
RR LevelArea ( km 2 )% of the Study Area
Low69073.73
Relatively low134,51472.72
Moderate41,17922.26
Relatively high23611.28
High150.01
Total184,976100.00
Table 8. Table of different weights combination for UR, AR, and ER.
SchemeUR (%)AR (%)ER (%)Fig. Label
1202060a
2204040b
3206020c
4402040d
5404020e
6602020f
Table 9. Resilience class distribution (%) across weighting schemes.
SchemeLowRelatively LowModerateRelatively HighHigh
Baseline3.7372.7222.261.280.01
1 (Eco)3.9862.0332.671.310.01
2 (Agro-Eco)0.6041.8054.123.470.01
3 (Agro)2.0825.3051.4920.880.24
4 (Urban-Eco)18.5876.563.821.040.00
5 (Urban-Agro)8.4069.3320.861.150.26
6 (Urban)75.3121.871.760.021.03
Table 10. Matrix for determining territorial spatial resilience zones.
Resilience Evaluation ResultsTerritorial Spatial Resilience Zoning
Urban ResilienceAgricultural ResilienceEcological Resilience
HighHighHighCURZs
HighHighModerateCURZs
HighHighLowCURZs
HighModerateHighCURZs
HighModerateModerateCURZs
HighModerateLowCURZs
HighLowHighCURZs
HighLowModerateCURZs
HighLowLowCURZs
ModerateHighHighUTRZs
ModerateHighModerateUTRZs
ModerateHighLowUTRZs
ModerateModerateHighUTRZs
ModerateModerateModerateUTRZs
ModerateModerateLowUTRZs
ModerateLowHighUTRZs
ModerateLowModerateUTRZs
ModerateLowLowUTRZs
LowHighHighCERZs
LowHighModerateCARZs
LowHighLowCARZs
LowModerateHighCERZs
LowModerateModerateATRZs
LowModerateLowATRZs
LowLowHighCERZs
LowLowModerateCERZs
LowLowLowCERZs
Disclaimer/Publisher’s Note: The statements, opinions and data contained in all publications are solely those of the individual author(s) and contributor(s) and not of MDPI and/or the editor(s). MDPI and/or the editor(s) disclaim responsibility for any injury to people or property resulting from any ideas, methods, instructions or products referred to in the content.