Article

Revealing the Driving Factors of Land Disputes in China: New Insights from Machine Learning and Interpretable Methods

1
School of Marxism, Hubei University, Wuhan 430062, China
2
Center of Agricultural Master’s Education, Hubei University, Wuhan 430062, China
3
College of Public Administration, Huazhong University of Science and Technology, Wuhan 430074, China
4
College of Tourism Management, Wuhan Business University, Wuhan 430056, China
5
College of Computer Science and Technology, Wuhan University of Science and Technology, Wuhan 430065, China
*
Author to whom correspondence should be addressed.
Land 2025, 14(9), 1757; https://doi.org/10.3390/land14091757
Submission received: 7 August 2025 / Revised: 24 August 2025 / Accepted: 27 August 2025 / Published: 29 August 2025

Abstract

Land disputes pose a severe challenge for many developing countries worldwide. Understanding the driving factors of land disputes is crucial for social stability and sustainable development. China is one of the countries with the most severe situations of land disputes. This paper evaluates the land dispute intensity (LDI) across 30 provinces in China from 2011 to 2022. Using the GBDT model and interpretability methods, this study reexamines the importance of multidimensional variables in LDI, while also uncovering their nonlinear and interaction effects. The results show that LDI across 30 provinces generally and continuously increased after 2014, with this trend being notably curbed after 2019. In terms of the driving factors of LDI, the number of specialized farmers’ cooperatives plays the most critical role (mean |SHAP value| = 0.4). Variables such as share of primary industry, coverage of land transfer service centers, and agricultural product price index also exert a stronger influence on LDI. Clear nonlinear effects on LDI are observed for the agricultural product price index, the number of specialized farmers’ cooperatives, and the mediation rate of non-litigation disputes. In terms of interaction effects, when the mediation rate of non-litigation disputes is lower than 0.9, increases in the number of specialized farmers’ cooperatives and coverage of land transfer service centers tend to enhance their influence on raising LDI. When the ratio of cultivated land transfer is below 0.3, an increase in coverage of land transfer service centers is associated with a stronger effect in reducing LDI. Overall, this study uses the GBDT model, Shapley additive explanation (SHAP), and partial dependency plots (PDPs) to identify the main driving factors of land disputes. This paper can provide valuable references for developing countries and regions worldwide in addressing land disputes and conflicts.

1. Introduction

Land disputes are a widespread challenge in many developing countries, particularly in regions such as East Asia, Southeast Asia, Sub-Saharan Africa, and Latin America [1,2,3]. The social unrest and economic stagnation caused by these disputes have raised significant concerns. In many regions, farmers’ land rights are unjustly deprived, and even their basic right to livelihood is difficult to guarantee [4,5,6]. As the world’s largest developing country and one of the most affected by land conflicts, China has long faced threats to rural stability and agricultural security [7]. Statistics from China’s agricultural sector show that in 2022, the total number of disputes related to rural land contracting and transfer exceeded 150,000 cases [8]. In response, the Chinese government has made ongoing efforts to mitigate land disputes and their adverse effects through institutional reforms and policy adjustments. In 2019, the central government pledged to stabilize and improve rural land contracting relations and to properly address conflicts arising from contract extensions. Judicial authorities also issued specialized guidance on adjudicating land dispute cases. However, local governments often struggle to prevent and resolve these disputes effectively [9,10]. With the deepening of land system reforms in recent years, issues surrounding land tenure and the distribution of benefits have become increasingly complex [11]. These emerging dynamics place significant pressure on local governments. In this context, examining the driving factors behind land disputes can offer valuable insights into their root causes, providing local governments with practical references for preventing conflicts and maintaining social stability.
Research on land disputes dates back to the fifth and fourth centuries BCE, when ancient Greek scholars discussed conflicts related to land cultivation and land purchases [12]. During the Middle Ages, competition for land intensified, particularly with the rise of the enclosure movement in Britain. Broadly speaking, any social conflict involving land can be classified as a land dispute [4]. However, the term is most commonly used to refer to tensions and conflicts concerning land resources and the distribution of related benefits [13]. From the perspective of the political economy of land, land disputes are not merely legal struggles over property rights. Rather, they are concrete manifestations of deeper imbalances in social relations, resource allocation, and institutional arrangements [14].
For a long time, scholarly discussions on land disputes have primarily focused on several key areas. First, researchers have classified land disputes based on their causes [9], the stakeholders involved [15], and the nature of the conflicts [16]. In recent years, increasing attention has also been paid to the spatiotemporal distribution [10] and risk evaluation [17] of such disputes. Second, scholars have investigated the root causes and underlying mechanisms behind land disputes. It is widely believed that a fundamental cause is the scarcity of land resources, which cannot meet the demands of population growth and urban expansion [18,19]. The political economy of land provides important insights into these mechanisms, highlighting that land disputes are not only legal or economic issues but also reflect deeper conflicts of interest and power struggles over land ownership, use, and allocation [20]. The deprivation of land rights among marginalized groups and the unequal distribution of land-related benefits are viewed as major contributors to land disputes, underscoring structural deficiencies within land systems [21]. A study conducted in rural Zimbabwe found that land disputes are not always driven by economic concerns—they may also stem from political power struggles [22]. Third, in terms of resolution, alternative dispute resolution methods—such as negotiation, mediation, and arbitration—play an important role in addressing land conflicts in Sub-Saharan Africa [23,24]. However, a study in rural Ghana indicates that traditional mechanisms, including court litigation and administrative adjudication, are still the preferred means of settling disputes [25]. Additionally, some researchers have examined the broader impacts of land disputes, including their links to corruption and racial tensions [26].
Turning our attention to China, as the world’s largest developing country, it faces a particularly strained relationship between people growth and land resources [8]. Within the context of China’s dual land ownership system, which separates urban and rural land rights, land disputes are deeply embedded in the complex institutional relationships among the state, collectives, and individuals [27]. The emergence of such disputes often signals a disruption in the established order of land use [28]. This confrontational process reflects not only tangible tensions between people and land but also the ongoing reconfiguration of interests and power relations [29]. On one hand, decades of rapid urbanization have intensified concerns over spatial injustice. In peri-urban areas in particular, rights violations during land expropriation, compensation, and resettlement have sparked significant public resistance [30,31]. Some scholars argue that “land finance,” an institutional arrangement in which local governments rely on transferring land use rights to generate fiscal revenue, has contributed to a surge in land disputes in rural and suburban regions [32]. On the other hand, since 2014, the Chinese government has promoted a policy encouraging capital and enterprise investment in agriculture and rural development, often referred to as “inflow of social capital into rural areas.” Although intended to stimulate rural revitalization, this policy has encountered legal ambiguities and institutional shortcomings [33]. In many cases, collusion between capital interests and local authorities, along with the exclusion of farmers from decision-making processes, has given rise to a range of land disputes [27,34]. In the early stages of land dispute resolution, the focus was on macro-level policy and legal reforms [11,33]. Especially in cities, the high stakes and intense conflicts drive people to prefer courts and other formal institutions. With the implementation of a policy aimed at separating land ownership rights, contract rights, and management rights, land transfer gradually became more common. The formal confirmation and registration of land rights were also expected to help reduce the incidence of land disputes [35,36]. During this period, local governments are increasingly emphasizing the role of informal dispute resolution. Nowadays, whether in urban or rural areas, land disputes are more often guided toward informal channels such as negotiation and mediation. However, when these mechanisms fail, formal institutions step in to ensure the land rights of stakeholders. One perspective views land disputes as a structured process, highlighting the need to advance property rights reform [37] and to optimize the mechanisms for distributing land-related benefits [38]. From the standpoint of promoting spatial justice, improving governmental functions [39] and enhancing farmers’ political participation [40] are also regarded as promising approaches. However, the practical application of these recommendations remains challenging due to the absence of supporting quantitative evidence, which this study aims to provide.
The above-mentioned literature provides a solid theoretical reference and empirical analysis framework for exploring the driving factors of land disputes. In recent years, as research tools have advanced and data mining capabilities have improved, with scholars beginning to adopt econometric approaches to explore the factors influencing land disputes. Findings indicate that variables such as the level of urbanization [7], the scale of land transfers and transaction costs [35], government investment in dispute resolution mechanisms, and family-related factors [41] are all significantly associated with the occurrence of land disputes. Although the relevant research is helpful for us to understand why land disputes occur, there are still certain limitations. Firstly, treating the number of disputes as the dependent variable overlooks the differences among types of land disputes, leading to insufficient explanatory power in the quantitative analysis model. Secondly, research on the factors influencing land disputes has largely focused on the micro level of individual farmers, often lacking comprehensive assessments and generalizable conclusions. Moreover, given the complexity and diversity of land disputes, their driving factors are likely to span multiple dimensions. Econometric methods, while valuable for interpretive analysis, face limitations in variable selection and causal inference. In contrast, machine learning approaches do not rely on predefined model structures. With their strong capabilities in data mining, model construction, and pattern recognition, they offer distinct advantages in variable selection, mechanism analysis, and outcome prediction. Currently, they have been widely applied in the exploration of various driving factors of social problems [42,43].
Using data from China Judgments Online (https://wenshu.court.gov.cn/, accessed on 2 August 2024) and machine learning algorithms, this study aims to assess the land dispute intensity and explore driving factors across 30 provincial-level regions in mainland China (excluding Tibet) from 2011 to 2022. Figure 1 presents the analytical framework, which consists of four key steps. First, the spatiotemporal evolution of land dispute intensity (LDI) was illustrated using descriptive statistics and ArcMap 10.7. Second, based on a comprehensive literature review, 33 potential independent variables were collected from economic, demographic, institutional, and land-related dimensions. Spearman correlation analysis and support vector machine–recursive feature elimination (SVM-RFE) was then employed to identify the 15 most optimal independent variables. Third, using a gradient boosting decision tree (GBDT) model, the study applied Shapley Additive Explanations (SHAP), partial dependence plots (PDPs), and SHAP dependency plots to reveal the importance of each variable, as well as their nonlinear impact and interaction effects on LDI. Finally, based on the findings, policy recommendations were proposed to help reduce land dispute intensity.
The potential contribution of this study lies in its application of machine learning methods to analyze the driving factors of land disputes. Compared with traditional econometric approaches, machine learning offers a more scientific means of handling relevant variables, allows for more comprehensive identification of dispute drivers, and enables a more accurate assessment of their impacts. Robustness tests further validate the results, ultimately generating new insights that differ from previous studies. This research provides valuable references for the prevention and resolution of land disputes across different countries and regions.

2. Data, Models, and Methods

2.1. Data and Sources

2.1.1. Variable and Sources

(1) Dependent variable
This paper first obtained the number of land dispute cases in 30 provinces from 2011 to 2022 on China Judgments Online. Specifically, civil cases such as “disputes over land contracted management rights”, “disputes over construction land use rights”, “disputes over homestead use rights”, “disputes over construction land use rights contracts”, “disputes over temporary land use contracts”, and “disputes over rural land contract” were collected. In judicial practice, the above-mentioned causes of action basically cover the main types of land disputes. At the same time, land disputes in criminal case categories, enforcement causes of action, and administrative causes of action were also retrieved. After data collection and screening, the number of land dispute cases was ultimately obtained. However, it is important to note that using the total number of disputes directly as the dependent variable may obscure the heterogeneity among different types of land disputes, potentially reducing the representativeness and explanatory power of this variable. Therefore, drawing on the previous studies [30,44], by assigning weights to courts at different levels and combining the number of disputes, the intensity of land disputes was calculated. Taking it as the dependent variable, we can quantify the regional differences and severity of land disputes as reasonably as possible. The equation is as follows:
L D I = W k     N k
where LDI denotes the land dispute intensity, N k represents the number of land dispute cases at a certain court level, and W k represents the weight of that court level. Referring to the research of Zhang et al. [7], the weights of the Supreme People’s Court, the High People’s Court, the Intermediate People’s Court, and the Primary People’s Court were determined as W 1 = 0.35, W 2 = 0.30, W 3 = 0.20, and W 4 = 0.15, respectively.
(2) Independent variables
The driving factors behind land disputes are highly complex, with their root cause lying in the competition for interests triggered by land appreciation. At the macroeconomic level, rapid urban expansion and sustained economic growth pose challenges to the land’s carrying capacity. For a given region, industrial upgrading may lead to land use conflicts and interest-related disputes. Existing studies have indicated a close link between per capita GDP, industrial structure, fiscal expenditure, and land disputes [7]. Given China’s unique dual urban–rural structure, this study also incorporates urban–rural disparity and the agricultural product price index into the variable set, as these factors indirectly reflect people’s dependence on land and their expected returns. In terms of population, the tension between population growth and limited land resources is a direct driver of land disputes [29]. For decades, labor migration has been closely related to the idleness or utilization of rural land. Theoretically, if people tend to migrate for work, the occurrence of land disputes may decrease—and vice versa. Cao et al. (2024) further pointed out that the education level of farmers can affect the incidence of land disputes [45]. As for institutional variables, specialized farmers’ cooperatives and family farms are also included in the variable set in combination with the judicial practice of land disputes cases. The rapid expansion of cooperatives and farms may be accompanied by concentrated land and unfair distribution of benefits. The alternative dispute resolution (ADR) mechanisms such as mediation and arbitration directly influence the outcomes of land disputes [7,17]. Quantified indicators of property rights reform and rural benefit distribution mechanisms are also included in the variable set [31,37]. Finally, land-related variables are considered. Research shows that land prices and land endowments are closely linked to land disputes [29]. Wang (2020) and Ma et al. (2015) discussed the correlation between land transfers and land disputes [46,47]. Researchers emphasized that with the increasing frequency of land transfers, land registration is essential for clarifying property rights. Some studies found that land registration helps reduce disputes in countries like Pakistan and Bangladesh [1,23], while Krul (2021) argued that unreliable property arrangements could, in some cases, cause land titling to trigger new conflicts [48]. Other scholars also highlighted the potential risks of land disputes arising from farmers’ resistance to external enterprises [49]. Based on a survey conducted across eight counties in China, Wan et al. (2021) found that unfair profit distribution in land transfers often led to “the most intense conflicts,” and the lack of formal transaction platforms created systemic risks [50]. In the process of sorting out the causes of disputes, it was found that the non-grain transfer of cultivated land and the non-agricultural business operation after the transfer accounted for a considerable proportion. Therefore, this study further considers the mode, direction, and purpose of land transfers.
It should be noted that although some scholars discussed the potential impact of geographic factors (such as fragmentation and slope) on land disputes [10], these variables are not included in this study. From a policy perspective, local governments have limited capacity to alter geographic conditions but can adjust socio-institutional frameworks, land policies, and resolution investments to prevent land disputes. Therefore, geographic driving factors are temporarily excluded from consideration. The variables selected in this study, along with their definitions, calculation methods, and data sources, are presented in Table 1.

2.1.2. Variable Preprocessing

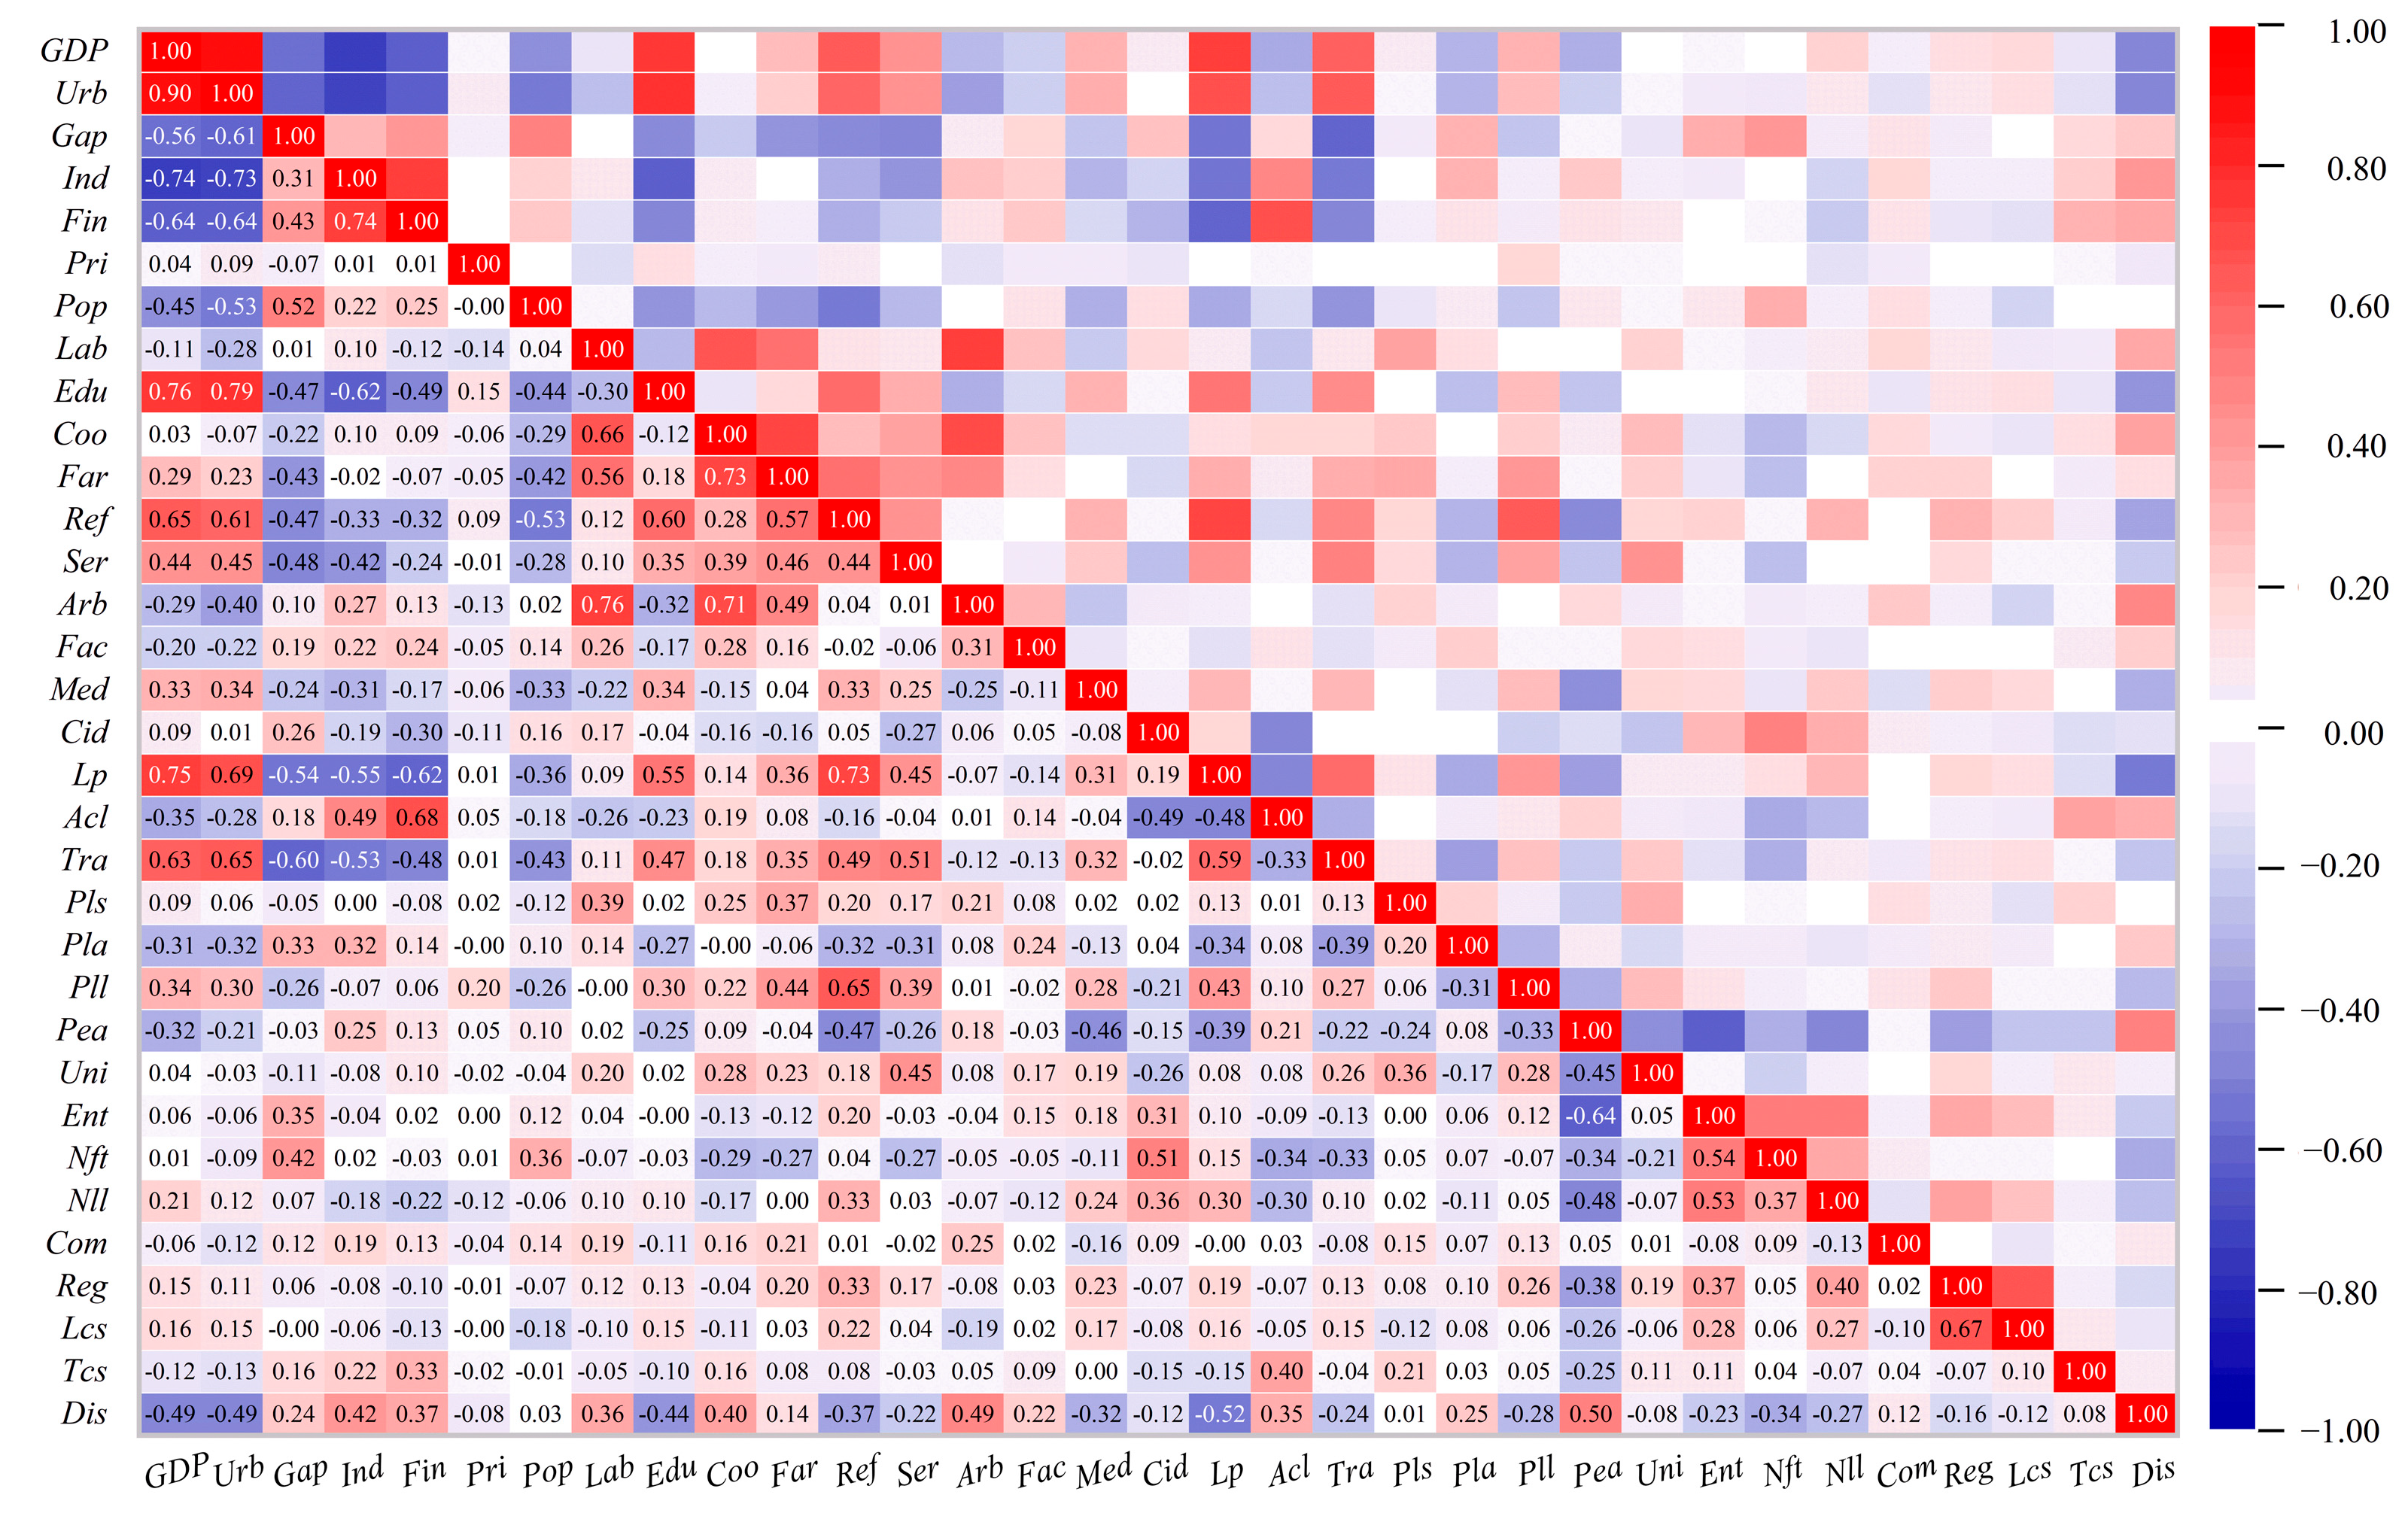
To mitigate the impact of multicollinearity on model analysis, Spearman correlation coefficients among the variables in the potential independent variable set were calculated. As shown in Figure 2, the numbers on each color block represent the correlation coefficients between two variables. The closer the absolute value of the coefficient is to 1.00, the stronger the correlation. Based on the research practice, this paper proposed that variables with an absolute coefficient value exceeding 0.75 are highly correlated, and accordingly, four variables, “GDP”, “Urb”, “Edu”, and “Lab”, were excluded.
To retain the comprehensiveness of potential driving factors behind land disputes, variable exclusion was limited to a specific extent during the correlation test. Nonetheless, some independent variables may still exhibit only weak correlations with land disputes. Therefore, the support vector machine–recursive feature elimination (SVM-RFE) algorithm was employed to refine the variable set. This algorithm iteratively evaluates feature weights to remove irrelevant variables while preserving original feature information and minimizing the risk of overfitting [51]. This approach enabled us to identify an optimal subset of variables that enhances the predictive performance of machine learning models. Using the SVM-RFE algorithm, 15 optimal variables were ultimately selected from the initial set of independent variables. Since the GBDT model employed in this study is fundamentally a tree-based decision algorithm, it generates predictions by identifying optimal split thresholds for the input variables. This process depends on the relative order of variables rather than their absolute values. In other words, standardization or normalization of variables would not change their ranking and consequently has no effect on model performance [52]. Furthermore, to preserve the interpretability of model results and their practical implications, all variables were analyzed on their original scale without standardization. Table 2 provides the descriptive statistics for the dependent variable and the selected independent variables.

2.2. Models and Methods

2.2.1. Gradient Boosting Decision Tree (GBDT)

This paper uses a GBDT to train the regression model of driving factors of land dispute intensity. The GBDT is an ensemble learning algorithm. It calculates the residuals in each iteration based on the prediction results of the previous round of models and uses them as the training target for the next round of models. The GBDT solves the common overfitting of decision tree models by combining several basic methods [53]. Compared with the random forest, it has the advantage of being more sensitive to outliers in the dataset, higher prediction accuracy, and easier-to-find higher-order relationships between variables [54]. Similarly to the GBDT, XGBoost (eXtreme gradient boosting) is also widely employed in studies investigating driving factors. It incorporates the first and second derivatives of the regularization term during the decision tree construction stage [55], making model training more efficient and accurate. But it is more suitable for high-dimensional data [56]. In recent years, artificial neural networks (ANNs) have been increasingly used for modeling nonlinear relationships [57]. However, it requires a large number of samples, and the data size in this paper is insufficient to meet the demand. From both theoretical and empirical perspectives, the GBDT is the optimal model for this study. Although the 360 samples obtained in this study meet the requirements of the machine learning model, there is still a risk of overfitting due to the relatively small sample size. To address this issue, cross-validation was employed to achieve the best fit for the regression model.
The algorithm of the GBDT can be presented as follows.
f 0 x = a r g m i n δ i = 1 N L y i , δ
ε i m = L y i , f x i f x i , f x = f m 1 x
Υ j m = a r g m i n Υ x i R j m L y i , f m 1 x i + Υ
f m x = f m 1 x + j = 1 J Υ j m I x i R j m
M x = f 0 x + m = 1 M i = 1 J Υ j m I x i R j m
Equation (2) is the initial regression function, where x is a set of independent variables, L   y i , δ is the loss function for the estimation function of observation I, and  δ is the step size for gradient descent. Equation (3) represents the calculation of residuals for samples 1, …, i. The obtained residuals ε i m are used as the new labels of the samples, and ( x i , Υ j m ) is used as the new training dataset. In Equations (4) and (5), f m x is the newly constructed tree, R j m denotes the leaf nodes of the tree, and Υ j m is R j m ’s best fit value. Equation (6) is the final prediction model after M iterations. This paper constructs a 100-mode decision tree based on the dataset (M = 100), with default back sampling and out-of-bag data testing.

2.2.2. Interpretability Methods for Machine Learning Models

(1) Shapley Additive exPlanations (SHAP)
SHAP is a common method for explaining the output of machine learning models. It explains the contribution of each feature to the model’s prediction by assigning a value (SHAP value) [52]. In this paper, SHAP values can visually present the influence of independent variables on LDI, which is helpful for identifying the main influencing factors of land disputes. The calculation formula of SHAP values is as follows:
φ i x = S N \ i S ! N S 1 ! N ! f x s i f x s
where φ i x represents the SHAP value of variable i, N represents the variable set, S is any subset of N excluding variable i, and |N| and |S| denote the number of variables in set N and subset S, respectively. f x s denotes the model trained with subset S, f x s i denotes the model trained after adding variable i, and x s and x s i are the input variable values, respectively.
(2) Partial dependency plots (PDPs)
Although SHAP values quantify the overall “contribution” of independent variables to LDI, they do not offer detailed insights into how individual variables influence the dependent variable. Partial dependence plots (PDPs) can visually illustrate the marginal effect of a single variable on the prediction outcomes of machine learning models by averaging out the effects of other variables [58]. In this study, PDPs were generated based on the selected independent variables and the output of GBDT model to better understand how these variables impact LDI.
(3) SHAP dependency plots
PDPs reveal the effect of a single variable on model’s output, but there may be interaction effects among variables, while SHAP dependency plots can directly demonstrate how principal variables and interacting variables jointly affect LDI. This study utilized Python 3.6 to generate SHAP value, PDPs, and SHAP dependency plots.

3. Results

3.1. Spatiotemporal Evolution of LDI

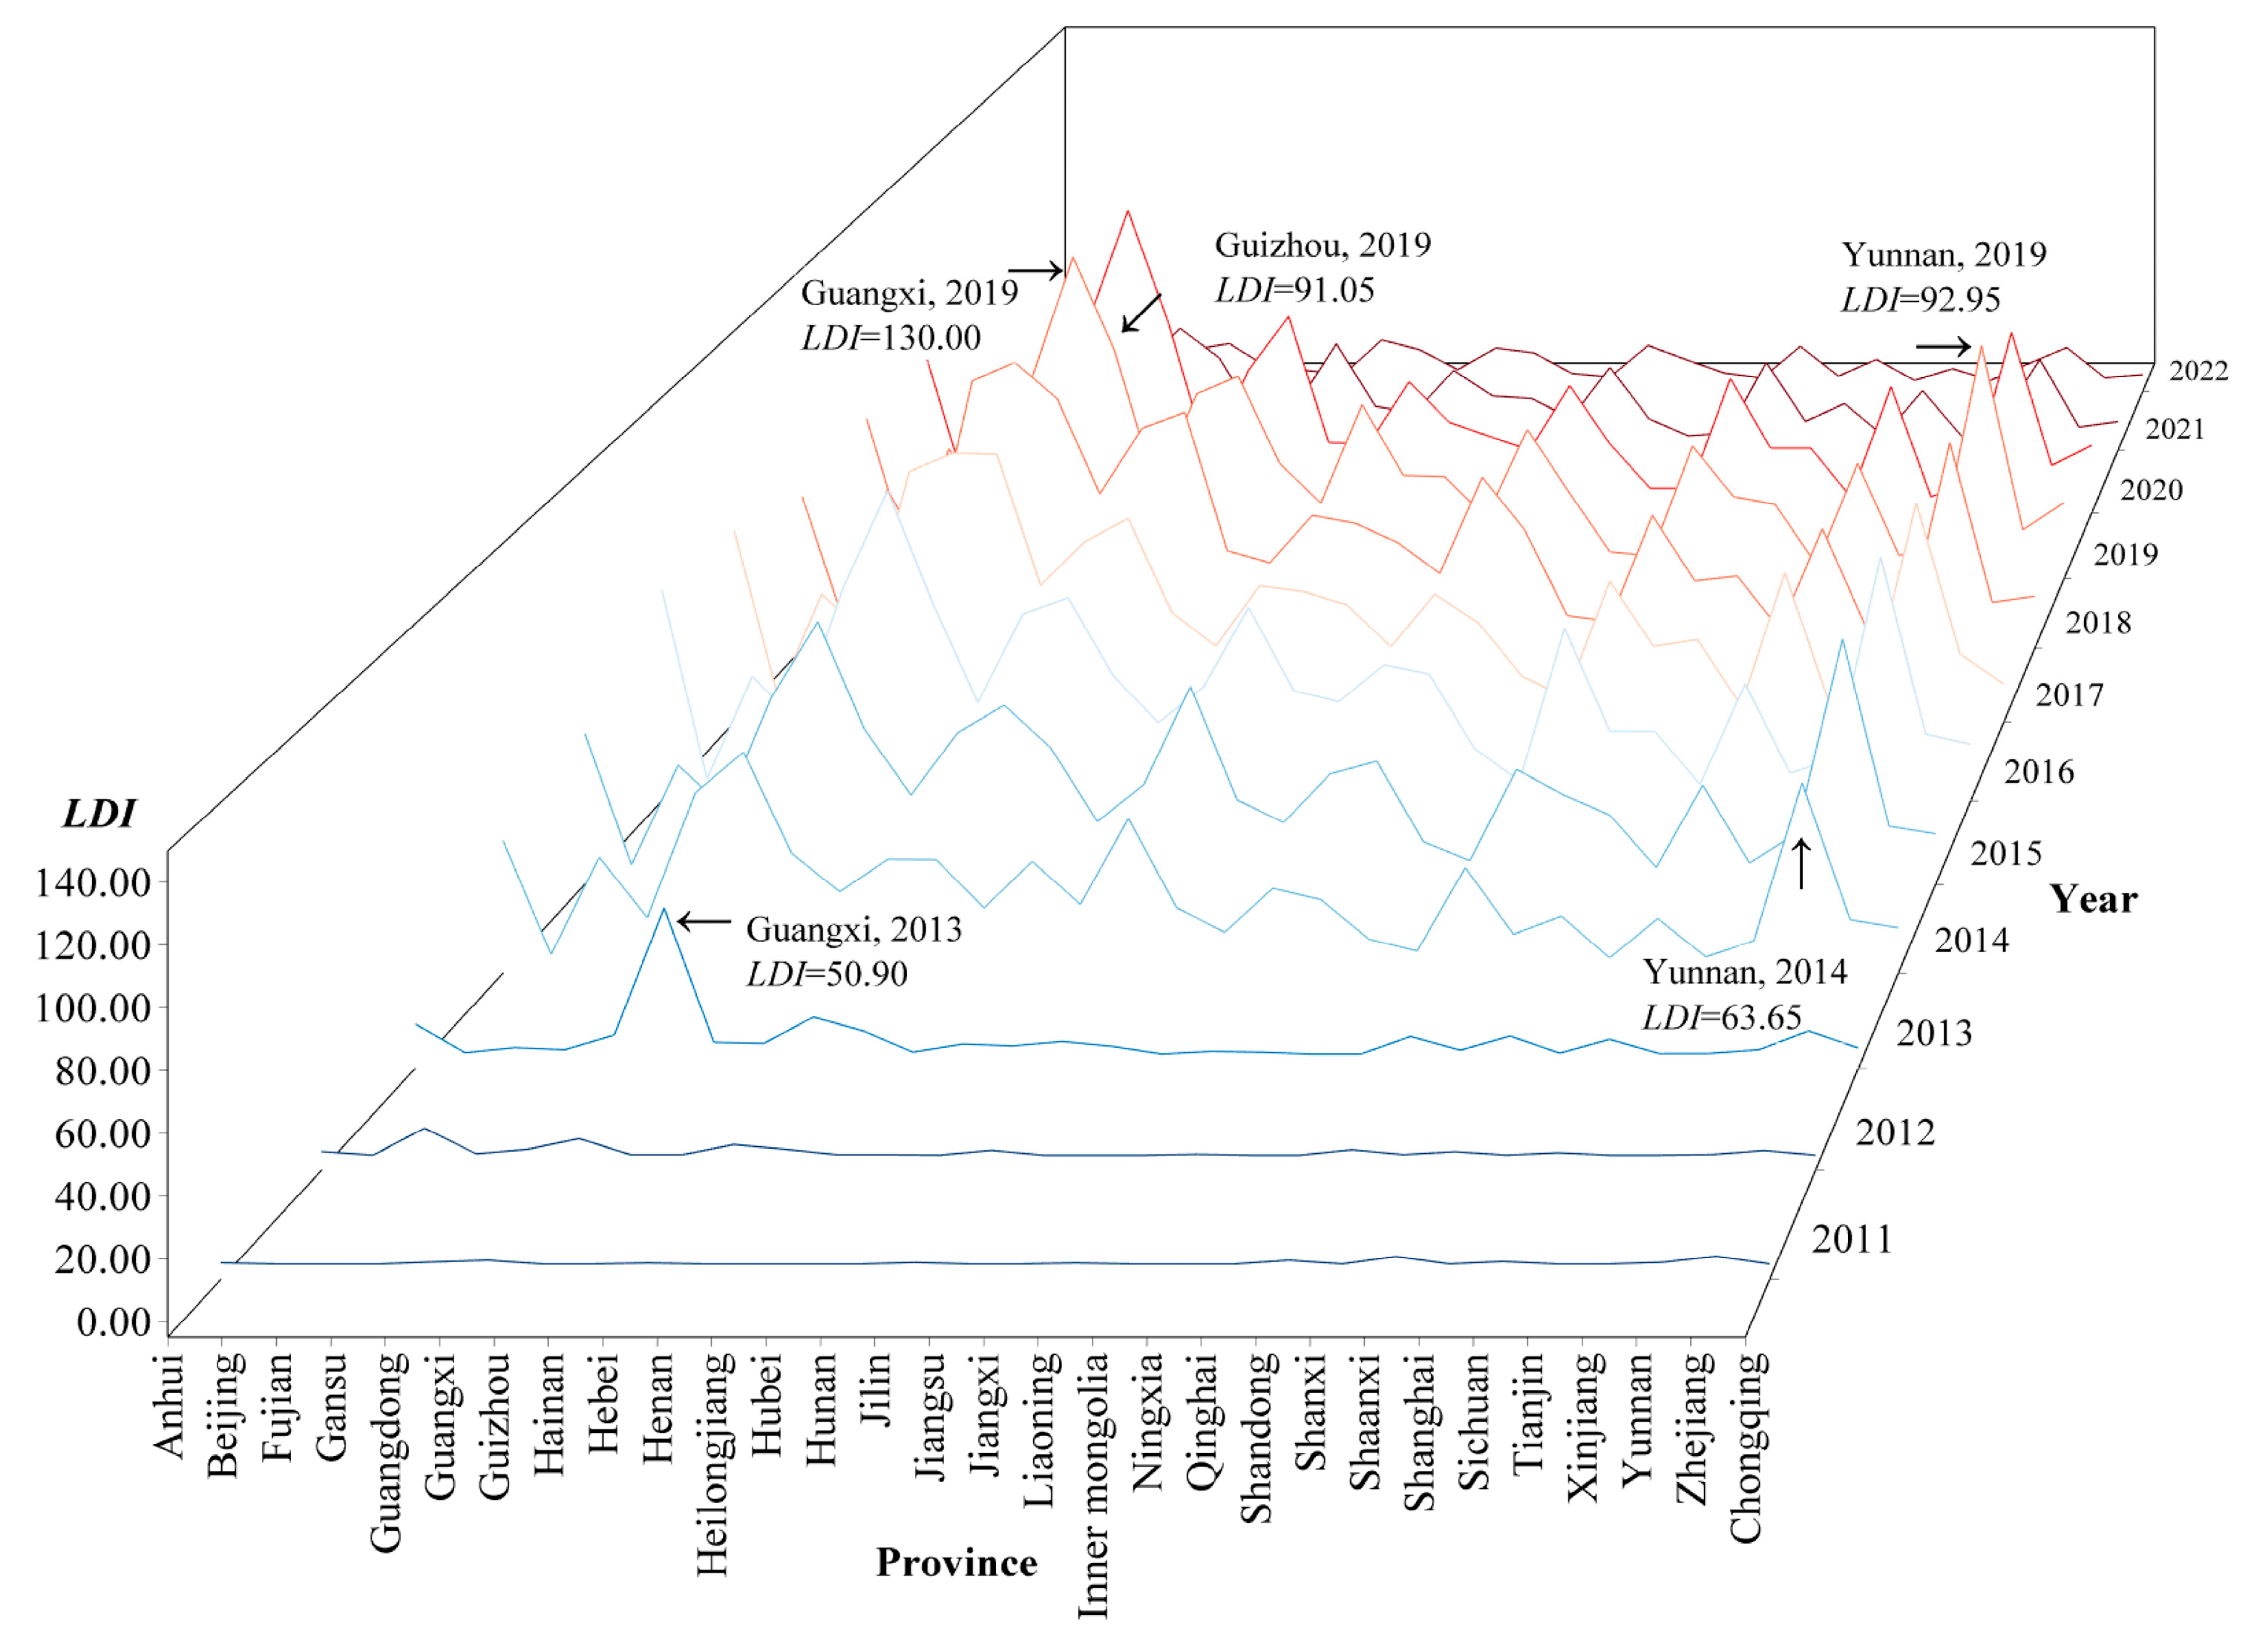
The temporal variation and regional disparities in land dispute intensity provide a more intuitive contextual foundation for this study. Using descriptive statistics and ArcMap 10.7, this paper presents the spatiotemporal evolution of LDI across 30 provinces in China from 2011 to 2022 (Figure 3 and Figure 4).
As shown in Figure 3, from 2011 to 2013, the land dispute intensity (LDI) across provinces in mainland China remained relatively low. Only Guangxi experienced a noticeable increase in 2013 (LDI = 50.90). During this period, China’s land policies were relatively stable, and land system reforms had yet to be widely implemented. Land ownership was generally clear, and the number of interest-related stakeholders remained limited, resulting in overall low LDI [17]. In 2014, nearly all provinces saw a significant rise in LDI, a trend that continued through 2019. Scholars have explored the contextual backdrop and potential mechanisms behind this shift. Whiting argued that China’s land-based fiscal system fueled a wave of land disputes during this period [32], while unfair compensation in land expropriations often triggered severe conflicts. In 2016, a reform aiming to separate land ownership, contract rights, and management rights was implemented, which led to a more complex landscape of land ownership. In addition, after 2013, an increasing inflow of capital into rural areas intensified competition over land operations and the distribution of benefits.
By 2019, the LDI in Guangxi, Guizhou, and Yunnan all exceeded 90.00, with Guangxi reaching the peak value within the study period (LDI = 130.00). For these three provinces, mountainous and hilly terrains limit the availability of land resources, while historical and customary differences among multiple ethnic groups may also play a significant role. In addition, large-scale resource development and infrastructure construction projects likely contributed to intensified interest conflicts [5]. After 2019, LDI in most regions began to decline, indicating that land disputes had been effectively managed and resolved. Some scholars have pointed out that increased investment by grassroots governments in dispute resolution played a key role [8]. The establishment of formal land markets and land transfer centers has helped clarify land ownership and the distribution of benefits, thereby reducing many unnecessary disputes. Overall, Figure 3 illustrates that after a prolonged period of increase, LDI across mainland China has now shown signs of decline.
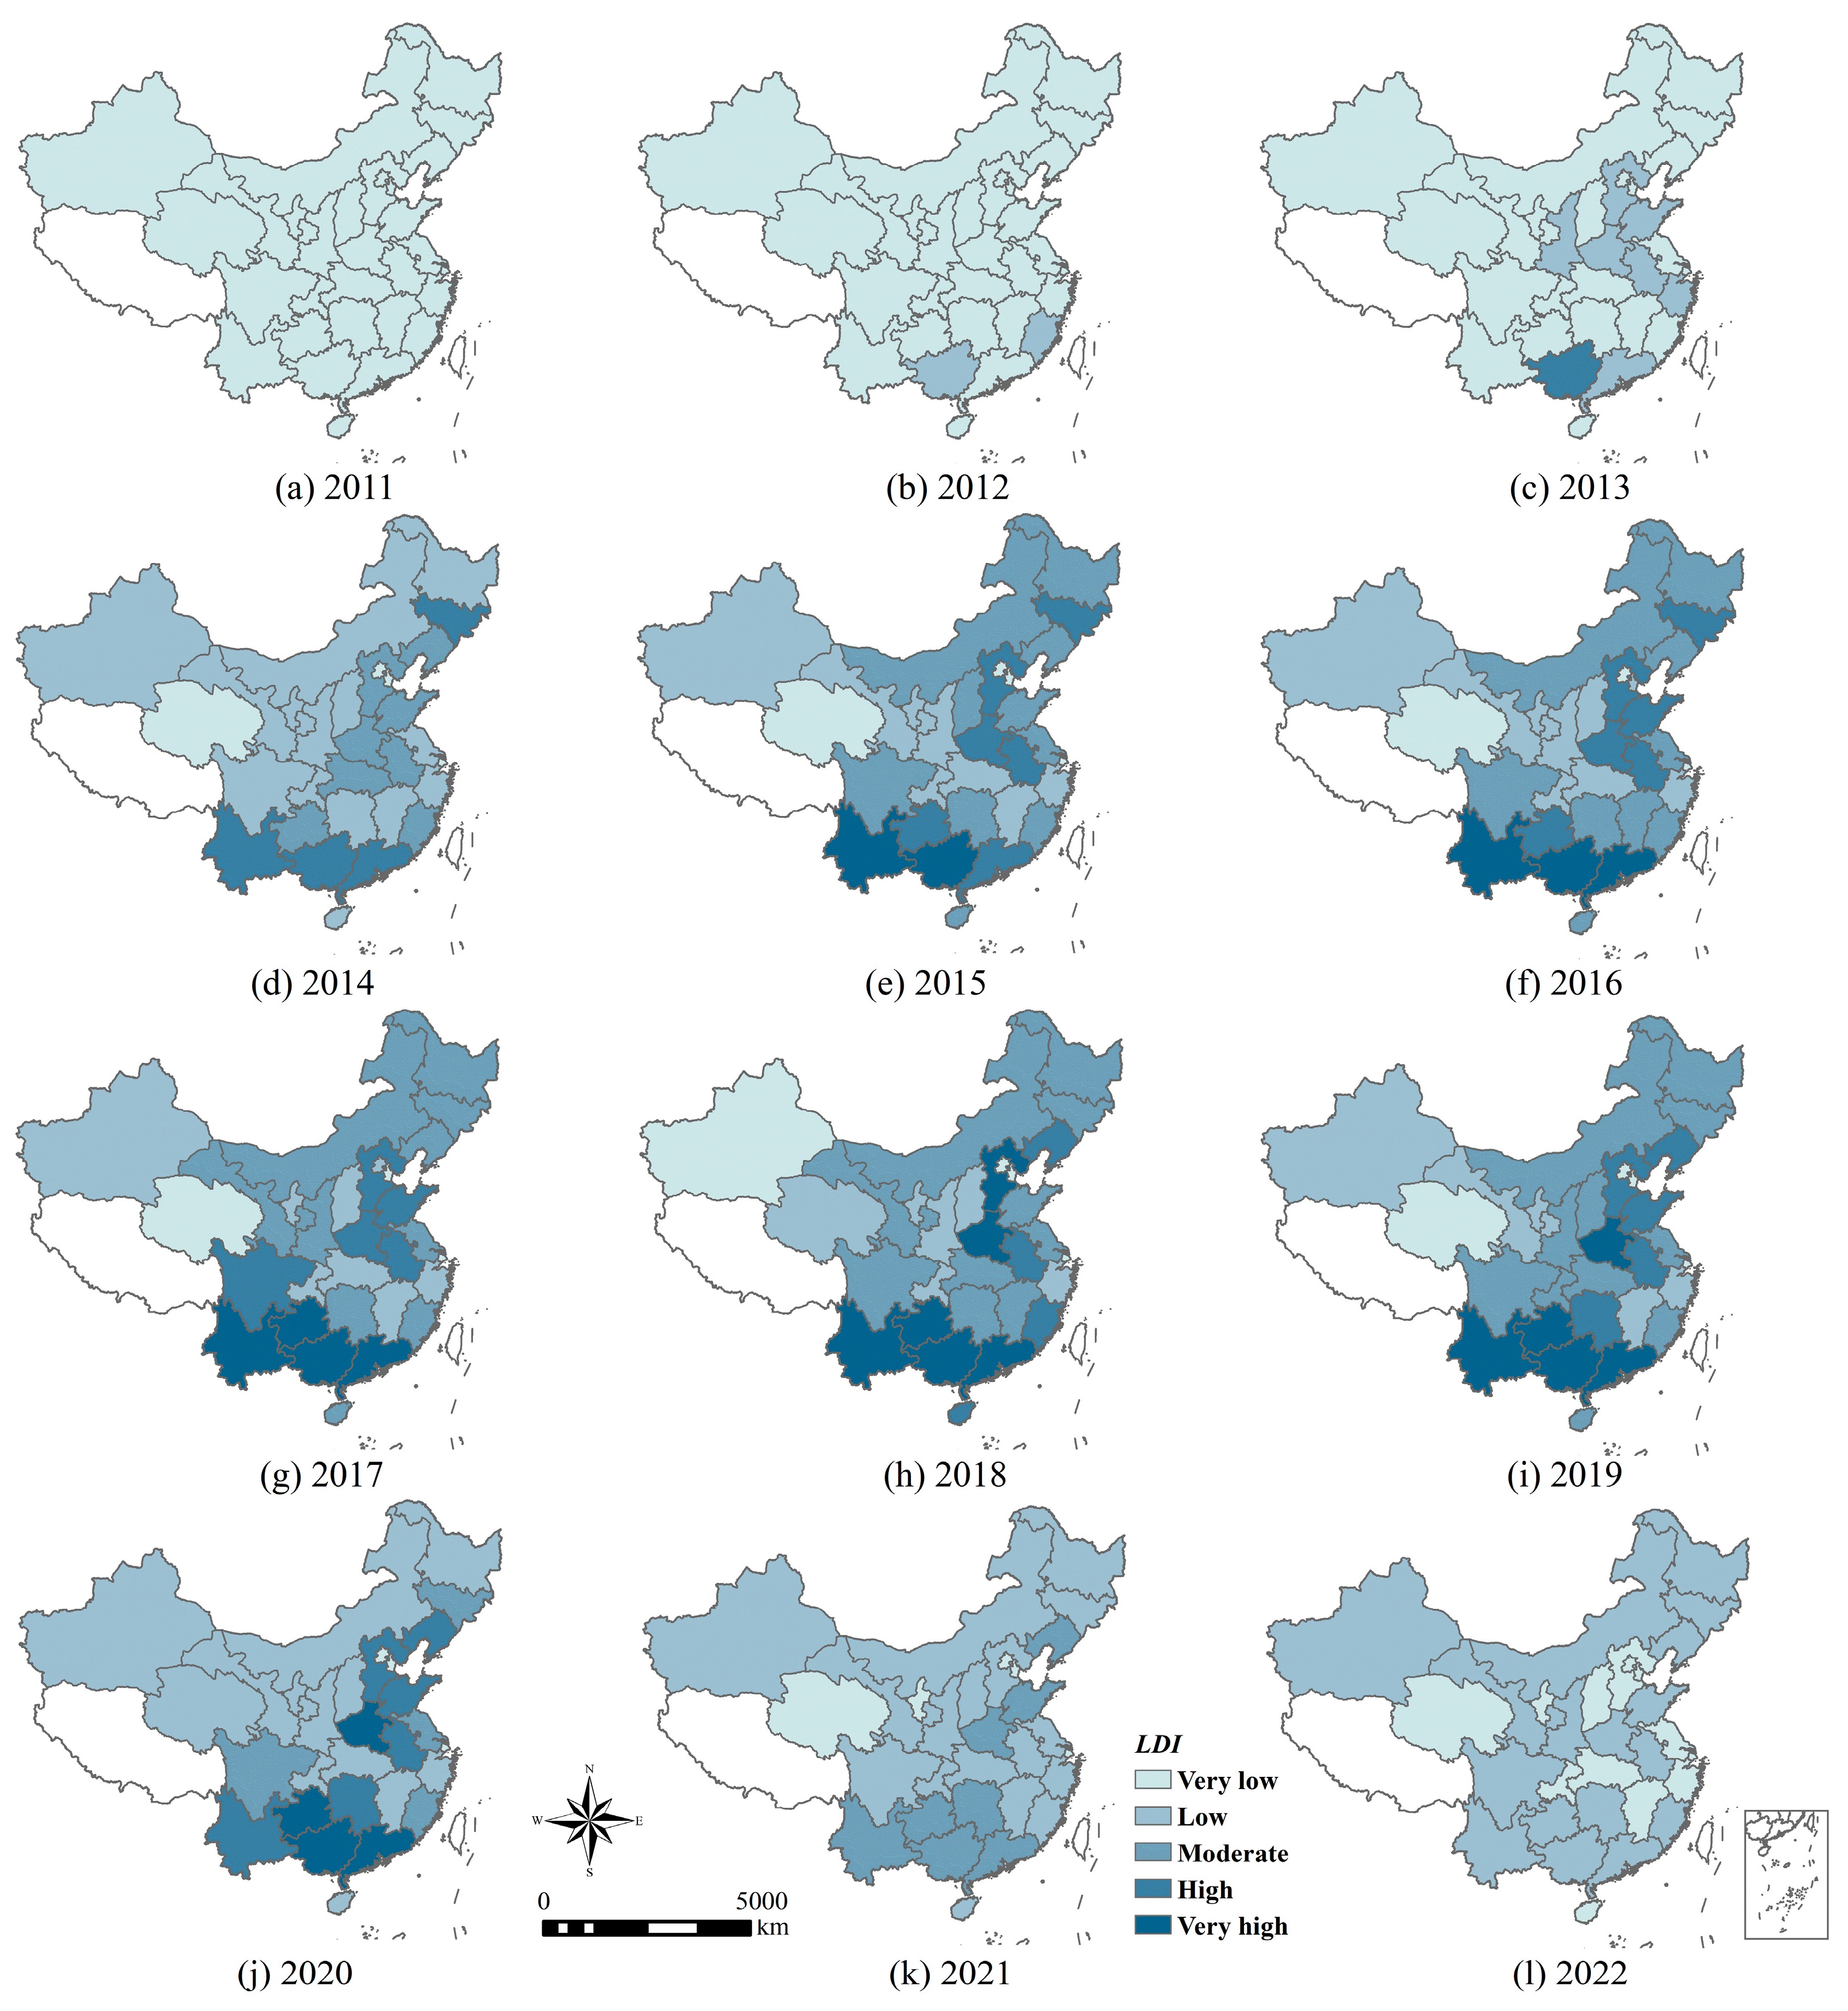
Figure 4 further illustrates the spatial distribution and temporal evolution of LDI. In ArcMap 10.7, all 360 samples over the study period were categorized into five levels—very low, low, moderate, high, and very high—using the natural breaks classification method (Jenks). As previously mentioned, from 2011 to 2013, nearly all provinces exhibited “very low” LDI. This situation changed significantly after 2014. In addition to the previously discussed Yunnan and Guangxi, provinces such as Guangdong, Jilin, and several in North China (including Hebei and Shandong) also reported concerningly high LDI. Between 2017 and 2020, provinces including Yunnan, Guizhou, Guangxi, Guangdong, and Henan consistently maintained LDI levels categorized as “high” or “very high.” This indicates that these regions experienced substantial land dispute pressure. As the most populous in China, Henan has experienced a severe imbalance between land supply and demand. Limited land resources are strictly allocated for agricultural use, leading to frequent disputes over farmland identification and rural homestead allocations over an extended period [36]. After 2020, LDI across mainland China declined significantly, with no province exceeding the “moderate” level.
Overall, LDI in Northwest China remained relatively low throughout the study period. Due to comparatively lower levels of economic development and population pressure, provinces in this region generally do not face intense human–land tensions. In contrast, North China exhibits significant strain due to scarce arable land and rapid urban expansion. Particularly under the rapid development of the Beijing–Tianjin–Hebei urban cluster, land acquisition, demolition, and the reallocation of land rights have frequently triggered land use conflicts and disputes over benefit distribution [57]. As discussed earlier, high LDI in Yunnan and Guangxi may be attributed to natural endowments and historical legacies. In other regions, however, socioeconomic factors are likely the socioeconomic drivers. Guangdong, for example, is one of the most land-constrained provinces in China. Rapid urban expansion often leads to land acquisition conflicts, while its highly developed collective economy may give rise to internal distribution disputes [45].
The spatiotemporal evolution of LDI provides crucial insights into the broader context of land disputes in China, and its complex dynamics emphasize the need for researchers to adopt a comprehensive view of potential driving factors.

3.2. Importance of Driving Factors

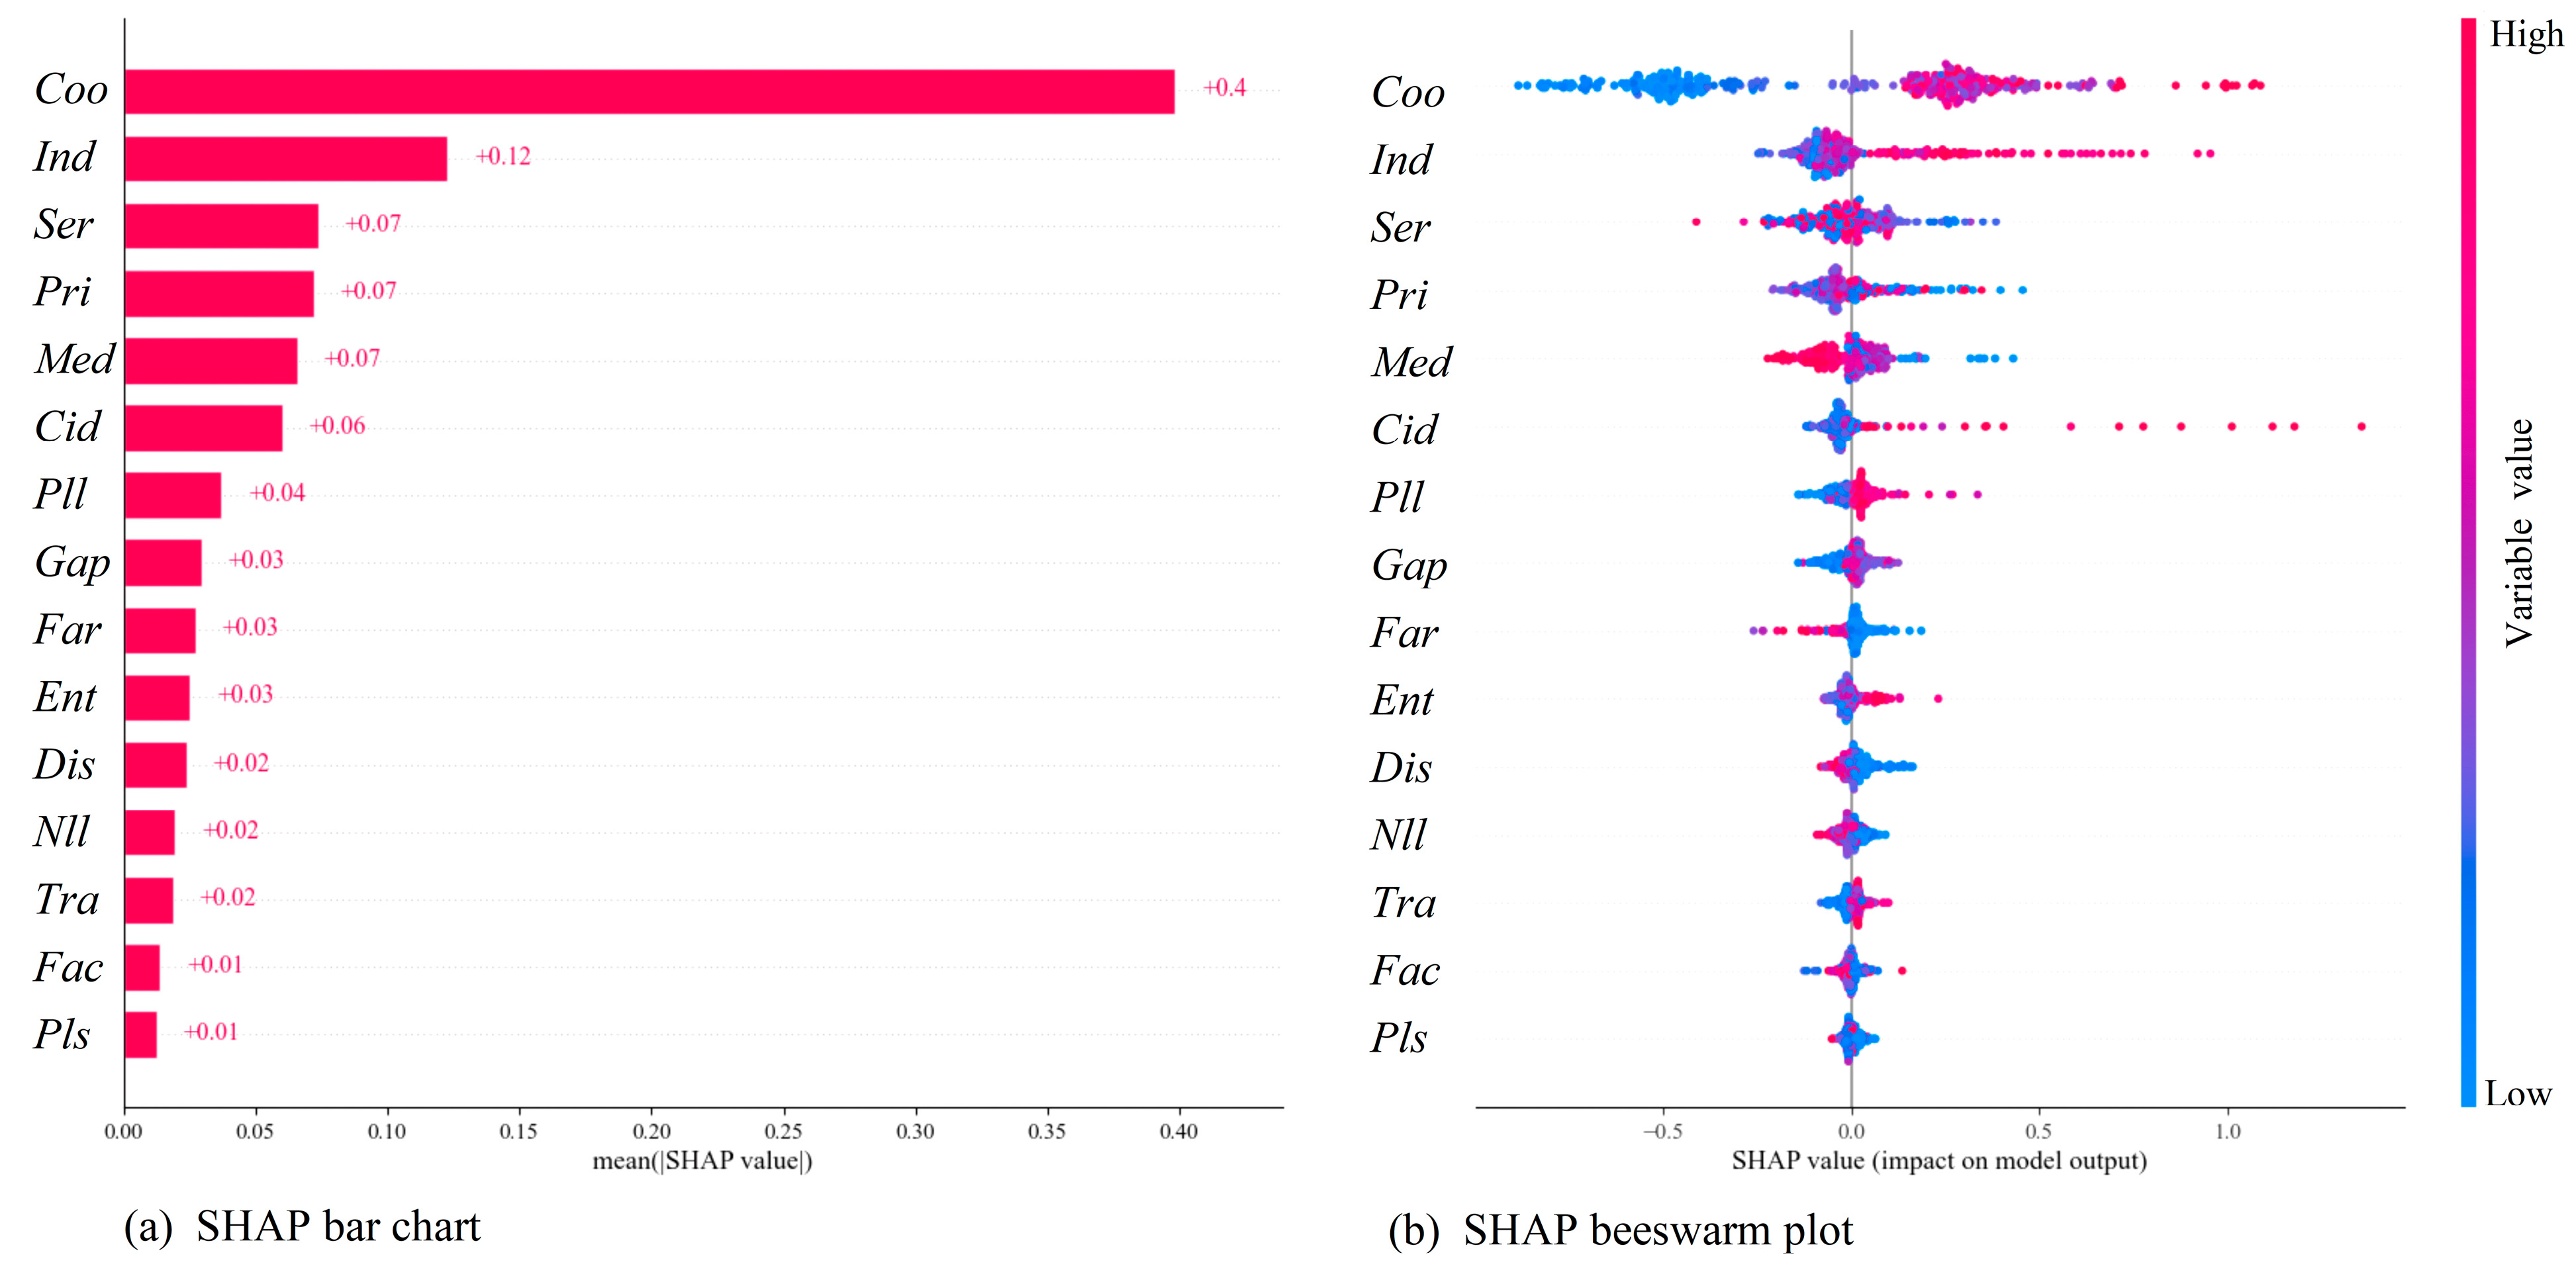
In the previous section, 15 optimal independent variables were screened out using the SVM-RFE algorithm. However, each variable contributes differently to LDI. In this section, we aim to answer which variables play a more important role, and which ones may be relatively less significant. SHAP values of independent variables are calculated to quantify their impact on LDI. Figure 5 reports the importance of variables and their contribution to model output.
In Figure 5a, the assessment of variable importance is based on the mean absolute SHAP values. The results show that Coo (number of specialized farmers’ cooperatives) plays the most important role in the model output. Some scholars raised concerns about income distribution disputes within farmers’ cooperatives [59], and this study confirms that these concerns are entirely justified. Meanwhile, Ind, Ser, Pri, Med, and Cid also have a strong impact on LDI. These findings validate the viewpoints of previous studies [17,25,31]. Researchers argued that ambiguous tenure in land transfer processes might cause disputes [50], and some highlighted interest conflicts from leasing land to non-locals [34]. However, these viewpoints were not confirmed in this study because the SHAP bar chart shows that Tra (ratio of cultivated land transfer) and Nll (proportion of land leased to non-locals) had a relatively weak impact on LDI (mean ∣SHAP value∣ = 0.02).
Figure 5b presents how variables specifically affect the model output. Red dots denote high values of variables, and blue dots denote low values. Dots to the right of y-axis (SHAP value > 0) indicate that variables’ values increase the LDI, while those to the left (SHAP value < 0) indicate that variables’ values decrease the LDI. If all dots are concentrated near y-axis, it indicates that the variable’s impact on model output is relatively weak. It can be seen that variables such as Coo, Cid, Pll, Gap, and Tra exhibit similar distribution patterns. For these variables, low values are mostly located on the left side of the y-axis, while high values tend to cluster on the right. Taking Coo as an example, higher values are associated with an increase in LDI, whereas lower values correspond to a decrease. The other variables mentioned above show comparable effects on LDI. In contrast, most high values of Med (mediation rate of non-litigation disputes) are positioned on the left side of the y-axis, indicating that alternative dispute resolution mechanisms tend to reduce LDI. Existing studies have suggested that the weaker a village’s capacity to mediate disputes, the more likely it is to experience new land conflicts [36]. Far (number of family farms), Dis (disaster-affected sown area), and Nll appear to have similar effects as Med, though the fact that their SHAP values are more tightly concentrated around the y-axis suggests that their influence on LDI is relatively limited. Therefore, they may not be the primary driving factors. The SHAP value distributions for the remaining variables are less observed, implying their impact on LDI is unclear.
It is worth noting that when SHAP outputs the marginal contributions of independent variables, it cannot fully eliminate potential interaction effects among them. Therefore, Figure 5 should be viewed as a preliminary reference for understanding the drivers of LDI. Detailed nonlinear effects and interaction effects need to be further explored.

3.3. Nonlinear Effects

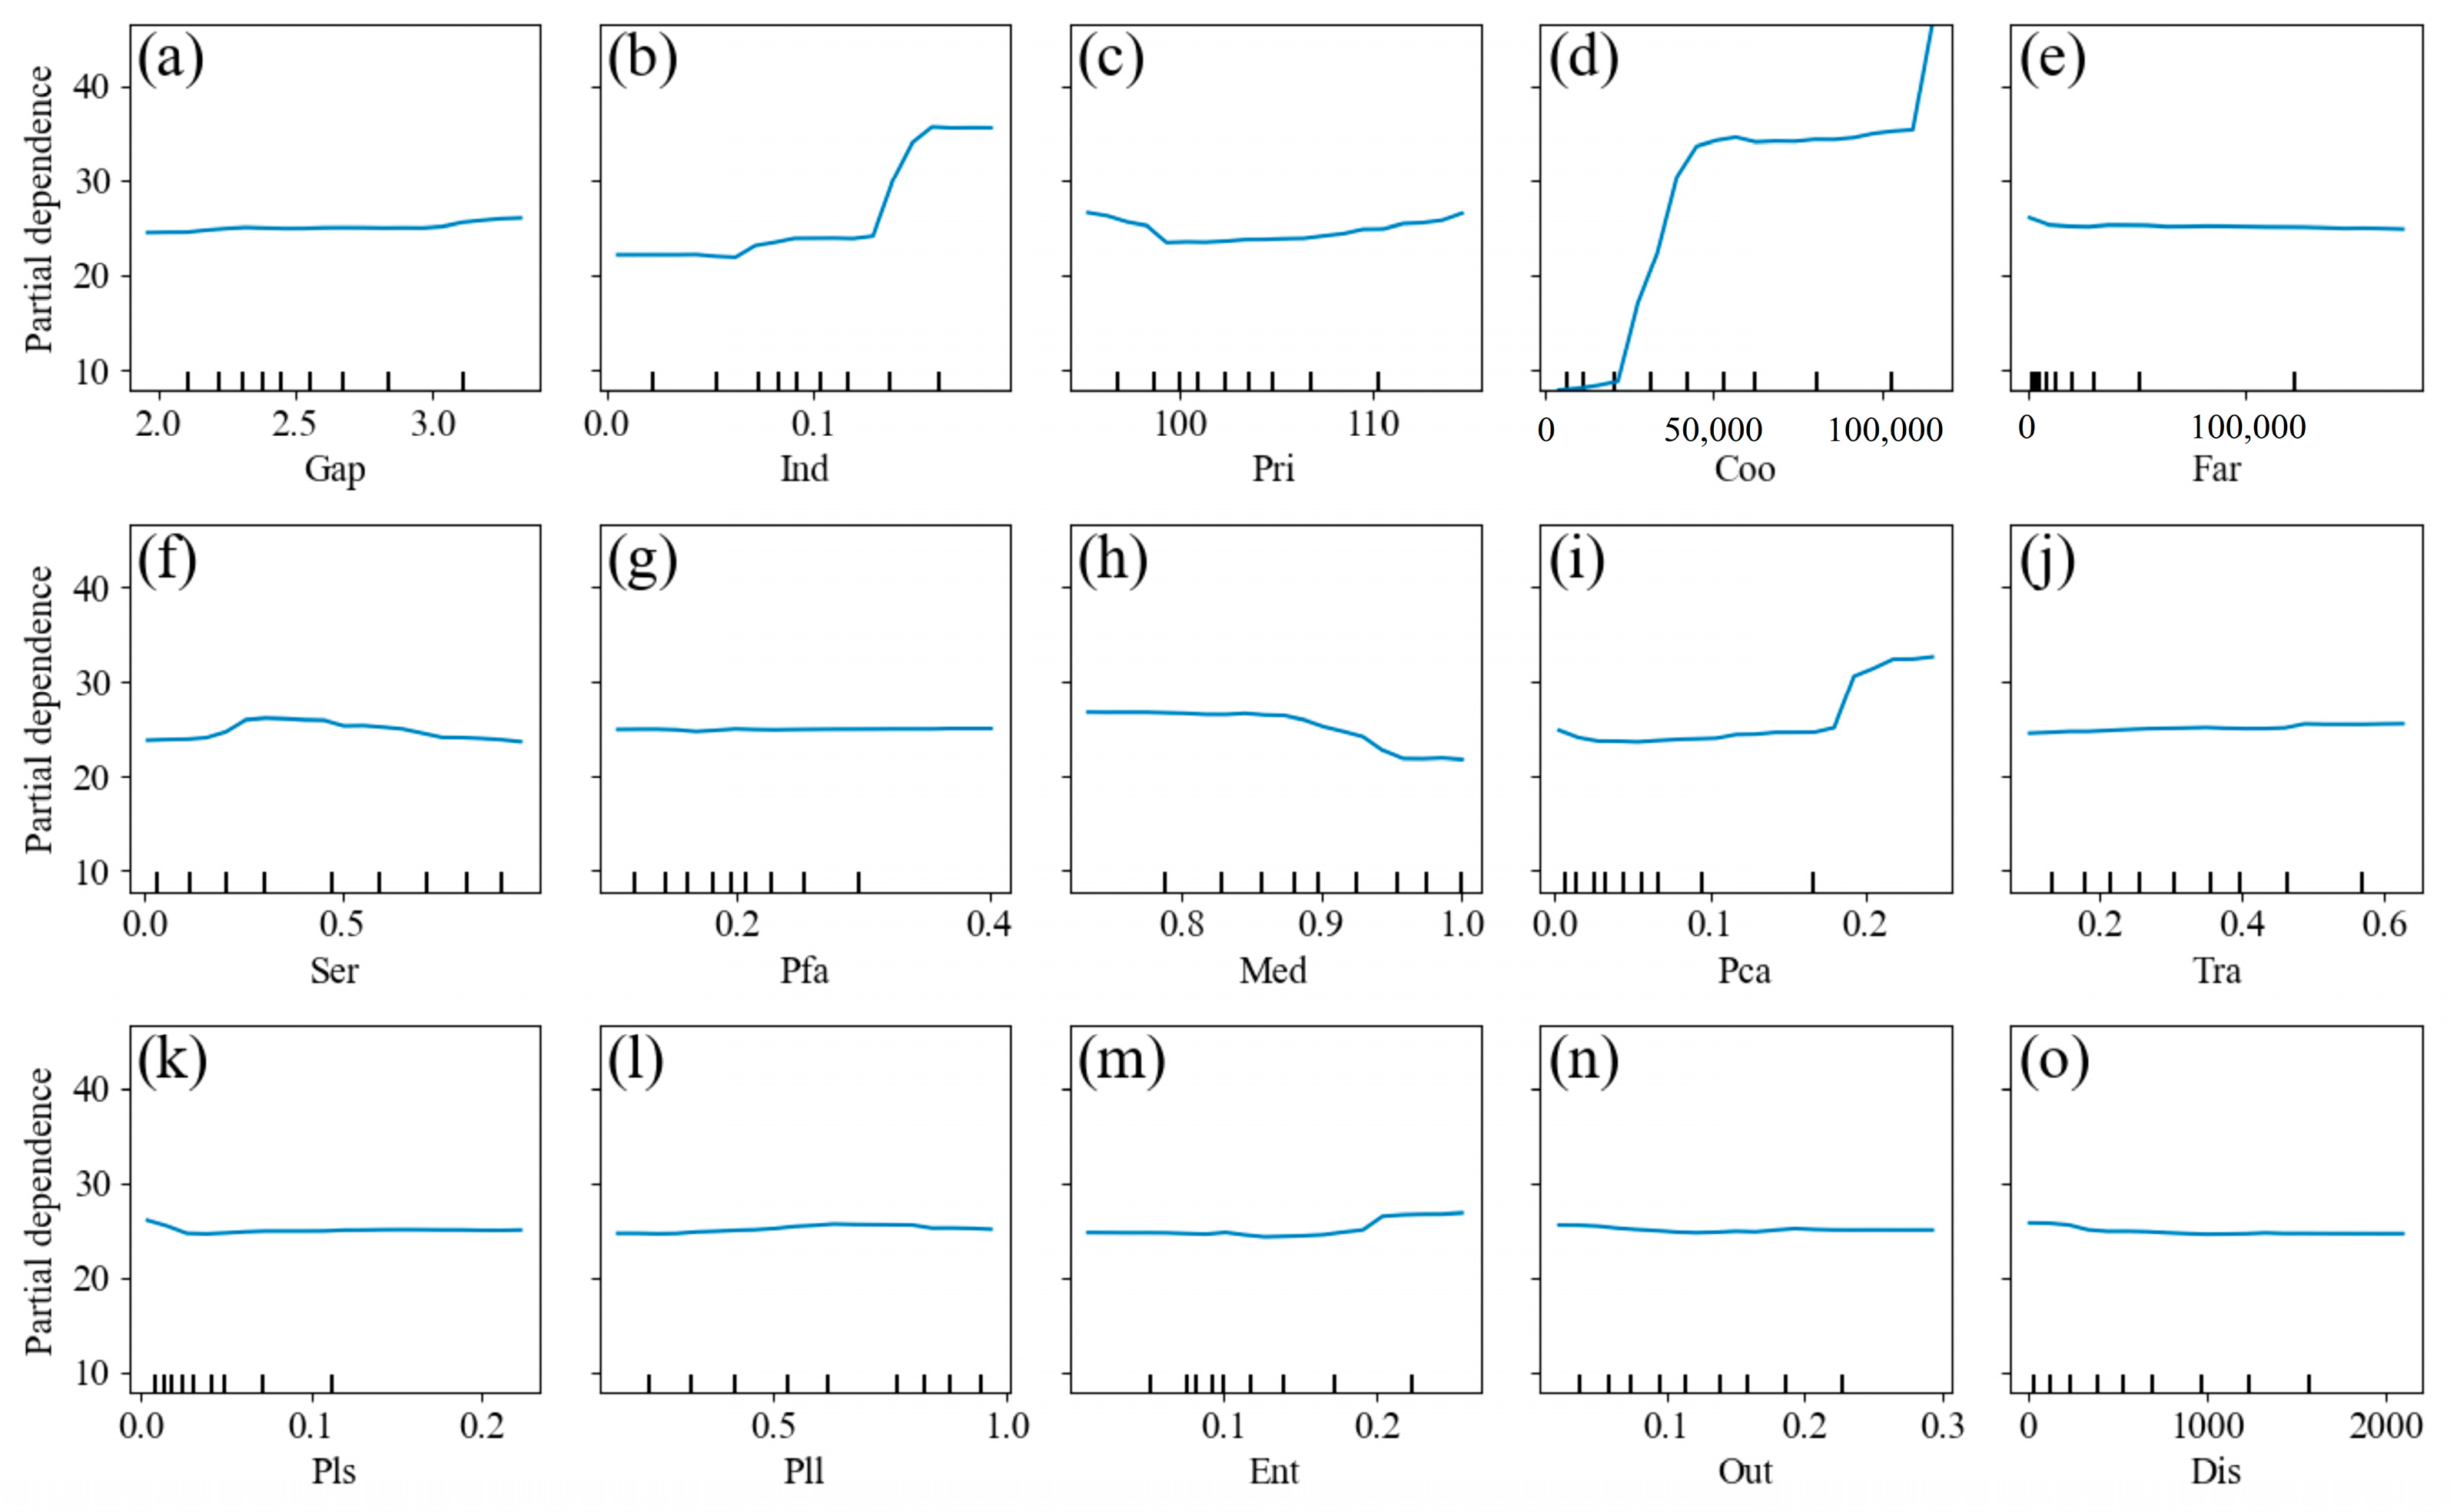
PDPs can reflect the marginal effect of individual variables on model predictions by systematically varying their values while holding other variables constant. To clarify the specific impacts of individual factors on LDI, this study generates PDPs for 15 optimal independent variables based on the GBDT regression results. Figure 6 shows that Ind, Pri, Coo, Ser, Med, and Cid have significant nonlinear effects on LDI.
In Figure 6b, the curve is relatively stable when Ind < 0.12, and a significant increase in LDI can be observed when it is above 0.12. One possible explanation is that the Ind (share of primary industry) is highly dependent on land resource, and any policy adjustments and changes in ownership can easily trigger conflicts of interest [56]. It can be seen from Figure 6c that when Pri > 100, LDI increases slowly as it rises. The rise in Pri (agricultural product price index) will increase the economic value of land and the expected returns of producers, leading to intensified competition for resources and interests. However, the stable curve indicates that this impact does not seem to be significant. Figure 6d shows that increases in Coo (number of specialized farmers’ cooperatives) consistently drive up LDI, which confirms the variable importance ranking presented in Figure 5. LDI is less sensitive to Coo only when 50,000 < Coo <100,000. On the one hand, as Coo increases, disputes over the distribution of benefits within organization gradually rise [40,59]. On the other hand, specialized cooperatives play the role of spokesmen for farmers’ interests. When conflicts become unavoidable, farmers are more likely to pursue cooperative-based collective litigation than to file individual lawsuits.
In Figure 6f, as Ser (coverage of land transfer service centers) increases from 0.0 to 0.3, LDI rises. However, when Ser > 0.3, LDI gradually declines as Ser continues to increase. In the early stages of establishing land transfer centers, imperfect mechanisms and unresolved historical issues may trigger land disputes. As policy frameworks improve over time, these centers—offering more comprehensive land management and services—help mitigate LDI to some extent [8,35]. Figure 6h shows that LDI decreases as Med (mediation rate of non-litigation disputes) increases, with the downward trend becoming particularly evident when Med exceeds 0.9. While many studies have highlighted the role of mediation in alternative dispute resolution (ADR) [24,60], our research provides empirical evidence. Figure 6i reveals that when Cid (proportion of collective income distributed to farmers) is below 0.18, its effect on LDI is minimal. However, once it surpasses this threshold, LDI increases significantly. This may suggest that internal inequities in benefit distribution, as well as external encroachment on collective interests, become more pronounced under higher Cid [49].

3.4. Interaction Effect

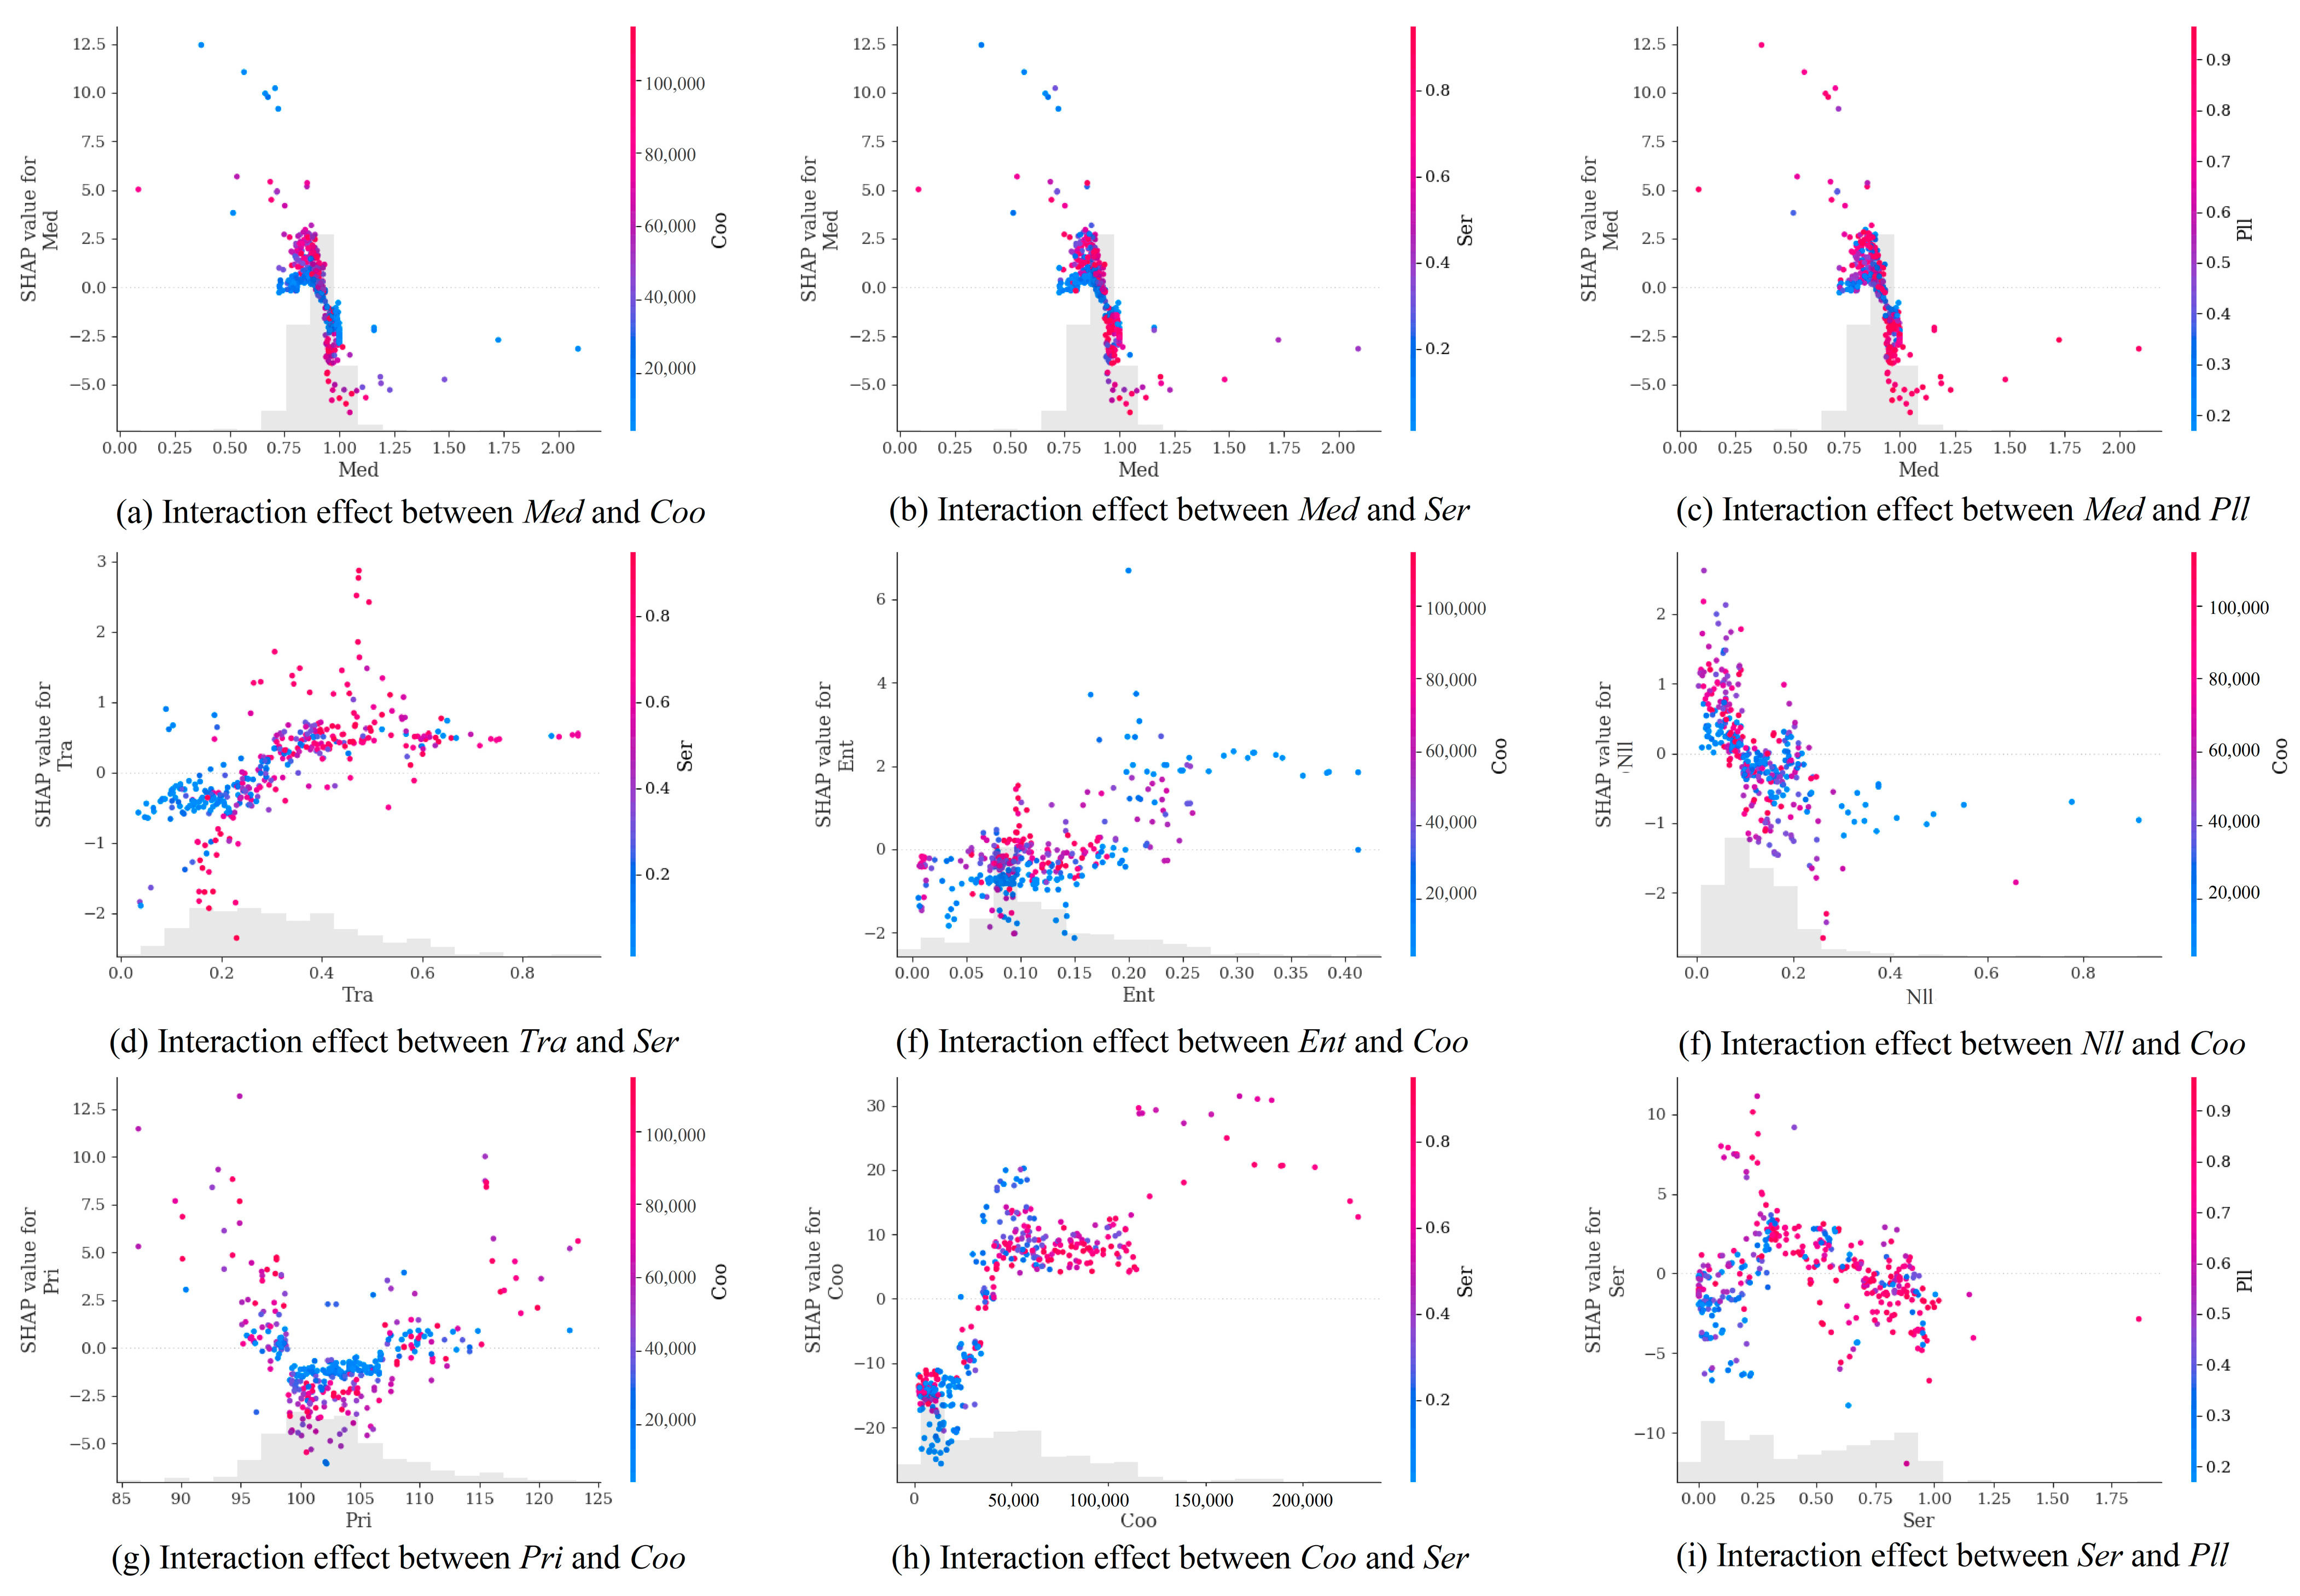
This study analyzed pairwise interactions among the 15 selected variables to examine their effects on LDI. Given the significance of interaction effects, SHAP dependence plots for several key variables were further explored (Figure 7). In Figure 7, the horizontal axis represents the range of the main variable, while the left y-axis shows its corresponding SHAP value. As previously explained, a positive SHAP value (>0) indicates an increase in LDI, while a negative value (<0) suggests a reduction in LDI. The variable shown on the right y-axis is the interacting variable. Red dots indicate higher values of the interacting variable, while blue dots represent lower values. The scatter pattern illustrates how changes in the interacting variable influence the SHAP value of the main variable.
Figure 7a–c present the effects of Med (mediation rate of non-litigation disputes) on LDI with Coo (number of specialized farmers’ cooperatives), Ser (coverage of land transfer service centers), and Pll (proportion of land leasing) as interaction variables, respectively. When Med is below 0.9, it tends to raise LDI, and this effect becomes more pronounced as Coo, Ser, and Pll increase. These variables are often associated with more intricate land governance structures, which in turn give rise to complex legal disputes over land ownership and benefit distribution [61]. In contrast, once Med surpasses 0.9, it begins to reduce LDI, and this effect strengthens as the values of the interacting variables rise. This suggests that well-established mediation systems and formal land transfer are effective tools for alleviating land dispute intensity. On the one hand, mediation, as a low-cost and efficient method of dispute resolution, can resolve land disputes much more quickly than litigation. On the other hand, regulated and institutionalized land transfer help clarify land ownership and usage, thereby reducing the likelihood of land-related conflicts.
In Figure 7d, when Tra (ratio of cultivated land transfer) < 0.3, it contributes to a decline in LDI, and higher Ser reinforces this effect. This implies that under conditions of stable land tenure, formal transfer can play a vital role in preventing disputes. Figure 7e demonstrates an interesting threshold effect. When Ent (proportion of land transferred to enterprises) < 0.2, increasing Coo gradually offsets Ent’s mitigating effect on LDI and, in some cases, even reverses it into an amplifying effect. From a policy implementation perspective, this emphasizes the importance of balancing the distribution of interests between farmers’ cooperatives and enterprises [49]. As shown in Figure 7f, when Nll (proportion of land leased to non-locals) < 0.1, rising Coo intensifies LDI. However, within the range of 0.1 < Nll < 0.2, an increase in Coo tends to weaken LDI. This pattern may reflect the reality that as commercial capital flows into rural China, the competition of land value may trigger conflicts. Over the past decade, capital from cities and enterprises has entered rural areas through land transfers, leases, and partnerships to operate agricultural businesses. However, the competition for interests between enterprises and farmers has become increasingly intense. Hence, promoting the development of specialized farmers’ cooperatives is essential for safeguarding farmers’ land rights and minimizing land-related disputes [62].
Similarly, significant interaction effects of other variables can be observed in Figure 4g–i. When 95 < Pri (agricultural product price index) < 110, the increase in Coo further decreases LDI. Cooperatives help maintain stability in agricultural production and promote land consolidation, thereby preventing unnecessary conflicts. When Coo ranges between 30,000 and 70,000, an increase in Ser weakens the mitigating effect of Coo by regulating the land market and providing dispute mediation mechanisms. However, when Ser < 0.3, an increase in Pll can reverse the effect of Ser on LDI from negative (decrease LDI) to positive (increase LDI). This confirms concerns that land leasing may trigger disputes [50].

3.5. Robustness Test

3.5.1. Model Performance

While the preceding discussion has justified the selection of the GBDT model, a comparative performance evaluation remains methodologically necessary. In this section, the performance of the GBDT is compared with that of traditional linear regression, decision trees, random forests, and the XGBoost model. Based on previous studies [42,58], four metrics —the coefficient of determination (R2), mean absolute error (MAE), mean squared error (MSE), and root mean squared error (RMSE)—were selected to evaluate the performance of different models. R2 measures the fitting between predicted and actual values, with higher values indicating better model performance. For MAE, MSE, and RMSE, smaller values correspond to superior predictive performance. Table 3 reported the performance of different models in the test set.
It can be seen that the GBDT model has the highest R2 (0.615), the lowest MSE (297.798), and the lowest RMSE (17.257), indicating that the model has the optimal performance in terms of interpretability and prediction accuracy. The MAE of XGBoost model is the lowest (11.987), indicating that its prediction has the best robustness. Given that this study focuses more on exploring the driving factors of land dispute intensity rather than making predictions, the GBDT model used in this paper is reasonable. It is worth noting that the R2 of all machine learning models is higher than that of the linear regression model (0.424). This is because correlations between variables and LDI are complex and diverse. Linear regression models are insufficient to explain the nonlinear influence of variables on LDI.

3.5.2. Variable Importance Test

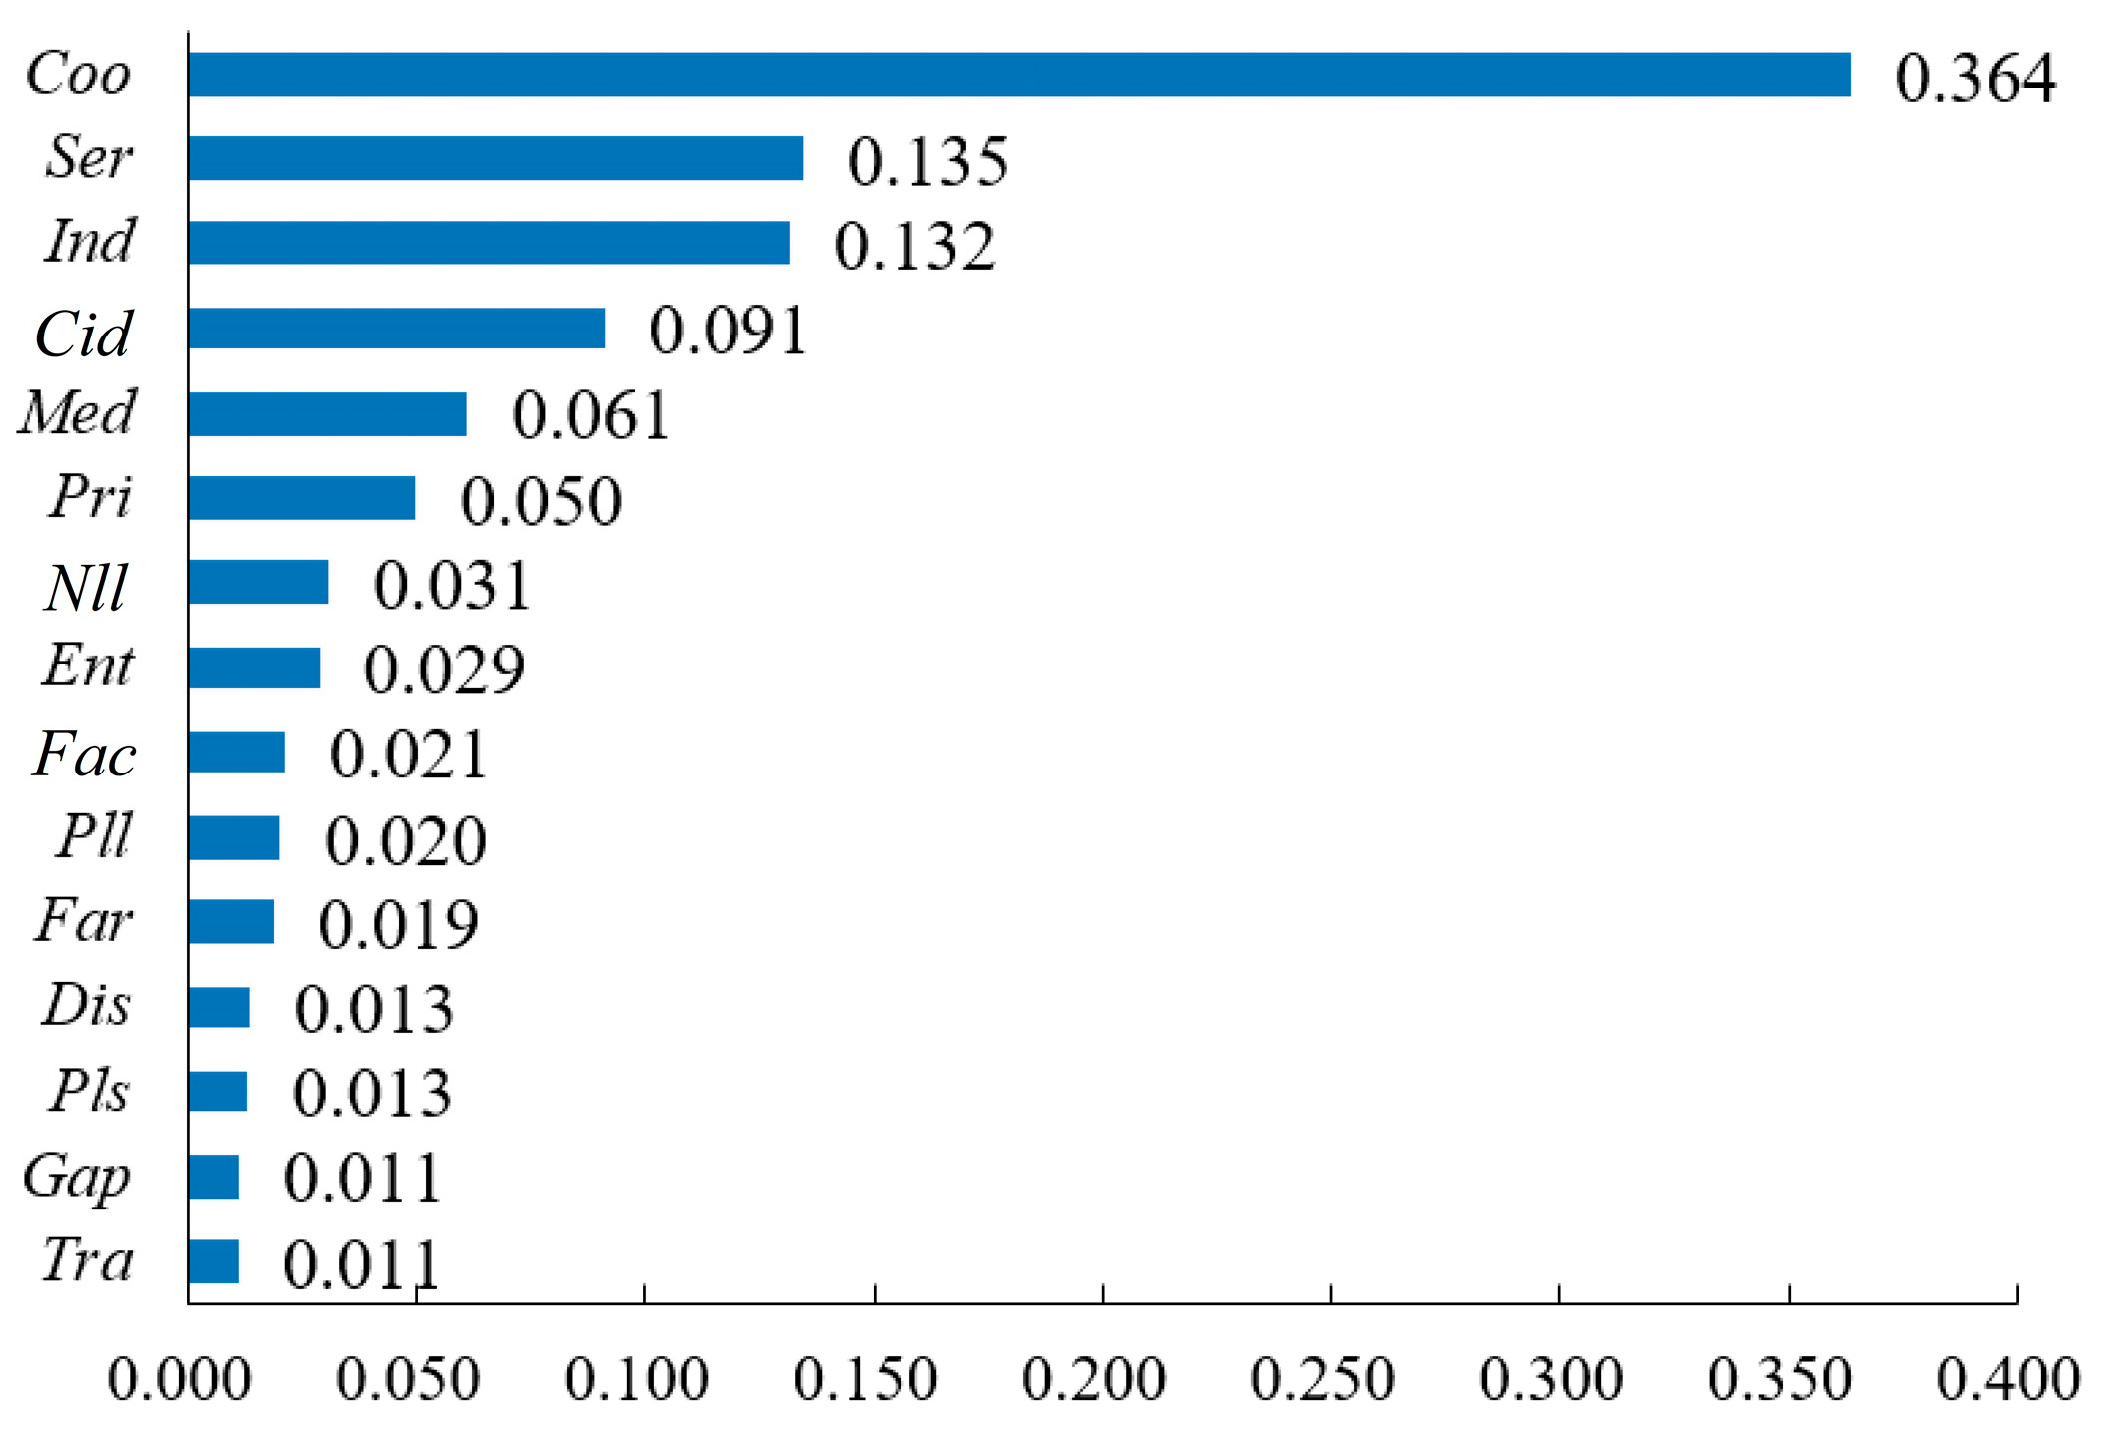
This paper adopts SHAP values to measure the impact of different variables on LDI. However, for many studies [63,64], it seems more common to rank the weights of independent variables based on machine learning algorithms. This study employed this method to validate the SHAP model’s analytical results. As shown in Figure 8, although the weight rankings did not perfectly align with the SHAP value rankings, the six most influential variables—Coo, Ser, Ind, Cid, Med, and Pri—remain consistently ranked in the top six, which indicates that the findings of this study are convincing and robust.

4. Discussion

This study assessed the land dispute intensity (LDI) in mainland China and employed a GBDT model and interpretable methods to explore its influencing factors.
The results show that LDI across 30 provinces generally and continuously increased after 2014, with this trend being notably curbed after 2019. Compared with previous studies [17], although differences exist in the assessment methods, findings about this trend are consistent. In terms of spatial distribution, earlier research pointed out the severity of land disputes in Southwest China [7,8]. The evaluation further indicates that Yunnan and Guangxi have experienced prolonged periods of “high” or “very high” LDI. Consistent with the investigation report by Xia et al. [10], northwestern China appears to exhibit less intense LDI.
As mentioned in the literature review, a previous study identified institutional reforms, social transformations, and authority structures as the macro-level background of land disputes [32,41], while ambiguous land tenure, unfair benefit distribution, and limited farmer awareness are regarded as micro-level driving factors [50,65]. However, this study gained unique insights by leveraging SHapley Additive exPlanations (SHAP). Through calculating the SHAP values of the independent variables, it can be found that specialized farmers’ cooperatives (Coo) had the most significant impact on LDI, while the share of primary industry (Ind) and the coverage of land transfer service centers (Ser) also showed strong effects. These findings confirm previous theoretical analyses and provide empirical support for them [59]. In addition, some variables previously believed to be closely associated with land disputes—such as land transfer [38] and enterprise operation [34]—did not show clear evidence in this study.
Although some scholars expressed concerns about internal disputes within farmers’ cooperatives [5,39], this study is the first to use partial dependence plots (PDPs) to identify the strong increasing effect of the establishment of cooperatives (Coo) on LDI. Land serves as the foundation of the primary industry (Ind), which means that any structural adjustment or industrial upgrading may trigger conflicts of interest [66]. Regarding the proportion of collective income distributed to farmers (Cid), mismatches between demographic changes and land income distribution are amplified at higher values, making internal disputes more likely [31]. Based on the outputs of the GBDT model and PDPs, it is confirmed that both Ind and Cid have significant nonlinear effects on LDI. Although it is widely understood that establishing township land transfer service centers (Ser) is intended to reduce potential disputes through formal registration [50], there has long been a lack of empirical research to support this claim. The findings of this study fill this gap. Since the late 20th century, the implementation of alternative dispute resolution (ADR) mechanisms in land-related conflicts has drawn increasing attention. Micro-level studies have shown that ADR plays an important role in resolving land disputes in sub-Saharan Africa [24,60]. This study, from a macro-level perspective, further highlights that the mediation rate of non-litigation disputes (Med), as an effective tool for stakeholders to reach agreements [67], can significantly reduce land dispute litigation. Using PDPs, this mitigating effect is visually and quantitatively illustrated.
The driving factors of land disputes are highly complex, yet the interactions between variables have long been overlooked. This study uses SHAP dependence plots to explore potential interaction effects. The increases in Coo, Ser, and Pll (proportion of land leasing) raise the SHAP value of Med (when Med < 0.9), suggesting that Med has a stronger amplifying effect on LDI under these conditions. One possible explanation is that increases in these variables may expose the limitations of mediation mechanisms due to complex interest distribution and frequent property rights transactions [61]. The interaction between the ratio of cultivated land transfer (Tra) and Ser indicates that under relatively stable land tenure arrangements, formal land transfers can effectively reduce disputes, which supports previous findings [47,50]. China is currently promoting the inflow of social capital into rural areas. Unlike the concept proposed by Robert Putnam [68], social capital in this research context specifically refers to private enterprises, commercial capital, and financial capital entering rural areas through market-based mechanisms. Over the past decade, these forms of capital have entered rural regions through land transfers, leasing, and partnerships to operate agricultural businesses. During this process, the collusion between capital and local power, as well as the weak connection between enterprises and farmers, has raised concerns about land disputes [6]. This study reports the interaction effects of the proportion of land transferred to enterprises (Ent), proportion of land leased to non-locals (Nll), and Coo on LDI. When Ent < 0.2, an increase in Coo reduces the SHAP value of Ent, implying that balancing the number of cooperatives and the scale of enterprises can help mitigate land disputes [49]. When 0.1 < Nll < 0.2, a rise in Coo further lowers LDI, suggesting that the establishment and growth of farmers’ cooperatives can protect farmers’ interests in the face of external capital competition [62]. In addition, the interaction effects between Pri and Coo as well as Ser and Pll were also observed. The interaction analysis based on SHAP dependence plots offers novel insights into the underlying logic of land disputes.
Based on above discussions, this paper proposed several policy recommendations to properly prevent and resolve land disputes: (1) Internal conflicts of interest within specialized farmers’ cooperatives should receive more attention from local governments. Authorities should provide guidance and support to ensure that all stakeholders can share the benefits of land value increases [69]. In practice, a flexible benefit-sharing mechanism can be introduced, along with third-party evaluation and auditing to improve transparency and oversight. Transparent procedures should be implemented for collective land development, with considerations given to employment opportunities, monetary compensation, and equity dividends based on practical circumstances. (2) A well-developed land transfer market, combined with strong government supervision, can help reduce the risk of land disputes [8]. In sub-Saharan Africa, for example, land transactions often go unregistered under customary land systems [66]. Confusion over land rights has caused many disputes, so formal registration is essential. In China, most towns have already established local land transfer centers. Local governments can allocate special funds to support the building of trading platforms and information systems. Both physical trading halls and online platforms are necessary, especially in underdeveloped rural areas. (3) Alternative dispute resolution (ADR), including mediation and negotiation, should be developed alongside legal systems and court practices. As mentioned earlier, although formal institutions are important, informal mechanisms still play a major role in many parts of the Global South [60]. Given that factors like education and policy awareness can affect people’s preferences, it is important to strike a balance between ADR and formal institutions. In China, local governments can also build remote mediation systems based on existing platforms to reduce governance costs. (4) The agricultural sector should help connect farmers, companies, and external investors through shared interests. Contract farming can be promoted, and crop prices can be adjusted based on market conditions. By extending the agricultural value chain and offering farm management services, governments can support more diverse benefit-sharing models. Risk control and regulation are also critical. In Africa and Brazil, large-scale land grabbing is still a serious problem. Therefore, it is important to ensure that all parties’ rights and interests are protected by law. Overall, when dealing with land disputes, governments should adopt a comprehensive approach that considers the nature of disputes, local social and economic conditions, and governance systems. A flexible mix of policy tools can help address land conflicts more effectively.
This study fills a gap in the application of machine learning to the analysis of land disputes. The proposed general framework—integrating LDI assessment, driver identification, nonlinear impact analysis, and interaction mechanisms—can be applied to evaluate and analyze land disputes or conflicts in any region. By using litigation and statistical data to assess LDI, local authorities can overcome data scarcity and gain a macro-level understanding of dispute patterns and underlying drivers. The findings of this research provide clear and quantitative evidence for clarifying the socio-economic driving forces behind land disputes in China. The policy implications proposed in this paper may serve as a valuable reference for land governance in countries across the Global South. However, it is important to acknowledge that the construction of independent variables may have omitted key indicators, which could introduce bias into the trained machine learning models and affect the validity of subsequent analyses. This paper mainly focused on socio-economic variables, while indicators of natural endowment dimensions (such as altitude, topography, soil, and climate) were not taken into account, although they were also very important. In addition, the measurement of the dependent variable has certain limitations, as it does not account for the subject matter of the land disputes or the duration of litigation. These limitations need to be properly addressed in future research.

5. Conclusions

This study evaluates the land dispute intensity (LDI) across 30 provincial regions in mainland China from 2011 to 2022 and explores its driving factors through the GBDT model and interpretable machine learning methods. First, 15 optimal factors of LDI were identified using correlation analysis and the SVM-RFE algorithm. Second, the spatiotemporal evolution of LDI was presented and analyzed. Then, based on GBDT model’s output, the study employed SHAP, PDPs, and SHAP dependence plots to explore the importance of key variables, their nonlinear effects on LDI, and their interaction mechanisms. The main findings are as follows:
LDI in mainland China experienced a general increase in 2014, and this upward trend continued until 2018. During this period, southern provinces such as Guangxi, Yunnan, and Guizhou experienced a long-term “high” LDI. In the north, provinces like Jilin, Henan, and Hebei also showed concerning LDI, while the northwestern region consistently maintained relatively “low” LDI levels. The spatial distribution and its evolution further indicate that, starting from 2019, LDI began to decline in most provinces, suggesting a reduction in land dispute pressure across mainland China.
In terms of the driving factors of LDI, Coo plays the most critical role in driving LDI (mean |SHAP value| = 0.4). Variables such as Ind, Ser, Pri, Med, and Cid exert a stronger influence on LDI, whereas Dis, Nll, Tra, Fac, and Pls appear to have relatively weaker effects.
Considering nonlinear effects, Coo has the most pronounced impact on land disputes. As Coo increases, LDI rises substantially, except within the range of 50,000 to 100,000 where this effect becomes less pronounced. The effects of Ind and Cid on LDI follow a similar pattern: once their values exceed critical thresholds of 0.12 and 0.18, respectively, LDI increases significantly. The reducing influence of Med on LDI becomes more evident when its value surpasses 0.9. Additionally, clear nonlinear relationships between Pri, Ser, and LDI can be easily observed.
In terms of interaction effects, when Med is below 0.9, increases in Coo, Ser, and Pll further amplify LDI. When Tra is less than 0.3, a rise in Ser further strengthens the decreasing effect on LDI. If Nll is below 0.1, an increase in Coo intensifies LDI; when Nll ranges between 0.1 and 0.2, increasing Coo also enhances the reducing effect on land disputes. When Ent is under 0.2, an increase in Coo tends to weaken Ent’s effect on land disputes. Moreover, complex interactions exist between Nll, Coo, and Pri.
Compared to previous research, this study acquired some new insights into the driving factors of land disputes. Considering the limitations of this study’s design, future research should (1) integrate indicators of population pressure and urban expansion using geographic information system (GIS) tools, and incorporate natural geographical factors into the set of variables; (2) develop a more comprehensive and reasonable indicator of dispute intensity, and attempt to explore the impact of sociopolitical variables—such as perceptions of institutional legitimacy and levels of community participation—on land disputes and preferences for their resolution, from a micro-level, resident-centered perspective; and (3) apply spatiotemporal models or machine learning techniques, such as geographically weighted regression (GWR) and geographically weighted neural networks (GWNN), to capture the spatial heterogeneity of land disputes.

Author Contributions

Conceptualization, B.T. and J.L.; methodology, B.T. and J.Z.; writing—original draft preparation, B.T.; writing—review and editing, J.L. and S.Z.; supervision, S.T.; funding acquisition, S.T. All authors have read and agreed to the published version of the manuscript.

Funding

This research was funded by the National Social Science Fund of China (Grant Number 20BZZ099).

Data Availability Statement

The original contributions presented in the study are included in the article: further inquiries can be directed at the corresponding author.

Conflicts of Interest

The authors declare no conflicts of interest.

References

  1. Rahman, A.; Hossain, R. The uncomfortable truth about land disputes in Bangladesh: Insights from a household survey. Land Use Policy 2020, 95, 104557. [Google Scholar] [CrossRef]
  2. Winters, M.S.; Conroy, K.J. Preferences for traditional and formal sector justice institutions to address land disputes in rural Mali. World Dev. 2021, 142, 105452. [Google Scholar] [CrossRef]
  3. Goodale, M.G.; Sky, P.K. A comparative study of land tenure, property boundaries, and dispute resolution: Case studies from Bolivia and Norway. J. Rural. Stud. 2001, 17, 183–200. [Google Scholar] [CrossRef]
  4. Foweraker, J. The Struggle for Land: A Political Economy of the Pioneer Frontier in Brazil from 1930 to the Present Day; Cambridge University Press: Cambridge, UK, 2002. [Google Scholar]
  5. Greiner, C.; Greven, D.; Klagge, B. Roads to change: Livelihoods, land disputes, and anticipation of future developments in rural Kenya. Eur. J. Dev. Res. 2021, 33, 1044–1068. [Google Scholar] [CrossRef]
  6. Nguyen, T.H.T.; Tran, V.T.; Bui, Q.T.; Man, Q.H.; de Vries Walter, T. Socio-economic effects of agricultural land conversion for urban development: Case study of Hanoi, Vietnam. Land Use Policy 2016, 54, 583–592. [Google Scholar] [CrossRef]
  7. Zhang, M.; Tan, S.; Chen, E.; Li, J. Spatio-temporal characteristics and influencing factors of land disputes in China: Do socio-economic factors matter? Ecol. Indic. 2024, 160, 111938. [Google Scholar] [CrossRef]
  8. Tan, S.; Tong, B.; Zhang, J. How did the land contract disputes evolve? Evidence from the Yangtze River Economic Belt, China. Land 2023, 12, 1334. [Google Scholar] [CrossRef]
  9. You, H.; Zhang, J.; Song, Y. Assessing conflict of farmland institutions using credibility theory: Implications for socially acceptable land use. Land Use Policy 2022, 112, 105817. [Google Scholar] [CrossRef]
  10. Xia, Y.; Zhang, R.; Qu, S. Countermeasures of rural land contract management dispute resolution based on large sample survey. Acad. J. Zhongzhou 2018, 3, 38–44. [Google Scholar]
  11. Li, L.; Gao, H.; Song, B.; Cui, C. How to use evidence rules reasonably to resolve land disputes: Analysis of typical land dispute cases from China. Land 2024, 13, 1187. [Google Scholar] [CrossRef]
  12. Caspari, V. The economy of ancient Greece and the beginning of economic thought. In A History of Economics; Springer Studies in the History of Economic Though; Springer: Berlin/Heidelberg, Germany, 2024. [Google Scholar]
  13. Bai, C. Social foundations and prospective administration of rural land disputes. China Land Sci. 2007, 6, 35–40. [Google Scholar]
  14. Deininger, K.; Castagnini, R. Incidence and impact of land conflict in Uganda. J. Econ. Behav. Organ. 2006, 60, 321–345. [Google Scholar] [CrossRef]
  15. Hashem, D.; Somayeh, A. Land tenure-related conflicts in peri-urban areas: A review. Land Use Policy 2019, 85, 218–229. [Google Scholar]
  16. Xu, K.; Su, J.; Bao, H.; Dang, Y.; Xu, W. Risk characteristics, transmission pathways and regulatory strategies in the secondary land market: Based on content analysis of 2045 land disputes court cases. China Land Sci. 2024, 38, 50–60. [Google Scholar]
  17. Tan, S.; Zou, S. Study on the evolution characteristics and influencing factors of land disputes in the Yangtze River Economic Belt. China Land Sci. 2022, 36, 22–31. [Google Scholar]
  18. Iswantoro, I. Strategy and management of dispute resolution, land conflicts at the land office of Sleman Regency. J. Hum. Rights Cult. Leg. Syst. 2021, 1, 1–18. [Google Scholar] [CrossRef]
  19. Morán Uriel, J.; Camerin, F.; Córdoba Hernández, R. Urban horizons in China: Challenges and opportunities for community intervention in a country marked by the Heihe-Tengchong Line. In Diversity as Catalyst: Economic Growth and Urban Resilience in Global Cityscapes; Siew, G., Allam, Z., Cheshmehzangi, A., Eds.; Urban Sustainability; Springer: Singapore, 2024. [Google Scholar]
  20. Simmons, C.S. The political economy of land conflict in the Eastern Brazilian Amazon. Ann. Assoc. Am. Geogr. 2004, 94, 183–206. [Google Scholar] [CrossRef]
  21. Mccarthy, J.F.; Dhiaulhaq, A.; Afiff, S.; Robinson, K. Land reform rationalities and their governance effects in Indonesia: Provoking land politics or addressing adverse formalization? Geoforum 2022, 132, 92–102. [Google Scholar] [CrossRef]
  22. Dietz, K.; Engels, B. Analyzing land conflicts in times of global crises. Geoforum 2020, 111, 208–217. [Google Scholar] [CrossRef]
  23. Ullah, I.; Hussain, S. Impact of early access to land record information through digitization: Evidence from Alternate Dispute Resolution Data in Punjab, Pakistan. Land Use Policy 2023, 134, 106917. [Google Scholar] [CrossRef]
  24. Ibrahim, A.S.; Abubakari, M.; Akanbang, B.A.; Kepe, T. Resolving land conflicts through Alternative Dispute Resolution: Exploring the motivations and challenges in Ghana. Land Use Policy 2022, 120, 106272. [Google Scholar] [CrossRef]
  25. Asaaga, F.A. Building on “Traditional” land dispute resolution mechanisms in rural Ghana: Adaptive or anachronistic? Land 2021, 10, 143. [Google Scholar] [CrossRef]
  26. Obala, L.M.; Mattingly, M. Ethnicity, corruption and violence in urban land conflict in Kenya. Urban Stud. 2014, 51, 2735–2751. [Google Scholar] [CrossRef]
  27. He, X. Analysis of potential risks of industrial and commercial capital flowing into rural areas. Discov. Chin. Rural. Areas 2014, 3, 125–131. [Google Scholar]
  28. Chu, Y. China’s new urbanization plan: Progress and structural constraints. Cities 2020, 103, 102736. [Google Scholar] [CrossRef]
  29. Hu, Y.; Zhou, K.; Lei, Y. Study on land disputes resolving and risk warning mechanism construction in the process of urbanization: From the perspective of Social Burning Theory. Res. Agric. Mod. 2015, 36, 68–972. [Google Scholar]
  30. Lin, Q.; Tan, S.; Zhang, L.; Wang, S. Conflicts of land expropriation in China during 2006–2016: An overview and its spatio-temporal characteristics. Land Use Policy 2018, 76, 246–251. [Google Scholar] [CrossRef]
  31. Chen, Y.; Ni, X. Study on distribution disputes of land expropriation compensation for contracted land within collective communities: Based on 1091 cases of disputes and court verdicts in Hunan province. China Land Sci. 2021, 35, 43–51. [Google Scholar]
  32. Whiting, S. Values in land: Fiscal pressures, land disputes and justice claims in rural and peri-urban China. Urban Stud. 2011, 48, 569–587. [Google Scholar] [CrossRef]
  33. Huang, Z. Disembeddedness and re-embeddedness: Agricultural operation and governance in village order. China Rural. Surv. 2018, 3, 51–64. [Google Scholar]
  34. Xu, Z. The social context of capital going to the countryside: A case study of agriculture enterprise in northern China. Sociol. Stud. 2016, 31, 63–87. [Google Scholar]
  35. Xu, X.; Zhang, L.; Liu, X. Disputes over farmland transfer: Breach of contract mechanism and its empirical study. J. China Agric. Univ. 2020, 25, 216–230. [Google Scholar]
  36. Qu, S.; Guo, J.; Xia, Y. Did rural land rights confirmation and land adjustment resolve land disputes?—Evidence from micro-level data. J. Northwest AF Univ. 2018, 18, 71–78. [Google Scholar]
  37. Zhou, M.; Lei, G.; Li, J. Capital inflow in village, property evolution and farmland transfer conflict. China Land Sci. 2015, 29, 55–62. [Google Scholar]
  38. Chen, R.; Chen, P. Farmer land rights security mechanism building in the agriculture modernization process survey on agriculture-related enterprise participate in farmland transfer in L city in the middle of Henan. J. Huazhong Agric. Univ. 2013, 5, 55–60. [Google Scholar]
  39. Nkobou, A.T.; Ainslie, A.; Lemke, S. Broken promises: A rights-based analysis of marginalized livelihoods and experiences of food insecurity in large-scale land investments in Tanzania. Food Secur. 2022, 14, 185–205. [Google Scholar] [CrossRef]
  40. Chen, Y.; Jin, X. How do farmers realize their rights on the collective land in rural China? An explanatory framework for deconstructing the subject of collective land ownership. Land 2023, 12, 1746. [Google Scholar] [CrossRef]
  41. Lombard, M.; Rakodi, C. Urban land conflict in the Global South: Towards an analytical framework. Urban Stud. 2016, 53, 2683–2699. [Google Scholar] [CrossRef]
  42. Gao, R.; Cai, H.; Xu, X. Analysis of Driving Factors of Cropland Productivity in Northeast China Using OPGD-SHAP Framework. Land 2025, 14, 1010. [Google Scholar] [CrossRef]
  43. Zhao, J.; Jia, B.; Wu, J.; Wu, X. Study of spatial and temporal characteristics and influencing factors of net carbon emissions in Hubei province based on interpretable machine learning. Land 2025, 14, 1255. [Google Scholar] [CrossRef]
  44. Ding, C. Policy and praxis of land acquisition in China. Land Use Policy 2007, 24, 1–13. [Google Scholar] [CrossRef]
  45. Cao, D.; Wang, Y.; Zang, L. Land reallocation and collective action in the commons: Application of social-ecological system framework with evidence from rural China. Land Use Policy 2024, 144, 107267. [Google Scholar] [CrossRef]
  46. Wang, Y. The impact of farmland transfer direction on land disputes: A rural panel data analysis based on 30 Chinese provinces. Ind. Innov. 2020, 16, 9–13. [Google Scholar]
  47. Ma, X.; Qiu, T.; Qian, Z. Farmland tenure security and farmers’ participation in the farmland transfer market: An empirical analysis based on survey data from four provinces. Chin. Rural. Econ. 2015, 2, 22–37. [Google Scholar]
  48. Krul, K.; Peter, H.; Yang, X. Land titling as a conflict remedy or driver? Analyzing institutional outcomes through latent and manifest conflicts in China’s forest sector. Land Use Policy 2021, 100, 104880. [Google Scholar] [CrossRef]
  49. Li, Y.; Lv, M. Study on the construction of farmers’ sustainable livelihood model in the process of capital to the countryside. J. Huazhong Agric. Univ. 2019, 2, 63–70. [Google Scholar]
  50. Wan, J.; Liu, Y.; Zhang, X. Conflict in informal rural construction land transfer practices in China: A case of Hubei. Land Use Policy 2021, 109, 105573. [Google Scholar] [CrossRef]
  51. Sanz, H.; Valim, C.; Vegas, E.; Oller, J.M.; Reverter, F. SVM-RFE: Selection and visualization of the most relevant features through non-linear kernels. BMC Bioinform. 2018, 19, 432. [Google Scholar] [CrossRef] [PubMed]
  52. Lundberg, S.M.; Lee, S. A unified approach to interpreting model predictions. In Proceedings of the 31st International Conference on Neural Information Processing Systems, Long Beach, CA, USA, 4–9 December 2017. [Google Scholar]
  53. Sagi, O.; Rokach, L. Ensemble learning: A survey. Wiley Interdiscip. Rev. Data Min. Knowl. Discov. 2018, 8, e1249. [Google Scholar] [CrossRef]
  54. Lalchand, V. Extracting more from boosted decision trees: A high energy physics case study. arXiv 2020, arXiv:2001.06033. [Google Scholar] [CrossRef]
  55. Tao, S.; Wu, X.; Fang, K.; Lin, D. Identifying drivers of county-level industrial carbon intensity by a generic machine learning framework. J. Clean. Prod. 2024, 454, 142276. [Google Scholar] [CrossRef]
  56. Yang, L.; Fang, C.; Chen, W.; Zeng, J. Urban-rural land structural conflicts in China: A land use transition perspective. Habitat Int. 2023, 138, 102877. [Google Scholar] [CrossRef]
  57. Ding, X.; Zhang, B.; Shen, C.; Wang, R.; Yin, S.; Li, F.; Xu, C. Are we underestimating the driving factors and potential risks of freshwater microplastics from in situ and in silico perspective? Water Res. 2025, 281, 123568. [Google Scholar] [CrossRef] [PubMed]
  58. Zhao, Y.; Ge, W.; Sun, Y.; Qiao, G.; Zhu, D.; Ai, H. Examining nonlinear effects of socioecological drivers on urban solar energy development in China using machine learning and high-dimensional data. J. Environ. Manag. 2024, 360, 121092. [Google Scholar] [CrossRef]
  59. Liao, X.; Ying, R.; Deng, H.; Xu, Z. The income effect and benefit distribution: Analysis on the effect of farmers’ cooperation. China Soft Sci. 2016, 5, 30–42. [Google Scholar]
  60. Hyacinth, O.E.; George, M.; Bedru, B.B. Land tenure security and preferences to dispute resolution pathways among landholders in Nigeria. Land Use Policy 2022, 119, 106179. [Google Scholar] [CrossRef]
  61. Guan, H. Legal risks and countermeasures in the reform of contracted farmland “Merging small fields with large fields”. Acad. J. Zhongzhou 2024, 3, 30–38. [Google Scholar]
  62. Hou, J. Capital to countryside: Perspective from farmers—Based on investigation from 3203 farming families in 214 villages nationwide. J. Huazhong Agric. Univ. 2015, 1, 81–87. [Google Scholar]
  63. Qi, X.; Wang, X. Factors influencing the citizenization of rural-urban migrants: A study based on machine learning. Chin. Rural. Econ. 2024, 5, 128–150. [Google Scholar]
  64. Wang, Y.; Zhang, Y.; Li, J. Digital finance and carbon emissions: An empirical test based on micro data and machine learning model. China Popul. Resour. Environ. 2022, 32, 1–11. [Google Scholar]
  65. Nandwani, B. Community forestry and its implications for land related disputes: Evidence from India. Eur. J. Political Econ. 2022, 73, 102155. [Google Scholar] [CrossRef]
  66. Rakgwale, M. The role of mediation in land disputes in Africa. In Dispute Resolution Within Africa; Baboolal Frank, R., Ed.; Springer: Cham, Switzerland, 2024. [Google Scholar]
  67. Czarnecki, A.; Milczarek, A.D.; Widła, D.Ł.; Jórasz, Z.A. Conflict dynamics over farmland use in the multifunctional countryside. Land Use Policy 2023, 128, 106587. [Google Scholar] [CrossRef]
  68. Putnam, R.D. Making Democracy Work: Civic Traditions in Modern Italy; Princeton University Press: Princeton, NJ, USA, 1993. [Google Scholar]
  69. Tan, S.; Zou, S.; Zhao, Y.; He, Q.; Zhang, M. Research on the Manifestation and Formation Mechanism of New Characteristics of Land Disputes: Evidence from the Yangtze River Economic Belt, China. Land 2024, 13, 1002. [Google Scholar] [CrossRef]
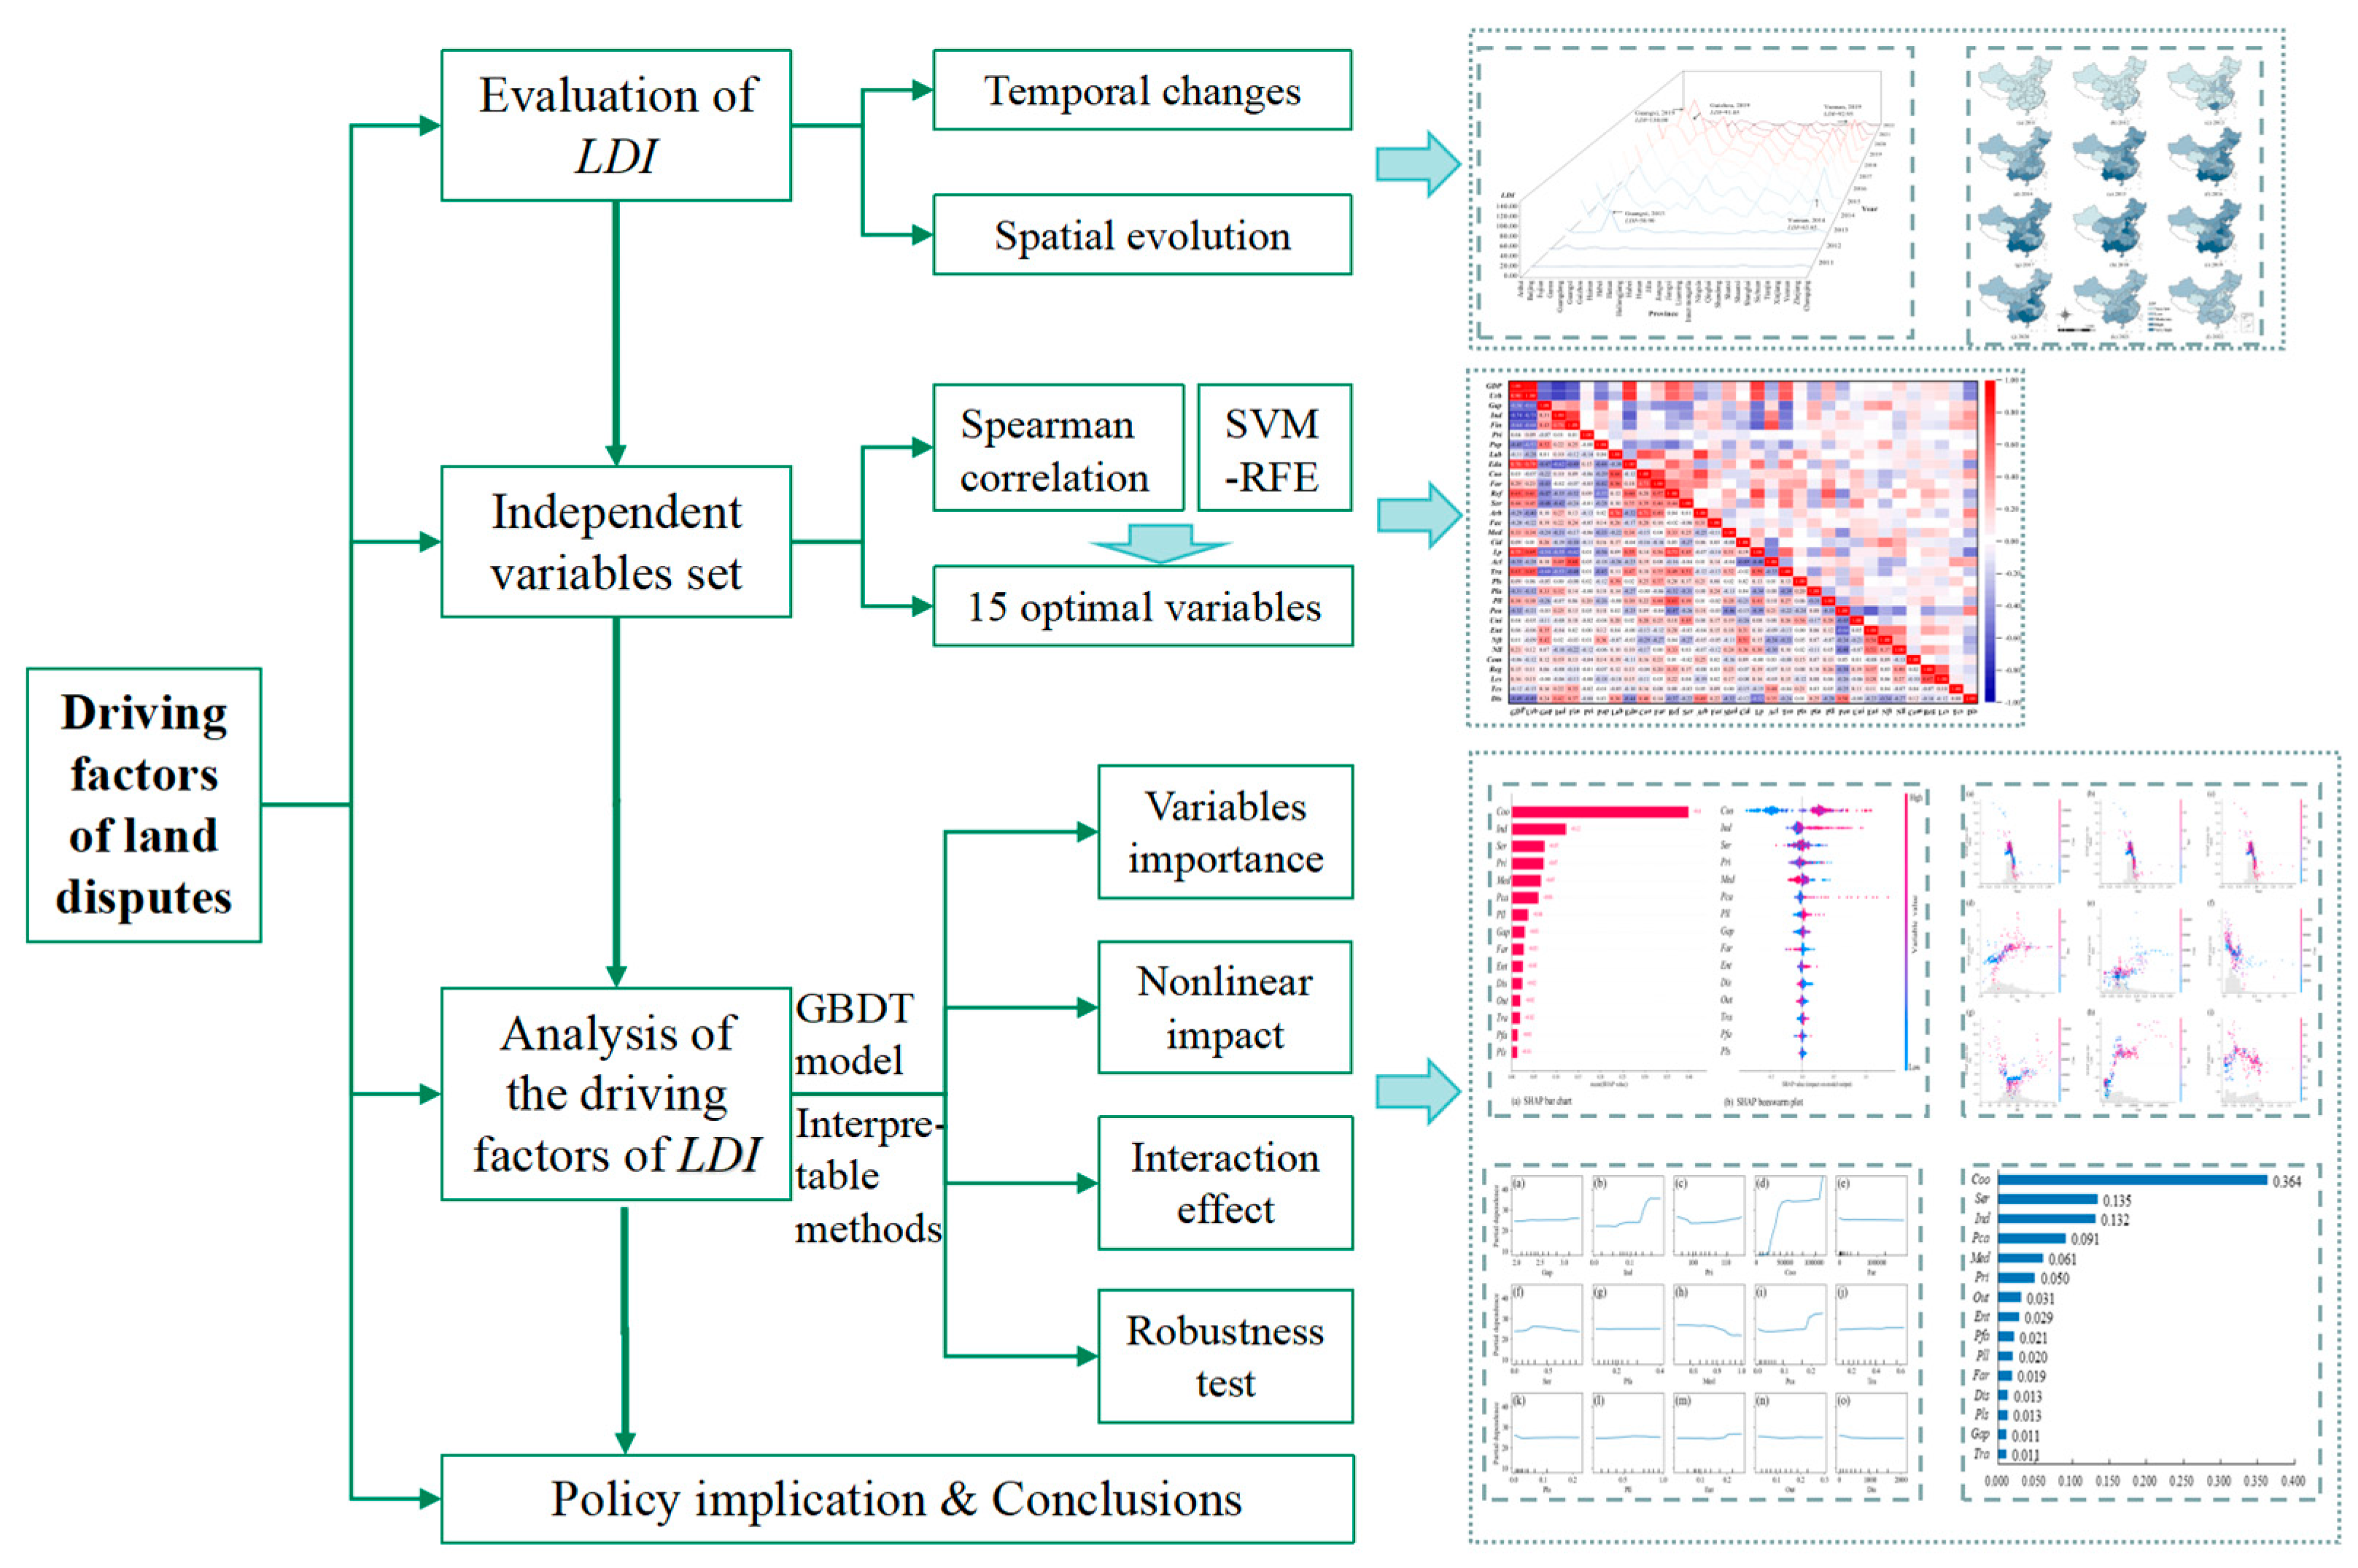
Figure 1. Framework of research.
Land 14 01757 g001
Figure 2. Spearman correlation of independent variables.
Land 14 01757 g002
Figure 3. Temporal changes in LDI.
Land 14 01757 g003
Figure 4. Spatial distribution evolution of LDI.
Land 14 01757 g004
Figure 5. SHAP summary plot.
Land 14 01757 g005
Figure 6. PDPs of variables.
Land 14 01757 g006
Figure 7. SHAP dependency plots of several variables.
Land 14 01757 g007
Figure 8. Variable weights.
Land 14 01757 g008
Table 1. Set of potential independent variables.
VariablesDefinitionCalculation MethodsData Sources
GDPPer capita GDP (CNY)Total GDP/populationEPSDATA (https://www.epsnet.com.cn, accessed on 2 August 2024)
UrbUrbanization levelUrban population/total population
GapUrban–rural gapUrban-to-rural disposable income ratio
IndShare of primary industryPrimary sector value-added/GDP
FinFinancial support for agricultureAgri-expenditure/fiscal expenditure
PriAgricultural product price index/
PopNatural population growth rate (‰)Net increase/population × 1000‰National Bureau of Statistics (https://www.stats.gov.cn, accessed on 2 August 2024)
LabNumber of migrant labors (104 persons)/
EduEducation levelPopulation with high school education or above/total population
CooNumber of specialized farmers’ cooperatives/China Rural Management Statistical Yearbook (2011–2018);
China Rural Policy and Reform Statistical Yearbook (2019–2022)
FarNumber of family farms/
RefCompletion rate of property rights reformVillages completing reform/total villages
SerCoverage of land transfer service centersNumber of land transfer centers/number of townships
ArbNumber of arbitration committees/
FacProportion of farmer in arbitration committeeNumber of farmer representatives/committee members
MedMediation rate of non-litigation disputesMediated disputes/total land disputes
CidProportion of collective income distributed to farmersIncome distributed to farmers/collective income
LpLand price (Yuan/ha)Total land transaction cost/land acquisition areaNational Bureau of Statistics (https://www.stats.gov.cn, accessed on 2 August 2024)
AclAverage cultivated land per household (ha)Area of cultivated land/total householdsChina Rural Management Statistical Yearbook (2011–2018);
China Rural Policy and Reform Statistical Yearbook (2019–2022)
TraRatio of cultivated land transferTransferred area/area of cultivated land
PlsProportion of land shareholdingArea for equity shares/transfer area
PlaProportion of land assignmentArea for assignment/transfer area
PllProportion of land leasingArea for lease/transfer area
PeaProportion of land transferred to peasantsTransferred to peasants/transfer area
UniProportion of land transferred to unionsTransferred to farmer unions/transfer area
EntProportion of land transferred to enterprisesTransferred to enterprises/transfer area
NftProportion of non-food land transferNon-food transfer/transfer area
NllProportion of land leased to non-localsLeased to non-locals/total leased area
Comland expropriation compensation (104 CNY)Land compensation fees/area of expropriated land
Regland registration and certificationCertificates issued/number of households
LcsPercentage of land contract signingLand contracts/number of households
TcsRatio of transfer contract signingTransfer contracts/number of households who transferred their land
DisDisaster-affected sown area (kha)/EPSDATA (https://www.epsnet.com.cn, accessed on 2 August 2024)
Table 2. Descriptive statistics of variables.
VariablesDefinitionMinMaxMedStdSample
LDILand dispute intensity0.000130.00015.02527.323360
GapUrban–rural gap1.8303.9302.4500.403360
IndShare of primary industry0.0020.2510.0920.052360
PriAgricultural product price index86.400123.300102.4005.745360
CooNumber of specialized farmers’ cooperatives2261.000228,738.00042,273.00040,850.183360
FarNumber of family farms173.000578,460.00012,243.00077,098.331360
SerCoverage of land transfer service centers0.0001.8670.4710.331360
FacProportion of farmers in arbitration committee0.0640.8550.1950.101360
MedMediation rate of non-litigation disputes0.0841.0000.8980.133360
CidProportion of collective income distributed to farmers0.0000.5140.0440.082360
TraRatio of cultivated land transfer0.0340.9110.3050.169360
PlsProportion of land shareholding0.0000.4000.0310.065360
PllProportion of land leasing0.0461.0000.6160.269360
EntProportion of land transferred to enterprises0.0060.4120.1000.072360
NllProportion of land leased to non-locals0.0030.9150.1130.102360
DisDisaster-affected sown area (kha)0.0004224.000534.000736.513360
Table 3. Performance of different models.
ModelR2MAEMSERMSE
linear regression0.42420.108428.69720.705
Decision tree0.44613.664428.54320.701
Random forest0.60212.679308.17817.555
XGBoost0.59211.987315.63717.766
GBDT0.61512.134297.79817.257
Disclaimer/Publisher’s Note: The statements, opinions and data contained in all publications are solely those of the individual author(s) and contributor(s) and not of MDPI and/or the editor(s). MDPI and/or the editor(s) disclaim responsibility for any injury to people or property resulting from any ideas, methods, instructions or products referred to in the content.