Article

Southern Carpathian Periglaciation in Transition: The Role of Ground Thermal Regimes in a Warming Climate

1
Department of Geography, West University of Timișoara, 300223 Timișoara, Romania
2
Institute for Advanced Environmental Research (ICAM), West University of Timișoara, 300223 Timișoara, Romania
3
Research Institute of the University of Bucharest, 050663 Bucharest, Romania
*
Author to whom correspondence should be addressed.
Land 2025, 14(9), 1756; https://doi.org/10.3390/land14091756
Submission received: 29 July 2025 / Revised: 24 August 2025 / Accepted: 27 August 2025 / Published: 29 August 2025
(This article belongs to the Special Issue Integrating Climate, Land, and Water Systems)

Abstract

This study examines ground surface and air temperatures and their implications for periglacial activity in the Țarcu Massif, Southern Carpathians, where data on current dynamics and climate responses remain scarce despite widespread periglacial landforms. To address this, we deployed seven temperature loggers between 2018 and 2024 across a range of periglacial landforms, including non-sorted patterned ground, a periglacial hummock, protalus rampart, block stream, periglacial tor, ploughing boulder, and nival niche. We analyzed key thermal indicators such as freeze–thaw cycles, freezing and thawing degree days, frost weathering intervals, frost days, and winter equilibrium temperatures—in relation to long-term air temperature records (1961–2023), snow cover dynamics, and local topographic and substrate conditions. Results reveal a marked warming trend at the Țarcu meteorological station, particularly after 1995, along with a shift in net thermal balance beginning in the late 1990s. Since then, climatic conditions at this site have no longer been favorable for the persistence of sporadic permafrost. Ground thermal conditions varied spatially, with coarse debris sites and rock wall maintaining the lowest MAGST values—typically with 1 to 2.5 °C cooler than fine-grained sediments—and the highest potential for frost-related weathering. Despite low and variable freeze–thaw cycle frequency, the high number of frost days (around 200 per year) and sustained frost weathering potential—exceeding 50 days annually at key sites—indicate that periglacial conditions remain active for nearly half the year around 2000 m in the Southern Carpathians. Snow cover dynamics proved to be a major control on ground thermal behavior, with earlier melting and delayed onset shortening its duration but amplifying early winter cooling. These findings indicate that the Țarcu Massif is a transitional periglacial environment, where active and relict features coexist under growing climatic pressure. The ongoing decline in frost-driven processes highlights the vulnerability of mid-latitude mountain periglacial systems to climate warming and underscores the need for continued monitoring to better understand future landscape evolution in the Southern Carpathians.

1. Introduction

Periglacial areas currently account for about 25% of Earth’s land surface [1], referring to cold-climate environments characterized by non-glacial processes and landforms [2]. Periglaciation encompasses frost-driven processes and associated landforms commonly found in high-latitude or high-elevation settings [3]. Within these cold regions, the ground may freeze on a daily, seasonal or perennial basis, and this frozen ground regime exerts a strong influence on soil, hydrological, biological, and geomorphological processes in cold-climate environments [4].
Ground surface temperature (GST), a key variable in hydrothermal processes at the land–atmosphere interface, plays a crucial role in understanding climate-induced changes in cold regions, where frozen ground is particularly sensitive to warming [5]. Rapid increases in both air temperature and GST have been observed across the circum-Arctic and high mountains, a trend with significant potential to alter periglacial processes at a global scale [6]. Monitoring GST is therefore essential for tracking permafrost dynamics and evaluating the effects of climate change in periglacial environments [7,8,9]. Variations in GST—such as rising temperatures and shifts in seasonal patterns—can lead to permafrost degradation, threatening landscape stability and posing risks to infrastructure and ecosystems [10]. In response, initiatives like the Global Terrestrial Network for Permafrost (GTN-P) [11] and the Swiss Permafrost Monitoring Network (PERMOS) [12] have advanced the monitoring of GST in periglacial regions, contributing valuable data for climate impact assessments.
Periglacial processes are widespread and active in the alpine zone of the Southern Carpathians, where the majority of the Romanian Carpathians’ periglacial environment is concentrated [13]. Covering approximately 1500 km2 of alpine terrain, the Southern Carpathians represent the most extensive area affected by periglacial conditions in Romania [14]. Despite being less visually striking than glacial features, frost-driven processes play a significant role in shaping present-day alpine slopes. A variety of periglacial landforms—such as solifluction lobes, patterned ground, and frost-shattered debris—occur predominantly above the tree line [14]. While permafrost is limited to small, high-altitude zones above 2100 m where the mean annual air temperature (MAAT) is around 0 °C, seasonally frozen ground is much more extensive [15]. Frost action remains an important geomorphic agent even in areas with positive MAAT, particularly on north-facing steep slopes where ground temperature closely follows air temperature [16]. Processes such as frost cracking, cryoturbation, gelifluction, frost creep, frost sorting, frost shattering, rock falls and nivation are all active, their intensity modulated by local factors including snow cover thickness and duration [14].
The inactivity of some periglacial landforms in the Romanian Carpathians highlights their value as relict features, offering insights into the intensity of periglacial processes during earlier climatic phases, especially the Late Glacial and Holocene. Following the Pleistocene glacial retreat, severe periglacial activity reshaped mountain slopes under the combined influence of glacial debuttressing and permafrost degradation [14]. While seasonally frozen ground is common across the Romanian Carpathians, permafrost exists only in a few isolated areas with particularly favorable conditions [15].
Although the rapid rise in air temperatures in recent decades has significantly influenced periglacial processes in high mountain environments, the sensitivity of specific frost-driven processes to climate warming remains insufficiently understood—particularly in the mountains of South-Eastern Europe. The importance of long-term, continuous observations for understanding and predicting changes in the cryosphere has been emphasized in recent IPCC Special Reports [17]. Frozen ground conditions, typically associated with mean annual air temperatures (MAAT) near 0 °C, play a fundamental role in driving geomorphological processes in periglacial environments [1]. Ground surface temperature (GST) has been widely used to characterize thermal regimes and infer permafrost distribution, yet it is less frequently applied to study the dynamics of seasonal and diurnal ground freezing [7,8,9]. Moreover, high-resolution GST data remain limited, contributing to persistent knowledge gaps regarding the response of periglacial processes to climate change across different mountainous regions.
This study presents a unique dataset of GST and near-rock surface temperature observations recorded in the alpine environment of the Țarcu Massif (~2000 m a.s.l.) between 2018 and 2024. The primary objective is to characterize the interannual and intraannual variability of GST and near-rock surface thermal regimes across diverse periglacial landforms, and to assess their relationship with air temperature trends. In addition to thermal dynamics, this study examines key cryogenic parameters such as freezing and thawing degree-day indices, frost weathering intervals, freeze–thaw cycle frequency, frost days, winter equilibrium temperatures, zero curtain periods, nival offset and snow cover duration. Data were collected using seven shallowly buried temperature loggers installed in representative landforms including non-sorted patterned ground, earth hummock, periglacial tor, ploughing boulder, block stream, protalus rampart, and nival depression. This integrative approach provides valuable insights into the thermal behavior of periglacial environments under contemporary climate conditions.

2. Materials and Methods

2.1. Study Area

The study area is situated in the northwestern part of the Southern Carpathians (45.280623° N; 22.533463° E), around the highest summits of the Țarcu Massif—Țarcu Peak (2190 m) and Căleanu Peak (2192 m) (Figure 1). Periglacial landforms are common above 1700 m; however, there is limited information on the current activity of frost-driven processes in this region [13]. The general geomorphology of the area is dominated by relict glacial cirques incised into extensive planation surfaces (known as Borăscu) that level the interfluves above 1900 m. These ancient peneplains are remarkably well developed in the Țarcu Massif [18] and are characterized by gently sloping or nearly flat terrain, which has favored the development of patterned ground, cryoplanation terraces and solifluction features. Isolated rock outcrops shaped by frost shattering, known as periglacial tors, frequently occur on mountain ridges and summits. Standing several meters tall, they dominate their surroundings and are usually set within gently sloping terrain. In contrast, the steep walls of the glacial cirques have promoted mass-wasting processes such as rockfalls, rock avalanches, and rockslides, along with intense frost weathering. The resulting periglacial landforms include talus cones, block streams, rock glaciers, scree slopes and protalus ramparts.
Although glaciers and perennial snowfields no longer exist in the Țarcu Massif today, the region hosted small glaciers during the Last Glacial Maximum (LGM) (24–19 ka) [19], with glacier termini reaching as low as 1300–1350 m [18]. The presence of plateau glaciers in the Țarcu Massif during the LGM has been hypothesized based on the extensive development of the Borăscu peneplain in this area [18,19]. Multiple glacial readvance phases have been identified in various parts of the Southern Carpathians during the Lateglacial period [20,21,22,23].
However, by the onset of the Younger Dryas, the region was already deglaciated and had transitioned to periglacial conditions [21,23]. The landscape above 1700 m is characterized by a variety of both relict and active periglacial landforms, such as: debris cones, talus cones, block streams, periglacial hummocks, non-sorted polygons, nival depressions, ploughing boulders, solifluction lobes, solifluction terraces, pronival ramparts and protalus ramparts (Figure 2).
At elevations above 2000 m, the climate of the Southern Carpathians qualifies as alpine periglacial [1], supporting the development of frost-induced geomorphic processes. The mean annual temperature at the Țarcu meteorological station (altitude 2180 m) between 1991 and 2020 was 0.19 °C, with a marked warming trend observed after 1995. During the same climatological period, the mean annual precipitation was 990 mm.

2.2. Methodology

2.2.1. Instrumentation

To investigate the thermal regime of the ground and near-rock surface in the Țarcu area seven dataloggers (Analog Devices, Wilmington, NC, USA) (Figure 1) were installed between 2018 and 2024 in different periglacial landforms (Table 1). Temperature measurements were obtained using iButton DS1922L miniature thermistors (Analog Devices, Wilmington, NC, USA). Due to their reliability and precision, these compact devices have become a standard tool for monitoring GST in periglacial environment, capable of recording temperatures between −40 and +80 °C, with an accuracy of ±0.5 °C and a resolution of 0.06 °C [24]. The sensors were installed at depths around 0.1 m, in accordance with the methodology outlined in the literature [25]. Temperature readings were taken at two-hour intervals. Thermistors were indirectly calibrated at 0 °C using zero curtain periods, which correspond to isothermal conditions at the ground surface during snowmelt in springs. Data were averaged annually according to hydrological years, which extend from October 1 to September 30 of the following year.
Four dataloggers (NP-1, PH-2, PB-4 and NN-5) were installed in relatively fine-grained sediments, primarily composed of soil mixed with pebbles. Vegetation cover varied across the sites: only site NN-5 had a bare ground surface, while the other three locations were covered by sparse alpine vegetation. At site PH-2, the sensor was embedded at a depth of 0.1 m beneath the apex of a 0.35 m high periglacial hummock. At site PB-4 the thermistor was placed in an elongated depression near a ploughing boulder, approximately 0.4 m from its base. One datalogger was installed on the north-facing rock wall of a periglacial tor, positioned in a shallow drill hole (~0.1 m deep) and sealed with silicon according to standard procedures [16]. Additionally, two thermistors (PS-6 and BS-7) were placed on the surface of coarse, angular clasts (decimeter-scale) which were then covered with cobbles to shield them from direct solar radiation [26].
To contextualize the period from October 2018 to September 2024, long-term temperature records from a nearby meteorological station were used. These provide a reference for comparing recent data and framing the study results within broader climatic trends. For this study, we relied on daily air temperature records from the Țarcu weather station, notable for being the second highest in elevation (2180 m) among meteorological stations in the Romanian Carpathians. All ground surface temperature (GST) monitoring sites are situated in close proximity to the meteorological station, with distances ranging from 0.4 to 3 km.

2.2.2. Parameters

From the ground-surface thermistor recordings, a set of parameters widely used in periglacial studies to characterize periglacial conditions were determined (Table 2). Among the derived metrics are the mean annual ground surface temperature (MAGST) and the mean annual air temperature (MAAT). The freezing degree days (FDD) and thawing degree days (TDD) quantify the intensity of freeze and thaw periods by summing daily mean temperatures below and above 0 °C, respectively. For each site, we also quantified the frequency of freeze–thaw cycle days (FTC) and frost days (FD), defined as days with minimum temperatures below or equal to 0 °C.
Given that frost weathering processes are most effective between −3 °C and −8 °C [27], we quantified the number of days (FWI) during which temperatures remained entirely within this range at each monitoring site. Only days when the temperature consistently stayed within these limits throughout the entire day were included in the analysis. For example, if the mean daily temperature fell between −3 °C and −8 °C, but hourly temperatures occasionally dropped below −8 °C or rose above −3 °C those days were excluded from the count.
Winter equilibrium temperature (WEqT) refers to a stable ground temperature recorded over a minimum two-week period, generally occurring in late winter (February to March), when snow insulation is sufficient (typically > 50 cm) [28]. This parameter is widely used as a proxy for identifying potential permafrost zones and distinguishing them from non-permafrost areas [25]. According to widely accepted thresholds, permafrost conditions are expected where WEqT values are below −3 °C [29]. Temperatures ranging from −2 °C to −3 °C suggest possible permafrost presence, whereas values above −2 °C typically indicate permafrost-free conditions [30].
In addition, we calculated the zero curtain period (ZCP), defined as the duration during which latent heat maintains ground temperatures near 0 °C during freezing or thawing phases [31]. Finally, snow cover duration (SCD) was estimated by counting the number of days when snow exerted a significant insulating effect—specifically those days when the weekly standard deviation of mean daily ground surface temperatures was ≤0.25 °C [32].
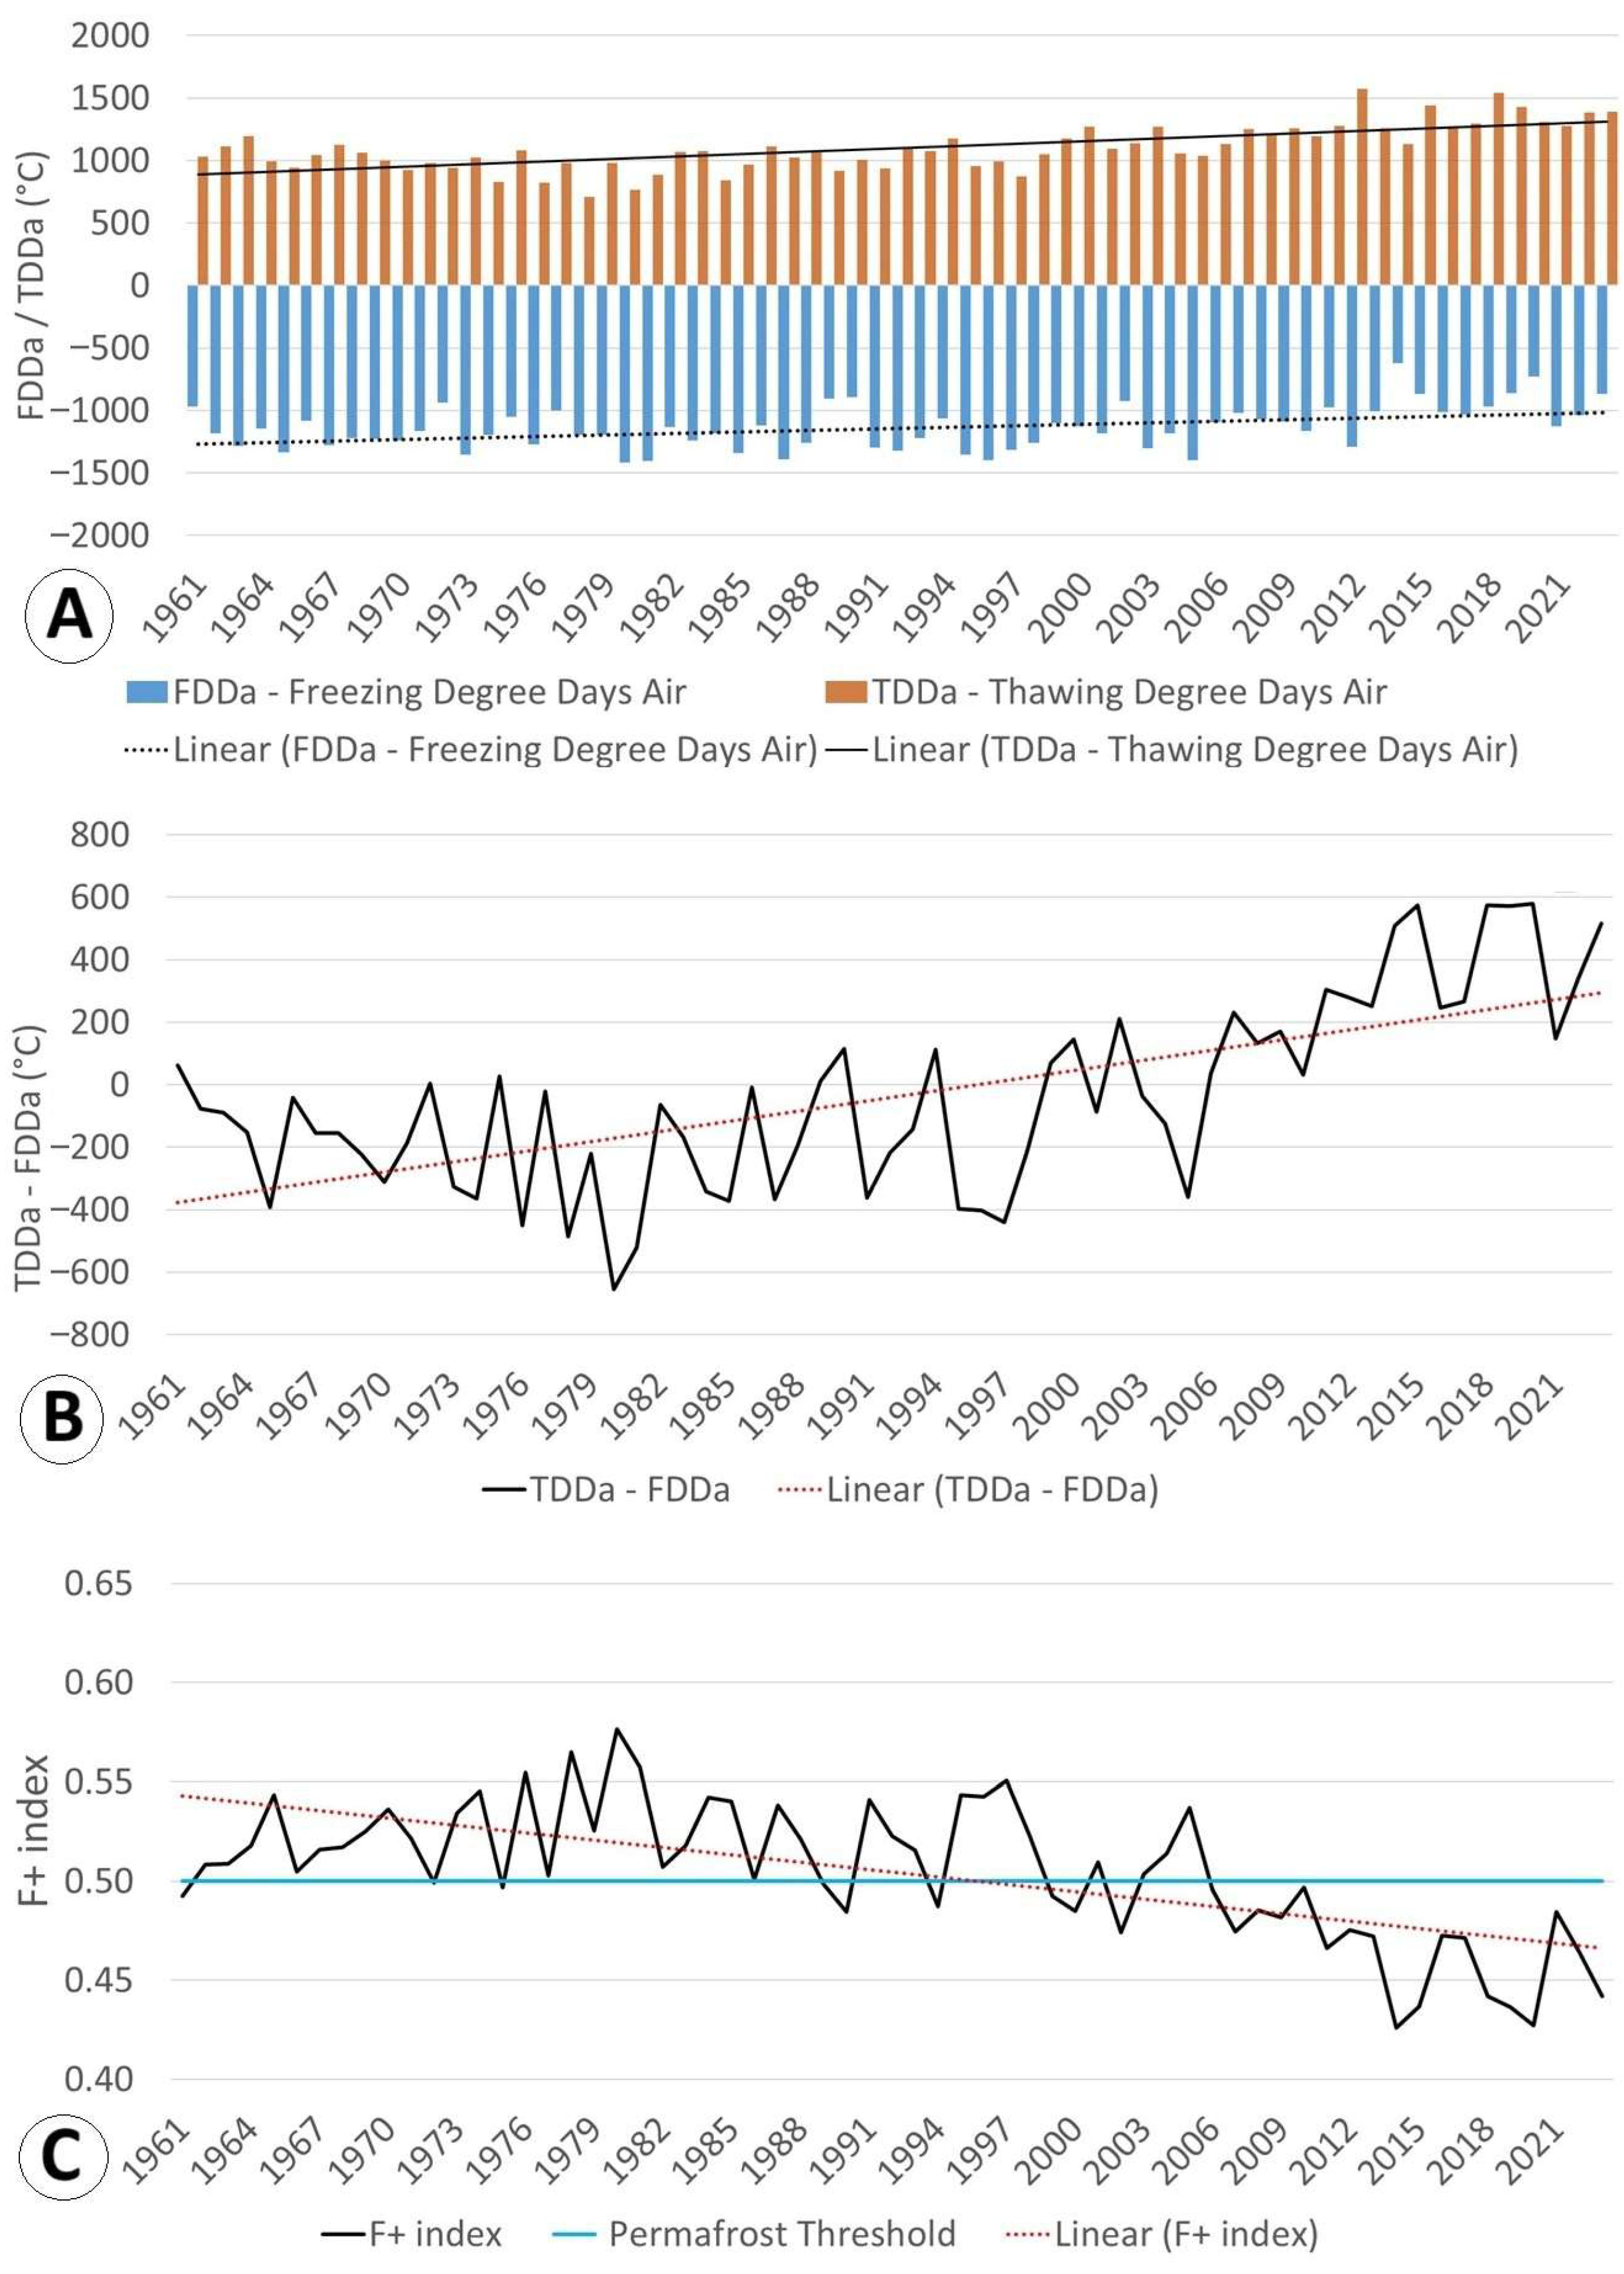
The F+ index is calculated using the annual totals of freezing degree days (FDDa) and thawing degree days (TDDa) over a calendar year (see Equation (1)). This dimensionless index provides an estimate of permafrost likelihood and is categorized as follows: F+ < 0.50—no permafrost; 0.50 ≤ F+ < 0.60—sporadic permafrost; 0.60 ≤ F+ < 0.67—discontinuous permafrost; F+ ≥ 0.67—continuous permafrost [33].
F+ = FDDa1/2/(FDDa1/2 + TDDa1/2)
To assess the influence of snow cover on the ground thermal regime through its insulating effect, we used the nival offset (NO) parameter [34] (see Equation (2)). Low NO values indicate a reduced snow influence on ground temperatures, whereas high values reflect strong thermal insulation. For each GST site, the corresponding air temperature was estimated using a lapse rate of 0.63 °C per 100 m [14].
NO = FDDa(1 − nf)/P
where P = annual period (365 or 366 days) and nf = FDDg/FDDa.
Except for MAAT, trend analyses for all parameters derived from air temperature records at the Țarcu Mountains were conducted using simple linear regression. In the case of MAAT because we observed an evident non-linear trend, we applied a Bai–Perron multiple structural break analysis [35] to account for potential shifts in slope. This method partitions the series into segments with distinct linear trends, with a minimum segment length of seven years. The optimal number of breaks was selected using the Bayesian Information Criterion [36].

3. Results

3.1. Long-Term Air Temperature

The long-term evolution of mean annual air temperature (MAAT) at the Țarcu meteorological station (1961–2023) reveals a clear warming trend, particularly pronounced in the last three decades (Figure 3). Nevertheless, the trend exhibits a non-linear, phase-like evolution. To identify break points in trend evolution we used a Bai-Perron multiple structural break analysis [35]. Results show two significant breakpoints in 1982 and 1995, separating three climatic phases: (i) 1961–1981: cooling at −0.50 °C dec−1 (p = 0.007); (ii) 1982–1994: near-stationary conditions with a weak, non-significant warming of +0.35 °C dec−1 (p = 0.351); and (iii) 1995–2023: accelerated warming at +0.81 °C dec−1 (p < 0.001). A 2nd order polynomial regression provides a consistent visual summary of this sequence (cooling → quasi-stable → rapid warming), but the segmented model better resolves regime shifts (Figure 3B). The lowest decadal average was recorded between 1971 and 1980 (−0.73 °C), while in contrast, the most recent decade (2011–2020) recorded a substantially higher average MAAT of 1.14 °C. The average temperature for the 1991–2020 climatological interval was approximately 0.8 °C higher than that of the 1961–1990 reference period (0.23 °C vs. −0.56 °C). Notably, prior to 1991, only two years recorded annual means above 0.1 °C, whereas after 2006, all years consistently exceeded this threshold. Moreover, in the most recent decade (2011–2020) the MAAT rose further to 1.14 °C. Across the entire observation period, the long-term mean annual air temperature was −0.11 °C.
The warming trend of air is further evident in the analysis of freezing and thawing degree days (Figure 4). In this respect, FDDa shows a gradual decrease in absolute values, suggesting less intense or shorter cold seasons, while TDDa values display a consistent increase (R2 = 0.48, p-value < 0.01), reflecting longer thawing periods. The net thermal balance expressed as the difference between TDDa and FDDa, shows a distinct shift from negative to positive values, beginning in the late 1990s, indicating that in recent decades, thawing has increasingly outweighed freezing. The F+ index has been applied to assess climatic conditions favorable for permafrost occurrence. A declining trend in F+ is observable (R2 = 0.42, p-value < 0.01), particularly after the 1990s, with values dropping below the 0.5 threshold in recent years—a commonly accepted limit for sporadic permafrost occurrence.
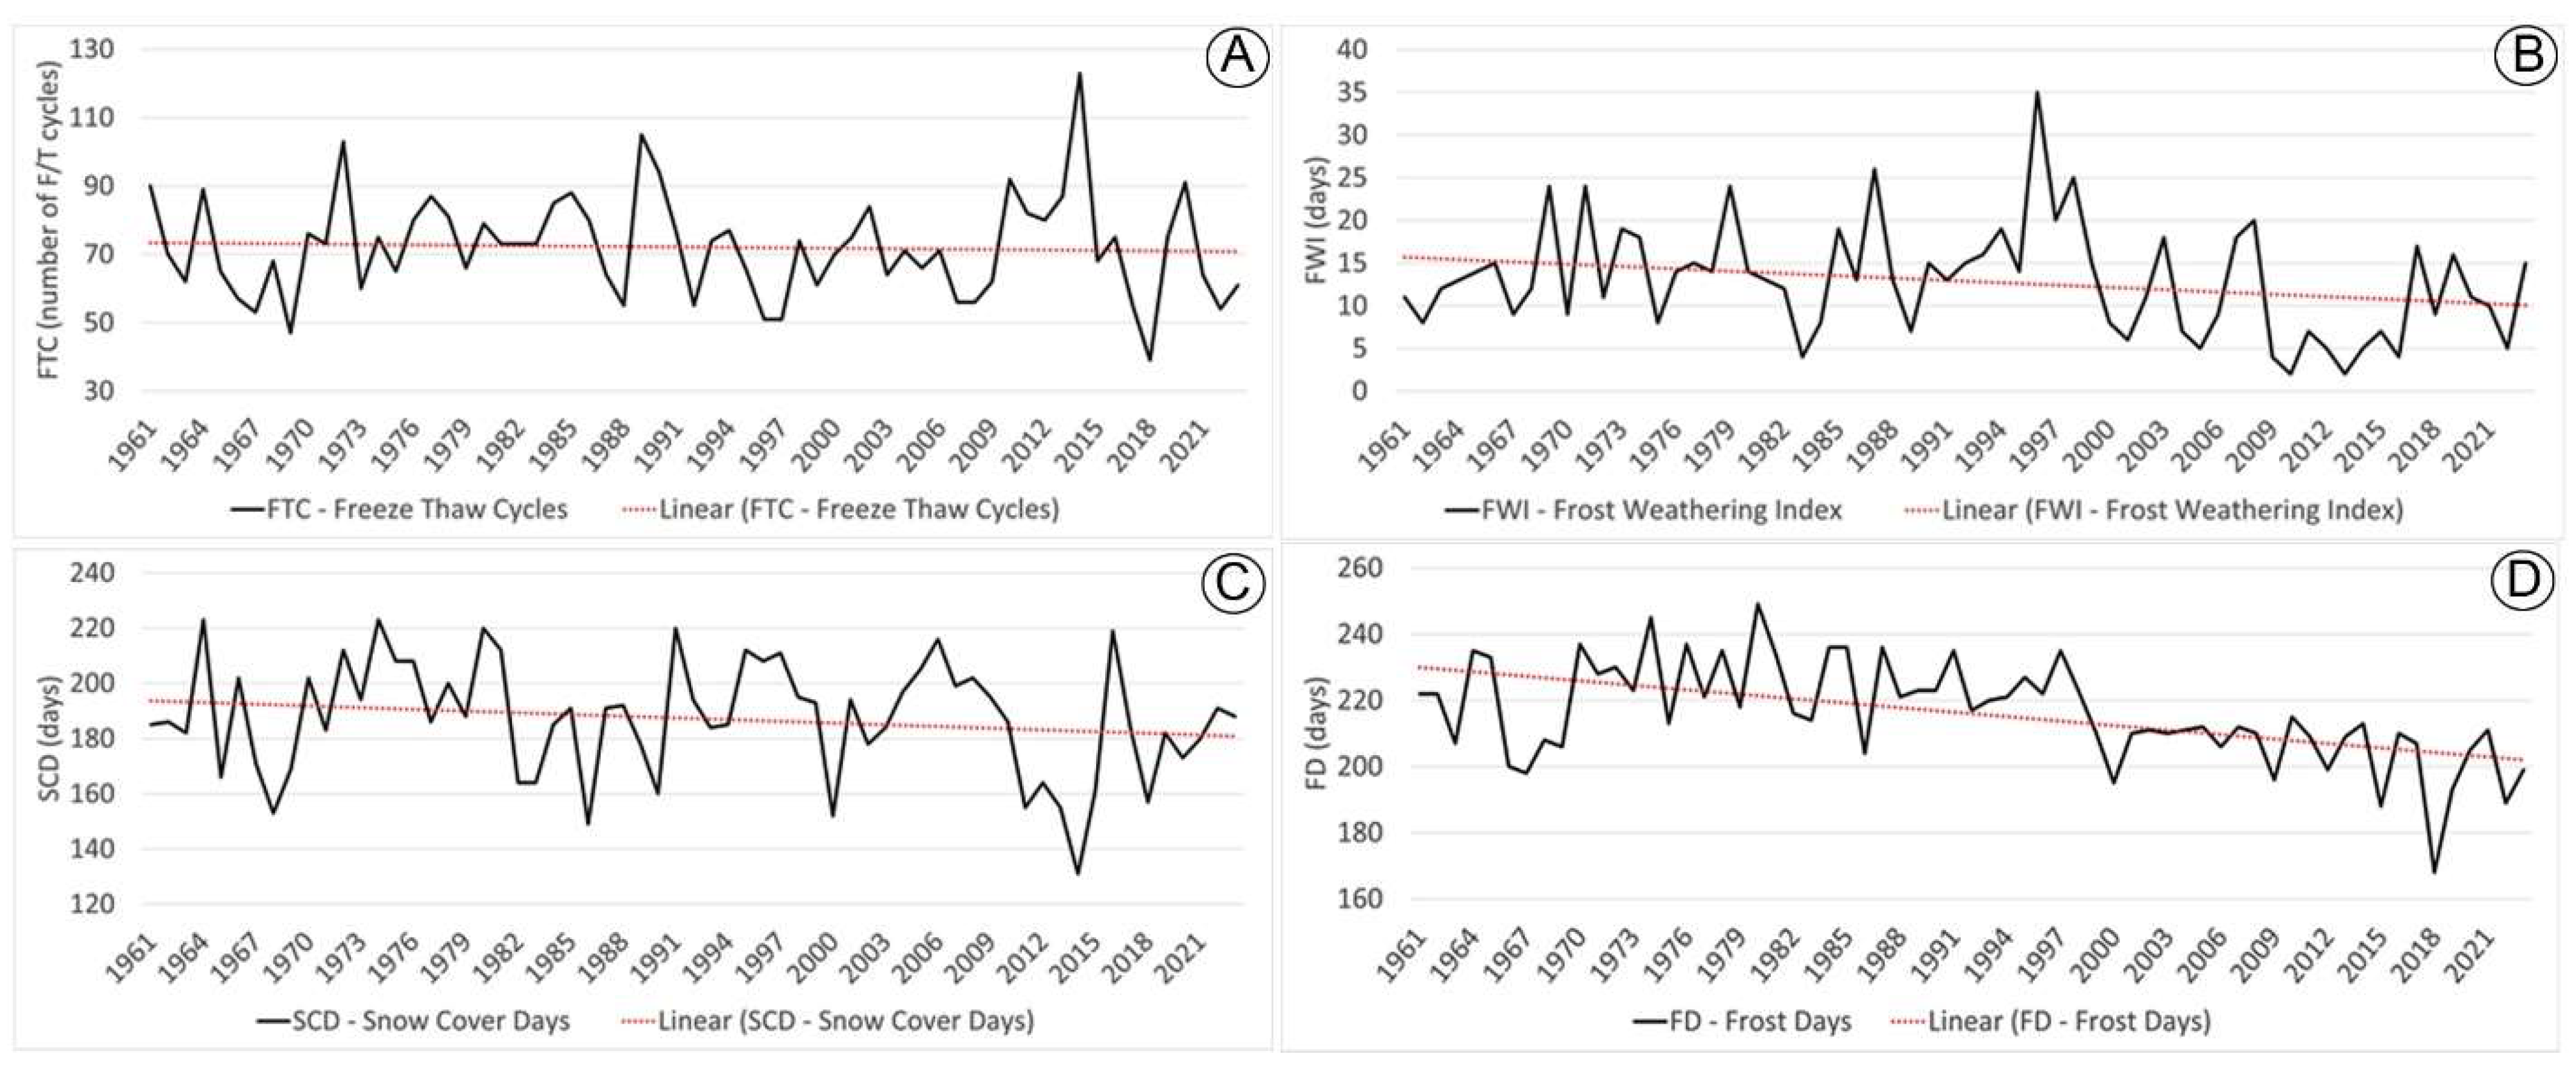
The indices presented in Figure 5 (FTC, FWI, SCD, and FD), calculated from air temperature, serve to highlight climate-related changes at the Țarcu Weather Station. Among them, FTC exhibits high interannual variability without a clear trend, whereas the remaining indices show slightly decreasing trends (see Figure 5 and Table 3), suggesting a gradual decline in frost-driven physical processes. This downward tendency becomes more pronounced over the past two decades, particularly in the case of FD, where the annual number of frost days no longer exceeds 210 days, in contrast to the pre-2000 period, when values typically remained above this threshold.
Results summarized in Table 3 show that parameters such as MAAT (overall and post-1995), TDDa, and F+ reveal statistically significant trends (p < 0.05) with relevant R2 values, underlining clear warming signals. In contrast, frost days, freeze–thaw cycles, and snow-related indices display non-significant trends with low explanatory power, reflecting high variability and weaker climatic signals.

3.2. Thermal Regimes

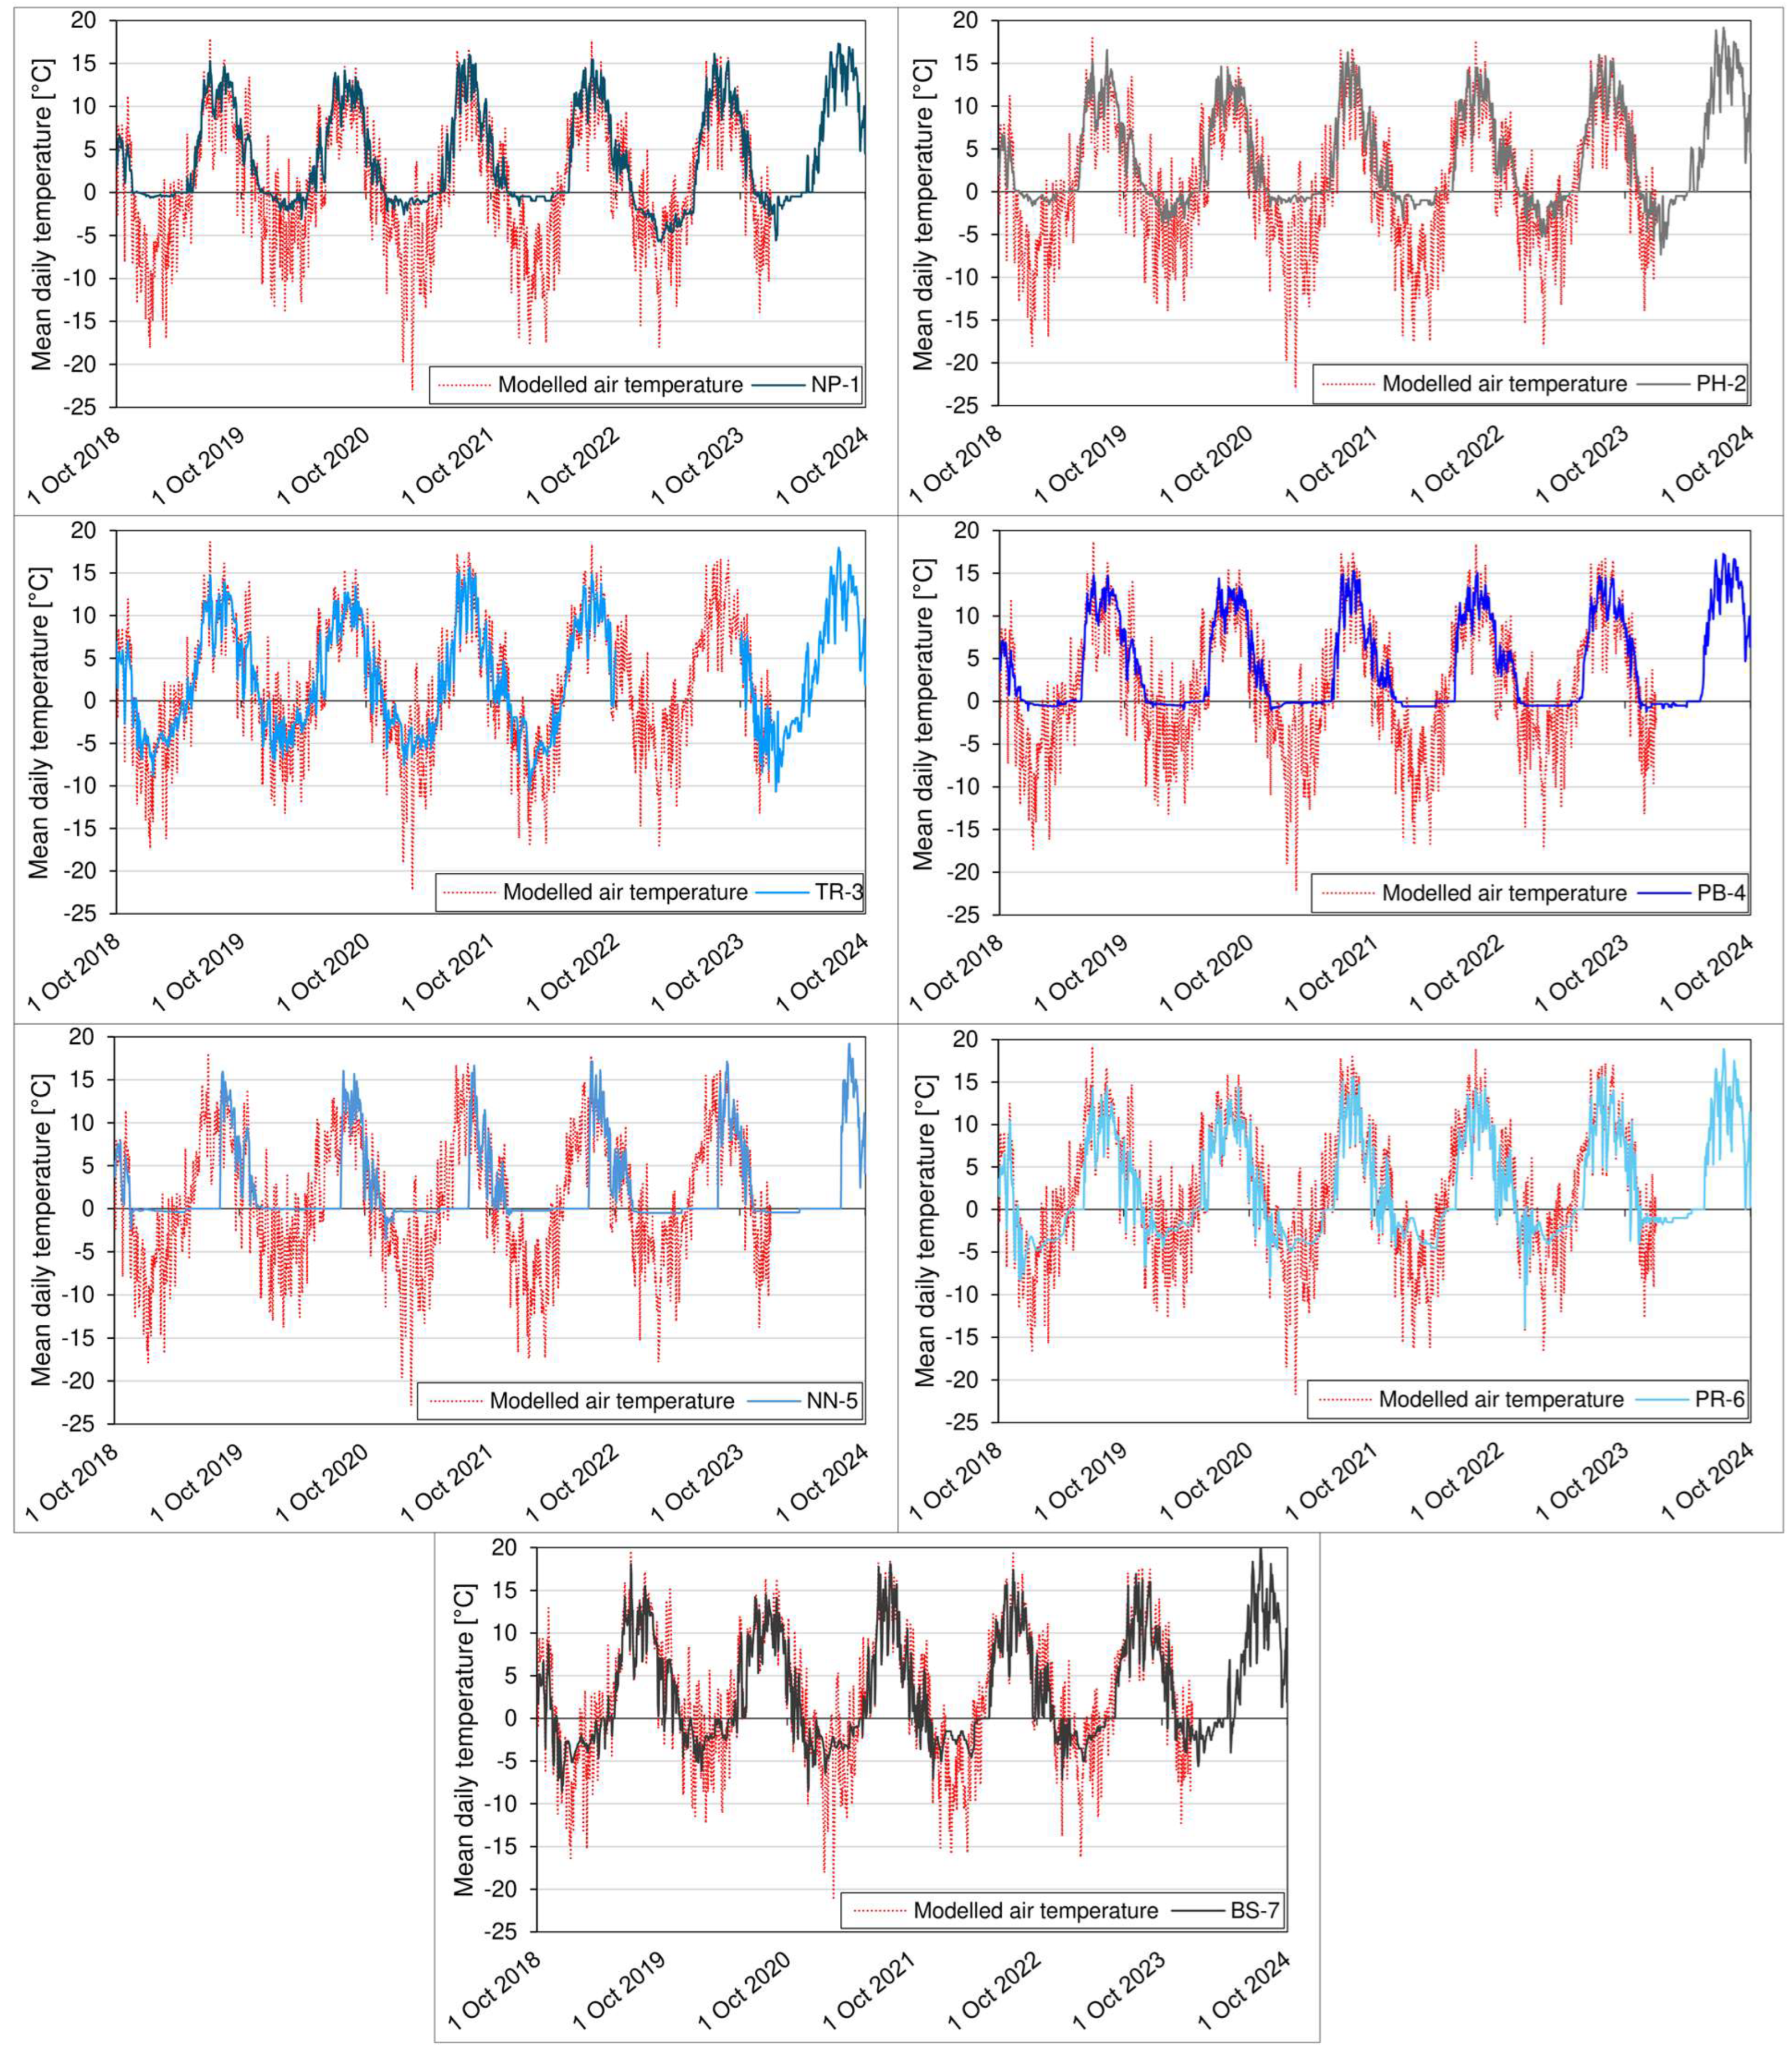
Daily ground temperature analysis reveals a minimum of four thermal phases; their duration being modulated by topoclimatic particularities (Figure 6). Phase A corresponds to the snow-free summer interval, typically extending from May or June to early October. During this period, the ground is exposed to the atmosphere, and the highest temperatures are recorded. There is a marked diurnal temperature range, with frost typically absent except for occasional freezing events in June and September. Peak temperatures usually occur in July or August, often exceeding 15 °C. In the nival depression, however, this interval is significantly shorter, starting in the latter part of July or even in early August. The highest temperatures at all sites were recorded during the summer of 2024.
Phase B corresponds to the transition from autumn to winter, characterized by alternating periods of negative and positive temperatures. This phase lasts until the establishment of a continuous insulating snow cover, which typically occurs between November and December. Short intervals with temporary snow cover are common, as are episodes of very low ground temperatures, occasionally reaching −5 °C or even −10 °C. This is a crucial period for ground cooling and the associated processes of ice segregation, frost cracking, and permafrost cooling. Sites with coarse debris record significantly lower temperatures during this phase, with minimum daily values dropping to −8 °C or even −13 °C at the protalus rampart. The rock surfaces of the periglacial tor also cool down to daily minimums of around −10 °C. In contrast, sites with fine-grained sediments show minimum mean daily temperatures ranging from −0.4 °C to −7.3 °C.
Phase C marks the homogenization of ground temperatures beneath a progressively thickening snow cover. The thermal characteristics of this period are strongly influenced by the properties of the snow cover itself. Larger temperature variations typically occur during the first part of the phase (December and January), when significant cooling (down to −10 °C) can still take place, particularly in coarse-grained deposits where air ventilation through advection and convection is possible. In the second part of this phase (February and March), ground temperatures generally stabilize across most sites, reflecting typical winter thermal conditions. The largest variations are recorded at block stream sites, where significant fluctuations are observed throughout all winters. Notable variations were also recorded at patterned ground and periglacial hummocks during the 2022–2023 winter, primarily due to an insufficiently thick snow cover.
Snowmelt usually begins in April and typically lasts until May, although it can extend into July or even August in the case of the nival depression. At the protalus rampart site, snowmelt persisted until early June in three years (2019, 2021, and 2023). This phase, commonly referred to as the zero curtain period (ZCP), is characterized by constant ground temperatures at 0 °C at all sites. The shortest ZCP was recorded at the block stream and patterned ground sites (mean duration < 20 days), while the longest occurred at the nival niche (mean duration > 100 days).

3.3. Periglacial Conditions

Between 2018 and 2024, MAGST at the seven monitored sites ranged from 1.5 to 5 °C (Figure 7). The lowest average MAGST during this period (2.3 °C) were recorded at the protalus rampart and nival niche sites, followed by the periglacial tor (2.4 °C) and the block stream (3.0 °C). In contrast, the highest temperatures were observed at the periglacial hummock (3.8 °C), patterned ground (3.9 °C), and ploughing boulder (4.1 °C) sites. Over the 2018–2023 period, mean annual air temperatures at Țarcu ranged from 0.5 °C (2021–2022) to 1.7 °C (2019–2020 and 2022–2023), with an overall mean of 1.2 °C.
The evolution of ground temperatures showed a slight increase in 2019–2020 compared to 2018–2019, followed by colder conditions during 2020–2021 and 2021–2022. Mean temperatures then rose again in 2022–2023, apart from the non-sorted polygons site. The 2023–2024 season recorded the highest MAGST at all sites, except for the nival niche, where interannual variations remained minimal. A similarly smooth and stable pattern was observed at the patterned ground and periglacial hummock sites. In contrast, significant interannual variations were recorded at the protalus rampart and periglacial tor sites.
WEqT is a reliable indicator of permafrost conditions in periglacial zones. Significant interannual variability was observed at most sites, except at the nival niche and ploughing boulder sites, where all WEqT values consistently ranged between 0 and −1 °C (Figure 7B). At the non-sorted polygons and periglacial hummock sites, most WEqT values were between 0 and −2 °C, except in 2022–2023, when reduced snow cover led to temperatures dropping below −2 °C in late winter. The lowest WEqT values were recorded at sites with coarse debris, such as the protalus rampart and block stream sites, where values typically ranged between −2.1 and −4.1 °C in all seasons except 2023–2024. In the most recent measurement season (2023–2024), WEqT increased substantially at most sites. The lowest WEqT values across the entire period were observed in 2021–2022 and 2022–2023.
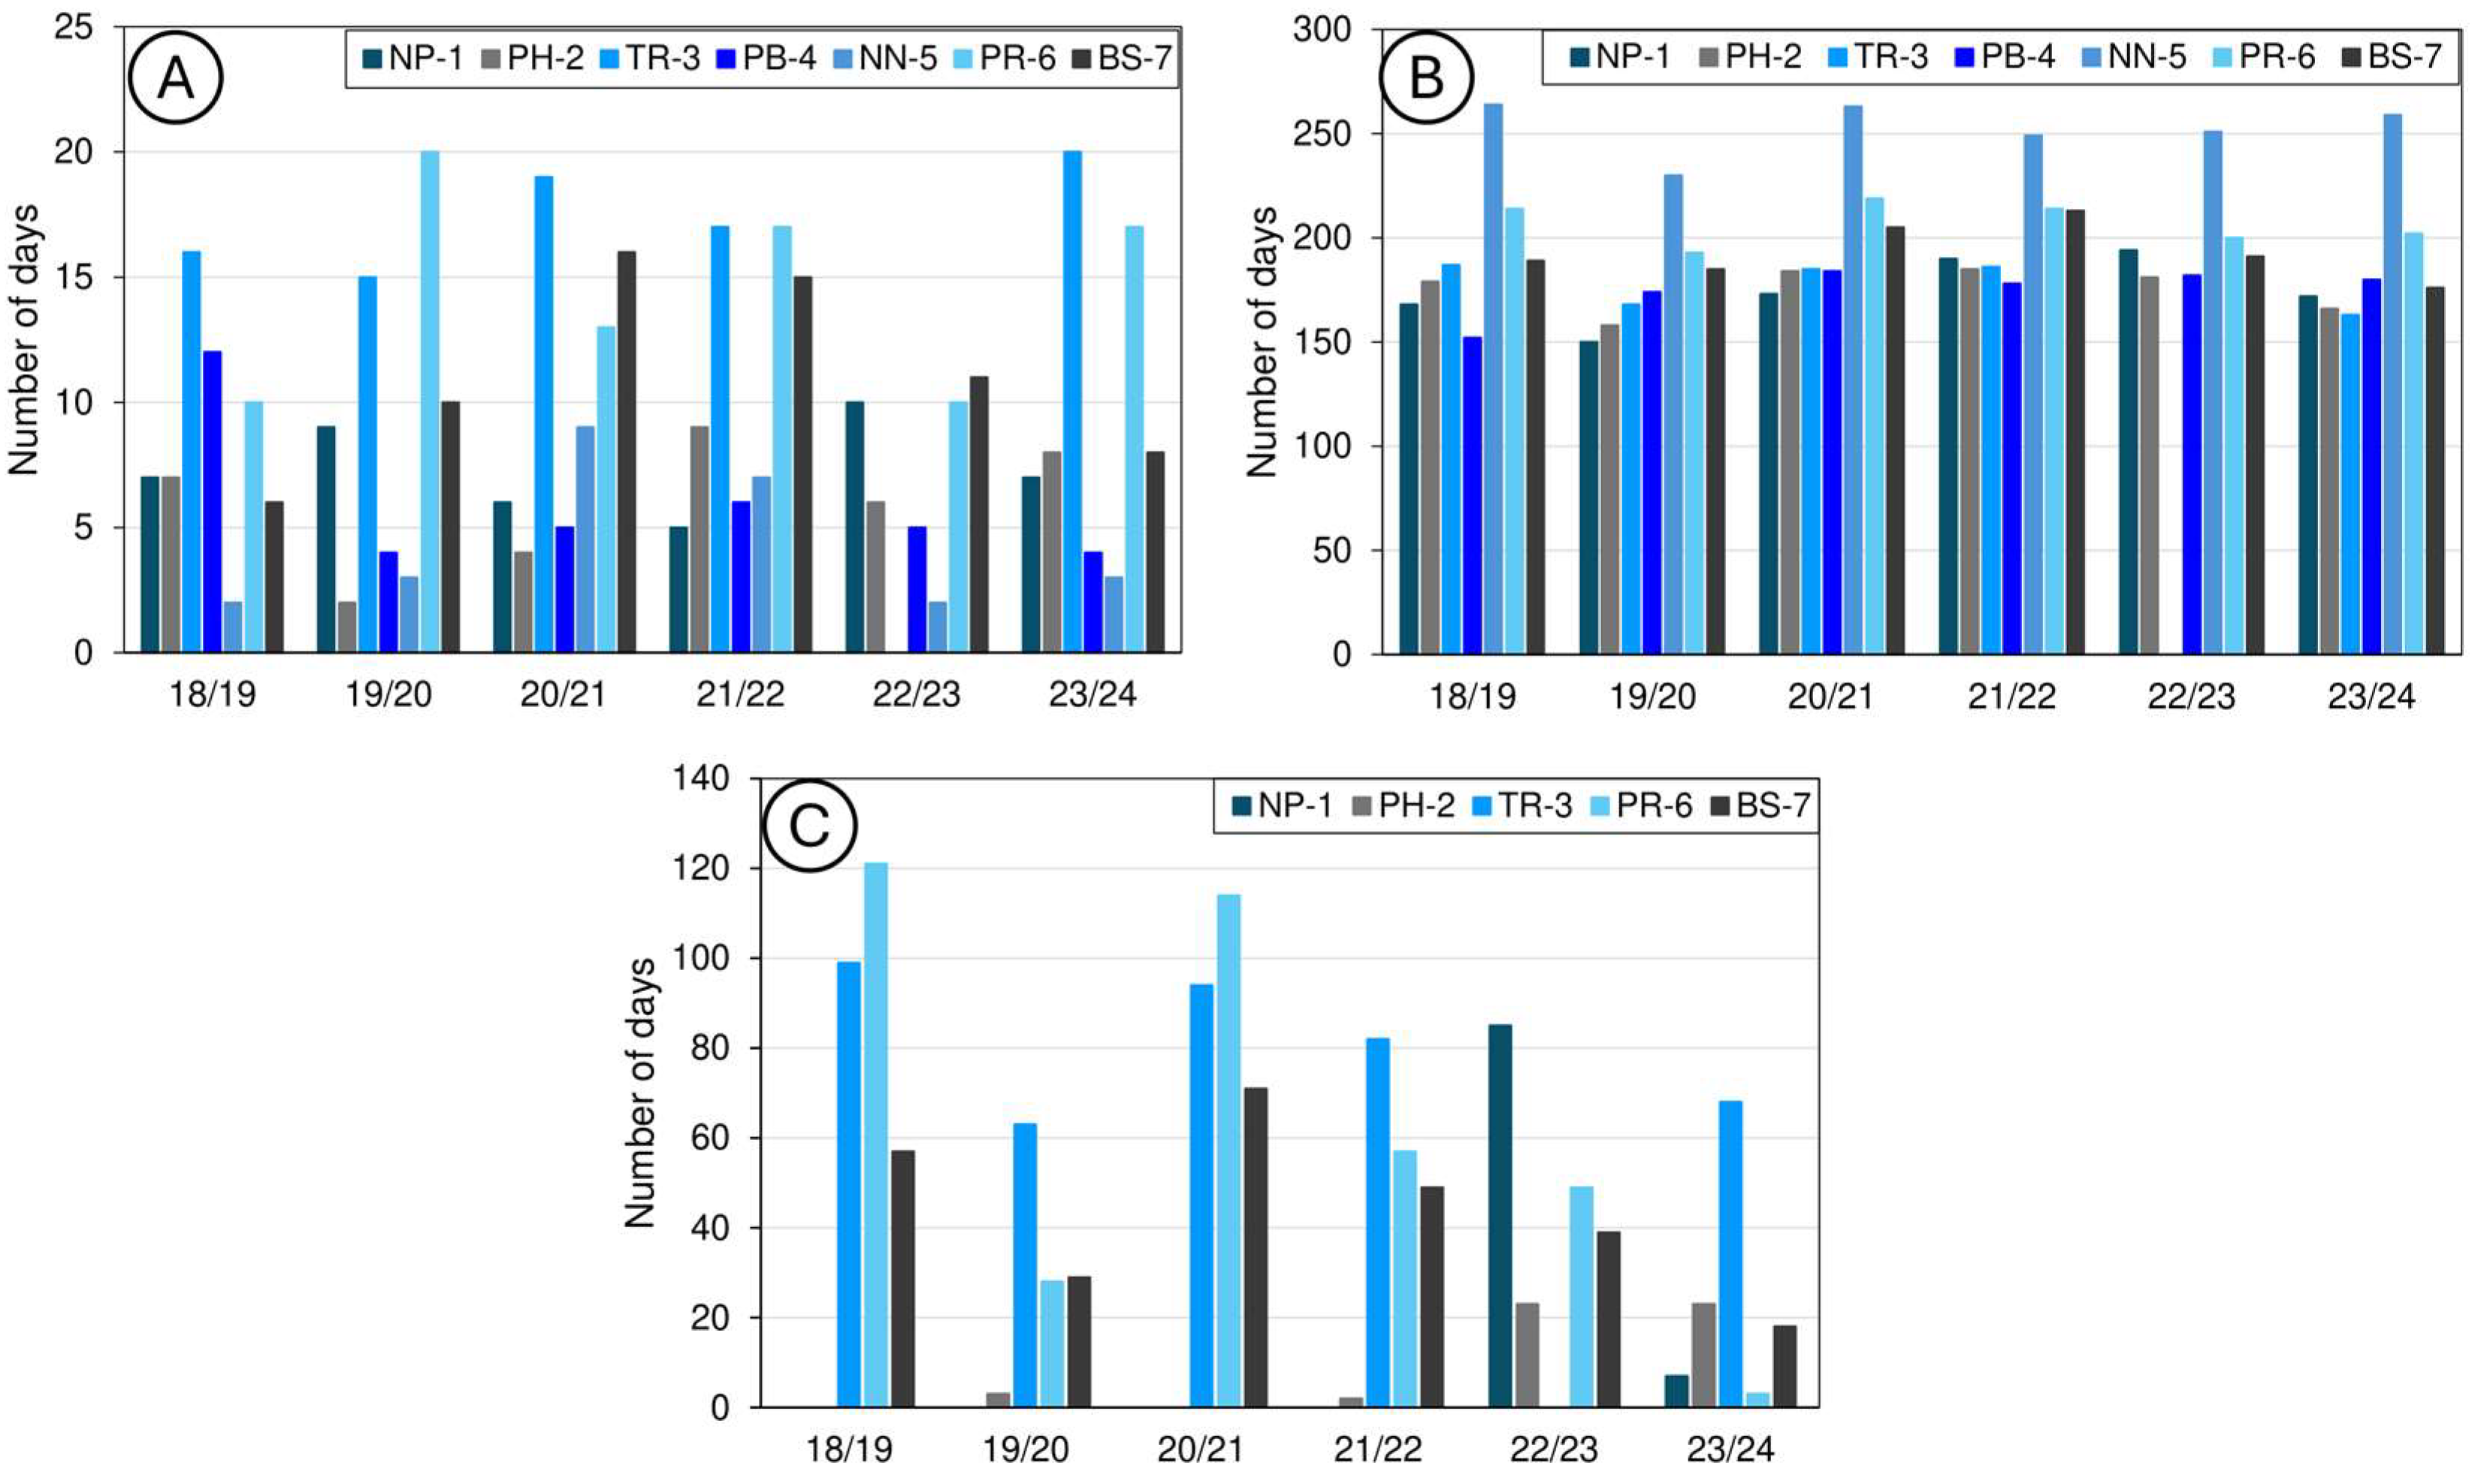
Figure 8 illustrates the evolution of freeze–thaw cycles, frost days, and frost weathering days calculated from ground surface temperature (GST) data recorded at 0.1 m depth. The number of days with freeze–thaw cycles exhibited considerable interannual variability at all sites (Figure 8A). The mean annual number of days with freeze–thaw cycles ranged from 4.3 at the nival niche site to 17.4 at the periglacial tor. More than 10 FTC days per year were also recorded at the protalus rampart and block stream sites. In 2019–2020 at protalus rampart site and 2023–2024 at periglacial tor there were 20 days with freeze–thaw cycles. At the periglacial hummock, ploughing boulder, and non-sorted polygons, the mean annual number of FTC was below 10, whereas at the periglacial tor, at least 15 days with freeze–thaw cycles were recorded each season. In 2020–2021 and 2021–2022, the mean FTC values were the highest across the seven sites. The protalus rampart and block stream sites exhibited the greatest variability in FTC, whereas the non-sorted polygons site displayed the lowest variability, ranging between 5 and 10 per year. The vast majority of FTCs occurred at the beginning of the cold season (October–December), prior to the establishment of snow cover. A smaller number of FTCs were also recorded following snowmelt in May or June. The efficiency of FTCs is greater when sufficient moisture is present in the substrate, which typically occurs after snowmelt and during rainfall events. Such conditions are more characteristic of spring and early summer than of autumn and winter in the Southern Carpathians.
The potential for frost weathering is illustrated in Figure 8C and indicates that the protalus rampart, periglacial tor, and block stream sites exhibit a high potential for frost-related weathering, with 81, 62, and 43 days per year, respectively, experiencing temperatures between −3 °C and −8 °C. In 2018–2019 and 2020–2021, over 100 days per year with conditions favorable for frost weathering were recorded at the protalus rampart site. High FWI values were also recorded at the periglacial tor, ranging between 63 and 99 days per year, whereas at the block stream site FWI exceeded 50 days in 2018–2019 and 2020–2021. An unusual pattern was observed at the non-sorted polygons site, where no days with potential for frost weathering were recorded during the first four seasons, while in 2022–2023 FWI abruptly increased to 85 days due to thin snow cover. In 2018–2019 and 2020–2021, the mean FWI values were the highest across the sites NP-1, PH-2, TR-3, PR-6 and BS-7, exceeding 50 days. No potential for frost weathering was recorded at the nival niche and ploughing boulder sites during the 2018–2024 period.
The number of FD varies interannually (Figure 8B) but shows less variability than the FWI, with average values ranging between 174 and 252 days per year. The highest number of frost days was recorded at the nival niche site, while the non-sorted polygons, periglacial hummock, periglacial tor, and ploughing boulder sites exhibited lower mean values, between 174 and 178 days. In contrast, relatively high mean values of FD were observed at the protalus rampart (207 days) and block stream (193 days) sites. Because of persistent snow cover, frost days (FD) at the nival niche site consistently exceeded 200 per season, ranging from 230 to 264. The lowest variability was observed at the protalus rampart site, where FD ranged from 193 to 219. In contrast, the greatest variability was recorded at the non-sorted polygons site, where values ranged between 150 and 194. During 2020–2021 and 2021–2022, the mean FD values were the highest across the seven sites, reaching 200 days.
Freezing degree days are considerably lower than thawing degree days at all sites (Figure 9). The highest FDDg values were recorded at the periglacial tor (mean: 587 °C days) and protalus rampart (mean: 436 °C days) sites, while the Țarcu weather station registered an FDDa of 935 °C days. FDDg exceeded 600 °C days at the periglacial tor in three seasons (2018–2019, 2020–2021 and 2021–2022), while at the protalus rampart it exceeded 500 °C days in two seasons (2018–2019 and 2020–2021). In 2023–2024, both protalus rampart and the block stream site experienced abrupt decreases in FDDg, dropping to 192 °C days and 253 °C days, respectively. By contrast, the non-sorted polygons site exhibited an abrupt increase in 2022–2023, with FDDg reaching 570 °C days. Mean TDDg values exceeded 1000 °C days at all sites except for the nival niche. Notably, an abrupt increase in FDDg values was observed at all sites during the 2023–2024 season, due to very high summer temperatures. While mean TDDg across the seven sites ranged between 1270 and 1421 °C days over the previous five seasons, in 2023–2024 TDDg reached 1731 °C days, with a maximum of 2045 °C days at the periglacial hummock site. TDDg values were also high at the coarse-block sites (e.g., protalus rampart and block stream), exceeding twice the FDDg and indicating a thermal balance unfavorable for the long-term preservation of permafrost.
The snowmelt period is considerably longer at the nival niche site compared to the other sites (Figure 10A). At this site, mean ZCP lasts for 104 days, while at the other sites it generally ranges between 20 and 33 days. The shortest snowmelt duration was recorded at the block stream site, with the ZCP lasting only 15 days per year. In only one season, ZCP fell below 100 days at the nival niche (2020–2021). An unusual situation occurred at the non-sorted polygons site at the end of the 2022–2023 cold season, when ZCP lasted only one day due to thin snow cover. The longest zero curtain periods were recorded at nearly all sites during the 2021–2022 season, with a mean duration of 54 days. At the nival niche site, the number of days with snow cover is consistently high, ranging between 219 and 257 days per year (Figure 10B). At sites characterized by fine-grained sediments, snow cover duration (SCD) ranges between 130 and 170 days, while the lowest values are recorded at sites with coarse-grained sediments, such as the block stream site, where SCD averages around 120 days per year. Seasons 2018–2019 and 2021–2022 were characterized by higher mean SCD across the sites, with values exceeding 165 days, whereas in 2019–2020 the mean SCD was below 150 days. The non-sorted polygons site exhibited the greatest SCD variability: in the first four seasons, values ranged between 136 and 178 days, while in the last two seasons they dropped to 84 and 79 days. In contrast, the ploughing boulder site displayed a very uniform SCD regime in five of the six seasons, with values ranging from 171 to 180 days; only in 2018–2019 did values deviate to 150 days.
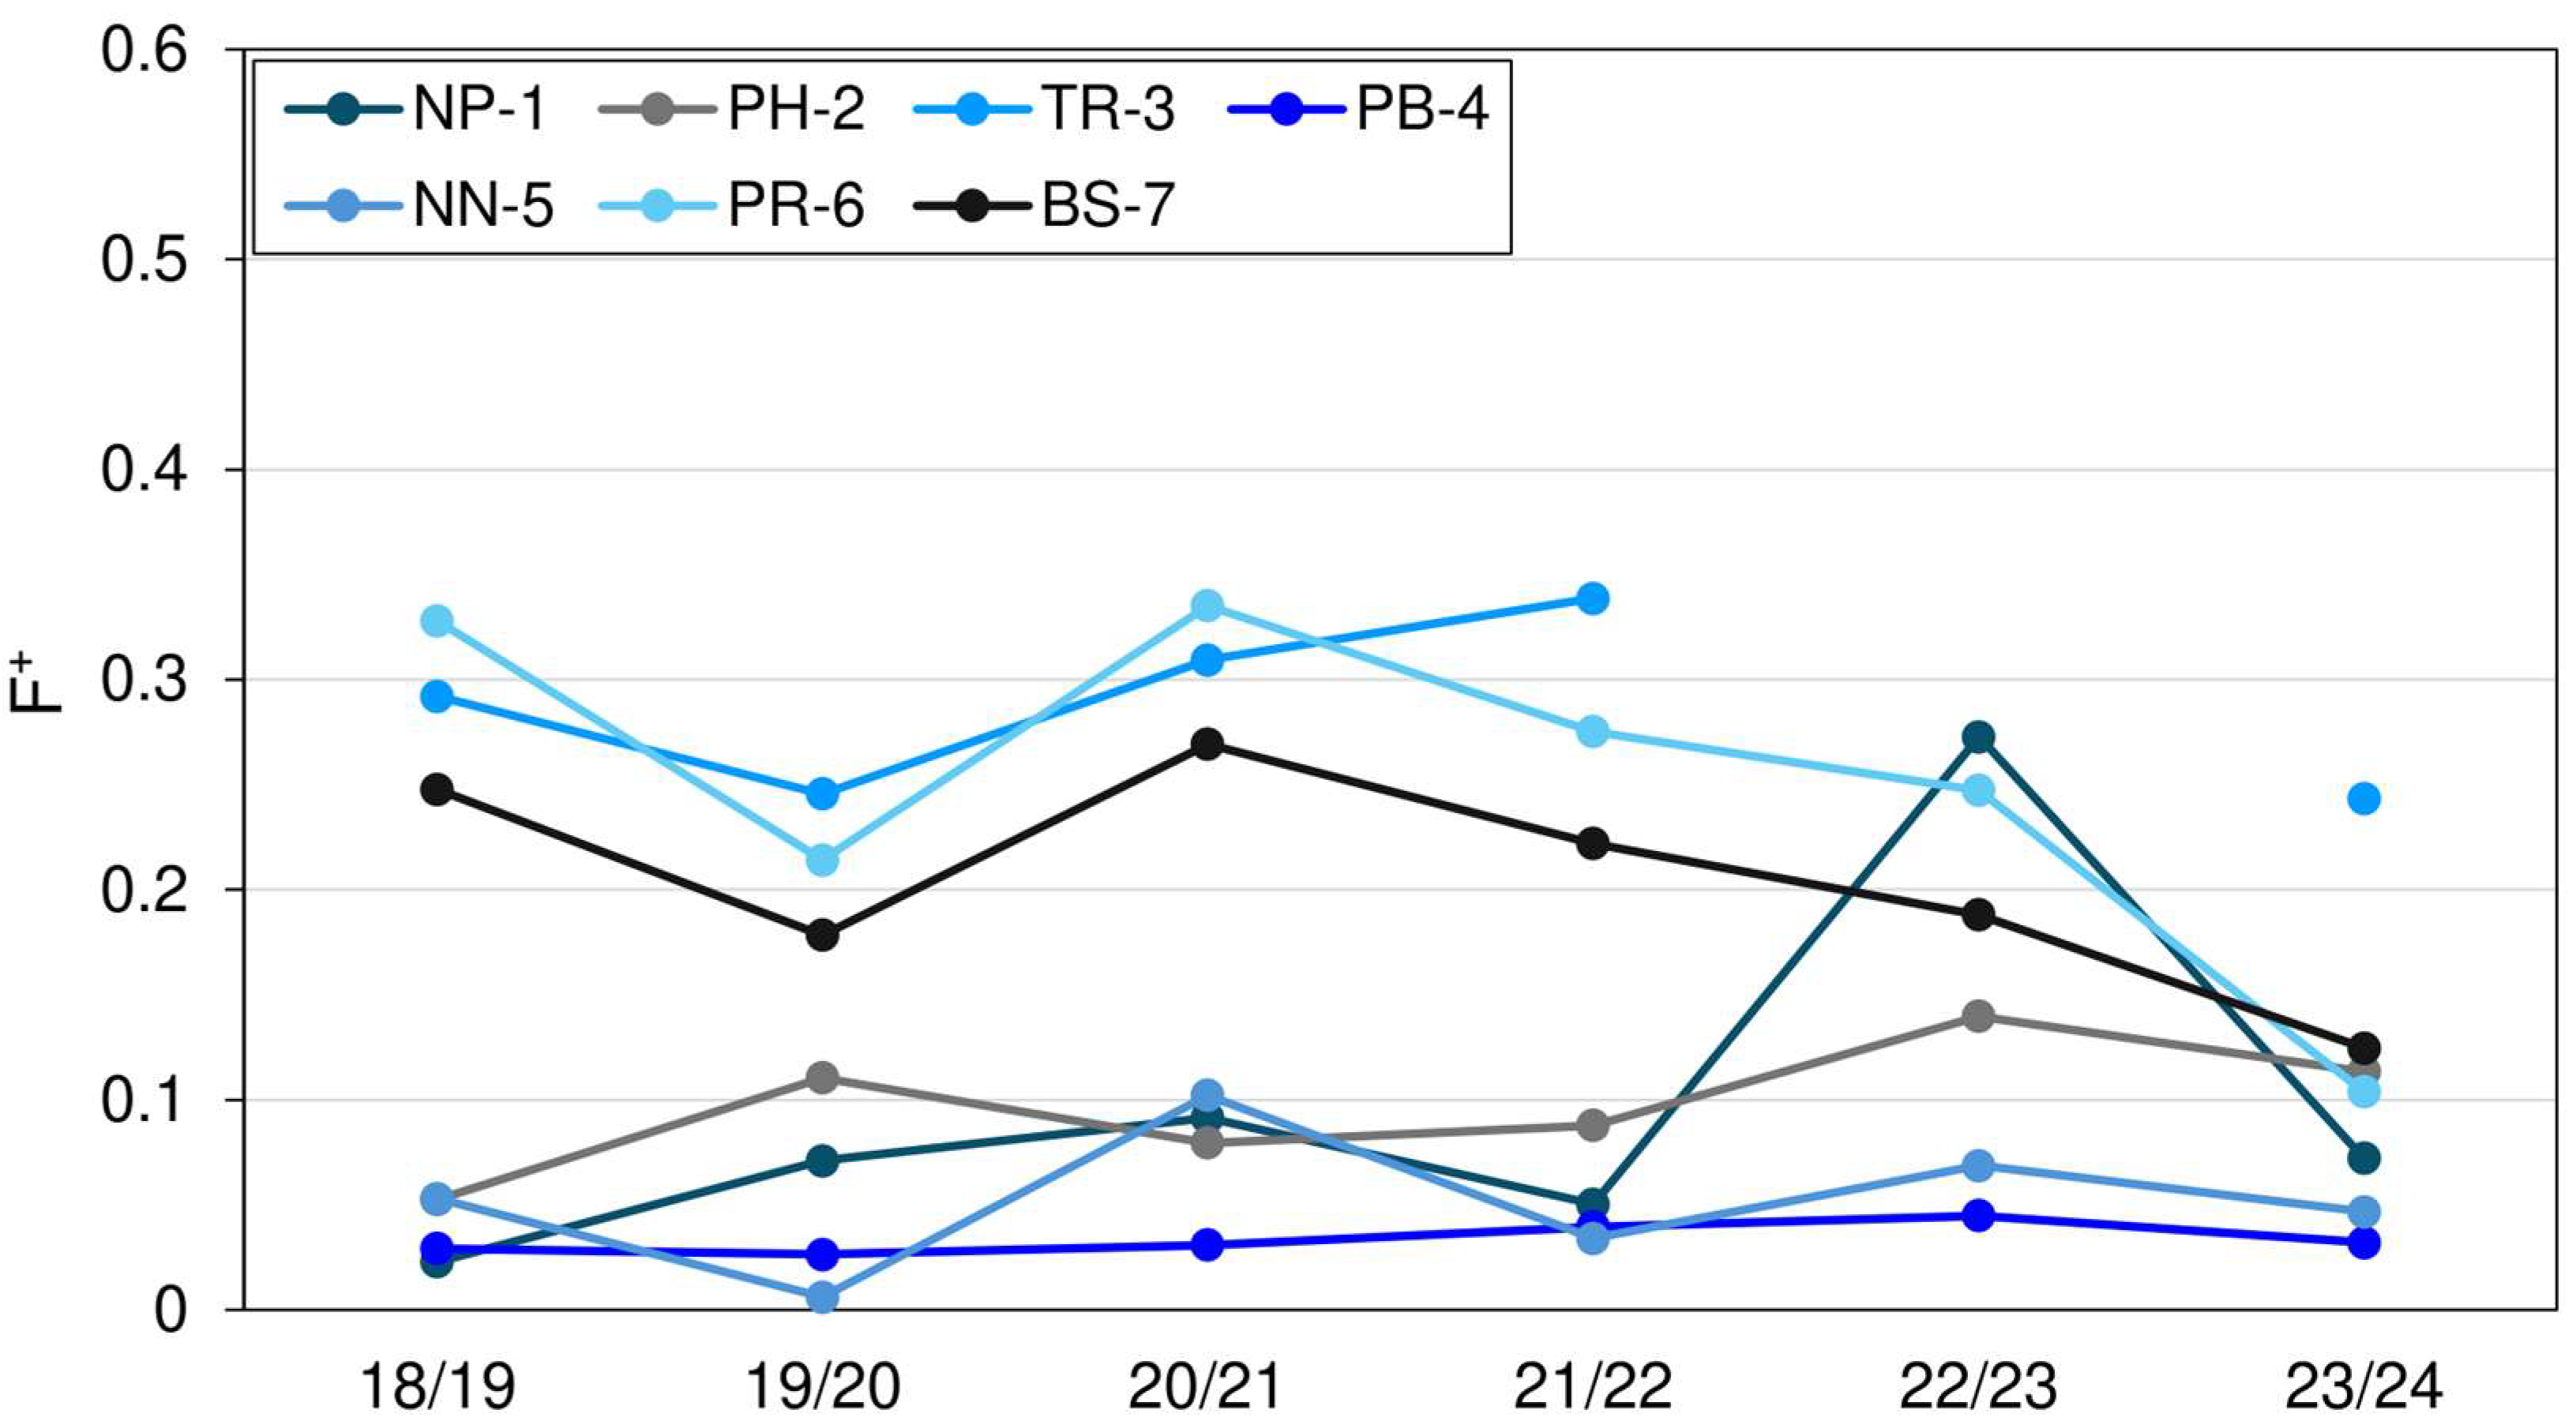
According to the F+ index, the potential for sporadic permafrost occurrence at all seven sites is low, as values do not exceed 0.5 (Figure 11). The highest mean F+ values (between 0.2 and 0.3) were recorded at periglacial tor, protalus rampart and block stream sites. At protalus rampart site, the F+ index exceeded 0.3 during 2018–2019 and 2020–2021, while at TR-3 it surpassed 0.3 in 2020–2021 and 2021–2022. At four sites F+ index does not reach 0.1 indicating dominant thawing conditions. The highest mean F+ values across all seven sites were recorded in 2020–2021.
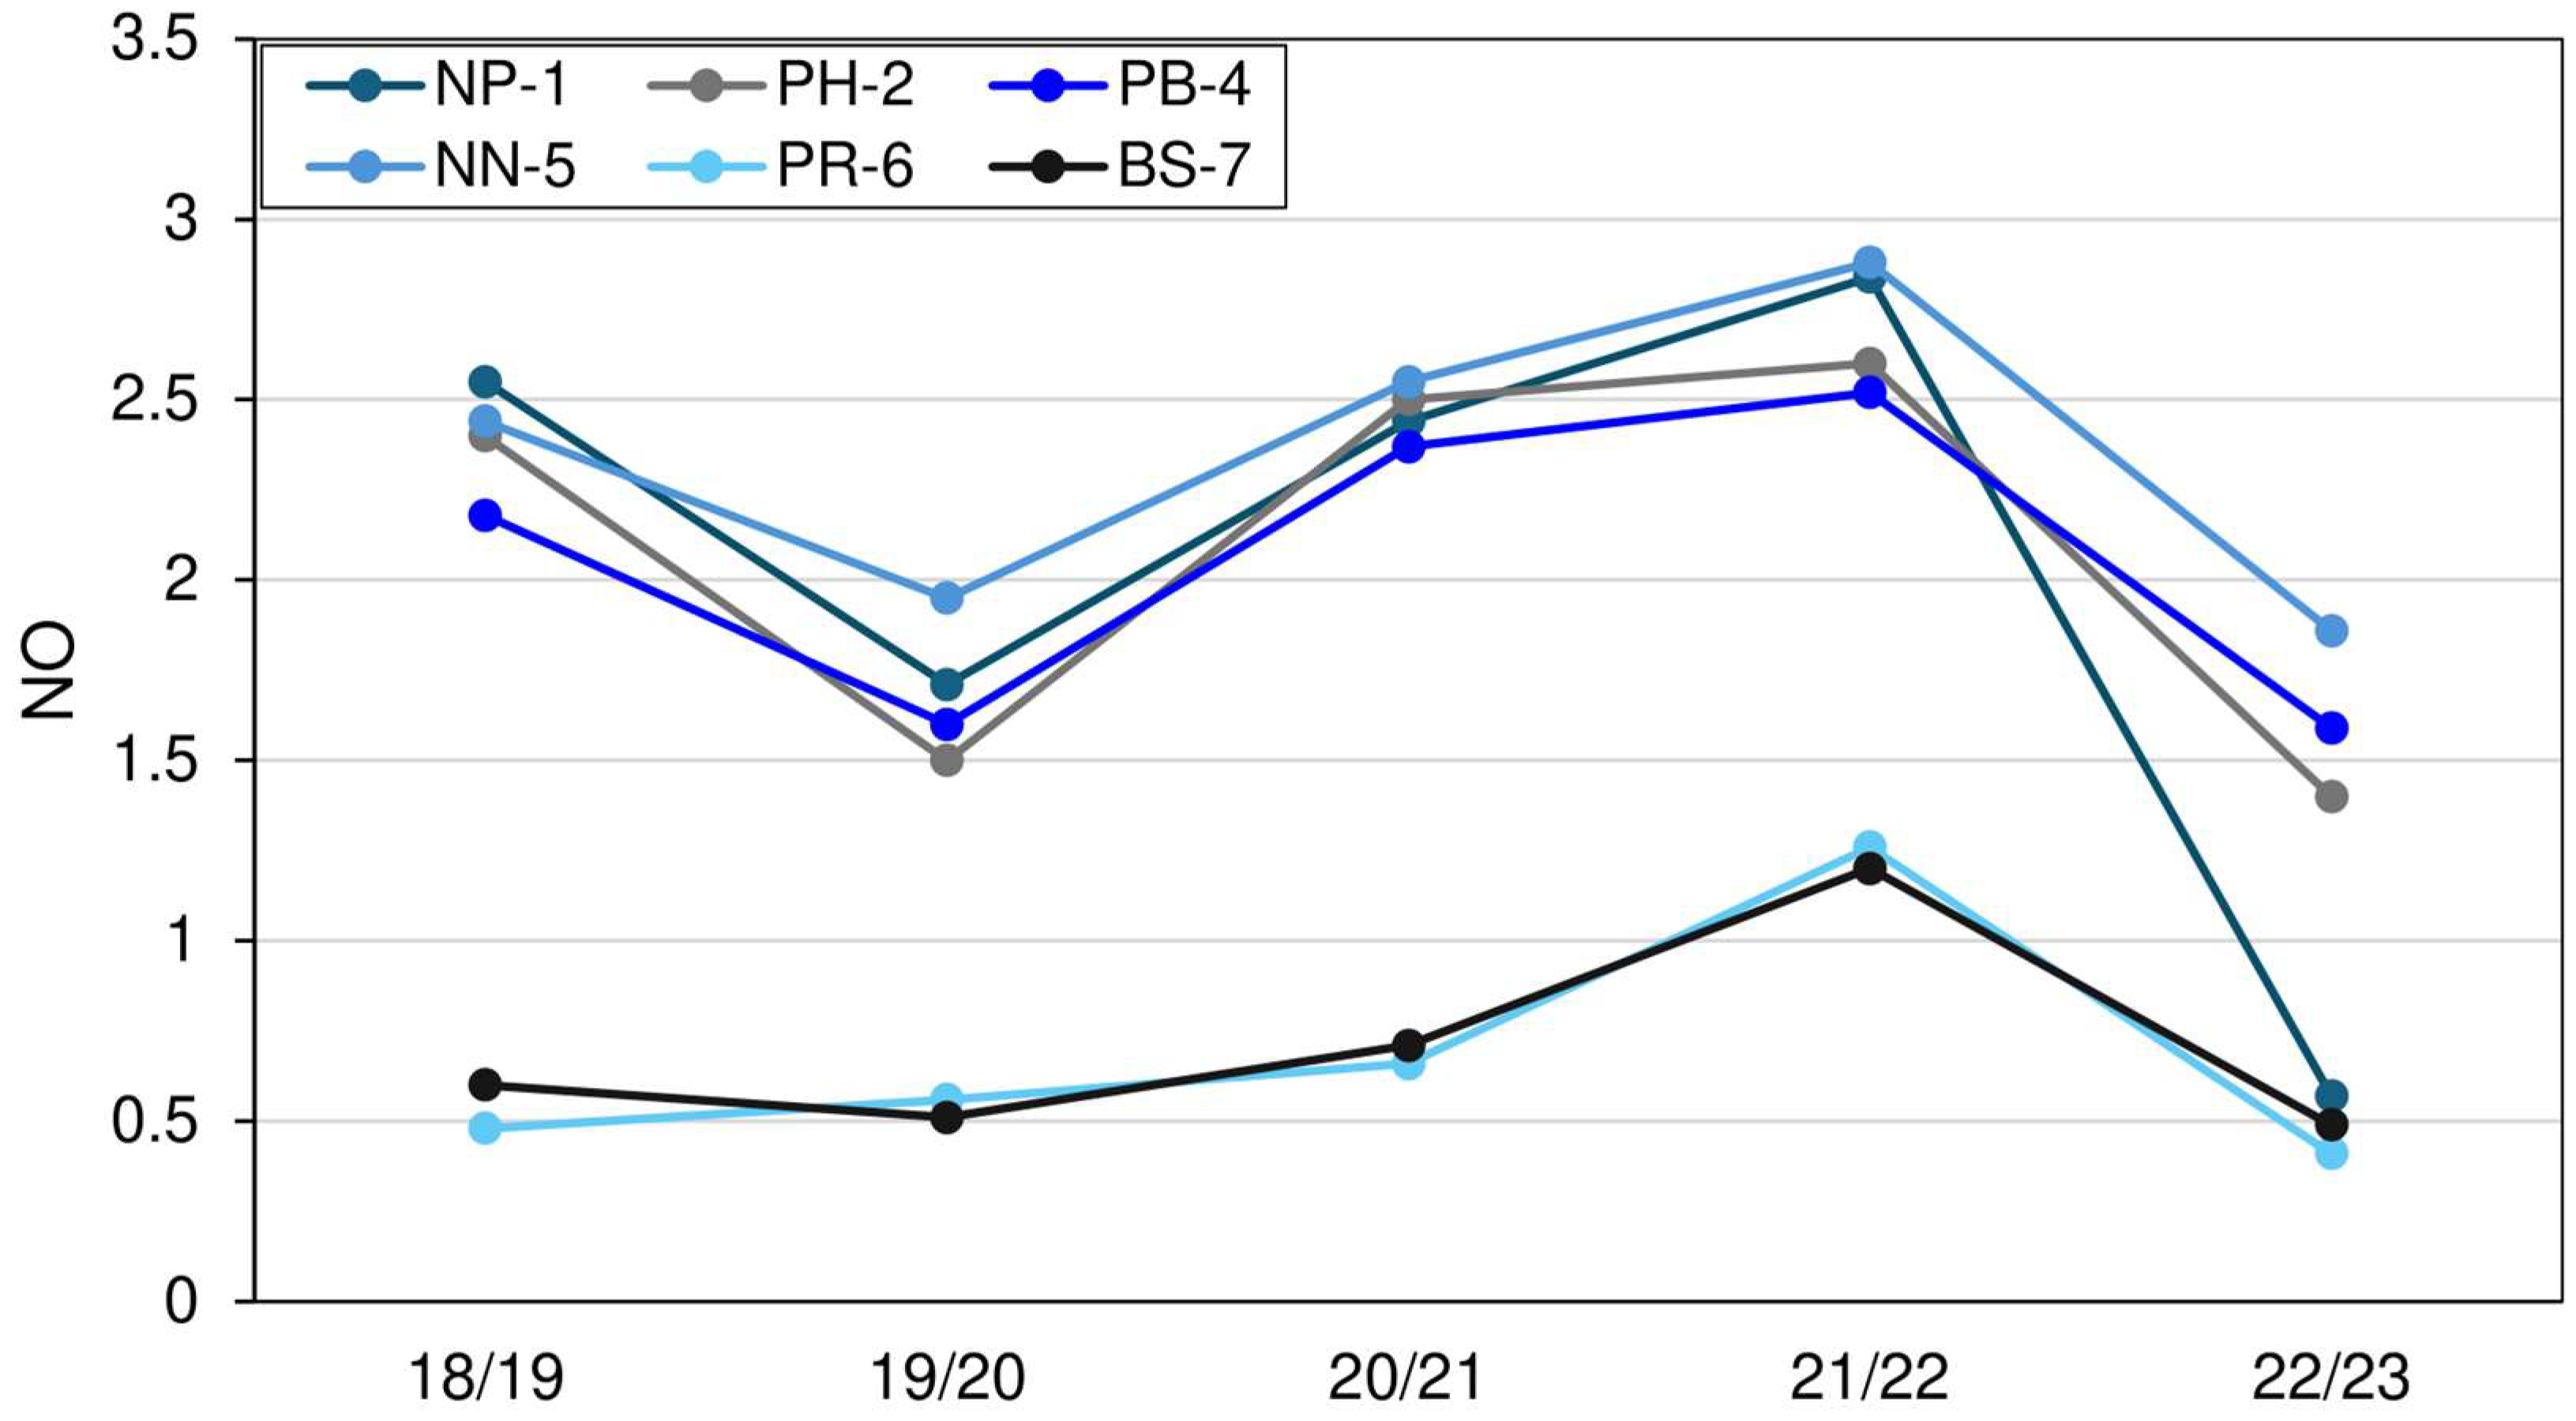
Figure 12 illustrates the insulating effect of snow on GST at six sites. Nival offset values are considerably lower at the protalus rampart and block stream sites, where snow cover duration is generally shorter. Apart from the 2021–2022 season, NO values ranged between 0.4 and 0.7 at these two sites. At sites with fine-grained sediments, snow insulation is substantially stronger, with maximum values exceeding 2. As expected, the highest NO values were recorded at the nival niche site, ranging from 1.86 to 2.88. The 2018–2019 and 2021–2022 seasons showed the highest mean values, while 2019–2020 and 2022–2023 were marked by a decline.

4. Discussion

Since the late 19th century, global warming has caused a temperature increase of approximately 1.5 °C [37]. Assuming a similar trend in the study area, the mean annual air temperature (MAAT) around the Țarcu Weather Station—now about 0 °C—would have been roughly −1.5 °C in the pre-industrial period. The 0.8 °C warming observed over the past three decades relative to the 1961–1990 baseline supports this estimate. This recent warming corresponds to a reduction of 14 frost days per year in the last three decades and likely nearly twice that compared to the late 19th century. As a result, periglacial process intensity has likely declined over the past century in the Southern Carpathians [13].
The long-term evolution of freezing and thawing degree days indicates a positive trend in the ground surface heat balance within the study area. These indices suggest that current climatic conditions are no longer favorable for the development or preservation of permafrost at elevations between 1900 and 2200 m in this sector of the Southern Carpathians. However, climatic conditions prior to 1990 likely supported the sporadic occurrence of permafrost at the Țarcu weather station. Recent studies indicate that isolated permafrost in the Southern Carpathians is confined to coarse debris deposits above 2000 m, where intense cooling is facilitated by internal air circulation and ventilation [15]. Model predictions indicate that permafrost in the Țarcu Massif is likely restricted to specific areas such as the Căleanu Peak (2190 m a.s.l.), areas in several glacial cirques, as well as blockfields with northern and western aspects at approximately 2000 m [15]. Based on GST measurements at the NP-1 site, located on the Căleanu Plateau near the summit, permafrost occurrence appears unlikely. In contrast, the PR-6 and BS-7 sites—where data loggers were installed within porous, openwork debris—recorded winter equilibrium temperatures (WEqT) indicative of permafrost conditions in several years. At both sites, WEqT values consistently dropped below −2 °C during late winter in all seasons except the most recent one. However, this method lacks sufficient precision in dry, bouldery terrains where subsurface air circulation through convection and advection influences ground thermal regimes. Furthermore, analysis of MAGST and GFI values at these two sites suggests an absence of permafrost when compared to other locations in the Southern Carpathians where isolated permafrost has been confirmed. Nonetheless, the presence of permafrost in coarse debris deposits—particularly within rock glaciers located between 1900 and 2200 m in this mountain range—cannot be ruled out.
The role of coarse blocks in controlling ground temperatures in periglacial regions has been frequently addressed [38,39,40,41]. It is generally accepted that internal ventilation within coarse blocks, which contain abundant air spaces, facilitates ground cooling, leading to the development of a thermal offset in these openwork structures [42]. At sites with thin or absent snow cover, intense ground cooling due to efficient winter convection occurs primarily at the beginning of the cold season. As snow accumulates, cold air can still penetrate through snow funnels, and advective heat fluxes—commonly referred to as the ‘chimney effect’—continue to contribute significantly to surface cooling [43]. When the air–coarse debris temperature gradient is large enough to enhance convection, ground ice forms within the porous material and may persist for some years in the ground [44]. Due to internal cold-air circulation within blocky layers, very low ground-surface temperatures can be recorded, sometimes well below −2 or −3 °C, which is commonly considered the threshold for permafrost presence. Such low temperatures may occur even at sites without permafrost, particularly in well-ventilated debris experiencing intense ground cooling. To avoid misinterpretation, it is highly recommended to supplement GST measurements with additional methods, such as drillings or geophysical surveys. The bottom temperature of the winter snow-cover method [29] offers an alternative approach for mapping permafrost, but it is effective only under optimal snow conditions. This method has the advantage of distinguishing colder ground-surface areas from warmer ones and provides a better understanding of energy exchange fluxes among the ground, permafrost, air, and snow [15]. However, in marginal periglacial regions such as the Southern Carpathians, short-term permafrost driven by convective cooling may also occur as a transitional phase toward non-permafrost conditions [44].
The effectiveness of frost action—particularly processes such as frost cracking—is largely controlled by the frequency of freeze–thaw cycles. When water is present in the ground, freeze–thaw cycles cause repeated expansion and contraction of the substrate, leading to the breakdown of rocks and soil [1]. Over time, this process drives the development of patterned ground features (e.g., sorted circles, stone polygons, non-sorted polygons, etc.) alongside frost-shattered debris, shaping a characteristic periglacial landscape. Notably, the frequency of these cycles in the ground can differ substantially from that observed in the air. For example, at the Țarcu weather station, approximately 73 days with FTC are recorded annually in the air, whereas only about 17 days per year are observed at the rock surface (TR-3). In the ground, at depths of 0.1 m, the number of FTC days ranges from just 4 to 15, highlighting a pronounced thermal damping effect with increasing depth. Contrary to expectations under rising air temperatures, the long-term trend in the number of FTC days does not show a consistent decline at Țarcu weather station. FTC also play a crucial role in driving frost creep and frost heave—periglacial processes observed at the study site that contribute to the present-day dynamics of solifluction lobes, ploughing boulders, patterned ground, and block streams. In a previous study in Țarcu Massif [13], monitoring during the 2010–2011 season recorded 22 freeze–thaw cycles (FTCs) in a periglacial tor located a few hundred meters from the TR-3 site, and 47 FTC days at the NP-1 site at 10 cm depth, with 45 recorded at 30 cm depth. In comparison, the number of FTC days recorded during the 2018–2024 interval is considerably lower at both locations, suggesting a reduction in FTC frequency over the past decade at these sites.
The analysis of climate change impacts on the Frost Weathering Index (FWI) indicates a clear decline in the number of days favorable for frost cracking at the Țarcu weather station. Similar findings have been reported for alpine rock surfaces in the Austrian Alps [45]. The highest FWI values were recorded at site TR-3, where conditions conducive to frost cracking occur on 63 to 99 days per year. However, the data also reveals substantial interannual variability, primarily influenced by snow cover conditions. A striking example is site PR-8, where the FWI dropped from 121 days in the 2018–2019 season to just 3 days in 2023–2024.
Except for TR-3, the thermal behavior at all monitoring sites is largely governed by snow cover. The GST regimes highlighted in this study emphasize the critical role of snow cover depth, timing, and duration. The interplay between winter snow cover dynamics and ground thermal conditions exerts a complex influence on both the duration of the frost-cracking window and the frequency of freeze–thaw cycles. An early onset of snow cover during the cold season insulates the ground and inhibits the penetration of cold air, resulting in limited variation in ground surface temperature (GST) beneath a thick snowpack. This insulating effect is observed at most sites, with the exception of BS-7, where cooling persists due to subsurface air convection and advection within the coarse debris. Conversely, at the onset of the warm season, a prolonged snow cover delays ground warming, as observed at sites like NN-5. The relatively long duration of the zero-curtain period (ZCP) indicates that, at most sites, snow cover is sufficiently thick to insulate the ground.
The analysis of the nival offset parameter further emphasizes the stronger insulating effect of snow cover at fine-grained sites. At coarse-grained sites, snow provides limited insulation, as the abundance of boulders promotes ground cooling through processes such as air convection and advection. In years with thin snow cover, protruding boulders enhance ground cooling by facilitating thermal conduction. In Canada, NO values are strongly linked to latitude and MAAT, ranging from 0 to nearly 6 [34]; at sites with positive MAAT, most values fall between 2 and 4 [34]. In comparison, values in the Southern Carpathians are slightly lower at fine-grained sites, generally ranging between 1.5 and 2.5.
Despite the high interannual variability, the number of snow-covered days at the Țarcu weather station has declined, particularly after 2000. For the effectiveness of frost-related processes, the delayed onset of snow cover observed in recent decades has had a positive impact by allowing more intense ground cooling during early winter. Conversely, earlier snowmelt in the warm season has accelerated the thawing of seasonally frozen ground and shortened the duration of frost conditions. From a geomorphological perspective, persistent snow patches promote snow creep and snowmelt runoff, contributing to the formation of cryo-nival landforms such as nivation depressions, pronival ramparts, and snow-push moraines. The prolonged presence of snow cover inhibits vegetation colonization and enhances denudational surface processes such as sheet erosion and gully development.
Rainfall impacts the thermal regime of the ground by increasing soil moisture and heat transfer, slowing frost penetration through latent heat release during freezing, and enhancing soil thermal conductivity and heat capacity [4]. Increased summer rainfall can induce deeper warming of the active layer, while in winter, rain-on-snow events often reduce snowpack persistence and expose the ground to stronger cooling or warming, depending on subsequent weather conditions [46]. More broadly, changes in the ratio of snowfall to rainfall have been recognized to alter permafrost dynamics, as a shift towards more liquid precipitation reduces the protective snow cover, modifies freeze–thaw cycles, and accelerates permafrost degradation [47]. Numerical modeling of future permafrost thermal conditions suggests a potential warming effect at the regional scale due to increased rainfall [48]. On the other hand, a crucial factor in the amplitude of periglaciation is soil moisture, as it governs the formation of segregation ice within the substrate [14]. Consequently, when soil moisture content is high—whether due to abundant precipitation or snowmelt—the effectiveness of diurnal freezing increases, resulting in higher rates of geomorphic activity [49]. Additionally, the presence of moisture in rock fractures promotes frost cracking [50].
Annual precipitation at Țarcu between 1961 and 2023 shows no significant long-term trend. The linear regression slope is +0.76 mm year−1, but the relationship is very weak (R2 = 0.003) and statistically non-significant (p = 0.68). Mean annual precipitation over the period is 994 mm, with values ranging from a minimum of 554 mm to a maximum of 1681 mm, indicating considerable interannual variability. Thus, while year-to-year fluctuations are large, there is no robust long-term trend in total annual precipitation. At the seasonal scale, winter precipitation shows a near-significant increase of 13 mm per decade, while summer precipitation displays a decrease of 16 mm per decade. Such variability, without a clear long-term trend in annual totals, suggests that the influence of precipitation on the ground thermal regime may be driven more by seasonal distribution and type (snow vs. rain) than by overall amounts. The tendency toward wetter winters may reinforce the insulating role of the snowpack but also increase the frequency of rain-on-snow events that can reduce snow persistence and alter soil freezing. Conversely, the tendency toward drier summers implies lower soil moisture which may limit evaporative cooling and favor greater summer heat penetration into the subsurface.
This study presents the longest high-resolution ground temperature dataset for periglacial landforms in the Southern Carpathians. Previous studies reported only short monitoring periods (1–3 years), focusing mainly on rock glaciers or rock walls. The results of this study offer valuable insights into the periglaciation of the alpine belt in the region. Building on earlier work by [13,16,51,52], a synthetic table was developed to summarize the main thermal characteristics of active periglacial processes and landforms in the Southern Carpathians (Table 4). Using several frost-related parameters, the periglacial environment was classified by surface type into two main belts: the Upper and Lower Periglacial zones. The recorded temperature data were then used to link active periglacial processes with specific landforms, highlighting the distinct characteristics of periglaciation in this mountainous region.
Ground surface temperature records from the Carpathians address a critical gap in global periglacial monitoring networks, as Southeastern Europe has received little attention despite the high sensitivity of its marginal periglacial environments to rising air temperatures [13]. Consequently, the present results enrich the global picture of cryosphere ‘health’, which is often based on spatially incomplete and temporally inconsistent datasets. By documenting GST variability across different landforms, the study also offers transferable insights for similar geomorphological contexts in other mountain ranges worldwide. Comparable periglacial conditions occur in other temperate and mid-latitude European mountain ranges (e.g., Pyrenees or Alps), making the Carpathian dataset a valuable reference point for cross-regional comparisons. In such environments, negative MAGST values generally indicate the presence of permafrost, although permafrost may still occur under boundary conditions where MAGST is slightly above zero. In the Swiss Alps, the permafrost–no-permafrost boundary was estimated at an MAGST of 1.5–2 °C [53], while in Southern Norway it can exceed 2 °C [54], and in the High Atlas it may reach up to 3.2 °C [55]. In coarse-grained sediments of the Țarcu Mountains, MAGST values range between 1.5 and 3 °C, although further investigations are needed to confirm permafrost presence. Similar environments in the Iberian Mountains exhibit comparable seasonal freezing characteristics to those observed in this study [8]. In the Cantabrian Mountains, ground freezing degree days (FDDg) range from 200 at lower elevations to 400 in the upper periglacial belt, with a relatively small number of freeze–thaw cycles (0–18) [8]. The number of frost days in the Picos de Europa is generally lower, ranging from 80 to 138 [8], whereas in the Țarcu Mountains all sites recorded more than 170 frost days per year. Regarding rock walls, studies in the Austrian Alps reported 0 to 44 freeze–thaw cycles per year [45], whereas at the periglacial tor studied here, our analyses indicate a narrower range of 15–20 cycles annually.
Longer monitoring periods are required to capture the influence of climate change on periglaciation in the Southern Carpathians. In contrast, studies from other European mountain ranges with longer time series have already revealed a statistically significant decrease in ground surface temperatures [45,56]. Furthermore, statistical modelling predicts a 72% reduction in the current periglacial realm in northern Europe by 2050, with many active periglacial processes expected to become relict [57]. The transition from active to relict periglacial states in the Southern Carpathians will have important geomorphic and ecological consequences. As permafrost and seasonal ground ice degrade, formerly active landforms such as rock glaciers, block streams, talus slopes, solifluction and patterned ground are likely to stabilize, but in parallel, the loss of ice as a bonding agent may enhance rock wall instability, debris flows, and other slope hazards [58]. Ecologically, the disappearance of cold microhabitats and seepage zones may reduce refugia for cold-adapted alpine species [59]. A wide range of microbes, plants, and animals rely on cold habitats such as active periglacial landforms for their persistence [60]. As these landforms become inactive, they may gradually be colonized by shrubs and forests, driving shifts in alpine biome composition and distribution [13]. In the socio-environmental context of the Southern Carpathians, such changes may affect local water resources, biodiversity conservation, traditional grazing activities, and mountain tourism, highlighting the role of this region as an early-warning sentinel of climate-driven transformations in marginal periglacial environments.

5. Conclusions

This study offers a detailed assessment of ground surface thermal regimes and their significance for periglacial processes in the alpine zone of the Țarcu Massif, Southern Carpathians. While less intense than in the late Pleistocene, periglacial activity persists above 2000 m. The results clearly indicate a sustained rise in air temperatures over recent decades, with a notable acceleration since 1995. This warming trend is further supported by the combined analysis of freezing and thawing degree days, net thermal balance, and the F+ index, all of which point to increasingly dominant thawing conditions and reduced climatic suitability for sporadic permafrost at the Țarcu meteorological station since the late 1990s. Additionally, a decline in both frost days and the frost weathering interval further underscores the diminishing intensity of frost-driven processes in the area.
Ground temperature data collected between 2018 and 2024 across various landforms revealed considerable spatial and temporal variability, influenced by substrate, microtopography, and snow cover dynamics. All relevant frost indices analyzed (FDDg, FWI, FTC FD and F+) show a consistent decline, indicating reduced intensity and duration of frost-driven processes. This trend is most pronounced in fine-grained, vegetated sites with higher mean annual ground temperatures and minimal frost activity. In contrast, coarse debris landforms like protalus ramparts and block streams maintain lower winter ground temperatures and higher frost weathering potential. These sites occasionally display thermal characteristics suggestive of isolated permafrost, but most probable, the low temperature in late winter are due to internal air circulation and ventilation (e.g., convective and advective fluxes) rather than conductive processes. Even so, the possibility of isolated permafrost persisting in coarse, well-ventilated debris at high elevations (e.g., rock glaciers) cannot be fully excluded without further geophysical investigation.
The frequency of freeze–thaw cycles shows high interannual variability but generally remains low—typically below 20 cycles per year. In contrast, the potential for frost cracking remains high at sites such as the periglacial tor, protalus rampart and block stream, where conditions favorable for frost cracking occur on more than 50 days per year. The high number of frost days—exceeding 170 days annually at all sites—suggest that periglacial conditions still operate for nearly half the year around 2000 m in the Southern Carpathians. Snow cover dynamics emerged as a key control on ground thermal behavior, with earlier snowmelt and delayed onset shortening the duration, but enhancing the effectiveness of early winter cooling.
In conclusion, the Țarcu Massif exemplifies the transitional nature of mid-latitude periglacial environments under current climate conditions. As warming continues, active periglacial processes are expected to decline further, and many currently dynamic landforms may evolve into relict features. Long-term ground temperature monitoring remains essential for detecting and interpreting these changes, refining permafrost modeling in the Carpathians, and assessing the broader geomorphic impacts of climate change in mountains regions.

Author Contributions

Conceptualization: F.A., O.B., A.O.; Methodology: F.A., O.B., P.C.; Formal Analysis: F.A., O.B., P.C., R.M.; Data Acquisition: F.A., O.B., P.C., A.A.; Data Preparation and Analysis: F.A., O.B., P.C., R.M.; Writing—Original Draft Preparation: F.A., O.B., P.C.; Writing—Review and Editing: F.A., O.B., A.O.; Maps & Figures: F.A., O.B., P.C.; Funding Acquisition: A.O. All authors have read and agreed to the published version of the manuscript.

Funding

This work was supported by a grant of the Ministry of Research, Innovation and Digitization, CNCS-UEFISCDI, project number PN-IV-P2-2.1-TE-2023-0603, within PNCDI IV and by PNRR-III-C9 2022-I8, CF 253/29.11.2022, project 760055/23.05.2023 (ChronoCaRP).

Data Availability Statement

The data presented in this study are available upon reasonable request from the authors.

Acknowledgments

We also thank Adriana Sărășan, Andrei Ioniță and Iosif Lopătiță for their invaluable assistance and support during field data collection.

Conflicts of Interest

The authors declare no conflicts of interest.

References

  1. French, H.M. The Periglacial Environment, 3rd ed.; Wiley: Chichester, UK, 2007; 458p. [Google Scholar]
  2. Harris, S.A.; French, H.M.; Heginbottom, J.A.; Johnston, G.H.; Ladanyi, B.; Sego, D.C.; van Everdingen, R.O. Glossary of Permafrost and Related Ground-Ice Terms; National Research Council of Canada: Ottawa, ON, Canada, 1988; 156p. [Google Scholar]
  3. Oliva, M.; Fernández-Fernández, J.M.; Nývlt, D. The Periglaciation of Europe. In Periglacial Landscapes of Europe; Oliva, M., Nývlt, D., Fernández-Fernández, J.M., Eds.; Springer: Cham, Germany, 2022. [Google Scholar] [CrossRef]
  4. Washburn, A.L. Geocryology: A Survey of Periglacial Processes and Environments; Edward Arnold: London, UK, 1979; 406p. [Google Scholar]
  5. Yang, B.; Duan, Y.; Zhao, J.; Tan, C.; Gesang, J.; Chen, L.; Zhao, Y.; Zhang, X. Response of soil hydrothermal processes within the active layer to variable alpine vegetation in the Yangtze River Source Area, Qinghai-Tibet Plateau. J. Hydrol. Reg. Stud. 2024, 54, 101850. [Google Scholar] [CrossRef]
  6. Guo, H.-X.; Zhu, W.-Q.; Xiao, C.-D.; Zhao, C.-L.; Chen, L.-Y. The freezing-thawing index and permafrost extent in pan-Arctic experience rapid changes following the global warming hiatus. Adv. Clim. Change Res. 2025, 16, 350–360. [Google Scholar] [CrossRef]
  7. Ferreira, A.; Vieira, G.; Ramos, M.; Nieuwendam, A. Ground temperature and permafrost distribution in Hurd Peninsula (Livingston Island, Maritime Antarctic): An assessment using freezing indexes and TTOP modelling. Catena 2017, 149, 560–571. [Google Scholar] [CrossRef]
  8. Pisabarro, A.; Pellitero, R.; Serrano, E.; Gómez-Lende, M.; González-Trueba, J.J. Ground temperatures, landforms and processes in an Atlantic Mountain: Cantabrian Mountains (Northern Spain). Catena 2017, 149, 623–636. [Google Scholar] [CrossRef]
  9. Baptista, J.; Vieira, G.; Lee, H. Ground surface temperature regimes are controlled by the topography and snow cover in the ice-free areas of Maritime Antarctica. Catena 2024, 240, 107947. [Google Scholar] [CrossRef]
  10. Biskaborn, B.K.; Smith, S.L.; Noetzli, J.; Matthes, H.; Vieira, G.; Streletskiy, D.A.; Schoeneich, P.; Romanovsky, V.E.; Lewkowicz, A.G.; Abramov, A.; et al. Permafrost is warming at a global scale. Nat. Commun. 2019, 10, 264. [Google Scholar] [CrossRef] [PubMed]
  11. GTN-P. Global Terrestrial Network for Permafrost Metadata for Active Layer Monitoring (CALM) Sites [Dataset]; PANGAEA: Bremen, Germany, 2015. [Google Scholar] [CrossRef]
  12. PERMOS. Swiss Permafrost Bulletin 2024; Noetzli, J., Pellet, C., Eds.; PERMOS: Zürich, Switzerland, 2025; Volume 6, 29p. [Google Scholar]
  13. Onaca, A.; Urdea, P.; Ardelean, A.C.; Șerban, R.; Ardelean, F. Present-day periglacial processes in the alpine zone. In Landform Dynamics and Evolution in Romania; Rădoane, M., Vespremeanu-Stroe, A., Eds.; Springer Geography: Cham, Germany, 2017; pp. 147–176. [Google Scholar]
  14. Onaca, A. Procese și Forme Periglaciare din Carpații Meridionali. Abordare Geomorfologică și Geofizică/Periglacial Processes and Landforms from the Southern Carpathians: A Geomorphological and Geophysical Approach; Editura Universității de Vest din Timișoara: Timișoara, Romania, 2017; 264p. [Google Scholar]
  15. Popescu, R.; Filhol, S.; Etzelmüller, B.; Vasile, M.; Pleșoianu, A.; Vîrghileanu, M.; Onaca, A.; Șandric, I.; Săvulescu, I.; Cruceru, N.; et al. Permafrost distribution in the Southern Carpathians, Romania, derived from machine learning modeling. Permafr. Periglac. 2024, 35, 243–261. [Google Scholar] [CrossRef]
  16. Vasile, M.; Vespremeanu-Stroe, A.; Popescu, R. Air versus ground temperature data in the evaluation of frost weathering and ground freezing: Examples from the Romanian Carpathians. Rev. Geomorfol. 2014, 16, 61–70. [Google Scholar]
  17. IPCC. Climate Change 2021: The Physical Science Basis. In Contribution of Working Group I to the Sixth Assessment Report of the Intergovernmental Panel on Climate Change *; Masson-Delmotte, V., Zhai, P., Pirani, A., Connors, S.L., Chen, Y., Goldfarb, L., Gomis, M.I., Matthews, J.B.R., Berger, S., Huang, M., et al., Eds.; IPCC: Geneva, Switzerland, 2021; Available online: https://www.ipcc.ch/report/ar6/wg1/downloads/report/IPCC_AR6_WGI_SummaryVolume.pdf (accessed on 10 March 2025).
  18. Niculescu, G. Relieful glaciar din Munții Țarcu. Stud. Cercet. Geogr. 1990, 37, 43–52. [Google Scholar]
  19. Urdea, P.; Ardelean, F.; Ardelean, M.; Onaca, A. Chapter 14—Glacial landscapes of the Romanian Carpathians. In European Glacial Landscapes: Maximum Extent of Glaciations; Palacios, D., Hughes, P.D., Garcia-Ruiz, J.M., de Andres, N., Eds.; Elsevier: Amsterdam, The Netherlands, 2022; pp. 109–114. [Google Scholar]
  20. Kuhlemann, J.; Dobre, F.; Urdea, P.; Krumrei, I.; Gachev, E.; Kubik, P.; Rahn, M. Last glacial maximum glaciation of the central South Carpathian Range (Romania). Aust. J. Earth Sci. 2013, 106, 83–95. [Google Scholar]
  21. Ruszkiczay-Rüdiger, Z.; Kern, Z.; Urdea, P.; Braucher, R.; Madarasz, B.; Schimmelpfennig, I. Revised deglaciation history of the Pietrele–Stânișoara glacial complex, Retezat Mts, Southern Carpathians, Romania. Quat. Int. 2016, 415, 216–229. [Google Scholar] [CrossRef]
  22. Ruszkiczay-Rüdiger, Z.; Kern, Z.; Urdea, P.; Madarasz, B.; Braucher, R. Limited glacial erosion during the last glaciation in mid-latitude cirques (Retezat Mts, Southern Carpathians, Romania). Geomorphology 2021, 384, 107719. [Google Scholar] [CrossRef]
  23. Kern, Z.; Urdea, P.; Ardelean, M.; ASTER Team; Ruszkiczay-Rüdiger, Z. Updated chronology of the last deglaciation in the Făgăraș Mts. (Romania). Geosciences 2025, 15, 109. [Google Scholar] [CrossRef]
  24. Haberkorn, A.; Hoelzle, M.; Phillips, M.; Kenner, R. Snow as a driving factor of rock surface temperatures in steep rough rock walls. Cold Reg. Sci. Technol. 2015, 118, 64–75. [Google Scholar] [CrossRef]
  25. Delaloye, R. Contribution à L’étude du Pergélisol de Montagne en Zone Marginale. Ph.D. Thesis, University of Fribourg, Fribourg, Switzerland, 2004; 244p. [Google Scholar]
  26. Ribolini, A.; Fabre, D. Permafrost existence in rock glaciers of the Argentera Massif, Maritime Alps, Italy. Permafr. Periglac. Process. 2006, 17, 49–63. [Google Scholar] [CrossRef]
  27. Hales, T.C.; Roering, J.J. Climatic controls on frost cracking and implications for the evolution of bedrock landscapes. J. Geophys. Res. 2007, 112, F02033. [Google Scholar] [CrossRef]
  28. Schoeneich, P. Guide Lines for Monitoring GST—Ground Surface Temperature, Permanent Project. Version 3. 2 February 2011. Available online: https://www.permanet-alpinespace.eu/archive/pdf/GST.pdf (accessed on 20 April 2025).
  29. Haeberli, W. Die Basis-Temperatur der winterlichen Schneedecke als möglicher Indikator für die Verbreitung von Permafrost in den Alpen. Z. Gletscherkd. Glazialgeol. 1973, 9, 221–227. [Google Scholar]
  30. Hoelzle, M.; Mittaz, C.; Etzelmüller, B.; Haeberli, W. Surface energy fluxes and distribution models of permafrost in European mountain areas: An overview of current developments. Permafr. Periglac. Process. 2001, 12, 53–68. [Google Scholar] [CrossRef]
  31. Outcalt, S.I.; Nelson, F.E.; Hinkel, K.M. The zero-curtain effect: Heat and mass transfer across an isothermal region in freezing soil. Water Resour. Res. 1990, 26, 1509–1516. [Google Scholar] [CrossRef]
  32. Staub, B.; Hasler, A.; Noetzli, J.; Delaloye, R. Gap-filling algorithm for ground surface temperature data measured in permafrost and periglacial environments. Permafr. Periglac. Process. 2016, 28, 275–285. [Google Scholar] [CrossRef]
  33. Nelson, F.E.; Outcalt, S.I. A computational method for prediction and regionalization of permafrost. Arct. Alp. Res. 1987, 19, 279–288. [Google Scholar] [CrossRef]
  34. Smith, M.W.; Riseborough, D.W. Climate and the limits of permafrost: A zonal analysis. Permafr. Periglac. Process. 2002, 13, 1–15. [Google Scholar] [CrossRef]
  35. Bai, J.; Perron, P. Computation and Analysis of Multiple Structural Change Models. J. Appl. Econom. 2003, 18, 1–22. [Google Scholar] [CrossRef]
  36. Schwarz, G. Estimating the Dimension of a Model. Ann. Stat. 1978, 6, 461–464. [Google Scholar] [CrossRef]
  37. Allen, M.R.; Dube, O.P.; Solecki, W.; Aragón-Durand, F.; Cramer, W.; Humphreys, S.; Kainuma, M.; Kala, J.; Mahowald, N.; Mulugetta, Y.; et al. Framing and Context. In Global Warming of 1.5 °C; An IPCC Special Report on the Impacts of Global Warming of 1.5 °C Above Pre-Industrial Levels and Related Global Greenhouse Gas Emission Pathways, in the Context of Strengthening the Global Response to the Threat of Climate Change; Masson-Delmotte, V., Zhai, P., Pörtner, H.-O., Roberts, D., Skea, J., Shukla, P.R., Pirani, A., Moufouma-Okia, W., Péan, C., Pidcock, R., et al., Eds.; Cambridge University Press: Cambridge, UK; New York, NY, USA, 2018; pp. 49–92. [Google Scholar] [CrossRef]
  38. Harris, S.A.; Pedersen, D.E. Thermal regimes beneath coarse blocky materials. Permafr. Periglac. Process. 1998, 3, 107–120. [Google Scholar] [CrossRef]
  39. Kneisel, C.; Hauck, C.; Vonder Mühll, D. Permafrost below the timberline confirmed and characterized by geoelectrical resistivity measurements, Bever Valley, eastern Swiss Alps. Permafr. Periglac. Process. 2000, 11, 295–304. [Google Scholar] [CrossRef]
  40. Sawada, Y.; Ishikawa, M.; Ono, Y. Thermal regime of sporadic permafrost in a block slope on Mt. Ni-shi-Nupukaushinupuri, Hokkaido Island, Northern Japan. Geomorphology 2003, 52, 121–130. [Google Scholar] [CrossRef]
  41. Juliussen, H.; Humlum, O. Thermal regime of openwork block fields on the mountains Elgåhogna and Sølen, central-eastern Norway. Permafr. Periglac. Process. 2008, 19, 1–18. [Google Scholar] [CrossRef]
  42. Colucci, R.R.; Forte, E.; Žebre, M.; Maset, E.; Zanettini, C.; Guglielmin, M. Is that a relict rock glacier? Geomorphology 2019, 330, 177–189. [Google Scholar] [CrossRef]
  43. Delaloye, R.; Lambiel, C. Evidence of winter ascending air circulation throughout talus slopes and rock glaciers situated in the lower belt of alpine discontinuous permafrost (Swiss Alps). Nor. Geogr. Tidsskr. 2005, 59, 194–203. [Google Scholar] [CrossRef]
  44. Wicky, J.; Hilbich, C.; Delaloye, R.; Hauck, C. Modeling the link between air convection and the occurrence of short-term permafrost in a low-altitude cold talus slope. Permafr. Periglac. Process. 2024, 35, 202–217. [Google Scholar] [CrossRef]
  45. Kellerer-Pirklbauer, A. Potential weathering by freeze–thaw action in alpine rocks in the European Alps during a nine-year monitoring period. Geomorphology 2017, 296, 113–131. [Google Scholar] [CrossRef]
  46. Zhang, T. Influence of the seasonal snow cover on the ground thermal regime: An overview. Rev. Geophys. 2005, 43, RG4002. [Google Scholar] [CrossRef]
  47. Gruber, S.; Haeberli, W. Permafrost in steep bedrock slopes and its temperature-related destabilization following climate change. J. Geophys. Res. 2007, 112, F02S18. [Google Scholar] [CrossRef]
  48. Zhirkov, A.; Permyakov, P.; Wen, Z.; Kirillin, A. Influence of rainfall changes on the temperature regime of permafrost in Central Yakutia. Land 2021, 10, 1230. [Google Scholar] [CrossRef]
  49. Saas, O. Rock moisture measurements: Techniques, results and implications for weathering. Earth Surf. Process. Landf. 2005, 30, 359–374. [Google Scholar] [CrossRef]
  50. Matsuoka, N. Frost weathering and rockwall erosion in the southeastern Swiss Alps: Long-term (1994–2008) observations. Geomorphology 2008, 99, 353–368. [Google Scholar] [CrossRef]
  51. Șerban, R. Studiu Asupra Solifluxiunii Din Zona Alpină a Carpaților Meridionali/Study on the Solifluction of the Southern Carpathians Alpine Zone; Editura Universității de Vest din Timișoara: Timișoara, Romania, 2021; 280p. [Google Scholar]
  52. Onaca, A.; Magori, B.; Urdea, P.; Chiroiu, P. Near surface thermal characteristics of alpine steep rockwalls in the Retezat Mountains. Forum Geogr. 2015, 14, 124–133. [Google Scholar] [CrossRef]
  53. Ikeda, A. Combination of conventional geophysical methods for sounding the composition of rock glaciers in the Swiss Alps. Permafr. Periglac. Process. 2006, 17, 35–48. [Google Scholar] [CrossRef]
  54. Isaksen, K.; Ødegård, R.S.; Etzelmüller, B.; Hilbich, C.; Hauck, C.; Farbrot, H.; Eiken, T.; Hygen, H.O.; Hipp, T.F. Degradingmountain permafrost in southern Norway: Spatial and temporal variability of mean ground temperatures, 1999–2009. Permafr. Periglac. Process. 2011, 22, 361–377. [Google Scholar] [CrossRef]
  55. Vieira, G.; Mora, C.; Faleh, A. New observations indicate the possible presence of permafrost in North Africa (Djebel Toubkal, High Atlas, Morocco). Cryosphere 2017, 11, 1691–1705. [Google Scholar] [CrossRef]
  56. Noetzli, J.; Isaksen, K.; Barnett, J.; Christiansen, H.H.; Delaloye, R.; Etzelmüller, B.; Farinotti, D.; Gallemann, T.; Guglielmin, M.; Hauck, C.; et al. Enhanced warming of European mountain permafrost in the early 21st century. Nat. Commun. 2024, 15, 10508. [Google Scholar] [CrossRef] [PubMed]
  57. Aalto, J.; Harrison, S.; Luoto, M. Statistical modelling predicts almost complete loss of major periglacial processes in Northern Europe by 2100. Nat. Commun. 2017, 8, 515. [Google Scholar] [CrossRef] [PubMed]
  58. Haeberli, W.; Gruber, S. Global warming and mountain permafrost. In Permafrost Soils; Margesin, R., Ed.; Springer: Berlin/Heidelberg, Germany, 2009; pp. 205–218. [Google Scholar] [CrossRef]
  59. Brighenti, S.; Hotaling, S.; Finn, D.S.; Fountain, A.G.; Hayashi, M.; Herbst, D.; Saros, J.E.; Tronstad, L.M.; Millar, C.I. Rock glaciers and related cold rocky landforms: Overlooked climate refugia for mountain biodiversity. Glob. Change Biol. 2021, 27, 1504–1517. [Google Scholar] [CrossRef] [PubMed]
  60. Hotaling, S.; Foley, M.E.; Zeglin, L.H.; Finn, D.S.; Tronstad, L.M.; Giersch, J.J.; Muhlfeld, C.C.; Weisrock, D.W. Microbial assemblages reflect environmental heterogeneity in alpine streams. Glob. Change Biol. 2019, 25, 2576–2590. [Google Scholar] [CrossRef]
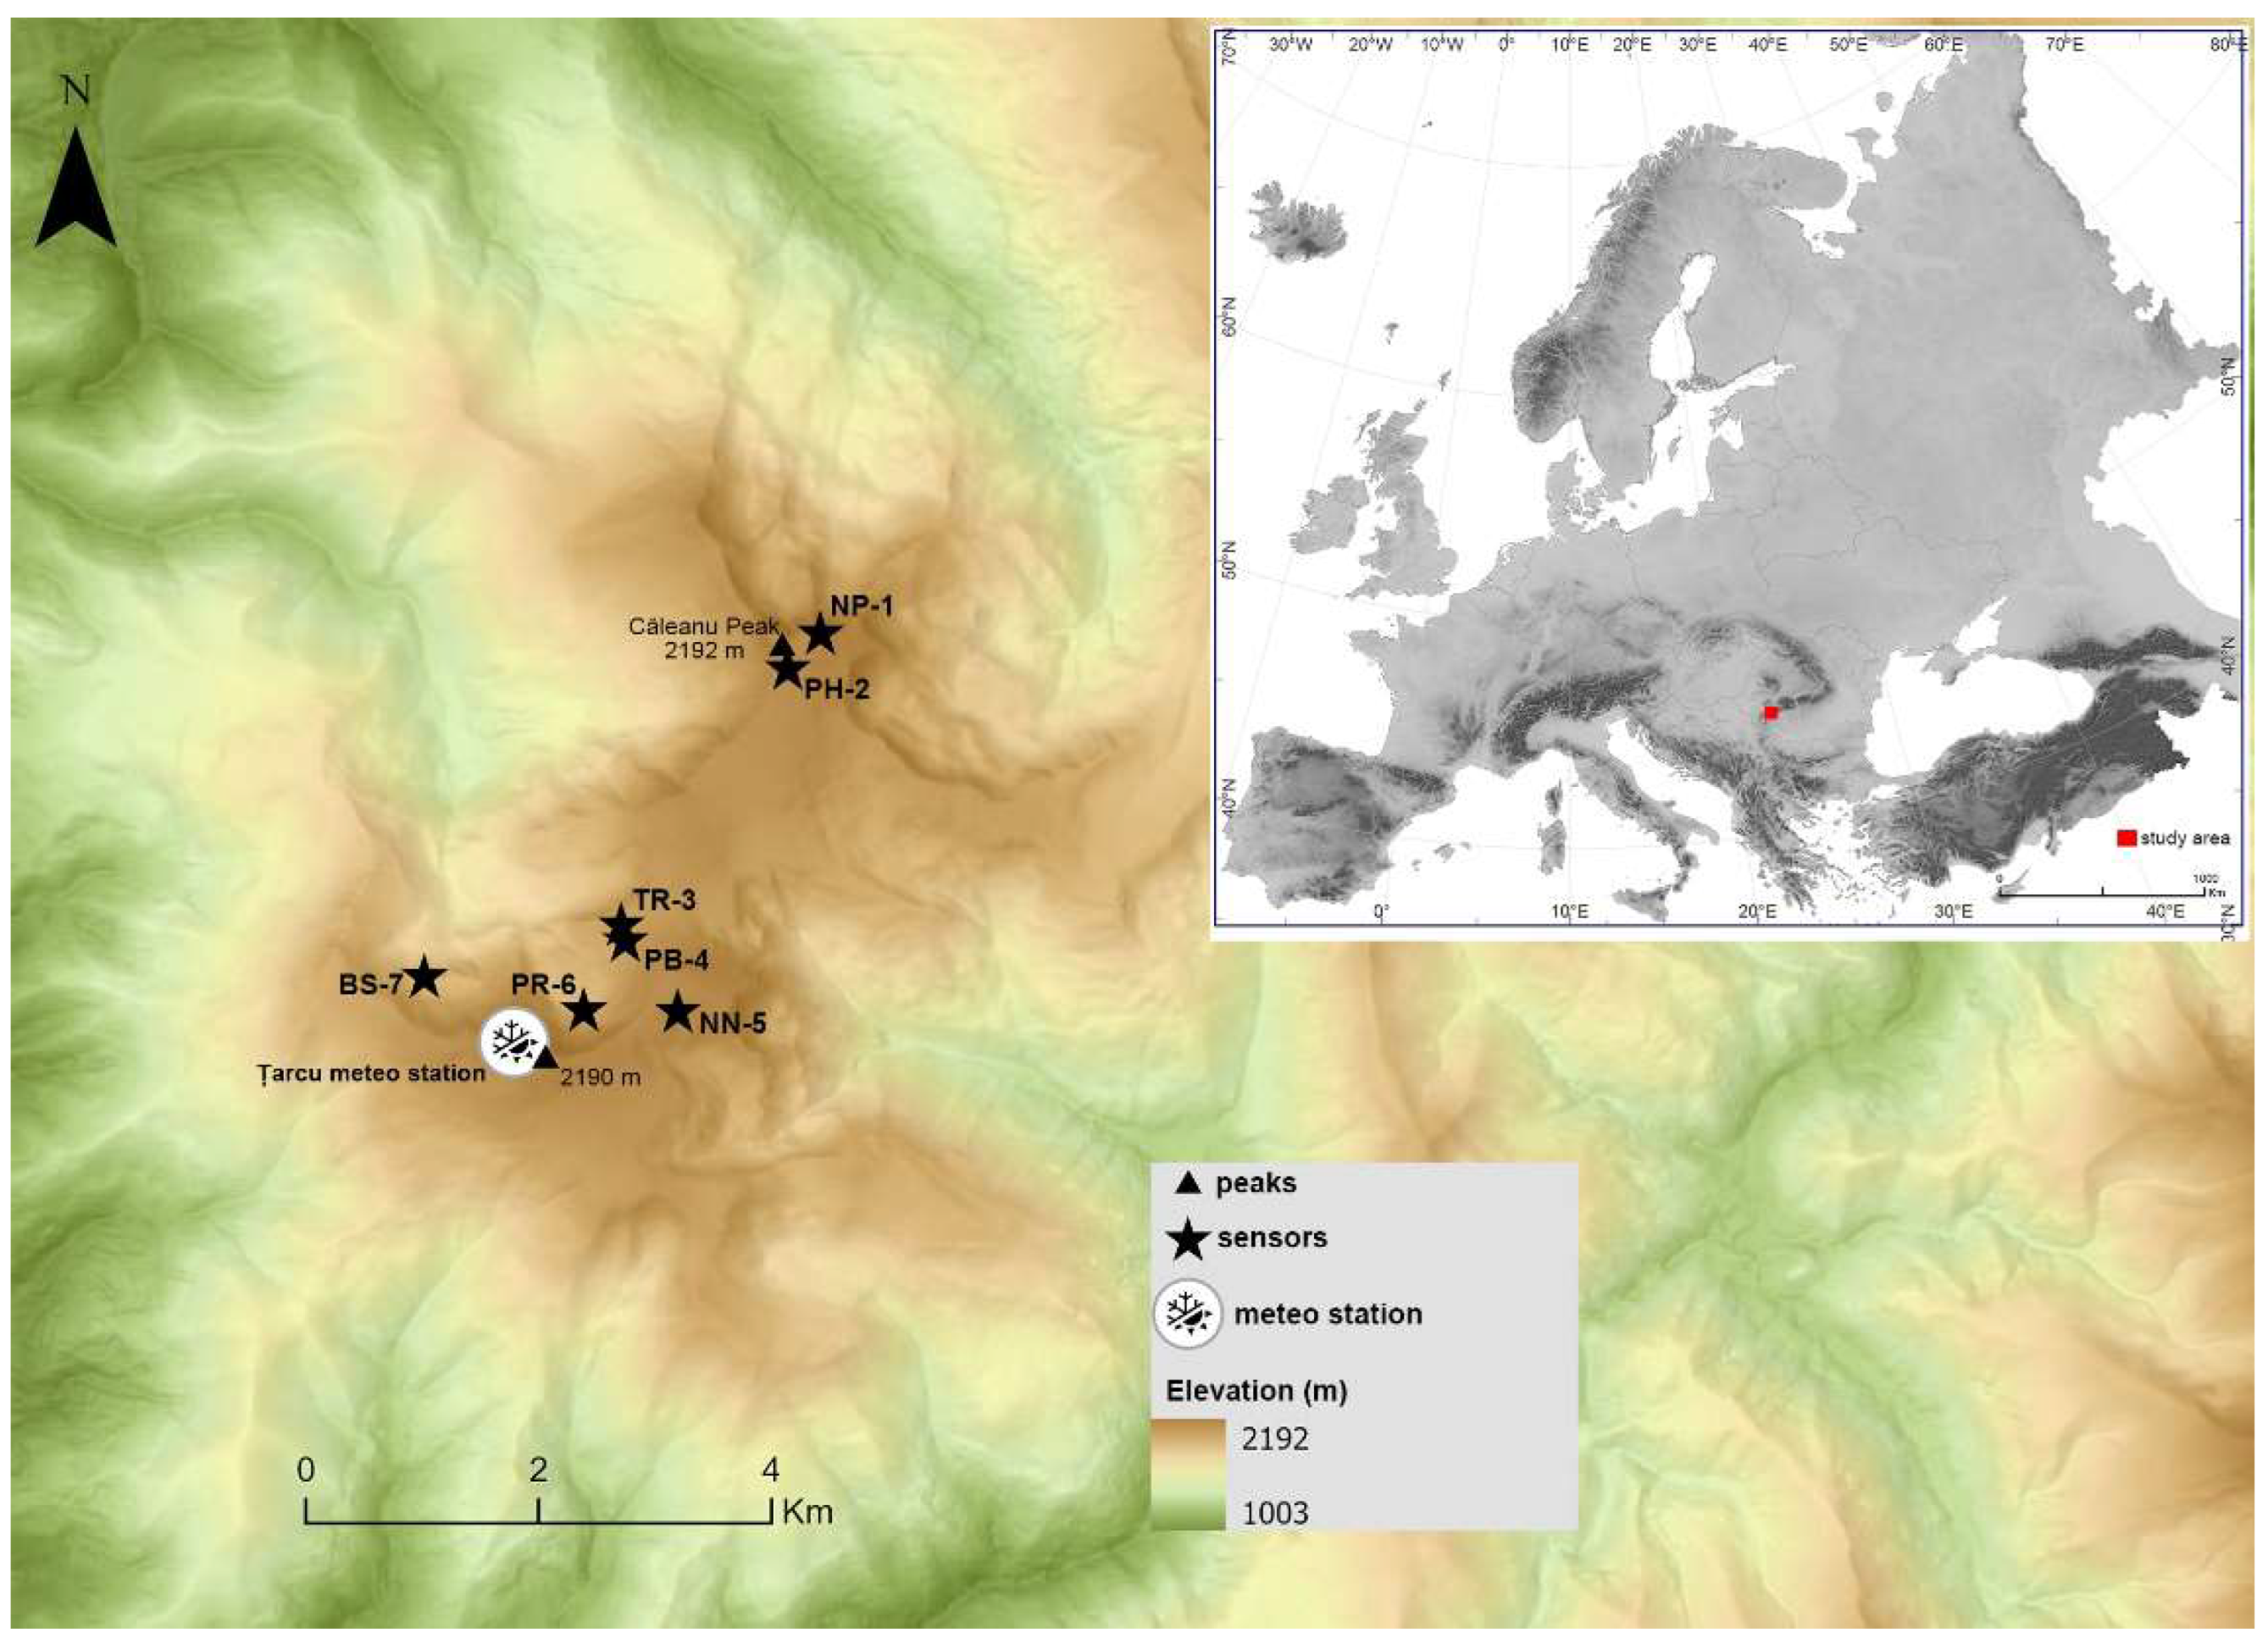
Figure 1. Study area. Țarcu Massif is located in Romanian Carpathians, in the south-eastern part of Europe (inset map).
Land 14 01756 g001
Figure 2. Examples of GST periglacial landforms monitored using miniature data-loggers, including (A) non-sorted polygons, (B) periglacial hummocks, (C) ploughing boulder and (D) protalus rampart.
Land 14 01756 g002
Figure 3. Evolution of mean annual air temperature (MAAT) at the Țarcu station (1961–2023). (A) Columns in blue show MAAT values and dotted red line shows the linear trend over the whole period. (B) Columns in grey show MAAT values; the red line is the optimal segmented linear regression with breakpoints in 1982 and 1995; the blue line is a 2nd-order polynomial for comparison.
Land 14 01756 g003
Figure 4. Temporal evolution of Freezing and Thawing Degree Days (A), net thermal balance (B) and the F+ index (C) at Țarcu weather station.
Land 14 01756 g004
Figure 5. Temporal evolution of freezing–thawing cycles (A), frost weathering interval (B), snow cover duration (C) and frost days (D) at Țarcu weather station.
Land 14 01756 g005
Figure 6. Mean daily air and ground surface temperatures at the monitoring sites from 1 October 2018 to 30 September 2024.
Land 14 01756 g006
Figure 7. Evolution of MAGST (A) and WEqT (B) at the GST monitoring sites.
Land 14 01756 g007
Figure 8. Evolution of freeze–thaw cycles (A), frost days (B) and frost weathering days (C) at the GST monitoring sites.
Land 14 01756 g008
Figure 9. Evolution of freezing degree days (FDDg) (A) and thawing degree days (TDDg) (B) at the GST monitoring sites.
Land 14 01756 g009
Figure 10. Evolution of zero curtain period (A) and snow cover duration (B) at the monitoring sites.
Land 14 01756 g010
Figure 11. Evolution of F+ at the monitoring sites.
Land 14 01756 g011
Figure 12. Evolution of NO at the monitoring sites.
Land 14 01756 g012
Table 1. Ground surface temperature (GST) monitoring sites and their main characteristics.
SiteMorphologyElevation
(m)
Slope
(°)
SubstrateData Series
NP-1Non-sorted polygons21769Fine-grained deposits1 October 2018–30 September 2024
PH-2Periglacial hummocks21705Fine-grained deposits1 October 2018–30 September 2024
TR-3Periglacial tor205978Rockwall1 October 2018–30 September 2024 *
PB-4Ploughing boulder205313Fine-grained deposits1 October 2018–30 September.2024
NN-5Nival niche214711Fine-grained deposits1 October 2018–30 September 2024
PR-6Protalus rampart197514Coarse debris1 October 2018–30 September 2024
BS-7Block stream190418Coarse debris1 October 2018–30 September 2024
*—gap between 1 October 2022 to 30 September 2023.
Table 2. Calculated parameters based on ground temperature data (HY = hydrological year; CY = calendar year).
Parameter (Code)DescriptionUnitTimescales
MAGSTMean annual ground surface temperature°CHY
MAATMean annual air temperature°CCY and HY
FDDaFreezing degree days sums for air temperature°C daysCY
TDDaThawing degree days sums for air temperature°C daysCY
FDDgFreezing degree days sums for ground temperature°C daysHY
TDDgThawing degree days sums for ground temperature°C daysHY
FTCDays with diurnal freeze–thaw cyclesNumber of daysCY and HY
FDFrost daysNumber of daysCY and HY
FWIFrost weathering intervalNumber of daysCY and HY
WEqTWinter equilibrium temperature°CHY
ZCPZero curtain periodNumber of daysHY
SCDSnow cover durationNumber of daysCY and HY
F+Dimensionless index—estimate permafrost CY
NODimensionless index—estimate snow thermal insulation HY
Table 3. Trend statistics for the analyzed parameters. Statistically significant correlations (p < 0.05) are shown in bold.
ParameterSlopeR2p-ValueStdev
MAAT (1961–2023)0.030.43<0.0010.83
MAAT (1961–1981)−0.500.320.0070.02
MAAT (1982–1994)0.350.070.3510.04
MAAT (1995–2023)0.810.67<0.0010.01
FDDa−4.030.180.001173.54
TDDa6.830.48<0.001180.48
F+0.000.43<0.00115.02
FTC−0.040.000.6956.51
FWI−0.090.060.04420.73
SCD−0.210.030.15315.23
FD−0.450.29<0.0010.035
Table 4. Main thermal characteristics of periglacial processes and landforms in the Southern Carpathians, based on data from [13,16,51,52], following the conceptual framework of [8].
Surface TypeGeomorphic BeltsThermal RegimeMain Periglacial ProcessesMain Active Landforms
Coarse debrisIsolated permafrost
(2544–2000 m)
MAGST = −2–1.5 °C
WEqT ≤ −2 °C
FDDg = −450–−1500 °C days
FD ≥ 200 days
Frost cracking
Frost creep
Permafrost creep
Active layer processes
Frost splitting
Rock glaciers
Block streams
Debris cones
Debris lobes
Debris talus
Blockfields
No permafrost
(2544–1650 m)
MAGST = 1.5–4 °C
WEqT = −2.5–0 °C
FDDg = 200–500 °C days
FD = 150–250 days
Frost cracking
Frost creep
Block streams
Debris cones
Debris talus
Fine-grained sedimentsUpper periglacial
(2544–2100 m)
MAGST = 1–4 °C
FTC = 5–50 cycles
FDDg = 50–500 °C days
FD = 150–225 days
Solifluction
Cryoturbation
Nivation
Frost heaving
Frost creep
Frost sorting
Non-sorted polygons
Sorted polygons
Ploughing boulders
Solifluction lobes
Solifluction terraces
Nivation hollows
Lower periglacial
(2100–1650 m)
MAGST = 4–6 °C
FTC = 1–20 cycles
FDDg = 20–200 °C days
FD = 100–150 days
Solifluction
Nivation
Frost heaving
Solifluction lobes
Ploughing boulders
Nivation hollows
Rock wallsUpper periglacial
(2544–2100 m)
MAGST = −1–+2.5 °C
FTC = 15–140 cycles
FDDg ≥ 500 °C days
FD = 160–230 days
Frost cracking
Rock falls
Summits
Crest
Rock Walls
Periglacial tors
Lower periglacial
(2100–1650 m)
MAGST = 2–5 °C
FTC = 10–40 cycles
FDDg ≤ 500 °C days
FD = 115–190 days
Frost crackingPeriglacial tors
Rock Walls
Disclaimer/Publisher’s Note: The statements, opinions and data contained in all publications are solely those of the individual author(s) and contributor(s) and not of MDPI and/or the editor(s). MDPI and/or the editor(s) disclaim responsibility for any injury to people or property resulting from any ideas, methods, instructions or products referred to in the content.