Article

Does Land Operation Scale Improve Rice Carbon Emission Productivity? Evidence from 916 Farmers in Guangdong Province, China

College of Economics and Management, South China Agricultural University, Guangzhou 510642, China
*
Author to whom correspondence should be addressed.
Land 2025, 14(9), 1750; https://doi.org/10.3390/land14091750
Submission received: 23 June 2025 / Revised: 5 August 2025 / Accepted: 20 August 2025 / Published: 29 August 2025

Abstract

China aims to reduce carbon emissions but faces challenges from small-scale farmer operations. Previous studies have predominantly examined carbon density using macro-level data. This study employs a primary field survey involving 916 rice farmers, along with input–output data from their typical paddy plots, to calculate micro-level carbon emissions and assess the impact of land operation scale. The results indicate that operational scale enhances carbon emission productivity and has a nonlinear relationship with carbon emission intensity. From survey data, the carbon emission intensity of late rice is 4648.77 kg CO2eq·ha−1 in Guangdong province China, which differs by a mere 1.14% from the figure derived from yearbook macro data. The yield carbon emission productivity and yield value carbon emission productivity of rice production are 1.347 kg·kg CO2eq−1 and 2.166 CNY·kg CO2eq−1, respectively. The operational scale significantly positively enhances indirect carbon emission productivity, a key indicator of economic growth and environmental sustainability. However, it exhibits a U-shaped effect on carbon emission intensity. Our results underscore the critical role of expanding the operational scale among individual farmers to boost carbon emission productivity, facilitating the simultaneous development of grain crops and a reduction in carbon emissions.

1. Introduction

Rice, a vital staple crop, is a major source of anthropogenic greenhouse gas emissions [1]. In 2024, China, the world’s largest rice producer [2], harvested 207.535 million tons from 29.006 million hectares [3]. The significant carbon footprint of China’s rice production has attracted global scrutiny. In fact, small-scale farming in China faces challenges, with prevailing opinions indicating that ultra-small-scale operations may not align with sustainable agricultural practices [4].
China has pledged to peak CO2 emissions before 2030 and achieve carbon neutrality by 2060. The primary pathway to realizing the goal is through reductions in carbon emission intensity. However, the carbon emission productivity indicators, which balance the imperative of stabilizing atmospheric CO2 concentrations and economic growth, provide a more appropriate standard for evaluating the success of climate change mitigation efforts [5]. More than 1.413 billion people in China [6] rely heavily on rice, with over 60% using it as a staple food. Consequently, food security must be a key consideration when addressing carbon emissions from rice production [7]. Zhang et al. [8] calculated China’s rice production from the 1960s to 2010s, finding a 37% yield increase per unit area and a 12.2% rise in carbon emissions, leading to an 18.1% decrease in carbon emissions per kilogram of yield. Rice production in China thus represents a collaborative effort aimed at simultaneously increasing production and reducing emissions. Xu et al. [9] applied about 2000 tracked farmers’ data from five provinces in China to reveal that from 2018 to 2022, greenhouse gas emission intensity and green total factor productivity of all kinds of agriculture production increased by 12.2% and 7.7%. Carbon emission productivity treats carbon emissions as an input factor (alongside labor and capital), evaluating output per unit of carbon emissions. Enhancing this productivity involves controlling carbon emissions, improving energy efficiency, and balancing agricultural output [10].
In China, over 98% of agricultural operators are smallholders, playing a crucial role in the country’s agriculture and resulting in significant scale diseconomies [11]. Despite China’s grain production surpassing 0.65 trillion kg annually since 2017 [3], the intensive use of fertilizers, pesticides, and agricultural films has exacerbated non-point source pollution, soil degradation, and land consolidation [11,12]. The Chinese government has been actively addressing these issues, focusing on land transfer and intensive management, but expanding the operational scale remains a protracted process.
The available evidence from various countries, including the United States [13], Turkey [14], Thailand [15], and Kenya [16], suggests a positive relationship between the scale of land operations and carbon emissions in the planting industry. Similar findings are reported for China, but they have primarily relied on macro-level data from yearbooks [17,18] and lack econometric analysis by using micro-level farmer data. Liu et al. [17], utilizing provincial panel data from China, identifies a U-shaped relationship between land operation scale and carbon emission intensity. Similarly, Bai et al. [18] examine county-level panel data from Gansu Province, China, and corroborate national findings [17]. Additionally prior research has predominantly examined carbon emission intensity [19,20], often overlooking carbon emission productivity. Xiong et al. [21] explore low-carbon technologies in the context of carbon emission productivity. Xu et al. [9] applied about 2000 tracked farmers’ data to calculate greenhouse gas emission intensity and green total factor productivity. Enhancing carbon emission productivity in agriculture remains a critical concern for achieving balanced economic growth and environmental sustainability.
This study enhances the existing literature in two key ways: First, it utilizes farmers’ input–output data from their rice paddy operation to calculate individual farmers’ rice production carbon emission productivity and carbon emission intensity, supplementing existing research that typically relies on macro or laboratory data. Second, this study’s analysis examines the impact of land operation scale on both carbon emission productivity and carbon emission intensity, offering empirical evidence for the synergy between economic development and emission reduction.

2. Materials and Methods

2.1. Overview of the Study Area and Data Source

This study’s data were sourced from a primary field survey of rice farmers in Guangdong Province, China. Guangdong Province is situated in the southernmost region of mainland China, downstream of the Pearl River Basin, spanning an area of 179,800 km2 between 20°13′–25°31′ N and 109°39′–117°19′ E (Figure 1). The province exhibits a diverse landscape with mountains, hills, tablelands and plains, accounting for 49.78%, 17.62%, 12.82% and 19.78% of the total land area, respectively. The terrain generally descends from north to south, accompanied by a 4114 km of coastline. The alluvial plains along rivers and coasts are the primary agriculture areas. Geographically, economically and culturally, Guangdong is administratively divided into 21 prefectural-level cities across four regions: eastern western and northern Guangdong, as well as the Pearl River Delta (PR Delta for short). The area experiences a subtropical monsoon climate, characterized by high temperatures and substantial rainfall, with an average 1745 sunshine hours, with a mean temperature of 22.3 °C and 1777 mm of precipitation annually. In 2024, Guangdong reported a rice cultivation area of 1.835 million hectares, harvesting 11.236 million tons.
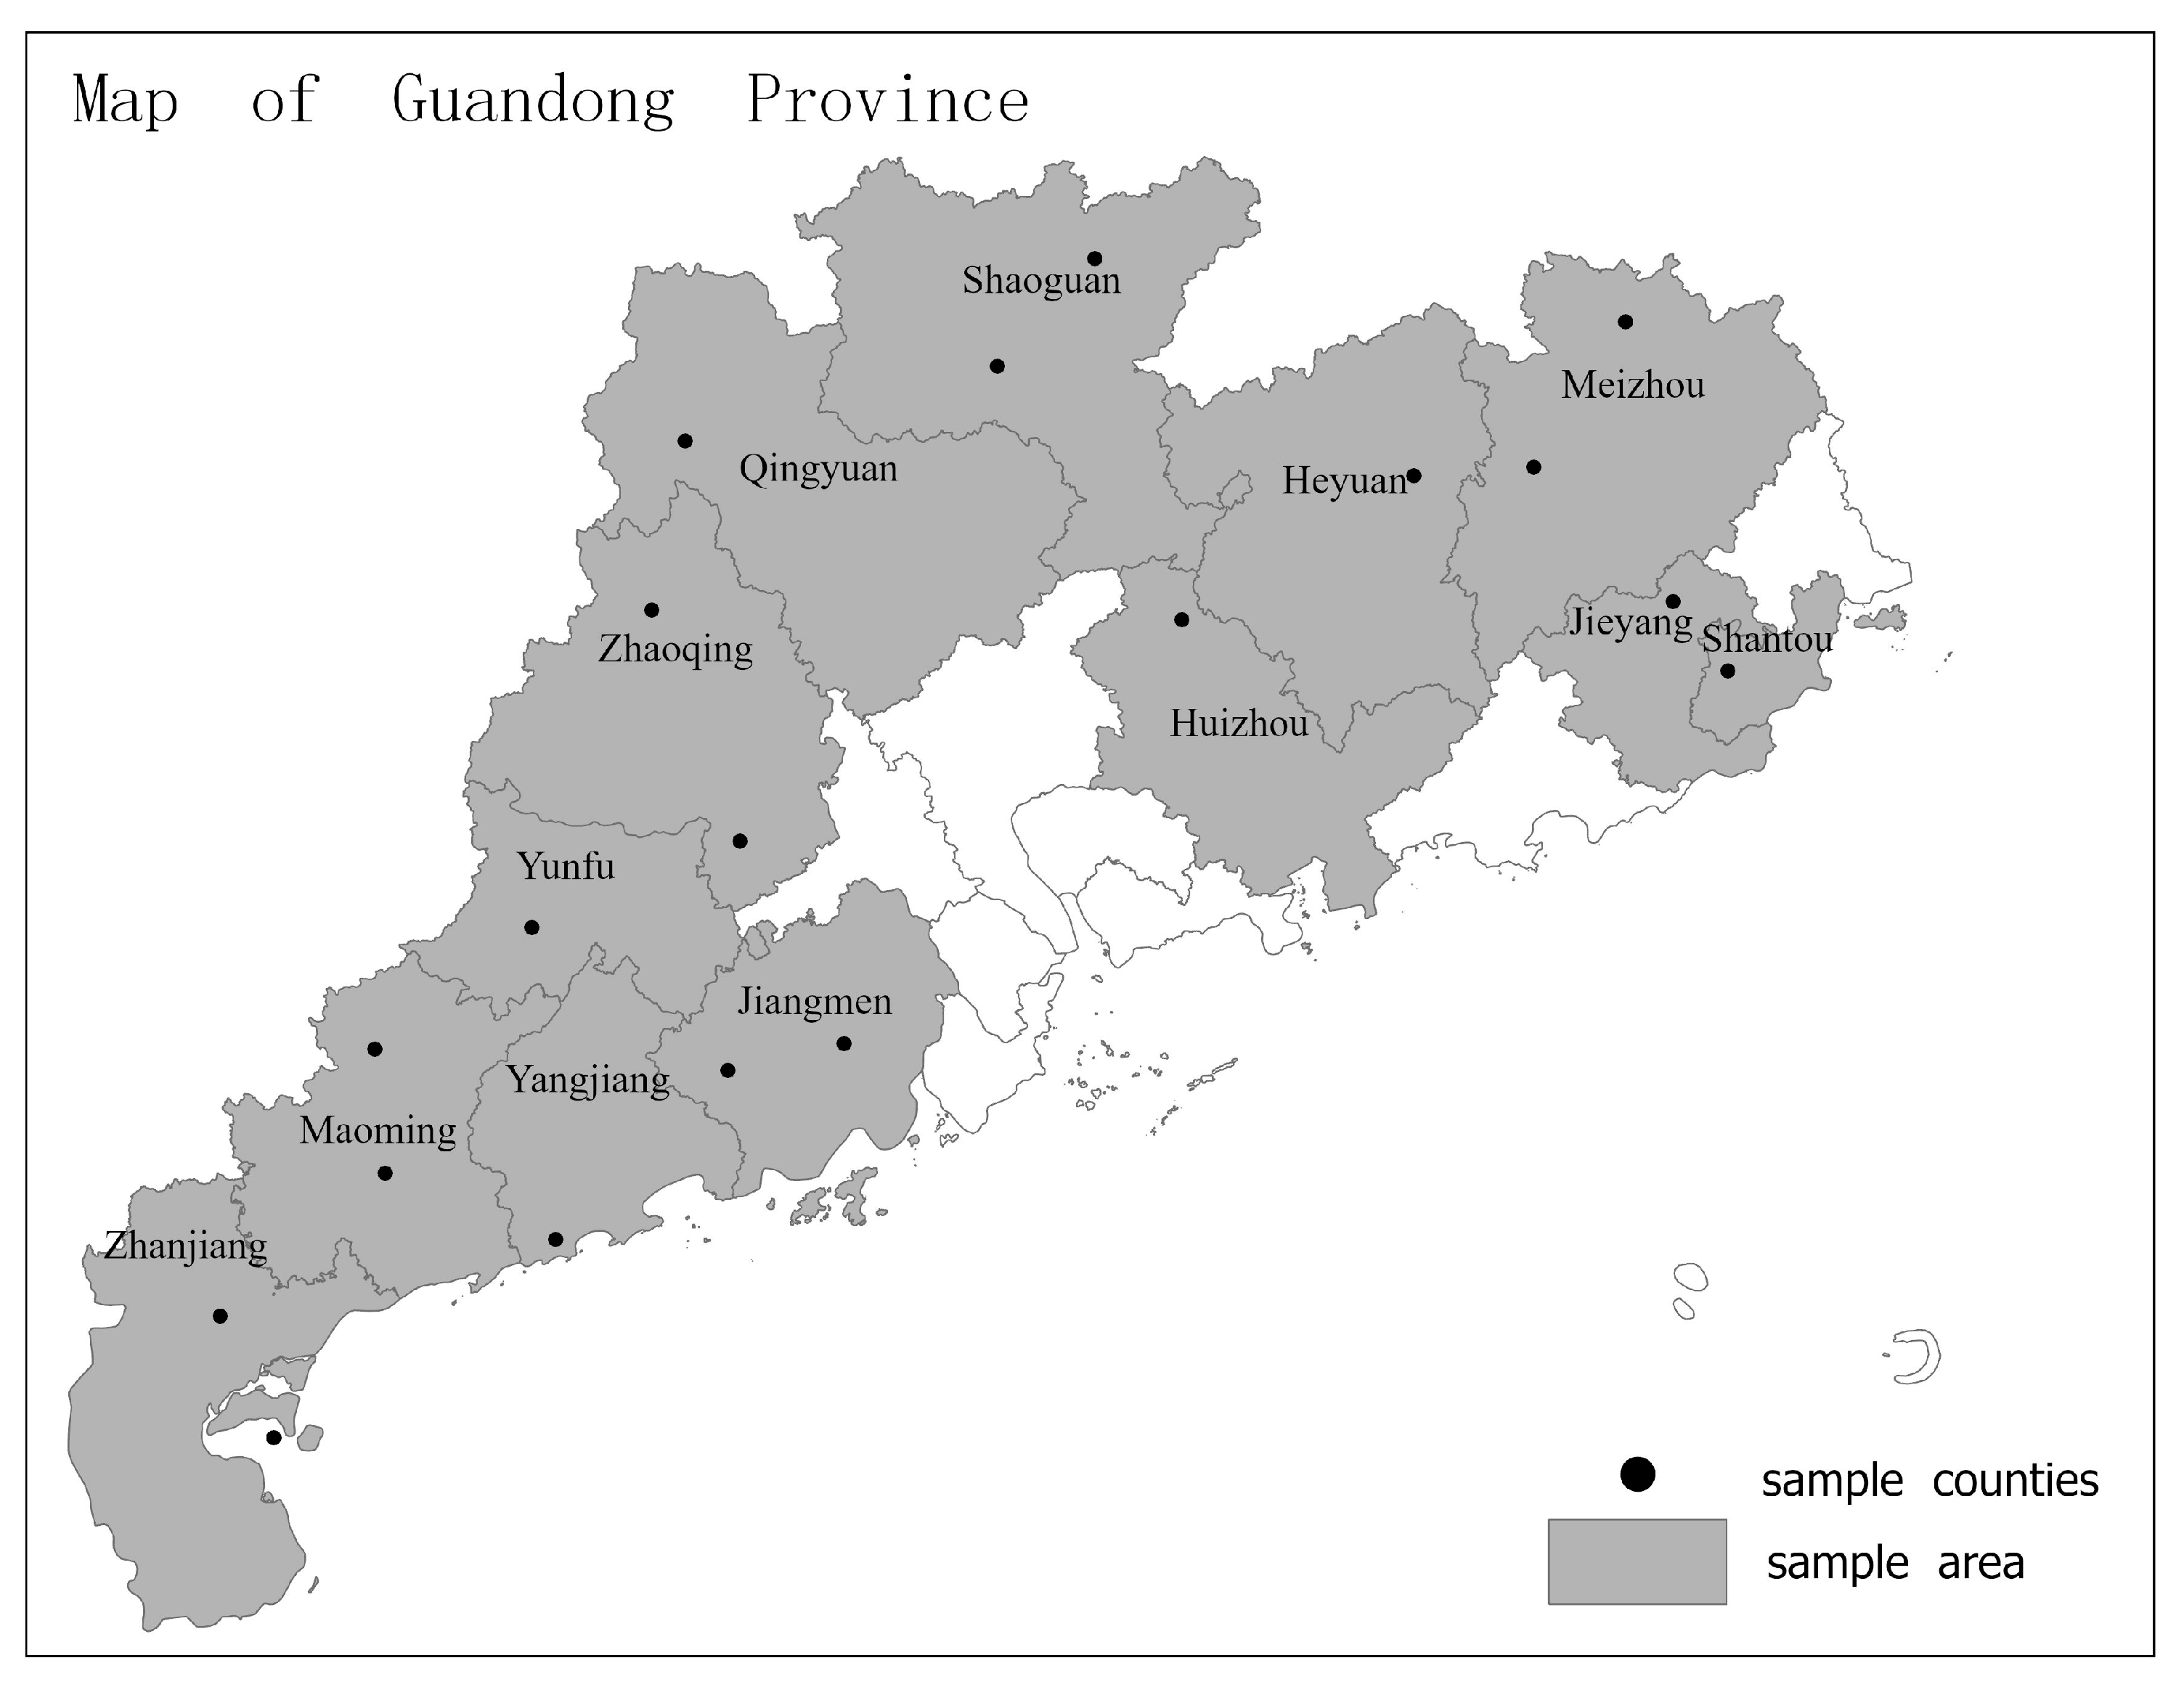
The survey was conducted from May to August 2021 by the Guangdong Rice Circulation and Industrial Economic Post team. A multi-stage sampling approach was employed: first, the top 13 rice-producing municipal regions in Guangdong were selected (Figure 1). Second, one or two counties were randomly chosen from each sampled region, which totals 19 counties (Figure 2). Third, two villages were randomly selected from each sampled county. Finally, 30 rice farmers were randomly chosen in each sampled village to complete the questionnaire. Out of 956 collected questionnaires, 916 were valid, yielding an effective response rate of 95.82%. All questionnaires were administered face-to-face by trained university students, with each interview lasting over 1.5 h.

2.2. Theoretical Analysis and Research Hypothesis

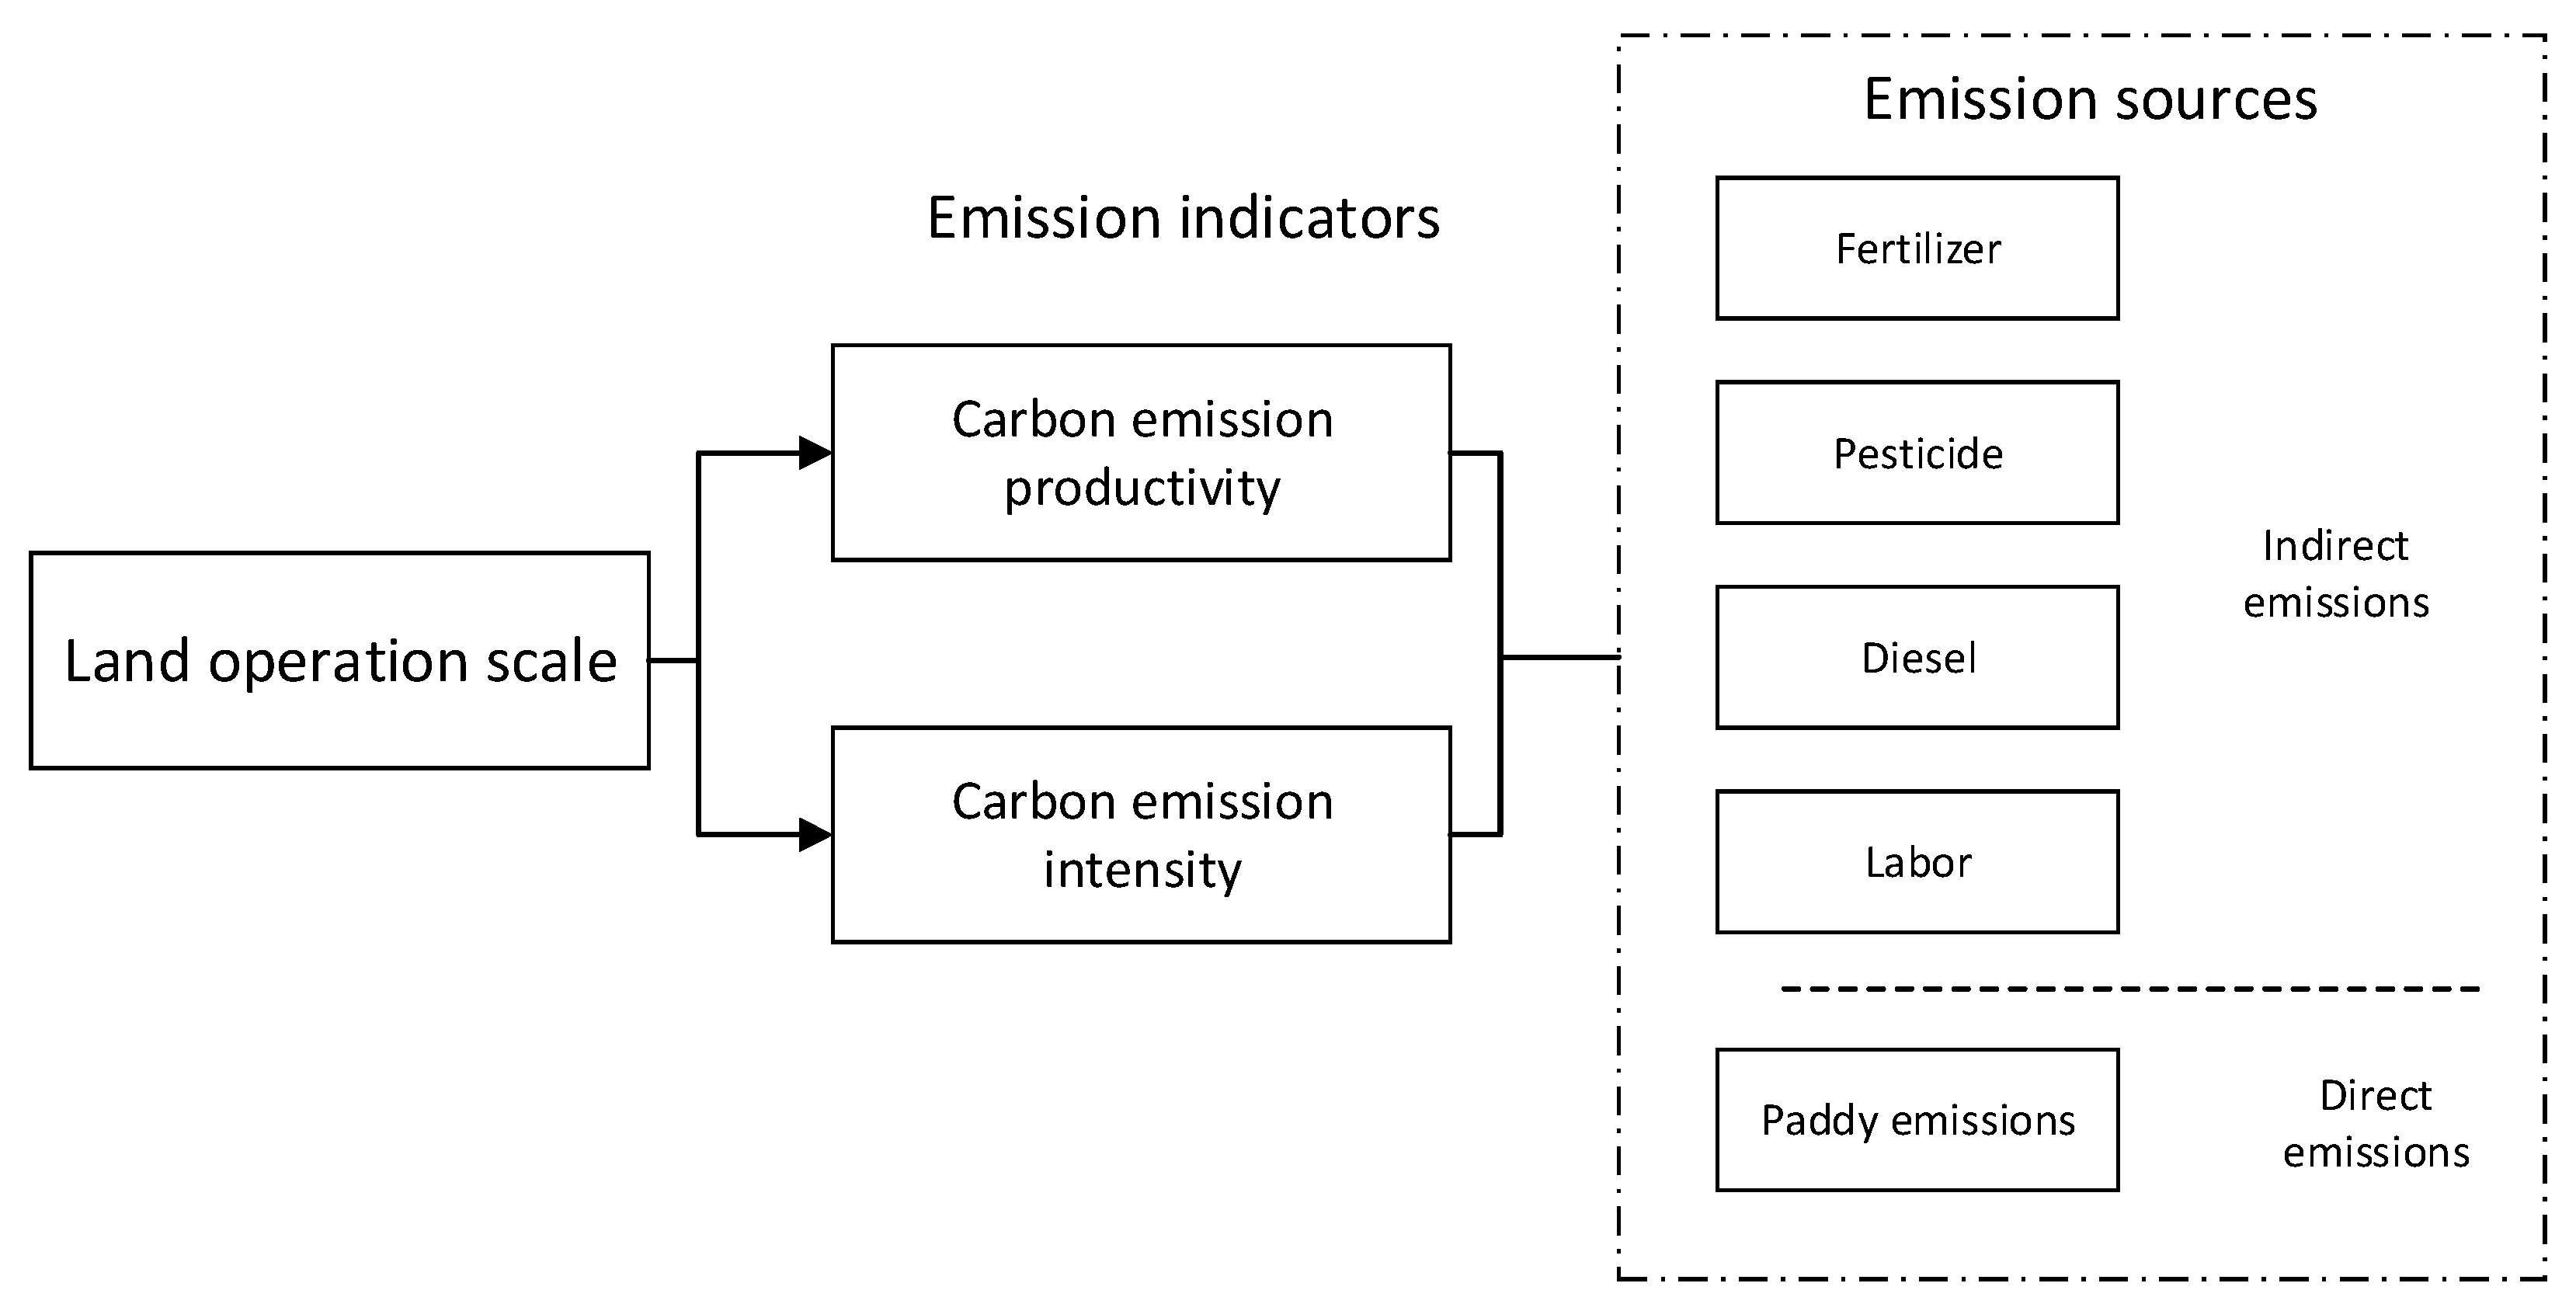
Carbon emissions in the planting industry stem from crop activities and input factors [17]. In rice production, emissions include CH4 from paddy fields during cultivation, emissions from inputs like fertilizers and pesticides, and energy used for land management, primarily through machinery and labor. To quantify an individual farmer’s rice production-related carbon emissions, the Intergovernmental Panel on Climate Change (IPCC) emission coefficient method can be applied using input–output data. In China, most rice producers are smallholders, and their operational scale may significantly impact carbon emission productivity and intensity. Figure 3 illustrates the theoretical analysis framework of this study.
The operational scale of agricultural production has been a persistent concern in economic research, particularly due to the immobility of arable land. China’s unique political and historical context has resulted in a large number of smallholder farms, making the scale of agricultural operations a critical focus of study [18,22]. Farmers, as rational agents, optimize chemical input levels within the constraints of their land and other resources to maximize productivity annually. However, the adoption of advanced planting technologies can significantly enhance the efficiency of energy and resource utilization, promote the rational allocation of agricultural inputs, suppress increases in carbon emissions while maintaining yields, and improve carbon emission productivity [8]. Zhu’s [7] study in Shandong Province, China, revealed that over half of large-scale farms employed subsurface fertilizer application, a technique not employed by any smallholder farmers. Xie [23] monitored 2600 farmers in Jiangsu Province, China, finding that a 1% increase in land operation scale corresponds to a 3% reduction in the net carbon effect, with green production technologies influencing this relationship. As the operational scale expands, farms need to increase labor, which promotes the use of machinery against the backdrop of rural labor outflow in China. Sometimes, mechanization reduces carbon emissions through introducing new technologies [24]. Although substituting human labor with machines initially raises emissions, the resulting reduction from mechanization compensates for this increase [25], thereby improving carbon emission productivity. Thus, we propose Hypothesis 1.
H1: 
Operational scale significantly enhances carbon emission productivity without reversal.
Carbon emission intensity, measured as carbon emissions per unit of land area, is primarily driven by farmer-controlled inputs, excluding direct land use emissions. Among these inputs, chemical fertilizers are the predominant contributors [26]. Ju [27] emphasized that expanding the operational scale is crucial for reducing fertilizer intensity, as larger scales enhance fertilizer use efficiency. Wu et al. [22] observed that a 1% increase in land operation scale results in a 0.3% reduction in fertilizer use per unit area. Moreover, given the central role of land in agriculture, farmers operating on larger areas generally possess greater capabilities [7]. These more capable farmers can more effectively mitigate carbon emission intensity by adopting relevant technologies and accumulating operational experience. Conversely, less capable farmers may struggle to fully comprehend and efficiently apply chemical inputs due to a limited understanding of best practices [28]. To minimize the risk of reduced yields, farmers may increase agrochemicals inputs, leading to higher carbon emissions [29].
As land operations expand beyond an optimal threshold, factor management becomes less precise [30], potentially leading to a rebound in carbon emission intensity. Bai et al. [18], utilizing panel data from Chinese Gansu Province’s statistical yearbook, identified a U-shaped relationship between operation scale and carbon emission intensity. Based on this analysis, we propose Hypothesis 2:
H2: 
The operational scale exhibits a nonlinear relationship with carbon emission intensity, suggesting the existence of an optimal scale. Prior to reaching this optimal point, increasing the scale can effectively mitigate carbon emission intensity. However, further scale expansion beyond the optimal point leads to a rise in carbon emission intensity.

2.3. Variable Selection

This study examines carbon emission productivity and intensity in rice production. Data were gathered via a questionnaire on inputs (fertilizer, pesticide, machinery, and labor) and outputs (harvested paddy volume) from a typical rice plot. Additional information, including paddy sales price and plot area, was also collected. These data were used to calculate each farmer’s carbon emission productivity and intensity.
The main explanatory variable is the scale of land operations undertaken by farmers, encompassing the total area of all rice-producing parcels managed by a farmer household.
Based on the existing literature, farm household characteristics, personal attributes of agricultural production decision-makers, and cultivation characteristics were chosen as control variables.

2.4. Data Description

The survey data comprised detailed information on the respondents’ family information and specific input–output data from their late rice paddy plot. This included the amount and costs of fertilizer, pesticide, labor, and energy, as well as output and selling prices of the yield (Table 1). Table 2 illustrates the rice production scale of sampled farmers, with over 90% operating on less than 1 hectare, predominantly between 0.125 and 0.5 hectares.

2.5. Carbon Emission Calculation

The Kyoto Protocol identifies six primary greenhouse gases, with rice production primarily emitting CO2, CH4, and N2O. This study assessed these emissions by following methodologies outlined by Xia et al. [31] and Chen et al. [32]. Greenhouse gas emissions were categorized as either direct, arising from on-field processes, or indirect, associated with input supply and energy use. Specifically, emissions from rice production are classified into those from factor inputs and field greenhouse gas emissions. Factor input emissions are further divided into material and energy input emissions. Calculations employed the IPCC emission coefficient method, with the relevant sources and coefficients detailed in Table 3.

2.5.1. Carbon Emissions from Factors Input

The material and energy inputs in rice production contribute to indirect carbon emissions. Material inputs primarily consist of fertilizers and pesticides. Fertilizer use is divided into base and topdressing application, while pesticides are applied two to three times per season, depending on weather and pest conditions. Energy inputs include diesel and labor, with diesel powering agricultural machinery and labor involved in field management and manual processes. Thus, the calculation of indirect carbon emissions from rice production can be expressed as follows:
E i n d i r e c t = E j = T j × φ j
where E i n d i r e c t is the rice production indirect carbon emissions; j is a carbon emission source; E j is the amount of carbon emissions of j ; T j is the input amount of j ; and φ j is the coefficient of j .

2.5.2. Carbon Emissions from Paddy Field

Land used for rice production generates greenhouse gases, mainly CH4 [34,35]. Wang et al. [36] elucidated the mechanisms underlying CH4 production, oxidation, and transportation. According to the IPCC’s [37] 100-year time frame, the effect of unit mass CH4 on the global warming potential (GWP) is 25 times that of CO2, with 1 kg CO2 being the 12/44 standard carbon. Therefore, the formula for calculating direct carbon emissions from paddy fields for late rice in Guangdong is as follows:
E d i r e c t = 516 × A × 25 × 12 44
where E d i r e c t represents the direct carbon emissions converted from CH4 emissions from paddy fields and A denotes the paddy field area.
The carbon emissions from rice production by farmers encompass both direct and indirect emissions, calculated as follows:
E i = E i i n d i r e c t + E i d i r e c t
where E i is the i th farmer’s rice production carbon emissions from a typical paddy plot.

2.5.3. Rice Production Carbon Emission Productivity and Carbon Emission Intensity

The formula for calculating indirect carbon emission productivity (Indirect carbon emission productivity is a component of overall carbon emission productivity. Rice production indirect carbon emission productivity pertains to emissions not originating from paddy soil emission in rice production (refer to Figure 2, Table 3, Equation (1), and Equation (3) for details). Equation (4) calculates the rice yield indirect carbon emission productivity, while Equation (5) determines the rice yield value indirect carbon emission productivity.) in rice production is as follows:
C i p r o y i e l d i n d i r e c t = Y i / E i i n d i r e c t
C i p r o v a l u e i n d i r e c t = Y i p i / E i i n d i r e c t
where C i p r o y i e l d i n d i r e c t represents the rice produced by the i th farmer by 1 kg indirect carbon emissions; and Y i denotes the rice yield on the typical paddy plot from the i th farmer, and the unit is kilogram. C i p r o v a l u e i n d i r e c t is the i th farmer’s yield rice market value by 1 kg of indirect carbon emissions; and p i is the i th farmer’s rice selling price, and the unit is CNY·kg−1
The formula for calculating carbon emission intensity of rice production is as follows:
C i i n t e n s i t y = E i / A i
where C i i n t e n s i t y is the carbon emissions per hectare by the i th farmer, and A i is the area of the i th farmer’s typical paddy field.
The formula for calculating the indirect carbon emission intensity of rice production is as follows:
C i i n t e n s i t y i n d i r e c t = E i i n d i r e c t / A i
where C i i n t e n s i t y i n d i r e c t is the indirect carbon emissions per hectare by the i th farmer.

2.6. Econometric Model

Ordinary Least Squares (OLS) was utilized to examine the relationship between land operation scale, carbon emission productivity, and carbon emission intensity among rice farmers. The regression model is specified as follows:
C i p r o y i e l d i n d i r e c t = α 1 + β 1 s c a l e i + j = 1 n γ j x i + ε i
C i p r o v a l u e i n d i r e c t = α 2 + β 2 s c a l e i + j = 1 n γ j x i + ε i
C i i n t e n s i t y i n d i r e c t = α 3 + β 3 s c a l e i + j = 1 n γ j x i + ε i
C i i n t e n s i t y = α 4 + β 5 s c a l e i + j = 1 n γ j x i + ε i
where C i p r o y i e l d i n d i r e c t , C i p r o v a l u e i n d i r e c t , C i i n t e n s i t y i n d i r e c t , and C i i n t e n s i t y represent the i th farmer’s yield indirect carbon emission productivity, yield value indirect carbon emission productivity, indirect carbon emission intensity, and carbon emission intensity, respectively; s c a l e i denotes the i th farmer’s total land operation scale of all rice paddy plots; j = 1 n β j x i is a series of factors that affect rice production carbon emissions; β 1 , β 2 , β 3 , β 4 , and γ 1 to γ j are the parameters to be estimated for each influencing variable; α 1 , α 2 , α 3 , and α 4 are the constant terms; and ε i is a random perturbation term.
Considering a potential U-shaped association between the scale of land operations and carbon emission productivity or carbon emission intensity, an absolute quadratic term is incorporated into Equations (8)–(11), resulting in the following model:
C i p r o y i e l d i n d i r e c t = α 5 + β 5 s c a l e i + δ 1 s c a l e i 2 + j = 1 n γ j x i + ε i
C i p r o v a l u e i n d i r e c t = α 6 + β 6 s c a l e i + δ 2 s c a l e i 2 + j = 1 n γ j x i + ε i
C i i n t e n s i t y i n d i r e c t = α 7 + β 7 s c a l e i + δ 3 s c a l e i 2 + j = 1 n γ j x i + ε i
C i i n t e n s i t y = α 8 + β 8 s c a l e i + δ 4 s c a l e i 2 + j = 1 n γ j x i + ε i
where β 5 , β 6 , β 7 , β 8 , δ 1 , δ 2 , δ 3 , and δ 4 are the parameters to be estimated for each influencing variable; and α 5 , and α 6   α 7 , and α 8 are the constant terms.

3. Results

3.1. Carbon Emissions of Rice Production

Table 4 presents data from field surveys and carbon emissions calculations, detailing total carbon emissions, carbon emission productivity and carbon emission intensity for individual rice farmers in Guangdong, China. The average carbon emission yield per kilogram of indirect carbon emissions, yield value per kilogram of indirect carbon emission, and per hectare are 1.347 kg·kg CO2eq−1, 2.166 CNY·kg CO2eq−1, and 4648.77 kg CO2eq·ha−1, respectively.
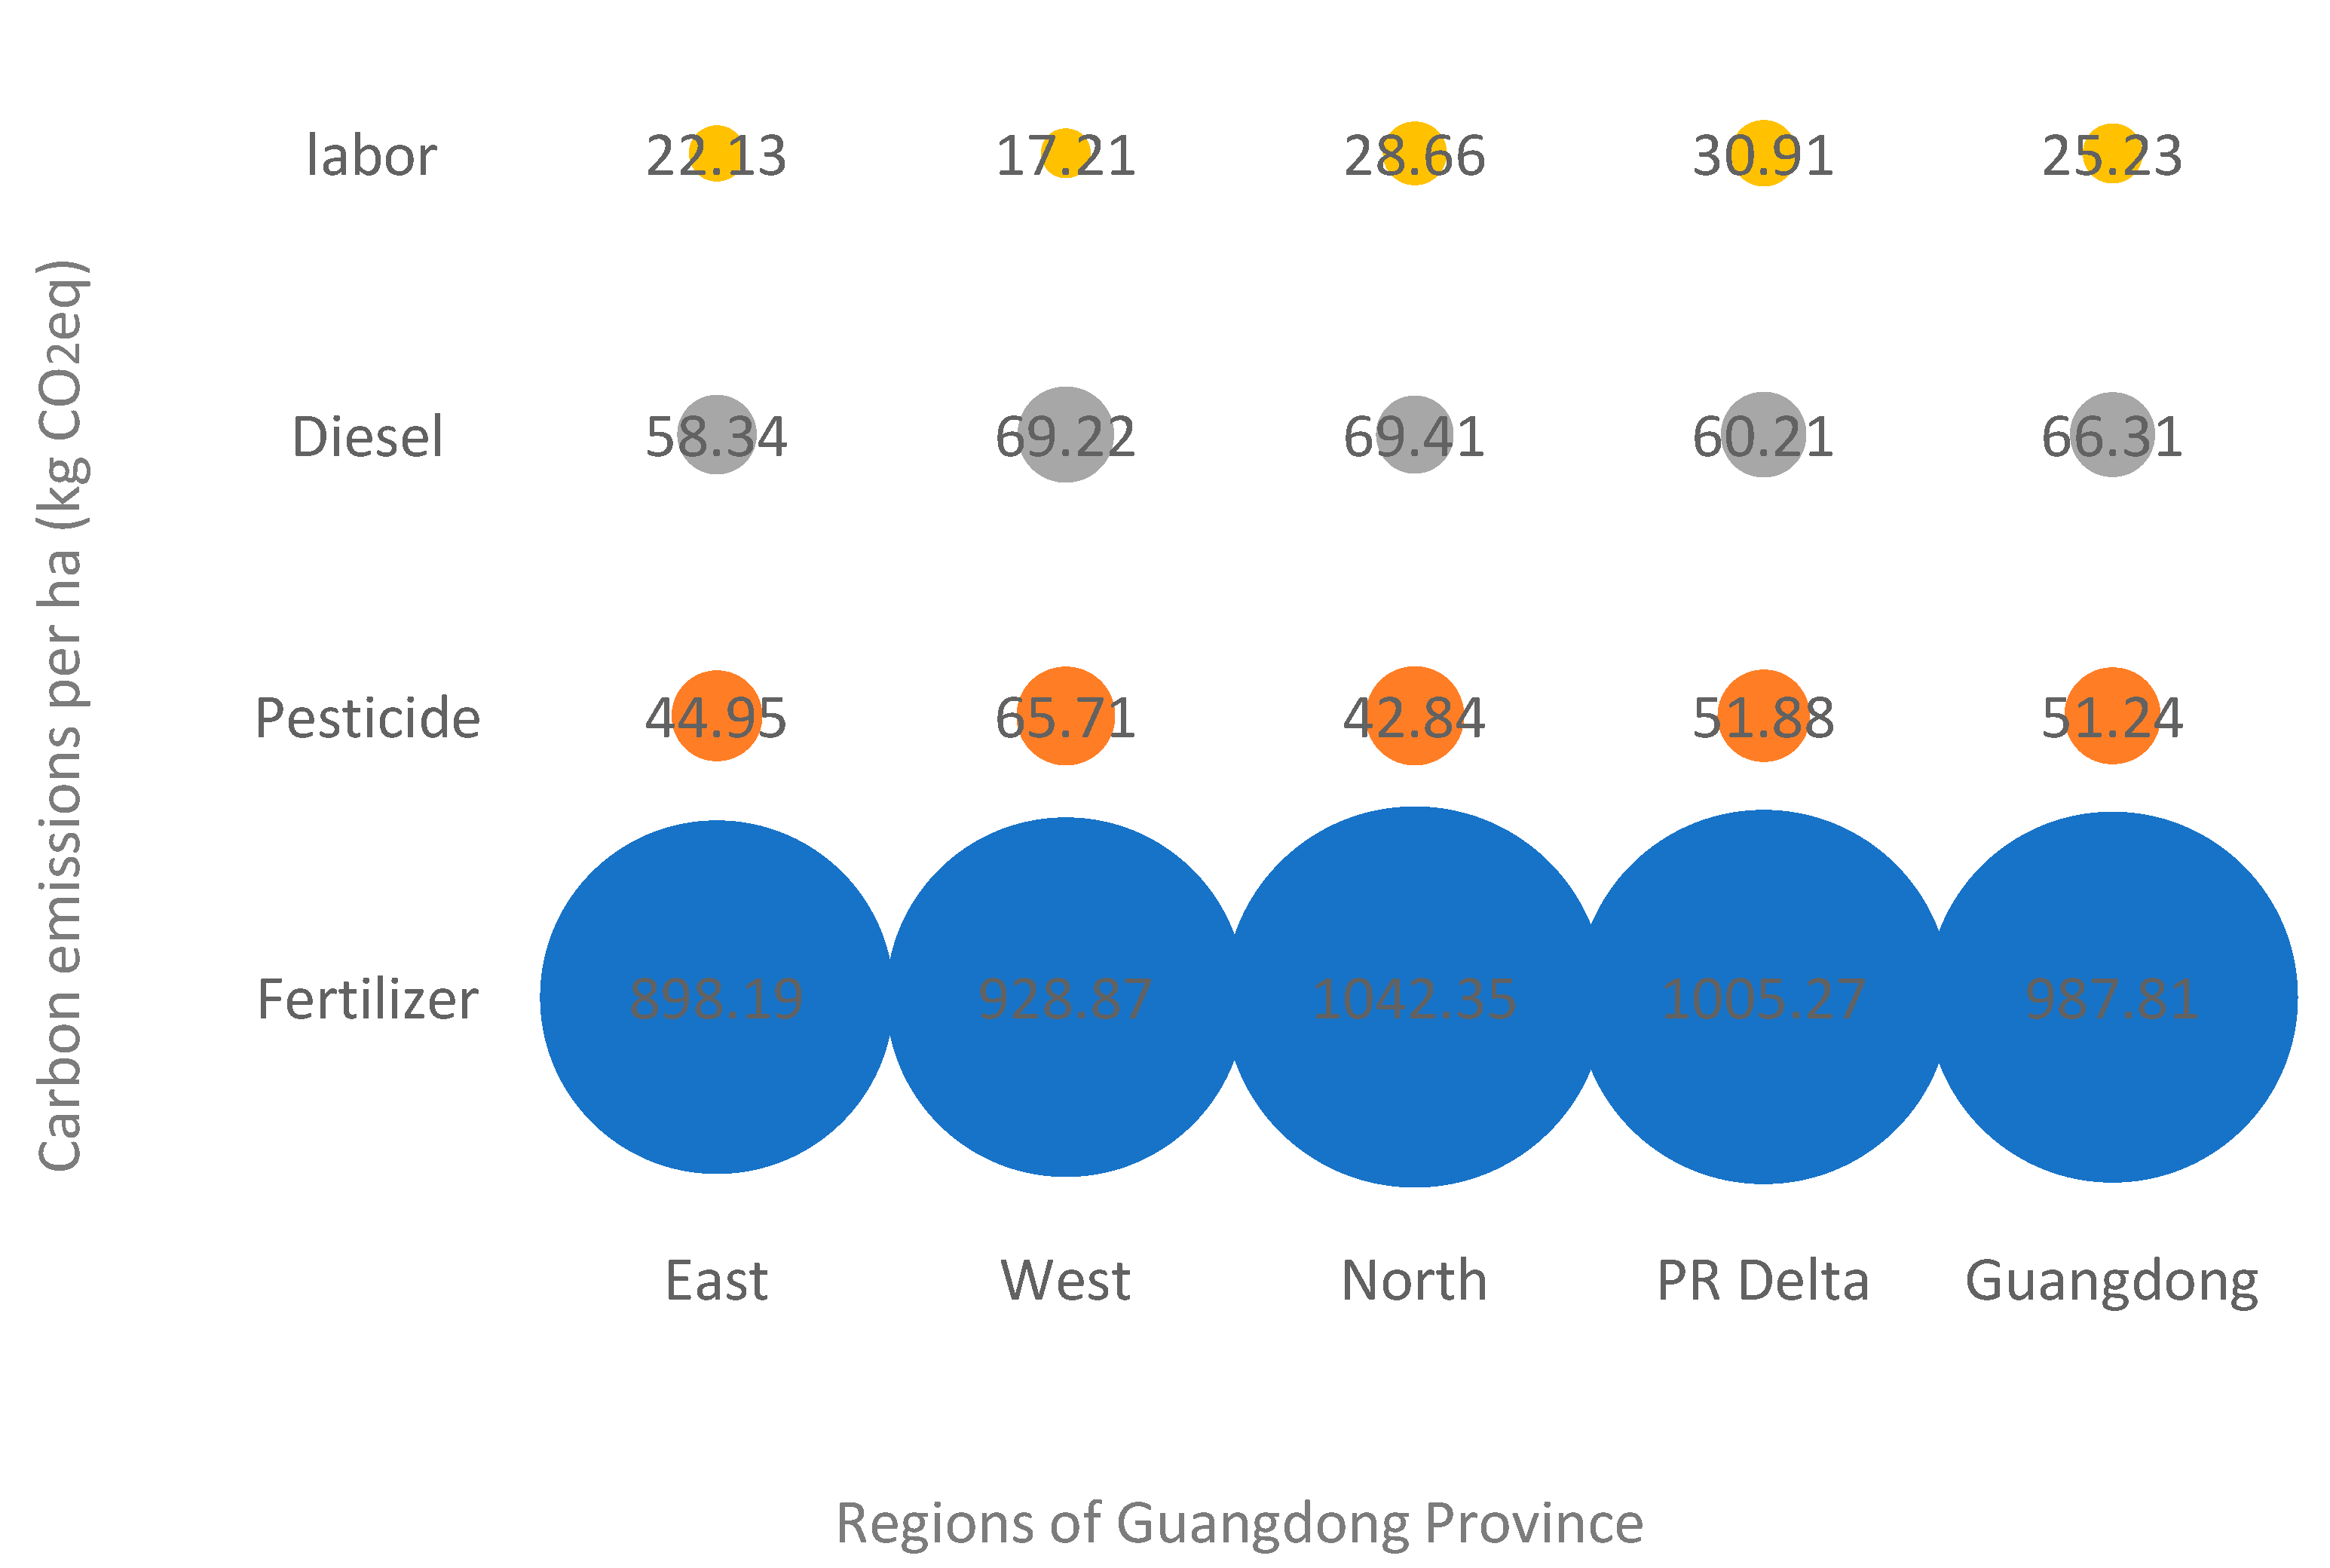
Table 5 details the sources of carbon emissions in rice production. Paddy fields account for about 75%, fertilizer inputs slightly exceed 21%, pesticides are around 1.5%, diesel is just over 1%, and manual inputs are slightly above 0.5%. For indirect emissions, regarding indirect carbon emissions intensity, fertilizer is the dominant contributor, responsible for 87.37% of the total, equating to 987.81 kg CO2eq·ha−1. The remaining indirect emissions are generated by pesticide (66.31 kg CO2eq·ha−1), diesel (51.24 kg CO2eq·ha−1), and manual labor (25.23 kg CO2eq·ha−1).
The diverse topography and landscapes across Guangdong’s four regions lead to distinct traditional rice cultivation practices. Furthermore, significant disparities in economic development levels and predominant industries across these areas influence farmers’ awareness of green production awareness and their adoption of green technologies. Consequently, this results in regional variations in carbon emissions from rice production.
Figure 4 presents the carbon emissions from various sources across different regions of Guangdong Province. Fertilizer-related emissions for rice production were highest in northern Guangdong at 1042.35 kg CO2eq·ha−1, followed by the PR Delta at 1005.27 kg CO2eq·ha−1. Western Guangdong emitted 76.4 kg CO2eq·ha−1 less than the PR Delta, while eastern Guangdong recorded the lowest emissions at 898.19 kg CO2eq·ha−1. In both northern and western Guangdong, emissions from pesticide use in rice production slightly exceeded 69 kg CO2eq·ha−1. Diesel-related emissions were notably higher in western Guangdong at 65.71 kg CO2eq·ha−1, surpassing the provincial average, whereas the other regions fell below this average, with northern Guangdong at the lowest, 42.84 kg CO2eq·ha−1. The PR Delta exhibited the highest emissions from artificial inputs at 30.91 kg CO2eq·ha−1, nearly 80% greater than those in western Guangdong. A substitution effect between labor input and diesel consumption was observed.
Variations in carbon emission intensity across Guangdong Province’s four regions primarily arise from fertilizer application rates. The northern Guangdong, characterized by mountainous and hilly terrain with low soil fertility and limited fertilizer retention, experiences lower average temperatures. Consequently, it applies the most fertilizers to support rice growth. Conversely, the PR Delta, with more favorable soil fertility and climate for rice production, practices high multiple cropping, including double- or triple-cropping rice, which necessitates substantial fertilizer use and results in high carbon emission intensity. In contrast, the western Guangdong and eastern Guangdong, benefiting from warmer climates and moderate soil fertility, apply less fertilizer, resulting in lower carbon emission intensity.

3.2. Impact of Land Operation Scale on Carbon Emissions of Rice Production

The impact of the farmers’ scale of operation on carbon emissions from rice production was examined using Stata 16.0. The regression results are presented in Table 6. Prior to empirical testing, a multi-collinearity test was conducted on all variables. The maximum, minimum, and average variance inflation factors (VIFs) were 1.05, 1.02, and 1.04, respectively. As all variables exhibited VIFs well below 10, there was no indication of severe multicollinearity.

3.2.1. Impact of Land Operation Scale on Carbon Emission Productivity

Table 6 presents the effects of the land operation scale on rice production carbon emission productivity. The findings reveal that land operation scale significantly enhances yield carbon emission productivity (Models 1 and 2) and yield value carbon emission productivity (Models 4 and 5). Specifically, the regression coefficients of farmers’ operation scale on yield indirect carbon emission productivity and yield value indirect carbon emission productivity are 0.408 (p < 0.01) and 0.574 (p < 0.05), respectively. Notably, the squared term of operation scale is negative but not significant (Models 3 and 6). Thus, increasing the scale of rice production consistently boosts carbon emission productivity without negative repercussions. These findings support the hypothesis (H1) that expanding the scale of rice production is an important strategy for improving the carbon emission productivity of rice production.

3.2.2. Impact of Land Operation Scale on Carbon Emission Intensity

Table 7 examines how operational scale influences the carbon emission intensity of rice production. The regression coefficient of farmers’ land operation scale on indirect carbon emission intensity is −61.978 at the 1% significance level, indicating a significant inhibitory effect (Models 7 and 8). However, the square term of the operational scale is significantly positive, indicating a U-shaped relationship between operation scale and carbon emission intensity (Models 9 and 10) The inflection point occurs at 10.68 ha; that is, when the operational scale of rice farmers is less than 10.68 ha, increasing the operational scale can reduce carbon emission intensity. However, when the operational scale exceeds 10.68 ha, increasing the operational scale will instead increase carbon emission intensity. Under economies of scale, expanding the operational scale allows farmers to better manage materials, energy, and labor, thereby reducing carbon emission intensity. However, the marginal benefits of economies of scale diminish, and beyond an optimal scale, ‘diseconomies of scale’ emerge. Since direct carbon emissions are area-based (3518.18 kg CO2eq·ha−1; Table 4), the influence of all variables, except ‘constant’, on indirect and total emissions remains consistent (Model 11), thus confirming Hypothesis 2.

4. Discussion

This study analyzes data from a primary survey of 916 rice farmers, collecting input–output data on their typical rice paddy plots. Utilizing the IPCC emission coefficient method, the carbon emission productivity and intensity of each farmer were calculated. The relationship between the scale of rice production operations and associated carbon emissions at the farmer level was then explored using Stata 16.0.
The carbon emission intensity of late rice in Guangdong is calculated at 4648.77 kg CO2eq·ha−1, closely aligning with Liu et al.’s [38] figure of 4595.40 CO2eq·ha−1 from macro data in the China Rural Statistical Yearbook (2002–2014), differing by only 1.14%. The convergence of these micro-level farmer data and macro-level provincial panel data underscores the reliability of these findings. Additionally, this study estimated the yield carbon emission productivity and the yield value carbon emission productivity of rice production, which were 1.347 kg·kg CO2eq−1 and 2.166 CNY·kg CO2eq−1, respectively. Provincial carbon emissions from rice production aggregate all farmers’ outputs, yet utilizing individual farmers’ input–output data captures production variability more accurately.
Carbon emission productivity, a metric that accounts for both carbon emissions and output, has garnered growing interest as an indicator for tracking green development among various international organizations [39]. The scale of land operations significantly affects carbon emissions in the planting industry [2,17,18,24], particularly for grain crops [23]. Prior research has examined the influence of varying grain production scales on chemical inputs [22], notably fertilizer [27], as well as on carbon intensity [17,18], and efficiency [40]. This study investigates individual rice farmers’ production practices and empirically demonstrates a significant positive relationship between operational scale and indirect carbon emission productivity. As the farmers’ operational scale expands, their yield and yield values per kilogram of indirect carbon emissions increase without an inverted U-shaped effect. This study identified a U-shaped nonlinear relationship between land operation scale and carbon emission intensity. As the scale of farming operations increases, carbon emissions per land unit initially decrease and then rise. This aligns with Liu et al.’s [17] finding on land operation scale, factor input, and carbon emissions using 17-year data from 31 Chinese provinces, and Bai et al.’s [18] results on land operation scale and carbon emission intensity using 20-year data from Gansu Province, China. The study corroborates the macro-level relationship between land operation scale and carbon emission intensity at the micro level and reveals that surpassing the optimal scale leads to increased carbon emission intensity. Despite generally much larger farm scales outside China, two micro-farm data studies reveal similar patterns in the relationship between farm scale, carbon emission efficiency, and carbon intensity. One study finds that while large-scale farms exhibit higher total factor productivity, small-scale farms (under 10 hectares) achieve a greater reduction in carbon emission intensity. However, rice production shows the least reduction in carbon emission intensity compared to other farm types [41]. The other study revealed that larger agricultural operations exhibited relatively higher carbon productivity. Specifically, farms within the 15–40-hectare range displayed optimal carbon productivity, while those exceeding 40 hectares experienced a decline in carbon productivity [42].
The scale of agricultural operations plays a pivotal role in environmental and economic sustainability, the core of which is the reduction in chemical inputs [43]. While increased fertilizer application can boost yields, it also leads to higher carbon emissions. Xu et al. [9] applied the data of about 2000 tracked farmers from five provinces in China to reveal that from 2018 to 2022, greenhouse gas emission intensity increased by 12.2%, while green total factor productivity rose by only 7.7%. Thus, improving carbon productivity requires the adoption of advanced agricultural technologies, such as soil testing and formula fertilizers, deep application of fertilizers, and extension of conservation tillage, as recommended by Xiong [21]. However, the successful implementation of these technologies necessitates a shift away from smallholder farming towards larger-scale production models. Yu’s [44] analysis of smallholder, large-scale family, cooperative, and industrial farms in Wuzhong County, Taihu Lake Region, China, revealed 7% more crop yield while using 8% less fertilizer, leading to a 28% decrease in pollutant emission. Consequently, the path to high-carbon productivity for rice cultivation lies in the development of new models of large-scale land operation.

5. Conclusions

The present study employed the IPCC emission coefficient method to calculate the emission intensity of late rice production in Guangdong as 4648.77 kg CO2eq·ha−1. This calculation was derived from inputs of fertilizers, pesticides, diesel, and labor reported by 916 randomly sampled rice farmers. The emission intensity closely aligns with macro-level data, differing by only 1.14%, thus confirming the feasibility and scientific validity of assessing agricultural carbon emissions at the micro-farmer level. Moreover, compared to carbon emission intensity, carbon emission productivity more effectively integrates output and emissions, aligning better with practical needs. Using rice yield data and its selling price, we calculated yield carbon emission productivity at 1.347 kg·kg CO2eq−1 and yield value carbon emission productivity at 2.166 CNY·kg CO2eq−1. Finally, China’s per capital land operation scale is small, with Guangdong being particularly notable (Table 2). Analysis of primary data from individual farmers reveals that operational scale significantly enhances indirect carbon emission productivity and exhibits a U-shaped effect on carbon emission intensity. This underscores the principle of economies of scale in rice production, indicating an optimal operating scale for minimizing carbon emission intensity.
The findings of this study offer important policy implications for enhancing rice yields while reducing carbon emissions. The government should incentivize rice farmers to expand their operational scale as very small-scale operations are inherently inefficient, resulting in low output and high costs. Policies should thus promote land transfer to facilitate large-scale rice farming. It should be noted that the optimal operational scale for rice production to minimize carbon emission intensity is below 10 ha. In the context of Guangdong Province, policy interventions should prioritize the northern Guangdong and PR Delta regions, as these exhibit relatively higher carbon emission intensities associated with rice production. Overall, encouraging moderate-scale rice production is essential for the balanced development of increased production and reduced carbon emissions.

Author Contributions

Conceptualization, H.L. and S.L.; methodology, H.L.; software, H.L. and M.S.; validation, H.L. and S.L.; formal analysis, H.L.; investigation, H.L. and M.S.; resources, S.L. and H.L.; writing—original draft preparation, H.L.; writing—review and editing, M.S. and S.L.; supervision, S.L.; funding acquisition, H.L., M.S. and S.L. All authors have read and agreed to the published version of the manuscript.

Funding

This research was funded by Guangdong Province Philosophy and Social Science Planning Project (GD23CYJ07), Guangdong Office of Philosophy and Social Science (GD24WTCXGC07), Guangdong Basic and Applied Basic Research Foundation (2022A1515011049), and National Fund of Philosophy and Social Science Foundation of China (24BJL007).

Institutional Review Board Statement

This research is approved by Ethics Committee of College of Economics and management, SCAU. Approval code: 510051.

Informed Consent Statement

Not applicable.

Data Availability Statement

All data included in this study are available upon request from the corresponding author.

Acknowledgments

Thanks very much to the Rice Farmer Production Behavior field survey team, and the Soil Lab team, especially Miss Yirui Zhang.

Conflicts of Interest

The authors declare no conflicts of interest.

References

  1. IPCC. Climate Change 2014: The Fifth Assessment Report of the Intergovernmental Panel on Climate Change; IPCC: Geneva, Switzerland, 2014. [Google Scholar]
  2. FAO (Food and Agriculture Organization of the United Nations). Statistics of Rice Production in 2019 Based on Continent; FAO Statistical Database; FAO: Rome, Italy, 2019. [Google Scholar]
  3. NBS (National Bureau of Statistics of China). Announcement of the National Bureau of Statistics on Grain Production Data for 2024. Available online: https://www.stats.gov.cn/sj/zxfb/202412/t20241213_1957744.html (accessed on 10 June 2025).
  4. Yan, M.; Cheng, K.; Luo, T.; Yan, Y.; Pan, G.; Rees, R.M. Carbon footprint of grain crop production in China—Based on farm survey data. J. Clean. Prod. 2015, 104, 130–138. [Google Scholar] [CrossRef]
  5. Beinhocker, E.; Oppenheim, J.; Irons, B.; Lahti, M.; Farrell, D.; Nyquist, S.; Remes, J.; Nauclér, T.; Enkvist, P.-A. The Carbon Emission Productivity Challenge: Curbing Climate Change and Sustaining Economic Growth; McKinsey & Company: Sydney, Australia, 2008. [Google Scholar]
  6. NBS (National Bureau of Statistics of China). The Total Population Has Slightly Decreased, and the Level of Urbanization Continues to Increase. Available online: http://www.stats.gov.cn/xxgk/jd/sjjd2020/202301/t20230118_1892285.html (accessed on 20 December 2023).
  7. Zhu, Y.; Waqas, M.A.; Li, Y.; Zou, X.; Jiang, D.; Wilkes, A.; Qin, X.; Gao, Q.; Wan, Y.; Hasbagan, G. Large-scale farming operations are win-win for grain production, soil carbon storage and mitigation of greenhouse gases. J. Clean. Prod. 2018, 172, 2143–2152. [Google Scholar] [CrossRef]
  8. Zhang, W.; Zhang, Y.; Deng, A.; Zhang, J. Integrated impacts and trend analysis of rice cultivar renewal and planting technology improvement on carbon emission in China. China Rice 2021, 27, 53–57. [Google Scholar]
  9. Xu, X.; Zhou, Z.; Sun, M.; Bai, Y.; Zhang, L. Dual growth of green total factor productivity and greenhouse gas emission intensity of smallholder farms in China: Trends and misallocation. Resour. Conserv. Recycl. 2025, 222, 108421. [Google Scholar] [CrossRef]
  10. Zhang, Z.; Mu, Y. Can industrial agglomeration improve agricultural carbon emission productivity? China Popul. Resour. Environ. 2019, 29, 57–65. [Google Scholar]
  11. Luo, B. Agricultural modernization in China: Development context, goal setting and strategic options. J. Mod. Stud. 2023, 2, 65–78. [Google Scholar]
  12. West, P.; Gerber, J.; Engstrom, P.; Mueller, N.D.; Brauman, K.A.; Carlson, K.M.; Cassidy, E.S.; Johnston, M.; MacDonald, G.K.; Ray, D.K.; et al. Leverage points for improving global food security and the environment. Science 2014, 345, 325–328. [Google Scholar] [CrossRef] [PubMed]
  13. Adewale, C.; Reganold, J.; Higgins, S.; Higgins, S.; Evans, R.D.; Carpenter-Boggs, L. Agricultural carbon footprint is farm specific: Case study of two organic farms. J. Clean. Prod. 2019, 229, 795–805. [Google Scholar] [CrossRef]
  14. Unakitan, G.; Hurma, H.; Yilmaz, F. An analysis of energy use efficiency of canola production in Turkey. Energy 2010, 35, 3623–3627. [Google Scholar] [CrossRef]
  15. Arunrat, N.; Pumijumnong, N.; Sereenonchai, S.; Chareonwong, U.; Wang, C. Comparison of GHG emissions and farmers’ profit of large-scale and individual farming in rice production across four regions of Thailand. J. Clean. Prod. 2021, 278, 123945. [Google Scholar] [CrossRef]
  16. Ortiz-Gonzalo, D.; Vaast, P.; Oelofse, M.; Neergaard, A.; Albrecht, A.; Rosenstock, T.S. Farm-scale greenhouse gas balances, hotspots and uncertainties in smallholder crop-livestock systems in Central Kenya. Agric. Ecosyst. Environ. 2017, 248, 58–70. [Google Scholar] [CrossRef]
  17. Liu, Q.; Xiao, H. What is the logic behind the impact of agricultural land management scale on agricultural carbon emissions?—The mediating effect of factors input and the moderating effect of personal quality. Rural Econ. 2020, 5, 10–17. [Google Scholar]
  18. Bai, J.; Liu, J.; Ma, L.; Zhang, W. The impact of farmland management scale on carbon emissions. Land 2023, 12, 1760. [Google Scholar] [CrossRef]
  19. Liu, N.; Hu, H.; Hu, Y. Research on structural characteristics and affecting factors of carbon emission of rice production in Jiangsu Province—Based on farmers’ factors input and scale. J. Anhui Agric. Sci. 2014, 42, 4121–4124. [Google Scholar]
  20. Huang, Q.; Zhang, Y. Decoupling and decomposition analysis of agricultural carbon emissions: Evidence from Heilongjiang Province, China. Int. J. Environ. Res. Public Health 2022, 19, 198. [Google Scholar] [CrossRef]
  21. Xiong, C.; Wang, G.; Su, W.; Gao, Q. Selecting low-carbon technologies and measures for high agricultural carbon productivity in Taihu Lake Basin, China. Environ. Sci. Pollut. Res. 2021, 28, 49913–49920. [Google Scholar] [CrossRef]
  22. Wu, Y.; Xi, X.; Tang, X.; Luo, D.; Gu, B.; Lam, S.K.; Vitousek, P.M.; Chen, D. Policy distortions, farm size, and the overuse of agricultural chemicals in China. Proc. Natl. Acad. Sci. USA 2018, 115, 7010–7015. [Google Scholar] [CrossRef]
  23. Xie, D.; Gao, W. Low-carbon transformation of China’s smallholder agriculture: Exploring the role of farmland size expansion and green technology adoption. Environ. Sci. Pollut. Res. 2023, 30, 105522–105537. [Google Scholar] [CrossRef]
  24. Xu, X.; Li, C.; Guo, J.; Zhang, L. Land transfer-in scale, land operation scale and carbon emissions from crop planting throughout the life cycle: Evidence from China rural development survey. China Rural Econ. 2022, 11, 40–58. [Google Scholar]
  25. Qiu, T.; Choy, S.; Li, Y.; Luo, B.; Li, J. Farmers’ exit from land operation in rural China: Does the price of agricultural mechanization services matter? China World Econ. 2021, 29, 99–122. [Google Scholar] [CrossRef]
  26. IPCC. IPCC Guidelines for National Greenhouse Gas Inventories, Volume 4: Agriculture, Forestry and Other Land Use; IPCC: Geneva, Switzerland, 2006. [Google Scholar]
  27. Ju, X.; Gu, B.; Wu, Y.; Galloway, J. Reducing China’s fertilizer use by increasing farm size. Glob. Environ. Chang. 2016, 41, 26–32. [Google Scholar] [CrossRef]
  28. Fan, L.; Niu, H.; Yang, X.; Qin, W.; Bento, C.P.; Ritsema, C.J.; Geissen, V. Factors affecting farmers’ behaviour in pesticide use: Insights from a field study in northern China. Sci. Total Environ. 2015, 537, 360–368. [Google Scholar] [CrossRef] [PubMed]
  29. Wu, H.; Hao, H.; Lei, H.; Ge, Y.; Shi, H.; Song, Y. Farm size, risk aversion and overuse of fertilizer: The heterogeneity of large-scale and small-scale wheat farmers in Northern China. Land 2021, 10, 111. [Google Scholar] [CrossRef]
  30. Liao, L.; Long, H.; Ma, E. Changes of rural labor factors and transformation of cultivated land use. Econ. Geogr. 2021, 41, 148–155. [Google Scholar]
  31. Xia, L.; Ti, C.; Li, B.; Xia, Y.; Yan, X. Greenhouse gas emissions and reactive nitrogen releases during the life-cycles of staple food production in China and their mitigation potential. Sci. Total Environ. 2016, 556, 116–125. [Google Scholar] [CrossRef]
  32. Chen, S.; Liu, T.; Cao, C.; Ling, L.; Wang, B. Situation of carbon neutrality in rice planting and techniques for low-carbon rice farming. J. Huazhong Agric. Univ. 2021, 40, 3–12. [Google Scholar]
  33. Chen, L.; Yan, M.; Pan, G. Evaluation of the carbon footprint of greenhouse vegetable production based on questionnaire survey from Nanjing, China. J. Agro-Environ. Sci. 2011, 30, 1791–1796. [Google Scholar]
  34. Min, J.; Hu, H. Calculation of greenhouse gases emission from agriculture production in China. China Popul. Resour. Environ. 2012, 22, 21–27. [Google Scholar]
  35. Cao, L.; Li, M.; Wang, X.; Zhao, Z.; Pan, X. Life cycle assessment of carbon footprint for rice planting in Shanghai. Acta Ecol. Sin. 2014, 34, 491–499. [Google Scholar]
  36. Wang, M.; Li, J.; Zheng, X. Methane emission and mechanisms of methane production, oxidation, transportation in the rice fields. Chin. J. Atmos. Sci. 1998, 4, 600–612. [Google Scholar]
  37. IPCC. Climate Change 2013: The Physical Science Basis; Cambridge University Press: New York, NY, USA, 2013. [Google Scholar]
  38. Liu, Y.; Zhang, J.B.; Zhang, L. Analysis of carbon emission efficiency of rice in China under different rice planting patterns based on the DEA-SBM model. J. China Agric. Univ. 2018, 23, 177–186. [Google Scholar]
  39. OECD. Green Growth Indicators for Agriculture; OECD Publishing: Paris, France, 2014. [Google Scholar]
  40. Ma, L.; Feng, S.; Reidsma, P.; Qu, F.; Heerink, N. Identifying entry points to improve fertilizer use efficiency in Taihu Basin, China. Land Use Policy 2014, 37, 52–59. [Google Scholar] [CrossRef]
  41. Baldoni, E.; Coderoni, S.; Esposti, R. The productivity and environment nexus with farm-level data. Bio-Based Appl. Econ. 2017, 6, 119–137. [Google Scholar]
  42. Coderoni, S.; Vanino, S. The farm-by-farm relationship among carbon productivity and economic performance of agriculture. Sci. Total Environ. 2022, 819, 153103. [Google Scholar] [CrossRef]
  43. Ren, C.; Liu, S.; Grinsven, H.; Qu, F.; Heerink, N. The impact of farm size on agricultural sustainability. J. Clean. Prod. 2019, 220, 357–367. [Google Scholar] [CrossRef]
  44. Yu, Y.; Hu, Y.; Gu, B.; Reis, S.; Yang, L. Reforming smallholder farms to mitigate agricultural pollution. Environ. Sci. Pollut. Res. 2022, 29, 13869–13880. [Google Scholar] [CrossRef]
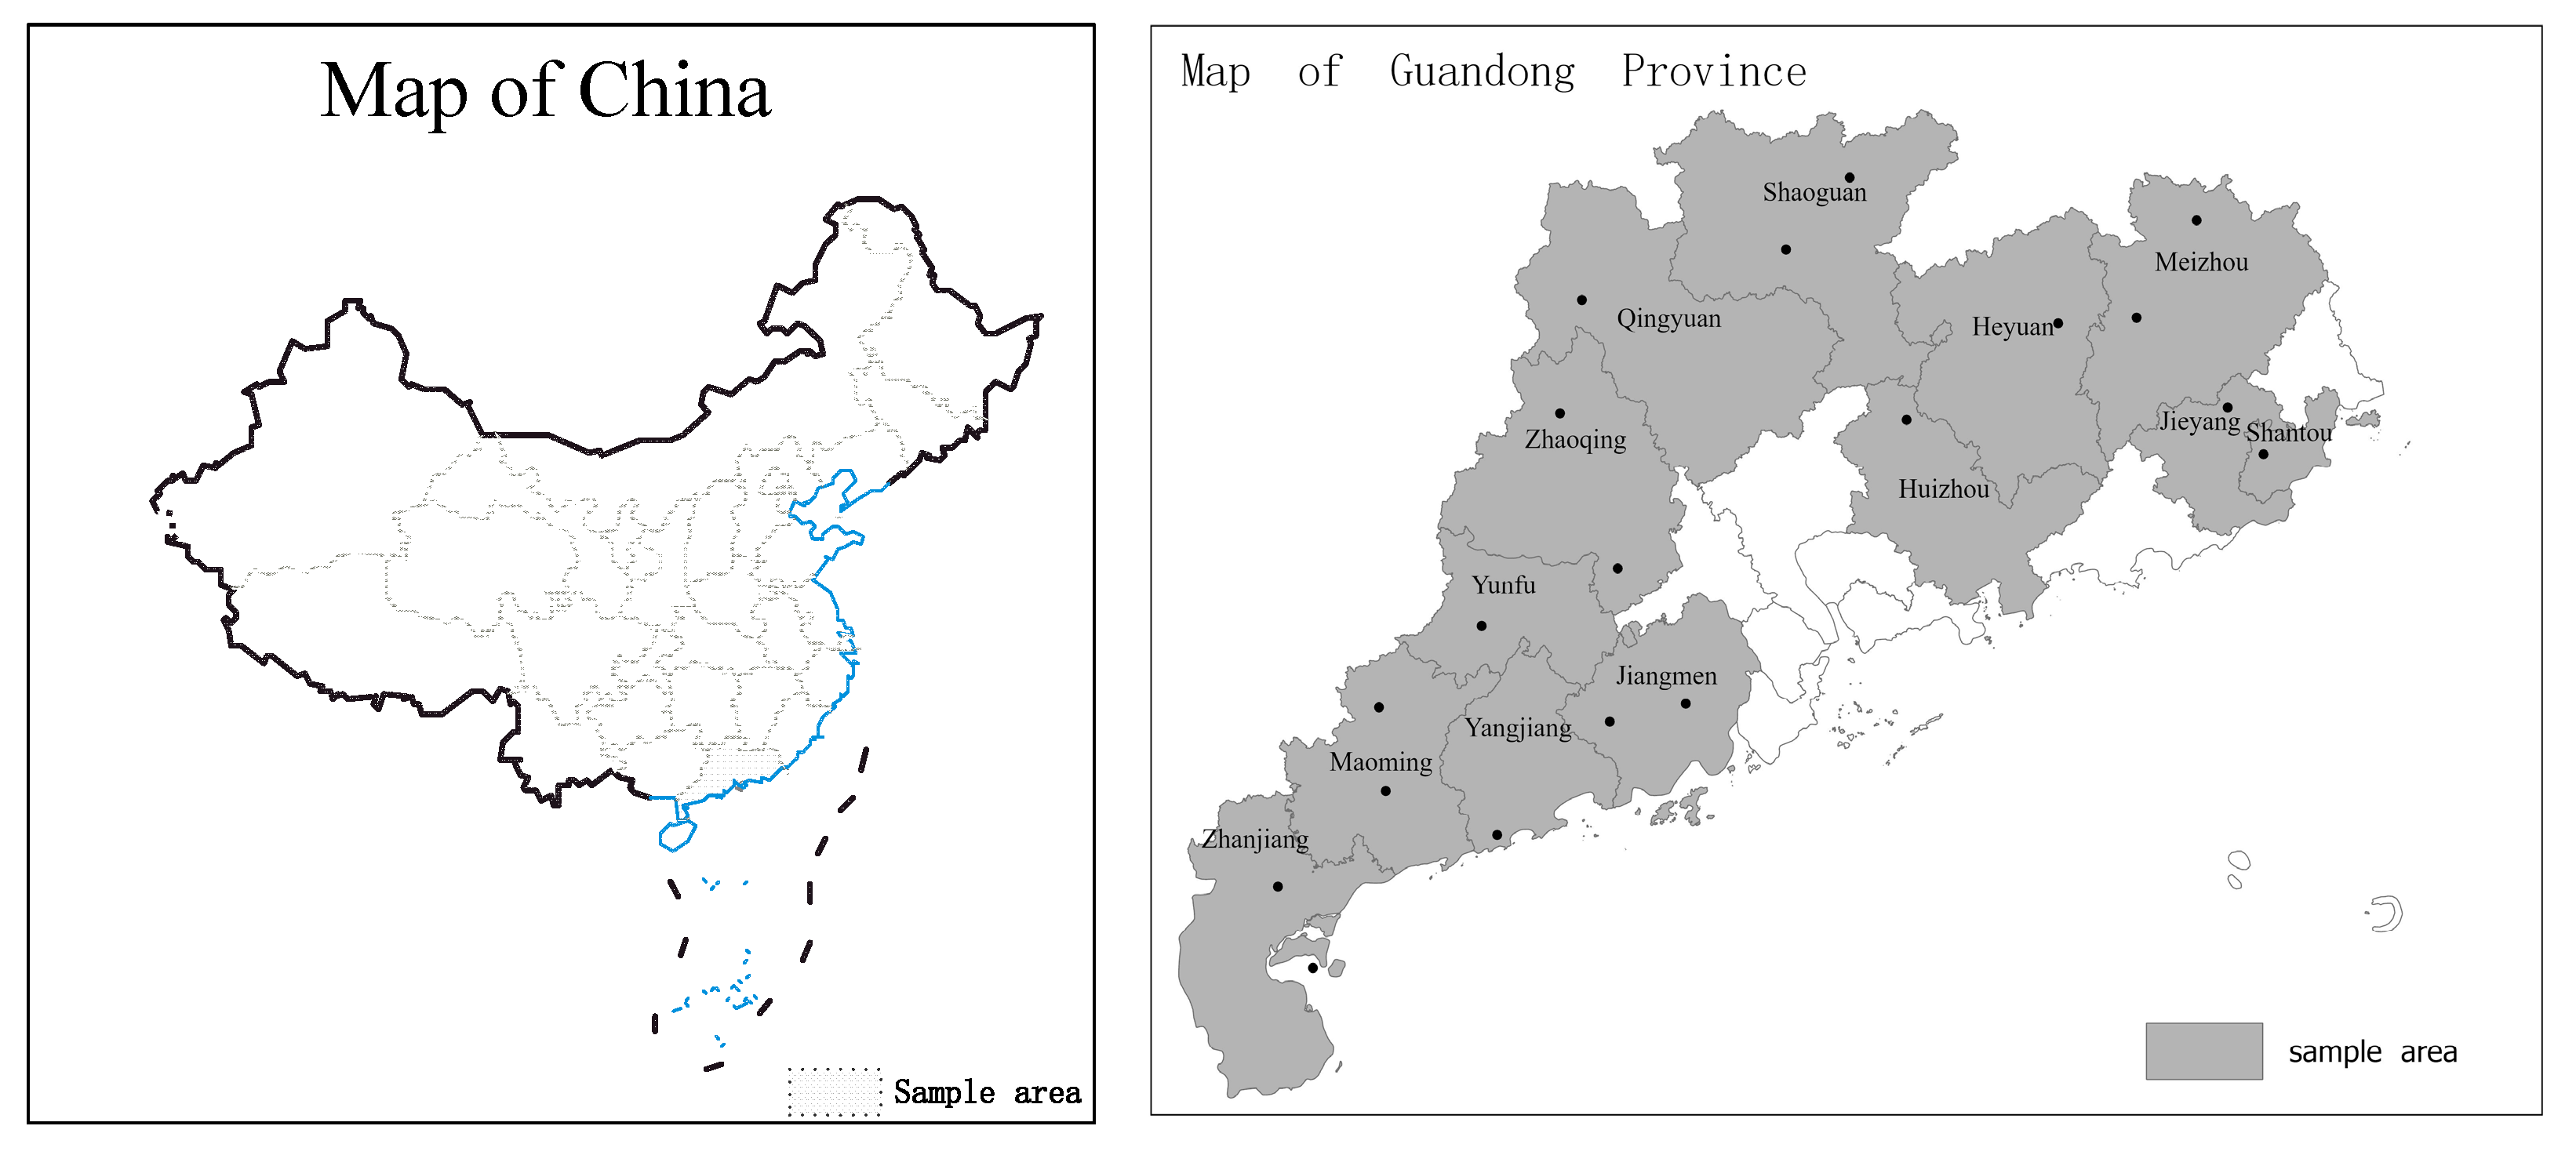
Figure 1. Location of the survey areas.
Land 14 01750 g001
Figure 2. Distribution map of sample counties.
Land 14 01750 g002
Figure 3. Theoretical analysis of land operational scale affecting carbon emissions.
Land 14 01750 g003
Figure 4. Carbon emissions of rice production input factors in different regions in Guangdong.
Land 14 01750 g004
Table 1. Descriptive statistics of the samples’ family and its rice production decision-makers (n = 916).
VariablesDefinitionMeanStd. Dev.MinMax
AgeAge (year)59.609.6712887
Gender 1 = man; 0 = woman0.7230.44801
Education levelYears of schooling (year)6.9523.393016
Health status1 = excellent; 2 = acceptable; 3 = poor1.2890.55213
Village cadre1 = yes; 0 = no0.0930.29001
Farming experienceYears of farming (year)35.6015.08075
Usage of smartphone1 = yes; 0 = no0.7010.45801
Operational scaleFamily’s operational scale of rice paddy (ha)0.4720.9650.0716.39
Family incomeFamily income of 2020 (CNY)78,763104,64012,013,000
Family sizePopulation of the family5.5502.474118
Living sizeSize of living place (m2)223.2187.8122805
Region 1 = East region; 2 = West region; 3 = North region; 4 = Pear River Delta2.7090.91014
Table 2. Number of farmers with different operational scales of rice paddy.
≥2 ha1–2 ha0.5–1 ha0.25–0.5 ha0.125–0.25 ha<0.125 ha
Number of farmers31(3.38%)42 (4.59%)118 (12.88%)292 (31.88%)293 (31.99%)140 (15.28%)
Table 3. Greenhouse gas emission factors and their coefficients of rice production.
Emission Source TypeEmission SourceEmission CoefficientData Source
Indirect emissionsInput of materialsChemical fertilizer0.8956 kg CO2eq·kg−1Oak Ridge National Lab, US
Pesticide4.9341 kg CO2eq·kg−1
Input of energyDiesel 0.5921 kg CO2eq·kg−1IPCC
Labor 0.25 kg CO2eq·day−1[33]
Direct emissionsSoil emissionsPaddy CH4 emissions (late rice in Guangdong, China) 516 kgCH4·ha−1[34]
Note: The direct emissions of greenhouse gases from rice paddy also include N2O. According to Cao et al. [35], the direct emission of N2O from rice paddy is very little; so, the emission of N2O is ignored in this paper.
Table 4. Carbon emissions of samples’ typical plots of rice paddy (n = 916).
UnitMeanStd. Dev.MinMax
Sizeha0.1260.2810.00674.667
Yield kg743.415354528,000
Market value of yieldCNY1234301576.5057,400
Carbon emissionskg CO2eq567.9124729.0121,547
Indirect carbon emissionskg CO2eq124.2275.35.5605129
Yield carbon emission productivitykg·kg CO2eq−11.3470.3160.5782.361
Yield value carbon emission productivityCNY·kg CO2eq−12.1660.6350.7144.562
Carbon emission intensitykg CO2eq·ha−14649545.136706826
Table 5. Proportion of different carbon emission sources in rice production (n = 916).
Carbon Emission Source TypeCarbon Emission SourceMean
(kg CO2eq·ha−1)
Std. Dev.Percentage in Total Carbon Emissions (%)Percentage in Indirect Carbon Emissions (%)
Indirect carbon emissionsMaterial inputFertilizer987.81524.0821.2587.37
Pesticide66.3142.371.435.87
Energy inputDiesel51.2446.041.114.53
Labor25.2326.060.532.23
Direct carbon emissionsPaddy emission (late rice)CH43518.18075.68-
Total4648.77545.13100.00100.00
Table 6. Impact of the operational scale on carbon emission productivity (n = 916).
VariablesYield Indirect Carbon Emission ProductivityYield Value Indirect Carbon Emission Productivity
Model 1Model 2Model 3Model 4Model 5Model 6
Scale0.399 ***0.408 ***0.557 *0.603 **0.574 **1.198 **
(2.64)(2.65)(1.75)(2.30)(2.17)(2.20)
Scale × Scale--−0.014--−0.057
--(−0.54)--(−1.31)
Age-−0.023−0.022-−0.046−0.044
-(−0.99)(−0.97)-(−1.17)(−1.12)
Gender-−0.029−0.030-0.0700.066
-(−0.08)(−0.08)-(0.11)(0.11)
Education level-0.0100.009-0.0080.006
-(0.20)(0.19)-(0.10)(0.07)
Health status-0.540 *0.539 *-0.846 *0.842 *
-(1.95)(1.95)-(1.78)(1.77)
Village cadre-−0.084−0.102-−0.275−0.348
-(−0.16)(−0.20)-(−0.31)(−0.39)
Farming experience -0.0030.003-0.0060.004
-(0.23)(0.19)-(0.26)(0.16)
Usage of smartphone-0.3110.309-0.3450.334
-(0.84)(0.83)-(0.54)(0.52)
Family size-−0.064−0.062-−0.206 *−0.200 *
-(−1.03)(−1.01)-(−1.93)(−1.87)
Living size-−0.000−0.000-0.0010.001
-(−0.22)(−0.21)-(0.39)(0.40)
Ln (family income)-0.1100.103-0.321 *0.288
-(1.06)(0.97)-(1.79)(1.59)
Region-−0.613 ***−0.623 ***-−0.602 **−0.641 **
-(−3.74)(−3.78)-(−2.14)(−2.26)
Constant6.730 ***7.881 ***7.928 ***10.904 ***11.242 ***11.437 ***
(40.98)(4.47)(4.49)(38.79)(3.71)(3.77)
R-squared0.0070.0320.0330.0060.0230.025
*, **, and *** indicate significance at the 10%, 5%, and 1% levels, respectively, with the standard errors in parentheses.
Table 7. Impact of the operational scale on the carbon emission intensity (n = 916).
VariablesIndirect Carbon Emission IntensityCarbon Emission Intensity
Model 7Model 8Model 9Model 10Model 11
Scale−66.946 ***−61.978 ***−138.954 ***−126.158 ***−126.158 ***
(−3.61)(−3.32)(37.574)(−3.28)(−3.28)
Scale × Scale--6.722 **5.908 *5.908 *
--(3.053)(1.91)(1.91)
Age -2.628-2.4182.418
-(0.95)-(0.88)(0.88)
Gender-38.970-39.42939.429
-(0.90)-(0.91)(0.91)
Education level-−4.814-−4.544−4.544
-(−0.85)-(−0.81)(−0.81)
Health status-−36.865-−36.389−36.389
-(−1.10)-(−1.09)(−1.09)
Village cadre-−87.618-−80.054−80.054
-(−1.39)-(−1.27)(−1.27)
Farming experience -−1.216-−0.988−0.988
-(−0.76)-(−0.62)(−0.62)
Usage of smartphone-−34.138-−32.980−32.980
-(−0.76)-(−0.73)(−0.73)
Family size-6.926-6.3006.300
-(0.92)-(0.84)(0.84)
Living size-0.140-0.1370.137
-(1.45)-(1.42)(1.42)
Ln (family income)-−37.880 ***-−34.466 ***−34.466 ***
-(−2.99)-(−2.70)(−2.70)
Region -46.257 **-50.312 **50.312 **
-(2.33)-(2.52)(2.52)
Constant1162.206 ***1342.101 ***1188.461 ***1322.103 ***4840.285 ***
(58.33)(6.28)(23.183)(6.19)(22.65)
R-squared0.0140.0410.0170.0450.045
*, **, and *** indicate significance at the 10%, 5%, and 1% levels, respectively, with the standard errors in parentheses.
Disclaimer/Publisher’s Note: The statements, opinions and data contained in all publications are solely those of the individual author(s) and contributor(s) and not of MDPI and/or the editor(s). MDPI and/or the editor(s) disclaim responsibility for any injury to people or property resulting from any ideas, methods, instructions or products referred to in the content.