Article

Assessing Coastal Vulnerability in Finland: A Geoinformation-Based Approach Using the CVI

by
Konstantina Lymperopoulou
1,2,
George P. Petropoulos
1,*,
Anna Karkani
2,
Niki Evelpidou
2 and
Spyridon E. Detsikas
1
1
Department of Geography, Harokopio University of Athens, El. Venizelou Street, 70, 17671 Athens, Greece
2
Faculty of Geology and Geoenvironment, National and Kapodistrian University of Athens, Panepistimiopolis Zografou, 15784 Athens, Greece
*
Author to whom correspondence should be addressed.
Land 2025, 14(9), 1741; https://doi.org/10.3390/land14091741
Submission received: 29 June 2025 / Revised: 12 August 2025 / Accepted: 14 August 2025 / Published: 27 August 2025
(This article belongs to the Section Landscape Ecology)

Abstract

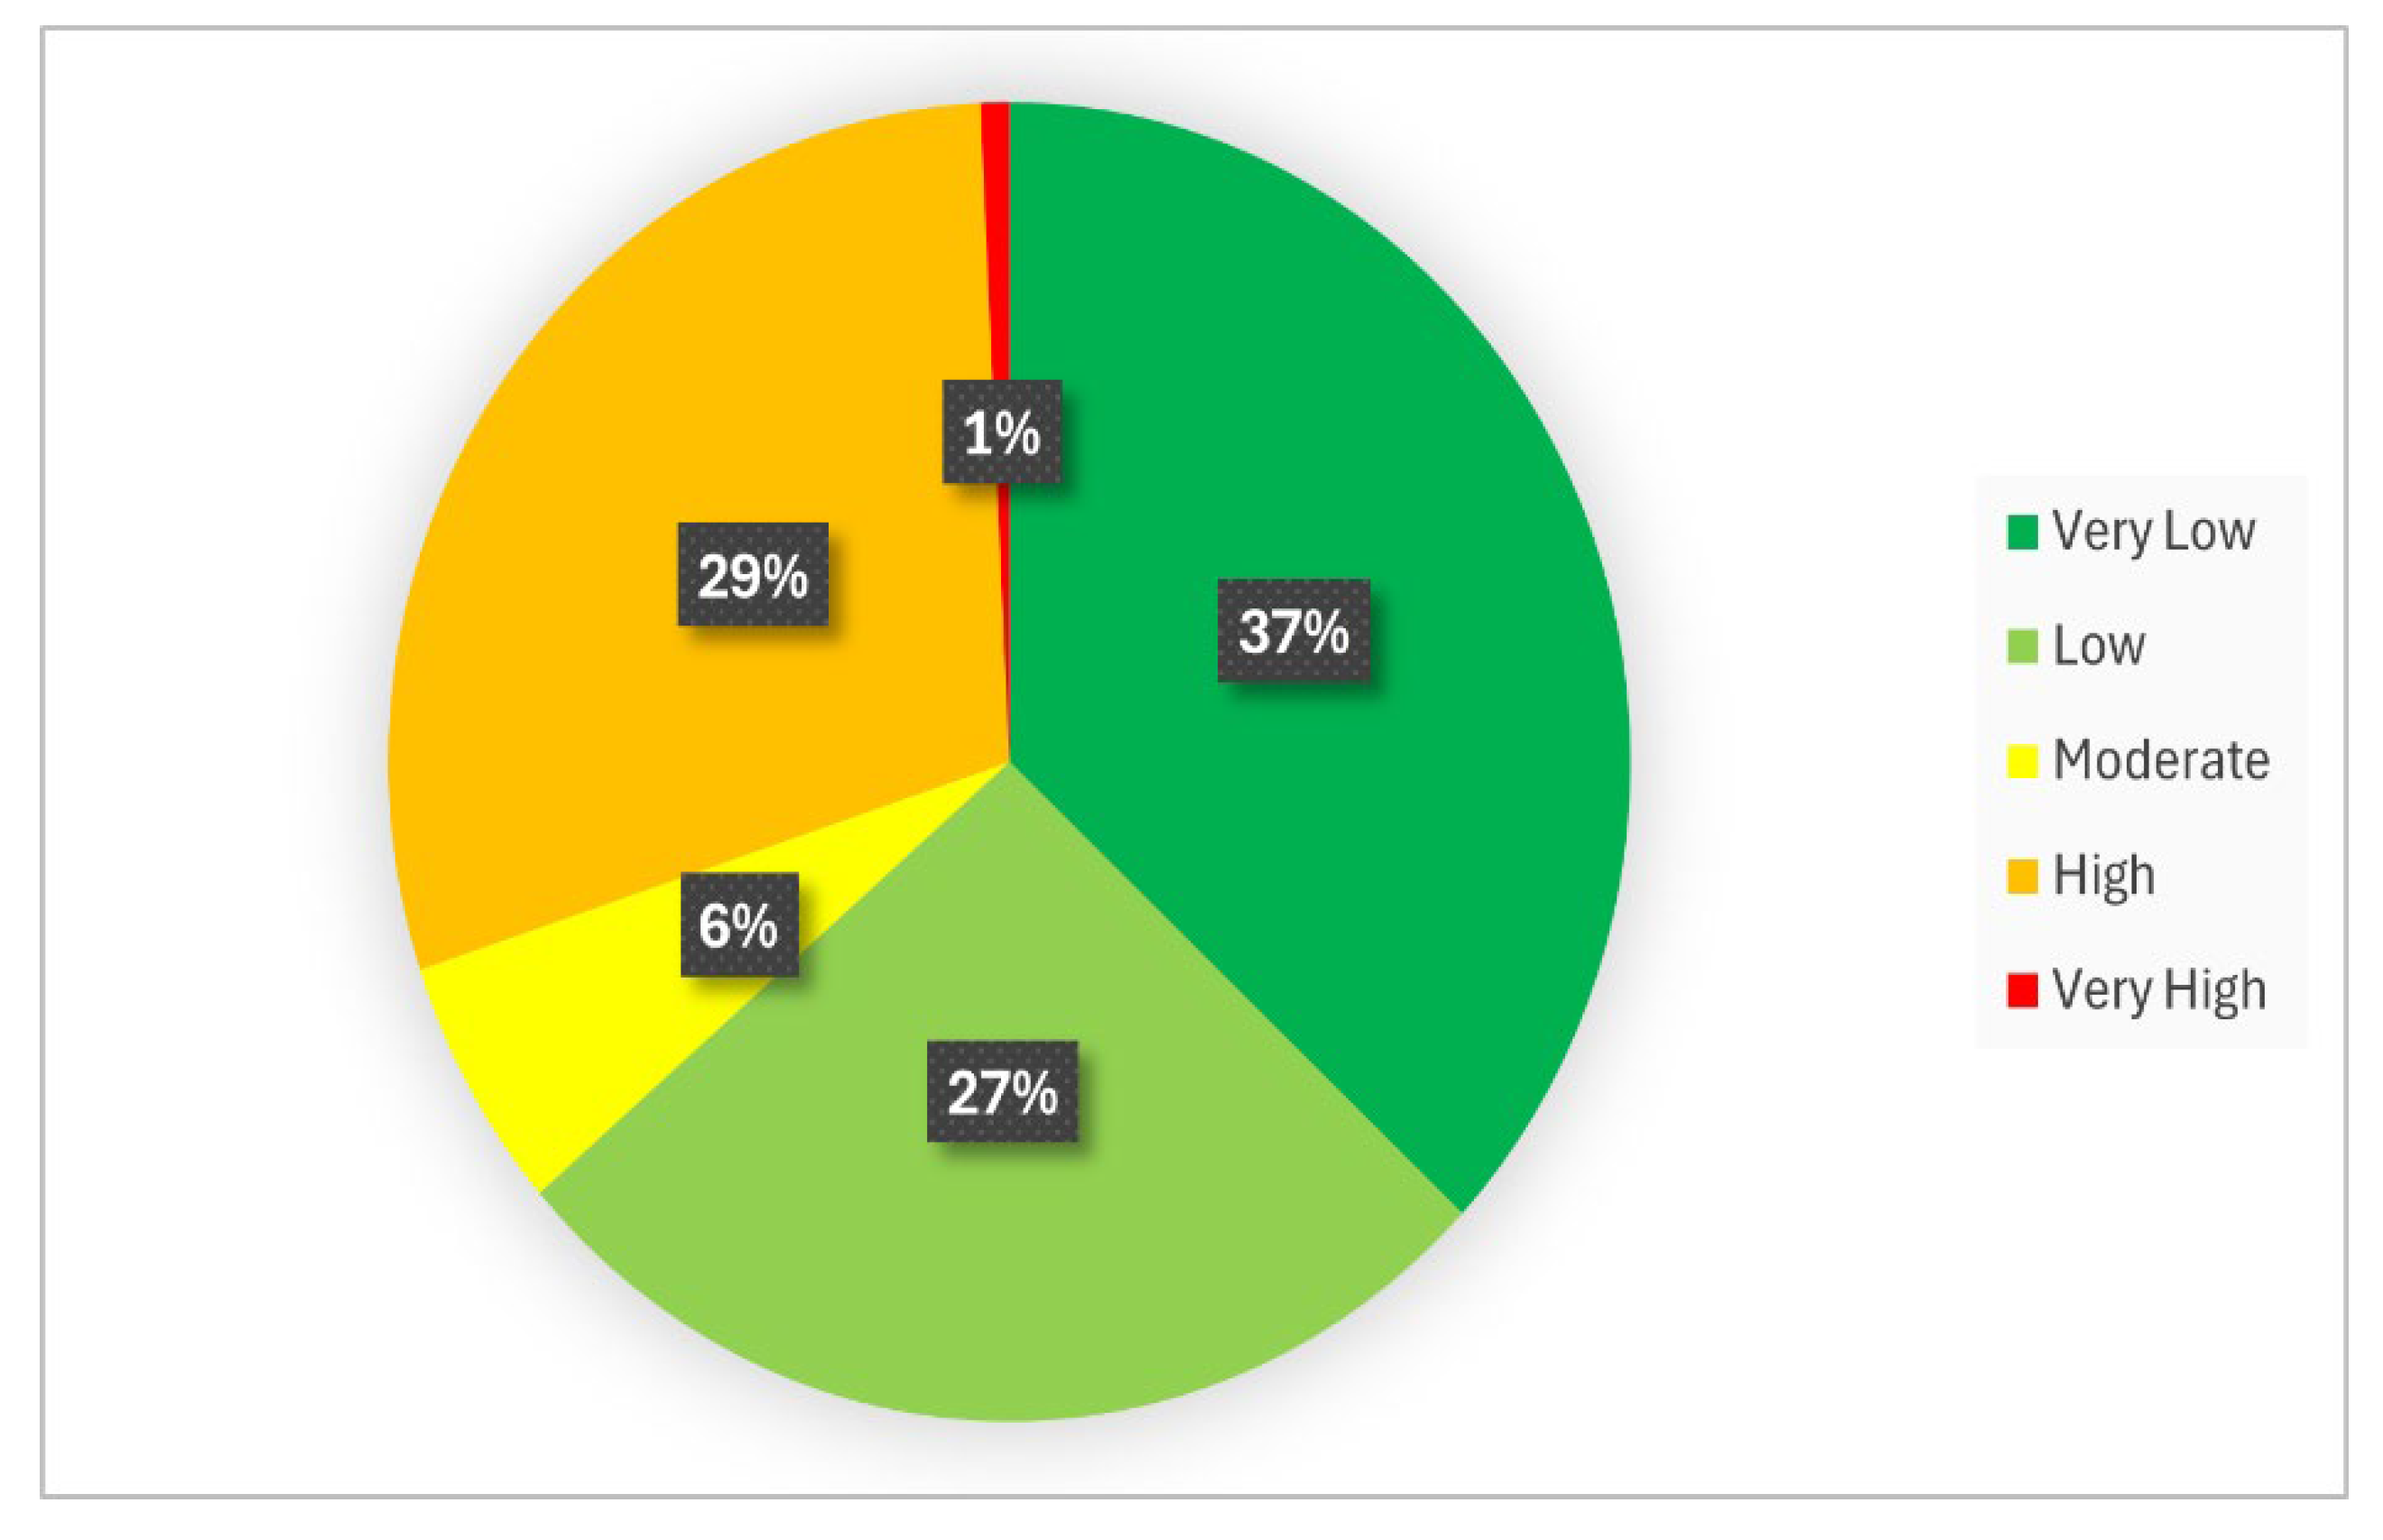
The Arctic region, one of the most vulnerable areas globally, faces severe climate change impacts, with rising sea levels and temperatures threatening local communities. Modern geoinformation tools provide a reliable, cost-efficient, and time-saving method for assessing these climate changes in Arctic coastal regions. This study focuses on Finland’s Arctic and sub-Arctic diverse coastline. The Coastal Vulnerability Index (CVI) is used to assess the vulnerability of Finland’s coastlines, using advanced geoinformatics tools. Integrating high-resolution data from EMODnet, the National Land Survey of Finland Digital Elevation Model (DEM), and physical sources, the CVI includes six input parameters: geomorphology, coastal slope, shoreline change rates, mean wave height, tidal range, and relative sea-level change. The CVI results reveal pronounced spatial variability: 37% of the coastline is classified with very low vulnerability, primarily in the southern Gulf of Finland, and some northern segments, specifically part of Lapland, exhibit minimal susceptibility to coastal hazards. Conversely, the central Gulf of Bothnia shows high vulnerability (29%), with low and moderate vulnerability zones comprising 27% and 6%, respectively, and very high vulnerability at 1%. This assessment provides essential insights for sustainable coastal management in Finland by offering a replicable model for Arctic coastal assessments. This study supports policymakers and local communities in developing targeted adaptation strategies to enhance resilience against climate-driven coastal hazards.

1. Introduction

The Arctic region is undergoing profound environmental transformations due to climate change and warming at a rate two to three times faster than the global average since 1979 [1]. Arctic coasts, as dynamic interfaces between terrestrial and marine environments, face escalating ranging threats from sea-level rise, sea ice retreat, permafrost thaw, and coastal erosion, which increase risks of inundation and infrastructure damage [2,3]. Monitoring these coasts is critical for understanding global climate impacts, protecting vulnerable ecosystems, and supporting indigenous communities reliant on coastal resources [4,5]. The significance of monitoring Arctic coasts extends beyond local impacts, aligning with global priorities such as the United Nations Sustainable Development Goals (SDGs) [6] and the European Union’s climate adaptation framework, which emphasizes resilience and sustainable development in vulnerable regions [7,8]. Thus, assessing coastal vulnerability is critical for fostering resilient communities and ecosystems in the Arctic’s coastal zones [9]. Evaluating and reducing coastal vulnerability is critical for fostering resilient communities and ecosystems in Arctic coastal zones.
Geoinformation technologies, particularly Earth Observation (EO) and Geographic Information Systems (GIS), have emerged as transformative solutions for monitoring these changes, offering cost-effective and scalable solutions for assessing coastal dynamics across remote Arctic regions [10]. High-resolution satellite imagery, both optical imagery (e.g., from Sentinel-2) and Synthetic Aperture Radar (SAR) data from Sentinel-1, enables precise mapping of shoreline changes and permafrost dynamics, overcoming challenges posed by frequent cloud cover in the Arctic [11,12]. Advanced EO techniques, such as automated shoreline mapping and machine learning-based classification, provide an unprecedented volume of geospatial data, supporting data-driven climate resilience planning for vulnerable communities, including indigenous groups at risk of displacement [13]. GIS has the ability to integrate diverse data, and its cost-effectiveness stems from reduced fieldwork, open-source tools, and datasets, while its scalability supports applications from local to global levels [14].
A robust methodology for assessing coastal risk in remote Arctic regions is the Coastal Vulnerability Index (CVI), a multivariate geospatial framework initially developed by Gornitz et al. [15] and refined by Thieler and Hammar-Klose [16]. The CVI quantifies coastal susceptibility by integrating physical and hydrographic variables, including geomorphology, coastal slope, relative sea-level change (RSL), shoreline erosion/accretion rates, tidal range (TR), and mean wave height (MWH) [17,18]. One of the key benefits of the CVI is its high level of customizability, allowing it to be integrated with various physical and socioeconomic factors. Additionally, it can be easily adapted to suit different environments or contexts [19]. The combination of the CVI with a modern geoinformation-based approach offers a systematic and adaptable tool to evaluate coastal vulnerability, particularly in data-scarce Arctic environments [20]. Despite its global application, the use of the CVI on Finland’s Arctic and sub-Arctic coasts, characterized by the Baltic Sea’s unique low-tidal and brackish conditions, remains underexplored [21]. Rising sea levels and increased storm surges due to climate change threaten Finland’s coastal zones [22]. Furthermore, Finland has a long coastline along the Baltic Sea, characterized by archipelagos, low-lying areas, and soft sediments, making it highly susceptible to erosion and flooding [23].
In light of the above, the present study aims at addressing this gap by applying the CVI to assess the vulnerability of Finland’s Arctic and sub-Arctic coastlines, specifically in the Gulf of Bothnia. The research was carried out using state-of-the-art EO datasets from the European Marine Observation and Data Network (EMODnet) [24] and National Land Survey of Finland DEM alongside hydrographic data. The study findings will enhance our understanding of Finland’s coastal dynamics under climate change. Furthermore, the study findings may offer critical insights for policy makers, local communities, and indigenous groups to develop targeted adaptation strategies and support sustainable coastal management in Finland.

2. Study Area

Finland, a Nordic nation situated in Northern Europe (Figure 1), holds a distinctive position within the Arctic Circle due to its geographic location and active participation in Arctic governance. Approximately one-third of Finland’s landmass, primarily the province of Lapland, lies above the Arctic Circle, encompassing roughly 180,000 inhabitants out of a national population exceeding 5.5 million [25]. The study of Finland’s coasts has gained particular interest, given its unique combination of geological stability, ongoing isostatic uplift, and vulnerability to sea-level rise due to limited vertical land movement in the southern coasts in comparison with other parts of Finland [26]. Finland’s coasts face significant environmental challenges, such as eutrophication and rising sea levels, which threaten coastal ecosystems and infrastructure [27,28]. Monitoring and protecting the Baltic Sea’s coastal zones is crucial for maintaining biodiversity and supporting sustainable development in the region [29].
Finland’s coastal zone, along the Baltic Sea and the Eastern Gulf of Finland, is a critical area for studying vulnerability to environmental changes and implementing effective coastal management strategies [30]. The Finnish coastline stretches approximately 1100 km along the mainland, with an additional 39,000 km being added when accounting for its extensive network of islands and archipelagos, making it one of the most intricate coastal systems in Europe [11]. This complex coastal environment faces mounting pressures from natural processes, such as erosion and storm surges, as well as anthropogenic activities, including urban development, tourism, and maritime transport [27]. These pressures necessitate robust coastal planning to balance economic growth with environmental preservation.
The region’s geology is shaped by ancient Precambrian rocks, primarily granites and gneisses, modified by glaciation cycles [31]. Key features include moraines, eskers, and glaciofluvial sediments that influence erosion patterns [32,33]. Post-glacial rebound (land uplift), with rates of 3–9 mm/year [34,35], offsets sea-level rise but also affects infrastructure planning. Seasonal ice and storm surges add further complexity [36].

3. Methodology

3.1. CVI Variables

For the estimation of the CVI, the following heuristic method was applied: (1) a set of indicators which potentially control coastal erosion phenomena was computed and assigned to each coastal sector; (2) each indicator was then reclassified according to expert-based criteria, and an overall CVI score was then obtained as a combination of the classes of the six indicators. CVI assessment integrates multiple physical parameters, including geomorphology, coastal slope, shoreline change rates, TR, RSL, and MWH to create comprehensive vulnerability profiles across Finland’s coastal zone. A summary of the dataset used is available in Table 1. Below, an analytical description of each variable used for the estimation of the CVI is presented.

3.1.1. Geomorphology

Geomorphology is one of the most critical components of the CVI, as the erosion risk of the coastal zone is related to the geomorphological features of the area [39]. Ranges of vulnerability scores are defined according to the relative susceptibility of a given landform to physical change. For instance, low-lying, unconsolidated coasts with high wave exposure are more prone to rapid retreat, whereas steep, rocky coasts may experience slower, episodic erosion. The ranking score assigns the lower vulnerability score to rocky and cliff coasts and the higher vulnerability score to landform types such as barrier beaches, sandy beaches, and deltas [40]. This component was managed with the help of the European Marine Observation and Data Network (EMODnet), which consists of more than 160 organizations that work together on assembling and harmonizing data, and making marine data, products, and metadata more available to public and private users, in combination with observations from Google Earth Pro. Specifically, the category of coastal type from the EMODnet geology map was used.

3.1.2. Coastal Slope

Coastal slope is a key indicator, which is expressed as a percentage, used not only to evaluate the relative risk of flooding but also to estimate the potential rate of shoreline retreat [41]. On gently sloping coasts, the environment tends to be more diffusive, allowing storm energy to generate significant sediment transport. In contrast, on steep shores, wave energy is mostly dissipated through breaking against the rocks. However, it is important to note that slope is just one of many indicators, and the overall impact is influenced by a combination of factors [42,43]. In this study, coastal slope was calculated with the help of the National Land Survey of Finland DEM (Table 1). The dataset has a grid size 10 m × 10 m, and the accuracy of elevation data is 1.4 m [44].

3.1.3. Physical Variables

To estimate the CVI for the physical variables, three parameters were used. In particular, we considered the RSL change of the area in millimeters per year (mm/y), the TR in meters and the MWH in meters. All three factors were derived from bibliographic research, and the data were provided from different stations along the coastline of Finland. Data for MWH between 1974 and 2018 were obtained from the numerical model of Sokolov and Chubarenko [37]. For the TR, long-term hourly data from 15 tide gauge stations in Finland, provided series of observations for more than 15 years [38]. Lastly, for the RSL change selected projections sourced from Finnish tide gauge data for the year 2100 were used, providing a standardized and regionally relevant estimate of future sea-level rise under moderate climate change mitigation scenarios [21]. The values of these factors are important for evaluating the most significant oceanographic events, such as eustatic components, inundation events, and movement of material offshore [45].

3.1.4. Shoreline Change

The shoreline change factor is a pivotal component of the CVI, as it quantifies the rate of coastal erosion or accretion. This factor is crucial because it directly influences coastal stability, impacting infrastructure, ecosystems, and communities, with recent studies emphasizing its role in assessing climate-driven vulnerabilities [46,47]. For the CVI, shoreline change data were sourced from the EMODnet website under the coastal migration category that provides the final rate of coastal change, utilizing optical imagery from ESA Sentinel-2 and NASA Landsat 5, 7, and 8, with pixel resolutions of 10–30 m and a revisit time of 1 to 2 weeks, covering the period 2007–2017. These high-resolution datasets were processed by the team from EMODnet with advanced tools like Google Earth Engine, enabling precise tracking of shoreline dynamics, enhancing the accuracy of CVI assessments [24].

3.2. Preprocessing

Prior to CVI computation, a series of data preprocessing steps were undertaken to ensure the harmonization of the input parameters for analysis. To assess the coastal vulnerability conditions, the Finnish coastline was splatted to vertices, generating more than 90,000 segments. Furthermore, the study incorporated key variables, including RSL change, MWH, and TR, which were derived from peer-reviewed literature and validated datasets. Among those, RSL changes required specific processing to align with the study’s objectives. Instead of using historical sea-level trends specific to the study area, projections based on the Intergovernmental Panel on Climate Change (IPCC) medium-emission scenario (RCP4.5/SSP2-4.5) were selected for the year 2100. The data of RSL change, MWH, and TR, were spatially interpolated across the coastline using the Thiessen polygon methodology to assign values to each coastal segment.
Another critical parameter subjected to preprocessing was coastal geomorphology, with a particular focus on vegetated beaches, often referred to as “green beaches” according to EMODnet classification. These coastal features present a unique challenge in vulnerability assessments due to their ambiguous classification within traditional geomorphological frameworks. Even though the roots provide stabilization similar to stabilized dune systems, and they are not rocky, green beaches are usually low-lying and slightly marshy areas. To account for these properties, the study integrated detailed geomorphological data, emphasizing the stabilizing role of vegetation while acknowledging the heightened vulnerability of these areas to coastal processes driven by climate change [48]. This preprocessing ensured that the CVI calculations accurately reflected the complex interplay of physical and ecological factors influencing coastal vulnerability. Lastly, the coastal slope map was produced using the DEM by calculating the distance from each shoreline segment to the contour of 5 m. The slope was expressed as a percentage by dividing rise by distance and multiplying by 100.

3.3. CVI Calculation

After the data preprocessing, the calculation of CVI was accomplished using ArcGIS Pro software (Version 3.4.3). The CVI variables were assigned scores ranging from 1 to 5, as defined by Thieler and Hammar-Klose [16]. This method produces numerical data that are not directly correlated with specific physical impacts. Specifically, the factors are evaluated such that the higher the value assigned, the more vulnerable the area is considered to be to that particular parameter. Table 2 was used to classify each according to their vulnerability.
The CVI variables that had been preprocessed were categorized based on the general category they belong to, and then, using Table 2, were ranked based on their vulnerability. Lastly, the rates of shoreline change given by EMODnet were evaluated based on the CVI categorization. All six parameters were initially processed as vector layers and subsequently converted to raster format within ArcGIS Pro to facilitate CVI calculation through raster calculation. This transformation was essential to enable the calculation of the CVI using the raster calculator tool in ArcGIS Pro, following the mathematical expression (1) outlined below:
C V I = a × b × c × d × e × f 6
where a = geomorphology, b = shoreline erosion/accretion rates, c = coastal slope, d = shoreline change e = mean wave height, and f = tidal range.

4. Results

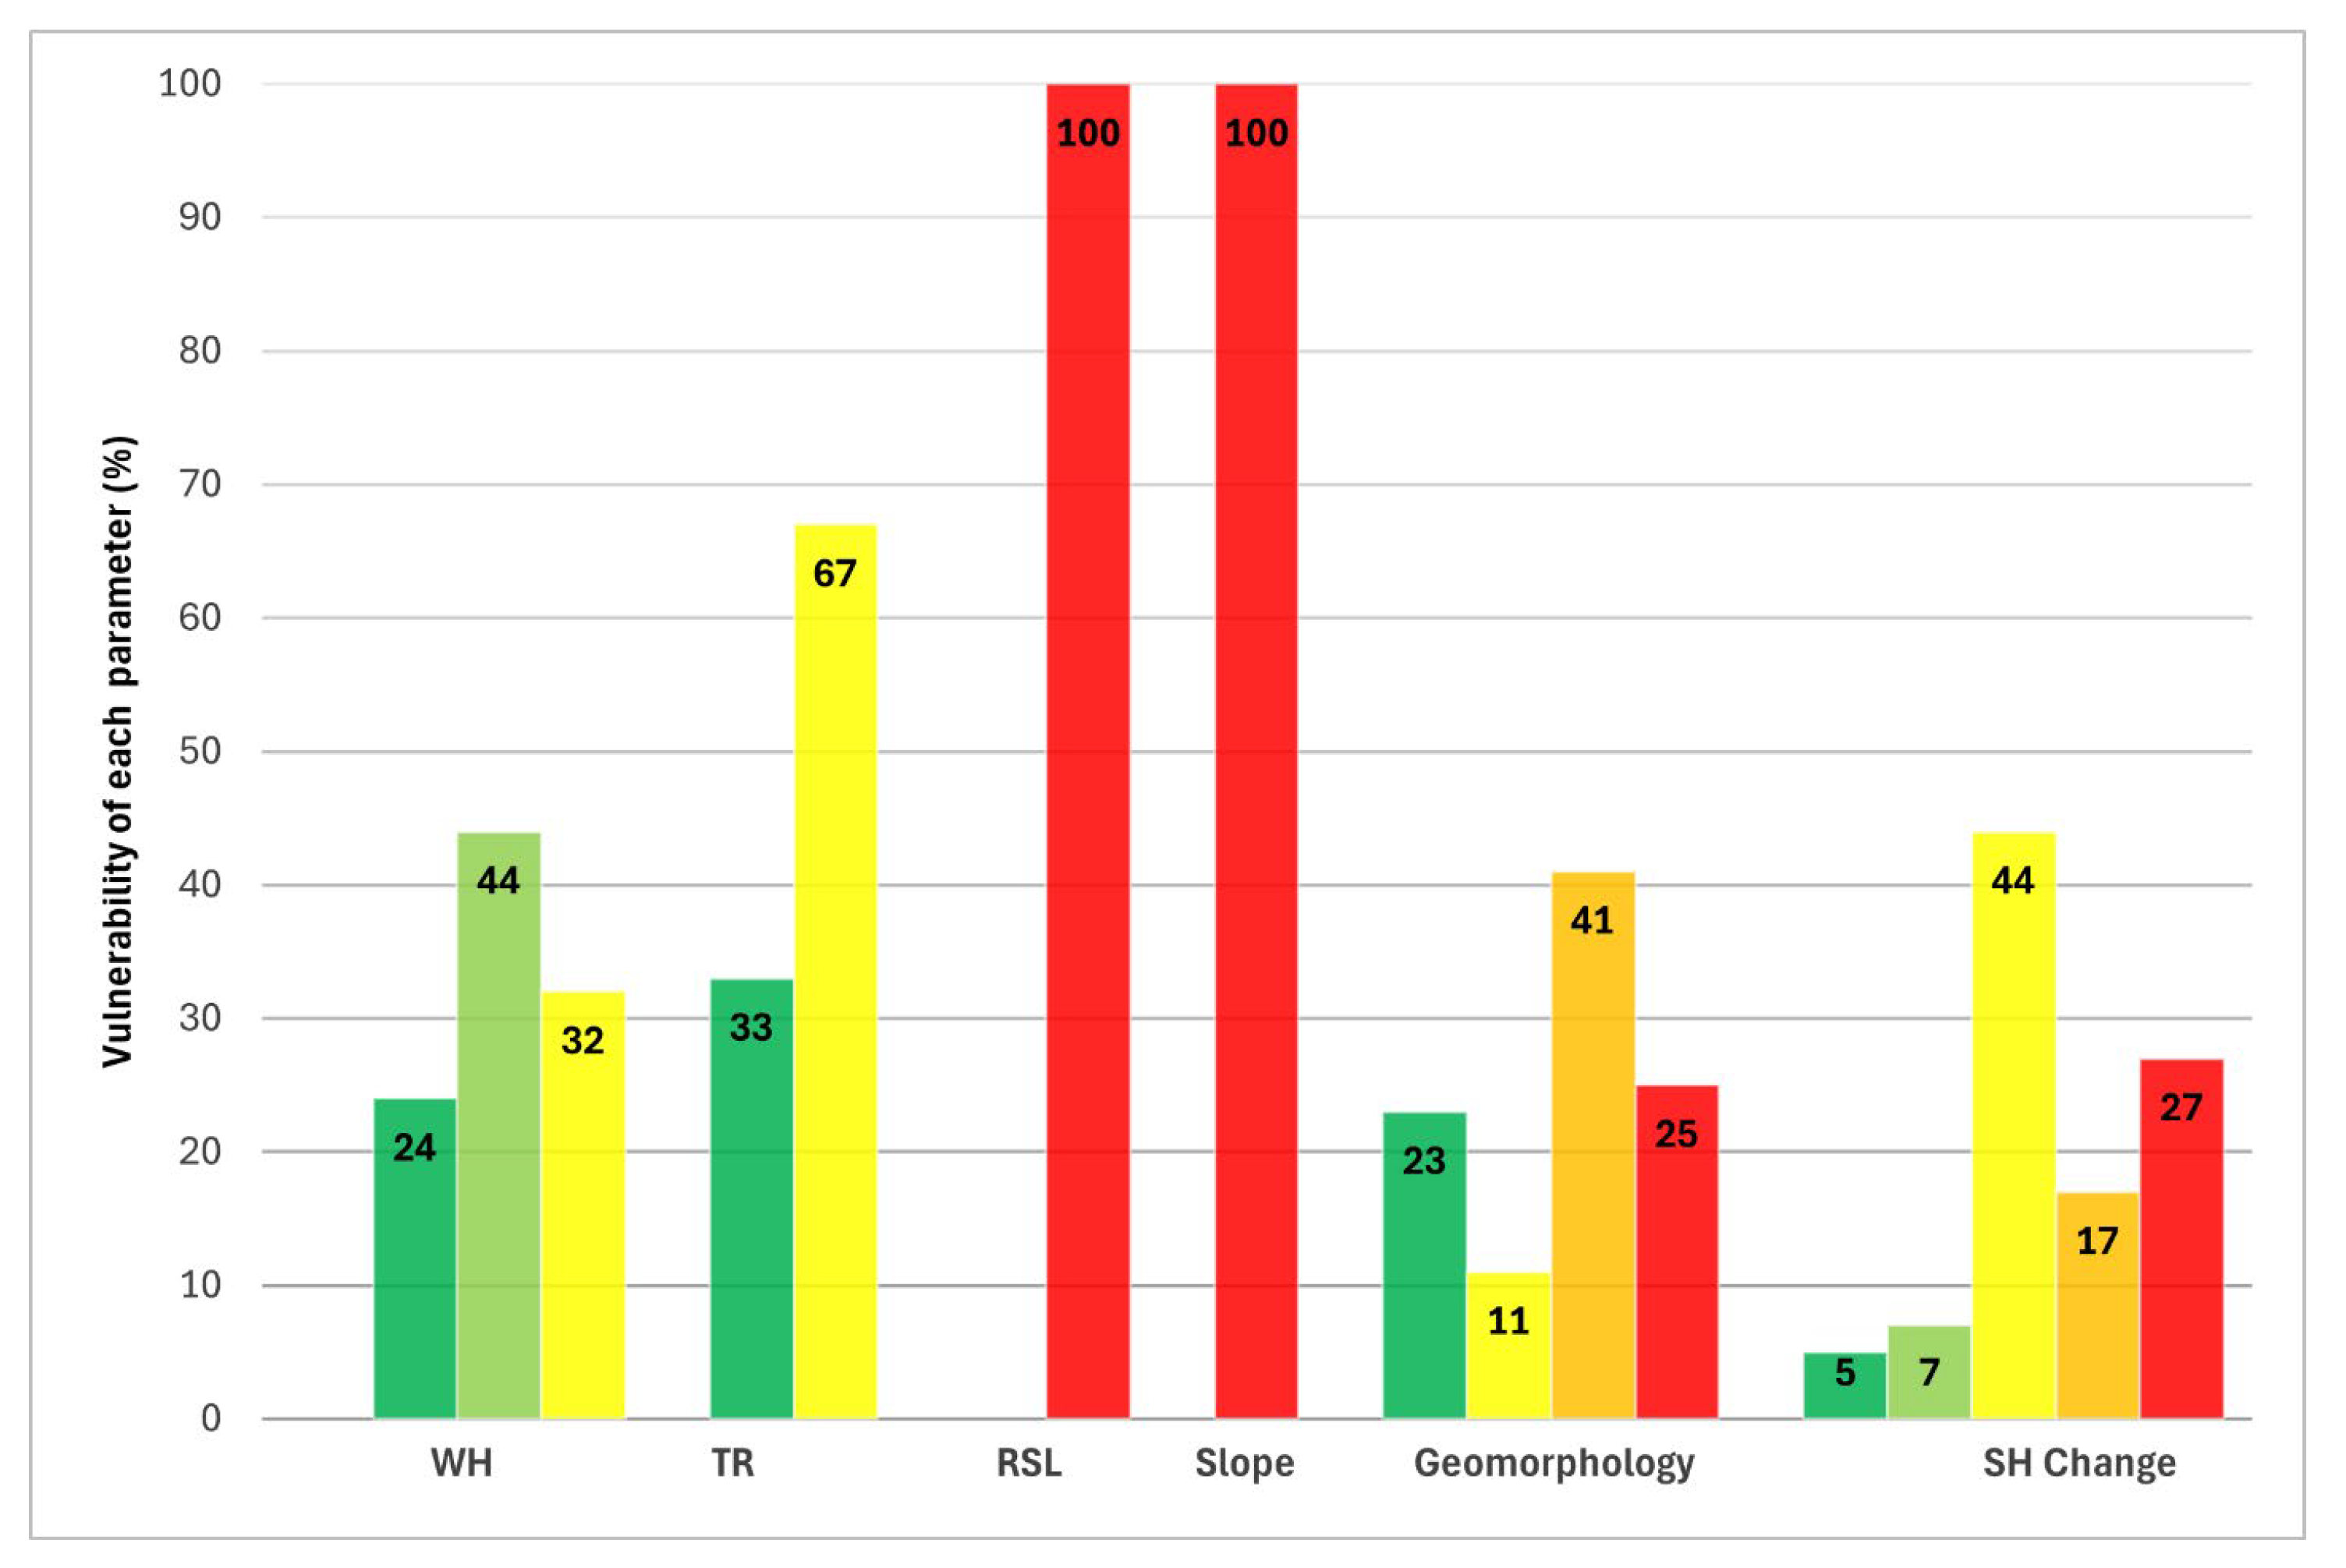
The results from the CVI analysis reveal distinct spatial variations of coastal vulnerability across Finland. In terms of the “geomorphology” factor, the majority of the examined shoreline was classified as highly vulnerable (41%); 25% was characterized with very high vulnerability, 23% with very low vulnerability, and 11% with moderate vulnerability (Figure 2 and Figure 3a). Areas categorized as highly vulnerable were found on vegetated or marshy beaches. Analysis of the coastal slope indicated that nearly the entire Finnish coastline falls under the very high vulnerability category. With slope percentages predominantly below 2.5%, and a maximum of 0.69%, the terrain provides little natural resistance to sea-level rise and storm surges. MWH results showed relatively low vulnerability across the region. About 24% of the coasts were classified as very low, 44% as low, and 32% as moderate, as shown in Figure 2 and Figure 3c. No significant high or very high vulnerability zones were identified, with wave heights not exceeding 0.95 m. Regarding TR, 33% of the coastline exhibited very low vulnerability, with the remaining 67% rated as moderate (Figure 2 and Figure 3d). RSL change was found to be a major contributor to vulnerability, with all the entirety of the examined coastline being classified as very high vulnerable class (Figure 2 and Figure 3e). Despite the presence of post-glacial rebound in parts of the country, regions with minimal uplift remain particularly exposed to sea-level rise. Finally, for the shoreline erosion/accretion factor, vulnerability is predominantly moderate, accounting for 44% and showing an almost even distribution across the country (Figure 3f).
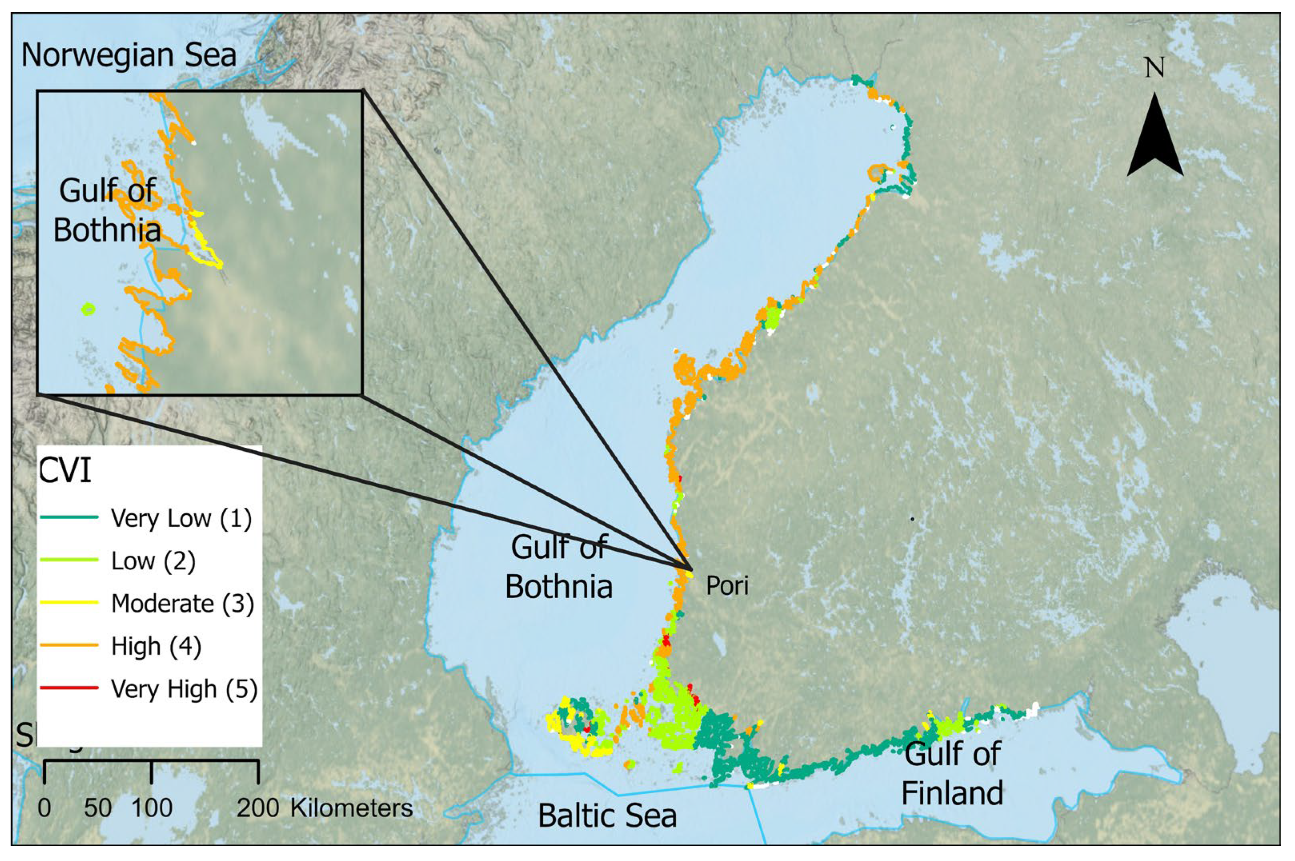
Figure 4 shows the spatial distribution of coastal vulnerability in comparison with the pie chart (Figure 5) representation. The calculated CVI values along the coastline of Finland range from 3 to 23. The classes were divided based on the case study of Komi [38] and were adapted to reflect the environmental conditions of Finland’s coastline. The predominant vulnerability category across the entire coastline is classified as “very low”, encompassing approximately 37% of the coastal extent. Predominantly, the southern regions, including the Gulf of Finland and part of Lapland, are characterized as non-vulnerable zones, exhibiting minimal susceptibility to coastal hazards. Conversely, the central Gulf of Bothnia of the Finnish coastline manifests high vulnerability levels, accounting for approximately 29% of the total coastal area. Areas with low vulnerability constitute a significant proportion, approximately 27%, while moderate vulnerability is observed along 6% of the coastline. Notably, regions exhibiting very high vulnerability are virtually nonexistent, comprising 1% of the coastal extent. In synthesizing these findings, a pronounced spatial heterogeneity in vulnerability is evident. The southeastern coastal zones, alongside a limited northern segment, demonstrate lower susceptibility to environmental stressors, in contrast with the central coastal region, which exhibits heightened vulnerability.

5. Discussion

As a multivariate index, the CVI enables a comprehensive analysis of coastal vulnerability by integrating a range of variables: geomorphology, coastal slope, mean wave height, tidal range, relative sea-level change, and shoreline erosion/accretion. The application of the CVI to the entirety of the Finnish coastline has offered significant insights into the spatial heterogeneity of coastal risk across the country. The results from the present analysis not only align with theoretical expectations for low-lying, ice-influenced coastlines such as Finland’s but also highlight areas where coastal management must be prioritized.
More specifically, after the application of the CVI, it appears that in the south part of Finland and in a segment of the coastline in the north, the vulnerability is low, while in other parts, mainly in central Finland, the values are high. Interestingly, the dominant class along the Finnish coast is “very low” vulnerability, covering approximately 37% of the coastline. This suggests that while certain parameters such as slope and RSL pose significant threats, the combined effect of all variables often results in a relatively low-risk vulnerability for large portions of the coast. Notably, the southern coastline, particularly the Gulf of Finland, is predominantly categorized as non-vulnerable or with very low vulnerability. These regions benefit from higher elevations, limited wave action, and the buffering effect of extensive archipelagos. The low vulnerability in the south of Finland aligns with the previous study of Kovaleva [11] on the Gulf of Finland. Even though the study area of Kovaleva [11] was in Russia, the results near the Finland border were the same due to the similar geological and physical background. However, the central part of the Finnish coastline stands out as most vulnerable, comprising roughly 29% of the total. The proximity of these areas to some of the largest cities of the country underscores the critical interplay between anthropogenic and natural factors. Consequently, their inherent connection necessitates a parallel study of both [10].
The spatial distribution of vulnerability, as shown in Figure 3 and the corresponding chart (Figure 2), confirms these findings. Regarding the factor of geomorphology, the distribution of vulnerability is heavily skewed towards higher classes. Specifically, 41% of the coastline falls under the “high” vulnerability category, and an additional 25% under “very high”, making this one of the most dominant sources of risk. The presence of complex coastal features, such as archipelagos and shallow bays, further exacerbates these vulnerabilities by creating intricate wave interactions and sediment transport patterns. In terms of coastal slope, the entire Finnish coast falls under the “very high” vulnerability category. The data reveal that slope values are predominantly below 2.5%. Low slopes provide minimal natural barriers against sea-level rise and storm surges, making the coastline inherently more susceptible to flooding events [21]. This finding is particularly important for urban planning and infrastructure resilience in coastal areas, suggesting that long-term adaptive strategies must account for the low slope gradient throughout the region.
The results for MWH present a relatively optimistic perspective. The distribution suggests that wave energy is not currently a primary driver of coastal risk in Finland. Most of the coastline is categorized as having low to very low vulnerability, with no regions marked as highly vulnerable. Maximum wave heights do not exceed 0.95 m, which is consistent with the semi-enclosed nature of the Baltic Sea and its limited fetch. TR, similarly, shows limited vulnerability. Approximately 33% of the coast falls into the “very low” vulnerability class, and the remaining 67% is marked as “moderate”. The limited tidal range in the Baltic Sea generally reduces the associated risk, although it may also limit natural sediment redistribution, thus amplifying vulnerability in other aspects. In contrast, RSL change emerges as a dominant contributor to high vulnerability across the Finnish coastline. Despite post-glacial isostatic rebound, which uplifts parts of the country, the entire coast is categorized under “very high” vulnerability. This highlights a contrasting condition: some regions experience uplift, yet other areas may show negligible vertical land movement, leaving them vulnerable to rising sea levels. Shoreline erosion and accretion data reveal a predominance of “moderate” vulnerability, affecting 44% of the coastline almost equally. While moderate erosion may not be alarming in the short term, its persistence, especially in areas with minimal sediment supply or anthropogenic intervention, can contribute significantly to long-term risk. Given Finland’s extensive archipelagic zones and relatively undeveloped coastal stretches, the management of erosion may be less complex than in highly urbanized nations but still necessitates targeted monitoring and conservation measures.
Certainly, the investigation encountered several constraints that warrant consideration. A primary limitation was the temporal relevance and availability of high-resolution geospatial data. Specifically, acquiring contemporaneous datasets with optimal spatial resolution posed a significant challenge, particularly when attempting to quantify shoreline change across an entire nation at the finest possible scale. Although recent advancements have granted access to high-resolution satellite imagery, such as that provided by the Sentinel-2 mission, persistent issues including cloud cover and the accurate delineation of land–water interfaces continue to impede precise analysis over expansive geographic regions [49].
Another limitation arises from the use of varying time periods in the bibliography and outdated data concerning RSL change, MWH, TR, and shoreline change. The studies referenced often span different temporal scales, with some relying on historical data while others incorporate future models. This inconsistency in temporal coverage can introduce uncertainties when integrating these parameters into coastal vulnerability models. Also the analysis relied on the most recent publicly accessible data available, with extensive preprocessing and evaluation to ensure consistency despite the challenges of integrating diverse sources. However, the parameter of shoreline change, is subject to rapid variability and could potentially be updated using more recent data or automatic extraction methods, such as satellite-based remote sensing for shorelines. While automatic extraction techniques were explored, the results were not satisfactory for the large spatial scale of Finland’s coastline, as they demanded significant computational resources and validation, effectively requiring a dedicated study. Such discrepancies may lead to over- or underestimation of vulnerability in certain regions, particularly in areas like Finland where coastal processes are highly dynamic due to post-glacial rebound and seasonal variations [50].
Additionally, the CVI ranking utilized in this study presents another limitation. The original CVI variables, as proposed by Gornitz [15], include parameters such as geomorphology, shoreline erosion/accretion rates, and MWH, which were designed for global applicability. However, their representativeness for Finland’s unique coastal environment, characterized by a fragmented archipelago, low tidal ranges, and significant isostatic uplift, may be limited. Furthermore, the use of equal weighting for the six CVI parameters, while scientifically validated and widely accepted for its simplicity and comparability with other studies, may not fully capture the relative importance of each parameter in the context of Finland’s distinct coastal characteristics, such as post-glacial rebound and mild wave energy. Incorporating additional variables, such as socioeconomic or sediment transport variables specific to Baltic Sea conditions, and exploring a tailored weighting scheme could enhance the accuracy of the CVI ranking for Finland. However, such enhancements would require further data collection and model refinement.
Another limitation of this study is the absence of a sensitivity analysis for the CVI calculations. Given the multiplicative nature of the CVI methodology, small variations in individual parameters, such as geomorphology, shoreline erosion rates, or mean wave height, can disproportionately influence the final vulnerability scores, particularly in the presence of outliers or measurement uncertainties. While many studies in the literature applying the CVI approach similarly omit sensitivity analyses, likely due to the standardized framework of the methodology, this omission may affect confidence in the robustness of our results, especially in the context of Finland’s unique coastal environment. Addressing this limitation through a sensitivity analysis in future research could provide a more comprehensive understanding of how parameter variability impacts the CVI outcomes, thereby enhancing the reliability of the vulnerability assessment for Finland’s coastline.
Furthermore, geomorphological assessments were constrained by inherent limitations in data collection methodologies. The more robust approach to assessing geomorphological features typically involves field-based survey. However, this method is fraught with logistical challenges in itself, and there is a collective need for innovative remote sensing techniques and improved computational frameworks to mitigate these limitations and improve the accuracy of large-scale coastal zone geomorphological studies.
From a planning and policy perspective, the spatial heterogeneity revealed by the CVI analysis underscores the need for regionally tailored risk management strategies. A one-size-fits-all approach would fail to capture the localized drivers of vulnerability that differ dramatically from one coastal segment to another. Furthermore, the CVI framework can serve as a baseline for integrating socioeconomic factors, including population density, infrastructure, and land use, into more holistic vulnerability assessments, such as the study of Charuka [51]. This approach can certainly be applied to other Arctic regions and especially to Sweden, a neighboring country, part of whose long coastline is located on the Baltic Sea.

6. Final Remarks

This study aimed at evaluating, to our knowledge for the first time, coastal vulnerability across Finland’s extensive and geomorphologically diverse coastline using a widely applied index for this purpose, namely, the CVI. The CVI application provided a comprehensive assessment of its susceptibility to climate-driven threats, such as sea-level rise, coastal erosion, and storm surges, and paved the way for smarter, sustainable coastal protection strategies. The CVI framework, incorporating parameters such as geomorphology, coastal slope, shoreline change rates, mean wave height, tidal range, and relative sea-level change, highlights for the first time the complex interplay of physical and environmental factors shaping Finland’s coastal dynamics.
Overall, the CVI across Finland revealed a complex mosaic of risks driven by landscape features, geological history, and marine conditions. Specifically, the coastline in the southern part of Finland and in a significant segment in the north seems to have low vulnerability, while in the central part of the country the vulnerability is high.
Specifically, the results of this study show relatively low overall vulnerability, particularly concerning MWH and TR, while coastal slope, RSL change, and geomorphology elevate the risk profile in specific regions. For the tidal range, 33% of the coastline exhibited very low vulnerability, while the remaining 67% was rated as moderate. In contrast, geomorphology seems to be high, with 41%, and 25% falls into the very high vulnerability class; 23% is characterized with very low vulnerability, and 11% with moderate. Analysis of the coastal slope indicated that the entire Finnish coastline falls under the very high vulnerability category, with a maximum of 0.69%, and relative sea-level change emerged as a major contributor to vulnerability, with over 56% of the coastline falling into the very high vulnerability class and 44% the high class.
Looking ahead, future research should focus on several key areas: first, the temporal resolution of shoreline change data by integrating historical datasets with more recent, high-resolution EO observations. This fusion would improve temporal continuity and enable more accurate trend analyses. Second, the inclusion of socioeconomic variables into the CVI framework will provide a more holistic understanding of exposure and adaptive capacity [52]. Third, the development of automated classification methods for geomorphological mapping using machine learning could enhance accuracy and reduce reliance on manual interpretation. Lastly, field validation campaigns are essential to verify EO-derived classifications and to refine parameter thresholds used in vulnerability scoring.
In conclusion, this research delivers a critical baseline for understanding Finland’s coastal vulnerability and offers a replicable model for Arctic coastal assessments worldwide. The CVI thus proves to be a valuable tool for guiding coastal management, informing infrastructure development, and enhancing resilience to climate-related impacts in Finland’s unique coastal environment, illustrating the innovative potential of geoinformation tools in enhancing climate resilience across high-latitude coastlines.

Author Contributions

Conceptualization, K.L., N.E. and G.P.P.; methodology, K.L., N.E. and A.K.; formal analysis, K.L.; writing—original draft preparation, K.L.; writing—review and editing, K.L., G.P.P., A.K., N.E. and S.E.D.; visualization, K.L.; supervision, G.P.P. and N.E. All authors have read and agreed to the published version of the manuscript.

Funding

The present research study has been financially supported by the project “EO-PERSIST”, funded by the European Union’s Horizon Europe research and innovation program (HORIZON-MSCA-2021-SE-01-01, under grant agreement no. 101086386).

Data Availability Statement

The raw data supporting the conclusions of this article will be made available by the authors on request.

Conflicts of Interest

The authors declare no conflicts of interest.

References

  1. Intergovernmental Panel on Climate Change (IPCC). Special Report on the Ocean and Cryosphere in a Changing Climate; IPCC: Geneva, Switzerland, 2019. [Google Scholar]
  2. Casas-Prat, M.; Wang, X.L. Projections of Extreme Ocean Waves in the Arctic and Potential Implications for Coastal Inundation and Erosion. J. Geophys. Res. Oceans 2020, 125, e2019JC015745. [Google Scholar] [CrossRef]
  3. Nielsen, D.M.; Pieper, P.; Barkhordarian, A.; Overduin, P.; Ilyina, T.; Brovkin, V.; Baehr, J.; Dobrynin, M. Increase in Arctic Coastal Erosion and Its Sensitivity to Warming in the Twenty-First Century. Nat. Clim. Chang. 2022, 12, 263–270. [Google Scholar] [CrossRef]
  4. Toumasi, P.; Petropoulos, G.P.; Detsikas, S.E.; Kalogeropoulos, K.; Tselos, N.G. Coastal Vulnerability Impact Assessment under Climate Change in the Arctic Coasts of Tromsø, Norway. Earth 2024, 5, 640–653. [Google Scholar] [CrossRef]
  5. Alessa, L.; Kliskey, A.; Busey, R.; Kofinas, G.; Hinzman, L.; Berman, M. Toward a Permafrost Vulnerability Index for Critical Infrastructure, Community Resilience and National Security. Geographies 2023, 3, 522–542. [Google Scholar] [CrossRef]
  6. United Nations. The 17 Sustainable Development Goals. Available online: https://sdgs.un.org/goals (accessed on 27 June 2025).
  7. European Environment Agency. Finland’s National Climate Change Adaptation Plan; Ministry of Agriculture and Forestry: Helsinki, Finland, 2021. [Google Scholar]
  8. Fuldauer, L.I.; Watson, J.; Pant, R.; Hall, J.W. Climate Change Adaptation and the Sustainable Development Goals: Synergies and Trade-offs. Nat. Clim. Change 2022, 12, 678–685. [Google Scholar]
  9. Irrgang, A.M.; Bendixen, M.; Farquharson, L.M.; Ogorodov, S.A.; Lantuit, H.; Fritz, M. Drivers, Dynamics and Impacts of Changing Arctic Coasts. Nat. Rev. Earth Environ. 2022, 3, 39–55. [Google Scholar] [CrossRef]
  10. Petropoulos, G.P.; Toumasi, P.; Kalogeropoulos, K.; Tselos, N.G. Geoinformation Technology in Support of Arctic Coastal Properties Characterization: State of the Art, Challenges, and Future Outlook. Land 2024, 13, 776. [Google Scholar] [CrossRef]
  11. Kovaleva, O.; Sergeev, A.; Ryabchuk, D. Coastal Vulnerability Index as a Tool for Current State Assessment and Anthropogenic Activity Planning for the Eastern Gulf of Finland Coastal Zone (the Baltic Sea). Appl. Geogr. 2022, 143, 102710. [Google Scholar] [CrossRef]
  12. Chen, J.; Zhang, L.; Doxaran, D.; Sun, Y.; Xu, J. Decadal Arctic Coastal Erosion Detection Using Sentinel-1 and Historic SAR Archives. Remote Sens. 2022, 14, 1210. [Google Scholar] [CrossRef]
  13. Rasmus, S.; Kivinen, S.; Jylhä, K.; Turunen, M.T. Climate Change and Reindeer Management in Finland: Co-Analysis of Practitioner Knowledge and Meteorological Data for Better Adaptation. Clim. Chang. 2021, 165, 1–18. [Google Scholar] [CrossRef]
  14. Longley, P.A.; Goodchild, M.F.; Maguire, D.J.; Rhind, D.W. Geographic Information Systems and Science, 4th ed.; Wiley: Chichester, UK, 2015. [Google Scholar]
  15. Gornitz, V.; White, T.; Cushman, R. Vulnerability of the U.S. to Future Sea Level Rise; Oak Ridge National Laboratory: Oak Ridge, TN, USA, 1991. [Google Scholar]
  16. Thieler, E.R.; Hammar-Klose, E.S. National Assessment of Coastal Vulnerability to Future Sea-Level Rise: Preliminary Results for the U.S. Pacific Coast. In U.S. Geological Survey Open-File Report; U.S. Geological Survey: Woods Hole, MA, USA, 2000. Available online: http://pubs.usgs.gov/of/2000/of00-178/ (accessed on 27 June 2025).
  17. Gaki-Papanastassiou, K.; Karymbalis, E.; Poulos, S.E.; Seni, A.; Zouva, C. Coastal Vulnerability Assessment to Sea-Level Rise Based on Geomorphological and Oceanographical Parameters: The Case of Argolikos Gulf, Peloponnese, Greece. Hell. J. Geosci. 2010, 45, 109–122. [Google Scholar]
  18. Tragaki, A.; Gallousi, C.; Karymbalis, E. Coastal Hazard Vulnerability Assessment Based on Geomorphic, Oceanographic and Demographic Parameters: The Case of the Peloponnese (Southern Greece). Land 2018, 7, 56. [Google Scholar] [CrossRef]
  19. Furlan, E.; Camuffo, M.; Dalla Fontana, G. Development of a Multi-Dimensional Coastal Vulnerability Index: Assessing Vulnerability to Inundation Scenarios in the Italian Coast. Sci. Total Environ. 2021, 772, 144650. [Google Scholar] [CrossRef] [PubMed]
  20. Nikifor, O. The Role of Remote Sensing Data for Coastal Zone Monitioring and Management (Case Study for the East Part of Gulf of Finland). In Proceedings of the International Conference “Managinag risks to coastal regions and communities in a changinag world” (EMECS’11—SeaCoasts XXVI), St. Petersburg, Russia, 22–27 August 2017. [Google Scholar] [CrossRef]
  21. Pellikka, H.; Johansson, M.M.; Nordman, M.; Ruosteenoja, K. Probabilistic Projections and Past Trends of Sea Level Rise in Finland. Nat. Hazards Earth Syst. Sci. 2023, 23, 1613–1630. [Google Scholar] [CrossRef]
  22. Intergovernmental Panel on Climate Change (IPCC). Climate Change 2022: Impacts, Adaptation and Vulnerability; Cambridge University Press: Cambridge, UK, 2022; Available online: https://www.ipcc.ch/report/ar6/wg2/ (accessed on 20 May 2025).
  23. Weisse, R.; Dailidienė, I.; Hünicke, B.; Kahma, K.; Madsen, K.; Omstedt, A.; Parnell, K.; Schöne, T.; Soomere, T.; Zhang, W.; et al. Sea Level Dynamics and Coastal Erosion in the Baltic Sea Region. Earth Syst. Dyn. 2021, 12, 871–898. [Google Scholar] [CrossRef]
  24. European Marine Observation and Data Network (EMODnet). EMODnet GeoViewer. Available online: https://emodnet.ec.europa.eu/geoviewer/#!/ (accessed on 5 May 2025).
  25. Arctic Council. Finland in the Arctic Council. Available online: https://arctic-council.org/about/states/finland/ (accessed on 10 June 2025).
  26. Peltonen, P.; Ojala, A.E.K. Post-Glacial Rebound and Sea-Level Change in Finland: Implications for Future Coastal Development. Geol. Surv. Finl., Spec. Pap. 2019, 61, 85–98. [Google Scholar]
  27. HELCOM. State of the Baltic Sea—Second HELCOM Holistic Assessment 2011–2016. Balt. Sea Environ. Proc. 2018, 155, 155. [Google Scholar]
  28. Nicholls, R.J.; Lincke, D.; Hinkel, J.; Brown, S.; Vafeidis, A.T.; Meyssignac, B.; Hanson, S.E.; Merkens, J.L.; Fang, J. A Global Analysis of Subsidence, Relative Sea-Level Change and Coastal Flood Exposure. Nat. Clim. Chang. 2021, 11, 338–342. [Google Scholar] [CrossRef]
  29. BACC II Author Team. Second Assessment of Climate Change for the Baltic Sea Basin; Springer: Cham, Switzerland, 2015. [Google Scholar]
  30. Prishchepenko, D.V.; Ryabchuk, D.V.; Zhamoida, V.A.; Sergeev, A.Y.; Leontev, F.A.; Grigoriev, A.G.; Neevin, I.A.; Budanov, L.M.; Kovaleva, O.A. Main Trends and Results of 300-Years Anthropogenic Impact on the Geological Environment and Ecosystem of the Eastern Gulf of Finland. Cont. Shelf Res. 2023, 265, 105058. [Google Scholar] [CrossRef]
  31. Vestøl, O.; Steffen, H.; Kierulf, H.P. Consistent Map of the Recent Postglacial Rebound of Fennoscandia. Terra Nova 2023, 35, 391–400. [Google Scholar]
  32. Luoma, S.; Majaniemi, J.; Pullinen, A.; Mursu, J.; Virtasalo, J. Geological and Groundwater Flow Model of a Submarine Groundwater Discharge Site at Hanko (Finland), Northern Baltic Sea. Hydrogeol. J. 2021, 29, 1279–1297. [Google Scholar] [CrossRef]
  33. Palmu, J.-P.; Ojala, A.E.K.; Virtasalo, J.; Putkinen, N.; Kohonen, J.; Sarala, P. Classification system of superficial (Quaternary) geological units in Finland. Geol. Surv. Finl. Bull. 2021, 412, 115–169. [Google Scholar] [CrossRef]
  34. Ekman, M. A Consistent Map of the Postglacial Uplift of Fennoscandia. Terra Nova 1996, 8, 158–165. [Google Scholar] [CrossRef]
  35. Johansson, M.M.; Pellikka, H.; Kahma, K.K.; Ruosteenoja, K. Global Sea Level Rise Scenarios Adapted to the Finnish Coast. J. Mar. Syst. 2014, 129, 35–46. [Google Scholar] [CrossRef]
  36. HELCOM. Climate Change in the Baltic Sea Area: HELCOM Thematic Assessment in 2013. Balt. Sea Environ. Proc. 2013, 137, 66. [Google Scholar]
  37. Sokolov, A.; Chubarenko, B. Baltic Sea Wave Climate in 1979–2018: Numerical Modelling Results. Ocean Eng. 2024, 297, 117088. [Google Scholar] [CrossRef]
  38. Medvedev, I.P.; Rabinovich, A.B.; Kulikov, E.A. Tidal Oscillations in the Baltic Sea. Oceanology 2013, 53, 526–538. [Google Scholar] [CrossRef]
  39. Komi, A.; Petropoulos, A.; Evelpidou, N.; Poulos, S.; Kapsimalis, V. Coastal Vulnerability Assessment for Future Sea Level Rise and a Comparative Study of Two Pocket Beaches in Seasonal Scale, Ios Island, Cyclades, Greece. J. Mar. Sci. Eng. 2022, 10, 1673. [Google Scholar] [CrossRef]
  40. Pantusa, D.; D’Alessandro, F.; Frega, F.; Francone, A.; Tomasicchio, G.R. Improvement of a Coastal Vulnerability Index and Its Application along the Calabria Coastline, Italy. Sci. Rep. 2022, 12, 21959. [Google Scholar] [CrossRef]
  41. Tarigan, T.A.; Ahmad, A.L.; Suciana; Fauzi, M.A.R.; Fatkhurrozi, M. Assessment of Coastal Vulnerability Index (CVI) and Its Application along the Sragi Coast, South Lampung, Indonesia. Int. J. Geomate 2024, 26, 134–141. [Google Scholar] [CrossRef]
  42. Vitousek, S.; Barnard, P.L.; Fletcher, C.H.; Frazer, N.; Erikson, L.; Storlazzi, C.D. Doubling of coastal flooding frequency within decades due to sea-level rise. Sci. Rep. 2017, 7, 1399. [Google Scholar] [CrossRef] [PubMed]
  43. Manno, G.; Azzara, G.; Lo Re, C.; Martinello, C.; Basile, M.; Rotigliano, E.; Ciraolo, G. An Approach for the Validation of a Coastal Erosion Vulnerability Index: An Application in Sicily. J. Mar. Sci. Eng. 2022, 11, 23. [Google Scholar] [CrossRef]
  44. National Land Survey of Finland. Karttapaikka. Available online: https://asiointi.maanmittauslaitos.fi/karttapaikka/?lang=en (accessed on 25 January 2025).
  45. Ružić, I.; Vulin, A.; Benac, Č.; Juras, J. Assessment of the Coastal Vulnerability Index in an Area of Complex Geological Conditions on the Krk Island, Northeast Adriatic Sea. Geosciences 2019, 9, 219. [Google Scholar] [CrossRef]
  46. Luijendijk, A.; Hagenaars, G.; Ranasinghe, R.; Baart, F.; Donchyts, G.; Aarninkhof, S. The State of the World’s Beaches. Sci. Rep. 2018, 8, 6641. [Google Scholar] [CrossRef]
  47. Vousdoukas, M.I.; Ranasinghe, R.; Mentaschi, L.; Plomaritis, T.A.; Athanasiou, P.; Luijendijk, A.; Feyen, L. Sandy Coastlines under Threat of Erosion. Nat. Clim. Chang. 2020, 10, 260–263. [Google Scholar] [CrossRef]
  48. Griggs, G.; Reguero, B.G. Coastal Adaptation to Climate Change and Sea-Level Rise. Water 2021, 13, 2151. [Google Scholar] [CrossRef]
  49. Li, J.; Roy, D.P. A Global Analysis of Sentinel-2A, Sentinel-2B and Landsat-8 Data Revisit Intervals and Implications for Terrestrial Monitoring. Remote Sens. 2017, 9, 902. [Google Scholar] [CrossRef]
  50. Peltier, W.R.; Argus, D.F.; Drummond, R. Space Geodesy Constrains Ice Age Terminal Deglaciation: The Global ICE-6G_C (VM5a) Model. J. Geophys. Res. Solid Earth 2015, 120, 450–487. [Google Scholar] [CrossRef]
  51. Charuka, B.; Angnuureng, D.B.; Brempong, E.K.; Agblorti, S.K.M.; Antwi Agyakwa, K.T. Assessment of the Integrated Coastal Vulnerability Index of Ghana toward Future Coastal Infrastructure Investment Plans. Ocean. Coast. Manag. 2023, 244, 106804. [Google Scholar] [CrossRef]
  52. Neumann, B.; Vafeidis, A.T.; Zimmermann, J.; Nicholls, R.J. Spatial Vulnerability Assessment for Climate Change Impacts on Coastal Communities: Combining Physical and Socio-Economic Dimensions. Clim. Chang. 2021, 168, 42. [Google Scholar] [CrossRef]
Figure 1. Geographic context and Finland’s shoreline (source: World Topographic Map).
Land 14 01741 g001
Figure 2. Percentage vulnerability of each CVI parameter. The numbers shown in the bars represent a percentage of the total coastline of Finland. The different levels of vulnerability are shown using a bivariate color palette, with red color hues indicating a high degree of vulnerability, while green hues show a low level of vulnerability (WH: wave height, TR: tidal range, RSL: relative sea level, SH Change: shoreline change).
Land 14 01741 g002
Figure 3. Vulnerability classification maps: (a) geomorphology, (b) coastal slope, (c) MWH, (d) TR, (e) RSL, (f) SH change. The different levels of vulnerability are shown using a bivariate color palette, with red color hues indicating a high degree of vulnerability, while green hues show a low level of vulnerability.
Land 14 01741 g003aLand 14 01741 g003b
Figure 4. Map of the resulting CVI classes for Finland. The different levels of vulnerability are shown using a bivariate color palette, with red color indicating a high degree of vulnerability, while green hues show a low level of vulnerability. The area is focused is one of the largest cities of Finland that is facing moderate and high results of vulnerability.
Land 14 01741 g004
Figure 5. CVI results pie chart for coastline vulnerability, as percentages (%).
Land 14 01741 g005
Table 1. Data sources used in CVI calculations in this study.
CVI VariablesSourceReference Period
Mean Wave Height (m)[37]1979–2018
Relative Sea-Level Change (mm/y)[21]IPCC 2100
Tidal Range (m)[38]1992–2008
Coastal SlopeNational Land Survey of Finland DEM https://asiointi.maanmittauslaitos.fi/karttapaikka/?lang=en
(accessed on 25 January 2025)
-
GeomorphologyEMODnet (geology/coastal type) https://emodnet.ec.europa.eu/geoviewer/#!/ (accessed on 5 May 2025)-
Shoreline Erosion/Accretion (m/y)EMODnet (geology/coastal migration/satellite data) https://emodnet.ec.europa.eu/geoviewer/#!/ (accessed on 5 May 2025)2007–2017
Table 2. CVI variables ranking according to Thieler and Hammar-Klose [16]. The background colors indicate the degree of vulnerability. Red color for high degree of vulnerability and green color for low degree of vulnerability.
CVIVery LowLowModerateHighVery High
Variables12345
GeomorphologyRocky, cliffed coasts; fjords,
fjards;
artificial constructions
Medium cliffs,
indented coasts
Low cliffs, glacial drift, alluvial plains, beach rocks, dunes (mixed material)Cobble beaches, estuaries, lagoonsBarrier beaches, sand beaches, salt marshes, mud flats, deltas, mangroves, coral reefs
Coastal Slope (%)>207–204–72.5–4<2.5
RSL (mm/y)<1.81.8–2.52.5–3.03.0–3.2>3.2
Tidal Range (m)>6.04.1–6.02.0–4.01.0–1.9<1.0
Mean Wave Height (m)<0.550.55–0.850.85–1.051.05–1.25>1.25
Shoreline Erosion/Accretion (m/yr)>2.01.0–2.0−1.0–1.0−1.1–2.0<−2.0
Disclaimer/Publisher’s Note: The statements, opinions and data contained in all publications are solely those of the individual author(s) and contributor(s) and not of MDPI and/or the editor(s). MDPI and/or the editor(s) disclaim responsibility for any injury to people or property resulting from any ideas, methods, instructions or products referred to in the content.