Article

Vegetation Dynamics, Productivity, and Carbon Stock in Plant Matter in the Drained Berkazan-Kamysh Peatland (Bashkir Cis-Urals) After Rewetting

1
Ufa Institute of Biology, Ufa Federal Research Centre of the Russian Academy of Sciences, Ufa 450054, Russia
2
Laboratory of Climate Change Monitoring and Carbon Ecosystems Balance, Ufa State Petroleum Technological University, Ufa 450062, Russia
3
Department of Bioecology and Biological Education, Bashkir State Pedagogical University n.a. M. Akmulla, Ufa 450008, Russia
*
Author to whom correspondence should be addressed.
Land 2025, 14(9), 1729; https://doi.org/10.3390/land14091729
Submission received: 15 July 2025 / Revised: 21 August 2025 / Accepted: 22 August 2025 / Published: 26 August 2025
(This article belongs to the Special Issue Ecological Functions and Conservation of Wetland Systems)

Abstract

Peatlands store huge amounts of soil carbon and play an important role in the global carbon cycle. Drained peatlands stop accumulating carbon and become a source of carbon emissions. Rewetting is an effective method used to restore the ecological functions and carbon sequestration capacities of previously drained peatlands. The eutrophic Berkazan-Kamysh peatland, located in the forest–steppe zone of Bashkir Cis-Urals (the Republic of Bashkortostan), was drained in the 1970s, and since 2017, it has been undergoing rewetting. The aim of this work is to assess and quantify above- and belowground phytomass and its associated carbon pool, as well as to study the dynamics of the vegetation in the Berkazan-Kamysh peatland after rewetting. Vegetation mapping was performed and the areas of the main plant communities were calculated using the Random Forest method. It was found that, over the 7 years from the start of rewetting, the total area of hygro- and hydrophytic mire communities increased almost 3-fold (from 218 to 608 ha). During the same time, the area of meadow communities decreased by half (from 808.0 to 398.9 ha). The areas occupied by helophytic communities of tall graminoid plants (Phragmites australis and Typha angustifolia) have increased 10-fold and have begun to occupy more than 40% of the total area of the peatland. The aboveground phytomass of these types of plant communities can reach 1500–2000 g m−2. Helophytization and other changes in vegetation composition led to a general increase in the above ground phytomass of the peatland of more than twofold.

1. Introduction

Peatlands play an important role in the global carbon cycle [1,2,3,4]. In the mires, the high humidity, low soil temperature, and anaerobic conditions suppress the activity of aerobic decomposers (bacteria and fungi) [1,5], and plant residues do not decompose completely but accumulate as peat. In the different types of peatlands in the boreal and temperate zones of the Northern Hemisphere, the average rate of carbon accumulation can be 4–30% of the annual net primary production of their vegetation [6]. Thus, determining the biological productivity of peatland vegetation is important for studying the global carbon cycle. Aboveground phytomass and root phytomass are the main indicators used for calculating the biological productivity of peatlands, where biomass stocks depend on the species composition of plant communities, the climatic conditions (especially temperature and precipitation during the growing season), the presence of nutrients, water table fluctuations, and other factors [1,7,8,9,10,11].
Currently, about 10% of the world’s peatlands have been anthropogenically transformed [12,13]. They cover only 0.3% of the world’s land area but are the source of 5% of global anthropogenic CO2 emissions [14]. Large areas of European temperate fens have been drained for agriculture [4]. After drainage, peatland ecosystems turn from accumulators into sources of carbon and N2O [4,15,16,17]. Carbon losses in drained peatland ecosystems occur through microbial oxidation of peat and through the release of CO2, CO and CH4 during peat fires [13]. Drainage leads to aeration and mineralization of the upper peat layers, eutrophication, subsidence of the peat soil surface, and reductions in the water-holding capacity of peatlands. In addition, drained peatlands are sources of nutrients, causing eutrophication of groundwater and downstream surface water [18,19].
Rewetting is a cost-effective measure to curb CO2 emissions from drained peatlands. It is considered a promising approach to peatland restoration with the aim of conserving biodiversity, mitigating climate change, and protecting water quality [14,20,21,22]. There has been a rapid increase in peatland restoration studies since the 2010s, which have focused on understanding various factors and conditions that affect restoration outcomes [13,20,23,24,25].
The depth of the water table is recognized as the main factor influencing the carbon balance in peatlands [26], and much of the research on rewetted peatlands has focused on CO2 emissions and greenhouse gas fluxes [27].
However, rewetting is only the first step in peatland restoration; its aim is to improve the hydrological conditions necessary for ecological development. Achieving higher water tables and lower carbon emissions should not be the only goal of ecological restoration. Despite the importance of rewetting in regulating the peatland carbon cycle, there is limited understanding of how it may affect plant community composition or productivity [24,25]. It has been shown that rewetting not only contributes to an increase in the number of hygrophilous species but also promotes an increase in the length of the growing season and changes in the phenological rhythms of plants [28,29,30], as well as an increase in productivity and the duration of growth of plant species’ aboveground and root biomass. This enhances carbon sequestration in rewetted peatlands, through mechanisms including a longer period of root growth in deep peat layers [30].
At the same time, there are multiple challenges, including technical difficulties related to water control and characteristics, levels of degraded peatlands, and problems related to socioeconomic conditions [31]. Restoring the typical hydrology for near-natural peatlands can be a major challenge, requiring landscape-scale hydrological measures to restore groundwater discharge patterns and related vegetation heterogeneity and to achieve the required groundwater and surface water parameters, soil structure, etc. [20]. In particular, it has been noted that the restoration of the water-conducting and -retaining properties of peat in drained peatlands is practically impossible, since, as a result of drying out, the decomposed and compacted peat prevents the inflow of groundwater, which leads to strong fluctuations in the water table and can increase peat mineralization [32].
With regard to fen restoration, it should be noted that a number of studies have shown that rewetting cannot always restore natural conditions or the various ecosystem services of severely disturbed and long-drained temperate fens, even over a long period of time [20,21,22,33]. One of the main barriers is the restoration of the necessary hydrological regime. Pristine fens exhibit natural fluctuations in water table, and fen vegetation communities adapt to different conditions at different times of the year. A comparison of rewetted and near-natural fen peatland sites across temperate Europe showed that rewetting of drained fen peatlands often induces helophytization (an increase in the area covered by tall, graminoid wetland plants) and long-lasting differences in pre-drainage biodiversity and vegetation structure, ecosystem functioning, and land cover characteristics (spectral temporal metrics) [33,34].
Fens include a wide variety of peat-forming ecosystems with a wide distribution. Studying the restoration of different fen types in various regions and environmental conditions is important to gain new hydrological, biogeochemical, and ecological knowledge that can be used to define restoration measures based on types of fens and starting conditions and to determine challenges in the hydrological restoration of drained peatlands [20].
In the forest–steppe zone of Russia, peatlands usually occupy less than 0.5–1% of the area of administrative districts but are important for maintaining the hydrological balance of landscapes and preserving biological diversity. As a rule, forest–steppe peatlands have a small area (on average up to 25–200 hectares) and shallow peat deposits (on average 0.9–2 m), making them extremely vulnerable to climate aridization [1,35,36]. In European Russia, there are more than 6000 forest steppe peatlands with a total area of at least 500 thousand hectares, more than half of which have been anthropogenically transformed [37]. Climate aridization contributes to an increase in the frequency of peat fires, which often occur in all natural zones of Russia, including forest steppe and steppe regions [38]. Peat fires in particular occur often on drained peatlands. Rewetting of drained peatlands can prevent peat fires and promote carbon sequestration of forest steppe ecosystems.
In Russia, rewetting of peatlands has only begun in recent decades in a few regions (Moscow, Tver, Nizhny Novgorod, Ryazan regions, etc.) [39], most of which are located in the forest zone. In 2017, rewetting began on the Berkazan-Kamysh eutrophic drained peatland located in the forest–steppe zone of the Bashkir Cis-Urals (the Republic of Bashkortostan, the South Ural region). The patterns of the formation of plant biomass and the decomposition of dead plant remains in rewetted peatlands of Russia have not been sufficiently studied. There are also few studies comparing these processes with similar data on undisturbed and drained peatlands within the forest-steppe zone. The aim of this work is to assess and quantify above- and belowground phytomass and its associated carbon pool, as well as to study the dynamics of vegetation in the Berkazan-Kamysh peatland after rewetting.

2. Materials and Methods

2.1. Site Description

The Berkazan-Kamysh peatland has an area of 1204 ha and is located in the “Asly-Kul” Nature Park in the Davlekanovsky District of the Republic of Bashkortostan (RB) (Figure 1) [40].
According to the physical and geographical zoning of the Republic of Bashkortostan [41], the study area is located in the southern forest–steppe subzone of birch–oak forests and steppes. The climate is continental with moderate or insufficient moisture. The precipitation level during periods when the air temperature is above 10 °C is 200–250 mm, with an average annual precipitation of 450 mm. Droughts are common in spring, and cold, long winters and dry summers are typical. Southern and western cyclones are accompanied by higher temperatures in winter, stronger winds, heavy snowstorms, and snowfalls. The average annual temperature is +2.3 °C, the average monthly temperature in January is −14 °C, and the average monthly temperature in July is +20 °C. The sum of active temperatures in the study area is 2100–2500 °C. The duration of the period with stable snow cover averages 147 days, while the duration of the frost-free period is 110–120 days. Southern and southwestern winds prevail [40].
Peatlands are rare and occupy less than 1% of the territory of the Davlekanovsky District, but Berkazan-Kamysh is one of the largest peatlands in the forest–steppe and steppe zones of European Russia [40].
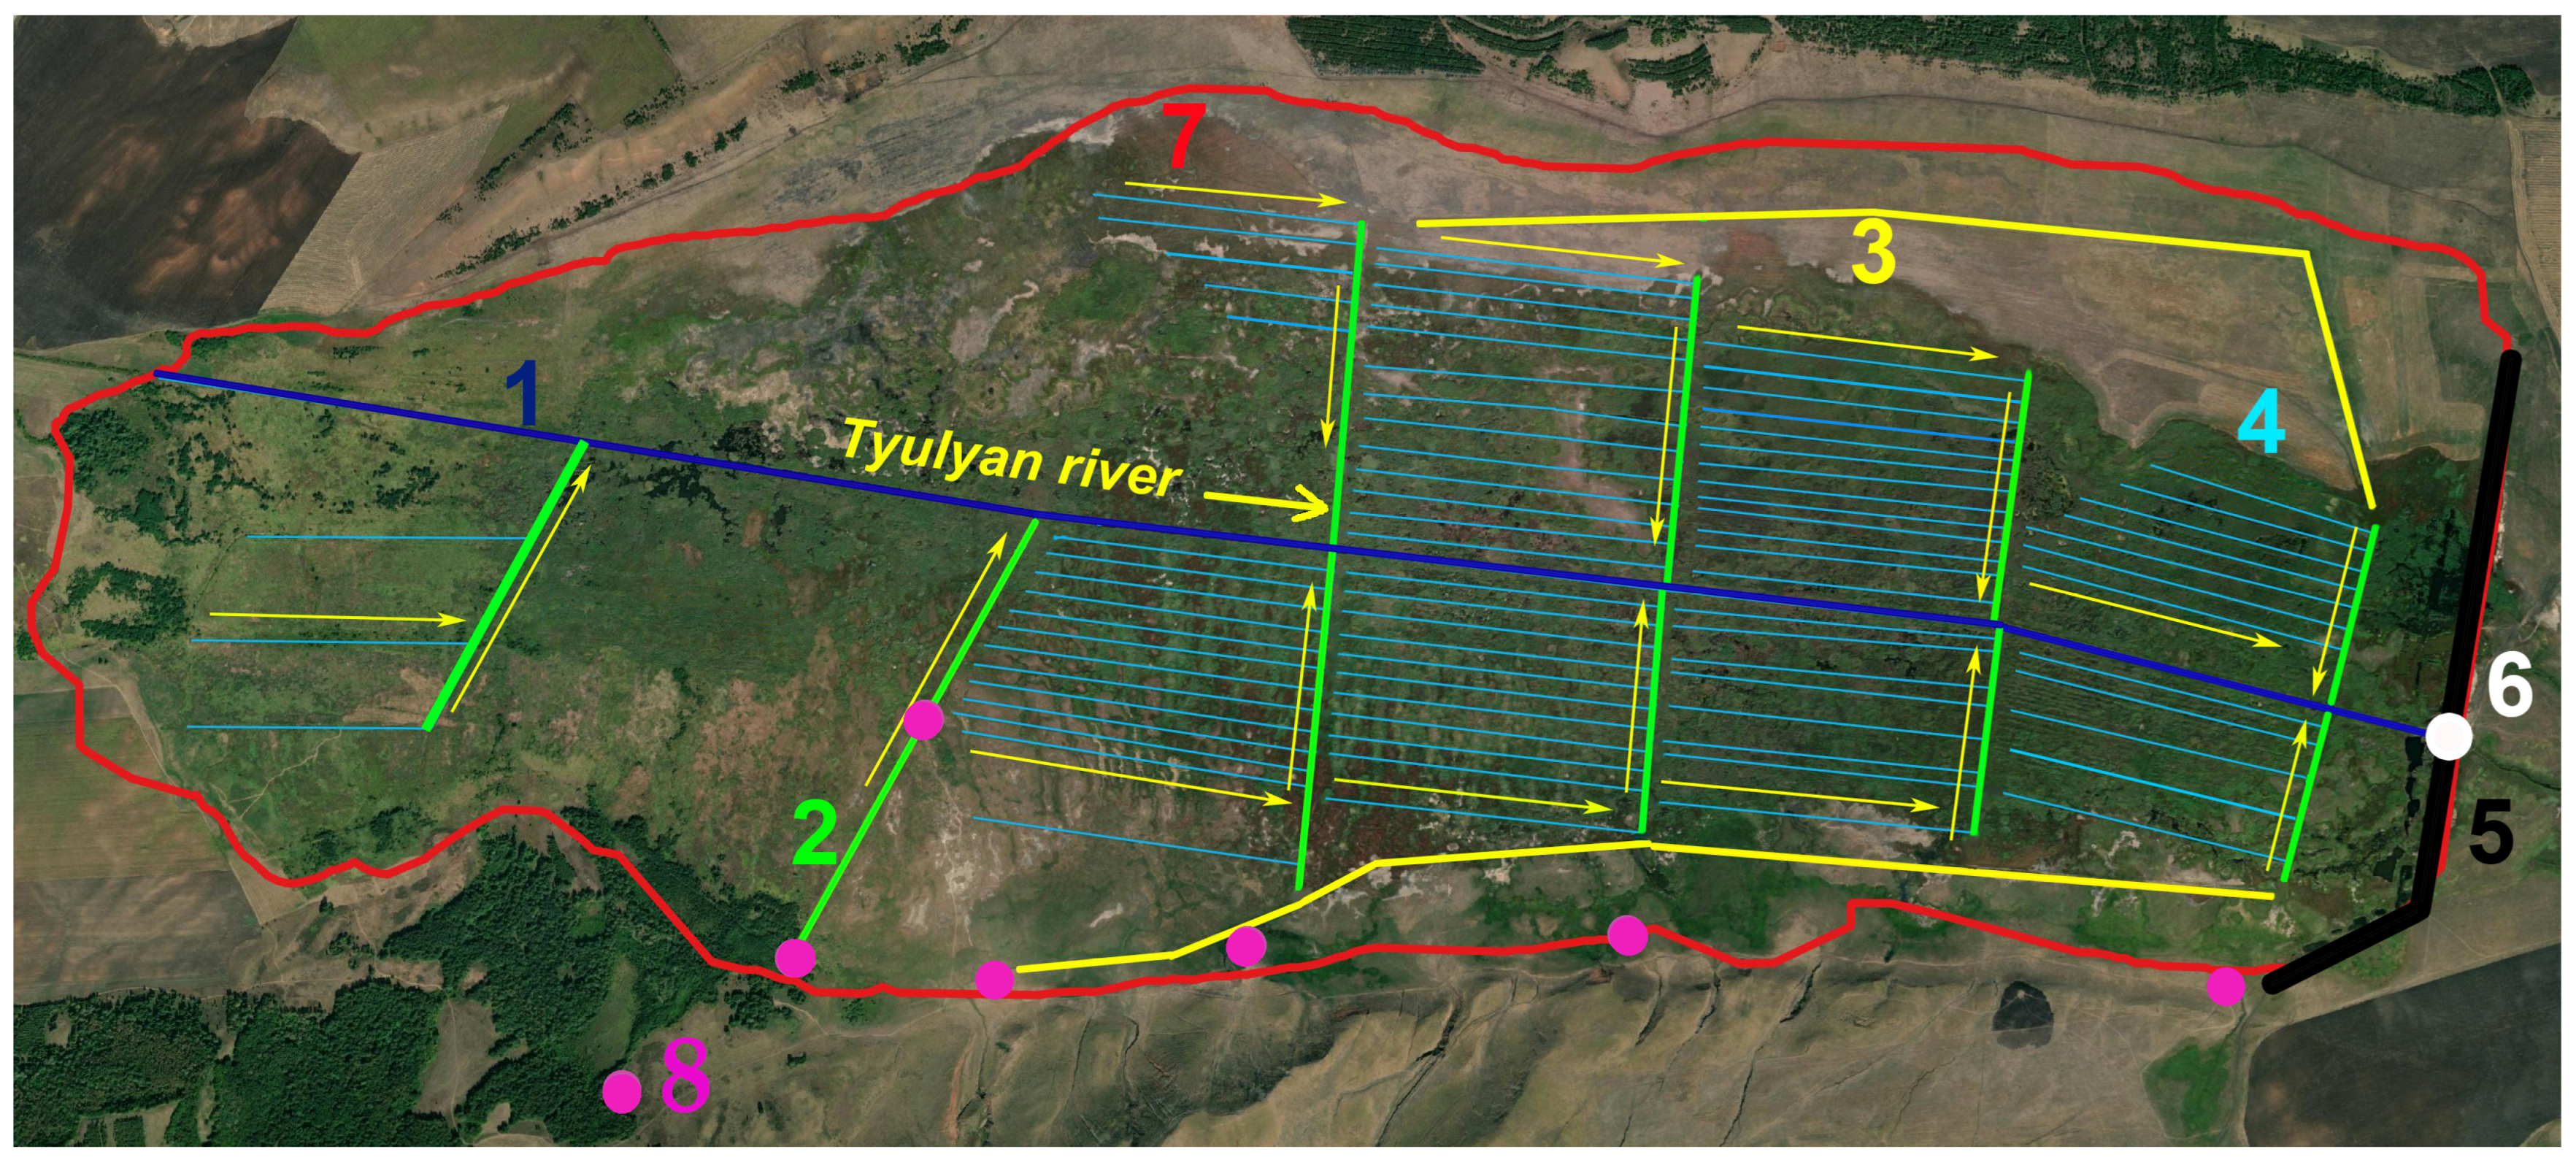
The Berkazan-Kamysh peatland has a flat surface. In the north, south, and west, it is surrounded by hills with relatively steep slopes (up to 9°) and a height of 250–300 m above sea level. The peatland is fed by floodplains and spring waters, as well as surface atmospheric waters flowing down from the surrounding hills (Figure 2). The groundwater has a hydrocarbonate–calcium–magnesium composition with a dry residue content of 480 to 1014 mg L−1. In some areas, the groundwater has a calcium sulfate composition with a dry residue content of 1093–2060 mg L−1. Near the southern edge of the peatland, there are spring outlets with a flow rate from 0.2 to 1 L s−1.
The soil mantle of the Berkazan-Kamysh peatland is represented by organogenic and mineral soils. In the 1970s, before the drainage of the peatland, the following soils were identified: silty bog soils, peat-bog weak solonchaks, peat soils, chernozem-meadow solonchaks, chernozem-meadow loams, and meadow clayey solonchaks [42]. After drainage, peat was extracted in part of the territory for several years, with most of the drained peatland subject to plowing. After plowing ceased, the territory was used for grazing and haymaking. Grazing continues on the outskirts and in the non-watered part of the peatland. Currently, five main types of soils are represented on this peatland [43]: meadow-chernozem soil, meadow weak solonchakish (containing a low amount of readily water-soluble salts) soil (Gleysols Sodic Endosalic), meadow solonchak (Solonchaks Gleyic Aridic), peat soil (Retisols Histic Abruptic), and peatbog soil (Histosols Dystric Fibric). Solonchaks and solonchakish subtypes of the meadow soils are characterized by a lower content of humus and mineral nutrients; the reaction of the medium ranges from neutral to strongly alkaline. Solonchakish soils are characterized by a moderate degree of salinization, and solonchaks by a high degree [42]. The salinization-induced degradation of these soils could have been triggered by an upward movement of water-soluble salts to the surface caused by intensified evapotranspiration. Gley horizons of the bog soil were exposed after drainage amelioration and plowing, and disruption of the capillary fringe caused spotty salinization of the sulfate or sulfate–chloride–carbonate, which led to complete loss of fertility and a decline in soil amount in this area [42].
Peat and peat-bog soils predominate in the western part of the study area. Meadow weak solonchakish soil and meadow solonchak soil have developed in the eastern part of the peatland, where initial studies of the sporadic formation of peat in small depressions with clay deposits were performed. Meadow-chernozem soils are found at the foot of hills near the southern and northwestern edges of the peatland.
The main reserves of reed–sedge peat are located in the western part of the peatland and amount to 267 hectares within the peat deposit boundary, including 185 hectares of industrial peat deposits with a depth of over 0.7 m. The maximum depth of the peat deposit is 3.9 m, and the average is 2.2 m. The peat reserves in the study area amount to 1298 thousand tons [40].
In the early 1970s, the Berkazan-Kamysh peatland was drained via laying open drainage channels. The drainage network included drainage channels, transport channels, upland-catching channels, and the main channel (Tyulyan River) (Figure 2).
During the 20th century, peat fires repeatedly occurred in the study area and became more frequent after drainage. In 1998, to prevent peat fires, a blocking embankment dam was built, part of which was destroyed in 1999 during the flood. In 2017, the following works were carried out for the rewetting of this peatland: restoration of the dam; filling of the crest and slopes of the dam; installation of an automatic spillway; installation of a trash rack; installation of a bottom drain; and installation of bulkheads on drainage channels, etc. The maximum height of the dam is about 2.5 m, its width is 6 m, and its length is 1.5 km. On the dam, there is a spillway structure, which consists of two reinforced concrete pipes with a diameter of 1.5 m. The Tyulyan River, whose bed was straightened in the 1970s during improvement works, crosses the peatland from east to west. The spring flood can last for one week; rain floods are observed regularly on the river but do not exceed the spring flood in magnitude.
Before rewetting, the level of water table in different parts of the Berkazan-Kamysh peatland varied from +30 cm (during spring snowmelt) to −180 cm (in the summer months).

2.2. Study and Mapping of Vegetation Cover on the Berkazan-Kamysh Peatland

In 2023–2024, 166 25–100 m2 geobotanical relevés were created in the study area, with the size of their area depending on the size of homogenous plant communities. All geobotanical relevés were entered into the TURBOVEG database [44] and subsequently used for vegetation classification in the JUICE program [45]. Syntaxonomic analysis of the plant communities was performed in accordance with the Braun-Blanquet approach [46,47,48]. Vegetation classification was carried out using the Random Forest ViGra module in SAGA V. 7.7.0 [49] software on individual layers of Sentinel-2 multispectral space images with a spatial resolution of 10 m. Eight cloudless images for the 2024 growing season (late April–August) were used. More than 900 georeferenced points of different types of plant communities identified during field studies in 2023–2024 were used as a training matrix. We used the following Random Forest settings: tree count—100, minimum node split size—5 and regression accuracy—0.01. The Prediction Probability function was used to evaluate the quality of predictions in each pixel of the raster of the resulting map. The mapping result with very high average values of the forecast quality (80–90%) was selected, which indicates a high quality of the model. In addition, a manual check of the model quality was performed. For this purpose, the obtained model was verified using 200 points of plant community types that were not included in the Random Forest training. The prediction quality was 88%. Manual map adjustment was carried out in QGIS V. 3.28 using aerial photography data from a DJI MATRICE 300 RTK quadcopter with a resolution of 25 cm per pixel.

2.3. Estimation of the Live Phytomass and Mortmass of Herbaceous Plants

To analyze the productivity of aboveground phytomass during the period of their maximum development (at the end of July and beginning of August), we set 166 square sample plots sized 50 × 50 cm (from 13 to 47 plots for each type of plant community depending on its mosaic nature). The stock of the total plant biomass includes the following fractions: living organic phytomass of aboveground parts of plants, root phytomass, and mortmass (dead biomass, including both plant litter, i.e., dead decomposing plants, and dead parts of herbs that have not yet lost their connection with living plants) [50]. The root phytomass was estimated using the soil core method. For this purpose, one core with a diameter of 5 cm was taken from the 0–30 cm soil layer in each sample plot. Before analysis, soil and non-organic material were carefully washed away from the roots using running tap water and were then manually separated from organic debris. All root samples were oven-dried at 60 °C to a constant mass, and their weights were measured using analytical scales (VLTE-150, Gosmeter, Saint Petersburg, Russia) with an accuracy of 0.001 g. Cattail phytomass was sampled by cutting stems under the water as close to the roots as possible; the mass of the roots was not determined.

2.4. Analysis of the Samples’ Carbon Contents

Samples of live and dead biomass were ground using Vilitek cutting mills (VLM series) to a particle size of less than 0.5 mm. The finest parts of the roots were ground to a powder in porcelain mortars with liquid nitrogen. The carbon content in the samples was determined using a CHNS EA-3100 elemental analyzer (Eurovector, Pavia, Italy) at the Laboratory of Physical and Chemical Methods of Analysis (PCMA) at the Ufa Institute of Chemistry, UFRC RAS. Quantitative contents were calculated using special software Weaver Version 1.5.0.0.

2.5. Vegetation of the Berkazan-Kamysh Peatland

In 2024, nine types of plant communities were described on the peatland, including eight types of herbaceous communities and one complex type of woody-shrub vegetation. A brief description of these communities is given below.
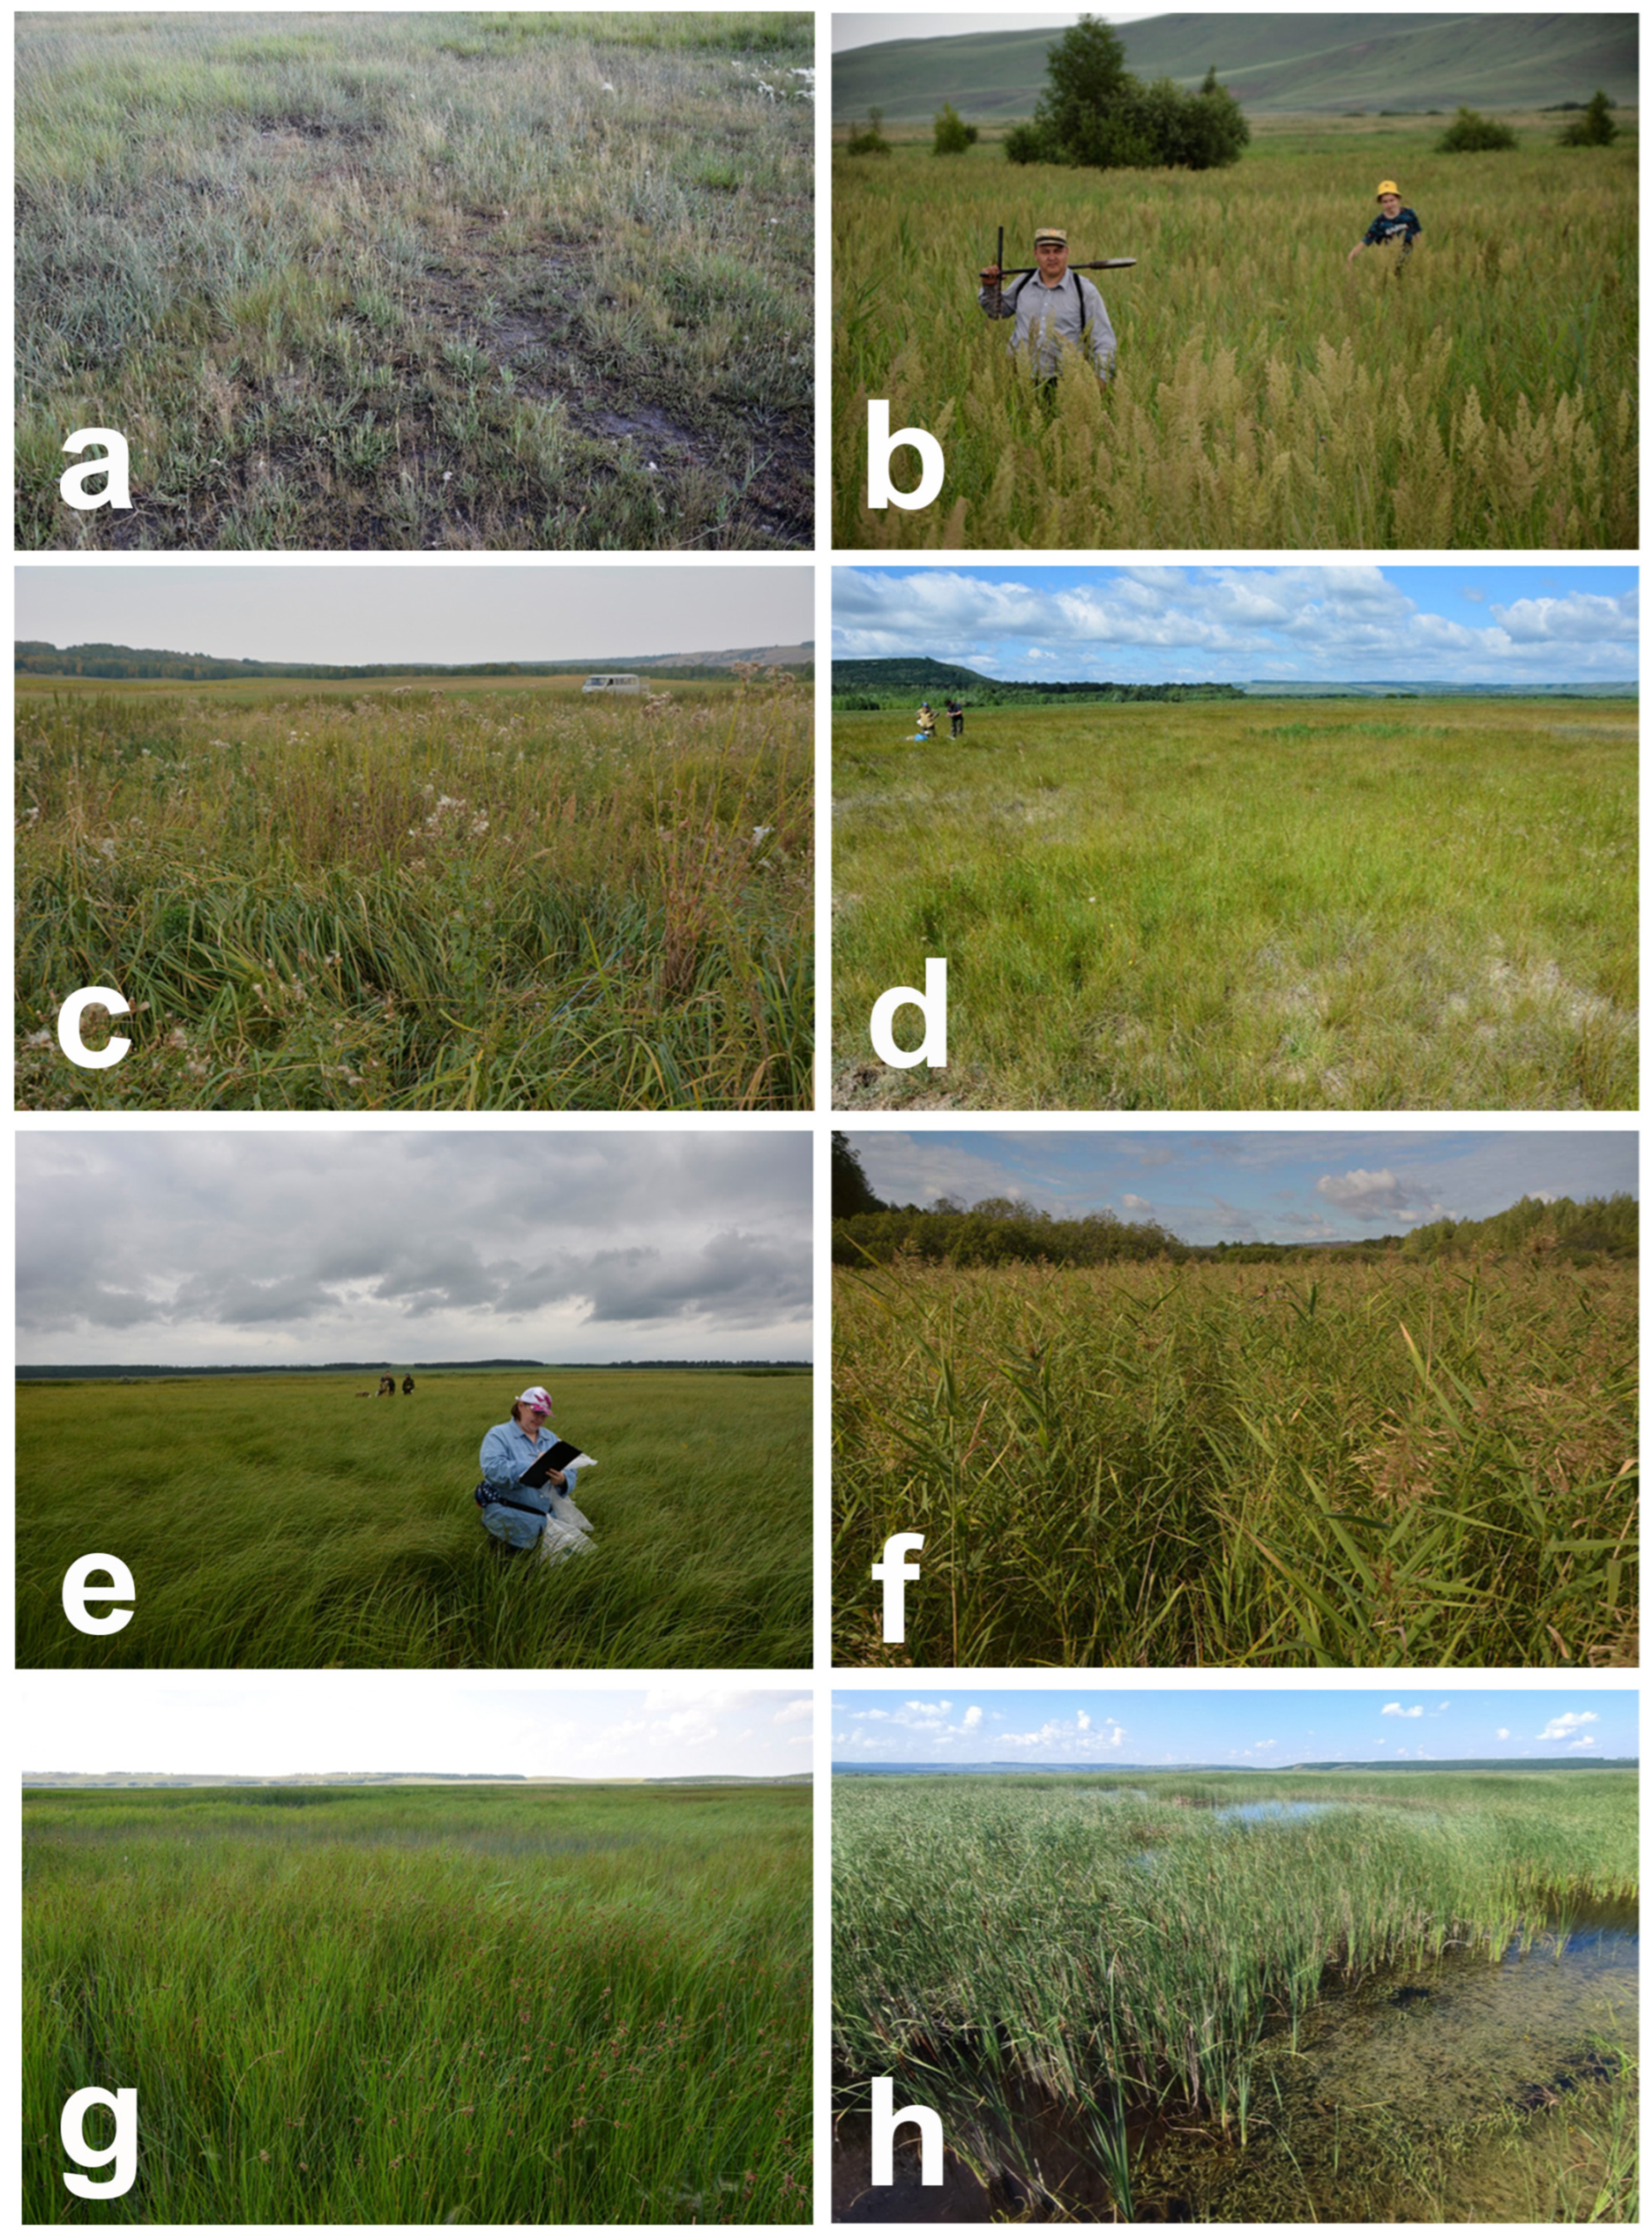
1. Salt-marsh communities (the association Junco gerardii-Agrostidetum stoloniferae Karpov et al. 2006 of the order Scorzonero-Juncetalia gerardi Vicherek 1973 [40,43]) (Figure 3a). These communities are characterized by high constancy of Puccinellia dolicholepis (V.I.Krecz.) Pavlov, Suaeda prostrata Pall., Plantago salsa Pall., as well as a low abundance but quite high constancy of Scorzonera parviflora Jacq., Leymus paboanus (Claus) Pilg., Atriplex sagittata Borkh. and other species. The herb layer has low projective cover (from 25 to 55%, averaging 40%) and height (on average 7.3 cm).
Salt-marsh communities are located on well-drained saline sites where moisture constantly evaporates. Similar communities have been observed in drained peatlands in many areas of the forest–steppe zone in Bashkir Cis-Urals [51,52,53]. In the summers of 2023 and 2024, the water table depth (WTD) in areas with these communities fluctuated from −36 to −125 cm. After the rewetting of the Berkazan-Kamysh peatland, the area of salt-marsh communities considerably decreased.
2. Wet meadows communities with Calamagrostis epigeios (L.) Roth (the association Calamagrostio epigeii-Saussuretum amarae Karpov et al. 2006 of the order Scorzonero-Juncetalia gerardi Vicherek 1973 [40]) (Figure 3b) are located mainly in the western part of the peatland. These subsaline communities are characterized by a dominance of Calamagrostis epigeios and a relatively high abundance of Cirsium setosum (Willd.) Besser ex M.Bieb., Saussurea amara (L.) DC., Alopecurus pratensis L., Sonchus arvensis L., and some other species. The habitats of these communities are characterized by weak soda-sulfate salinization and a relatively stable soil moisture during the growing season. The projective cover of the herb layer varies from 30 to 90% (average 65%); the average height is 75 cm. These communities are present mainly in the least waterlogged western part of the peatland, where they replace common reed communities and border on woody-shrub vegetation. In the summers of 2023 and 2024, the WTD in areas with these communities fluctuated from −28 to −57 cm. In areas with permanent grazing, pasture variants of these communities containing weed species predominate.
3. The Festuca regeliana-forb meadows (Festuca regeliana rangeless community of the order Scorzonero-Juncetalia gerardii Vicherek 1973) (Figure 3c) border on wet meadows with Calamagrostis epigeios. These wet halophytic meadows are dominated by Festuca regeliana Pavlov, Elytrigia repens (L.) Nevski, Saussurea amara. In some sites, Bromopsis inermis (Leyss.) Holub, Thalictrum flavum L., Cirsium setosum, Poa angustifolia L., and other species also may have a high cover. The herb layer has quite a high projective cover (70–95%, average 87%) and an average height of 55 cm. In the summers of 2023 and 2024, the WTD in areas with these communities fluctuated from −34 to −56 cm.
4. The communities of subsaline meadows dominated by Festuca regeliana and Hordeum nevskianum Bowden (association Cirsio esculenti-Hordeetum brevisubulati Karpov et al. ex Golub 1994 of the order Scorzonero-Juncetalia gerardi Vicherek 1973 [40,54]) (Figure 3d) are characterized by a fluctuating moisture regime and are affected by salinization and grazing. The floristic composition includes meadow species, weedy species, and species typical of salt marshes. In these communities, Saussurea amara, Cirsium esculentum C.A.Mey., Plantago salsa, Taraxacum bessarabicum (Hornem.) Hand.-Mazz., Festuca valesiaca Schleich. ex Gaudin and some other species can have a fairly high projective cover. The projective cover of the herb layer varies greatly from 30 to 90%, averaging 63%, while the average height of the herb layer is 32 cm. These communities are divided into two subtypes. The first subtype represents the typical communities described above (var. typicum), and the second one includes communities with co-dominance of Artemisia austriaca Jacq., and is mainly located in the northern part of the peatland in areas with overgrazing. In the summers of 2023 and 2024, the WTD in areas with these communities fluctuated from −28 to −48 cm.
5. Sedge-bed marsh communities with Carex acuta L. (community Carex acutae of the order Magnocaricetalia Pignatti 1953) (Figure 3e) prefer habitats with a high level of moisture. Carex acuta forms 30–40 cm high hummocks, among which Potentilla anserina L., Cynoglossum officinale L. and other species are occasionally found. The herb layer has a high projective cover (70–95%, average 84%) and an average height of 80 cm. In the summers of 2023 and 2024, the WTD in areas with these communities fluctuated from −15 to +5 cm. Habitat degradation and reduction for these communities occur as a result of intensive grazing.
6. Common reed communities dominated by Phragmites australis (Cav.) Trin. ex Steud. (association Phragmitetum australis Savič 1926 of the alliance Phragmition australis Koch 1926 [40]) (Figure 3f) are found in the central part of the peatland along the banks of drainage channels and in small depressions. In these communities, Poa palustris L., Triglochin maritima L., Bolboschoenus maritimus (L.) Palla have a low constancy and abundance. In areas with more drained soil, Agrostis stolonifera L., Festuca regeliana and other species may also be found. The herb layer has a high projective cover (65–100%, average 89%), and an average height of 156 cm. In the summers of 2023 and 2024, the WTD in areas with these communities fluctuated from +5 to +150 cm (on average +55 cm).
7. Tuber-reed communities dominated by Bolboschoenus maritimus (association Bolboschoenetum maritimi Eggler 1933 of the order Bolboschoenetalia maritime Hejný in Holub et al. 1967 [40]) (Figure 3g) are found mainly near the dam, along drainage canals, and on the banks of the Tyulyan River. In the floristic composition of these brackish swamp communities, Trichophorum pumilum (Vahl) Schinz et Thell. and Triglochin maritima can have quite a high projective cover, and Hordeum nevskianum, Puccinellia dolicholepis and some other species are found in low abundance, but a relatively high constancy. The projective cover of the herb layer varies from 65 to 95%, averaging 79%. In the summers of 2023 and 2024, the WTD in areas with these communities fluctuated from 0 to +35 cm (on average +55 cm).
8. Cattail coastal-aquatic communities dominated by Typha angustifolia L. (association Typhetum angustifoliae Pignatti 1953 of the order Phragmito-Magno-Caricetea Klika in Klika et Novák 1941 (Figure 3h) grow mainly along drainage canals and the bed of the Tyulyan River, as well as near the dam. The habitats of these communities are characterized by constant flooding. The communities are characterized only by the episodic presence of single specimens of random species (Scirpus lacustris L., Lythrum salicaria L., Carex riparia Curtis, etc.). The herb layer of the communities is characterized by a high projective cover (50–80%, on average 68%) and height (on average 196 cm). In the summers of 2023 and 2024, the WTD in areas with these communities fluctuated from +45 to +150 cm.
9. Complex woody-shrub-type vegetation is represented in a mosaic of small communities with Betula pubescens Ehrh., Populus tremula L., Alnus glutinosa (L.) Gaertn., Salix caprea L., Salix cinerea L., Salix pentandra L., and other tree and shrub species. In the herb layer, Phragmites australis and Calamagrostis epigeios usually dominate. These communities are located mainly in the western and southwestern peripheral parts of the peatland and occupy an area of 22.8 ha (2.2% of the territory). In the summers of 2023 and 2024, the WTD in areas with these communities fluctuated from −150 to −196 cm.

3. Results

3.1. Analysis of Productivity and Stocks of Aboveground and Root Phytomass in Different Types of Plant Communities on the Berkazan-Kamysh Peatland

The average and total stocks of plant biomass in different types of plant communities in the Berkazan-Kamysh peatland are given in Table 1.
The maximum stock of aboveground phytomass was found in cattail communities with Typha angustifolia (1238.9 g m−2), and the minimum was observed in salt-marsh communities (103.2 g m−2). The largest share of mortmass (but still less than 23% of the total plant biomass of the community) was noted in Festuca regeliana-forb meadows, sedge communities, and wet meadows with Calamagrostis epigeios, where it is represented mainly by grasses and sedge residues. Mortmass was almost absent in the salt-marsh and tuber-reed communities.
In almost all types of plant communities (except for the common reed communities with Phragmites australis and Festuca regeliana-forb meadows, as well as the cattail communities, where the mass of the roots was not determined), the stock of root phytomass exceeded the stock of aboveground phytomass. On average, across all plant community types, the share of roots was 48.6% of the total plant biomass. The largest share of root phytomass was observed in the salt-marsh communities (77.1% of the total plant biomass of the community), Festuca regeliana + Hordeum nevskianum wet meadows (67.7%), and tuber-reed communities (63.9%).

3.2. Total Carbon Stock in the Vegetation of the Berkazan-Kamysh Peatland

A map of the plant communities in the study area is shown in Figure 4. Salt-marsh communities are located mainly in the southern and northern peripheral parts of the peatland and occupy an area of 33.3 ha (3.2% of the total peatland area), while wet meadows with Calamagrostis epigeios occur mainly in the western part of the peatland and occupy an area of 105.2 ha (10.1% of the total peatland area). Festuca regeliana-forb meadows occupy small areas in the western part of the peatland (28.0 ha, 2.7% of the total peatland area). Subsaline meadows dominated by Festuca regeliana and Hordeum nevskianum are located in well-drained areas in the northern and southern peripheral parts of the peatland and occupy large areas (180.2 ha, 17.3% of the total peatland area). Sedge communities with Carex acuta are located near the springs in the southern edge of the peatland and occupy an area of 35.7 ha (3.4% of the total peatland area), while common reed communities dominated by Phragmites australis occupy vast areas (418.6 ha, 40.2% of the total peatland area) in the central and eastern parts of the peatland. Tuber-reed communities with Bolboschoenus maritimus are found mainly near the dam and along canals in the central part of the peatland. These communities occupy 130.5 ha (12.5%) of the total peatland area. Cattail communities with Typha angustifolia are found mainly along the drainage canals and the Tyulyan River, as well as near the dam. These communities occupy an area of 23.2 ha (2.2% of the total peatland area). Finally, woody-shrub vegetation is located mainly in the western and southwestern peripheral part of the peatland and occupies an area of 22.8 ha (2.2% of the total peatland area).
The study area exhibits a mosaic-like vegetation cover, and the distribution of plant communities does not appear to be closely related to specific soil types. Salt-marsh communities, both variants of wet meadows with Festuca regeliana and Hordeum nevskianum, and wet meadows with Calamagrostis epigeios can grow in areas with meadow weak solonchakish and meadow solonchak soils. In areas with peat soil, various types of vegetation (except for alt-marsh communities) were found, while meadow and common reed communities apparently prefer peat-bog soils.
The carbon content in plant matter and the carbon stock accumulated in the phytomass of different types of plant communities are presented in Table 2.
For all types of plant communities in the study area, the carbon content in dry aboveground phytomass was 41.0% on average. The highest carbon content in plant matter was noted in Festuca regeliana-forb meadows, sedge communities with Carex acuta, and in reed and tuber-reed communities (42.7% each), and the lowest was observed in the salt-marsh communities (29.7%). It was found that the average carbon content in the aboveground phytomass was slightly higher than in the mortmass (35–42.5% in different types of plant communities) and in the root phytomass (in all types of vegetation, except for salt-marsh communities).
Among all the studied types of plant communities, the total carbon stock in plant matter is positively correlated with the stock in the aboveground phytomass and roots. On average, for all types of plant communities in the study area, the carbon stock in plant matter was 599.1 g m−2, including the contribution of aboveground phytomass of 248.4 g m−2. The stock of the aboveground phytomass was the highest in the cattail communities (525.3 g m−2) and lowest in salt-marsh communities (30.6 g m−2). The total carbon stock in plant matter was highest in the common reed and tuber-reed plant communities (989.6 and 805.2 g m−2, respectively) and lowest in salt-marsh communities (139.2 g m−2).
In general, the shares of different types of plant communities in the pool of carbon accumulated in plant matter depend on the areas they occupy within the peatland. Currently, 54.3% of the total stock of plant biomass and 55.8% of the total carbon stock accumulated in plant matter of the peatland are accounted for by communities with Phragmites australis, occupying 40.2% of the peatland area. The share of tuber-reed communities (14.3% of the total stock of plant biomass and 14.1% of the total carbon stock in plant matter of the peatland) and Festuca regeliana-forb meadows (13.4% and 12.2%, respectively) is also high. The smallest shares are in the salt-marsh (0.6% of the total carbon stock in plant matter of the peatland) and cattail (1.5%) communities, which have a minimal contribution to the total area of the peatland.

3.3. Dynamics of Vegetation on the Berkazan-Kamysh Peatland After Rewetting

In 2016–2017, the vegetation of the Berkazan-Kamysh peatland was studied and mapped using satellite images, multispectral photography from UAVs, and field studies [55,56]. Before rewetting, only four main types of treeless plant communities were identified: saline meadows (with Hordeum nevskianum, Festuca regeliana, Poa pratensis, Eleocharis quinqueflora, Plantago salsa, Taraxacum bessarabicum, Hordeum jubatum, etc.), slightly saline wet meadows (with Calamagrostis epigeios, Festuca regeliana, Molinia caerulea, Cirsium esculentum, Agrostis diluta, etc.), reed–sedge communities with tuber-reeds (with Phragmites australis, Carex riparia, Bolboschoenus maritimus, Filipendula ulmaria, etc.), and reed–cattail communities with a predominance of Typha angustifolia, Phragmites australis, and Scirpus lacustris [40,56,57,58]. Large areas were occupied by mesophytic communities, whereas common reed–sedge and reed–cattail communities were only located in small depressions, along drainage channels, and in sites with an additional spring water supply. During the drainage time, that is, over more than 40 years, the peatland vegetation was greatly transformed [55,56].
With regard to vegetation mapping, it should be noted that, before rewetting, the resolution of space images did not allow communities with a high level of mosaicism to be identified as separate types during interpretation, and accordingly, they were considered within the framework of other vegetation types.
After the initiation of rewetting, the water table level rose [40] and the diversity of plant communities increased. Some types of hydro- and hygrophytic plant communities began to occupy large areas.
The results of the comparison of the types of plant communities that were identified before [56,57,58] and 7 years after the start of rewetting are presented in Table 3.
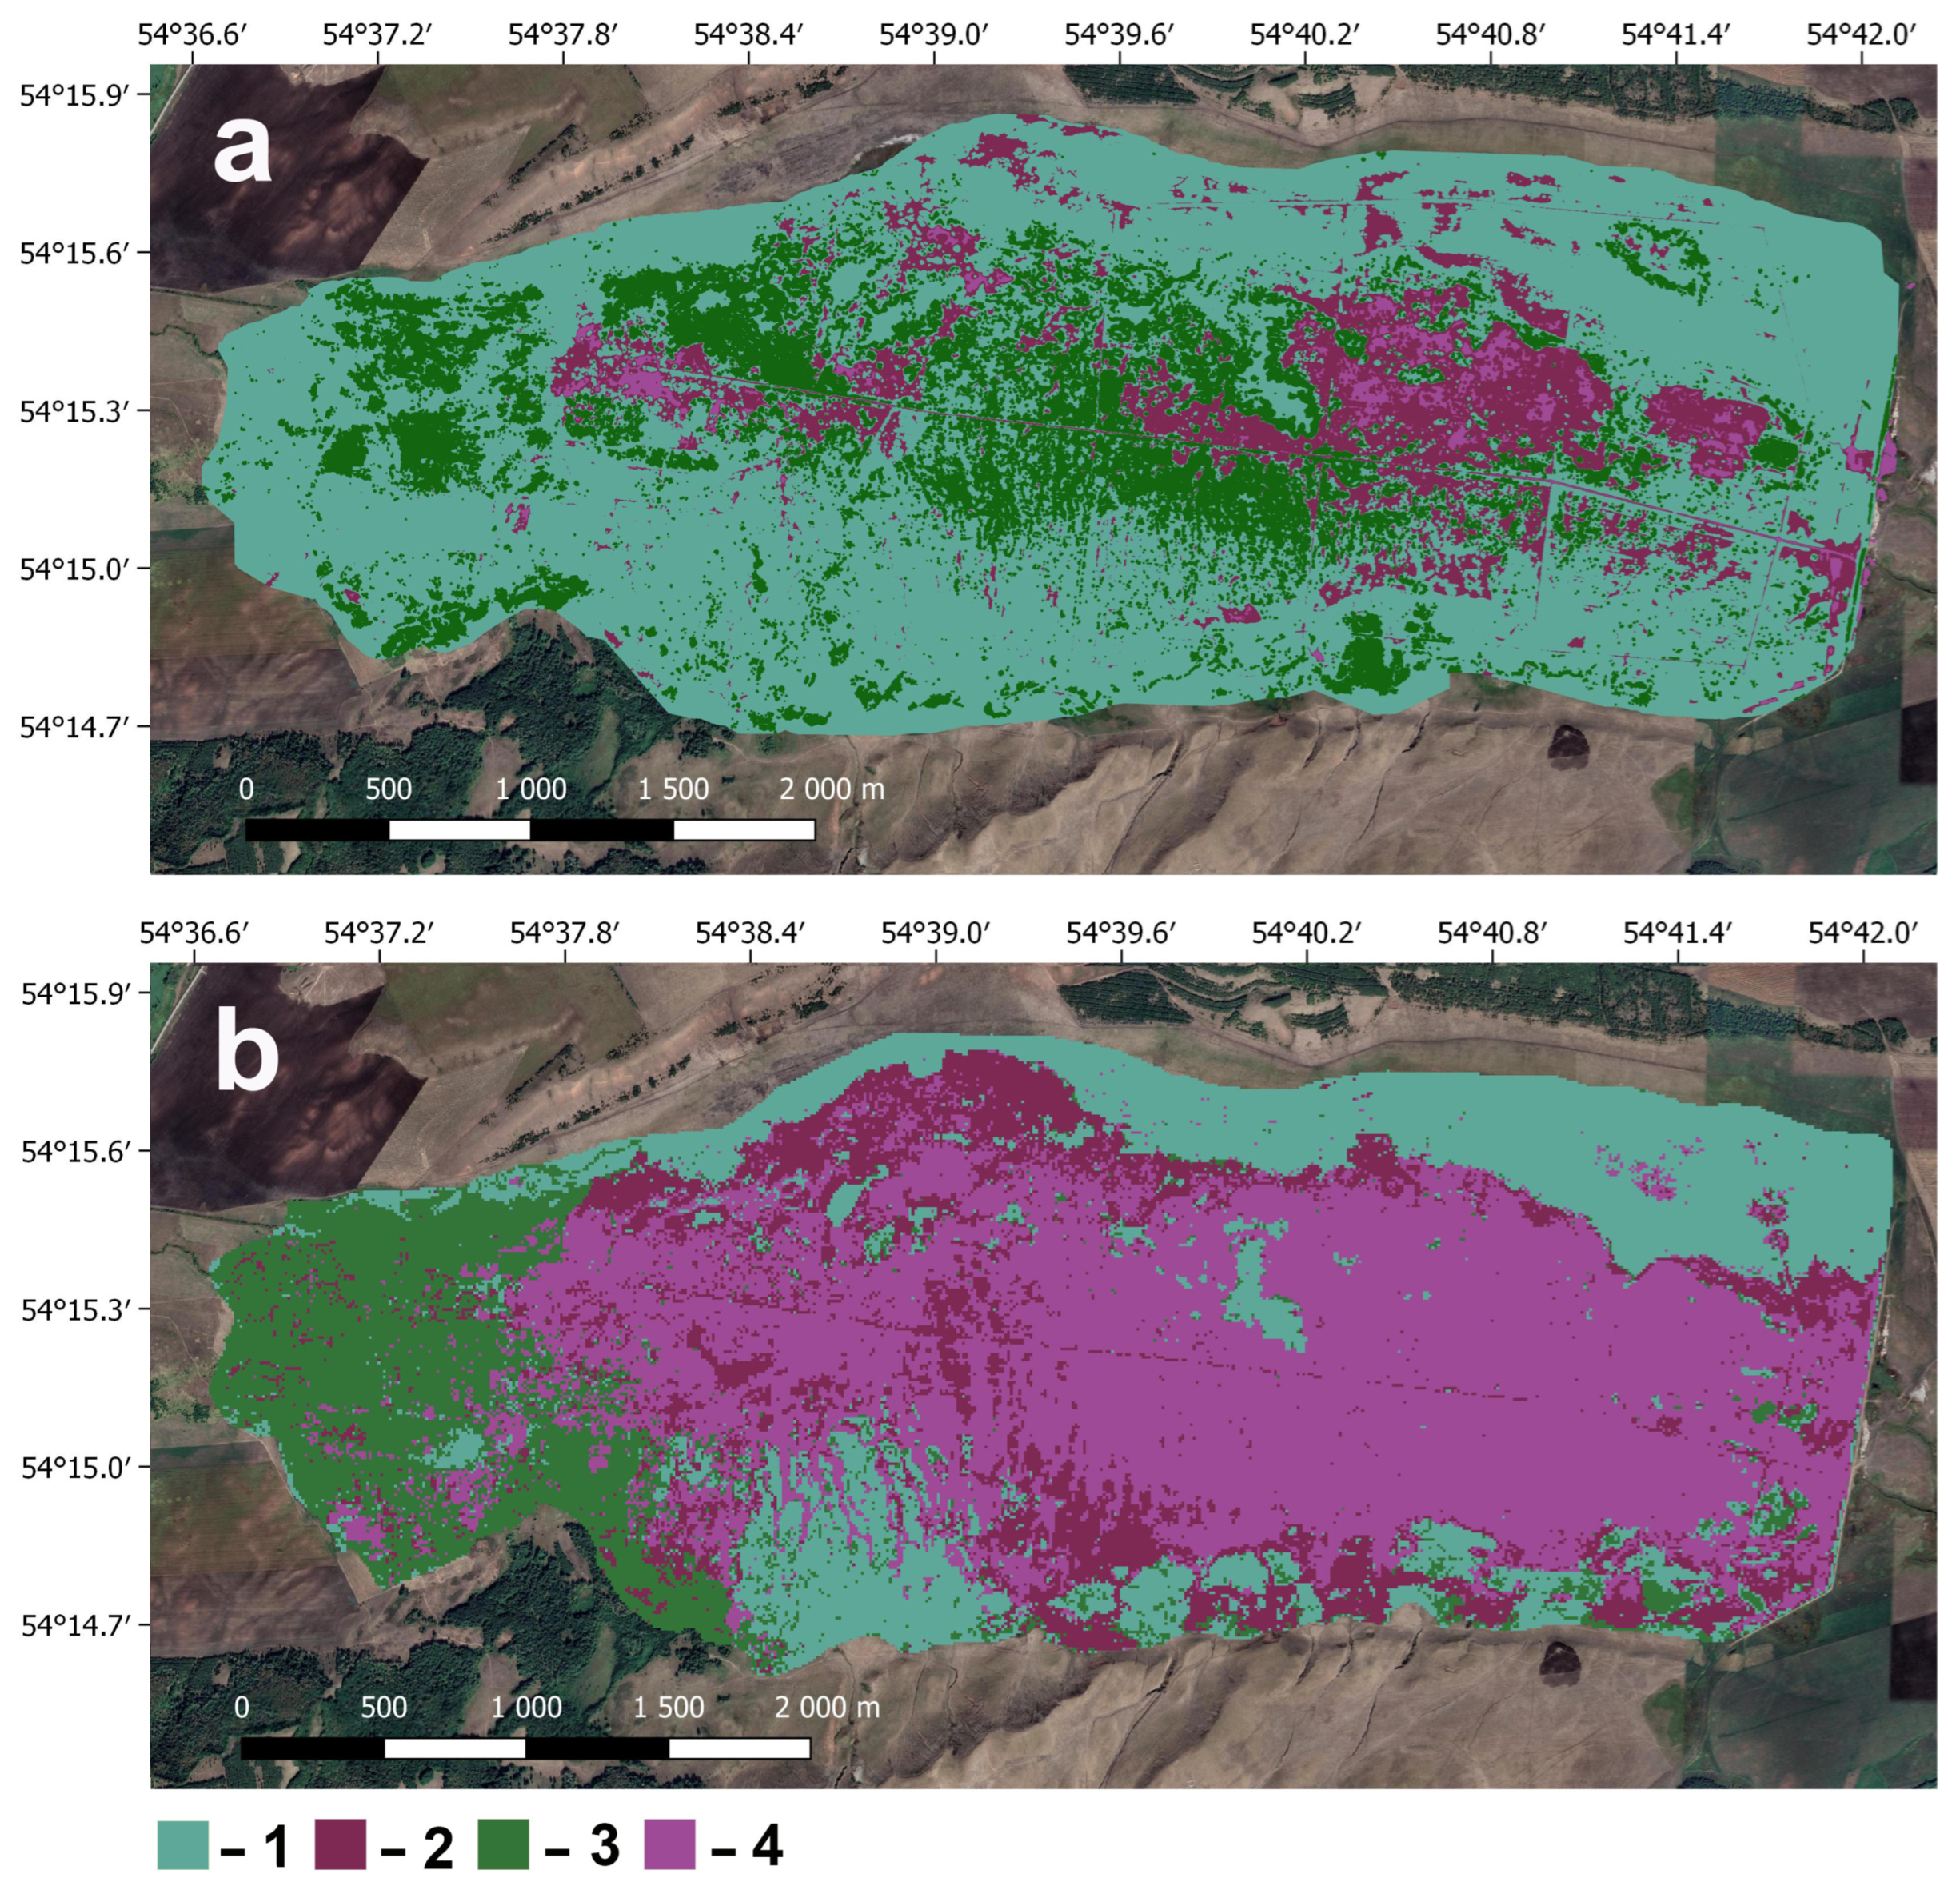
The increase in the water table level after rewetting caused a change in the areas occupied by different types of plant communities (Figure 5, Table 4). In 2017, about 80% of the area of the study area was covered by subsaline communities (saline meadows, slightly saline wet meadows, and salt-marsh communities) (Figure 5a) [55,56,57,58].
After rewetting, the areas of hygro- and hydrophytic communities increased by almost 200% (from 218 hectares to 608 hectares), while on the contrary, the areas of meadows and salt-marsh communities decreased by half (from 808 hectares to 398.9 hectares) (Table 4).
Comparison of the data calculated for the whole peatland area in 2017 (before rewetting) [55,56] and in 2024 showed a considerable increase in the stock of aboveground phytomass. Before rewetting, the stock of the aboveground phytomass was 3103.6 tons, which corresponds to 1261.6 tons of carbon or 4626 tons of absorbed carbon dioxide. After flooding, these data were 7258.9 tons, 3077.6 tons, and 11,283.6 tons, respectively; that is, they more than doubled. Thus, rewetting led to a considerable increase in the carbon stock in plant matter in the Berkazan-Kamysh peatland.

4. Discussion

4.1. Vegetation Dynamics After Rewetting

Over the 7 years since the initiation of rewetting, the areas occupied by communities with a predominance of Phragmites australis and Typha angustifolia have increased 10-fold and began to occupy more than 40% of the total area of the Berlazan-Kamysh peatland (Table 4). A comparison of rewetted fen peatland sites with near-natural peatlands of similar origin across temperate Europe showed that the main differences in vegetation between rewetted and near-natural fens are often associated with helophytization, i.e., increases in areas of communities with tall, graminoid wetland plants [33]. Peat mineralization, a higher bulk density, a low porosity, and decreasing hydraulic conductivity of the peat during the drained phase cause subsidence of the upper layer of the peat deposit, which leads to a high level of groundwater after rewetting [20,33]. In 2017, before the start of rewetting, the water table depth (WTD) in the study area ranged from −30 to +150 cm [55,56]. In 2023–2024, the WTD ranged from −30 to +200 cm, with areas with a high WTD increasing considerably. In the central part of the Berkazan-Kamysh peatland, the average WTD increased by 70–100 cm, and in the dam area, it increased by 150–170 cm.
The combination of flooding and eutrophic conditions promotes the development of tall graminoids, which suppress low-growing vascular plants and mosses. In the study area, helophyte communities are dominated by Phragmites australis and Typha angustifolia, whereas in Central Europe, Typha latifolia or Phalaris arundinacea are more common in rewetted fens [33].
While rewetting clearly reduces carbon emissions by inhibiting peat mineralization, comparative analyses between the different types of plant communities inhabiting rewetted peatland are required to assess the total greenhouse gas effects of rewetting [33]. The research data reflect the fact that communities dominated by the same species can be both sinks and sources of greenhouse gases, depending on the local environmental conditions.
As an important component of natural wetlands, emergent plant species Typha angustifolia and Phragmites australis have a crucial impact on greenhouse gas emissions. Communities with a predominance of these species are commonly known as strong carbon sinks due to the high productivity and carbon fixation in wetland soil. On the other hand, both of these species feature aerenchyma and can enhance the transport of greenhouse gases. This is because plant-mediated transport is a highly effective pathway of CH4 transport from peat and soil to the atmosphere [59,60]. For instance, a field experiment monitoring CO2 and CH4 flux capture showed that Typha angustifolia shows high potential for reducing greenhouse gas emissions after rewetting to flooded conditions when compared with reference drained peatlands in the Netherlands [59]. Phragmites australis-dominated wetlands often exhibit highly negative annual CO2 fluxes (a high CO2 uptake) under high moisture conditions, but drought can turn these ecosystems into a strong carbon source, as shown in the reed belt of a subsaline lake in Austria [60].
According to recent studies, the roots of Typha angustifolia [61] and Phragmites australis [62] not only play an important role in transporting the CH4 that is produced from anaerobic sediment but also provide a habitat for microorganisms, including methanotrophs. Thus, the presence of root-associated methane-oxidizing bacteria is important for reducing CH4 emissions in the ecosystems where these plant species are common. It has been hypothesized that in wetlands dominated by emergent plants, more than 70% of the CH4 produced is transported through plants, and up to 90% is oxidized by aerobic methanotrophs from the root zone [61,63].
To determine the contribution of the communities with a predominance of Typha angustifolia and Phragmites australis to the greenhouse gas balance in the study area, further long-term research is needed.

4.2. Comparison of Productivity and Stocks of Aboveground and Root Phytomass of Plant Communities on the Berkazan-Kamysh Peatland with Peatlands of Other Regions

The stock of plant biomass in peatland communities depends on their structure and floristic composition, as well as on climatic, hydrological, and hydrogeochemical conditions [64,65,66]. Data on the biomass stocks of plant communities in Eurasian peatlands vary quite greatly, since mire communities, despite containing a small set of species, have a high coenotic diversity and grow in various environmental conditions [50].
Little is known about the phytomass stock in plant communities of fens located in the forest–steppe and steppe zones of Russia; the available data are based on a small sample from a limited number of regions. The average stock of the phytomass in fens located in the meadow steppe subzone amounts to about 30 t ha−1 (with the share of roots at about 70%) in European Russia, 26.7 t ha−1 (with the share of roots at up to 77%) in Western Siberia, and 18 t ha−1 (the contribution of aboveground phytomass and root phytomass is approximately equal) in Central Siberia [64].
Eutrophic open mires in the forest–steppe and steppe zones of Russia are characterized by a large share of roots in the total phytomass of plant communities. When there is a lack of oxygen in peat, the advantage is gained by plants with well-developed root systems, especially with small suction roots. An exception is Phragmites australis, which has air-bearing tissue in the roots and does not suffer from a lack of oxygen in the soil; therefore, in plant communities with its dominance, the stocks of aboveground phytomass are higher than the root phytomass [65].
In the study area, the average stock of the total phytomass in Festuca regeliana-forb meadow communities (18 t ha−1, with the average share of roots of 29%), sedge communities with Carex acuta (19 t ha−1, with the average share of roots of 53%), reed communities with Phragmites australis (24 t ha−1, with the average share of roots of 43%) and tuber-reed communities with Bolboschoenus maritimus (20 t ha−1, with the average share of roots of 64%) generally corresponds to these data in terms of total phytomass, while the proportion of roots is less lower than in the open fens of European Russia and Western Siberia.
Some our results can be compared with the data on the phytomass of the fen communities of the Baraba forest steppe (Western Siberia) [66], i.e., the fen community with a predominance of Phragmites australis in the valley of the Ob’ River (average live aboveground phytomass: 450 g m−2.), the forb-Calamagrostis neglecta community (total plant biomass: 4494 g m−2; average live aboveground phytomass: 500 g m−2, root biomass: 2280 g m−2 (60% of the total plant biomass); aboveground mortmass: 1714 g m−2 (38%)), and the forb-Phragmites australis community (total plant biomass: 6214 g m−2; average live aboveground phytomass: 497 g m−2; root biomass: 4122 g m−2 (66%); aboveground mortmass: 1595 g m−2 (25%)). In general, if the average indicators of aboveground phytomass of some meadow and sedge communities in the study area are compared to corresponding data from the fens of the Baraba forest steppe, then the total plant phytomass, mortmass, and root biomass are much lower. However, the aboveground phytomass of our community dominated by Phragmites australis (1101.6 g m−2) significantly exceeds that in similar areas of Western Siberia. This is probably due to the higher water table level in the rewetted peatland, where its fluctuations are not as pronounced as in the near-natural fens in the forest-steppe zone.
The dynamics of plant matter in mire ecosystems are generally linked to the temperature and moisture during the vegetation period. Depending on the hydrothermal conditions of a particular year, the stocks of living aboveground biomass in the communities of open fens in the forest–steppe zone of Western Siberia can change by 2-fold or more [67]. Thus, the results of this comparison may be preliminary, since comparison was made between data obtained over just one year of observation.
Currently, the vegetation in the Berkazan-Kamysh peatland is characterized by a relatively high diversity of plant communities, between which there are considerable differences in the stocks of phytomass fractions. In the future, this vegetation structure will probably change. During the 7 years since the initiation of rewetting, the area of salt-marsh communities has decreased more than twofold, while the area of highly productive helophyte communities has increased substantially. If this trend continues, the stock of plant matter in the Berkazan-Kamysh peatland will increase, which will be important for intensifying the peat formation process. A study of peat formation processes was an objective of this work, but it should be noted that Phragmites australis is an effective peat-forming species and that phragmites peat is widespread in floodplain fens in the forest–steppe area. Cattails, in contrast, usually have low peat accumulation potential and are not desirable for fen reclamation [68]. However, in some peatlands of the southern taiga subzone, layers of peat formed via cattails have been observed [69].
Undisturbed natural fens located near the study area are usually covered with common reed or common reed–sedge communities featuring Carex riparia, Carex juncella, and Carex cespitosa [40]. At present, it is difficult to predict the structure of the peatland vegetation after a long period of rewetting. However, monodominant Phragmites australis are typical and widespread in the natural fens of the forest–steppe zone of the Republic of Bashkortostan.

5. Conclusions

In the forest–steppe zone of European Russia, there are large areas of peatlands, a large part of which have been drained. This, has reduced their sequestration potential, especially in the context of increasingly frequent and intense droughts due to climate change. As a rule, forest–steppe peatlands have a small area and shallow peat deposits, which makes them extremely vulnerable to climate aridization. Drained peatlands are a source of carbon emissions and are a great fire hazard. Rewetting of drained peatlands aims to restore their ecological functions and original carbon sink. The Berkazan-Kamysh peatland is one of the largest peatlands in the forest–steppe and steppe zones of European Russia. In the 1970s, the Berkazan-Kamysh peatland was drained, after which peat fires became more frequent. Then, in 2017, the rewetting of this peatland was initiated to prevent peat fires and restore its ecological functions.
This study uncovered major changes in the vegetation structure and biomass and carbon stocks in the plant matter in the forest steppe Berkazan-Kamysh peatland after rewetting. It was observed that over the 7 years from the start of rewetting, the total area of hygro- and hydrophytic mire communities increased by almost 3-fold (from 218 to 608 ha). At the same time, the area of meadow communities decreased by half (from 808.0 to 398.9 ha). The areas occupied by helophytic communities of tall graminoid plants (Phrag-mites australis and Typha angustifolia) have increased 10-fold and have begun to occupy more than 40% of the total area of the peatland. The aboveground phytomass of these types of plant communities can reach 1500–2000 g m−2. Helophytization and other changes in vegetation composition led to a general increase in the aboveground phytomass of the peatland of more than twofold.
To determine the impact of rewetting on carbon sequestration, further long-term research is needed. Our future studies will be aimed at studying greenhouse gas fluxes in different types of mire communities in the Berkazan-Kamysh peatland, which will help to predict the extent of restoration of the original ecological functions of the drained fens in the forest–steppe zone after rewetting.

Author Contributions

Conceptualization, N.F., P.S. and E.B.; methodology, N.F., P.S. and V.M.; software, N.F., I.B. and I.T.; validation, E.B., V.M. and S.Z.; formal analysis, I.B., I.T., A.M., S.Z. and L.N.; investigation, N.F., P.S., A.M., I.B., I.T., S.Z. and E.B.; data curation, N.F. and E.B.; writing—original draft preparation, N.F., E.B., S.Z. and V.M.; writing—review and editing, N.F., S.Z., E.B. and P.S.; visualization, S.Z., E.B. and P.S.; project administration, S.Z. All authors have read and agreed to the published version of the manuscript.

Funding

Field studies and analysis of plant biomass and carbon stocks was performed within the state assignment framework of the Ministry of Science and Higher Education of the Russian Federation «Assessment of greenhouse gas balance in the Eurasian carbon polygon with the aim to develop technologies to increase carbon stocks by ecosystems of the Republic of Bashkortostan for 2024–2026» (Publication number: FEUR-2024-0007), and the study of the vegetation dynamics on drained peatland was carried out within the state assignment framework No. 123020800001-5 «Analysis and forecast of the complex impact of anthropogenic factors and climatic changes on the vegetation cover of the South Ural region».

Data Availability Statement

The original contributions presented in the study are included in the article, further inquiries can be directed to the corresponding author.

Conflicts of Interest

The authors declare no conflicts of interest.

References

  1. Assessment on Peatlands, Biodiversity and Climate Change: Main Report; Parish, F., Ed.; Kuala Lumpur, Malaysia; Global Environment Centre: Wageningen, The Netherlands; Wetlands International: Ede, The Netherlands, 2008; 179p, Available online: https://hazeportal.asean.org/publications/assessment-on-peatlands-biodiversity-and-climate-change-main-report/ (accessed on 21 August 2025).
  2. Yu, Z.C. Northern peatland carbon stocks and dynamics: A review. Biogeosciences 2012, 9, 4071–4085. [Google Scholar] [CrossRef]
  3. Loisel, J.; Yu, Z.; Beilman, D.W.; Camill, P.; Alm, J.; Amesbury, M.J.; Anderson, D.; Andersson, S.; Bochicchio, C.; Barber, K.; et al. A database and synthesis of northern peatland soil properties and Holocene carbon and nitrogen accumulation. Holocene 2014, 24, 1028–1042. [Google Scholar] [CrossRef]
  4. Joosten, H.; Tanneberger, F.; Moen, A. Mires and Peatlands of Europe: Status, Distribution and Conservation; Schweizerbart Science Publishers: Stuttgart, Germany, 2017; 780p. [Google Scholar]
  5. Moore, T.R.; Bubier, J.L.; Bledzki, L. Litter decomposition in temperate peatland ecosystems. The effect of substrate and site. Ecosystems 2007, 10, 949–963. [Google Scholar] [CrossRef]
  6. Vompersky, S.E. Biogeocenotic Features of Swamps and Their Rational Use; Nauka: Moscow, Russia, 1994; pp. 5–37. [Google Scholar]
  7. Kosykh, N.P.; Koronatova, N.G.; Naumova, N.B.; Titlyanova, A.A. Above- and below-ground phytomass and net primary production in boreal mire ecosystems Western Sibiria. Wetl. Ecol. Manag. 2008, 16, 139–153. [Google Scholar] [CrossRef]
  8. Kosykh, N.P.; Mironycheva-Tokareva, N.P.; Peregon, A.M.; Parshina, E.K. Biological productivity of bogs in the middle taiga subzone of Western Siberia. Russ. J. Ecol. 2008, 39, 8–16. [Google Scholar] [CrossRef]
  9. Zhong, Y.; Jiang, M.; Middleton, B.A. Effects of water level alteration on carbon cycling in peatlands. Ecosyst. Health Sustain. 2020, 6, 1806113. [Google Scholar] [CrossRef]
  10. Serk, H.; Nilsson, M.B.; Figueira, J.; Wieloch, T.; Schleucher, J. CO2 fertilization of Sphagnum peat mosses is modulated by water table level and other environmental factors. Plant Cell Environ. 2021, 44, 1756–1768. [Google Scholar] [CrossRef]
  11. Titlyanova, A.A.; Bazilevich, N.I.; Snytko, V.A.; Dubynina, S.S.; Kopoteva, T.A.; Magomedova, L.N.; Mironycheva-Tokareva, N.P.; Nefedyeva, L.G.; Titlyanova, A.A.; Vishnyakova, E.K. Changes in the productivity of wetland and grass ecosystems along the latitudinal gradient. Soils Environ. 2022, 5, 32–50. [Google Scholar]
  12. Joosten, H. The Global Peatland CO2 Picture: Peatland Status and Drainage Related Emissions in All Countries of the World; Wetland International: Ede, The Netherlands, 2010. [Google Scholar]
  13. Leifeld, J.; Menichetti, L. The underappreciated potential of peatlands in global climate change mitigation strategies. Nat. Commun. 2018, 9, 1071. [Google Scholar] [CrossRef]
  14. Joosten, H. Peatlands across the globe. In Peatland Restoration and Ecosystem Services. Science, Policy and Practice; Joosten, H., Ed.; Cambridge University Press: Cambridge, UK, 2016; pp. 19–43. [Google Scholar]
  15. Frolking, S.; Talbot, J.; Jones, M.C.; Treat, C.C.; Kauffman, J.B.; Tuittila, E.S.; Roulet, N. Peatlands in the Earth’s 21st century climate system. Environ. Rev. 2011, 19, 371–396. [Google Scholar] [CrossRef]
  16. IPCC. Climate Change 2013: The Physical Science Basis, Contribution of Working Group I to the Fifth Assessment Report of the Intergovernmental Panel on Climate Change; Cambridge University Press: Cambridge, UK; New York, NY, USA, 2013; p. 1535. [Google Scholar]
  17. Leifeld, J. Prologue paper: Soil carbon losses from land-use change and the global agricultural greenhouse gas budget. Sci. Total Environ. 2013, 465, 3–6. [Google Scholar] [CrossRef] [PubMed]
  18. Zak, D.; Gelbrecht, J. The mobilisation of phosphorus, organic carbon and ammonium in the initial stage of fen rewetting (a case study from NE Germany). Biogeochemistry 2007, 85, 141–151. [Google Scholar] [CrossRef]
  19. Tiemeyer, B.; Kahle, P. Nitrogen and dissolved organic carbon (DOC) losses from an artificially drained grassland on organic soils. Biogeosciences 2014, 11, 4123–4137. [Google Scholar] [CrossRef]
  20. Lamers, L.P.M.; Vile, M.A.; Grootjans, A.P.; Acreman, M.C.; van Diggelen, R.; Evans, M.G.; Richardson, C.J.; Rochefort, L.; Kooijman, A.M.; Roelofs, J.G.M.; et al. Ecological restoration of rich fens in Europe and North America: From trial and error to an evidence-based approach. Biol. Rev. Camb. Philos. Soc. 2015, 90, 182–203. [Google Scholar] [CrossRef]
  21. Bonn, A. (Ed.) Peatland Restoration and Ecosystem Services: Science, Policy, and Practice; Cambridge University Press: Cambridge, UK, 2016; 510p. [Google Scholar] [CrossRef]
  22. Günther, A.; Huth, V.; Jurasinski, G.; Glatzel, S. The effect of biomass harvesting on greenhouse gas emissions from a rewetted temperate fen. GCB Bioenergy 2015, 7, 1092–1106. [Google Scholar] [CrossRef]
  23. Tuittila, E.S.; Vasander, H.; Laine, J. Impact of rewetting on the vegetation of a cut-away peatland. Appl. Veg. Sci. 2000, 3, 205–212. [Google Scholar] [CrossRef]
  24. Liu, N.; Li, Y.; Wang, Q.C.; Zhou, R.; Gaffney, P.P.; Liu, M.; Shi, R.; Gao, Z.; Chu, H.; Niu, S.; et al. Restoration recovers plant diversity but changes species composition and biomass allocation in an alpine peatland. Ecol. Process. 2025, 14, 24. [Google Scholar] [CrossRef]
  25. Malloy, S.; Price, J.S. Fen restoration on a bog harvested down to sedge peat: A hydrological assessment. Ecol. Eng. 2014, 64, 151–160. [Google Scholar] [CrossRef]
  26. Evans, C.D.; Peacock, M.; Baird, A.J.; Evans, C.D.; Peacock, M.; Baird, A.J.; Artz, R.R.E.; Burden, A.; Callaghan, N.; Chapman, P.J.; et al. Morrison5Overriding water table control on managed peatland greenhouse gas emissions. Nature 2021, 593, 548–552. [Google Scholar] [CrossRef]
  27. Günther, A.; Barthelmes, A.; Huth, V.; Joosten, H.; Jurasinski, G.; Koebsch, F.; Couwenberg, J. Prompt rewetting of drained peatlands reduces climate warming despite methane emissions. Nat. Commun. 2020, 11, 1644. [Google Scholar] [CrossRef]
  28. Järveoja, J.; Nilsson, M.B.; Crill, P.M.; Peichl, M. Bimodal diel pattern in peatland ecosystem respiration rebuts uniform temperature response. Nat. Commun. 2020, 11, 4255. [Google Scholar] [CrossRef]
  29. Peichl, M.; Gažovič, M.; Vermeij, I.; de Goede, E.; Sonnentag, O.; Limpens, J.; Nilsson, M.B. Peatland vegetation composition and phenology drive the seasonal trajectory of maximum gross primary production. Sci. Rep. 2018, 8, 8012. [Google Scholar] [CrossRef]
  30. Schwieger, S.; Kreyling, J.; Peters, B.; Gillert, A.; Freiherr von Lukas, U.; Jurasinski, G.; Köhn, D.; Blume-Werry, G. Rewetting prolongs root growing season in minerotrophic peatlands and mitigates negative drought effects. J. Appl. Ecol. 2022, 59, 2106–2116. [Google Scholar] [CrossRef]
  31. Mursyid, H.; Ramadhan, R.; Irawan, A.; Sadono, R.; Putra, E.T.S.; Suryanto, P. A global development and dynamics of peatland restoration: A bibliometric analysis. Ecol. Indic. 2025, 177, 113724. [Google Scholar] [CrossRef]
  32. Kotowski, W.; Ackreman, M.; Grootjans, A.; Klimkowska, A.; Rößling, H.; Wheeler, B. Restoration of Temperate Fens: Matching Strategies with Site Potential. In Peatland Restoration and Ecosystem Services: Science, Policy and Practice; Bonn, A., Allott, T., Evans, M., Joosten, H., Stoneman, R., Eds.; Cambridge University Press, British Ecological Society: Cambridge, MA, USA, 2016; pp. 170–191. [Google Scholar]
  33. Kreyling, J.; Tanneberger, F.; Jansen, F.; Van Der Linden, S.; Aggenbach, C.; Blüml, V.; Couwenberg, J.; Emsens, W.-J.; Joosten, H.; Klimkowska, A.; et al. Rewetting does not return drained fen peatlands to their old selves. Nat. Commun. 2021, 12, 5693. [Google Scholar] [CrossRef]
  34. Kotowski, W.; Thörig, W.; van Diggelen, R.; Wassen, M.J. Competition as a factor structuring species zonation in riparian fens—A transplantation experiment. Appl. Veg. Sci. 2006, 9, 231–240. [Google Scholar] [CrossRef]
  35. Minayeva, T.; Sirin, A.; Bragg, O. A Quick Scan of Peatlands in Central and Eastern Europe; Wetlands International: Wageningen, The Netherlands, 2009; p. 132. [Google Scholar]
  36. Sirin, A.A. Peatbogs and anthopogenically modified peatlands: Carbon, greenhouse gases and climate change. Uspekhi Sovrem. Biol. 2022, 142, 560–577. [Google Scholar] [CrossRef]
  37. Ilyasov, D.V.; Sirin, A.A.; Suvorov, G.G.; Meteleva, M.M.; Markina, A.V. Restoration of forest–steppe degrading peatlands and their ecosystem functions. Aktual. Napravleniya Nauchnykh Issled. XXI Veka Teor. I Prakt. 2017, 5, 400–406. [Google Scholar]
  38. Minayeva, T.; Sirin, A.; Stracher, G. The Peat Fires of Russia. In Coal and Peat Fires: A Global Perspective; Stracher, G., Ed.; Elsevier B.V.: Amsterdam, The Netherlands, 2013; pp. 376–394. [Google Scholar]
  39. Sirin, A.A.; Medvedeva, M.A.; Itkin, V.Y. Rewetting of disused drained peatlands and reduction of greenhouse gas emissions. Bull. Russ. Acad. Sciences. Geogr. Ser. 2023, 87, 597–618. [Google Scholar] [CrossRef]
  40. Mirkin, B.M.; Martynenko, V.B. (Eds.) Natural Conditions and Biota of the Asly-Kul Nature Park; Bashkir encyclopedia: Ufa, Russia, 2018; 456p. [Google Scholar]
  41. Kadilnikov, I.P. (Ed.) Physical and Geographical Zoning of the Bashkir ASSR; Bashkir State University: Ufa, Russia, 1964; 210p. [Google Scholar]
  42. Gabbasova, I.M.; Suleymanov, R.R.; Garipov, T.T.; Komissarov, M.A.; Suleymanov, A.R. Changes in soil properties under drainage and secondary watering of the steppe zone, Southern Ural Region. Arid Ecosys. 2024, 30, 91–99. [Google Scholar]
  43. Yamalov, S.M.; Martynenko, V.B.; Abramova, L.M.; Golub, V.B.; Baisheva, E.Z.; Bayanov, A.V. Prodromus of Plant Communities of the Republic of Bashkortostan: Preprint; Gilem: Ufa, Russia, 2012; 83p. [Google Scholar]
  44. Hennekens, S.M.; Schaminée, J.H.J. TURBOVEG, a comprehensive data base management system for vegetation data. J. Veg. Sci. 2001, 12, 589–591. [Google Scholar] [CrossRef]
  45. Tichý, L.; Holt, J.; Nejezchlebová, M. Program for Management, Analysis and Classification of Ecological Data; Masaryk University: Brno, Czech Republic, 2011; 61p. [Google Scholar]
  46. Westhoff, V.; van der Maarel, E. The Braun-Blanquet approach. In Classification of Plant Communities; Whittaker, R.H., Ed.; Dr. W. Junk Publishers: Hague, The Netherlands, 1978. [Google Scholar]
  47. Mirkin, B.M.; Solomeshch, A.I.; Zhuravleva, S.E. Vegetation of Russia in the area of the syntaxonomy of Braun-Blanquet: Development and results. Zhurnal Obs. Biol. 2000, 1, 5–21. [Google Scholar]
  48. Braun-Blanquet, J. Pflanzensoziologie. Grundzüge der Vegetationskunde; Springer: Wien, Austria; New York, NY, USA, 1964; 631p. [Google Scholar]
  49. Conrad, O.; Bechtel, B.; Bock, M.; Dietrich, H.; Fischer, E.; Gerlitz, L.; Wehberg, J.; Wichmann, V.; Böhner, J. System for Automated Geoscientific Analyses (SAGA) v. 2.1.4. Geosci. Model Dev. 2015, 8, 1991–2007. [Google Scholar] [CrossRef]
  50. Golovatskaya, E.A. Biological productivity of oligotrophic and eutrophic mires in the southern taiga of Western Siberia. J. Sib. Fed. Univ. Ser. Biol. 2009, 2, 38–53. [Google Scholar]
  51. Khaziev, F.K.; Mukatanov, A.K. Rational Use of Drained Lands; Bashkirskoye Knizhnoye Izdatel’stvo: Ufa, Russia, 1985; 104p. [Google Scholar]
  52. Komissarov, A.V.; Kovshov, Y.A.; Ishbulatov, M.G. Monitoring of reclaimed lands in the Republic of Bashkortostan. Land Manag. Cadastre Land Monit. 2011, 10, 56–61. [Google Scholar]
  53. Baisheva, E.Z.; Shirokih, P.S.; Martynenko, V.B.; Bikbaev, I.G. On the results of inventarisation of anthropogenically modified peatlands in the Bashkir Cis-Urals. Bull. Ufa Sci. Cent. Russ. Acad. Sci. 2022, 3, 55–61. [Google Scholar] [CrossRef]
  54. Karpov, D.N.; Yuritsyna, N.A. Vegetation of Saline Soils of the Southern Urals and Adjacent Territories; Institute of Ecology of the Volga Basin of the RAS: Tolyatti, Russia, 2006; 124p. [Google Scholar]
  55. Ilyasov, D.V.; Sirin, A.A.; Suvorov, G.G.; Meteleva, M.M.; Maslov, A.A.; Muldashev, A.A.; Shirokikh, P.S.; Bikbaev, I.G.; Martynenko, V.B. Soils and vegetation of anthropogenic changed steppe peatland (Berkazan-Kamysh, Bashkiriya). Agrochemistry 2018, 12, 46–59. [Google Scholar] [CrossRef]
  56. Ilyasov, D.V.; Sirin, A.A.; Suvorov, G.G.; Martynenko, V.B. The summer carbon dioxide and methane fluxes on drained peatland in forest–steppe of Bashkortostan. Agrochemistry 2017, 1, 50–62. [Google Scholar]
  57. Suvorov, G.G.; Chistotin, M.V.; Sirin, A.A. The carbon losses from a drained peatland in Moscow oblast used for peat extraction and agriculture. Agrochemistry 2015, 11, 51–62. [Google Scholar]
  58. Tsvelev, N.N. (Ed.) Flora of Eastern Europe; Publishing House of SPHFA: St. Petersburg, Russia, 2001; 670p. [Google Scholar]
  59. van den Berg, M.; Gremmen, T.M.; Vroom, R.J.E.; van Huissteden, J.; Boonman, J.; van Huissteden, C.J.A.; van der Velde, Y.; Smolders, A.J.P.; van de Riet, B.P. A case study on topsoil removal and rewetting for paludiculture: Effect on biogeochemistry and greenhouse gas emissions from Typha latifolia, Typha angustifolia, and Azolla filiculoides. Biogeosciences 2024, 21, 2669–2690. [Google Scholar] [CrossRef]
  60. Baur, P.A.; Maier, A.; Buchsteiner, C.; Zechmeister, T.; Glatzel, S. Consequences of intense drought on CO2 and CH4 fluxes of the reed ecosystem at Lake Neusiedl. Environ. Res. 2024, 262, 119907. [Google Scholar] [CrossRef] [PubMed]
  61. Cui, J.; Zhang, M.; Chen, L.; Zhang, S.; Luo, Y.; Cao, W.; Zhao, J.; Wang, L.; Jia, Z.; Bao, Z. Methanotrophs contribute to nitrogen fixation in emergent macrophytes. Front. Microbial. 2022, 13, 851424. [Google Scholar] [CrossRef] [PubMed]
  62. Fauβer, A.C.; Hoppert, M.; Walther, P. Roots of the wetland plants Typha latifolia and Phragmites australis are inhabited by methanotrophic bacteria in biofilms. Flora-Morphology, Distribution. Funct. Ecol. Plants 2012, 207, 775–782. [Google Scholar] [CrossRef]
  63. Laanbroek, H.J. Methane emission from natural wetlands: Interplay between emergent macrophytes and soil microbial processes. A mini-review. Ann. Bot. 2010, 105, 141–153. [Google Scholar] [CrossRef] [PubMed]
  64. Bazilevich, N.I. Biological Productivity of the Ecosystems of Northern Eurasia; Nauka: Moskow, Russia, 1993; 293p. [Google Scholar]
  65. Titlyanova, A.A. Net primary production of grass and marsh ecosystems. Sib. Ecol. J. 2007, 5, 763–770. [Google Scholar]
  66. Kosykh, N.P. Biological productivity of bog in forest–steppe. Vestn. Tomsk. Gos. Pedagog. Univ. 2009, 3, 87–90. [Google Scholar]
  67. Titlyanova, A.A.; Bazilevich, N.I.; Shmakova, E.I.; Snytko, V.A.; Dubynina, S.S.; Magomedova, L.N.; Nefedeva, L.G.; Semenyuk, N.V.; Tishkov, A.A.; Tran, T.; et al. Biological Productivity of Grasslands. Geographical Regularities and Ecological Features, 2nd ed.; revised and supplemented; IPA SB RAS: Novosibirsk, Russia, 2018; 110p. [Google Scholar] [CrossRef]
  68. Borkenhagen, A.; Cooper, D.J.; House, M.; Vitt, D.H. Establishing peat-forming plant communities: A comparison of wetland reclamation methods in A lberta’s oil sands region. Ecol. Appl. 2024, 34, e2929. [Google Scholar] [CrossRef]
  69. Zubkova, K.A.; Gonina, E.S.; Shikhova, L.N.; Lisitsyn, E.M. Analysis of climatic stages of swamp formation based on the botanical composition of peat. Vestn. Orenb. Gos. Univ. 2016, 193, 57–64. [Google Scholar]
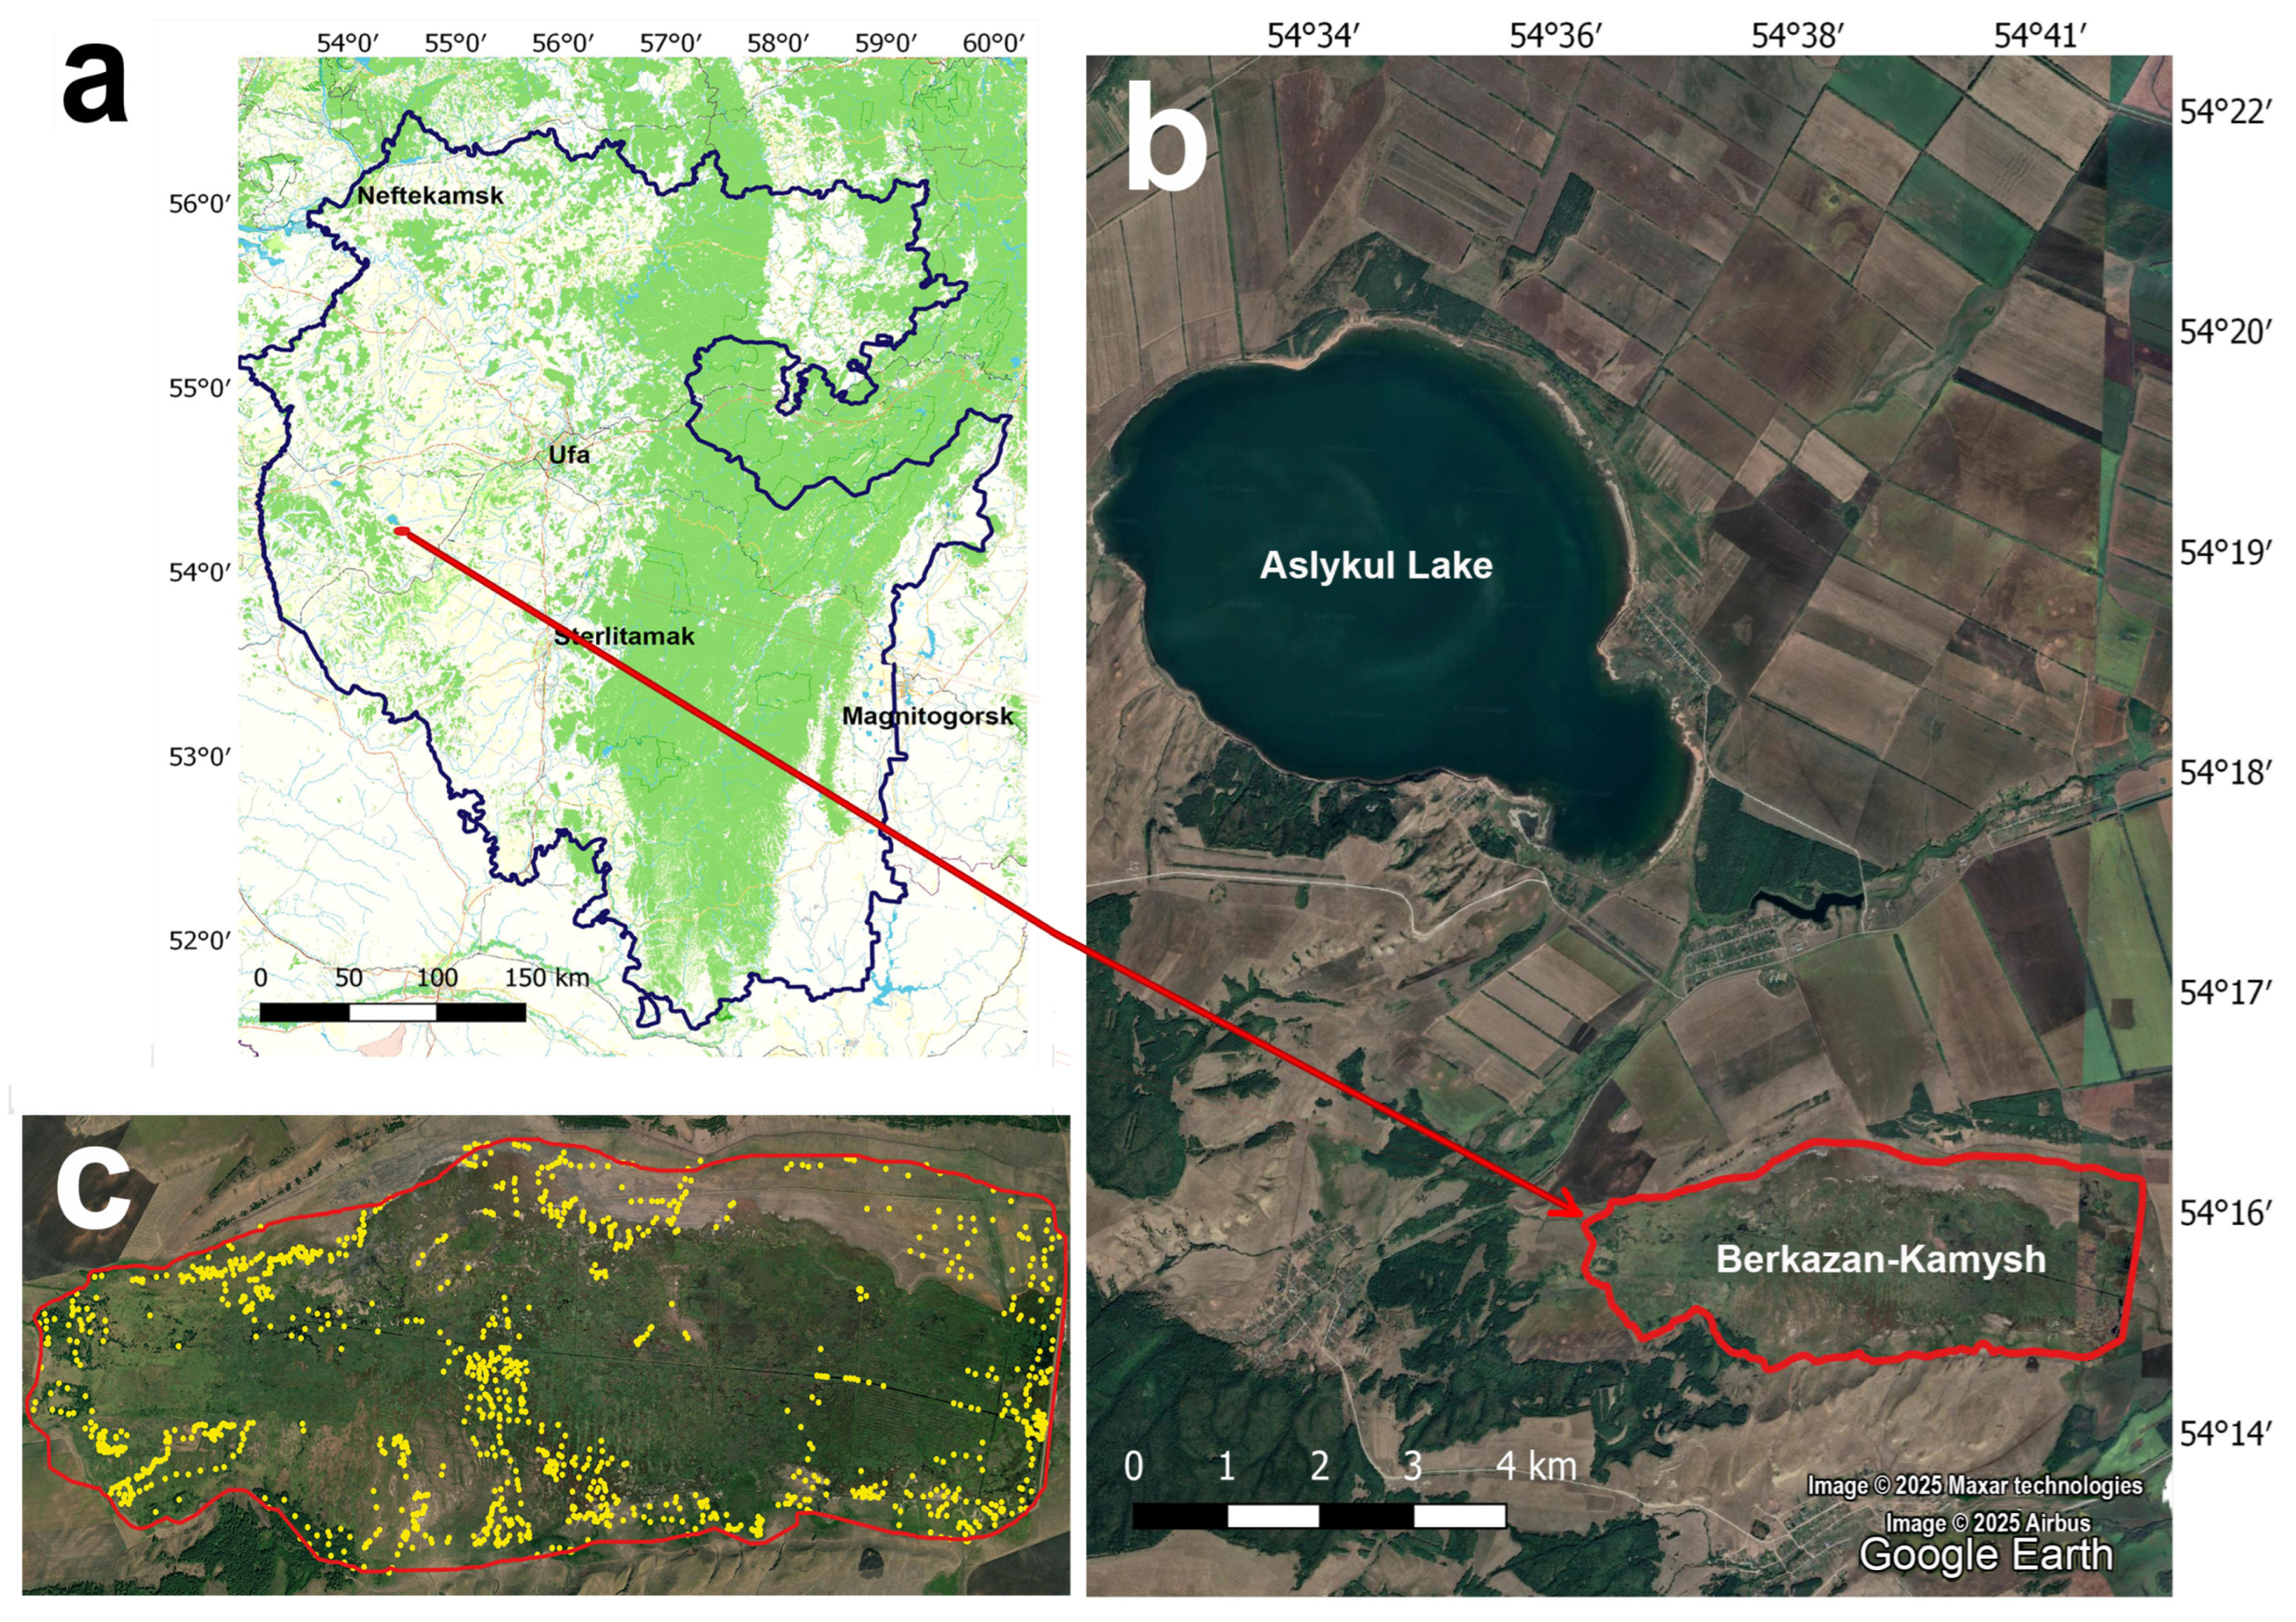
Figure 1. The Berkazan-Kamysh peatland: (a) location of the study area in the Republic of Bashkortostan; (b) location of the Berkazan-Kamysh peatland (boundary is marked in red); (c) location of georeferenced points selected for mapping (marked in yellow).
Land 14 01729 g001
Figure 2. Hydrography scheme of the Berkazan-Kamysh peatland. The following elements of the drainage network are marked: 1 (blue line)—main channel, 2 (green lines)—transport channels, 3 (yellow lines)—upland-catching channels, 4 (light blue thin lines)—drainage channels, 5 (black line)—dam, 6 (white circle)—installation of automatic spillway, 7 (red line)—peatland boundary, 8 (pink circles)—springs. Yellow arrows show the direction of water flow.
Land 14 01729 g002
Figure 3. Investigated plant communities: (a)—salt-marsh communities; (b)—wet meadows with Calamagrostis epigeios; (c)—Festuca regeliana-forb meadows; (d)—Festuca regeliana + Hordeum nevskianum wet meadows, var. typicum; (e)—sedge communities with Carex acuta; (f)—common reed communities with Phragmites australis; (g)—tuber-reed communities with Bolboschoenus maritimus; (h)—cattail communities with Typha angustifolia.
Land 14 01729 g003
Figure 4. Different types of plant communities and sites with open water in the Berkazan-Kamysh peatland: 1 (Figure 3a)—salt-marsh communities; 2 (Figure 3b)—wet meadows with Calamagrostis epigeios; 3 (Figure 3c)—Festuca regeliana-forb meadows; 4 (Figure 3d)—Festuca regeliana + Hordeum nevskianum wet meadows, var. typicum; 5 (Figure 3e)—sedge communities with Carex acuta; 6 (Figure 3f)—common reed communities with Phragmites australis; 7 (Figure 3g)—tuber-reed communities with Bolboschoenus maritimus; 8 (Figure 3h)—cattail communities with Typha angustifolia; 9—Festuca regeliana + Hordeum nevskianum meadows, var. Artemisia austriaca; 10—complex type of woody-shrub vegetation; 11—open water.
Land 14 01729 g004
Figure 5. Distribution of the main types of plant communities in the Berkazan-Kamysh peatland: (a)—before rewetting [55,56] and (b)—after rewetting: 1—saline meadows (after rewetting: Festuca regeliana + Hordeum nevskianum wet meadows, Festuca regeliana + Hordeum nevskianum + Artemisia austriaca wet meadows, salt-marsh communities), 2—hydrophilic reed–sedge communities with tuber-reeds (after rewetting: tuber-reed communities with Bolboschoenus maritimus, sedge communities with Carex acuta), 3—slightly saline wet meadows (after rewetting: wet meadows with Calamagrostis epigeios, Festuca regeliana-forb meadows), 4—reed–cattail communities (after rewetting: common reed communities and cattail communities).
Land 14 01729 g005
Table 1. The stocks of aboveground and root phytomass in different types of plant communities on the Berkazan-Kamysh peatland.
Plant Matter FractionsTypes of Plant Community
12345678
Average stock of plant biomass, g m−2
Live aboveground phytomass103.2 ± 10.6415.9 ± 41.0869.8 ± 90.0278.6 ± 14.1515.9 ± 31.91101.6 ± 81.0734.6 ± 32.21238.9 ± 94.7
Mortmass0 ± 0324.2 ± 42.9416.2 ± 43.6167.5 ± 19.2391.1 ± 43.8265.9 ± 20.50 ± 00 ± 0
Root phytomass 346.9 ± 59.6881.9 ± 113.0530.0 ± 68.4933.9 ± 88.71041.2 ± 174.41039.8 ± 83.41299.7 ± 239.80 ± 0
Average stock of plant biomass 450.1 ± 59.31621.9 ± 104.41816.0 ± 118.91380.1 ± 97.11948.2 ± 181.92407.2 ± 82.72034.3 ± 244.31238.9 ± 94.7
Total stock of plant biomass calculated taking into account the areas occupied by different types of plant communities in the Berkazan-Kamysh peatland, t
Live aboveground phytomass 34.37437.52243.55502.12184.174611.12958.64287.42
Mortmass 0 ± 0341.01116.52301.85139.621113.180 ± 00 ± 0
Root phytomass 115.51927.72148.391682.89371.724352.431696.150 ± 0
Total stock of plant biomass149.881706.25508.472486.86695.5110076.732654.79287.42
Note. Types of plant communities: 1—salt-marsh communities, 2—wet meadows with Calamagrostis epigeios, 3—Festuca regeliana-forb meadows, 4—Festuca regeliana + Hordeum nevskianum wet meadows; 5—sedge communities with Carex acuta, 6—common reed communities with Phragmites australis, 7—tuber-reed communities with Bolboschoenus maritimus, 8—cattail communities with Typha angustifolia.
Table 2. The carbon content in plant matter and stock of the plant biomass in different types of plant communities in the Berkazan-Kamysh peatland.
Plant Matter FractionsTypes of Plant Community
12345678
Carbon content, %
Live aboveground phytomass29.7 ± 1.241.6 ± 0.242.7 ± 0.440.8 ± 0.242.7 ± 0.242.7 ± 0.142.7 ± 0.242.3 ± 0.4
Mortmass37.1 ± 1.042.5 ± 0.338.3 ± 0.535.0 ± 1.339.9 ± 0.5
Root phytomass30.8 ± 1.040.9 ± 0.640.2 ± 0.735.0 ± 0.734.9 ± 1.339.6 ± 0.837.8 ± 0.8
Carbon stock, g m−2
Live aboveground phytomass30.6 ± 3.2172.9 ± 16.8371.1 ± 37.1114.4 ± 6.0219.8 ± 13.3469.6 ± 34.3313.6 ± 13.9525.3 ± 41.6
Mortmass125.3 ± 18.6176.1 ± 17.863.3 ± 6.9136.8 ± 16.7106.5 ± 8.8
Root phytomass108.6 ± 20.3355.0 ± 44.2211.6 ± 27.5325.8 ± 31.6368.3 ± 63.2413.6 ± 34.3491.7 ± 93.3
Total stock of plant biomass139.2 ± 20.6653.2 ± 42.1758.8 ± 47.9503.5 ± 35.6724.9 ± 64.5989.6 ± 35.4805.2 ± 95.0525.3 ± 41.6
Total carbon stock in plant matter calculated taking into account the areas occupied by different plant communities in the Berkazan-Kamysh peatland, t
Live aboveground phytomass10.18181.87103.90206.1278.461965.76409.19121.87
Mortmass131.8649.31114.0548.85445.74
Root phytomass36.17373.4759.26587.08131.481731.17641.65
Total stock of plant biomass46.35687.21212.47907.26258.804142.661050.84121.87
Note. Types of plant communities: 1—salt-marsh communities, 2—wet meadows with Calamagrostis epigeios, 3—Festuca regeliana-forb meadows, 4—Festuca regeliana + Hordeum nevskianum wet meadows; 5—sedge communities with Carex acuta, 6—common reed communities with Phragmites australis, 7—tuber-reed communities with Bolboschoenus maritimus, 8—cattail communities with Typha angustifolia.
Table 3. Plant communities of the Berkazan-Kamysh peatland before and 7 years after the start of rewetting.
Types of Plant Community
Before RewettingAfter Rewetting
saline meadows Festuca regeliana + Hordeum nevskianum wet meadows (var. typicum, var. Artemisia austriaca), salt-marsh communities
reed–sedge communities with tuber-reedstuber-reed communities with Bolboschoenus maritimus, sedge communities with Carex acuta
slightly saline wet meadows wet meadows with Calamagrostis epigeios, Festuca regeliana-forb meadows
reed–cattail communitiesreed communities with Phragmites australis and cattail communities with Typha angustifolia
Table 4. Areas occupied by different types of plant communities before and after rewetting in the Berkazan-Kamysh peatland.
Types of Plant CommunityBefore Rewetting
(2017)
After Rewetting
(2024)
Area, haShare of Total Peatland Area, %Area, haShare of Total Peatland Area, %
Mesophytic plant communities
saline meadows + salt-marsh communities68266242.924.1
slightly saline wet meadows 12612156.015.5
Hygrophytic and hydrophytic plant communities
reed–sedge communities with tuber-reeds18018166.216.5
reed–cattail communities384441.843.9
Total area10261001006.9100
Disclaimer/Publisher’s Note: The statements, opinions and data contained in all publications are solely those of the individual author(s) and contributor(s) and not of MDPI and/or the editor(s). MDPI and/or the editor(s) disclaim responsibility for any injury to people or property resulting from any ideas, methods, instructions or products referred to in the content.