Article

Assessing Spatiotemporal Changes and Drivers of Ecological Quality in Youjiang River Valley Using RSEI and Random Forest

1
National Disaster Reduction Center of China, Ministry of Emergency Management, Beijing 100124, China
2
Technical Innovation Center of Mine Geological Environmental Restoration Engineering in Southern Karst Area, Ministry of Natural Resources, Nanning 530028, China
3
Land Consolidation and Rehabilitation Center, Ministry of Natural Resources, Beijing 100035, China
4
Science and Technology Innovation Bureau, State-Owned Assets Supervision and Administration Commission of the State Council, Beijing 100053, China
5
National Geological Library of China, Beijing 100083, China
6
School of Architecture, Tsinghua University, Beijing 100084, China
7
Beijing Municipal Institute of City Planning and Design, Beijing 100045, China
8
Natural Resources Ecological Restoration Center of Guangxi Zhuang Autonomous Region, Nanning 530028, China
*
Authors to whom correspondence should be addressed.
These authors contributed equally to this work.
Land 2025, 14(9), 1708; https://doi.org/10.3390/land14091708
Submission received: 6 July 2025 / Revised: 16 August 2025 / Accepted: 22 August 2025 / Published: 23 August 2025

Abstract

Assessing ecological quality in mining areas is critical for environmental protection and sustainable resource management. However, most previous studies concentrate on large-scale analysis, overlooking fine-scale assessment in mining areas. To address this issue, this study proposed a novel analysis framework for mining areas by integrating high-resolution Landsat data, the Remote Sensing Ecological Index (RSEI), and the Random Forest regression method. Based on the framework, four decades of spatiotemporal dynamics and drivers of ecological quality were revealed in Youjiang River Valley. Results showed that from 1986 to 2024, ecological quality in Youjiang River Valley exhibited a fluctuating upward trend (slope = 0.004/year), with notable improvement concentrated in the most recent decade. Spatially, areas with a significant increasing trend in RSEI (48.71%) were mainly located in natural vegetation regions, whereas areas with a significant decreasing trend (9.11%) were concentrated in impervious surfaces and croplands in northern and central regions. Driver analysis indicates that anthropogenic factors played a crucial role in ecological quality changes. Specifically, land use intensity, precipitation, and sunshine duration were main determinants. These findings offer a comprehensive understanding of ecological quality evolution in subtropical karst mining areas and provide crucial insights for conservation and restoration efforts in Youjiang River Valley.

1. Introduction

Ecological quality, which reflects ecosystem health and functionality, is critical for achieving sustainability goals [1]. In recent years, the global ecological environment has been subjected to mounting pressures due to ongoing climate change, population growth, and rapid economic development, leading to land degradation, frequent natural disasters, and loss of ecosystem services [2,3,4,5]. Comprehensive assessment of ecological quality plays a crucial role in understanding the current status and development trends of the ecological environment, and in identifying the scope and extent of ecological degradation [6,7]. Furthermore, investigation of drivers behind ecological quality changes helps elucidate underlying driving mechanisms, providing theoretical guidance and decision-making support for ecological conservation and restoration [8].
As remote sensing technology advances, ecological quality assessment emerges as a research hotspot. Due to its characteristics, including extensive spatial coverage, high temporal frequency, and rapid data acquisition, remote sensing facilitates large-scale, dynamic, and cost-effective monitoring of ecological quality [9]. Earlier studies relied on single remote sensing indicators to characterize ecological quality [10]. However, single indicators are inadequate for comprehensively reflecting ecological conditions. To solve the problem, composite ecological quality indices have been developed. The Chinese Ministry of Ecology and Environment (MEE) [11] designed the Ecosystem Quality Index (EQI), which combines indicators of function, stability, and pressure to evaluate the quality of vegetation ecosystems. Nevertheless, the calculation of EQI requires not only remote sensing data but also ground survey data, resulting in high demands for data acquisition. In contrast, Xu et al. [12] proposed the Remote Sensing Ecological Index (RSEI), which is directly calculated based on remote sensing data. The RSEI combines multi-dimensional ecological indicators such as heat, dryness, greenness, and moisture. Subsequently, many scholars have worked to improve the RSEI by integrating more ecological indicators and designing new indices, such as the Remote Sensing Ecological Index considering Full Elements (RSEIFE) [13], An improved Remote Sensing Ecological Index (ARSEI) [14], etc. In comparison, RSEI is more widely used and has shown good adaptability to dynamic monitoring of various ecosystems [15,16,17,18]. However, many previous RSEI-based studies exhibit limitations in spatiotemporal resolution. On the one hand, many analyses relied on a limited number of years, which makes it infeasible to capture the continuous change process and susceptible to bias from outlier years [19]. On the other hand, most studies utilized Moderate Resolution Imaging Spectroradiometer (MODIS) data, whose relatively low spatial resolution hinders the fine-scale characterization of local ecological conditions [20]. Therefore, further exploration of more continuous and detailed ecological quality assessments is needed.
Ecological quality responds sensitively to variations in natural and anthropogenic factors [21]. Key natural factors influencing ecological quality include climate, topography, soil, and vegetation. For instance, Bai et al. [22] found that natural factors, particularly climate water deficit, dominated ecological quality changes. Yang et al. [23] identified a close relationship between ecological quality and topographic factors. Tang et al. [14] showed that precipitation and vegetation status were the main drivers of ecological quality changes. Li et al. [24] highlighted the pivotal role of carbon and water cycles in shaping ecological quality patterns. Simultaneously, anthropogenic factors, including socioeconomic development, ecological engineering, and land use intensity (LUI), are also significant factors influencing ecological quality. Li et al. [25] found that landscape fragmentation degrees and drastic land use were primary contributors to spatial variation in ecological quality. Lv et al. [26] identified land use type as the primary anthropogenic influence. Liu et al. [19] revealed the significant impacts of ecological engineering. Several studies suggested that anthropogenic factors have become the leading drivers recently. For example, Zhang et al. [27] reported that the negative effect of urbanization gradually increased. Gong et al. [28] observed that the negative impact of socioeconomic factors, as represented by gross domestic product (GDP), intensified. However, the driving mechanisms underlying the effects of multiple factors on ecological quality have not yet been fully elucidated.
Regarding analysis methods for driving mechanisms of ecological quality, traditional approaches such as correlation and geographically weighted regression have been commonly applied [29]. Nevertheless, such methods typically rely on the assumption of linearity and are sensitive to multicollinearity among explanatory variables. Recently, the Geodetector model was successfully utilized to analyze drivers influencing ecological quality and their interactive effects [30]. Despite its strengths, Geodetector operates as a stratification-based method and cannot provide information on the direction of effects. The introduction of machine learning methods provides a new perspective for quantitatively revealing complex and nonlinear relationships between driving factors and ecological quality [16]. Among these, Random Forest is noted for its minimal data requirements, robustness against overfitting, and capacity to handle high-dimensional data [31,32], which has been successfully applied to the driver analysis of ecological quality changes [24,33,34]. However, Random Forest is often criticized as a “black-box” model due to its limited interpretability [35].
As typical regions subjected to intense human-induced disturbances, mining areas present significant ecological problems. Ecological restoration of mining areas is increasingly regarded as essential for promoting regional sustainable development. The recent progress in mine restoration across China [36,37,38,39] has highlighted the urgent need to evaluate spatiotemporal dynamics of ecological quality in mining areas. However, previous studies on ecological quality have primarily focused on large-scale areas, such as national or basin scales, with relatively little attention paid to mining areas [15,40]. The Youjiang River Valley, located in Guangxi Province, is well known for its abundant mineral resources and has experienced extensive disturbance due to the combined impacts of resource exploitation and ecological restoration efforts [41]. As a representative mining area in the South China Karst region, it offers an ideal case for understanding ecological quality dynamics under compound natural disturbances and anthropogenic interventions. Nevertheless, the spatiotemporal evolution of ecological quality in Youjiang River Valley remains unclear.
To address the above knowledge gaps, this study developed a novel framework for long-term and high-resolution ecological quality assessment in mining areas. By leveraging the full Landsat archive to support RSEI analysis, our approach overcame the limitation of previous studies in terms of spatiotemporal resolution. Additionally, we enhanced the interpretability of Random Forest regression models by integrating Partial Dependence Plots (PDPs) to clarify the marginal effects of drivers. Specifically, this study aims to (1) construct an annual high-resolution RSEI dataset for Yujing River Valley from 1986 to 2024; (2) assess the spatiotemporal patterns and trends of ecological quality in Youjiang River Valley; and (3) investigate the nonlinear relationships between ecological quality and environmental factors. We hypothesize that the observed ecological quality changes exhibit spatiotemporal heterogeneity governed by climate, topography, and anthropogenic factors. This study can provide new insights for detecting and attributing ecological quality changes in subtropical karst mining areas and offer scientific support for ecological conservation and restoration in Yuanjiang River Valley.

2. Materials and Methods

An overview of the framework for ecological quality assessment and analysis is provided in Figure 1. It includes data pre-processing, calculation of RSEI, spatiotemporal analysis, and driver analysis.

2.1. Study Area

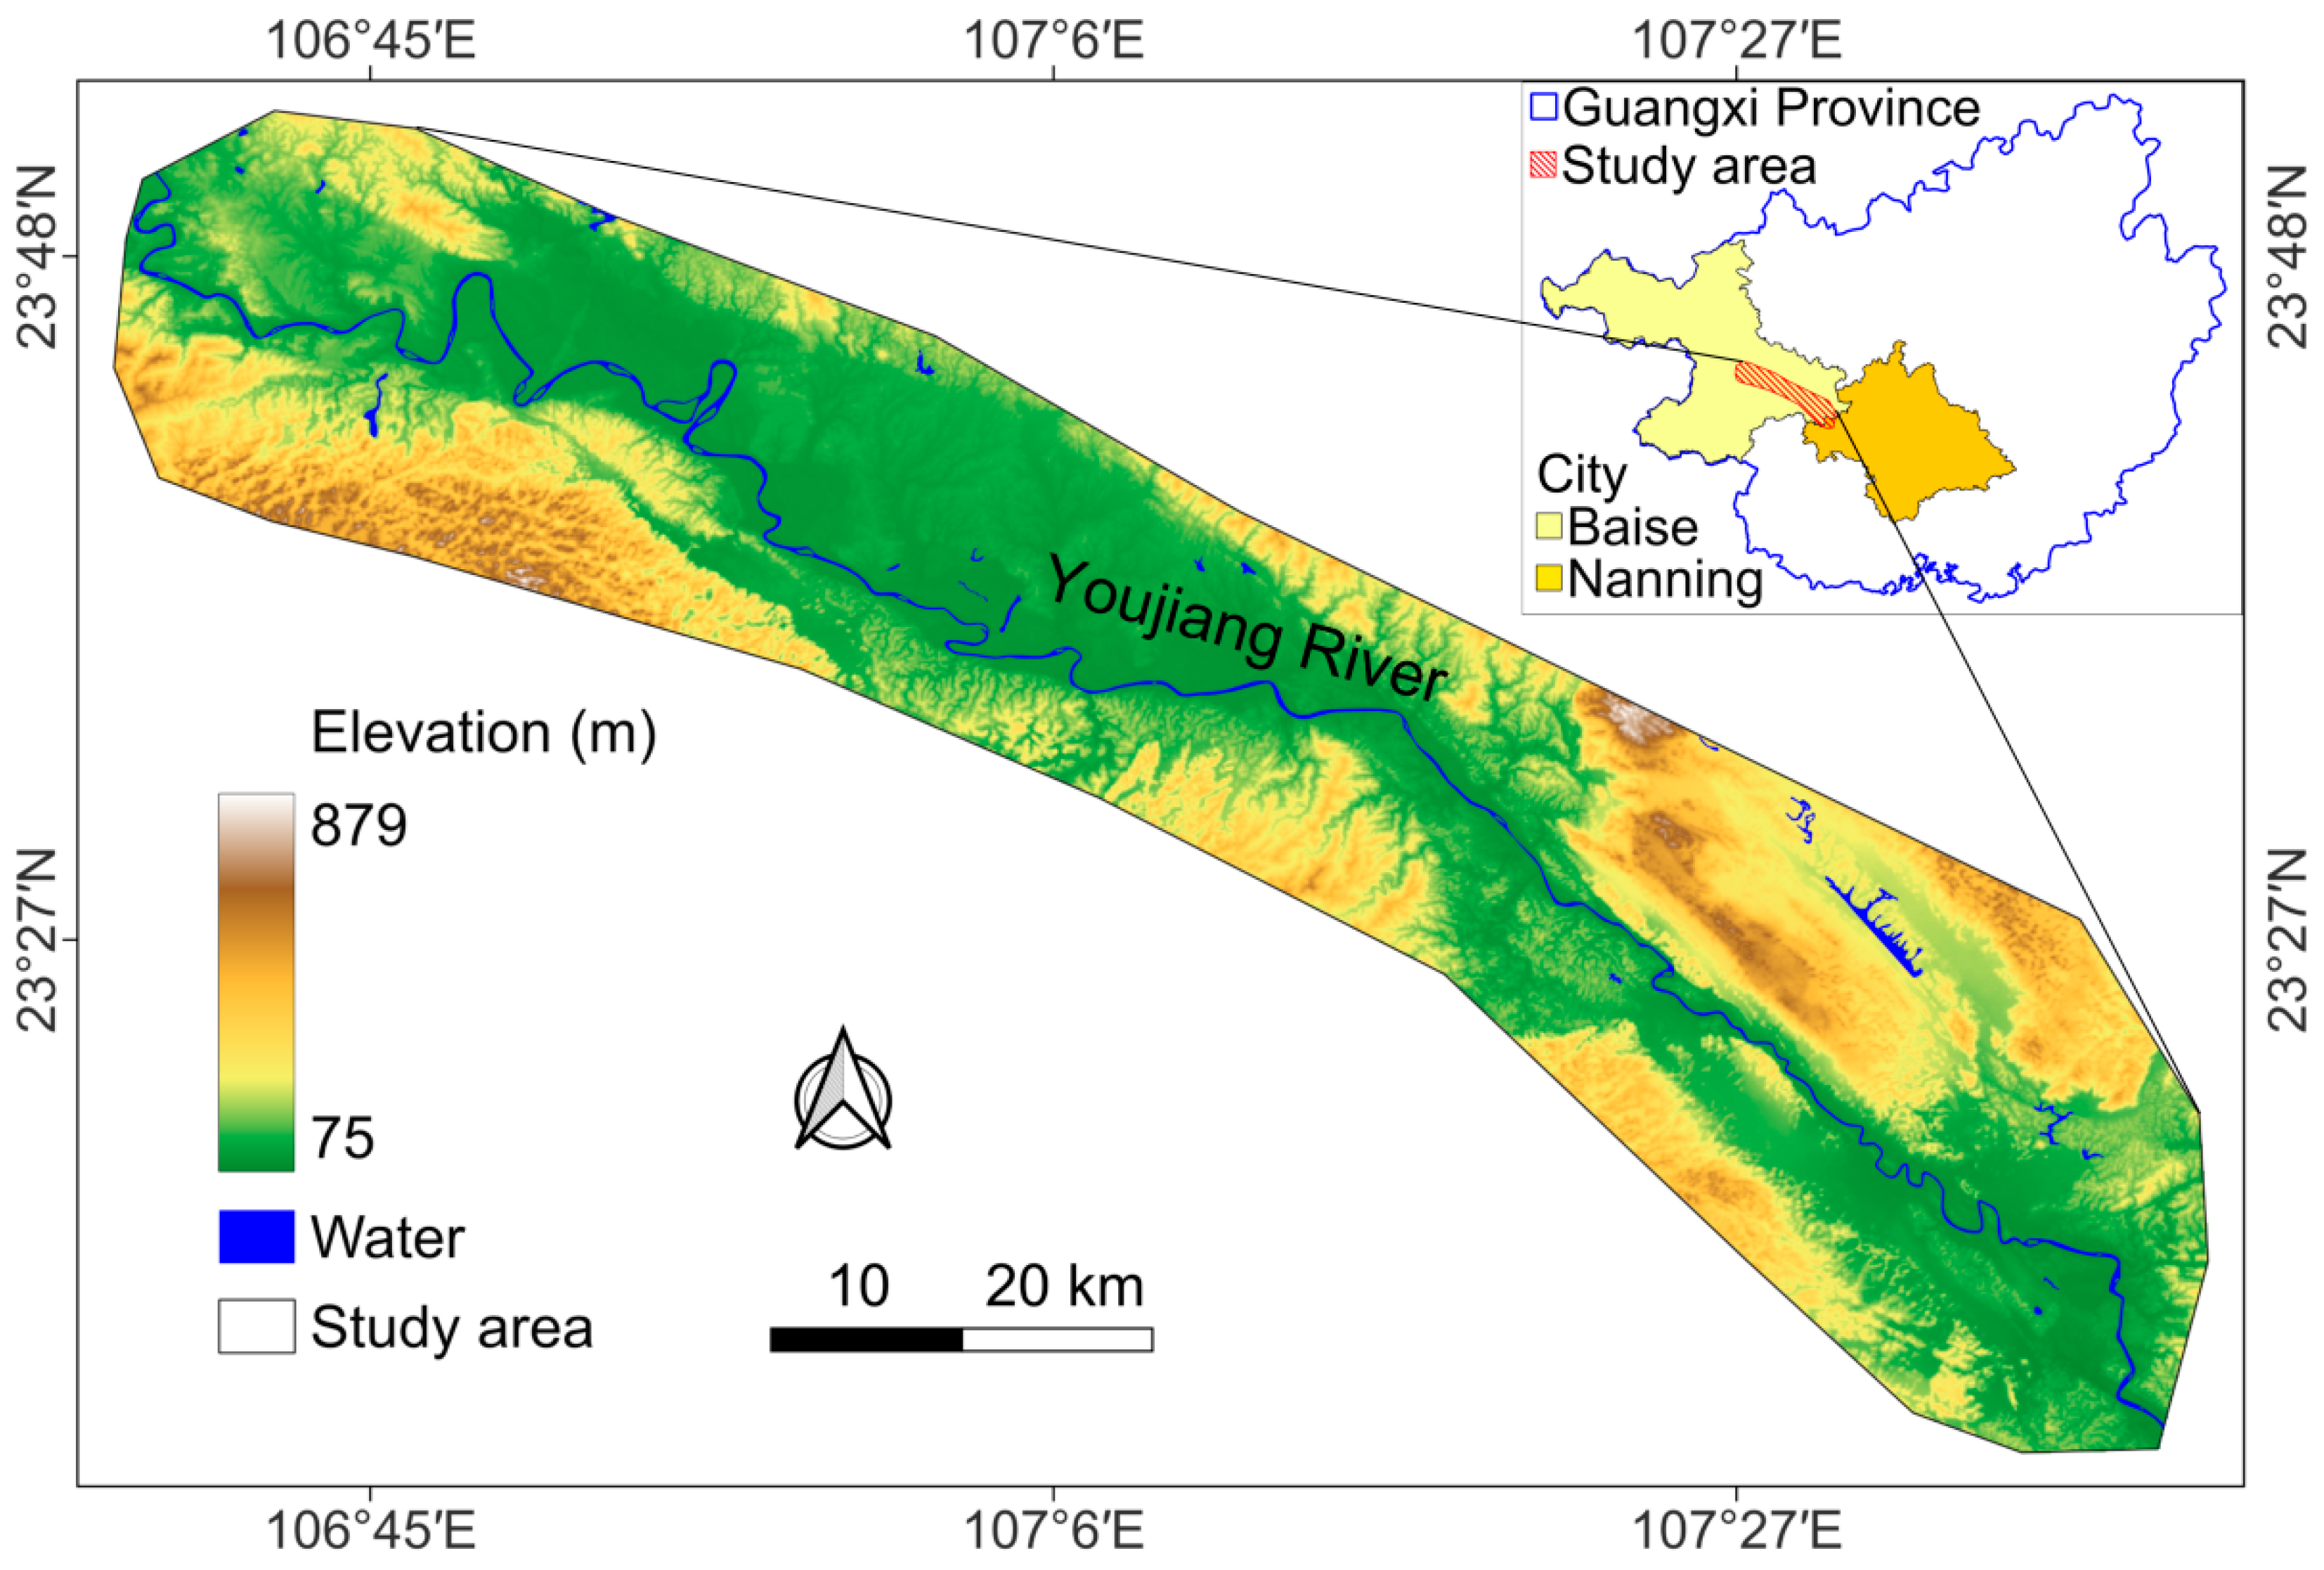
Youjiang River Valley (Figure 2) is situated in the west of Guangxi Province, South China (106°37′ E–107°41′ E and 23°11′ N–23°52′ N). It encompasses Youjiang District, Tianyang District, Tiandong County, Pingguo County in Baise City, and Longan County in Nanning City, covering a total area of approximately 2572 km2. The Youjiang River flows across the study area from northwest to southeast, eventually merging with the Yujiang River. Along both sides of the Youjiang riverbed, landforms such as alluvial plains, terraces, hills, and low mountains or karst peak clusters develop in succession from the riverbanks outward. The terrain exhibits low altitudes in central regions and high altitudes at edges, with an overall elevation range of 75 m to 879 m. Located in the subtropical monsoon climate zone, the study area experiences mean annual temperature (TEM) ranging from 19 °C to 23 °C and mean annual precipitation (PRE) ranging from 1135 mm to 1546 mm [42]. Major land use classes include forest, impervious surface, cropland, water body, grassland, shrubland, and bare land.
Youjiang River Valley is characterized by a wide variety of mineral deposits [44]. The main types of minerals include coal, bauxite, limestone, and manganese. Notable deposits include Pingguo bauxite and Tiandong coal mine [45]. Simultaneously, many abandoned mines are scattered across the area, posing significant ecological issues such as land degradation, geological safety hazard, vegetation destruction, and soil erosion. In 2021, Youjiang River Valley was designated as one of the key regions for ecological restoration of historical legacy mines in Guangxi Province [43]. A major ecological restoration project for abandoned mining areas has been launched, focusing on the bauxite and coal mines in Pingguo County and Tiandong County. The adopted restoration approach emphasizes assisted regeneration and ecological reconstruction, involving terrain reshaping, soil reconstruction, and vegetation recovery to restore the ecological environment.

2.2. Data and Pre-Processing

The 30 m Landsat data, provided by the United States Geological Survey (USGS), was used to calculate the RSEI in this study. The dataset includes Level-2 surface reflectance and land surface temperature (LST) products derived from Landsat 8 Operational Land Imager and Thermal Infrared Sensor, as well as Landsat 5 Thematic Mapper. It spans from 1986 to 2024. Imagery from 2012 was excluded to avoid potential interference caused by data gaps associated with Landsat 7. To minimize the effects of seasonal variation, only images from the growing season (May to October) were used to generate annual median composites. All imagery underwent standard pre-processing procedures, such as terrain correction and atmospheric correction. Terrain correction was conducted via the Geometric Processing Subsystem of the Landsat Product Generation System, using elevation data from the Landsat Collection 2 Digital Elevation Model (DEM) [46]. Atmospheric correction was carried out based on the Land Surface Reflectance Code [47] and Landsat Ecosystem Disturbance Adaptive Processing System [48]. Cloud and cloud shadow masking were performed using the quality assessment information generated by the C Function of Mask (CFMask) algorithm [49]. All image acquisition and processing were conducted on the Google Earth Engine (GEE) cloud computing platform.
To investigate driving factors influencing ecological quality, nine representative variables were selected and categorized as climatic, topographic, or anthropogenic factors. The climatic variables include TEM, PRE, and sunshine duration (SSD). The topographic variables consist of elevation (ELE), slope (SLO), and aspect (ASP). The anthropogenic variables comprise GDP, population density (PD), and LUI. Climatic variables were obtained from a 1 km gridded meteorological dataset for China (1960–2020), provided by the Resource and Environmental Science Data Center (RESDC) [50]. Topographic variables were extracted based on the 30 m Shuttle Radar Topography Mission (SRTM) DEM dataset [51], which was collected by the National Aeronautics and Space Administration (NASA) in 2000; 1 km data on GDP and PD from 1990 to 2020 were offered by RESDC. LUI was calculated based on the 30 m China Land Cover Dataset (CLCD) [52] from 1990 to 2023, developed by Wuhan University. Specifically, LUI [53] was calculated using the following formula:
L U I = m = 1 M W m A m
where M denotes the number of land use classes. W m and A m indicate the weight and area of the m -th land use class at a spatial resolution of 1 km, respectively. Specifically, the weight assigned to impervious surface was 4; cropland was assigned a weight of 3; forest, shrubland, grassland, and water body were each assigned a weight of 2; and bare land was assigned a weight of 1.
Table 1 summarizes information about all datasets used in this study.

2.3. Methodology

2.3.1. Calculation of RSEI

The RSEI was applied to evaluate ecological quality in Youjiang River Valley from 1986 to 2024. The RSEI is a composite index designed to reflect ecological conditions objectively using remote sensing data [54]. It integrates four key ecological indicators, including heat, dryness, greenness, and moisture. Specifically, LST, Normalized Difference Built-up and Soil Index (NDBSI) [54], Normalized Difference Vegetation Index (NDVI) [55], and wetness (WET) [56] were utilized to represent the four indicators. Among them, LST was directly extracted from Landsat data, while the formulas of the other three are as follows:
N D B S I = S R s w i r 1 / ( S R s w i r 1 + S R n i r ) 2 [ S R n i r / ( S R n i r + S R r e d ) + S R g r e e n / ( S R g r e e n + S R s w i r 1 ) ] S R s w i r 1 / ( S R s w i r 1 + S R n i r ) 2 + [ S R n i r / ( S R n i r + S R r e d ) + S R g r e e n / ( S R g r e e n + S R s w i r 1 ) ] 0.5 + ( S R s w i r 1 + S R r e d ) ( S R n i r + S R b l u e ) ( S R s w i r 1 + S R r e d ) + ( S R n i r + S R b l u e ) 0.5
N D V I = S R n i r S R r e d S R n i r + S R r e d
W E T = S R b l u e c 1 + S R g r e e n c 2 + S R r e d c 3 + S R n i r c 4 + S R s w i r 1 c 5 + S R s w i r 2 c 6
where S R b l u e , S R g r e e n , S R r e d , S R n i r , S R s w i r 1 , and S R s w i r 2 represent surface reflectance values for the blue, green, red, near-infrared, shortwave infrared 1, and shortwave infrared 2 bands, respectively. When derived from Landsat 5 data, the values of c 1 , c 2 , c 3 , c 4 , c 5 , and c 6 are 0.0315, 0.2021, 0.3102, 0.1594, −0.6806, and −0.6109, respectively [56]. When derived from Landsat 8 data, the corresponding values are 0.1511, 0.1973, 0.3283, 0.3407, −0.7107, and −0.4559, respectively [57].
To minimize the influence of subjective bias, Principal Component Analysis (PCA) was employed to determine weights of four indicators according to their contribution to total variance. Before PCA, normalization was performed on all four indicators to eliminate effects of value differences. The first principal component (PC1) obtained from PCA was used to calculate the initial RSEI ( R S E I 0 ), and the final RSEI was produced by normalizing R S E I 0 . The RSEI can be expressed as follows [54]:
R S E I = R S E I 0 R S E I 0 _ m i n R S E I 0 _ m a x R S E I 0 _ m i n
R S E I 0 = 1 P C 1 [ f ( L S T , N D B S I , N D V I , W E T ) ]
where R S E I 0 _ m i n and R S E I 0 _ m a x refer to minimum and maximum values of R S E I 0 , respectively. f ( · ) indicates a function.
RSEI ranges from 0 to 1, with higher values indicating better ecological quality. Based on equal interval classification, RSEI was categorized into five levels, including Excellent (0.8–1.0), Good (0.6–0.8), Moderate (0.4–0.6), Fair (0.2–0.4), and Poor (0–0.2). Additionally, to reduce the influence of water on PCA loadings, water bodies were masked based on Modified Normalized Difference Water Index [58].
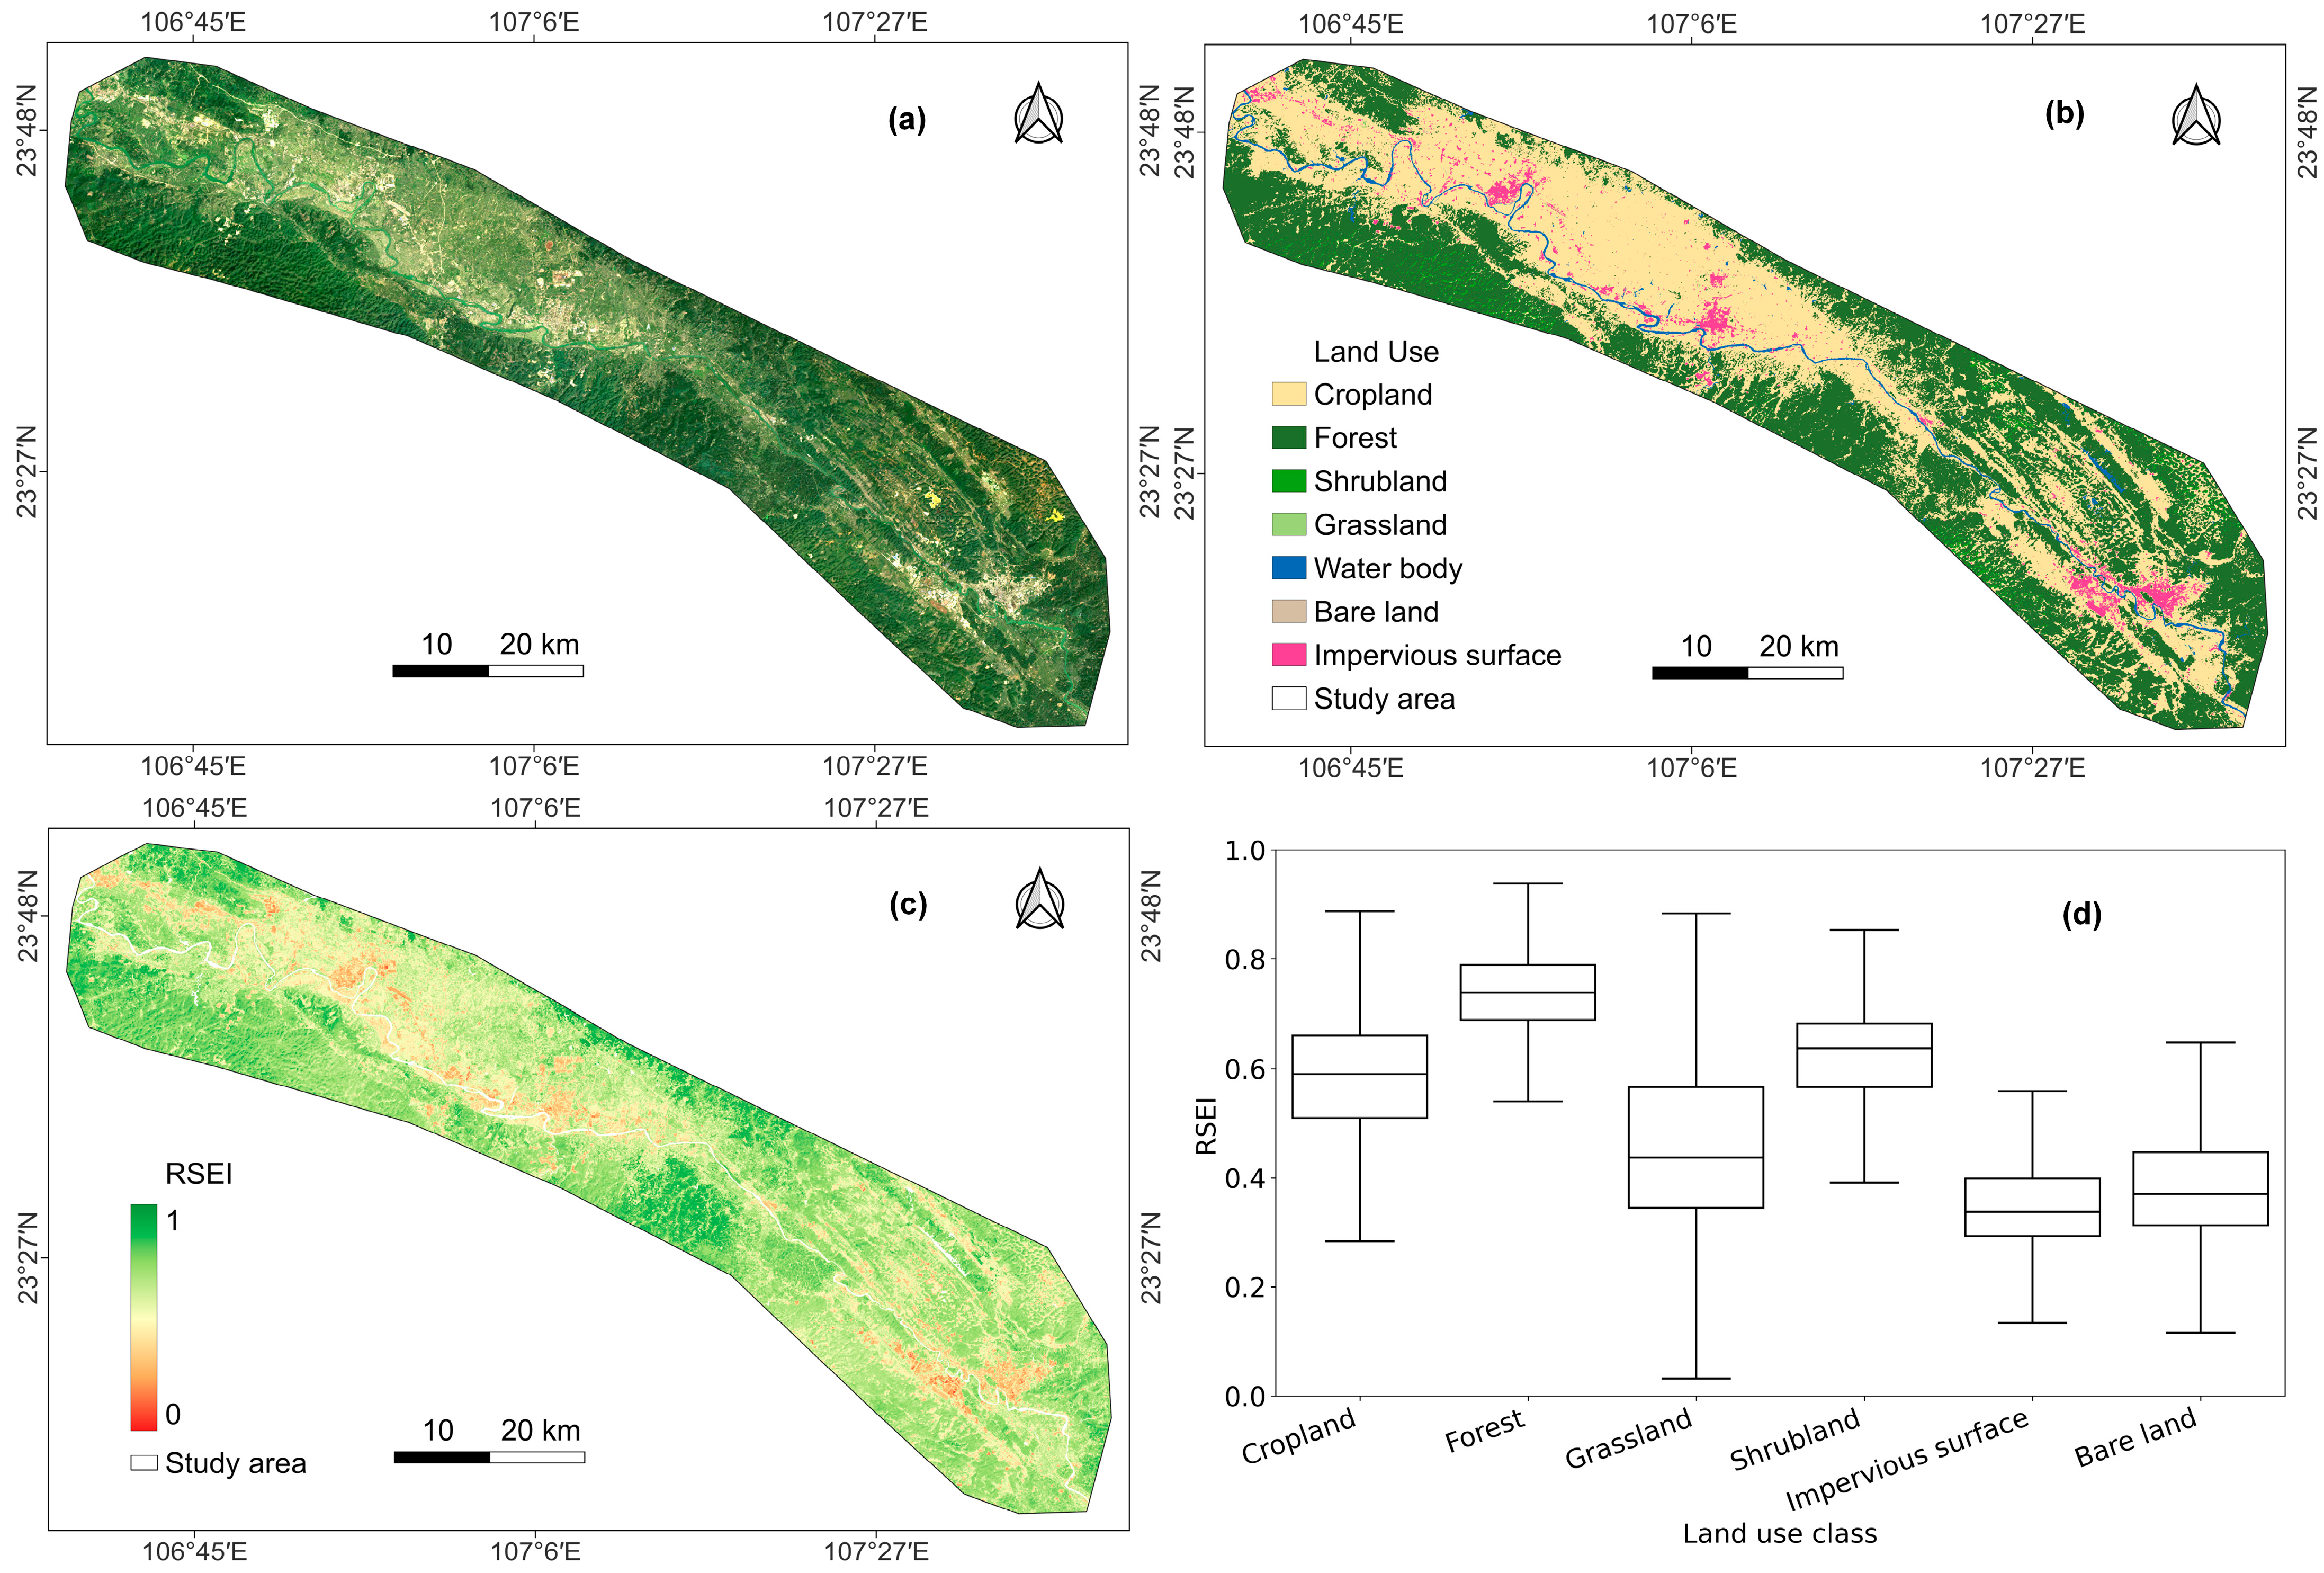
To validate the rationality of the calculated RSEI, we compared it with Landsat imagery and the land use map. Furthermore, we statistically analyzed the distribution of RSEI across different land use classes.

2.3.2. Spatial Autocorrelation Analysis

To explore the spatial pattern of ecological quality, spatial autocorrelation analysis was carried out at a 300 m resolution. Global Moran’s I [59] was calculated over different years to evaluate the overall spatial correlation. Additionally, Moran scatter plots were constructed to visualize spatial clustering effects. Global Moran’s I was calculated as follows:
G l o b a l   M o r a n s   I = n i = 1 n j = 1 n w i j ( R S E I i R S E I ¯ ) ( R S E I j R S E I ¯ ) i = 1 n j = 1 n w i j i = 1 n ( R S E I i R S E I ¯ ) 2
where R S E I i and R S E I j denote RSEI of the i-th and j-th pixels, respectively. n is the number of pixels. R S E I ¯ represents mean RSEI. w i j indicates spatial weight. Global Moran’s I ranges from −1 to 1. Values close to 0 imply randomness, values close to −1 reflect spatial dispersion, and values close to 1 indicate spatial clustering.
To further explore the localized pattern, Local Moran’s I was employed for Local Indicators of Spatial Association (LISA) cluster analysis [60]. LISA facilities detection of spatial clusters and outliers, such as Low–Low clusters, High–High clusters, Low–High outliers, and High–Low outliers. Local Moran’s I can be expressed as
L o c a l   M o r a n s   I = n ( R S E I i R S E I ¯ ) j = 1 n w i j ( R S E I j R S E I ¯ ) j = 1 n ( R S E I j R S E I ¯ ) 2

2.3.3. Trend Analysis

The Theil–Sen estimator [61] was applied to analyze temporal trends in ecological quality. The Theil–Sen estimator is widely recognized as a robust technique for linear trend estimation. The method offers computational efficiency and is highly robust against the influence of measurement errors and outliers. Specifically, the slope was calculated using the following formula:
S l o p e = M e d i a n ( R S E I b R S E I a b a ) , b > a
where M e d i a n ( · ) denotes the median function. R S E I a and R S E I b represent the RSEI values in year a and year b , respectively. A positive slope indicates an improving trend in ecological quality, while a negative slope reflects a deteriorating trend.
The Mann–Kendall test was applied to evaluate the significance of observed RSEI trends. As a non-parametric method, the Mann–Kendall test is commonly used for identifying monotonic temporal trends [62]. The test is robust to outliers and missing values and does not require normal distribution. Specifically, the significance was evaluated based on the Z statistic, calculated using the following formulas:
Z = D + 1 V A R ( D ) , D < 0     0 ,                             D = 0 D 1 V A R ( D ) , D > 0
D = a = 1 l 1 b = a + 1 l s i g n ( R S E I b R S E I a )
V A R ( D ) = l ( l 1 ) ( 2 l + 5 ) 18
where l denotes the temporal length, s i g n ( · ) represents the sign function, D is the sum of signs of all pairwise RSEI differences, and V a r ( D ) denotes the variance of D . The trend is regarded as significant at 95% confidence level when Z 1.96 .

2.3.4. Random Forest Regression

The Random Forest regression approach was employed to investigate the relationships between RSEI and explanatory variables as described in Section 2.2. Random Forest is an ensemble machine learning method capable of capturing nonlinear relationships [63,64]. Compared with traditional regression techniques, it demonstrates greater robustness to multicollinearity, higher tolerance to variations in data distribution, and improved generalization performance [65].
A total of 200 trees were used for the Random Forest regression. Out-of-bag (OOB) score, expressed as the coefficient of determination (R2), was utilized to evaluate model performance. To examine the relative contribution of explanatory variables, impurity-based feature importance, also known as Gini importance, was calculated. Gini importance estimates the importance by measuring how much each variable contributes to reducing impurity when splitting nodes in decision trees. Additionally, to improve interpretability, PDPs were generated to illustrate the relationship between each variable and RSEI. PDPs estimate the marginal effect of a given variable on the RSEI while averaging over the distribution of other variables [31].
To ensure compatibility between the RSEI and explanatory variables, all raster datasets for regression were resampled to 30 m resolution. Due to limitations in data availability (as illustrated in Table 1), Random Forest models were constructed for four benchmark years, including 1990, 2000, 2010, and 2020. Since topographic features are relatively stable over time, DEM data from 2000 was used consistently across all periods [66].

3. Results

3.1. Rationality of RSEI

Four indicators and corresponding RSEI for Youjiang River Valley were calculated annually. The results of PCA from 1986 to 2024 are presented in Figure 3. Across all years, the contribution rate of PC1 averaged approximately 68.90%, ranging from a minimum of 63.02% to a maximum of 76.83%. It demonstrates that PC1 effectively captured most information. Throughout the study period, loadings of four indicators remained stable and exhibited consistent algebraic signs. Specifically, NDVI and WET showed positive loadings, with average values of 0.54 and 0.34, respectively, suggesting positive impacts. Instead, LST and NDBSI showed negative loadings, with mean values of −0.29 and −0.68, reflecting negative effects. The opposing relationships are ecologically sound, as increased vegetation and moisture signify better ecological conditions, while higher temperature and more built-up areas indicate stronger ecological stress. In summary, PC1 provided a reliable synthesis of the four ecological indicators, and the RSEI constructed from PC1 can reasonably reflect the regional ecological quality.
To further evaluate the rationality of RSEI in reflecting ecological conditions, Landsat median composite imagery, the land use classification map, and the RSEI map for Youjiang River Valley in 2023 were compared. As illustrated in Figure 4a, the study area comprises multiple land use classes, with forests accounting for a high proportion. The land use map in Figure 4b further confirms that cropland and forest are dominant land use classes. Simultaneously, impervious surface is mainly concentrated in certain localized regions along the Youjiang River corridors. The RSEI map (Figure 4c) reveals apparent spatial variation in ecological quality across different land use classes. As shown in Figure 4d, median RSEI values for forest and shrubland reached 0.73 and 0.60, respectively, indicating good ecological conditions. Further, RSEI values for cropland and grassland were moderate. In contrast, RSEI values for impervious surface and bare land were low, with median values of 0.35 and 0.39, respectively. The strong spatial correspondence between RSEI values and land use classes suggests that the RSEI reliably captures the spatial pattern of ecological quality, demonstrating its applicability for ecological assessment.

3.2. Spatiotemporal Characteristics of Ecological Quality

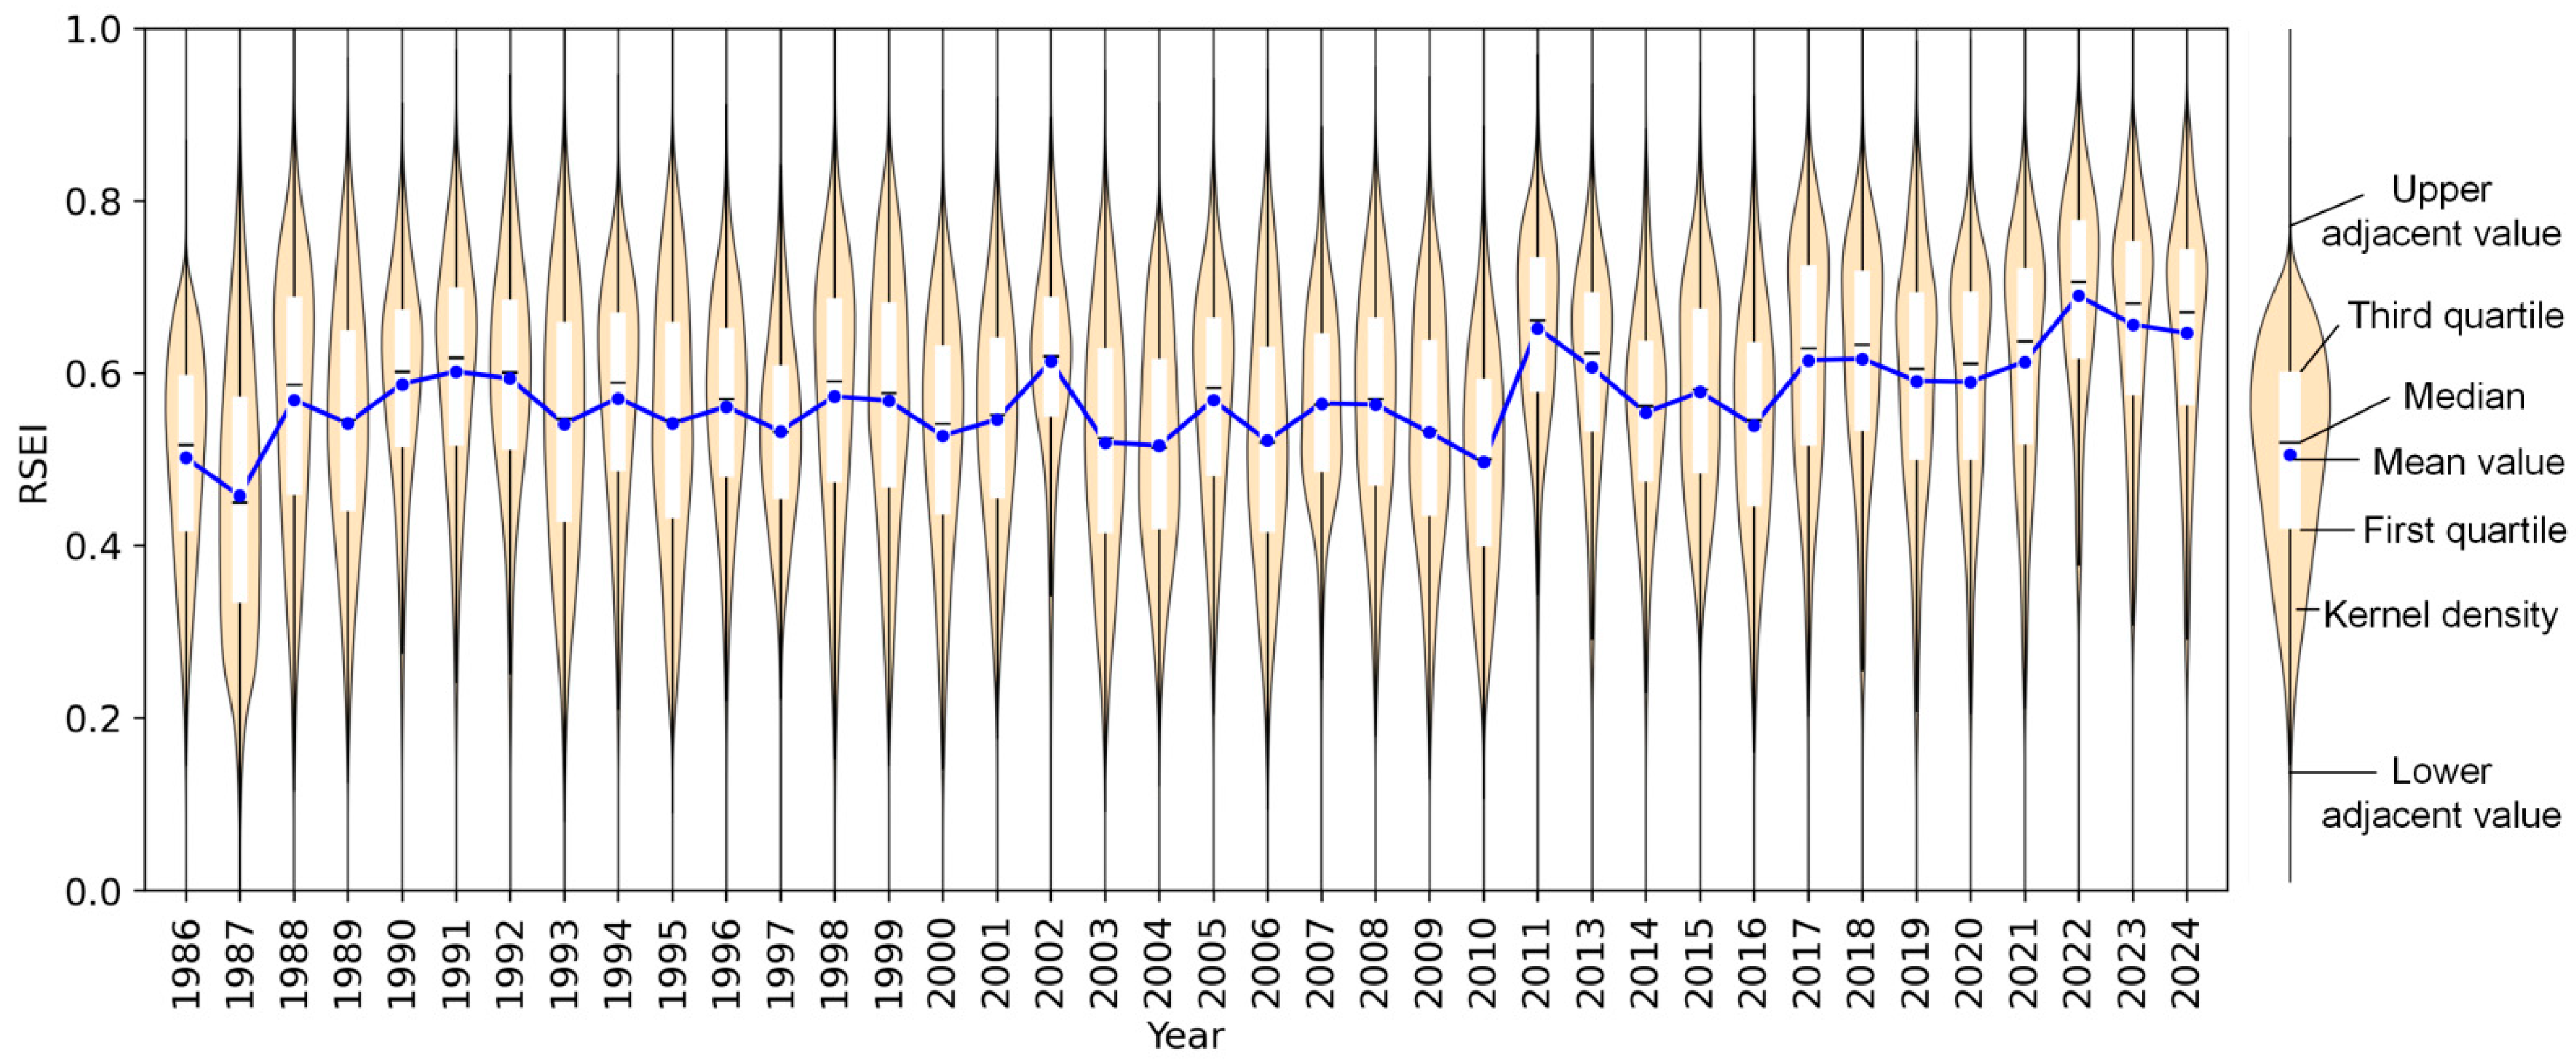
Statistical results of RSEI in Youjiang River Valley are presented in Figure 5. From 1986 to 2024, mean RSEI values varied between 0.46 and 0.69, with an overall average of 0.57. Median RSEI values varied between 0.45 and 0.71, and the standard deviation was approximately 0.14. The kernel density distribution indicates that RSEI values were primarily concentrated in the range of 0.4 to 0.7, suggesting favorable ecological conditions across the study area. Regarding temporal variation, RSEI exhibited a generally increasing trend, with a growth rate of 0.004 per year. From 1986 to 2010, mean RSEI values remained relatively stable. However, after 2011, the growth rate accelerated significantly, reaching 0.011, which may be related to rising temperature and increased precipitation [67]. At the same time, consistently high RSEI values have been observed since 2022, reflecting a notable improvement in ecological quality in recent years, potentially attributable to intensified ecological restoration efforts [43].
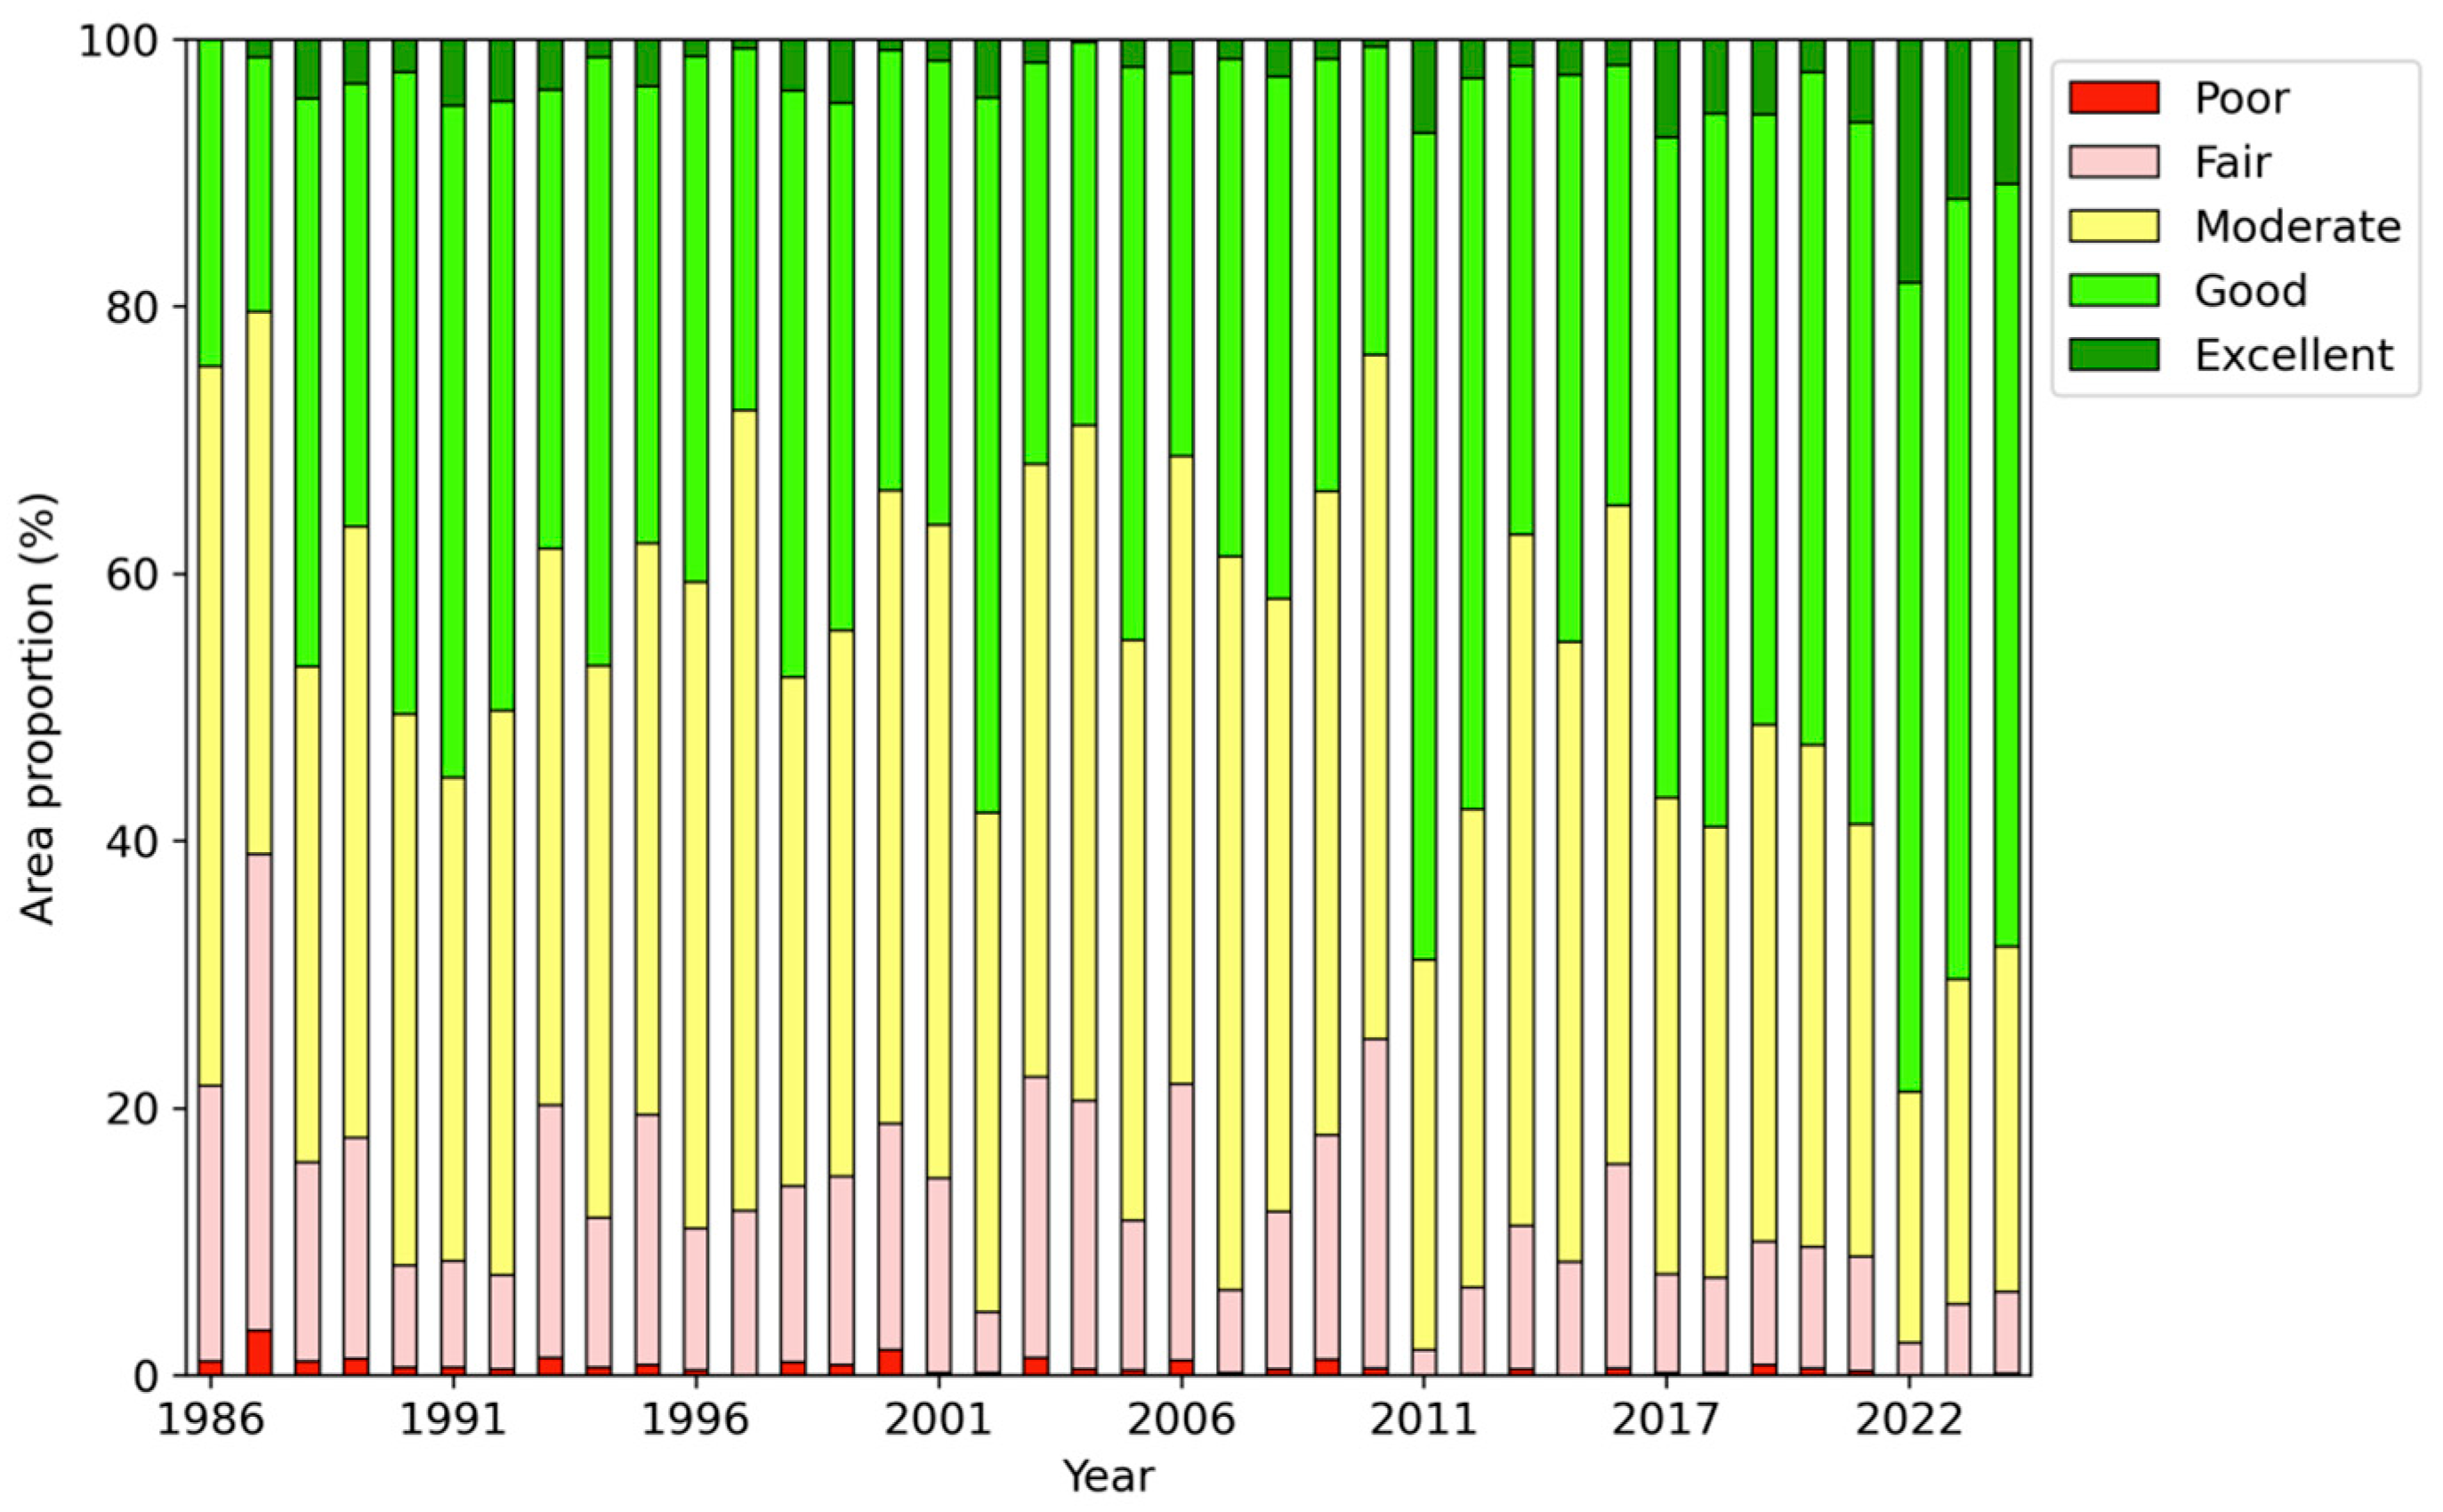
Figure 6 shows area proportions of five RSEI levels in the study area from 1986 to 2024. Overall, ecological quality was primarily classified as Moderate (41.85 ± 8.74%) and Good (41.18 ± 11.06%) levels, followed by Fair (12.53 ± 6.86%) and Excellent (3.79 ± 3.59%) levels. In contrast, the Poor level accounted for the smallest proportion (0.65 ± 0.64%). Over time, the proportions of Moderate, Fair, and Poor levels decreased, whereas those of Excellent and Good levels increased, reflecting an improvement in overall ecological quality. Since 2011, the Good level has gradually become dominant, indicating a structurally positive shift in the ecological conditions. Notably, beginning in 2022, the proportion of the Excellent level has surpassed 10%, marking a significant expansion of areas with high ecological quality. Compared to earlier years, the proportions of Poor and Fair levels have markedly decreased in recent years, providing further evidence of ongoing ecological improvement. As mentioned above, these positive changes may be the result of the combined effects of climate change and ecological restoration.
Spatial distribution and temporal evolution of RSEI levels in 1986, 1995, 2005, 2015, and 2024 are illustrated in Figure 7. Spatially, areas with high ecological quality, classified as Excellent and Good levels, were mainly situated along the periphery of Youjiang River Valley. The periphery are predominantly covered by natural vegetation, where ecosystems remain relatively stable. In contrast, areas categorized as Poor, Fair, and Moderate levels were mainly located in central regions, which are dominated by cropland and impervious surface, and more vulnerable to anthropogenic disturbances. Temporally, the extent of high-quality areas exhibited a dynamic pattern of “expansion–contraction–expansion”. Between 1986 and 1995, ecological quality improved, and the high-quality areas expanded. However, from 2005 to 2015, the high-quality areas contracted significantly. By 2024, high-quality areas have expanded again, particularly along the periphery, indicating positive changes.
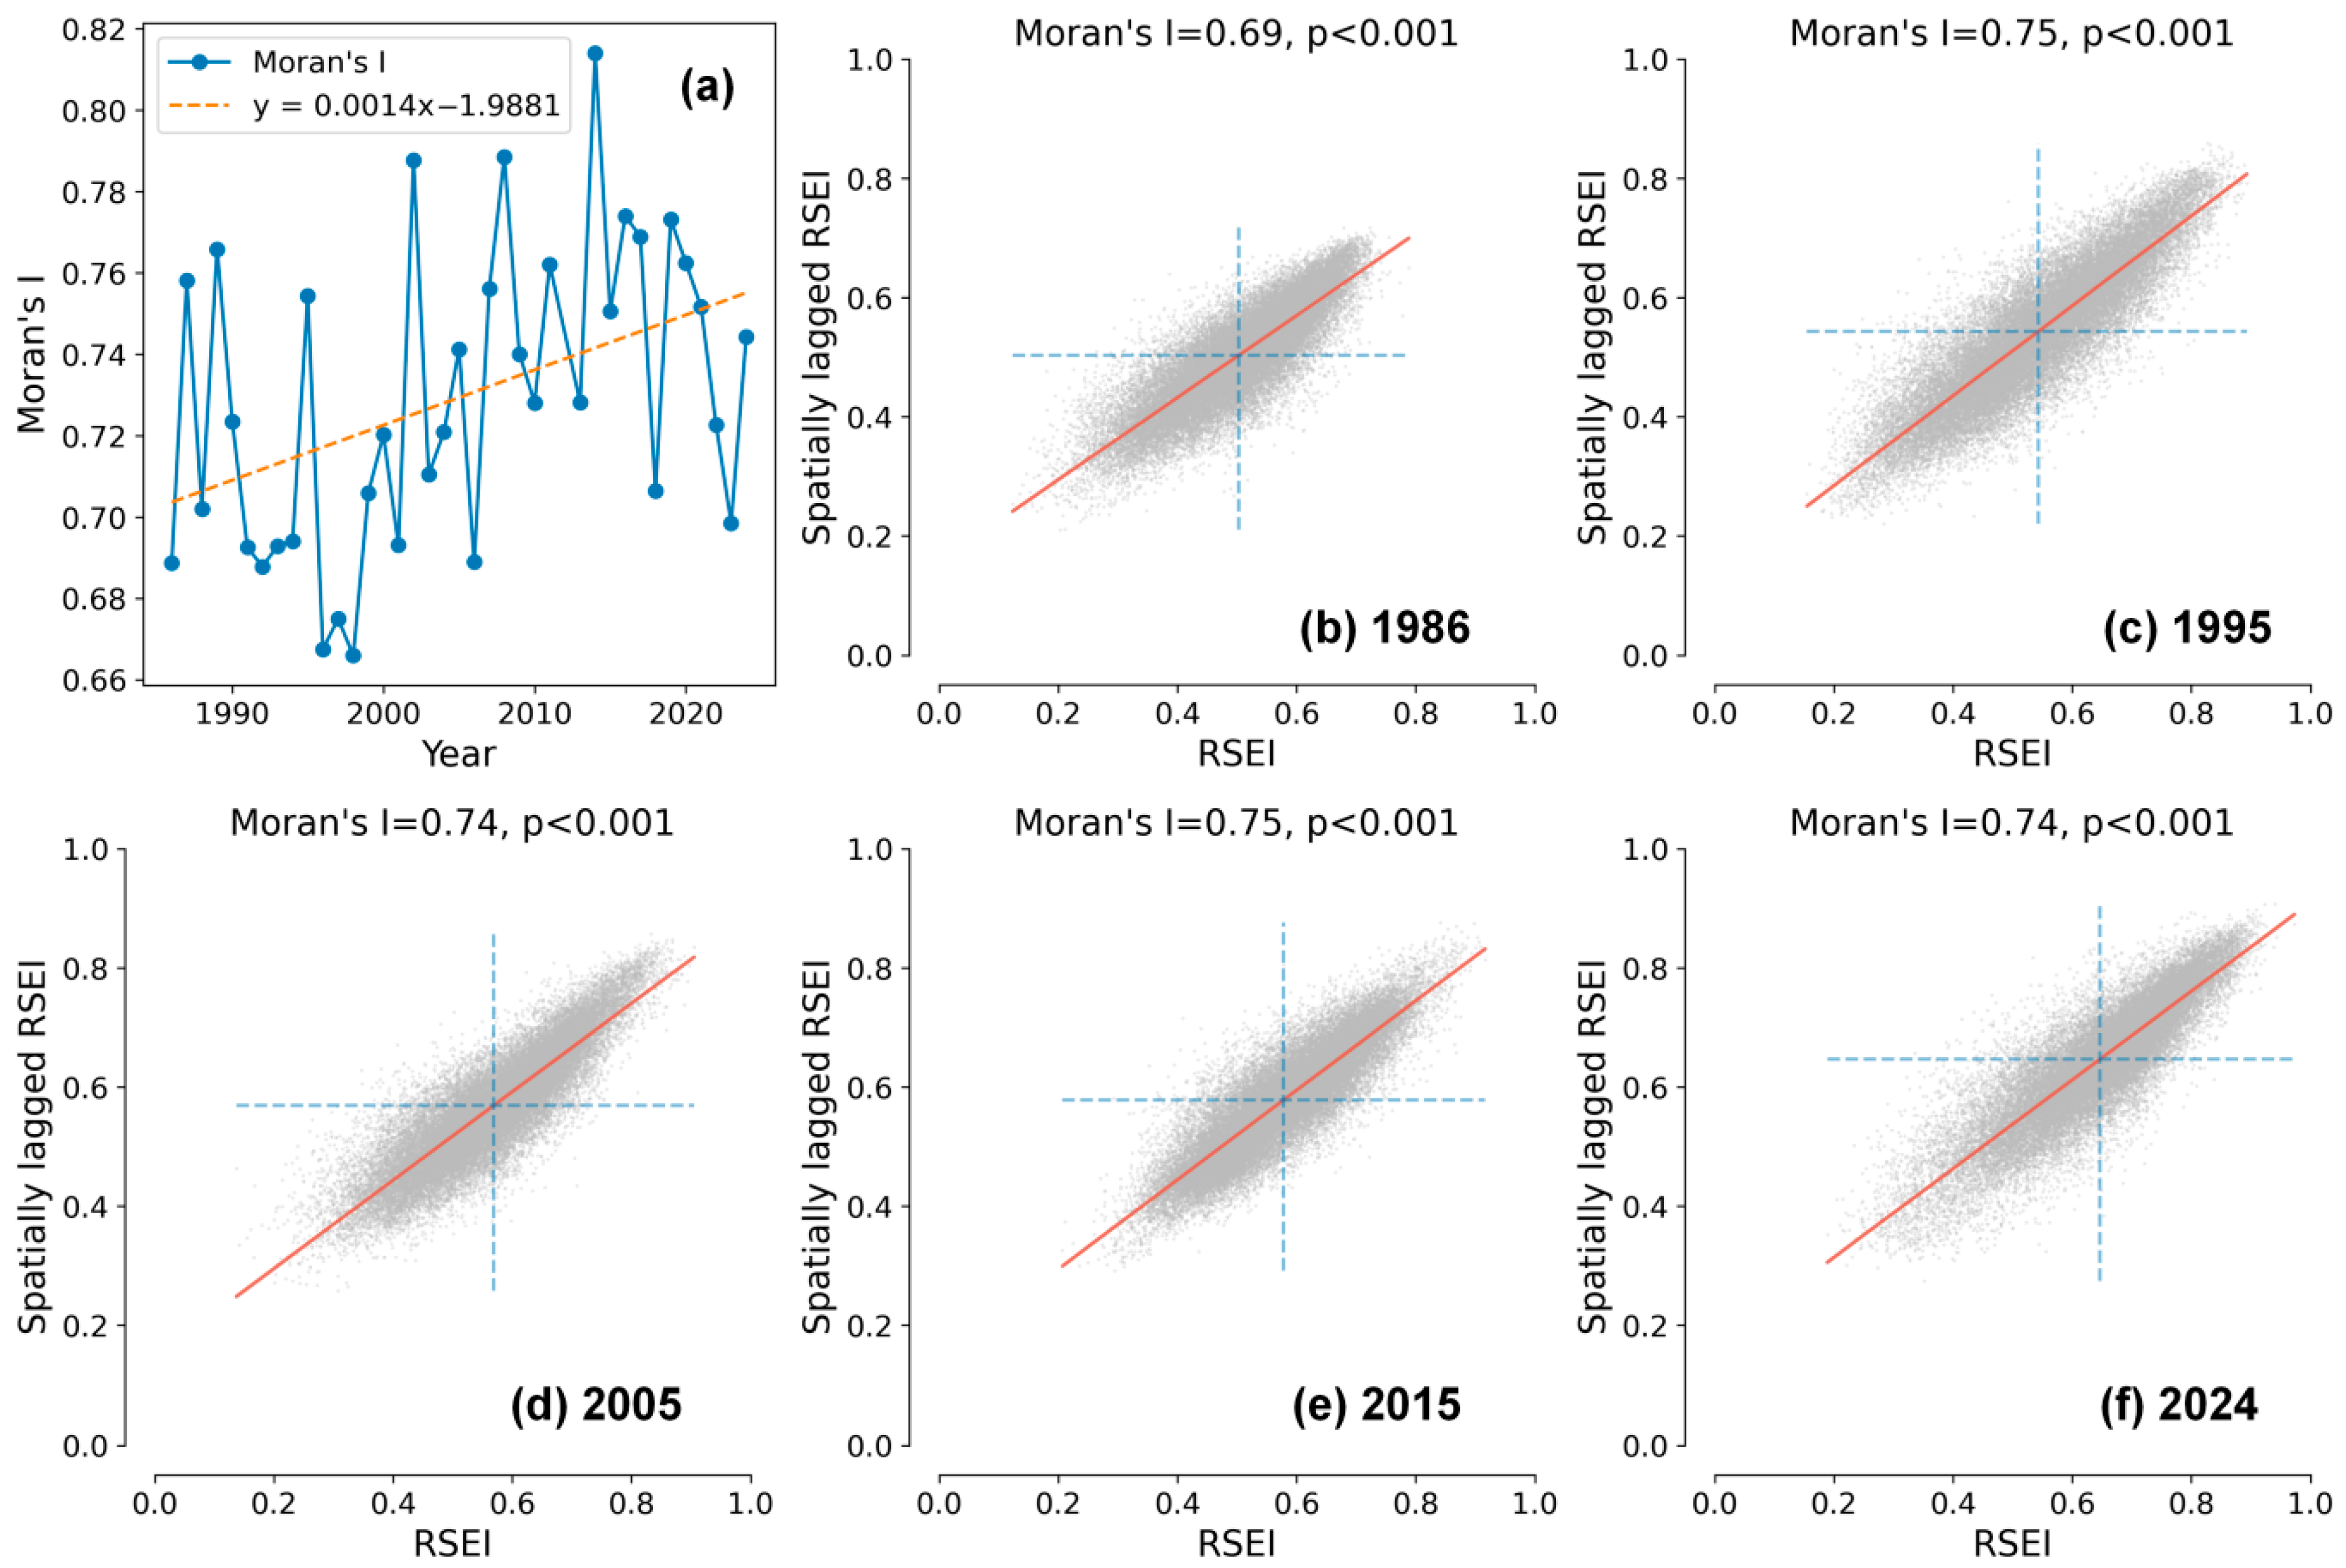
Figure 8 shows spatial autocorrelation analysis results of RSEI in Youjiang River Valley. Between 1986 and 2024, Global Moran’s I values remained consistently high, ranging from 0.67 to 0.81, with an average of 0.73 (Figure 8a). It suggests that ecological quality exhibits strong spatial autocorrelation. Additionally, a slight upward trend in Global Moran’s I was observed over the study period, with a linear regression slope of 0.0014, suggesting a gradual intensification of spatial autocorrelation. The Moran scatter plots (Figure 8b–f) further demonstrate that most points are located in the first and third quadrants, indicating a spatial association among areas with similar RSEI levels, which reflects a pronounced spatial clustering pattern.
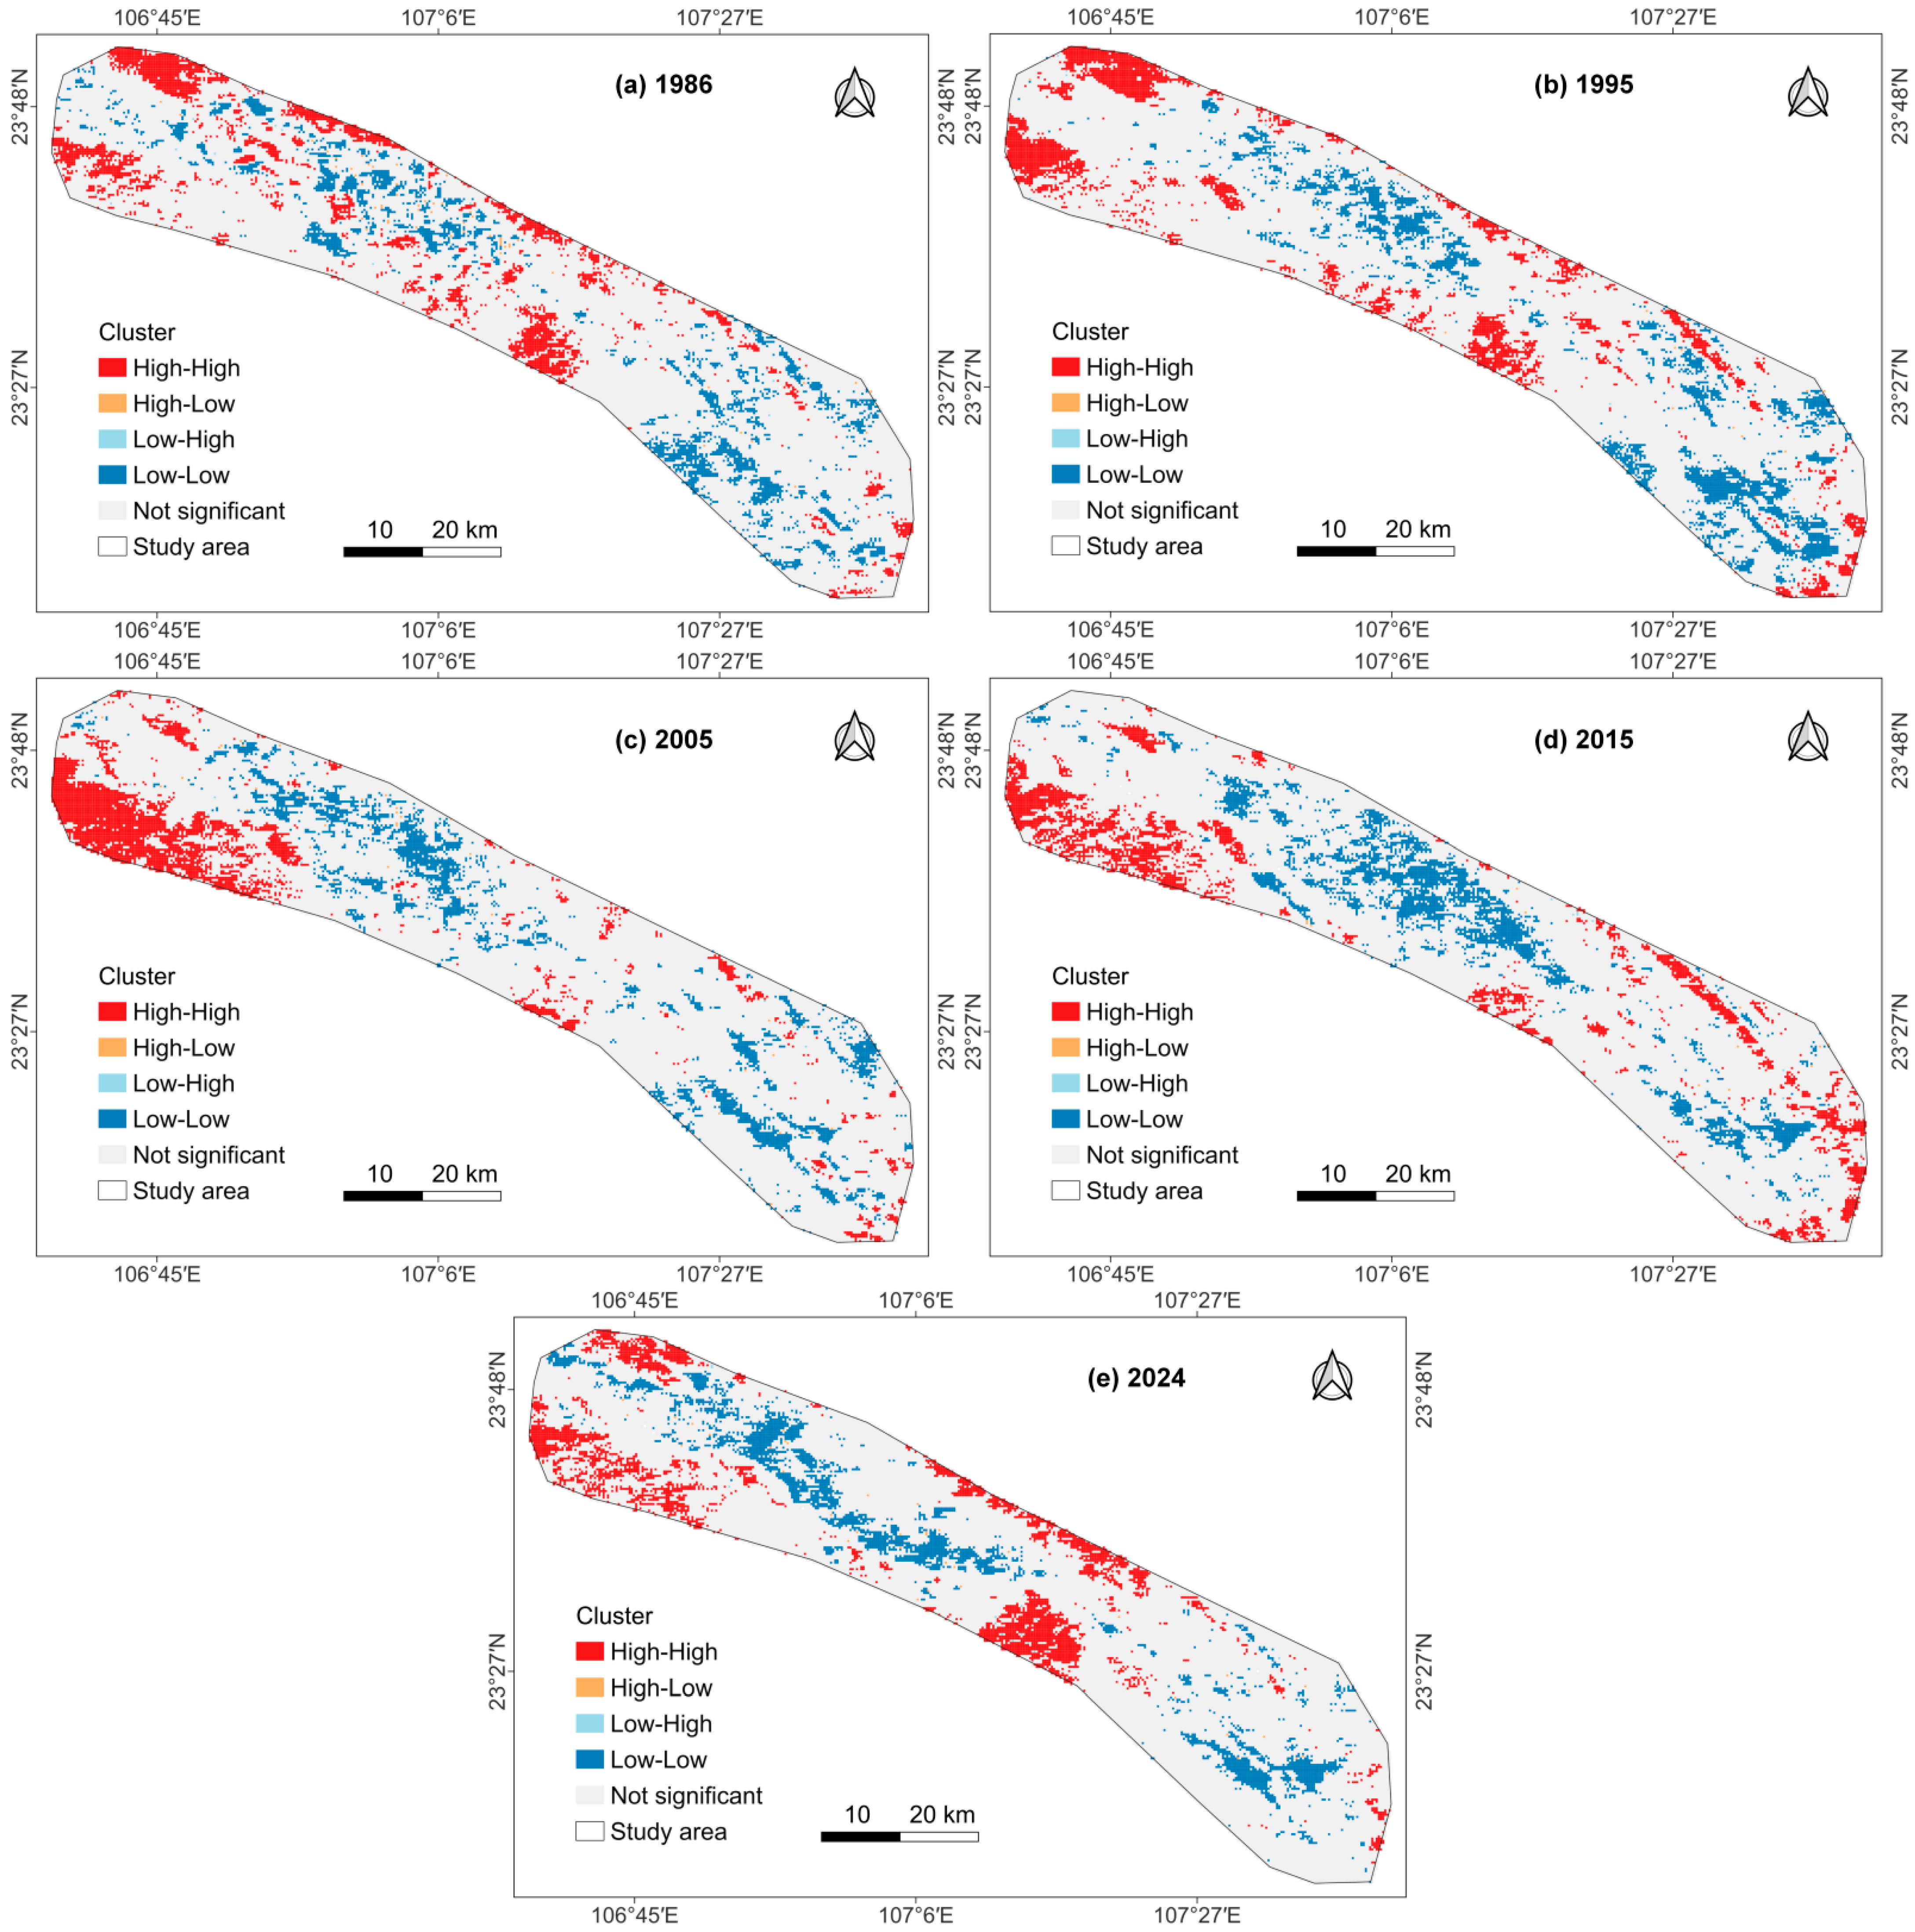
Figure 9 presents the LISA cluster maps of RSEI in 1986, 1995, 2005, 2015, and 2024. At the local scale, ecological quality was primarily characterized by significant Low–Low and High–High clusters, reflecting strong spatial homogeneity. In contrast, areas identified as High–Low and Low–High clusters occupied only a small proportion, indicating limited local spatial heterogeneity. The High–High clusters were mostly located in peripheral zones, particularly in the northwestern and central regions. Conversely, Low–Low clusters were primarily concentrated in southeastern and western core regions. Over time, spatial configuration of LISA clusters has remained stable, reflecting persistence of spatial clustering pattern in ecological quality.

3.3. Change Trends of Ecological Quality

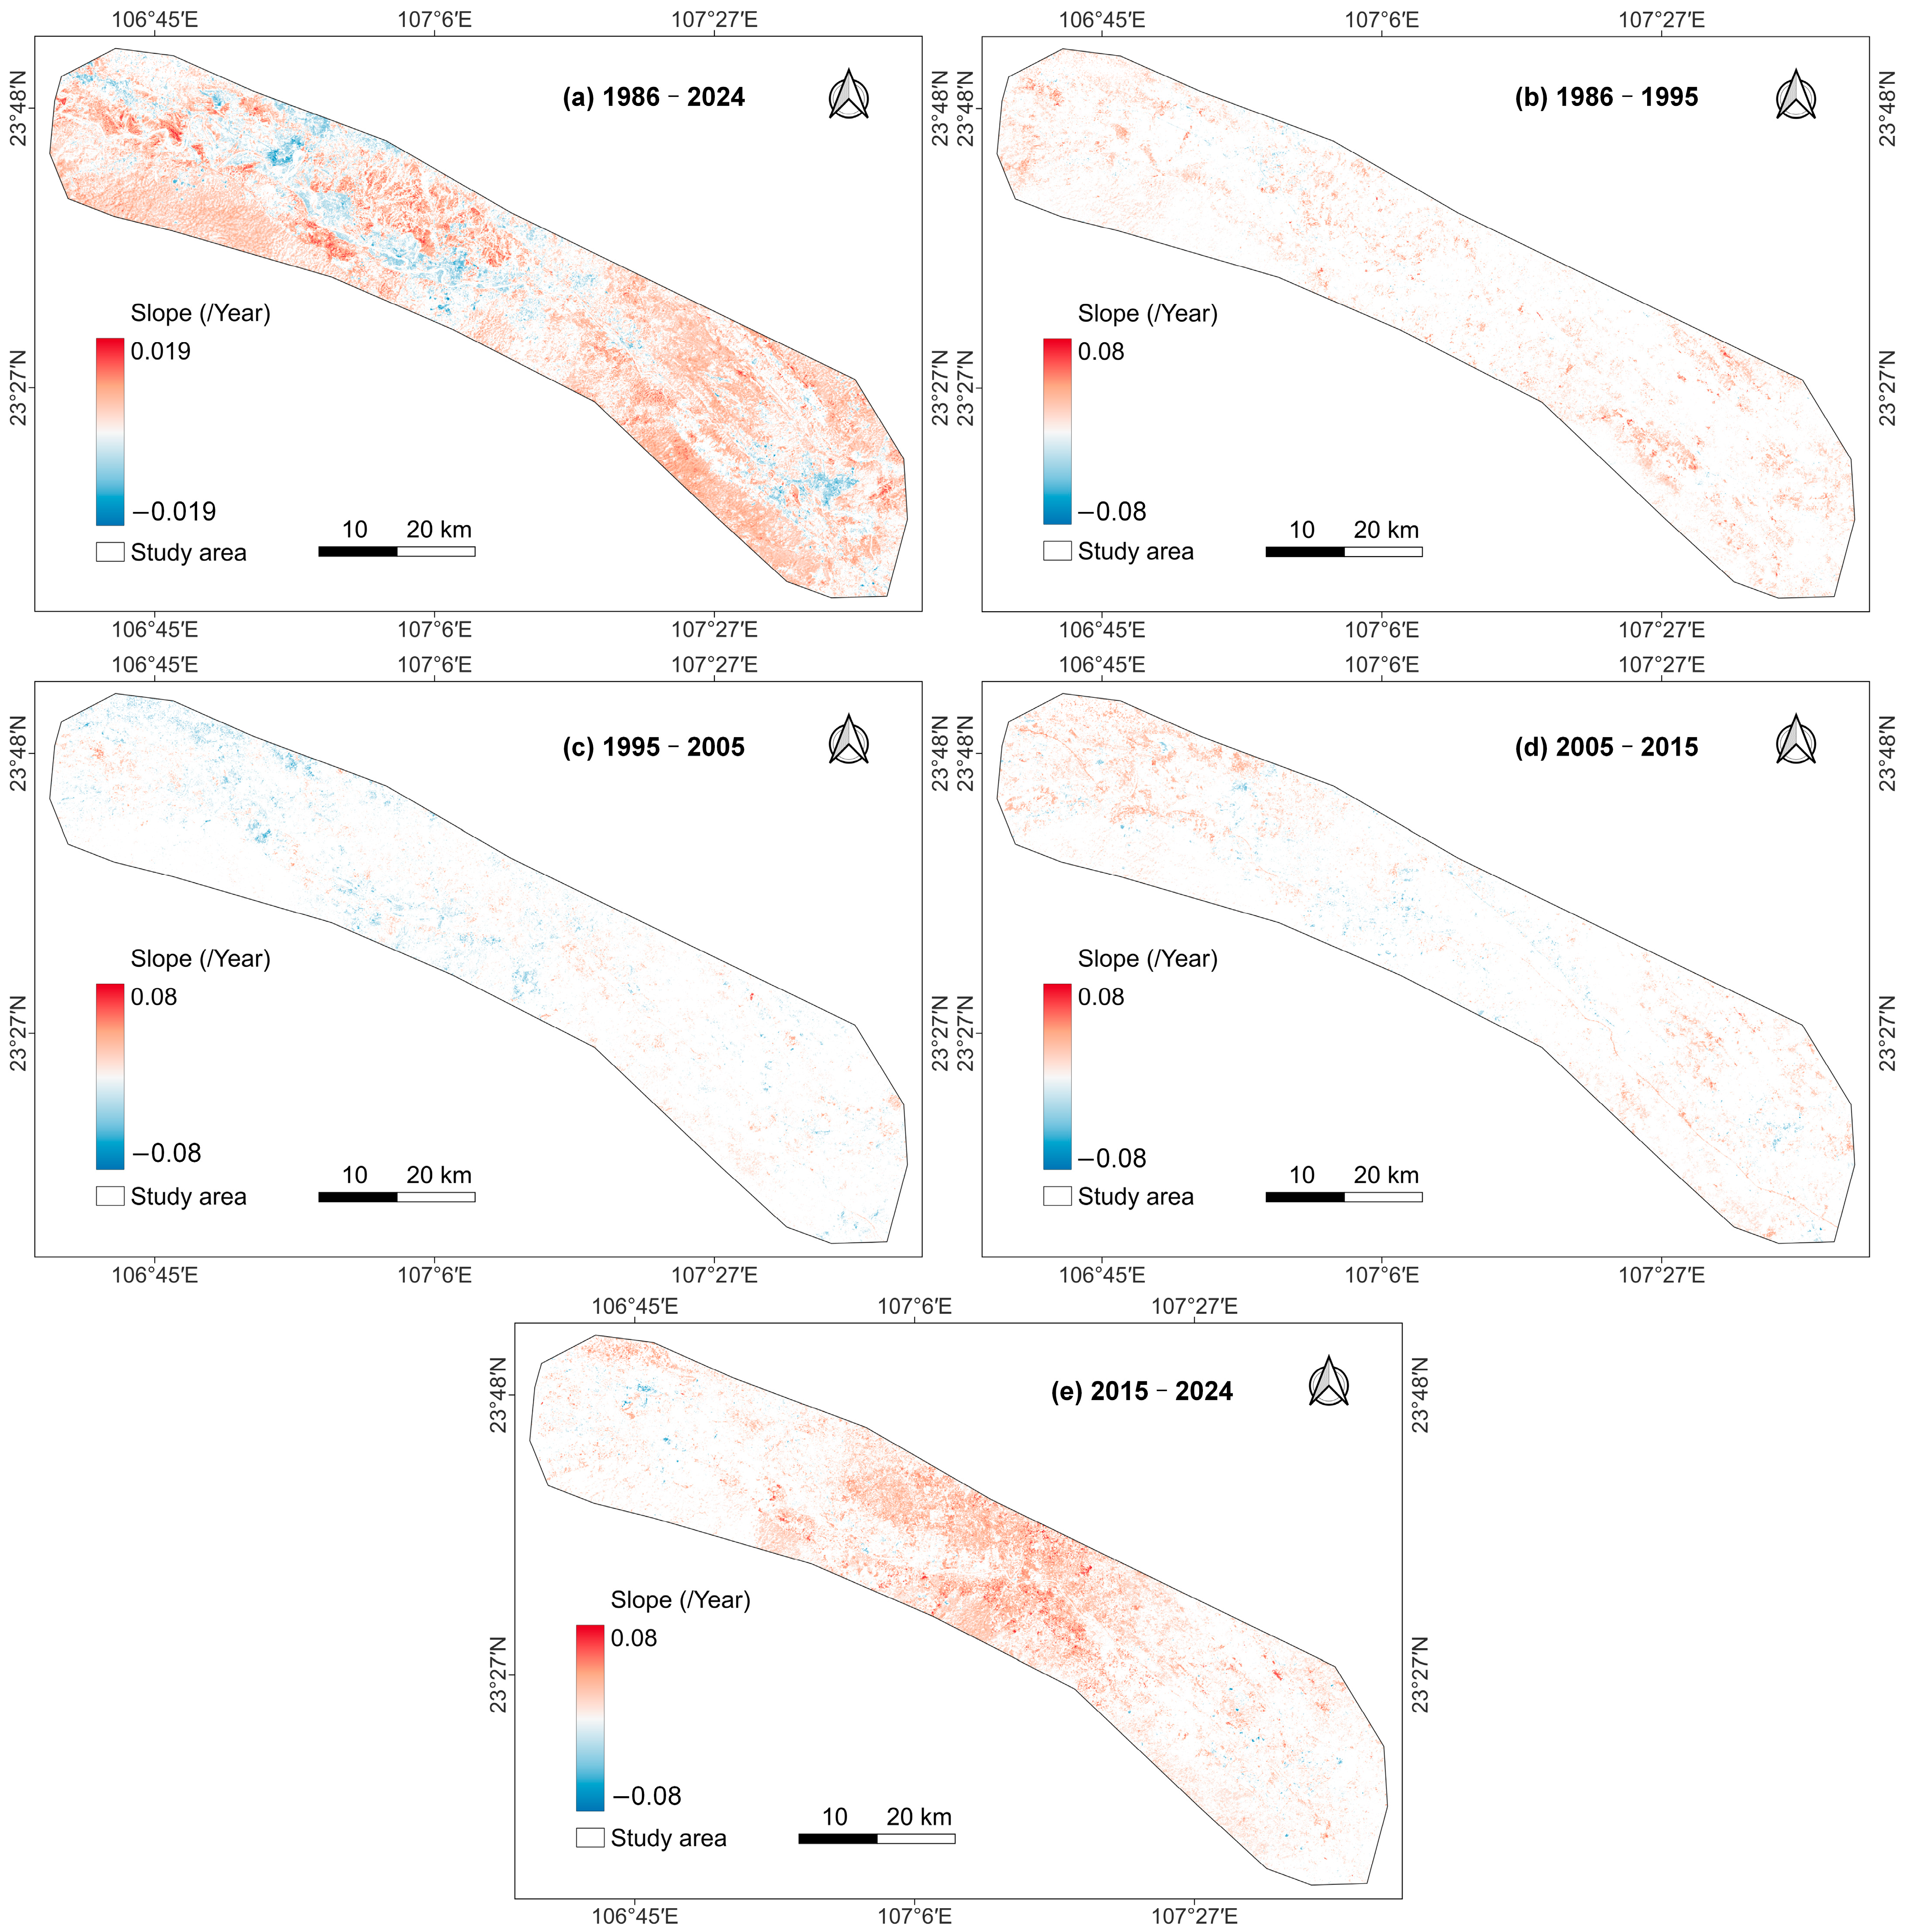
Spatial distribution of significant trends in RSEI is illustrated in Figure 10. Overall, from 1986 to 2024, ecological quality in Youjiang River Valley showed predominantly significant increasing trends (Figure 10a), with RSEI increasing by up to 0.19 per year in some areas. Although certain northern and central regions experienced significant decreasing trends in RSEI, their spatial extent was relatively limited. When analyzed by period, significant increasing trends in RSEI were generally dominant, except from 1995 to 2005 (Figure 10c). The most extensive distribution of significant increasing trends occurred between 2015 and 2024 (Figure 10e), primarily concentrated in the central regions. In contrast, during the mid-term periods (1995–2005 and 2005–2015), areas with significant decreasing trends became more prominent (Figure 10c,d), particularly in central and northwestern regions, suggesting localized ecological degradation.
Statistics of RSEI trends are summarized in Table 2. From 1986 to 2024, 48.71% of Youjiang River Valley showed significant increasing trends in RSEI, and 24.88% exhibited non-significant increasing trends. In contrast, only 9.11% of the study area experienced significant decreasing trends. Overall, the study area has undergone a predominantly improving trend in ecological quality over the past four decades. Temporal variations in RSEI trends reveal phase characteristics. From 1986 to 1995, 12.11% of the study area showed significant increasing trends in RSEI, whereas only 0.54% exhibited significant decreasing trends, indicating a clear improvement in ecological quality. However, between 1995 and 2005, the proportion of significant increasing trends declined to 3.86%, while the proportion of significant decreasing trends rose to 4.81%, suggesting a weakening in the overall improving trend. After 2005, the improving trend in ecological quality continued to intensify. Notably, in the most recent decade (2015–2024), the proportion of areas with significant increasing trends in RSEI surged to 26.76%, indicating strong improvement in ecological conditions.

3.4. Driving Factors of Ecological Quality

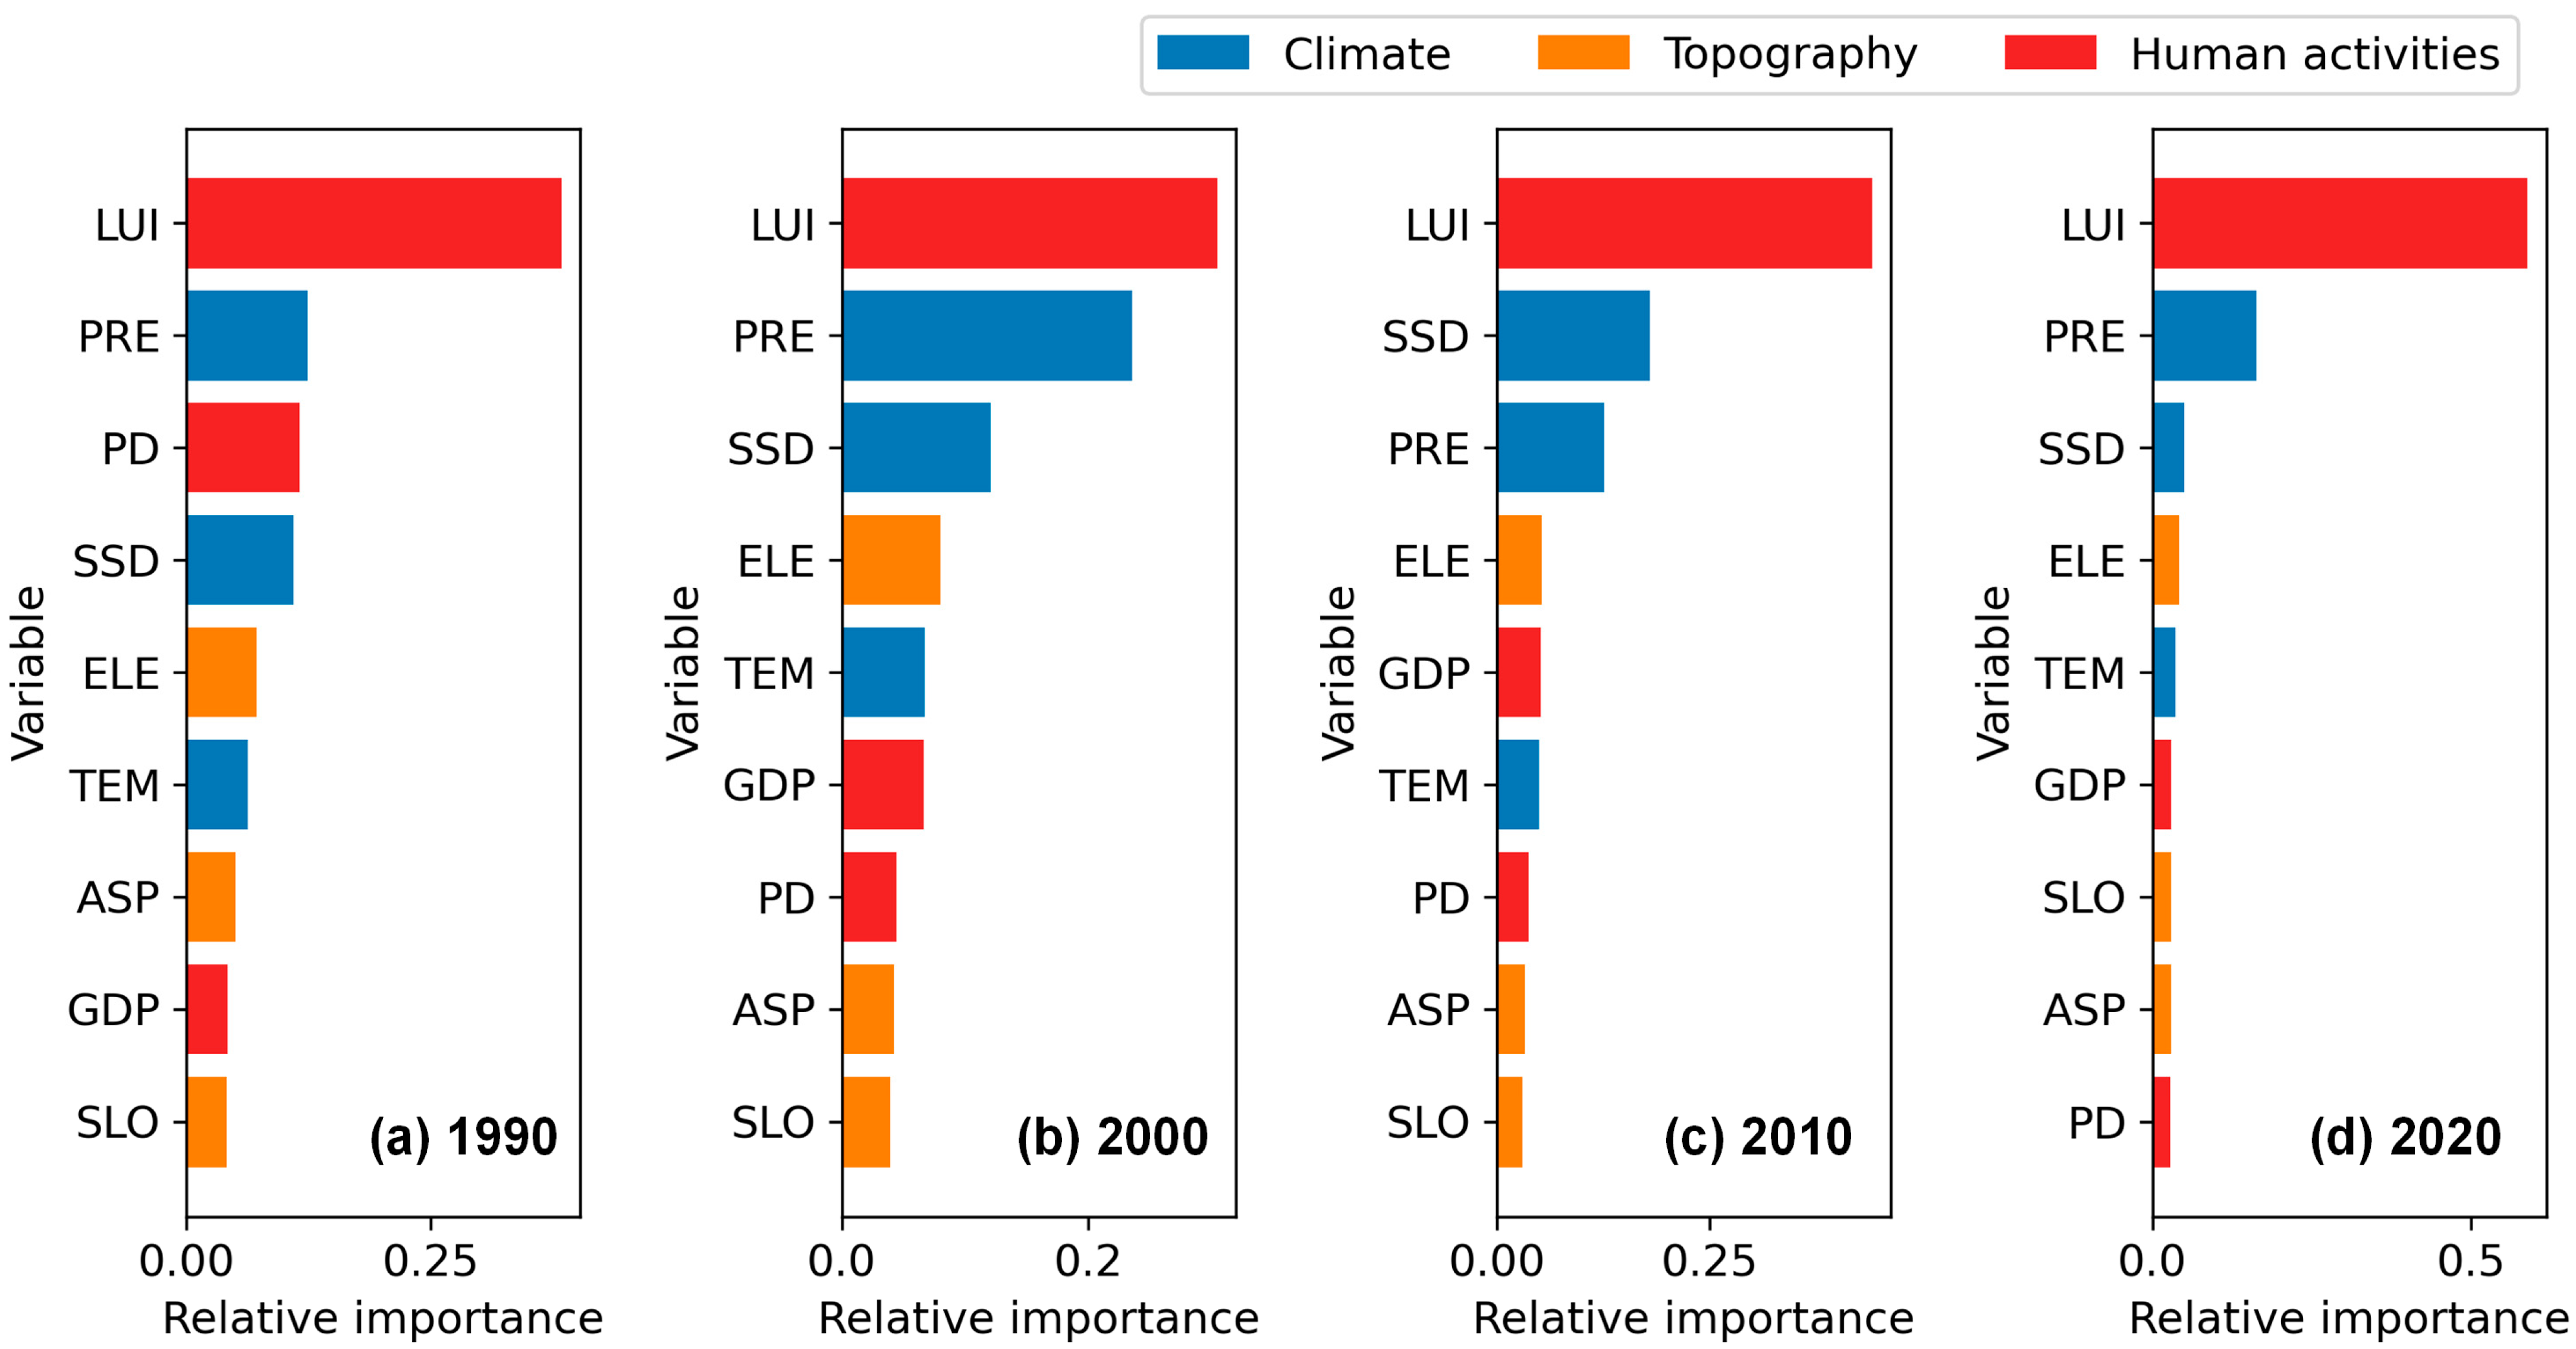
The Random Forest regression models for RSEI performed well overall, with an average R2 of 0.87. Specifically, R2 of the models in 1990, 2000, 2010, and 2020 reached 0.85, 0.85, 0.89, and 0.88, respectively. The relative importance of variables influencing RSEI is depicted in Figure 11. Among three categories, anthropogenic factors exerted the greatest influence on ecological quality, with overall relative importance ranging from 0.41 to 0.65. Climatic factors ranked second, with a mean overall importance of 0.33, while topographic factors consistently played a minor role throughout the study period. Specifically, LUI was the most influential variable across all periods, reaching the highest importance of 0.59 in 2020. It indicates a consistently strong impact of land use on ecological quality. Instead, the importance of PD declined over time, shifting from the third most crucial variable in 1990 to the least important one in 2020, suggesting a weakening influence. GDP exhibited relatively low importance, implying that economic output may not directly determine ecological quality. Among climatic variables, PRE consistently ranked among the top three, with an average relative importance of 0.16, underscoring the significance of water availability. SSD also showed considerable impact, with relative importance of 0.12 and 0.18 in 2000 and 2010, respectively, reflecting the effect of solar radiation.
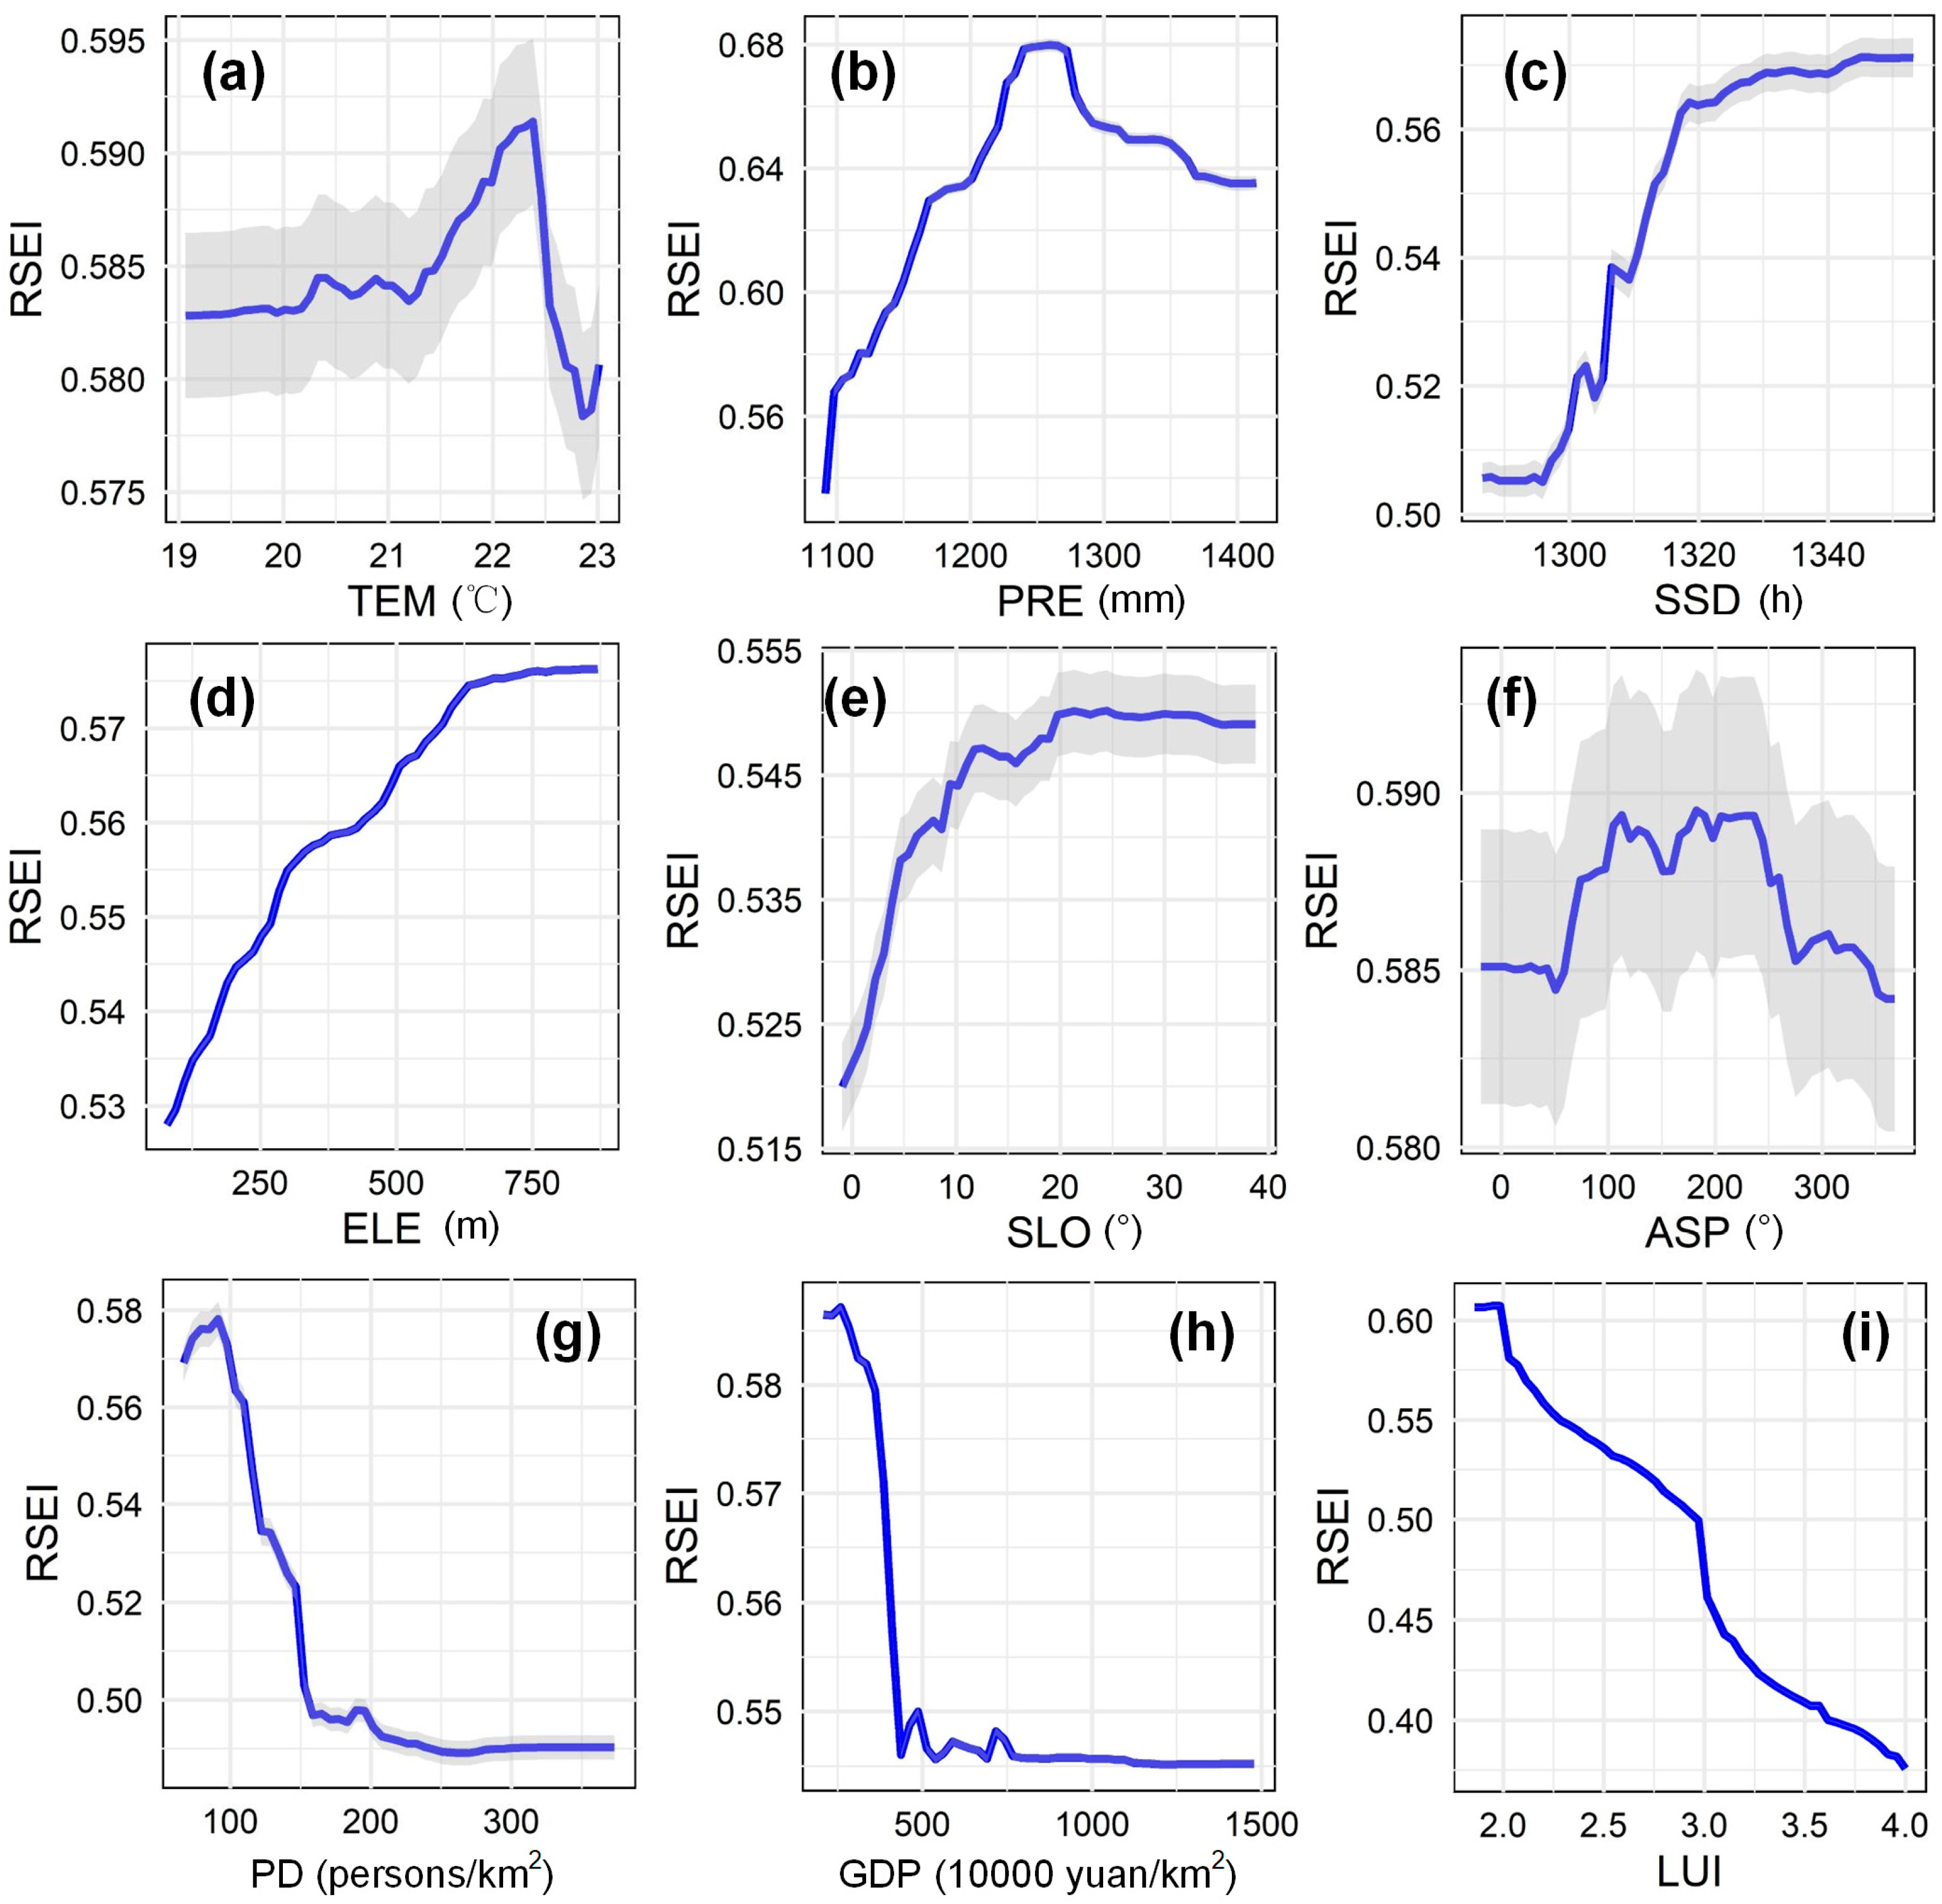
To investigate the influence paths of driving factors on ecological quality, response curves of RSEI to each variable were generated, as shown in Figure 12. For climatic variables, the relationship between TEM and RSEI followed an inverted U-shape, suggesting a possible inhibitory effect of excessive heat. RSEI showed a generally positive correlation with PRE, indicating that moderate precipitation contributes to ecological improvement. SSD also positively influenced RSEI, implying that sufficient sunlight may support better ecological conditions. Regarding topographic factors, ELE was positively associated with RSEI, with values above 625 m linked to high RSEI, likely due to reduced human-induced disturbances at high altitudes. SLO also contributed positively, particularly when SLO < 20°, possibly because steeper terrain limits human development. The relationship between ASP and RSEI was less distinct, although south-aspect areas tended to exhibit higher RSEI values. In terms of anthropogenic variables, PD demonstrated a negative correlation with RSEI. RSEI remained relatively high when PD was below 100 persons/km2 but decreased as PD increased beyond this threshold. A similar negative relationship was observed for GDP and RSEI, suggesting that areas with higher economic output may be subject to greater ecological stress due to intensified resource exploitation. LUI exerted the strongest negative effect, with RSEI values continuously decreasing as LUI increased, underscoring the pronounced suppressive effect of land use on ecological quality. Overall, climatic and topographic factors positively influenced ecological quality within specific thresholds, whereas anthropogenic factors emerged as the main sources of ecological pressure.

4. Discussion

4.1. Long-Term and Fine-Scale Ecological Quality Assessment

In this study, a long-term and fine-scale assessment of ecological quality in Youjiang River Valley was carried out, based on a nearly 40-year RSEI time series constructed from annual Landsat data. The findings indicate a general trend of ecological improvement, accompanied by some localized degradation and natural interannual variations. For example, certain areas in the northern and central regions showed significant decreasing trends in RSEI, which need better conservation and restoration. The overall trend is consistent with the broader regional trend previously reported for Guangxi province by Li et al. [68]. The assessment framework employed in this study offers several notable advantages. Firstly, the application of RSEI has proven highly effective for comprehensive ecological quality assessment in mining areas, thus overcoming the limitations associated with single-indicator approaches [10]. Secondly, the adoption of an annual assessment interval, as opposed to the longer intervals used in previous research [28], allows for more sensitive detection of both short-term dynamics and long-term trends. The robustness of the assessment is further enhanced through the integration of trend analysis approaches, including the Mann–Kendall test and Theil–Sen estimator, which minimize uncertainties related to specific years. Thirdly, the utilization of high-resolution Landsat data, rather than coarser-resolution products like MODIS [69], enables a more detailed and precise identification of ecological quality changes at the local scale. Furthermore, subtropical and tropical regions are often susceptible to cloudy and rainy weather, making remote sensing monitoring more challenging [18,70,71,72,73]. Compared to previous studies that have paid more attention to arid and semi-arid regions [15,29,37,40,74], this study provides a reference for ecological quality assessment in subtropical karst mining areas.

4.2. Driving Mechanisms of Ecological Quality Changes

To move beyond simple correlation analysis and gain in-depth insights into driving mechanisms of ecological quality changes, an analysis framework based on Random Forest regression was designed. The framework systematically deconstructed driver influence in two stages. First, Gini importance of all explanatory variables was calculated to objectively rank their impacts. Second, PDPs were utilized to visualize the specific and potentially nonlinear response relationships between ecological quality and variables. The integrated application of relative importance measure and PDPs enables a transition from merely identifying significant factors to precisely understanding how the driving factors exert their influence, thereby improving the interpretability of models [75]. Overall, the advanced framework not only yields highly interpretable models but also provides a new perspective for exploring the complex mechanisms underlying ecological quality changes [76].
The findings of this study confirm that ecological quality is jointly influenced by anthropogenic and natural factors [77]. Among natural drivers, climate was a key determinant of ecological quality, directly influencing vegetation distribution and growth [68]. For instance, the results show that greater precipitation and longer sunshine duration were generally associated with higher RSEI values. Topography played an indirect role, primarily by limiting human activities and altering local hydrothermal conditions. Our findings indicate that ecological quality exhibited a spatial distribution pattern consistent with topographic patterns, such as elevation and slope. Nevertheless, the relative importance of topographic factors was low, likely because river valley landforms with less topographic variation were dominant. Relative to natural factors, the impact of anthropogenic factors was stronger. Specifically, LUI was found to be the primary driver of RSEI variation. For example, land use changes, such as urban expansion, directly degrade ecological quality by reducing ecological land and increasing environmental pressure [25,26]. While other socioeconomic indicators like GDP and PD also negatively affected RSEI, their relative importance was minor, aligning with previous findings [21].
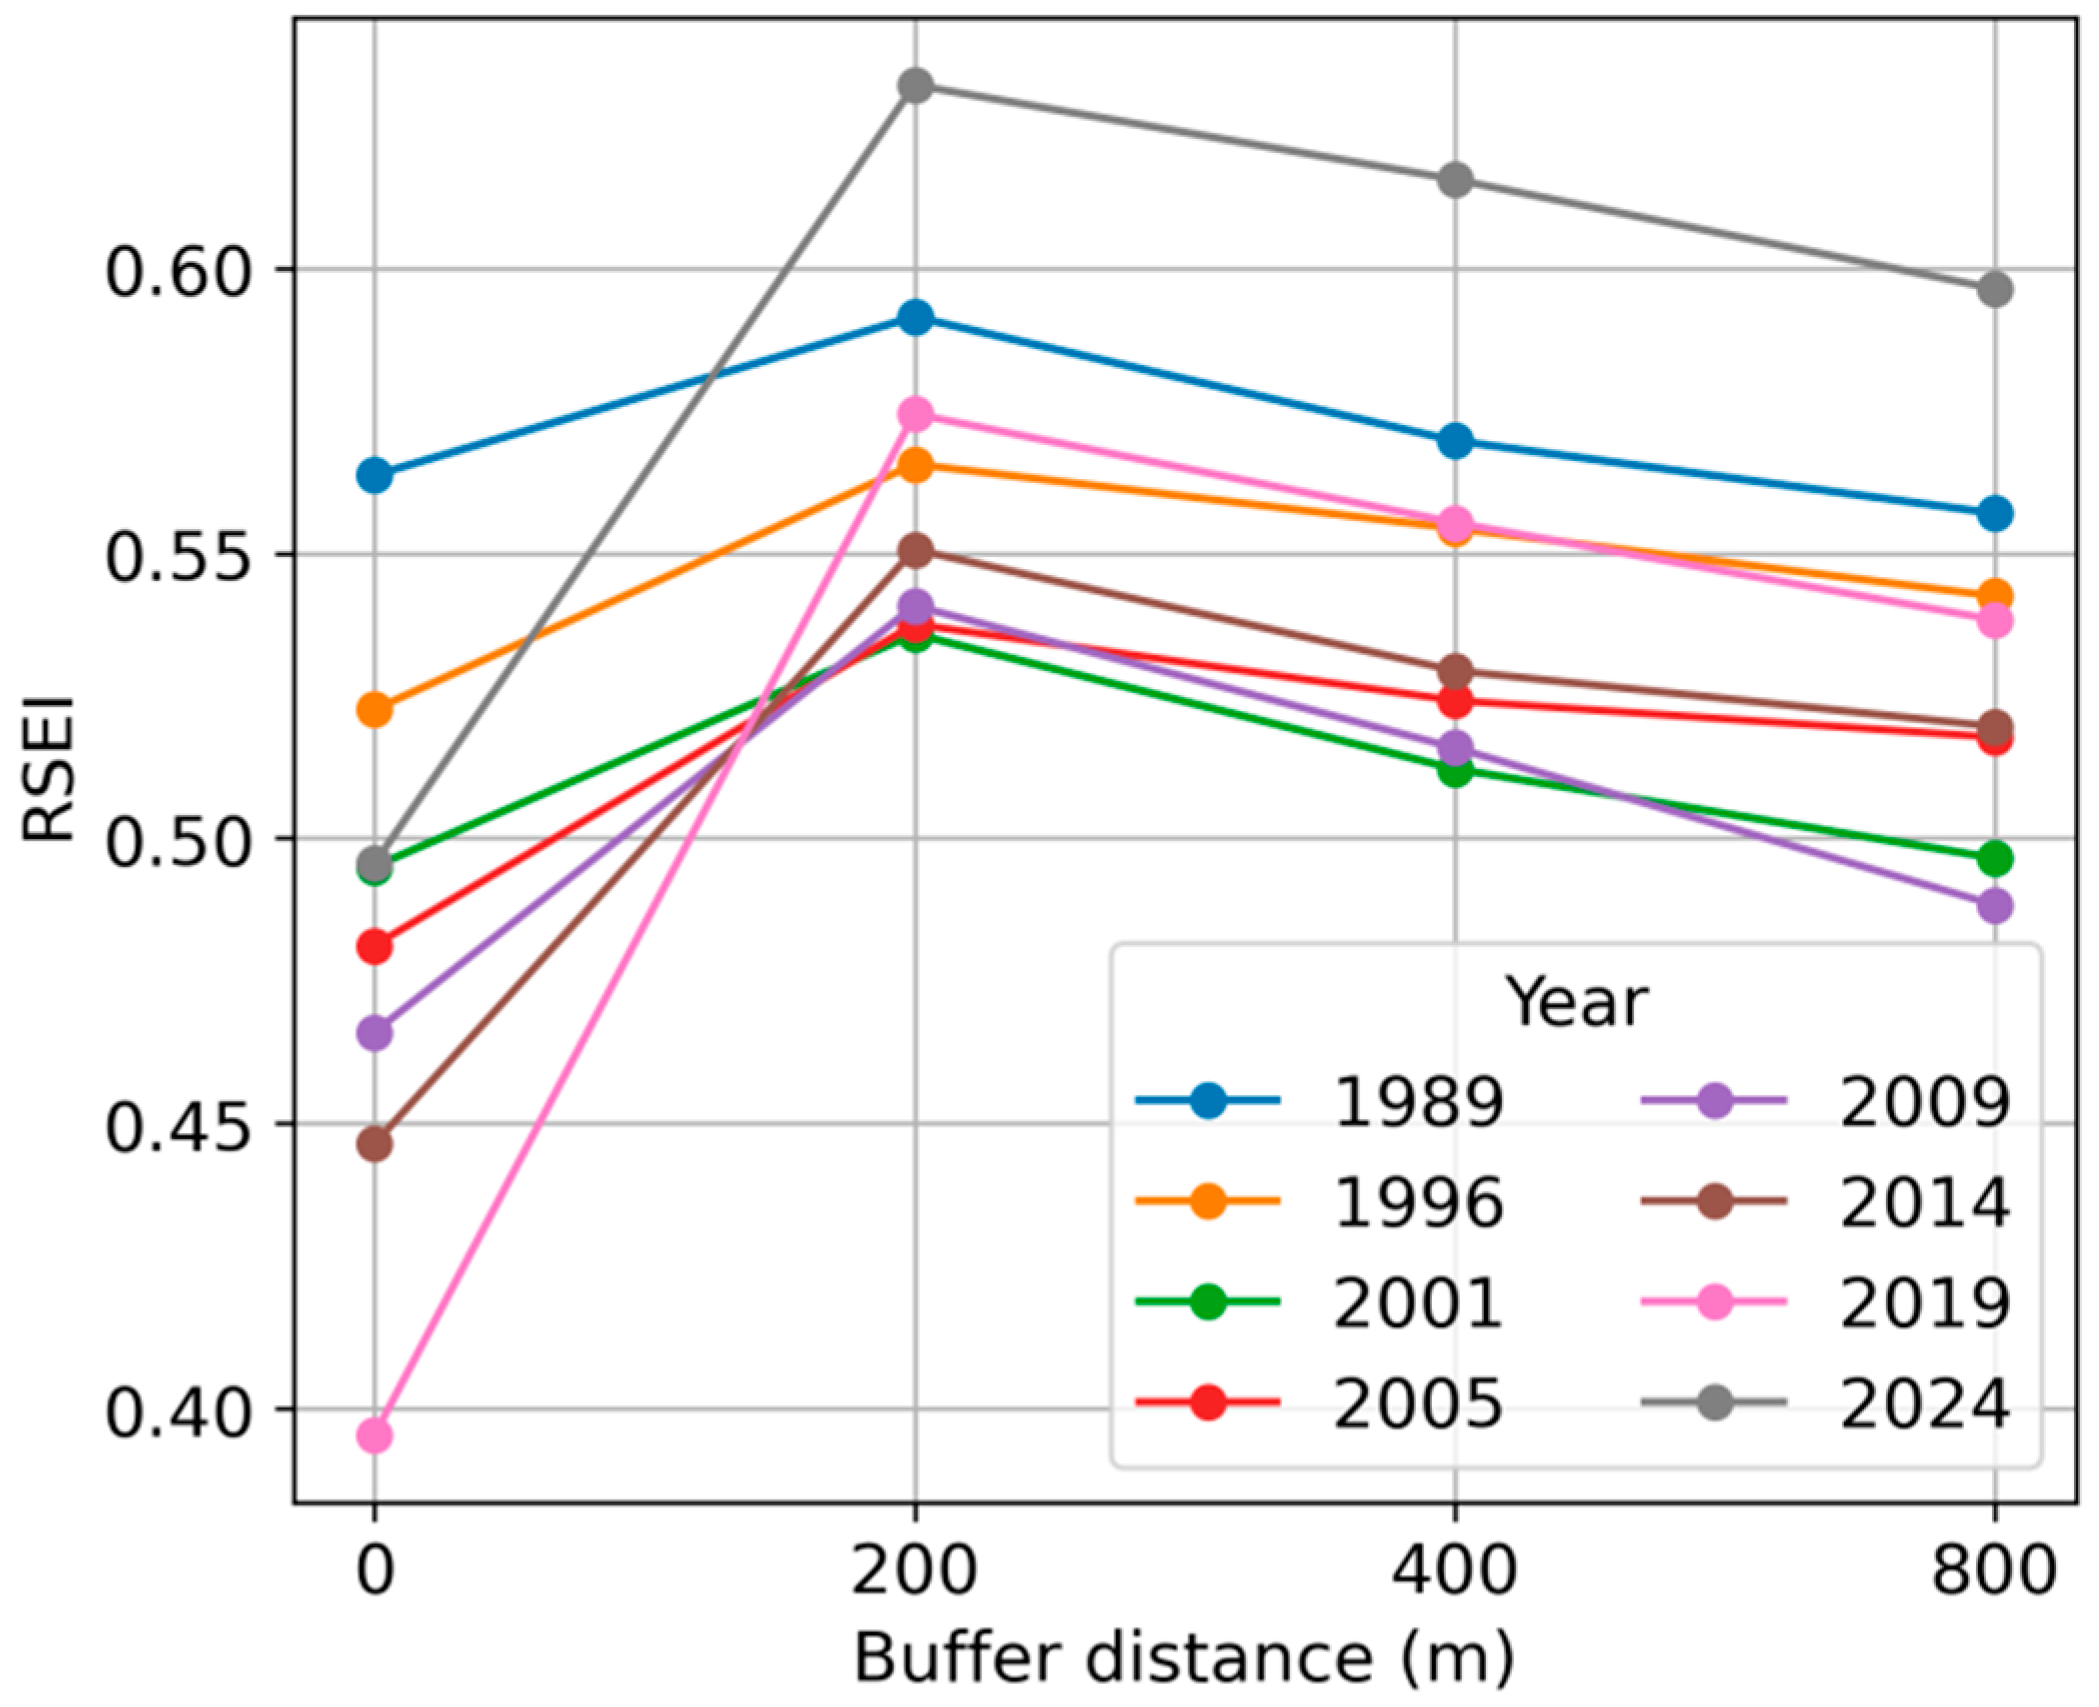
Among various anthropogenic factors, mining activities and ecological restoration efforts represent particular processes that affect ecological quality in Youjiang River Valley. On one hand, mining activities alter land use patterns and cause vegetation loss, which can lead to ecological degradation. On the other hand, ecological restoration projects can potentially reverse some of these negative impacts and promote vegetation recovery. To clarify these effects, RSEI changes within mining areas and their buffer zones were further extracted and analyzed. Referring to the method in [40], we extracted buffer zones with a radius of 200 m, 400 m, and 800 m. As shown in Figure 13, RSEI values within mining areas are consistently lower than those in buffer zones, confirming the negative effect of mining activities [40]. Regarding temporal variation, RSEI in the middle period was lower than that in the early period, especially within mining areas, reflecting considerable ecosystem disturbances. However, in recent years, a notable recovery of RSEI values within mining areas has been observed, consistent with the overall positive trend in Youjiang River Valley. The improvement is likely associated with the implementation of the major ecological restoration project targeting historical legacy mines [43].

4.3. Limitations and Future Perspective

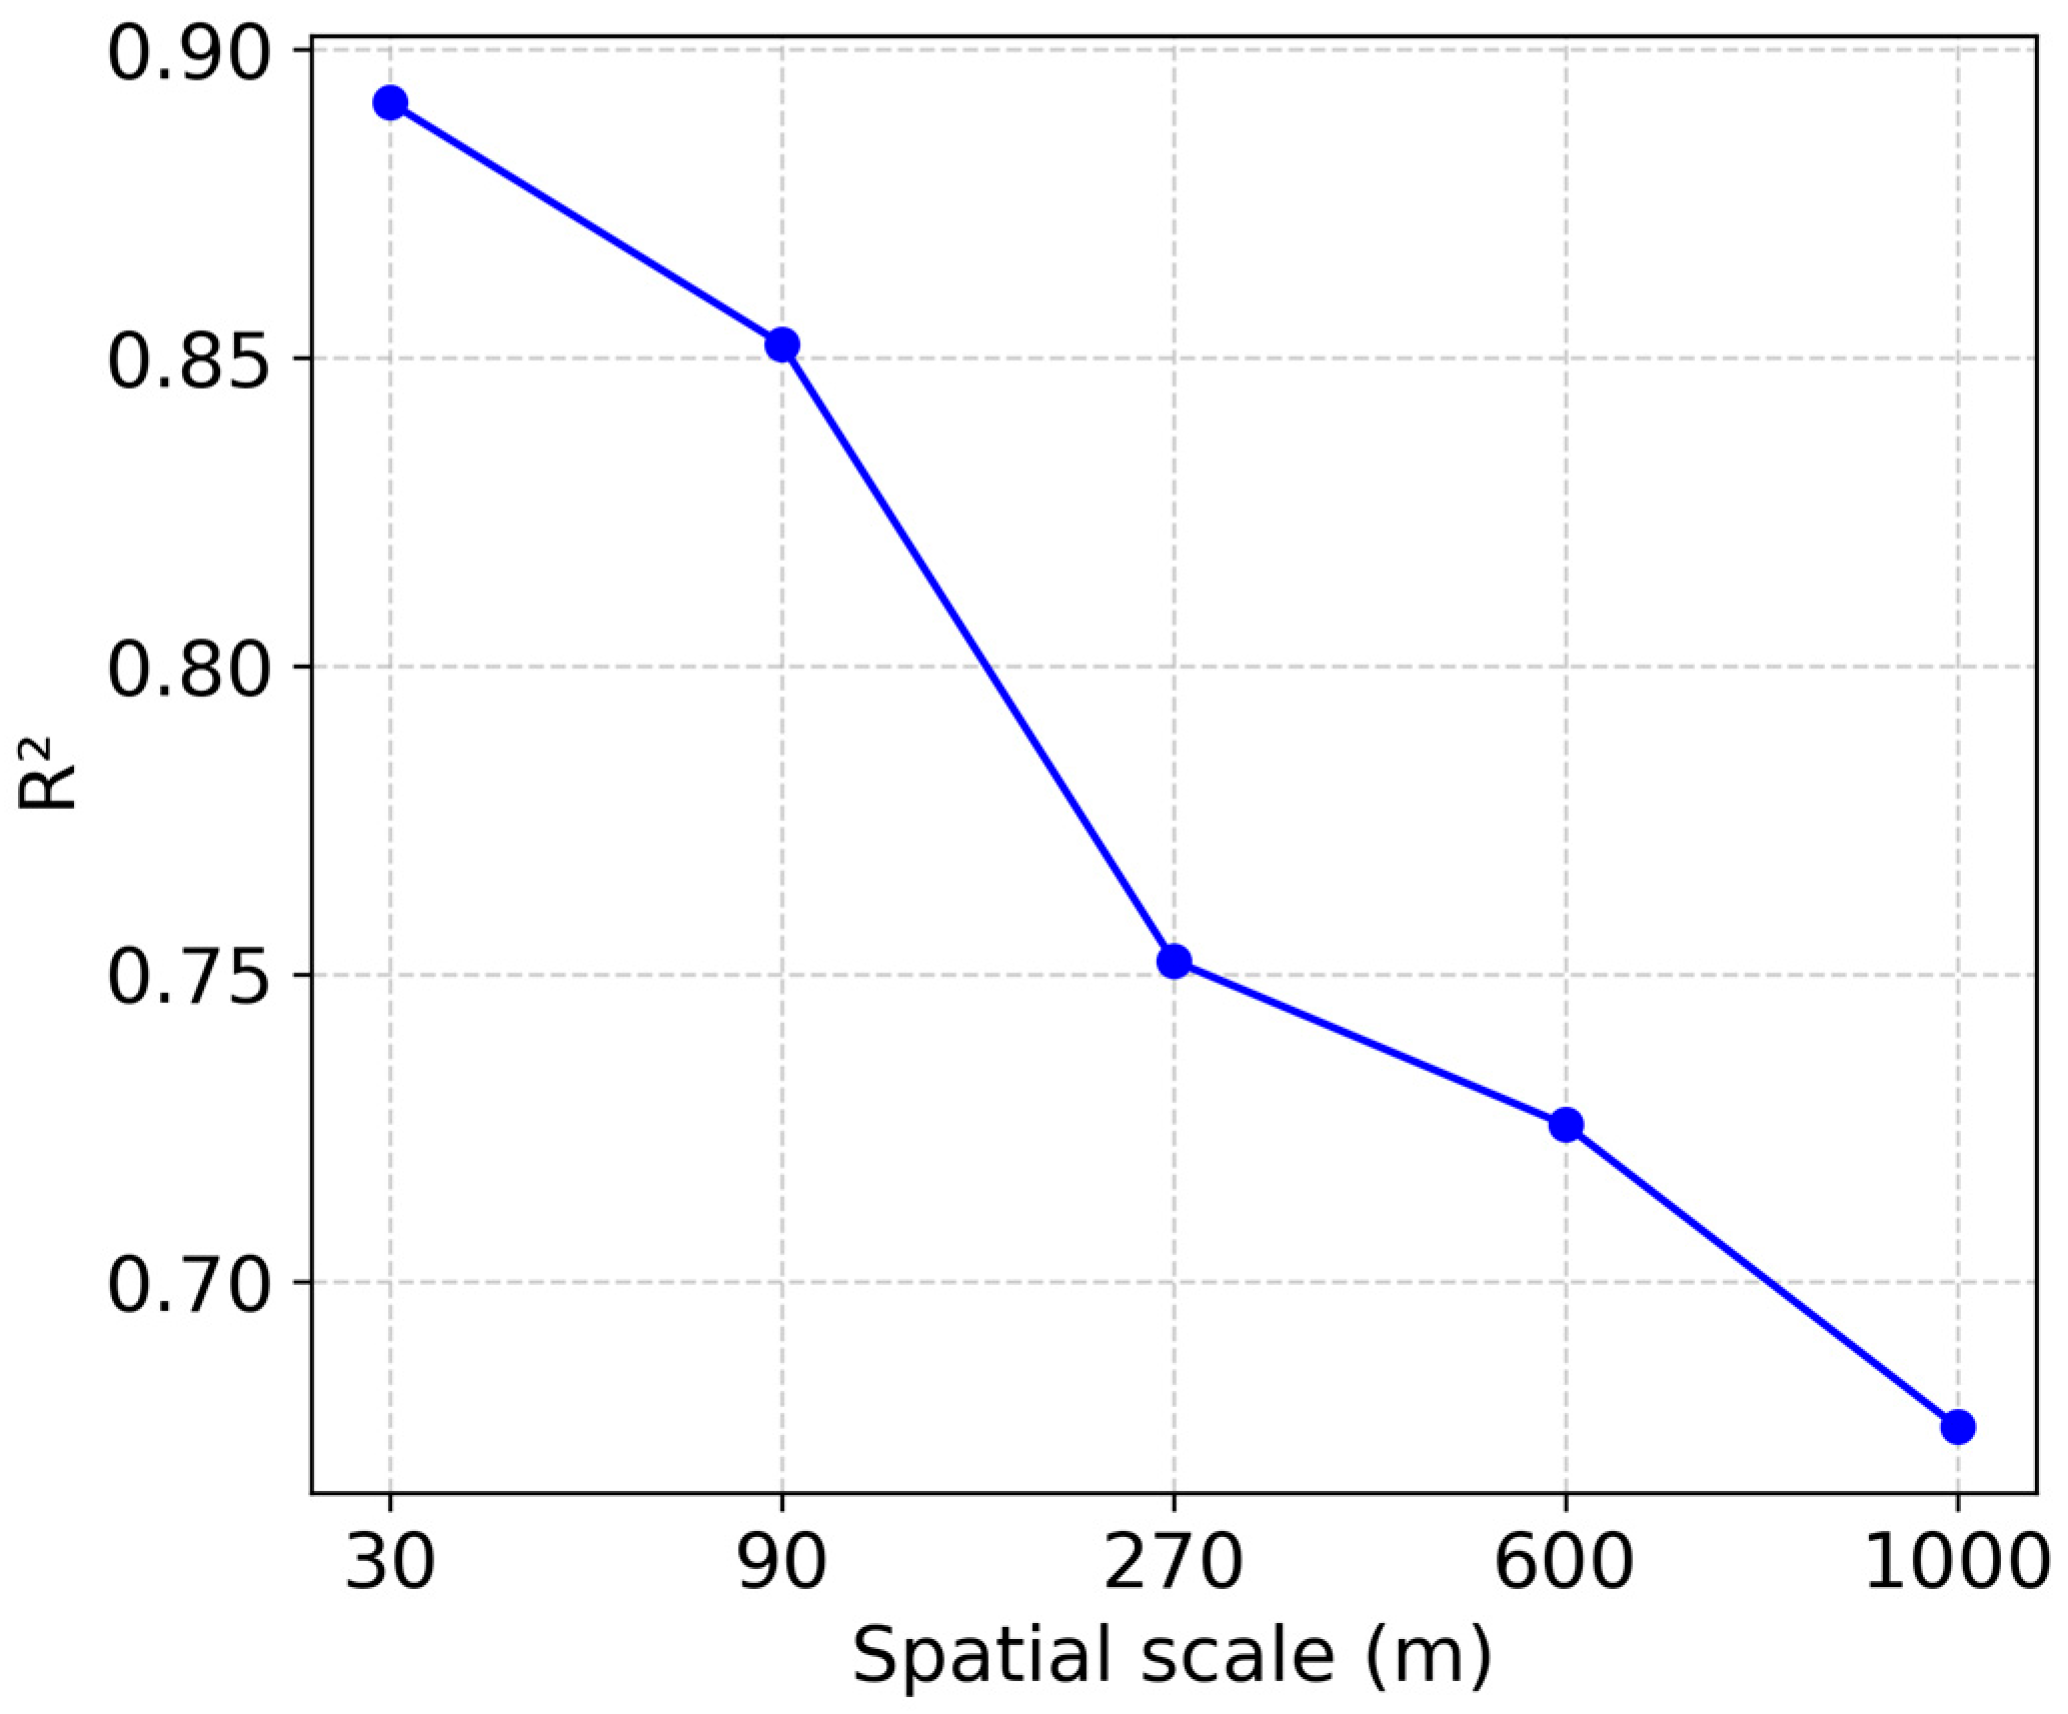
While this study sheds light on regional ecological quality and its driving mechanisms, several limitations and challenges require further investigation. First, validation of ecological quality assessment needs to be strengthened. In this study, the results were primarily validated through visual comparison with high-resolution imagery and statistical comparison with land use data. However, due to limited open data availability [78], quantitative comparison with field data or other assessment results were not feasible, which should be addressed as a priority in future work. Second, the scope of the ecological quality index could be expanded. While the RSEI is robust for ecological quality assessment, it remains limited in the capacity to reflect ecological dimensions such as biodiversity, ecosystem services, and environmental pollution [13]. Future research could explore developing new indices that incorporate more ecological indicators [14]. Third, the analysis of driving factors was subject to data constraints. Limitations included the use of datasets with inconsistent spatiotemporal resolution and the failure to quantitatively incorporate certain important factors, such as the intensity of policy interventions or ecological restoration measures [79]. These issues may cause uncertainty in regression analysis. For example, resampling factor data with a resolution of 1 km to 30 m may introduce certain errors. To reveal the effect of spatial scale, model performance at 30 m, 90 m, 270 m, 600 m, and 1 km resolution was compared. As shown in Figure 14, higher R2 was achieved at higher resolution, demonstrating that the choice of the 30 m scale is appropriate. In addition, due to the limited temporal coverage of factor datasets, the driving factor analysis was only conducted for four benchmark years. Despite this, the analysis results obtained in different years were relatively consistent, which indicates that the influence of data fluctuations may be limited. Overall, integrating more diverse and higher-quality datasets will be essential for a deeper insight into the driving mechanisms underlying ecological quality changes.

5. Conclusions

Timely assessment of the spatiotemporal evolution of ecological quality is crucial for guiding ecological conservation and restoration efforts in mining areas. However, fine-scale assessment in mining areas remains challenging. In this study, we developed a long-term and high-resolution framework for assessing ecological quality in subtropical karst mining areas using Landsat data, RSEI, and Random Forest regression. Based on this framework, we quantified the spatiotemporal dynamics and influencing factors of ecological quality in Youjiang River Valley. Results showed that the ecological quality in the study area was mainly categorized as Moderate (41.85%) and Good (41.18%) levels, with a mean RSEI of 0.57. The distribution of RSEI exhibited spatial clustering, with a mean Global Moran’s I reaching 0.73. From 1986 to 2024, ecological quality has generally improved, with a more pronounced improvement observed in the recent decade (2015–2024). Areas showing significant increasing, non-significant, and significant decreasing trends in RSEI accounted for 48.71%, 42.18%, and 9.11%, respectively. The significant increasing trends were primarily observed in natural vegetation regions such as forests. In contrast, the significant decreasing trends were mainly concentrated in impervious surfaces and croplands of the northern and central regions. Among three categories of factors, anthropogenic factors exerted the greatest influence on ecological quality, with an overall relative importance of 0.53. Among the nine variables analyzed, LUI, PRE, and SSD were primary driving factors affecting ecological quality, with relative importance reaching 0.43, 0.16, and 0.12, respectively. LUI, as the most critical determinant, exhibited a negative impact, highlighting the necessity of regulating LUI for improving ecological quality. Overall, results confirm the effectiveness of the implemented ecological restoration project in the study area. This study provides a promising framework for ecological quality assessment and analysis in subtropical karst mining areas and offers a practical reference for ecological conservation and restoration in Youjiang River Valley. Further validation of the proposed framework is needed in other geographical regions, such as arid and alpine mining areas. Furthermore, to better understand the driving mechanisms of ecological quality changes, factor datasets with higher spatiotemporal resolution should be developed and applied in future work.

Author Contributions

Conceptualization, Y.W. and H.L.; methodology, Y.W. and H.L.; software, Y.W. and H.L.; validation, Y.W. and H.L.; formal analysis, Y.W. and H.L.; investigation, Y.W. and H.L.; resources, Y.W. and H.L.; data curation, Y.W. and H.L.; writing—original draft preparation, Y.W. and H.L.; writing—review and editing, Y.W., H.L., L.W. (Li Wang), L.S., L.W. (Lili Wang), T.H., F.J., J.C. and K.L.; visualization, Y.W. and H.L.; supervision, L.W. (Li Wang) and T.H.; project administration, L.S., L.W. (Lili Wang) and K.L.; funding acquisition, Y.W. and H.L. All authors have read and agreed to the published version of the manuscript.

Funding

This research was funded by the National Natural Science Foundation of China (42301461) and Open Research Fund Program of Technical Innovation Center of Mine Geological Environmental Restoration Engineering in Southern Karst Area (NFSS2023004).

Data Availability Statement

The GEE’s JavaScript code is available at https://code.earthengine.google.com/22f2fd762ac4a34e2809d133d14f5142 (accessed on 16 August 2025). The original contributions presented in the study are included in the article, further inquiries can be directed to the corresponding author.

Conflicts of Interest

The authors declare no conflicts of interest.

References

  1. Sinclair, J.S.; Welti, E.A.R.; Altermatt, F.; Álvarez-Cabria, M.; Aroviita, J.; Baker, N.J.; Barešová, L.; Barquín, J.; Bonacina, L.; Bonada, N.; et al. Multi-decadal improvements in the ecological quality of European rivers are not consistently reflected in biodiversity metrics. Nat. Ecol. Evol. 2024, 8, 430–441. [Google Scholar] [CrossRef]
  2. Fletcher, C.; Ripple, W.J.; Newsome, T.; Barnard, P.; Beamer, K.; Behl, A.; Bowen, J.; Cooney, M.; Crist, E.; Field, C.; et al. Earth at risk: An urgent call to end the age of destruction and forge a just and sustainable future. PNAS Nexus 2024, 3, pgae106. [Google Scholar] [CrossRef] [PubMed]
  3. Prăvălie, R.; Borrelli, P.; Panagos, P.; Ballabio, C.; Lugato, E.; Chappell, A.; Miguez-Macho, G.; Maggi, F.; Peng, J.; Niculiță, M.; et al. A unifying modelling of multiple land degradation pathways in Europe. Nat. Commun. 2024, 15, 3862. [Google Scholar] [CrossRef]
  4. Gonçalves, F.; Farooq, H.; Harfoot, M.; Pires, M.M.; Villar, N.; Sales, L.; Carvalho, C.; Bello, C.; Emer, C.; Bovendorp, R.S.; et al. A global map of species at risk of extinction due to natural hazards. Proc. Natl. Acad. Sci. USA 2024, 121, e2321068121. [Google Scholar] [CrossRef] [PubMed]
  5. Pereira, H.M.; Martins, I.S.; Rosa, I.M.D.; Kim, H.; Leadley, P.; Popp, A.; van Vuuren, D.P.; Hurtt, G.; Quoss, L.; Arneth, A.; et al. Global trends and scenarios for terrestrial biodiversity and ecosystem services from 1900 to 2050. Science 2024, 384, 458–465. [Google Scholar] [CrossRef] [PubMed]
  6. Peng, J.; Xu, D.; Xu, Z.; Tang, H.; Jiang, H.; Dong, J.; Liu, Y. Ten key issues for ecological restoration of territorial space. Natl. Sci. Rev. 2024, 11, nwae176. [Google Scholar] [CrossRef]
  7. Ewers, R.M.; Orme, C.D.L.; Pearse, W.D.; Zulkifli, N.; Yvon-Durocher, G.; Yusah, K.M.; Yoh, N.; Yeo, D.C.J.; Wong, A.; Williamson, J.; et al. Thresholds for adding degraded tropical forest to the conservation estate. Nature 2024, 631, 808–813. [Google Scholar] [CrossRef]
  8. Yan, Y.; Guan, Q.; Shao, W.; Wang, Q.; Yang, X.; Luo, H. Spatiotemporal dynamics and driving mechanism of arable ecosystem stability in arid and semi-arid areas based on Pressure-Buffer-Response process. J. Clean. Prod. 2023, 421, 138553. [Google Scholar] [CrossRef]
  9. Wang, R.; Sun, Y.; Zong, J.; Wang, Y.; Cao, X.; Wang, Y.; Cheng, X.; Zhang, W. Remote sensing application in ecological restoration monitoring: A systematic review. Remote Sens. 2024, 16, 2204. [Google Scholar] [CrossRef]
  10. Guo, Y.; Cheng, L.; Ding, A.; Yuan, Y.; Li, Z.; Hou, Y.; Ren, L.; Zhang, S. Geodetector model-based quantitative analysis of vegetation change characteristics and driving forces: A case study in the Yongding River basin in China. Int. J. Appl. Earth Obs. Geoinf. 2024, 132, 104027. [Google Scholar] [CrossRef]
  11. MEE. Technical Specification for Investigation and Assessment of National Ecological Status—Ecosystem Quality Assessment. Available online: https://www.mee.gov.cn/ywgz/fgbz/bz/bzwb/stzl/202106/W020210910456717871866.pdf (accessed on 6 June 2025).
  12. Xu, H. A remote sensing urban ecological index and its application. Acta Ecol. Sin. 2013, 33, 7853–7862. (In Chinese) [Google Scholar]
  13. Wang, Z.; Chen, T.; Zhu, D.; Jia, K.; Plaza, A. RSEIFE: A new remote sensing ecological index for simulating the land surface eco-environment. J. Environ. Manag. 2023, 326, 116851. [Google Scholar] [CrossRef] [PubMed]
  14. Tang, Q.; Hua, L.; Tang, J.; Jiang, L.; Wang, Q.; Cao, Y.; Wang, T.; Cai, C. Advancing ecological quality assessment in China: Introducing the ARSEI and identifying key regional drivers. Ecol. Indic. 2024, 163, 112109. [Google Scholar] [CrossRef]
  15. Wang, X.; Nian, Y.; Wang, H.; Chen, J.; Li, K.; Hu, T.; Li, Z. Monitoring of ecological environment changes in open-pit mines on the Loess Plateau from 1990 to 2023 based on RSEI. Ecol. Indic. 2025, 170, 113064. [Google Scholar] [CrossRef]
  16. Zhang, L.; Li, X.; Liu, X.; Lian, Z.; Zhang, G.; Liu, Z.; An, S.; Ren, Y.; Li, Y.; Liu, S. Dynamic monitoring and drivers of ecological environmental quality in the Three-North region, China: Insights based on remote sensing ecological index. Ecol. Inform. 2025, 85, 102936. [Google Scholar] [CrossRef]
  17. Zhang, C.; Wang, Z.; Wang, J.; Ding, X.; Peng, Y. Spatial differentiation of ecological environment quality and the influencing factors in cities within the Beijing–Tianjin–Hebei Region based on LCZ and RSEI. IEEE J. Sel. Top. Appl. Earth Obs. Remote Sens. 2025, 18, 15477–15494. [Google Scholar] [CrossRef]
  18. Lai, J.; Li, J.; Liu, L. Optimization strategies for ecological security pattern based on the Remote Sensing Ecological Index in Yunnan Province, China. Land Degrad. Dev. 2025, 36, 1326–1342. [Google Scholar] [CrossRef]
  19. Liu, P.; Ren, C.; Yu, W.; Ren, H.; Xia, C. Exploring the ecological quality and its drivers based on annual remote sensing ecological index and multisource data in Northeast China. Ecol. Indic. 2023, 154, 110589. [Google Scholar] [CrossRef]
  20. Xu, H.; Mengjie, R.; and Lin, M. Cross-comparison of Landsat-8 and Landsat-9 data: A three-level approach based on underfly images. GISci. Remote Sens. 2024, 61, 2318071. [Google Scholar] [CrossRef]
  21. Duo, L.; Wang, J.; Zhang, F.; Xia, Y.; Xiao, S.; He, B.-J. Assessing the spatiotemporal evolution and drivers of ecological environment quality using an enhanced remote sensing ecological index in Lanzhou City, China. Remote Sens. 2023, 15, 4704. [Google Scholar] [CrossRef]
  22. Bai, T.; Cheng, J.; Zheng, Z.; Zhang, Q.; Li, Z.; Xu, D. Drivers of eco-environmental quality in China from 2000 to 2017. J. Clean. Prod. 2023, 396, 136408. [Google Scholar] [CrossRef]
  23. Yang, X.; Meng, F.; Fu, P.; Zhang, Y.; Liu, Y. Spatiotemporal change and driving factors of the Eco-Environment quality in the Yangtze River Basin from 2001 to 2019. Ecol. Indic. 2021, 131, 108214. [Google Scholar] [CrossRef]
  24. Li, Y.; Tian, H.; Zhang, J.; Lu, S.; Xie, Z.; Shen, W.; Zheng, Z.; Li, M.; Rong, P.; Qin, Y. Detection of spatiotemporal changes in ecological quality in the Chinese mainland: Trends and attributes. Sci. Total Environ. 2023, 884, 163791. [Google Scholar] [CrossRef]
  25. Li, Y.; Li, Z.; Wang, J.; Zeng, H. Analyses of driving factors on the spatial variations in regional eco-environmental quality using two types of species distribution models: A case study of Minjiang River Basin, China. Ecol. Indic. 2022, 139, 108980. [Google Scholar] [CrossRef]
  26. Lv, Y.; Xiu, L.; Yao, X.; Yu, Z.; Huang, X. Spatiotemporal evolution and driving factors analysis of the eco-quality in the Lanxi urban agglomeration. Ecol. Indic. 2023, 156, 111114. [Google Scholar] [CrossRef]
  27. Zhang, Y.; She, J.; Long, X.; Zhang, M. Spatio-temporal evolution and driving factors of eco-environmental quality based on RSEI in Chang-Zhu-Tan metropolitan circle, central China. Ecol. Indic. 2022, 144, 109436. [Google Scholar] [CrossRef]
  28. Gong, C.; Lyu, F.; Wang, Y. Spatiotemporal change and drivers of ecosystem quality in the Loess Plateau based on RSEI: A case study of Shanxi, China. Ecol. Indic. 2023, 155, 111060. [Google Scholar] [CrossRef]
  29. Liu, Y.; Zhang, J. Spatio-temporal evolutionary analysis of surface ecological quality in Pingshuo open-cast mine area, China. Environ. Sci. Pollut. Res. 2024, 31, 7312–7329. [Google Scholar] [CrossRef]
  30. Zhang, S.; Zhou, Y.; Yu, Y.; Li, F.; Zhang, R.; Li, W. Using the geodetector method to characterize the spatiotemporal dynamics of vegetation and its interaction with environmental factors in the Qinba Mountains, China. Remote Sens. 2022, 14, 5794. [Google Scholar] [CrossRef]
  31. Wang, Y.; Liu, H.; Sang, L.; Wang, J. Characterizing forest cover and landscape pattern using multi-source remote sensing data with ensemble learning. Remote Sens. 2022, 14, 5470. [Google Scholar] [CrossRef]
  32. Wang, C.; Liu, Y.; Chen, J.; Yu, C. Turning points of the relationship between human activity and environmental quality in China. Sustain. Cities Soc. 2025, 119, 106123. [Google Scholar] [CrossRef]
  33. Yue, H.; Wang, Z.; Liu, Y. Comprehensive assessment of the ecosystem in Yellow River Basin based on Pattern-Quality-Service Model. Environ. Model. Assess. 2025, 30, 337–348. [Google Scholar] [CrossRef]
  34. Liu, Z.; Dai, E.; Xing, S.; Zhou, L. Two decades of ecological quality evolution along the Sichuan-Tibet Highway: Improvement, localized degradation and grazing intensity dominating changes post-2010. Land Degrad. Dev. 2025, 0, 1–17. [Google Scholar] [CrossRef]
  35. Kerrigan, D.; Barr, B.; Bertini, E. PDPilot: Exploring partial dependence plots through ranking, filtering, and clustering. IEEE Trans. Vis. Comput. Graph. 2025, 1–14. [Google Scholar] [CrossRef]
  36. Xu, H.; Waheed, A.; Kuerban, A.; Muhammad, M.; Aili, A. Dynamic approaches to ecological restoration in China’s mining regions: A scientific review. Ecol. Eng. 2025, 214, 107577. [Google Scholar] [CrossRef]
  37. Mao, Z.; Yu, H.; Liang, W.; Sun, J. Dynamic monitoring of ecological restoration of abandoned mines based on GF-2 remote sensing images- Take Dawukou Ditch of Helan Mountain as an example. Ecol. Eng. 2024, 207, 107304. [Google Scholar] [CrossRef]
  38. Zang, Y.; Wang, K.; Xu, S.; Xiao, W.; Tong, T.; Sun, H.; Li, C. Identification of surface mining and assessment of ecological restoration effects using GEE and Sentinel-2 image data—A case study on Yangtze River watershed, China. Ecol. Eng. 2025, 212, 107525. [Google Scholar] [CrossRef]
  39. Xu, H.; Xu, F.; Lin, T.; Xu, Q.; Yu, P.; Wang, C.; Aili, A.; Zhao, X.; Zhao, W.; Zhang, P.; et al. A systematic review and comprehensive analysis on ecological restoration of mining areas in the arid region of China: Challenge, capability and reconsideration. Ecol. Indic. 2023, 154, 110630. [Google Scholar] [CrossRef]
  40. Li, J.; Tian, Y. Assessment of ecological quality and analysis of influencing factors in coal-bearing hilly areas of northern China: An exploration of human mining and natural topography. Land 2024, 13, 1067. [Google Scholar] [CrossRef]
  41. Dou, S.; Xu, D.; Keenan, R.J. Effect of income, industry structure and environmental regulation on the ecological impacts of mining: An analysis for Guangxi Province in China. J. Clean. Prod. 2023, 400, 136654. [Google Scholar] [CrossRef]
  42. Song, X.; Chen, H.; Chen, T.; Huang, Q.; Deng, S.; Yang, N. Spatial and temporal variations of spring drought in Southwest China and its possible teleconnection with the global climate events. J. Hydrol. Reg. Stud. 2024, 51, 101655. [Google Scholar] [CrossRef]
  43. DNR. Ecological Restoration Plan for Territorial Space of Guangxi Zhuang Autonomous Region (2021–2035). Available online: https://dnr.gxzf.gov.cn/zfxxgk/fdzdgknr/ghjh/ghjh/W020230317555916270160.pdf (accessed on 5 June 2025).
  44. Wang, Q.; Yang, L.; Xu, X.; Santosh, M.; Wang, Y.; Wang, T.; Chen, F.; Wang, R.; Gao, L.; Liu, X.; et al. Multi-stage tectonics and metallogeny associated with Phanerozoic evolution of the South China Block: A holistic perspective from the Youjiang Basin. Earth-Sci. Rev. 2020, 211, 103405. [Google Scholar] [CrossRef]
  45. Liu, X.; Wang, Q.; Zhang, Q.; Yang, S.; Liang, Y.; Zhang, Y.; Li, Y.; Guan, T. Genesis of the Permian karstic Pingguo bauxite deposit, western Guangxi, China. Miner. Depos. 2017, 52, 1031–1048. [Google Scholar] [CrossRef]
  46. Franks, S.; Storey, J.; Rengarajan, R. The new Landsat Collection-2 Digital Elevation Model. Remote Sens. 2020, 12, 3909. [Google Scholar] [CrossRef]
  47. Vermote, E.; Roger, J.-C.; Franch, B.; Skakun, S. LaSRC (Land Surface Reflectance Code): Overview, application and validation using MODIS, VIIRS, LANDSAT and Sentinel 2 data’s. In Proceedings of the IEEE International Geoscience and Remote Sensing Symposium, Valencia, Spain, 22–27 July 2018; pp. 8173–8176. [Google Scholar]
  48. Schmidt, G.; Jenkerson, C.B.; Masek, J.; Vermote, E.; Gao, F. Landsat Ecosystem Disturbance Adaptive Processing System (LEDAPS) Algorithm Description; 2331-1258; U.S. Geological Survey: Reston, VA, USA, 2013; Open-File Report 2013–1057; pp. 1–17. [Google Scholar]
  49. Zhu, Z.; Wang, S.; Woodcock, C.E. Improvement and expansion of the Fmask algorithm: Cloud, cloud shadow, and snow detection for Landsats 4–7, 8, and Sentinel 2 images. Remote Sens. Environ. 2015, 159, 269–277. [Google Scholar] [CrossRef]
  50. RESDC. Resource and Environmental Science Data Platform. Available online: https://www.resdc.cn (accessed on 1 June 2025).
  51. Farr, T.G.; Rosen, P.A.; Caro, E.; Crippen, R.; Duren, R.; Hensley, S.; Kobrick, M.; Paller, M.; Rodriguez, E.; Roth, L. The shuttle radar topography mission. Rev. Geophys. 2007, 45, RG2004. [Google Scholar] [CrossRef]
  52. Yang, J.; Huang, X. The 30 m annual land cover dataset and its dynamics in China from 1990 to 2019. Earth Syst. Sci. Data 2021, 13, 3907–3925. [Google Scholar] [CrossRef]
  53. Kuang, W.; Zhang, S.; Du, G.; Yan, C.; Wu, S.; Li, R.; Lu, D.; Pan, T.; Ning, J.; Guo, C.; et al. Monitoring periodically national land use changes and analyzing their spatiotemporal patterns in China during 2015–2020. J. Geogr. Sci. 2022, 32, 1705–1723. [Google Scholar] [CrossRef]
  54. Hu, X.; Xu, H. A new remote sensing index for assessing the spatial heterogeneity in urban ecological quality: A case from Fuzhou City, China. Ecol. Indic. 2018, 89, 11–21. [Google Scholar] [CrossRef]
  55. Rouse Jr, J.W.; Haas, R.H.; Schell, J.; Deering, D. Monitoring vegetation systems in the Great Plains with ERTS. In Proceedings of the Third Earth Resources Technology Satellite-1 Symposium, Washington, DC, USA, 10–14 December 1973; pp. 309–317. [Google Scholar]
  56. Crist, E.P. A TM Tasseled Cap equivalent transformation for reflectance factor data. Remote Sens. Environ. 1985, 17, 301–306. [Google Scholar] [CrossRef]
  57. Baig, M.H.A.; Zhang, L.; Shuai, T.; Tong, Q. Derivation of a tasselled cap transformation based on Landsat 8 at-satellite reflectance. Remote Sens. Lett. 2014, 5, 423–431. [Google Scholar] [CrossRef]
  58. Xu, H. Modification of normalised difference water index (NDWI) to enhance open water features in remotely sensed imagery. Int. J. Remote Sens. 2006, 27, 3025–3033. [Google Scholar] [CrossRef]
  59. Getis, A.; Ord, J.K. The analysis of spatial association by use of distance statistics. Geogr. Anal. 1992, 24, 189–206. [Google Scholar] [CrossRef]
  60. Anselin, L. Local indicators of spatial association—LISA. Geogr. Anal. 1995, 27, 93–115. [Google Scholar] [CrossRef]
  61. Sen, P.K. Estimates of the regression coefficient based on Kendall’s Tau. J. Am. Stat. Assoc. 1968, 63, 1379–1389. [Google Scholar] [CrossRef]
  62. Mann, H.B. Nonparametric tests against trend. Econometrica 1945, 13, 245–259. [Google Scholar] [CrossRef]
  63. Gong, P.; Liu, H.; Zhang, M.; Li, C.; Wang, J.; Huang, H.; Clinton, N.; Ji, L.; Li, W.; Bai, Y.; et al. Stable classification with limited sample: Transferring a 30-m resolution sample set collected in 2015 to mapping 10-m resolution global land cover in 2017. Sci. Bull. 2019, 64, 370–373. [Google Scholar] [CrossRef]
  64. Liu, H.; Gong, P.; Wang, J.; Clinton, N.; Bai, Y.; Liang, S. Annual dynamics of global land cover and its long-term changes from 1982 to 2015. Earth Syst. Sci. Data 2020, 12, 1217–1243. [Google Scholar] [CrossRef]
  65. Liu, H.; Liao, T.; Wang, Y.; Qian, X.; Liu, X.; Li, C.; Li, S.; Guan, Z.; Zhu, L.; Zhou, X.; et al. Fine-grained wetland classification for national wetland reserves using multi-source remote sensing data and Pixel Information Expert Engine (PIE-Engine). GISci. Remote Sens. 2023, 60, 2286746. [Google Scholar] [CrossRef]
  66. Liu, H.; Wang, Y.; Sang, L.; Zhao, C.; Hu, T.; Liu, H.; Zhang, Z.; Wang, S.; Miao, S.; Ju, Z. Evaluation of spatiotemporal changes in cropland quantity and quality with multi-source remote sensing. Land 2023, 12, 1764. [Google Scholar] [CrossRef]
  67. Mo, J.; Zhou, X.; Mo, W.; Chen, Y. Analysis of vegetation ecological quality change and its driving forces in Guangxi from 2000 to 2020. Guihaia 2024, 44, 907–924. (In Chinese) [Google Scholar] [CrossRef]
  68. Li, J.; Peng, X.; Tang, R.; Geng, J.; Zhang, Z.; Xu, D.; Bai, T. Spatial and temporal variation characteristics of eological environment quality in China from 2002 to 2019 and influencing factors. Land 2024, 13, 110. [Google Scholar] [CrossRef]
  69. Zhang, W.; Liu, Z.; Qin, K.; Dai, S.; Lu, H.; Lu, M.; Ji, J.; Yang, Z.; Chen, C.; Jia, P. Long-term dynamic monitoring and driving force analysis of eco-environmental quality in China. Remote Sens. 2024, 16, 1028. [Google Scholar] [CrossRef]
  70. Gong, X.; Li, T.; Wang, R.; Hu, S.; Yuan, S. Beyond the Remote Sensing Ecological Index: A comprehensive ecological quality evaluation using a deep-learning-based Remote Sensing Ecological Index. Remote Sens. 2025, 17, 558. [Google Scholar] [CrossRef]
  71. Xu, H.; Lin, M.; Wang, Y.; Guan, H.; Tang, F. Quantitatively exploring the influence of geographical conditions on ecological quality using a novel remote sensing model: A comparison between two geographical disparity regions in China. Geo Spat. Inf. Sci. 2024, 28, 849–866. [Google Scholar] [CrossRef]
  72. Zhang, C.; Zeren, Z.; Li, J.; Zheng, H.; Raval, S.; Ding, Y.; Ma, Y. An index-based approach to evaluate ecological environment in various surface coal mines using Google Earth Engine. J. Clean. Prod. 2025, 490, 144746. [Google Scholar] [CrossRef]
  73. Liu, H.; Gong, P.; Wang, J.; Wang, X.; Ning, G.; Xu, B. Production of global daily seamless data cubes and quantification of global land cover change from 1985 to 2020—iMap World 1.0. Remote Sens. Environ. 2021, 258, 112364. [Google Scholar] [CrossRef]
  74. Wang, S.; Ma, C.; Ma, Y.; Li, T. Monitoring and evaluation of ecological restoration in open-pit coal mine using remote sensing data based on a OM-RSEI model. Int. J. Min. Reclam. Environ. 2025, 1–23. [Google Scholar] [CrossRef]
  75. Jiang, S.; Sweet, L.-b.; Blougouras, G.; Brenning, A.; Li, W.; Reichstein, M.; Denzler, J.; Shangguan, W.; Yu, G.; Huang, F.; et al. How interpretable machine learning can benefit process understanding in the geosciences. Earth’s Future 2024, 12, e2024EF004540. [Google Scholar] [CrossRef]
  76. Pichler, M.; Hartig, F. Machine learning and deep learning—A review for ecologists. Methods Ecol. Evol. 2023, 14, 994–1016. [Google Scholar] [CrossRef]
  77. Wen, C.; Long, T.; He, G.; Jiao, W.; Jiang, W. Temporally enhanced RSEI and nighttime lights reveal long-term ecological changes and effective protection in China’s inaugural national parks. Ecol. Indic. 2025, 170, 112981. [Google Scholar] [CrossRef]
  78. Liu, X.; Ruibo, C.; Lijuan, H.; Rundong, L.; Shuhong, M.; Chanling, P.; Jiaxing, C.; and Zhou, G. Ecological quality assessment of large-scale regions using RSEI improved with YTT temperature rectification. Int. J. Remote Sens. 2025, 46, 4274–4294. [Google Scholar] [CrossRef]
  79. Peng, J.; Hu, T.; Xu, D.; Xu, Z.; Zheng, H.; Lin, Y.; Wang, Y.; Dong, J.; Liu, Y. Land ecology for achieving China’s ecological civilization: Key issues and frontier topics. Sci. Bull. 2025, 70, 1910–1914. [Google Scholar] [CrossRef] [PubMed]
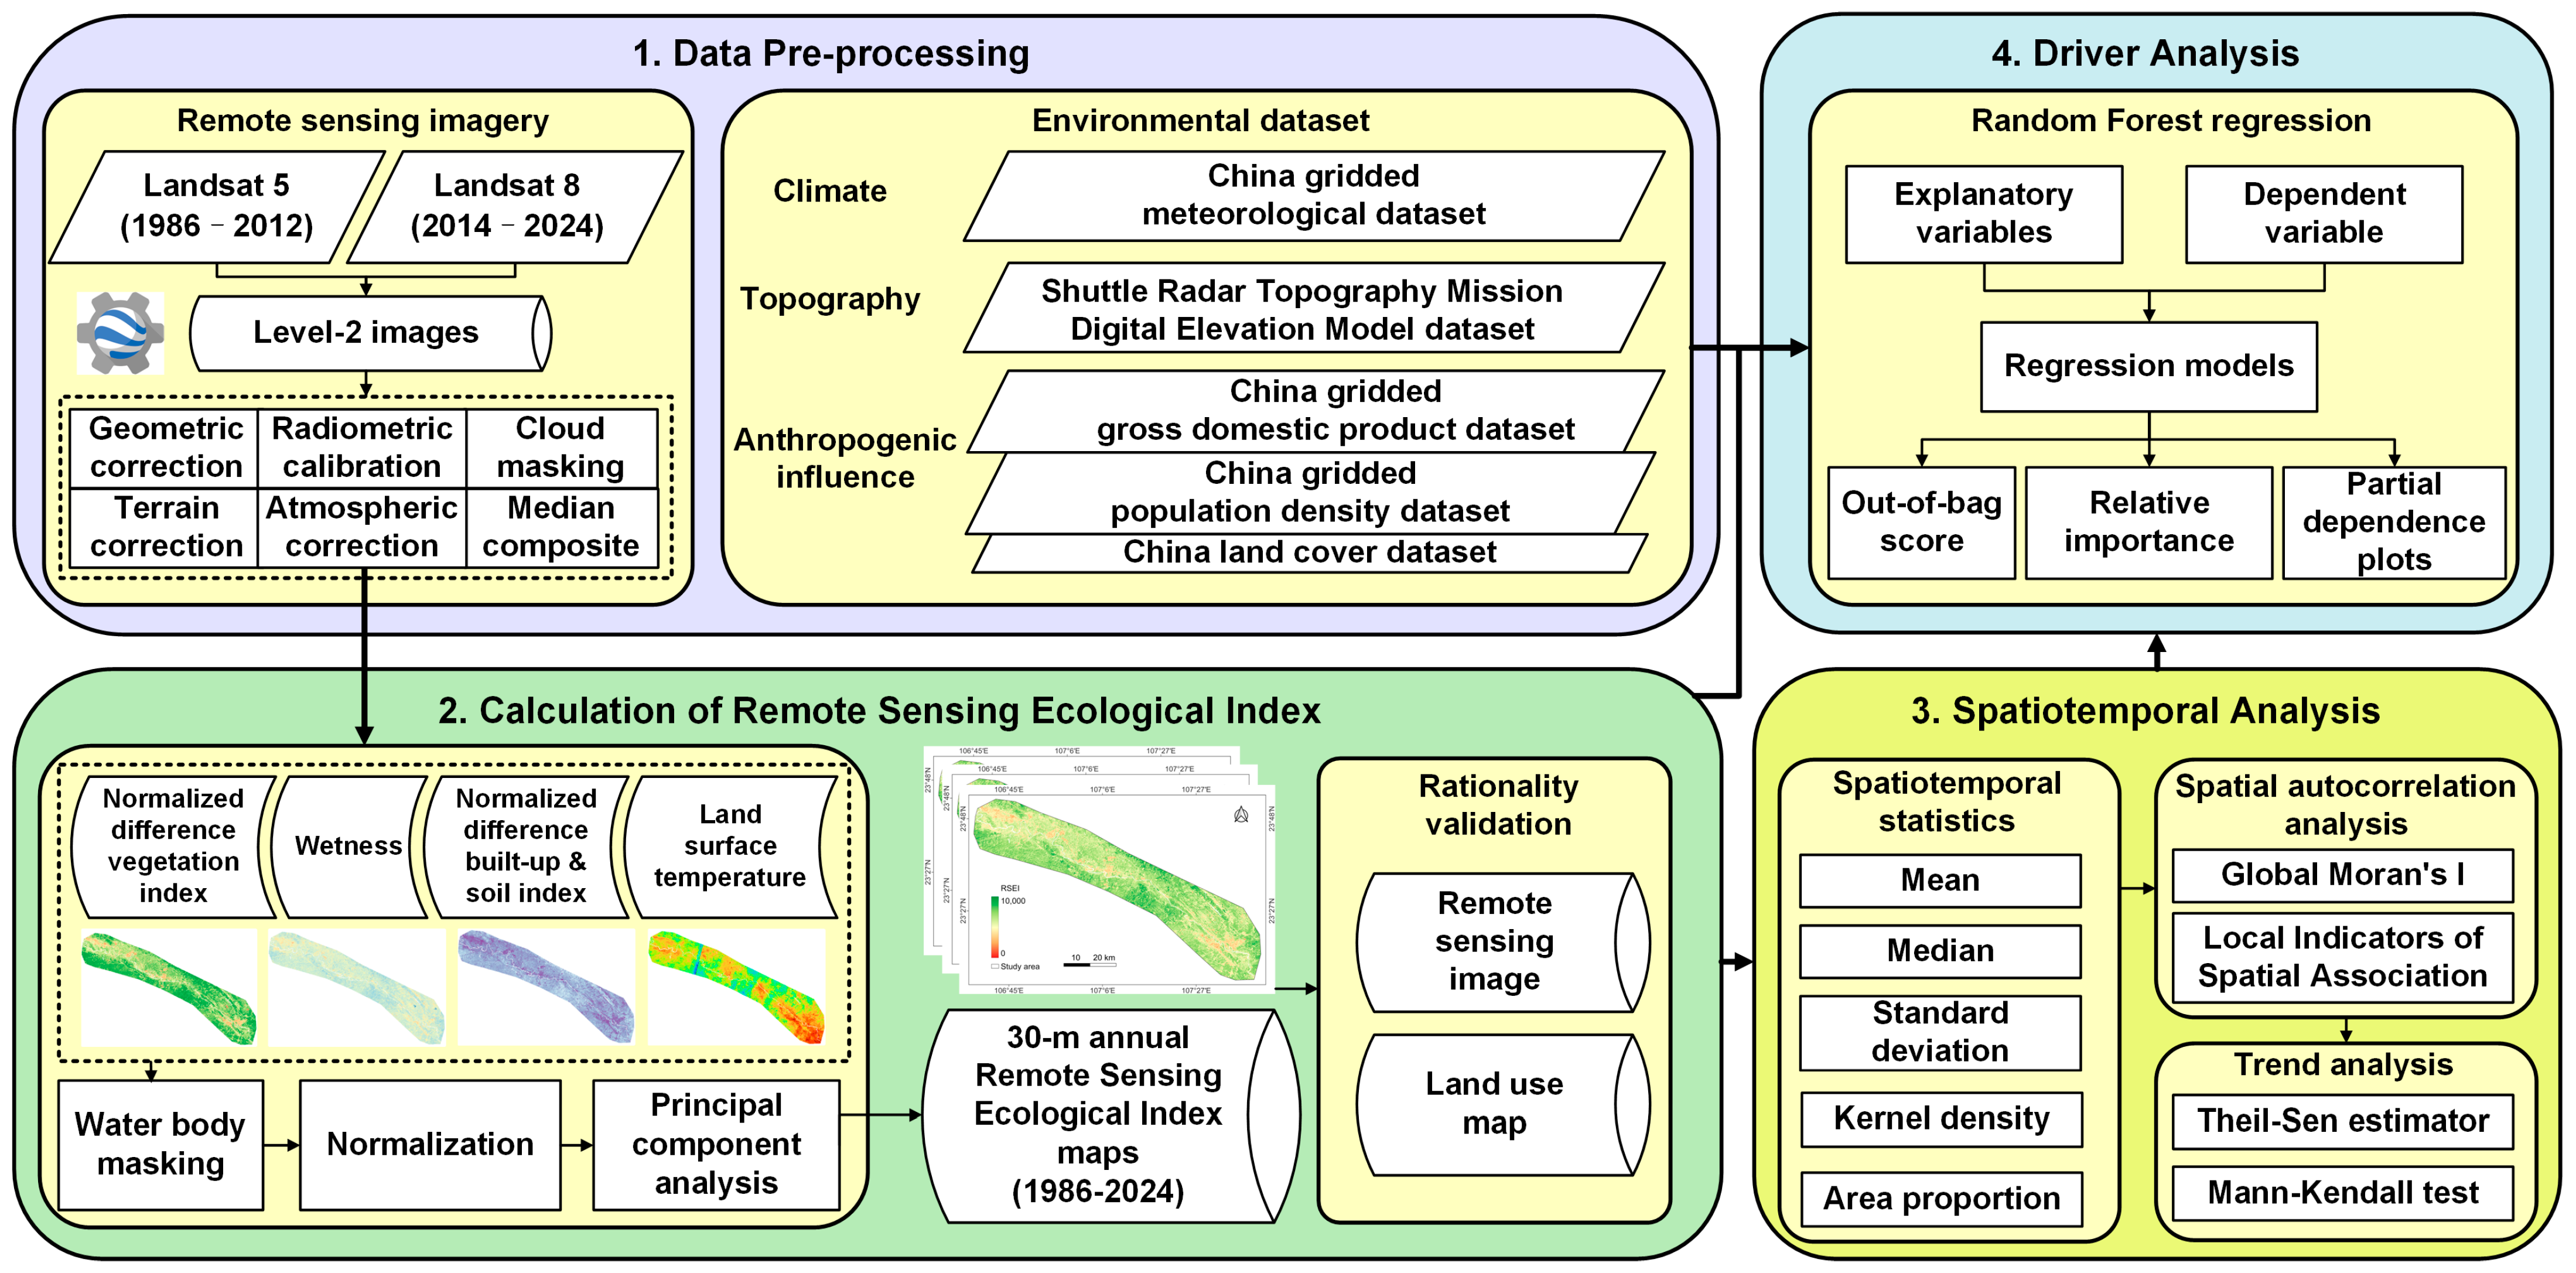
Figure 1. Overall framework of this study.
Land 14 01708 g001
Figure 2. Location of Youjiang River Valley in Guangxi Province, China (source: [43]).
Land 14 01708 g002
Figure 3. Contribution of four ecological indicators to PC1 from 1986 to 2024.
Land 14 01708 g003
Figure 4. Remote sensing imagery and ecological condition of Youjiang River Valley in 2023. (a) Landsat median composite image; (b) land use map; (c) RSEI map; (d) RSEI distribution across land use classes.
Land 14 01708 g004
Figure 5. Annual RSEI statistics for Youjiang River Valley 1986–2024.
Land 14 01708 g005
Figure 6. Interannual changes of area proportions of RSEI levels in Youjiang River Valley from 1986 to 2024.
Land 14 01708 g006
Figure 7. Spatial distribution of RSEI levels in Youjiang River Valley from 1986 to 2024.
Land 14 01708 g007
Figure 8. Global spatial autocorrelation of RSEI in Youjiang River Valley 1986–2024. (a) Global Moran’s I trend; Moran scatter plots in (b) 1986, (c) 1995, (d) 2005, (e) 2015, (f) 2024.
Land 14 01708 g008
Figure 9. LISA cluster maps of RSEI in Youjiang River Valley 1986–2024.
Land 14 01708 g009
Figure 10. Spatial distribution of significant spatiotemporal trends of RSEI in Youjiang River Valley.
Land 14 01708 g010
Figure 11. Relative importance of variables influencing RSEI.
Land 14 01708 g011
Figure 12. Response curves of RSEI to explanatory variables. (a) TEM; (b) PRE; (c) SSD; (d) ELE; (e) SLO; (f) ASP; (g) PD; (h) GDP; (i) LUI.
Land 14 01708 g012
Figure 13. Variation of RSEI in mining areas and buffer zones.
Land 14 01708 g013
Figure 14. Effect of spatial scale on the performance of regression models.
Land 14 01708 g014
Table 1. List of datasets used.
Data TypeVariableDatasetProviderSpatial ResolutionTemporal Range
Multispectral imageryRSEILandsat Level-2 SR and LST image collectionUSGS30 m1986–2011, 2013–2024
ClimateTEMChina gridded meteorological datasetRESDC1 km1990/2000/
2010/2020
PRE
SSD
TopographyELESRTM DEMNASA30 m2000
SLO
ASP
Anthropogenic influenceGDPChina gridded GDP datasetRESDC1 km1990/2000/
2010/2020
PDChina gridded PD dataset
LUICLCDWuhan University30 m1990–2023
Table 2. Area proportion of RSEI change trends in Youjiang River Valley from 1986 to 2024.
PeriodArea Proportion (%)
Significant Decreasing Trend (p < 0.05)Non-Significant Decreasing Trend (p ≥ 0.05)No TrendNon-Significant Increasing Trend (p ≥ 0.05)Significant Increasing Trend (p < 0.05)
1986–20249.1117.240.0624.8848.71
1986–19950.5421.630.0965.6312.11
1995–20054.8146.500.1344.703.86
2005–20151.5631.540.0958.408.40
2015–20240.7614.290.0658.1226.76
Disclaimer/Publisher’s Note: The statements, opinions and data contained in all publications are solely those of the individual author(s) and contributor(s) and not of MDPI and/or the editor(s). MDPI and/or the editor(s) disclaim responsibility for any injury to people or property resulting from any ideas, methods, instructions or products referred to in the content.