Article

A New Perspective on Functional Zoning by Integrating Coupling Coordination Analysis of Ecological Environment and Urbanization Level: A Case Study of Inner Mongolia

1
Department of Computer Science and Artificial Intelligence, Beijing Technology and Business University, Beijing 100048, China
2
Institute of Geographic Sciences and Natural Resources Research, Chinese Academy of Sciences, Beijing 100101, China
3
Inner Mongolia Institute of Monitoring and Planning for Forestry and Grassland, Inner Mongolia Key Lab of Remote Sensing for Grassland, Hohhot 010020, China
4
College of Resources and Environmental Economics, Inner Mongolia University of Finance and Economics, Hohhot 010070, China
*
Authors to whom correspondence should be addressed.
Land 2025, 14(8), 1692; https://doi.org/10.3390/land14081692
Submission received: 21 July 2025 / Revised: 13 August 2025 / Accepted: 18 August 2025 / Published: 21 August 2025

Abstract

Rapid urbanization intensifies disturbances to the ecological environment, underscoring the urgent need for effective strategies to guide regional development towards sustainability. Functional zoning offers a promising approach to address this challenge. However, in eco-fragile regions, functional zoning has often failed to incorporate the spatially explicit coupling coordination degree (CCD) between ecological environment and urbanization level. Taking Inner Mongolia as a case study, this study evaluated the spatial coordination between these two systems by leveraging geographic big data. Functional zones were then delineated using the K-means clustering method, incorporating the geospatial relationships between ecological environment and urbanization level. Results revealed significant geospatial heterogeneity in both ecological environment and urbanization level. Ecological environment generally declined from east to west, while urbanization was generally low throughout the region. Substantial variations in CCD were observed, with the global Moran’s I value confirming a significant spatial clustering pattern. Based on the findings above, five functional zones were identified, with the urbanization promotion zone as the dominant one. This study provides a valuable reference for regional pattern optimization and sustainable development of social-ecological systems.

1. Introduction

Coordination between socio-economic development and ecosystem protection is greatly responsible for the achievement of Sustainable Development Goals (SDGs) [1,2,3,4,5]. One significant characteristic of socio-economic development is urbanization [6]. However, this process has a complex relationship with the ecological environment, as they are interdependent and mutually reinforcing [7,8]. This means that urbanization can both positively and negatively impact the ecological environment, and simultaneously, the state of ecological environment can either facilitate or hinder urban development. For example, a negative impact manifests when urban expansion often encroaches on ecological spaces, leading to the fragmentation and degradation of natural habitats. However, active measures, implemented alongside urbanization processes, such as dynamic monitoring, the designation of ecological redlines, and ecological restoration, aim to protect the ecological environment. On the other hand, high ecological environment can support the sustainable development of urbanization by providing functions such as climate regulation and air purification, which help mitigate issues like urban heat islands and air pollution [9]. Conversely, a degraded ecological environment may lead to desertification, which hinders the process of urbanization. Therefore, implementing zone-based policies based on the complex interaction between urbanization level and ecological environment has become a pressing concern.
The past 40 years have witnessed rapid urbanization in China, sparked by the reform and opening up policy of the late 1970s [10]. The level of urbanization is reflected by a region’s population, land use, and socio-economic conditions [11]. To better understand these complex aspects, researchers have developed specific indicator systems that incorporate demographic, economic, social, and spatial dimensions [12,13]. However, previous studies on urbanization that incorporate geographic big data remained limited. Geographic big data, such as nighttime light data, points of interest (POI) data, and social media data, capture the vitality characteristic of human activities and serve as important indicators of the urbanization process. As human activities interact with service facilities across both virtual and physical realms [14], geographic big data offer new insights into the dynamics of urbanization. In light of this broadened perspective, this study leveraged geographic big data and proposed a multi-dimensional urbanization indicator comprising population, economic, and social dimensions to provide a more comprehensive understanding of urbanization.
Assessing ecological environment is a crucial approach for gaining insights into the ecosystem and alleviating ecological issues [15]. Assessment frameworks for ecological environment such as the “resistance–adaptation–restoration” model, the “pressure–state–response” (PSR) model and the “driver–pressure–state–impact–response” (DPSIR) model are prominent. Based on these frameworks, the index-based approach, which incorporates a suite of social-ecological indicators, has become the predominant method for quantifying the ecological environment in current efforts [16,17]. With the help of the index-based approach, previous studies have aimed to reveal patterns of ecological environment at multiple scales, ranging from the national and city scale to the county and grid scale, mainly focusing on the spatiotemporal characteristics, the driving factors, as well as the spatial relationship between urbanization and ecological environment [7,15,18].
Coupling coordination degree (CCD) is widely accepted as a key indicator for quantifying spatial relationship within various coupled systems. Based on CCD, there is growing interest in revealing the interactions between different systems. To date, studies exploring the coordination between urbanization and the ecological environment have produced substantial findings [11,19,20], including analyses of CCD between urbanization and ecological environment at multiple scales and using diverse data sources [8,18]. These studies have made significant contributions to the coordinated development of the socio-economic and ecological systems in tandem with China’s ongoing urbanization. However, studies on the coupling coordination between ecological environment and urbanization level in eco-fragile regions remain limited. These regions possess unique ecosystems that, if damaged by urbanization, may suffer irreversible consequences.
Functional zoning enables policymakers and scientists to formulate protection strategies and construction plans based on the ecological characteristics and issues of each region. For instance, Yunnan Province has been divided into five ecological zones based on the ecological network [21]. Similarly, the Anhui section of the water and soil conservation functional area in the Dabie Mountains of China was classified into four types of functional zones by calculating ecosystem service value and landscape ecological risk [22]. However, previous functional zoning documents were mainly based on the status of ecological environment, paying little attention to the CCD between ecological environment and urbanization level.
Located in China’s drylands, Inner Mongolia is a typical eco-fragile region, playing a crucial role in constructing the ecological security barrier for China and even the broader Asia region [23]. The demand for sustainable development is growing as the ecological security barrier is being constructed in China. Thus, this study first assessed ecological environment and urbanization level with the help of the multiple geographic big data and entropy weight method (EWM) at the county scale. Next, the spatially explicit relationship between ecological environment and urbanization level was analyzed using the CCD model and Moran’s I. Then, comprehensive functional zoning was conducted based on the above analysis by using the K-means clustering method. Finally, this study proposed suggestions for promoting high-quality development based on the result of the functional zoning. These findings offered an in-depth understanding of functional zoning with consideration of CCD between ecological environment and urbanization level and served as valuable references for sustainable development in eco-fragile regions globally.

2. Materials and Methods

2.1. Study Area

Inner Mongolia Autonomous Region, located in North China (97°12′–126°04′ E, 37°24′–53°23′ N), is a typical eco-fragile region in global drylands (Figure 1). It covers 1.18 × 10⁶ km2 with an average altitude of 1000 m. The climate of this study area is primarily characterized by a temperate continental monsoon climate. Due to the spatial heterogeneity of topography and climate, different ecosystems distribute from northeast to southwest. At high altitude in the northeast, forests are the dominant ecosystem. The grassland ecosystem is mainly concentrated in the central part. It is the largest terrestrial ecosystem in Inner Mongolia, accounting for 73.26% of the total study area [24]. The western part of this region is covered predominantly by barren land. Inner Mongolia comprises 12 prefecture-level divisions, including 102 counties. In 2020, the total population of Inner Mongolia was 24.05 million inhabitants, and the total GDP reached 1735.98 billion yuan. The long-term high evaporation and scare precipitation make the ecosystems in Inner Mongolia relatively vulnerable. In addition, under the influence of population explosion and growing urbanization, severe ecological crises have been caused in Inner Mongolia. Therefore, it is of great significance to conduct functional zoning and make sustainable suggestions based on the spatially explicit relationship between ecological environment and urbanization level in the study area.

2.2. Data Collection and Preprocessing

This study assessed the ecological environment and urbanization level by using various types of data, covering land use data, meteorology data, topography data (i.e., DEM), satellite-derived NDVI data, POI data, social media check-in data, PM 2.5 data, nighttime light data, CO2 emission data, transport network (mainly railways and highways) data, population, and GDP data. All data for the year 2020 were obtained. Additionally, all data were unified to the same projection system with a spatial resolution of 1 km, by method of bilinear interpolation. The specific information of all data was listed in Table 1.

2.3. Methods

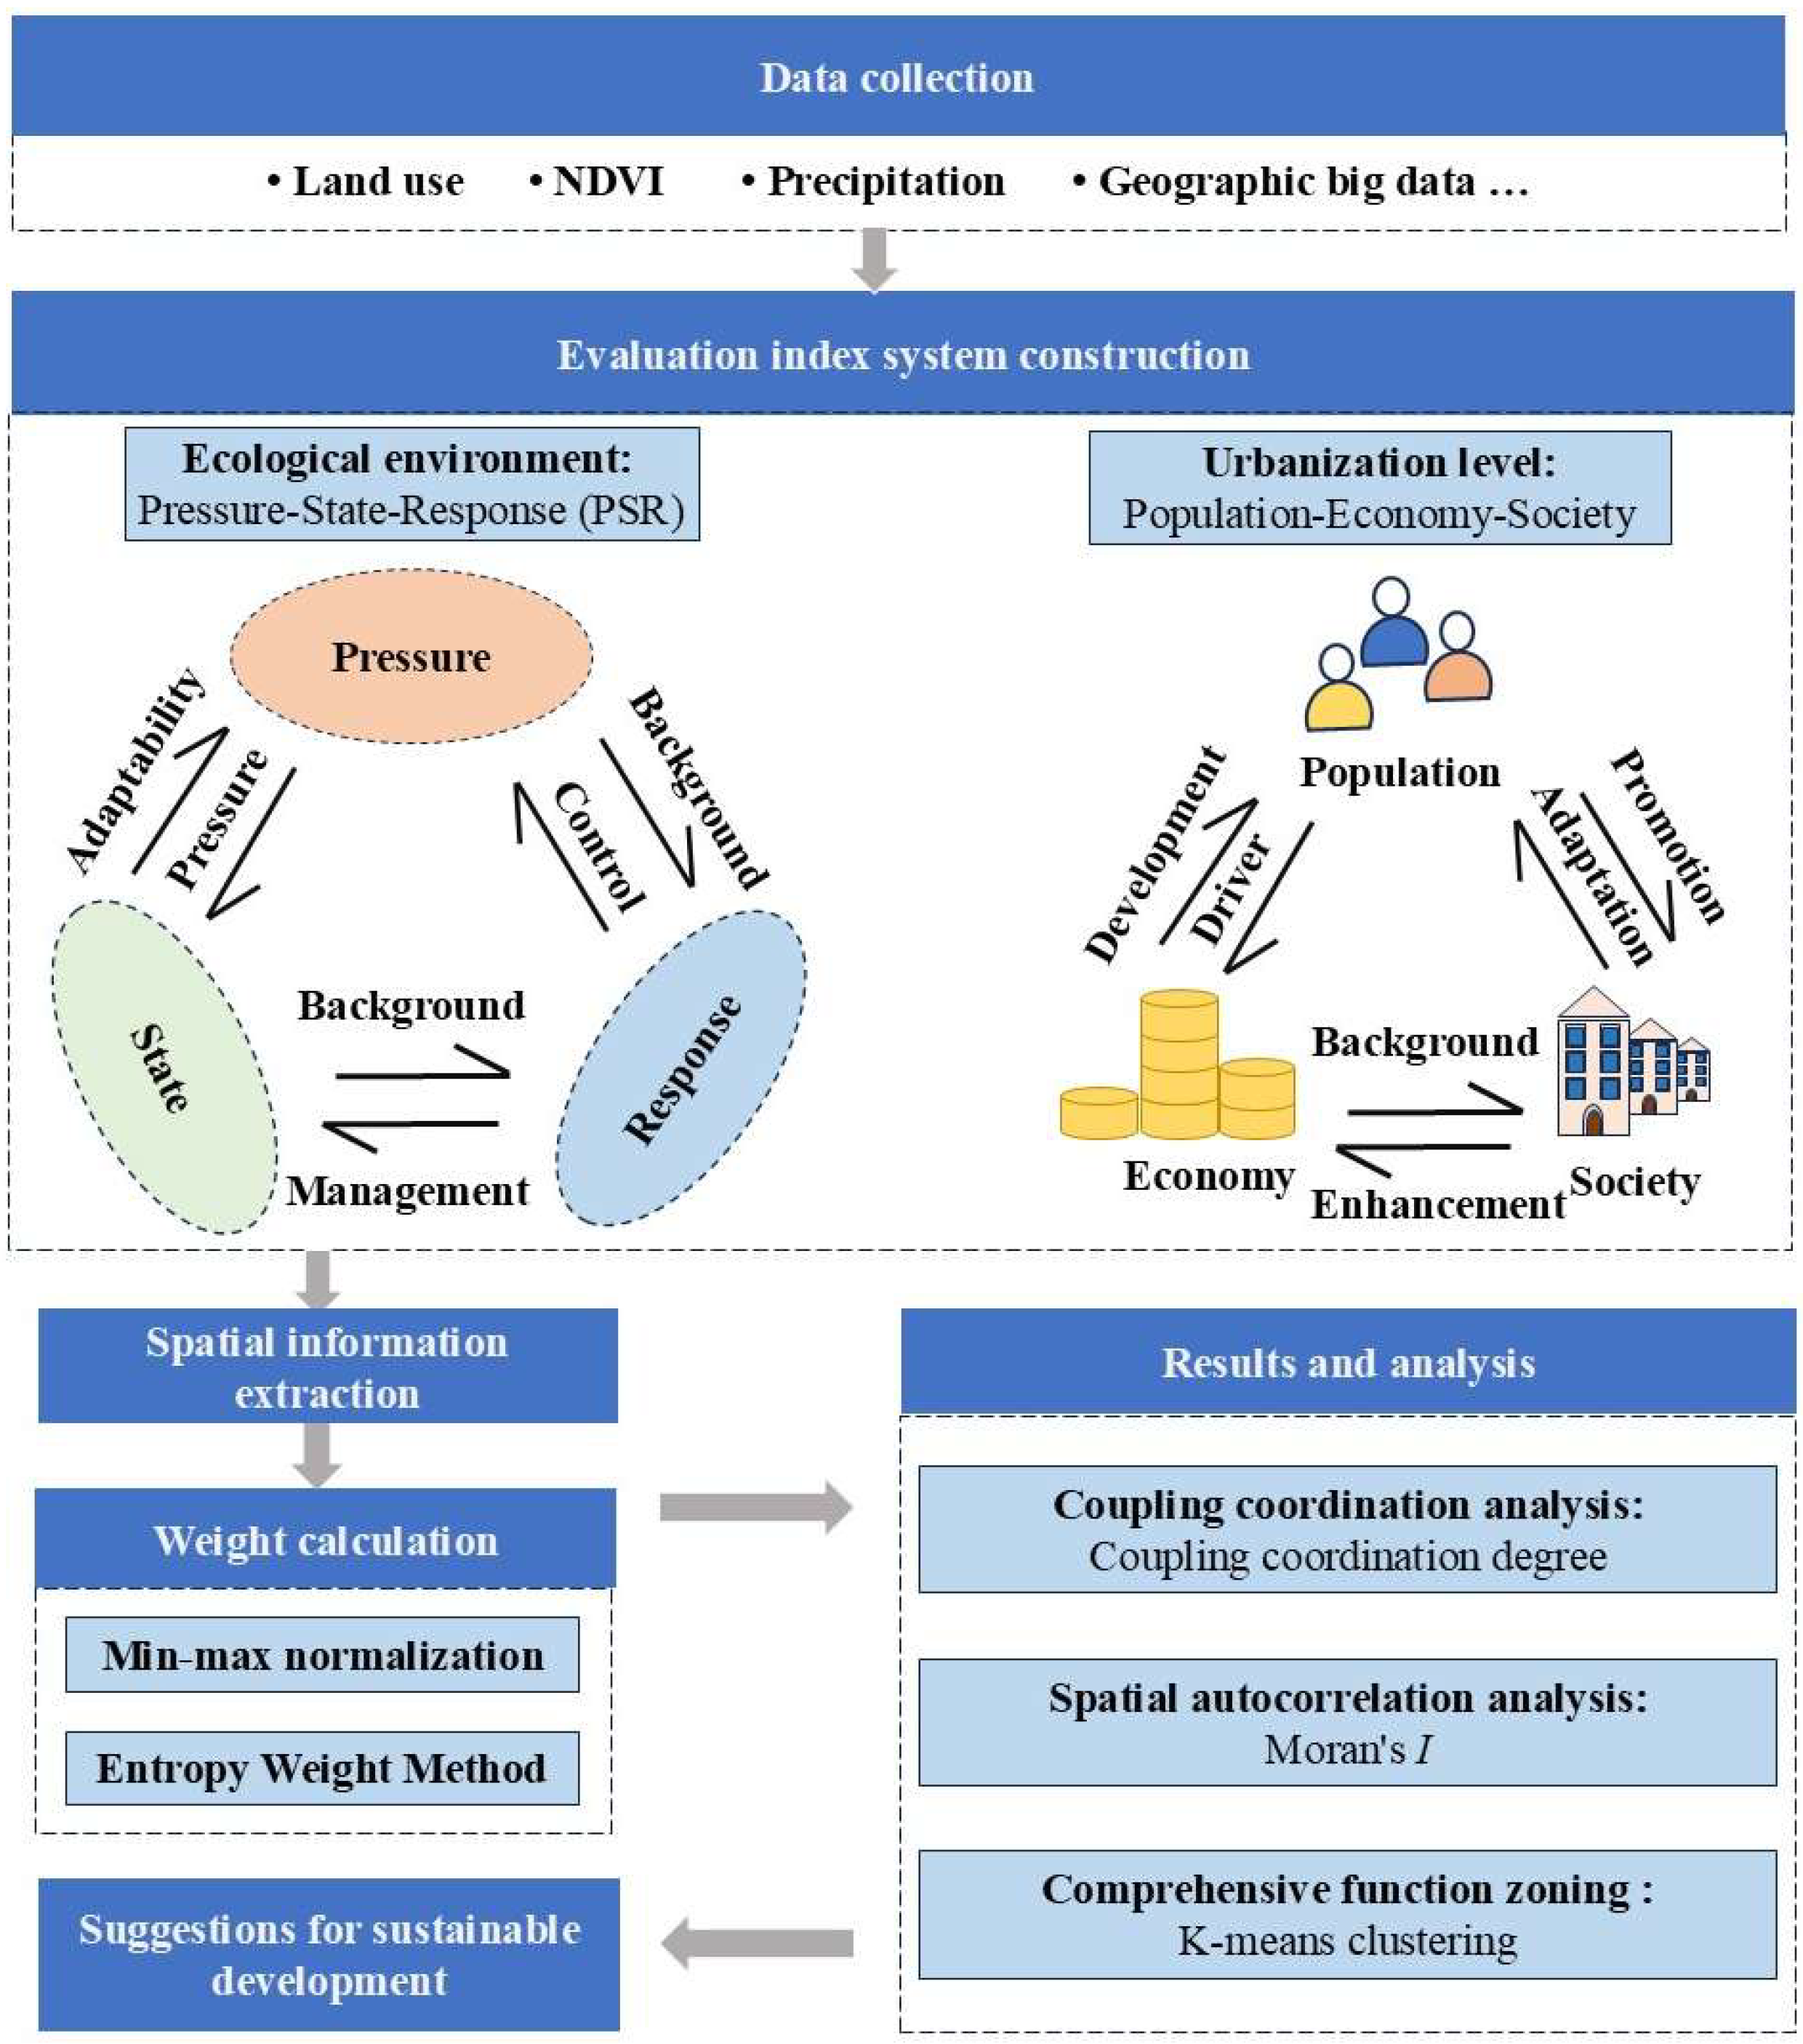
The objective of this study was to evaluate the ecological environment and urbanization level, to identify their spatially explicit relationship, and to delineate functional zones, with the goal of promoting win–win sustainable development in Inner Mongolia. Figure 2 provided a flowchart visualizing the research process. Data collection was the first step. Following data collection, evaluation index systems were initially constructed. Subsequently, all pertinent variables were extracted into discrete evaluation units, specifically county units. Each unit contained not only the requisite attribute information but also showed the spatial relationship between the unit and the acquired geodata. Then, the weight of each variable was calculated using the entropy weight method. Next, the coupling coordination degree and Moran’s I were calculated. Using the natural breaks method in ArcGIS, the quantified coupling coordination degree was classified into six groups, with high-value groups designated as coordination and low-value groups as incoordination. Finally, the comprehensive functional zoning was conducted based on the above analysis, using the K-means clustering method. Suggestions for regional sustainable development were proposed.

2.3.1. Quantification of Ecological Environment and Urbanization Level

(1)
Construction of Evaluation Index System
Two separate evaluation index systems were constructed for ecological environment (Table 2) and urbanization level (Table 3), based on existing studies and data availability.
This study used the PSR model to build a comprehensive and systematic ecological environment evaluation index system. Proposed in the 1980s by the Organization for Economic Cooperation and Development and the UN Environment Programme, the PSR model has gained widespread acceptance in the field of ecological and environmental studies. Compared to other models, PSR model strives to exhibit clearer causal correlations [25]. This model effectively demonstrates the interactions between indicators from three categories, which are derived from the internal logical relationship of “why it happened, what the consequences were, and how the issues should be addressed”. Pressure was conceptualized as the degree of influence from human activities and climate change [26]. State was defined as the condition corresponding to the pressure exerted by human activities and climate change. Response was characterized as the capacity to adapt to and mitigate the negative effects of climate change and human intervention, as well as the ability to provide sustainable ecological and environmental protection [27]. In this study, pressure was defined by socio-ecological factors, including evapotranspiration, precipitation, temperature, PM 2.5, percentage of barren land area, CO2 emission, and number of livestock. In eco-fragile regions, vegetation conditions are governed by a delicate balance between water availability and environmental stress. Generally, increased precipitation positively influences vegetation by enhancing water availability, which is frequently the most critical limiting factor for growth. However, this positive effect is counteracted by a suite of negative factors. Higher evapotranspiration and rising temperatures intensify water loss, creating physiological stress for plants. Concurrently, anthropogenic activities and pollution, including greater CO2 emissions, increased PM 2.5 concentrations, and a higher number of livestock, contribute to environmental degradation. Finally, land use changes, represented by an expansion in the percentage of barren land area, directly reduce vegetation cover and exacerbate land vulnerability. State was primarily influenced by the percentage of forest area, percentage of grassland area, NDVI, and elevation. The positive contributions of forest and grassland coverage, along with a higher NDVI, collectively underscore the critical role of robust vegetation cover in maintaining a favorable ecological environmental state. These factors are intrinsically linked, reflecting a synergistic enhancement of ecosystem health. On the other hand, the identified negative relationship with elevation highlights a significant environmental gradient, where increasing altitude is associated with a decline in ecological environmental state. Response was discretized based on the percentage of ecological conservation redline area and the GDP percentage from the tertiary industry. Both indicators were assigned a positive influence on the response. The percentage of ecological conservation redline area is a direct measure of conservation efforts and habitat preservation, where a larger area under protection is intrinsically linked to better ecological environmental outcomes. Concurrently, the GDP percentage from the tertiary industry serves as a proxy for economic structure optimization; a higher proportion indicates a reduced reliance on environmentally intensive sectors like manufacturing and agriculture, thus promoting a more harmonious relationship between socio-economic and ecological systems. Ecological environment was evaluated using the pressure, state, and response framework at the county level.
The urbanization level evaluation index system was established from the population and socio-economic perspectives. Data on population, GDP, nighttime light, kernel density of POI, and check-in data, percentage of build-up land area, transport network area, and cropland area were used to define the extent and characteristics of urbanization. Accordingly, all indicators—encompassing population, GDP, nighttime light, POI, and check-in density, and the percentages of build-up and transport land—were assigned a positive influence on urbanization, as they collectively represent the agglomeration of people, the vitality of the economy, the intensity of social activity, and the physical expansion of the built environment. The sole exception was the percentage of cropland area, which was assigned a negative influence due to its characteristic displacement by urban expansion, marking the core land-use transformation of the urbanization process.
Table 2. Evaluation index system of ecological environment.
DimensionIndicatorIndicator TypeJustification
PressureEvapotranspirationNegative[26,28]
PrecipitationPositive
TemperatureNegative
PM 2.5Negative
Percentage of barren land areaNegative
CO2 emissionNegative
Number of livestockNegative
StatePercentage of forest areaPositive[28,29]
Percentage of grassland areaPositive
NDVIPositive
ElevationNegative
ResponsePercentage of ecological conservation redline areaPositive[30,31]
GDP percentage from the tertiary industry Positive
Table 3. Evaluation index system of urbanization level.
DimensionIndicatorIndicator TypeJustification
PopulationPopulationPositive[32]
EconomyGDP Positive[8,28]
Nighttime lightPositive
SocietyKernel density of POIPositive[10,29]
Kernel density of check-in dataPositive
Percentage of build-up land areaPositive
Percentage of transport network areaPositive
Percentage of cropland areaNegative
(2)
Weight Calculating Based on the Entropy Weight Method
EWM is an objective weighting method, as the weights are determined solely by the indicators. This method provides exceptional reliability and effectiveness to avoid uncertainties introduced by subjective experience and preference. Therefore, EWM was adopted in our study to determine the weight of each indicator.
To enable a standardized comparison of all data, the original data are firstly normalized within the interval [0, 1] using Formulas (1) and (2). These formulas are given as follows:
I i j = I i j I m i n I m a x I m i n
I i j = I m a x I i j I m a x I m i n
where I i j and I i j represent the standardized and original values of the indicator i in the assessment unit j , respectively; I m i n and I m a x represent the minimum and maximum values of the indicator i , respectively. Formula 1 is used for positive indicators, while formula 2 is employed for negative indicators.
Then, weight determination steps are listed as Formulas (3)–(5). EWM calculates an entropy value, with smaller values indicating a greater weight for the index and vice versa.
P i j = I i j j = 1 n I i j
H i = 1 l n n j = 1 n P i j l n P i j
W j = 1 H i m i = 1 m H i
where P i j is the proportion of indicator i in assessment unit j ; n and m represent the count of assessment units and the count of indicators, respectively; H i and W j represent the entropy and the weight of indicator j .

2.3.2. Coupling Coordination Analysis

The CCD model is widely adopted to quantify the extent of interaction and the level of coupling among different systems [33,34]. In this study, the CCD model was adopted to calculate the degree of the interactions between ecological environment and urbanization level. The formulas are listed as follows:
C = U 1 × U 2 / U 1 + U 2 / 2 2
T = α U 1 + β U 2
D = C × T
where C , U 1 , and U 2 represent the coupling degree, ecological environment index and urbanization level index, respectively; T is the coordination degree; α and β refer to the coefficients of the two systems; D is the coupling coordination degree between ecological environment and urbanization level. Due to the equal importance of the two systems in terms of their contribution to the degree of coordination, and in line with previous studies, the coefficients for the two systems were assigned the same weight, i.e., α = β = 0.5. The values of D can be categorized into the following types based on the method of natural breaks (Table 4). The ratio of U 1 to U 2 is used to determine the degree of development lag between two systems [35].

2.3.3. Spatial Autocorrelation Analysis

The spatial autocorrelation, which reflects the interdependence and heterogeneity of data, can be measured using Moran’s I. This study employed the global Moran’s I to identify the presence of spatial correlations for CCD and employed the local Moran’s I to reveal the spatial variations in CCD across the study area. The range of global Moran’s I is from −1 to 1. A positive value represents a positive correlation, with more positive correlation and stronger spatial clustering as the value increases. Conversely, a negative value means a negative spatial correlation, where the more negative the value, the stronger the spatial dispersion or difference. Zero implies no spatial correlation, indicating a random distribution of the spatial units. The calculations are listed as follows:
I = n i = 1 n j = 1 n w i j ( x i x ¯ ) ( x j x ¯ ) i = 1 n ( x i x ¯ ) 2 i = 1 n j = 1 n w i j
I i = n x i x ¯ j = 1 n w i j x j x ¯ i = 1 n ( x i x ¯ ) 2
x ¯ = 1 n i = 1 n x i
where I and I i represent global and local Moran’s I, respectively; n and w i j are the number of spatial units and the weight matrix, respectively; x i and x j are the attribute value of spatial unit i and j , respectively; x ¯ is the mean value of all spatial units. The pseudo-significance of the spatial correlation was set at the 1% level using 999 randomization permutations. The results of local Moran’s I can be categorized into five types: low-low (LL), high-high (HH), high-low (HL), low-high (LH), and insignificant (IG). Local Moran’s I was visualized by the map for local indicators of spatial association (LISA map). In this study, Moran’s I was quantified by Geoda software (version 1.20.0.36).

2.3.4. Clustering Analysis

This study employed the K-means clustering method to perform comprehensive functional zoning. The indicator values, organized into a matrix at the county scale, formed the input data for K-means clustering. Using this matrix, the observations were grouped into k distinct clusters. When determining the number of clusters, it is essential to adhere to three key principles: mutual exclusivity of observations across clusters, an appropriate number of clusters, and well-defined cluster types. The objective of K-means clustering is to partition observations into a predefined number of clusters to achieve high intra-cluster similarity and low inter-cluster similarity. This ensures that observations within the same cluster exhibit higher similarity to each other than to observations in other clusters. Each observation is assigned to only one cluster, specifically the cluster with the nearest centroid. This method has been widely adopted in studies of functional zoning and spatial patterns owing to the distinct, mutually exclusive, and interpretable clusters its forms [36,37,38]. The calculations are listed as follows:
d x , c = t = 1 m ( x t c t ) 2
where d x , c is the Euclidean distance between sample x and clustering center c ; x t and c t represent the t -th attribute of sample x and clustering center c , respectively; m is the number of m -dimensional attributes. In this study, the number of clusters was determined using the elbow method, which is a widely used approach for identifying the optimal number of clusters in K-means clustering.

3. Results

3.1. Spatial Patterns of Ecological Environment and Urbanization Level

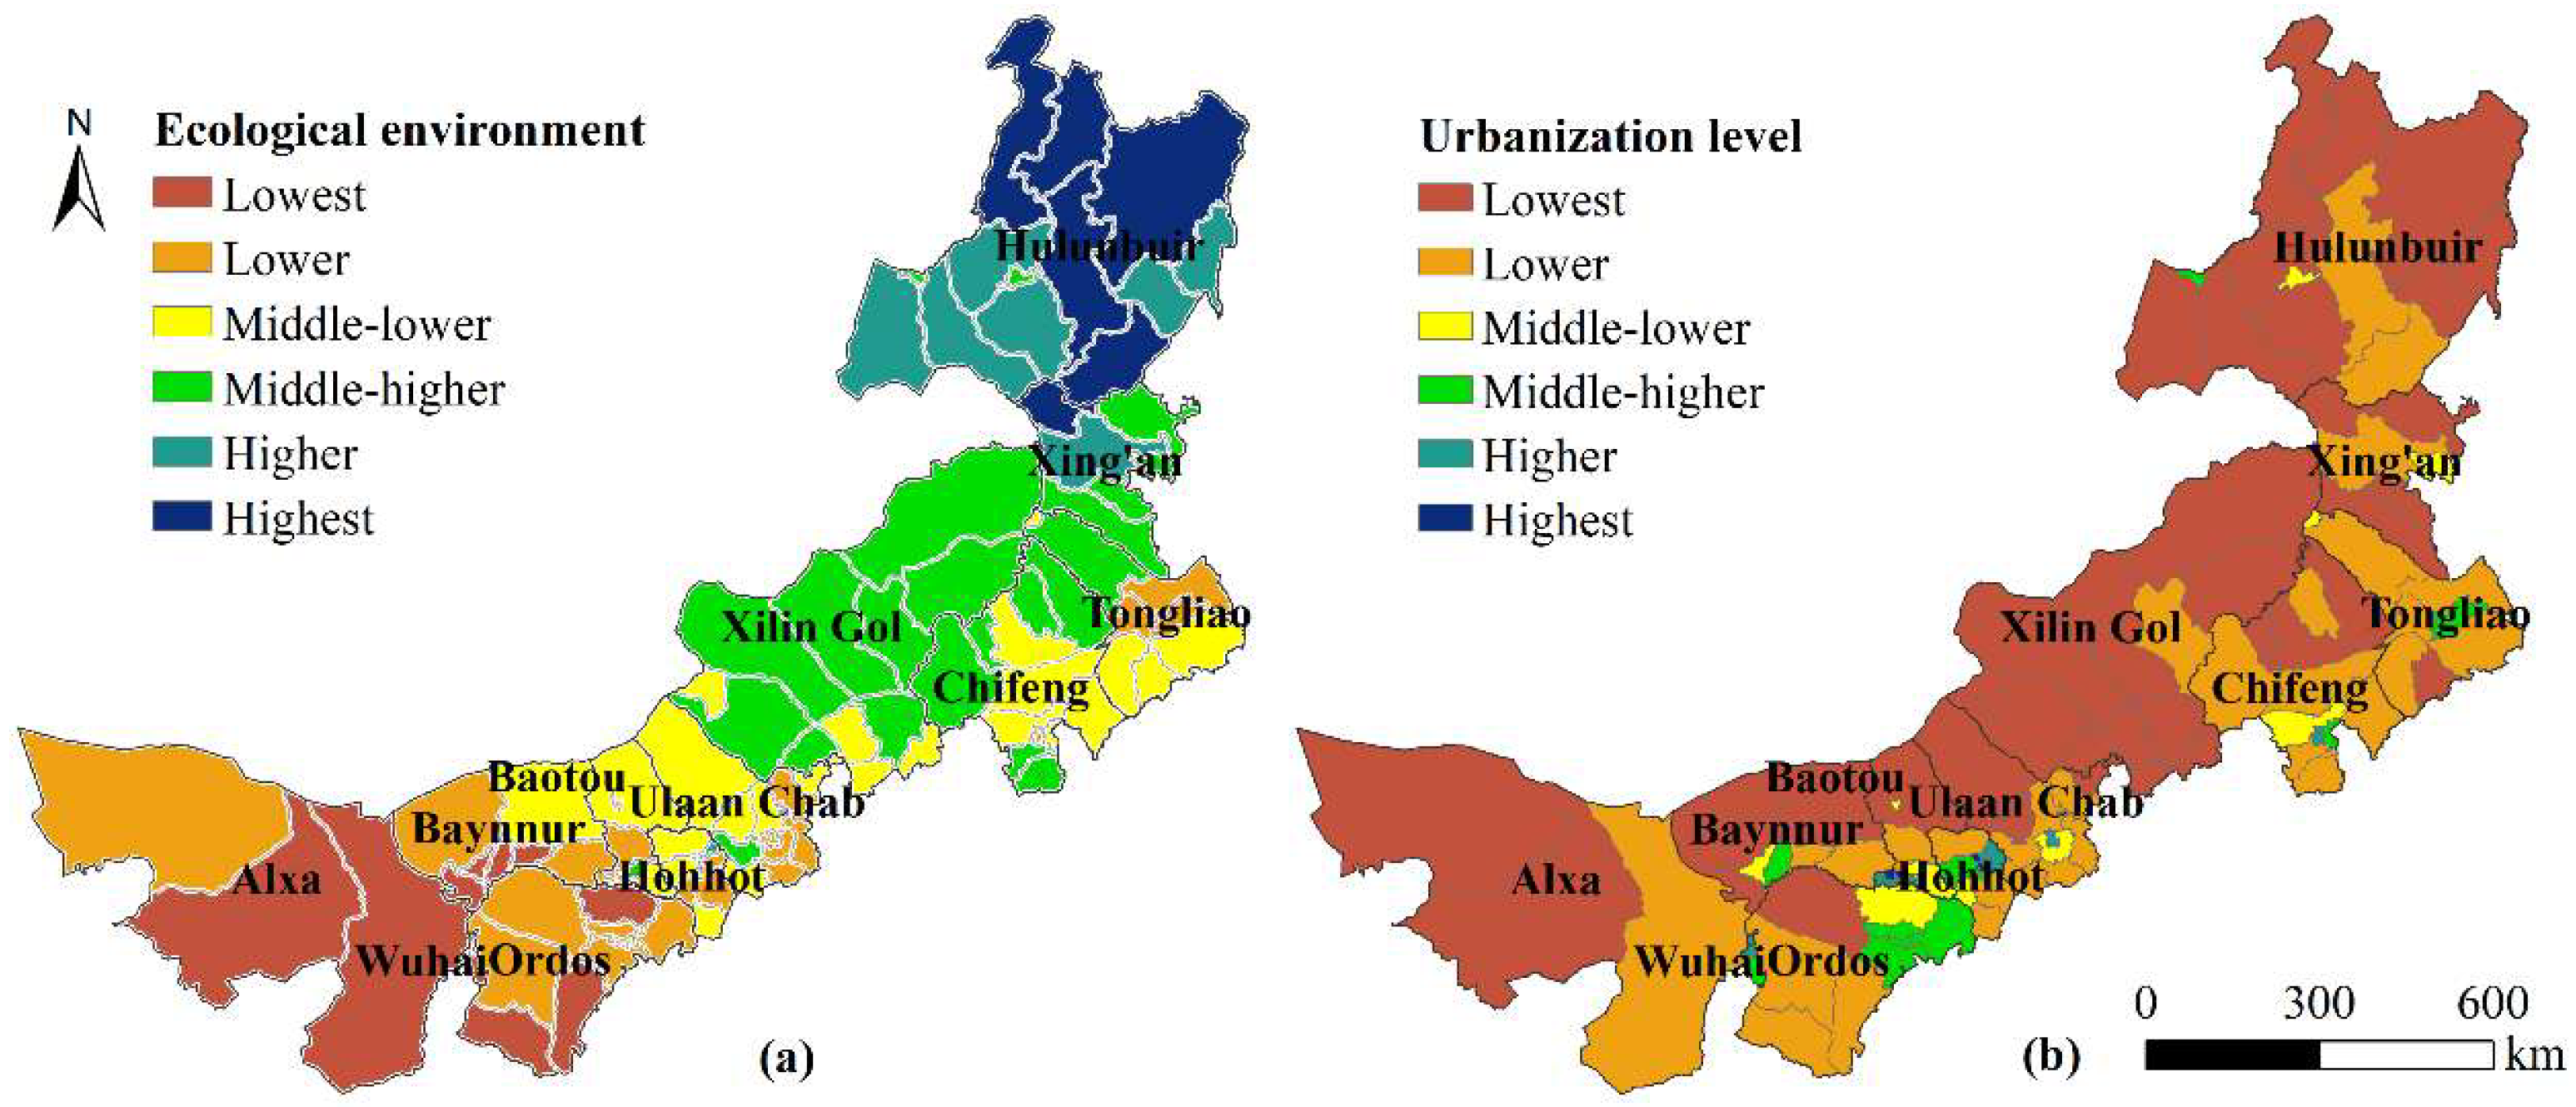
Figure 3 depicts the spatial distribution of the ecological environment (Figure 3a) and urbanization level (Figure 3b) within Inner Mongolia. The results were categorized into six groups using natural breaks in ArcGIS. As shown in Figure 3a, lower ecological environment category was the most prevalent, observed in 27 counties (26.47% of 102 total). The subsequent middle-lower ecological environment category covered 24 counties (23.53%), followed by middle-higher ecological environment category (23 counties, 22.55%) and the lowest ecological environment category (13 counties, 12.75%). A relatively low number of counties exhibited higher and highest ecological environment values, specifically nine (8.82%) and six (5.88%) counties, respectively. In general, counties with high ecological environment (highest, higher, and middle-higher categories) accounted for 37.25% of the total, whereas those with low ecological environment (lowest, lower, and middle-lower categories) accounted for 62.75%.
Counties exhibiting the highest ecological environment were found in Hulunbuir, primarily centralized in the mountainous regions covered with dense forest and high precipitation. Areas with higher ecological environment were mainly scattered around the counties with the highest ecological environment values in the northeastern part of the study area. Counties characterized by a middle-higher ecological environment were predominantly found in Xing’an, Tongliao, Chifeng, and Hulunbuir. The middle-lower ecological environment regions were largely observed in the southeastern plain and the western grassland. Lower and lowest ecological environment counties were mainly located in the western parts of the study area. Overall, the eastern counties had higher ecological environment than the western counties.
As shown in Figure 3b, the lowest urbanization category included 38 counties, representing 37.25% of the total. The subsequent category was the lower category, found in 31 (30.39%) counties. A total of 11 counties (10.78%) fell into middle-lower urbanization category, and 10 counties (9.82%) were classified as middle-higher urbanization. Both the higher and highest urbanization categories had fewer than 10 counties, specifically eight (7.84%) and four (3.92%) counties, respectively. Overall, counties with high urbanization level (highest, higher, and middle-higher categories) accounted for 21.58% of the total, whereas those with low urbanization level (lowest, lower, and middle-lower categories) accounted for 78.42%.
Counties with the highest urbanization values, observed in Hohhot and Baotou, exhibited denser POI and social media check-in data, as well as higher nighttime light, compared to other regions. Counties with higher urbanization were mainly concentrated around these highest urbanization regions. Counties characterized by middle-higher urbanization were scattered around the study area, observed in Hulunbuir, Tongliao, Chifeng, Hohhot, Ordos, Baynnuer, and Wuhai. Middle-lower and lower urbanization categories were largely found surrounding the highest, higher, and middle-higher urbanization regions. Counties with the lowest urbanization category were widely distributed throughout Inner Mongolia, except for Hohhot and Wuhai.

3.2. Spatial Variations in Coupling Coordination Degree

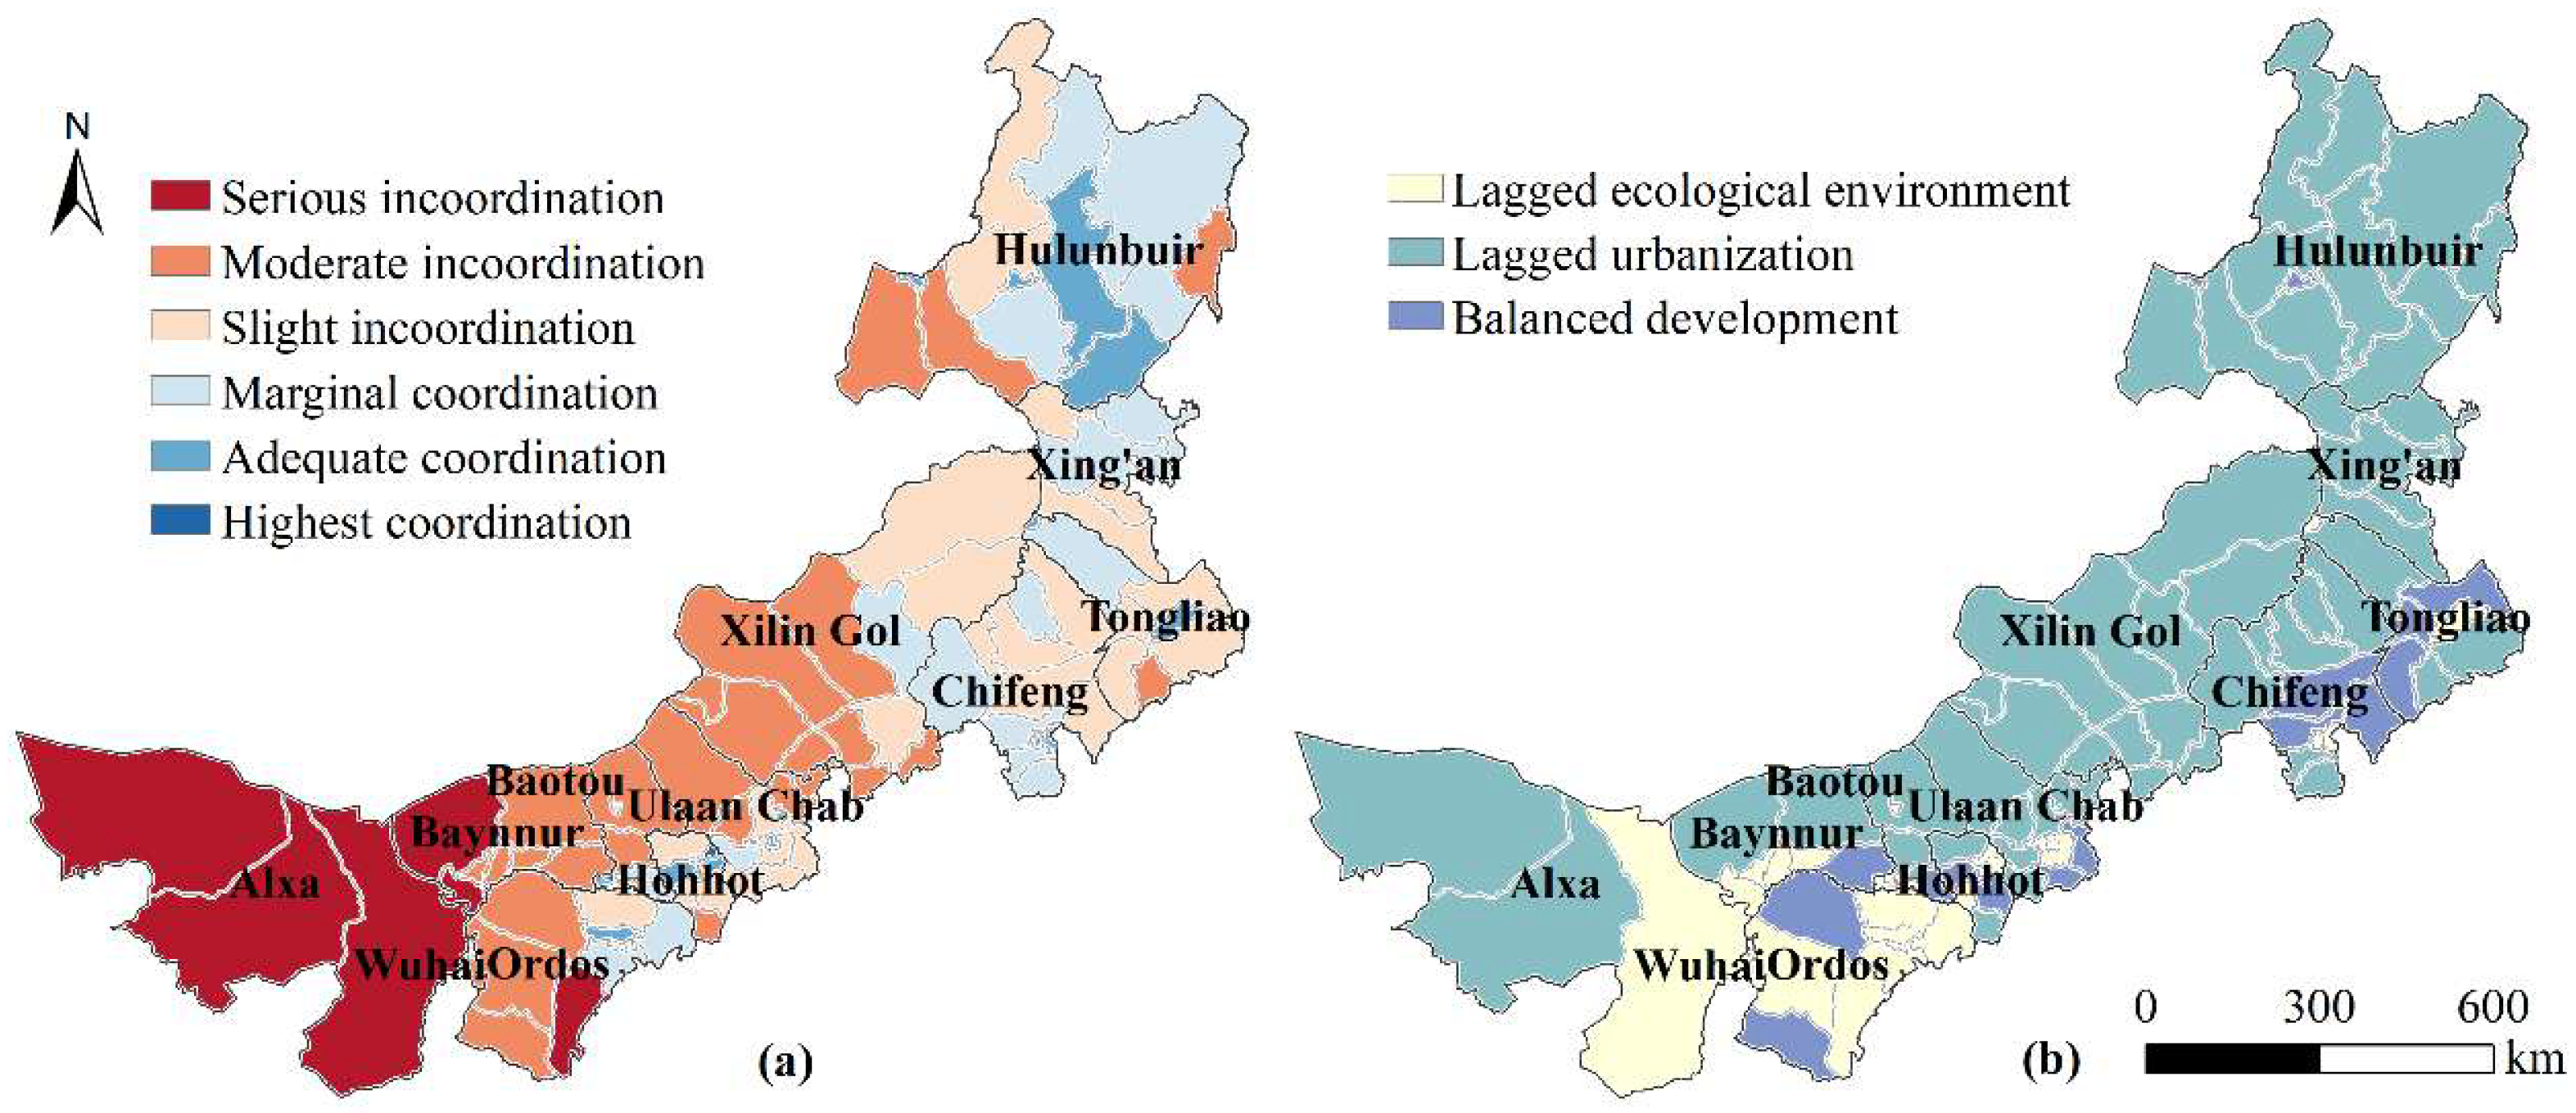
This study further analyzed the spatial variation in CCD (Figure 4a) and its corresponding characteristic (Figure 4b) between ecological environment and urbanization level in Inner Mongolia. Overall, the differences in CCD across the study area were significant. Of the 102 counties, only 3.92% were categorized as having the highest coordination, and they were mainly located in the most developed counties in Hohhot and Baotou. These counties were all characterized by lagged ecological environment. Counties with adequate coordination made up 14.71% of the 102 counties, displaying a relatively dispersed distribution pattern. These counties were largely distinguished by lagged ecological environment, while fewer were categorized into lagged urbanization and balanced development. Counties with marginal coordination, accounting for 21.57% of the total, were primarily distributed in counties of Hulunbuir, Xing’an, Tongliao, Xilin Gol, Chifeng, Ulaan Chab, Baotou, Ordos, and Wuhai. These counties were mainly characterized by lagged urbanization, with fewer instances of lagged ecological environment and balanced development. Coordination categories accounted for 40.20% of the 102 counties.
More than a quarter (25.49%) of the 102 counties exhibited slight incoordination, often geographically close to counties with marginal coordination. Most of these counties were categorized as having lagged urbanization, while fewer were classified as having lagged ecological environment or balanced development. Counties exhibiting moderate incoordination constituted 28.43% of the total and were predominantly clustered in the center of the study area. These counties were largely categorized as having lagged urbanization. Few belonged to the lagged ecological environment type, and even fewer exhibited balanced development. Counties with serious incoordination accounted for 5.88% of the total, mainly distributed in western Inner Mongolia. Among them, lagged ecological environment and lagged urbanization each accounted for half. Incoordination categories constituted 59.80% of the 102 counties in total.
A majority (53.92%) of the 102 counties exhibited lagged urbanization. Counties experiencing lagged ecological environment comprised 30.39% of the total and were primarily located in the western counties of the study area. Those with balanced development, mainly found in the southern parts of the study area, made up 15.69% of the total. These counties were located in Hulunuir, Tongliao, Chifeng, Ulaan Chab, Hohhot, Baotou, Baynnur, and Ordos.

3.3. Spatial Autocorrelation Analysis of Coupling Coordination Degree

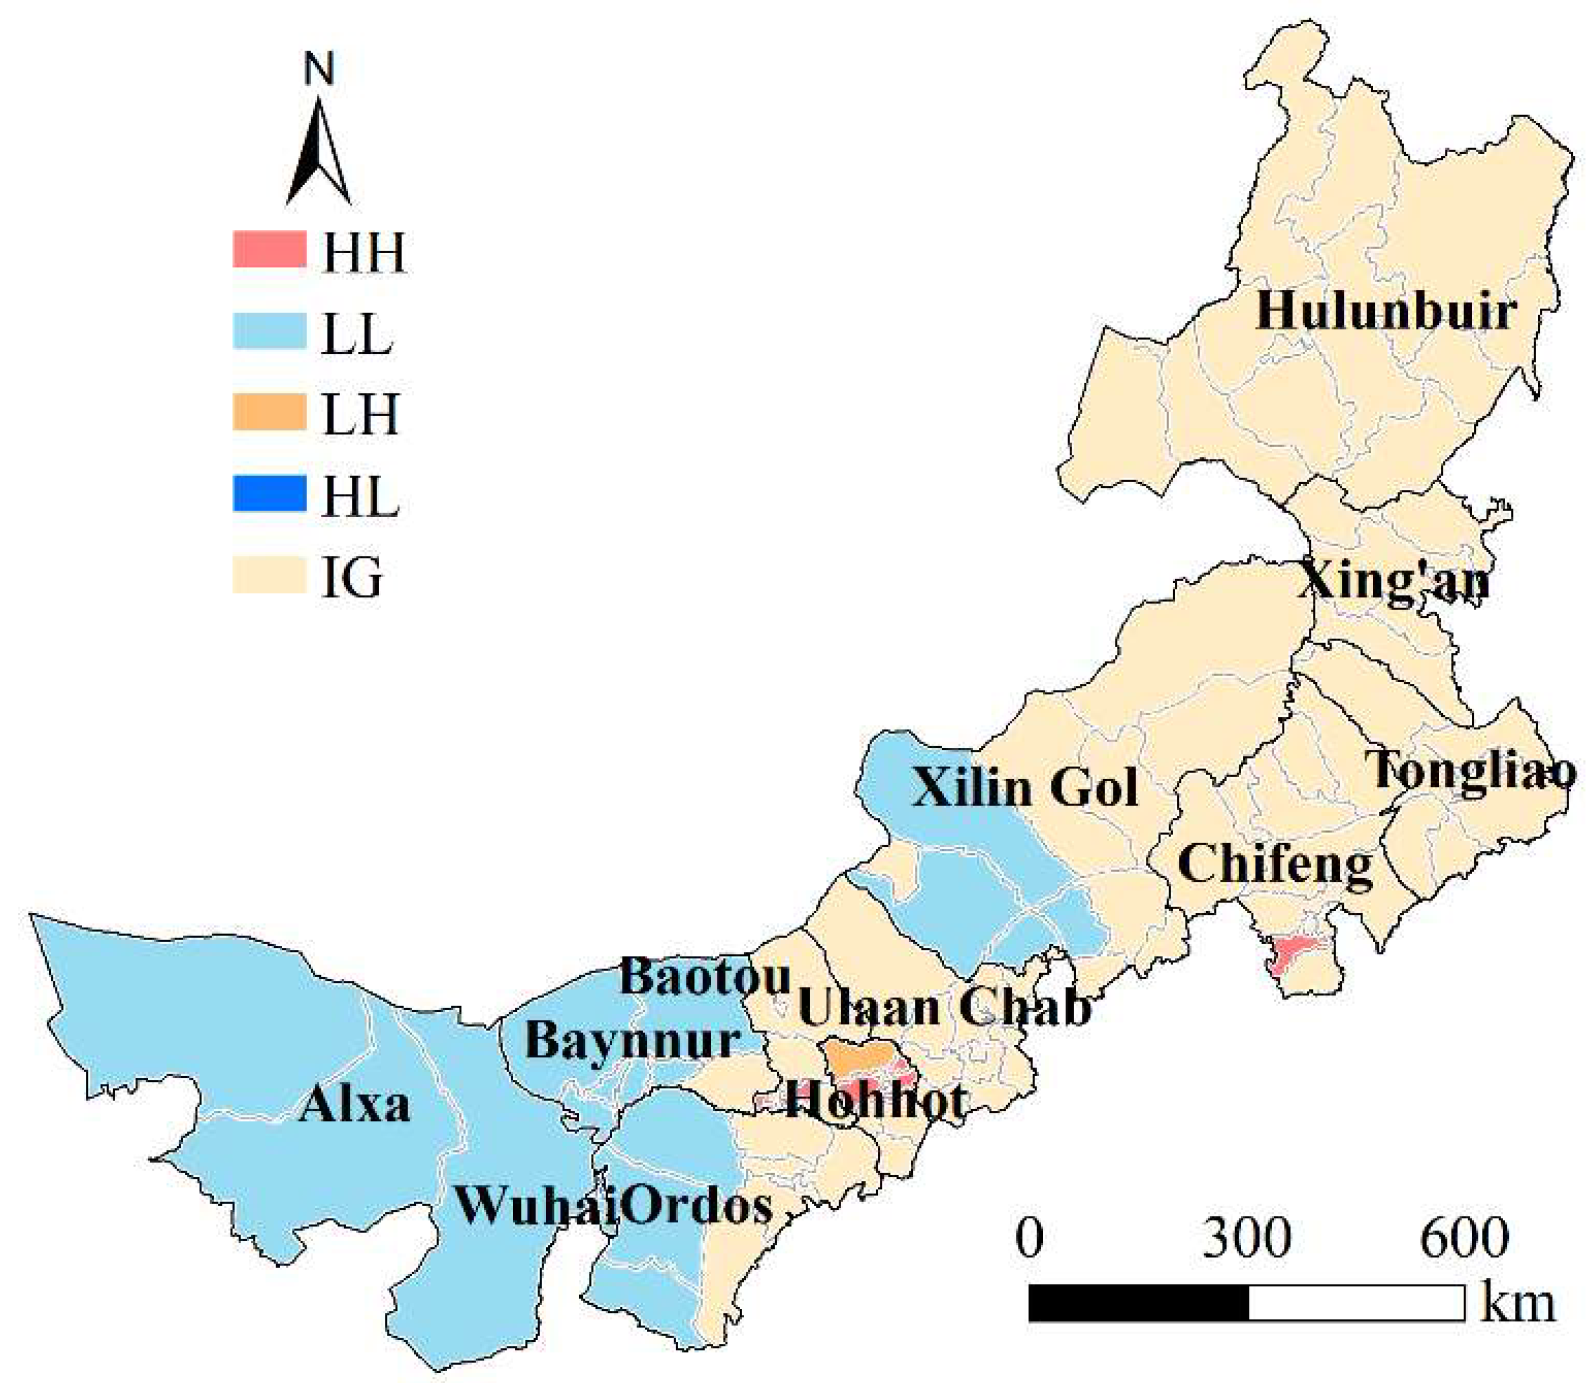
The global Moran’s I value for CCD was 0.470, with a corresponding p-value of 0.001, suggesting a significant positive spatial autocorrelation for CCD between ecological environment and urbanization level. The positive value indicated CCD in the study area exhibited a spatial clustering pattern. The LISA map (Figure 5) revealed four distinct spatial correlation patterns of CCD.
The HH regions, characterized by high CCD values surrounded by other high values, were predominantly observed in counties of Chifeng, Hohhot, and Baotou. These counties accounted for 9.8% of the total counties. The LL regions, where low CCD values were grouped together, were mainly found in counties of Xinlin Gol, Baynnur, Ordos, Wuhai, and Alxa, accounting for 17.65% of the total counties. Within the LL regions, the counties of Baynnur, Ordos, Wuhai, and Alxa shared similar natural conditions, characterized by low precipitation and sparse vegetation cover. The LH clusters, with low CCD values surrounded by high values, were distributed around the HH clusters in Hohhot and accounted for only 0.98% of the total counties. The HL clusters, where high CCD values were surrounded by low values, were in Wuhai and accounted for only 0.98% of the total counties. The characteristics of spatial agglomeration were not significant in other counties.

3.4. Comprehensive Functional Zoning

By applying the K-means clustering method, five functional zones, namely the ecological restoration zone, ecological protection zone, ecological control zone, core urbanization zone, and urbanization promotion zone, were designated according to indicators including CCD, urbanization level, ecological environment, and the proportions of forest, grassland, and barren land. As shown in Figure 6, the ecological restoration zone, characterized by serious incoordination, were observed in the western barren land. A total of 5.88% of the total 102 counties fell into this zone, mainly found in Alxa, Baynnur, and Ordos. Counties of the urbanization promotion zone had higher urbanization compared with the northern parts. This zone contains the highest number of counties, 50% of the total. Counties of the ecological control zone had higher CCD than the ecological restoration zone and had lower CCD than the eastern part of Inner Mongolia. In all, 31.37% of the total were within this zone. Core urbanization zone was located in the counties of Hohhot and Baotou. These counties had higher CCD than the other counties, occupying 5.88% of the total.
Ecological protection zone was located in counties of Hulunbuir and Xing’an. In this zone, the dominant types of CCD were adequate coordination and marginal coordination. Moreover, this zone exhibited the highest ecological environment. Approximately 6.86% of the total fell into this zone.

4. Discussion

4.1. Implication of Spatial Relationships Between Ecological Environment and Urbanization Level

4.1.1. Uneven Developments of Subsystems

This study explored the spatial relationships between the ecological environment and urbanization level in Inner Mongolia, a typical eco-fragile region. Results showed that eastern counties of the study area exhibited higher ecological environment, compared with western counties. This disparity was primarily driven by the eastern region’s richer forest and grassland coverage, resulting from its climatic advantages of higher precipitation and lower evapotranspiration. The majority of the total 102 counties were at the lowest level of urbanization. The high urbanization values were observed in counties of Hohhot, Baotou, and Ordos. In general, ecological environment demonstrated significant spatial variability, whereas urbanization level showed relatively minor spatial differences. This was in line with the results of other studies [39,40]. Furthermore, utilizing geographic big data to refine the spatial variables in this study could provide a more comprehensive understanding of urbanization.
The coupling coordination degree is determined by the relationship between the values of the two subsystems. If the total values of the two subsystems are equivalent, the CCD is higher when the values of the two subsystems are close to each other. Conversely, if there is a significant disparity between the values, the CCD is lower. Furthermore, if the total value of the two subsystems is lower than the sum of other values from the same two subsystems, then their CCD values will be lower. These findings were consistent with those from other studies conducted elsewhere [41,42]. Maintaining a balance between ecological environment and urbanization is crucial for the harmonious growth of regional sustainable development. However, the disorder or imbalance between these factors can result in uneven development and potentially impede overall progress. In this study, the urbanized counties demonstrated a higher degree of coordination between ecological environment and urbanization, compared to other areas. These can be attributed to their more balanced technological and ecological development. These counties were largely within the farming–pasture ecotone. Especially, the Hohhot–Baotou–Ordos urban agglomeration, as the core regions of Inner Mongolia, played a prominent role in eco-friendly urbanization. In addition, three types of incoordination were widespread in the north, especially in the desert and grassland areas beyond the farming-pastoral ecotone. This situation reflected the dependence of urbanization development on natural resources and the inefficient transformation of ecological assets into human welfare [43]. Achieving the optimal allocation of land resources and improving land use efficiency is essential for sustainable urbanization [44].

4.1.2. Spillover Effects Through Spatial Autocorrelation Analysis

No county was an isolated entity. The spatial spillover effect refers to the situation where one place experiences benefits or costs as a result of spatial externalities that arise from its proximity to neighboring areas [45]. To be specific, activities in one place can indirectly impact the well-being of surrounding areas. In terms of spatial autocorrelation analysis, our findings revealed that significant spillover effects were within the spatial distribution of CCD values, as indicated by the statistically significant Moran’s I value. Counties established connections through the exchange of materials and culture, such as resources and policies. These connections implied that CCD in one region was not independent but influenced by other regions. These findings were consistent with Zhang’s study [46]. Therefore, to enhance a region’s CCD value, it is necessary to consider the region and its surroundings integrally, given that the exchange of materials, energy, and information is not bounded by administrative divisions [47].

4.2. Suggestions for Regional Sustainable Management

The challenge that regional policymakers face is how to balance the relationship between urbanization and ecological environment. The high-speed urbanization, accompanied by construction activities, poses threats to ecological management. In light of this concern, it is urgent to view ecosystem and urbanization as an integrated system and to discuss their spatial interactions within the regional context [46]. Based on the findings of our study, practical suggestions for sustainable development are proposed.
In the ecological restoration zone, nature-based solutions (NbS), such as ecological restoration projects, are crucial in these areas to restore ecological integrity and enhance ecological environment. These projects should prioritize the use of native species, which are well adapted to the local environment and contribute to long-term ecological quality. In addition, under conditions of extremely scarce water resources, afforestation may consume excessive amounts of water, leading to poor tree growth, or even death, thereby failing to achieve the desired ecological effects. The consideration of replacing tree planting with planting grass is certainly worth in-depth discussion. Furthermore, counties in Alxa show great potential for photovoltaic energy, and photovoltaic systems promote land-use efficiency in these areas [48]. These measures aim to improve ecological environment while promoting urbanization, thereby increasing CCD.
In the urbanization promotion zone, construction activities should be limited to a certain extent, recognizing that unchecked development can undermine the ecological environment. Additionally, fostering urban development should not solely rely on physical construction; these regions can also effectively drive the urbanization process by strategically increasing the proportion of the service sector, creating vibrant economies and opportunities that complement the enhanced quality of life provided by thoughtful green planning.
In ecological control areas, environmental protection should be given priority alongside regional urbanization development. Since these regions are predominantly grassland within the study area, developing tourism presents an opportunity to convert ecological assets into economic benefits and to foster local urbanization. However, it is crucial to implement strict environmental management measures while promoting tourism to prevent ecological degradation. This includes controlling tourist numbers, managing waste effectively, and educating visitors on conservation practices, ensuring that urbanization and economic growth do not come at the cost of damaging the fragile ecological environment.
In the core urbanization zone, it is crucial for large cities to continue playing the leading role, while actively encouraging the sustainable economic development and environmental protection of surrounding cities through collaboration. Promoting integrated regional development requires joint planning bodies to coordinate infrastructure, land use, and environmental management. In addition, effective environmental management, as highlighted by the well-established role of green infrastructure in mitigating the urban heat island effect and extreme weather events [49], necessitates that green infrastructure becomes an integral part of urban planning to ensure resident well-being [50].
In the ecological protection zone, careful consideration is needed to balance future urban growth and ecological protection in these regions. For example, the Natural Forest Conservation Program, which bans deforestation and commercial logging, has already been implemented in the northeast of the study area [23]. This conservation effort has led to extensive forest coverage in these areas. As a result, the carbon trading market in these counties holds significant potential due to their dense forest cover. Carbon trading serves as a beneficial tool for realizing the concept that “lucid waters and lush mountains are as valuable as gold and silver”. This exemplifies how ecological assets can be transformed into economic benefits or financial resources through market-based mechanisms.

4.3. Limitations and Prospects

Our study offered in-depth insights to conduct functional zoning that considers the CCD between ecological environment and urbanization, thereby contributing to the enhancement of sustainable development for socio-ecological systems. Despite the efforts made, interpreting these results has inherent limitations and uncertainties. One such limitation is that the choice of proxies for assessing ecological environment and urbanization level can vary, leading to different results and introducing uncertainty. Additionally, the scale effect poses a challenge where altering the spatial unit of analysis can yield different outcomes. Analyzing data on a specific scale might not fully capture or accurately represent the interactions between multiple systems. To overcome this drawback, future research should adopt a multi-scale perspective, including various grid sizes and administrative divisions, to enhance the robustness of the findings. Furthermore, this study focused on ecological zoning with the integration of CCD between ecological environment and urbanization level in 2020, given the accessibility of relevant data. Future studies should explore the temporal dynamics of this relationship to provide a more comprehensive understanding.

5. Conclusions

This study assessed the ecological environment and urbanization level in Inner Mongolia, calculated coupling coordination degree between ecological environment and urbanization level, determined Moran’s I value for coupling coordination degree, and conducted comprehensive functional zoning. Results showed that ecological environment and urbanization level had different geo-spatial patterns. The eastern counties had higher ecological environments than the western counties, with 37.25% of the counties characterized by high ecological environments and 62.75% characterized by low ecological environments. A total 21.58% of the total counties had high urbanization levels, while 78.42% exhibited low urbanization levels. Specifically, the lowest urbanization category was widely distributed throughout Inner Mongolia. The study area displayed evident variations in coupling coordination degree, with 40.20% counties in coordination categories and 59.80% in incoordination categories. The global Moran’s I value suggested coupling coordination degree in the study area exhibited spatial clustering. Based on the findings, this study finally designated five functional zones, namely the ecological restoration zone, ecological protection zone, ecological control zone, core urbanization zone, and urbanization promotion zone. Among these zones, the urbanization promotion zone, accounting for 50% total counties, was the dominant functional zone. Sustainable management suggestions were proposed based on the comprehensive functional zoning. Future research should adopt a multi-scale perspective and explore the temporal dynamics of this relationship to enhance the robustness and comprehensiveness of the findings. This study not only sheds light on functional zoning, taking into account coupling coordination degree between ecological environment and urbanization level, but also contributed valuable insights for guiding the sustainable management of eco-fragile regions.

Author Contributions

Conceptualization, Y.L.; Data curation, B.J. and X.Z.; Funding acquisition, Y.L. and Z.L.; Supervision, Z.L. and W.C.; Writing—original draft, Y.L.; Writing—review and editing, Z.L. and Y.W. All authors have read and agreed to the published version of the manuscript.

Funding

This research was funded by the Natural Science Foundation of Inner Mongolia Autonomous Region of China (Grant No. 2025MS04035), and the National Key R&D Program of China (Grant No. 2022YFC3802801).

Data Availability Statement

All data used in this study are publicly available.

Conflicts of Interest

The authors declare that they have no known competing financial interests or personal relationships that could have appeared to influence the work reported in this paper.

References

  1. Moran, M.S.; Ponce-Campos, G.E.; Huete, A.; McClaran, M.P.; Zhang, Y.; Hamerlynck, E.P.; Augustine, D.J.; Gunter, S.A.; Kitchen, S.G.; Peters, D.P.C.; et al. Functional Response of U.S. Grasslands to the Early 21st-century Drought. Ecology 2014, 95, 2121–2133. [Google Scholar] [CrossRef]
  2. Berdugo, M.; Delgado-Baquerizo, M.; Soliveres, S.; Hernández-Clemente, R.; Zhao, Y.; Gaitán, J.J.; Gross, N.; Saiz, H.; Maire, V.; Lehmann, A.; et al. Global Ecosystem Thresholds Driven by Aridity. Science 2020, 367, 787–790. [Google Scholar] [CrossRef]
  3. Liu, H.; Li, P.; Peng, C.; Liu, C.; Zhou, X.; Deng, Z.; Zhang, C.; Liu, Z. Application of Climate Change Scenarios in the Simulation of Forest Ecosystems: An Overview. Environ. Rev. 2023, 31, 565–588. [Google Scholar] [CrossRef]
  4. Antunes, A.C.; Berti, E.; Brose, U.; Hirt, M.R.; Karger, D.N.; O’Connor, L.M.J.; Pollock, L.J.; Thuiller, W.; Gauzens, B. Linking Biodiversity, Ecosystem Function, and Nature’s Contributions to People: A Macroecological Energy Flux Perspective. Trends Ecol. Evol. 2024, 39, 427–434. [Google Scholar] [CrossRef]
  5. Wen, R.; Liu, Z. Exploring Trade-Offs and Synergies between Economy Development and Ecosystem Sustainability of the Eco-Fragile Regions in the Context of Food Security. J. Clean Prod. 2025, 510, 145604. [Google Scholar] [CrossRef]
  6. Zhang, L.; Jia, X.; Zhao, Y.; Luo, M.; Mu, Q.; Kang, H.; Zhang, P. Long Time-Series Change Characteristics and Suitable Scale of Oasis in Arid and Semi-Arid Regions of China. Appl. Geogr. 2025, 180, 103663. [Google Scholar] [CrossRef]
  7. Lei, X.; Liu, H.; Li, S.; Luo, Q.; Cheng, S.; Hu, G.; Wang, X.; Bai, W. Coupling Coordination Analysis of Urbanization and Ecological Environment in Chengdu-Chongqing Urban Agglomeration. Ecol. Indic. 2024, 161, 111969. [Google Scholar] [CrossRef]
  8. Yang, H.; Shao, H.; Zhang, C.; Zhang, C.; Su, W.; Zhao, Q. Optimization Framework for Coupled and Coordinated Development of Ecological Environment and Urbanization in Dual-Core Urban Agglomerations: A Case Study Area of Chengdu-Chongqing. Ecol. Indic. 2025, 176, 113624. [Google Scholar] [CrossRef]
  9. McConnell, K.; Braneon, C.V.; Glenn, E.; Stamler, N.; Mallen, E.; Johnson, D.P.; Pandya, R.; Abramowitz, J.; Fernandez, G.; Rosenzweig, C. A Quasi-Experimental Approach for Evaluating the Heat Mitigation Effects of Green Roofs in Chicago, Illinois. Sust. Cities Soc. 2022, 76, 103376. [Google Scholar] [CrossRef]
  10. Liao, S.; Wu, Y.; Wong, S.W.; Shen, L. Provincial Perspective Analysis on the Coordination between Urbanization Growth and Resource Environment Carrying Capacity (RECC) in China. Sci. Total Environ. 2020, 730, 138964. [Google Scholar] [CrossRef] [PubMed]
  11. Yu, B. Ecological Effects of New-Type Urbanization in China. Renew. Sust. Energ. Rev. 2021, 135, 110239. [Google Scholar] [CrossRef]
  12. Li, S.; Liu, Y.; Elahi, E.; Meng, X.; Deng, W. A New Type of Urbanization Policy and Transition of Low-Carbon Society: A “Local- Neighborhood” Perspective. Land Use Policy 2023, 131, 106709. [Google Scholar] [CrossRef]
  13. Qi, X.; Chen, J.; Wang, J.; Liu, H.; Ding, B. The Impact of Urbanization on the Alleviation of Energy Poverty: Evidence from China. Cities 2024, 151, 105130. [Google Scholar] [CrossRef]
  14. Wu, H.; Gui, Z.; Yang, Z. Geospatial Big Data for Urban Planning and Urban Management. Geo-Spat. Inf. Sci. 2020, 23, 273–274. [Google Scholar] [CrossRef]
  15. Wang, S.; Li, Z.; Long, Y.; Yang, L.; Ding, X.; Sun, X.; Chen, T. Impacts of Urbanization on the Spatiotemporal Evolution of Ecological Resilience in the Plateau Lake Area in Central Yunnan, China. Ecol. Indic. 2024, 160, 111836. [Google Scholar] [CrossRef]
  16. Dakos, V.; Kéfi, S. Ecological Resilience: What to Measure and How. Environ. Res. Lett. 2022, 17, 043003. [Google Scholar] [CrossRef]
  17. Feng, Y.; Feng, J.; Li, C. Progress of the Spatiotemporal Change and Improvement of Green Space from the Perspective of Ecological Resilience. Acta Ecol. Sin. 2023, 43, 5648–5661. [Google Scholar]
  18. Tang, F.; Wang, L.; Guo, Y.; Fu, M.; Huang, N.; Duan, W.; Luo, M.; Zhang, J.; Li, W.; Song, W. Spatio-Temporal Variation and Coupling Coordination Relationship between Urbanisation and Habitat Quality in the Grand Canal, China. Land Use Pol. 2022, 117, 106119. [Google Scholar] [CrossRef]
  19. Li, W.; Wang, Y.; Xie, S.; Cheng, X. Coupling Coordination Analysis and Spatiotemporal Heterogeneity between Urbanization and Ecosystem Health in Chongqing Municipality, China. Sci. Total Environ. 2021, 791, 148311. [Google Scholar] [CrossRef]
  20. Tu, D.; Cai, Y.; Liu, M. Coupling Coordination Analysis and Spatiotemporal Heterogeneity between Ecosystem Services and New-Type Urbanization: A Case Study of the Yangtze River Economic Belt in China. Ecol. Indic. 2023, 154, 110535. [Google Scholar] [CrossRef]
  21. Jiang, H.; Peng, J.; Zhao, Y.; Xu, D.; Dong, J. Zoning for Ecosystem Restoration Based on Ecological Network in Mountainous Region. Ecol. Indic. 2022, 142, 109138. [Google Scholar] [CrossRef]
  22. Li, J.; Hu, D.; Wang, Y.; Chu, J.; Yin, H.; Ma, M. Study of Identification and Simulation of Ecological Zoning through Integration of Landscape Ecological Risk and Ecosystem Service Value. Sust. Cities Soc. 2024, 107, 105442. [Google Scholar] [CrossRef]
  23. Li, C.; Fu, B.; Wang, S.; Stringer, L.C.; Wang, Y.; Li, Z.; Liu, Y.; Zhou, W. Drivers and Impacts of Changes in China’s Drylands. Nat. Rev. Earth Environ. 2021, 2, 858–873. [Google Scholar] [CrossRef]
  24. Li, T.; Jia, Y.; Fava, F.; Xu, Z.; Zhu, J.; Yang, Y.; Tang, L.; Wang, Y.; Hao, Y.; Cui, X. A Geographic Identification of Sustainable Development Obstacles and Countermeasures in Drylands: A Case Study in Inner Mongolia, China. Ecol. Indic. 2021, 132, 108257. [Google Scholar] [CrossRef]
  25. Wolfslehner, B.; Vacik, H. Evaluating Sustainable Forest Management Strategies with the Analytic Network Process in a Pressure-State-Response Framework. J. Environ. Manag. 2008, 88, 1–10. [Google Scholar] [CrossRef] [PubMed]
  26. Han, C.; Zheng, J.; Guan, J.; Yu, D.; Lu, B. Evaluating and Simulating Resource and Environmental Carrying Capacity in Arid and Semiarid Regions: A Case Study of Xinjiang, China. J. Clean. Prod. 2022, 338, 130646. [Google Scholar] [CrossRef]
  27. Lv, X.; Xiao, W.; Zhao, Y.; Zhang, W.; Li, S.; Sun, H. Drivers of Spatio-Temporal Ecological Vulnerability in an Arid, Coal Mining Region in Western China. Ecol. Indic. 2019, 106, 105475. [Google Scholar] [CrossRef]
  28. Jiang, Y.; Shi, B.; Su, G.; Lu, Y.; Li, Q.; Meng, J.; Ding, Y.; Song, S.; Dai, L. Spatiotemporal Analysis of Ecological Vulnerability in the Tibet Autonomous Region Based on a Pressure-State-Response-Management Framework. Ecol. Indic. 2021, 130, 108054. [Google Scholar] [CrossRef]
  29. Zhang, M.; Bao, Y.; Xu, J.; Han, A.; Liu, X.; Zhang, J.; Tong, Z. Ecological Security Evaluation and Ecological Regulation Approach of East-Liao River Basin Based on Ecological Function Area. Ecol. Indic. 2021, 132, 108255. [Google Scholar] [CrossRef]
  30. Chen, X.; Yu, L.; Lin, W.; Yang, F.; Li, Y.; Tao, J.; Cheng, S. Urban Resilience Assessment from the Multidimensional Perspective Using Dynamic Bayesian Network: A Case Study of Fujian Province, China. Reliab. Eng. Syst. Saf. 2023, 238, 109469. [Google Scholar] [CrossRef]
  31. Liu, J.; Xu, X.; Zou, C.; Lin, N.; Zhang, K.; Shan, N.; Zhang, H.; Liu, R. A Bayesian Network-GIS Probabilistic Model for Addressing Human Disturbance Risk to Ecological Conservation Redline Areas. J. Environ. Manag. 2023, 344, 118400. [Google Scholar] [CrossRef]
  32. Wang, R.; Xiao, Y.; Huang, H.; Chang, M. Exploring the Complex Relationship between Industrial Upgrading and Energy Eco-Efficiency in River Basin Cities: A Case Study of the Yellow River Basin in China. Energy 2024, 312, 133498. [Google Scholar] [CrossRef]
  33. Liang, L.; Zhang, F.; Wu, F.; Chen, Y.; Qin, K. Coupling Coordination Degree Spatial Analysis and Driving Factor between Socio-Economic and Eco-Environment in Northern China. Ecol. Indic. 2022, 135, 108555. [Google Scholar]
  34. Xing, L.; Xue, M.; Hu, M. Dynamic Simulation and Assessment of the Coupling Coordination Degree of the Economy–Resource–Environment System: Case of Wuhan City in China. J. Environ. Manag. 2019, 230, 474–487. [Google Scholar] [CrossRef] [PubMed]
  35. Wei, W.; Yuan, Z.; Wei, X.; Dou, H.; Xiong, J. Coupling Coordination Relationship Between Gross Ecosystem Product and Economic Development in Important Ecological Functional Areas: A Case Study in the Yellow River Basin. Econ. Geogr. 2024, 44, 161–172. [Google Scholar]
  36. Li, X.; Meng, X.; Ji, X.; Zhou, J.; Pan, C.; Gao, N. Zoning Technology for the Management of Ecological and Clean Small-Watersheds via k-Means Clustering and Entropy-Weighted TOPSIS: A Case Study in Beijing. J. Clean Prod. 2023, 397, 136449. [Google Scholar] [CrossRef]
  37. Ma, R.; Huang, Y.; Zhou, W.; Ren, J.; Wang, H.; Shi, Z.; Wang, J. How to Transform Cultivated Land Protection on the Northeast Tibetan Plateau? A Multifunctional Path Exploration. Ecol. Indic. 2025, 170, 112988. [Google Scholar] [CrossRef]
  38. Zhou, Y.; Wu, T.; Wang, Y. Urban Expansion Simulation and Development-Oriented Zoning of Rapidly Urbanising Areas: A Case Study of Hangzhou. Sci. Total Environ. 2022, 807, 150813. [Google Scholar] [CrossRef]
  39. Liao, Z.; Su, K.; Jiang, X.; Wang, J.; You, Y.; Wang, L.; Chang, S.; Wei, C.; Zhang, Y.; Li, C. Spatiotemporal Variation and Coupling of Grazing Intensity and Ecosystem Based on Four Quadrant Model on the Inner Mongolia. Ecol. Indic. 2023, 152, 110379. [Google Scholar] [CrossRef]
  40. Tian, Z.; Yu, Y.; Huang, C. Spatial Distribution Characteristics and Influencing Factors of Tourism Elements in Inner Mongolia Counties Based on POI Data. Arid Land Geogr. 2025, 48, 1255–1266. [Google Scholar]
  41. Cheng, X.; Long, R.; Chen, H.; Li, Q. Coupling Coordination Degree and Spatial Dynamic Evolution of a Regional Green Competitiveness System - A Case Study from China. Ecol. Indic. 2019, 104, 489–500. [Google Scholar] [CrossRef]
  42. Luo, L.; Wang, Y.; Liu, Y.; Zhang, X.; Fang, X. Where Is the Pathway to Sustainable Urban Development? Coupling Coordination Evaluation and Configuration Analysis between Low-Carbon Development and Eco-Environment: A Case Study of the Yellow River Basin, China. Ecol. Indic. 2022, 144, 109473. [Google Scholar] [CrossRef]
  43. Bi, X.; Shen, L.; Feng, G.; Zhou, P. The Interaction Mechanisms between Urbanization and Ecosystems from a Telecoupling Perspective: A Case Study of the Yangtze River Delta Region [J/OL]. Chin. J. Ecol. 2025, 1–17. [Google Scholar]
  44. Xiao, R.; Yu, X.; Xiang, T.; Zhang, Z.; Wang, X.; Wu, J. Exploring the Coordination between Physical Space Expansion and Social Space Growth of China’s Urban Agglomerations Based on Hierarchical Analysis. Land Use Pol. 2021, 109, 105700. [Google Scholar] [CrossRef]
  45. Thogersen, J. Spillover Processes in the Development of a Sustainable Consumption Pattern. J. Econ. Psychol. 1999, 20, 53–81. [Google Scholar] [CrossRef]
  46. Zhang, Y.; Liu, Y.; Zhang, Y.; Liu, Y.; Zhang, G.; Chen, Y. On the Spatial Relationship between Ecosystem Services and Urbanization: A Case Study in Wuhan, China. Sci. Total Environ. 2018, 637–638, 780–790. [Google Scholar] [CrossRef]
  47. Yang, H.; Gou, X.; Xue, B.; Xu, J.; Wei, Y.; Ma, W. Measuring the Cross-Border Spillover Effects and Telecoupling Processes of Ecosystem Services in Western China. Environ. Res. 2023, 239, 117291. [Google Scholar] [CrossRef]
  48. Stern, R.; Muller, J.D.; Rotenberg, E.; Amer, M.; Segev, L.; Yakir, D. Photovoltaic Fields Largely Outperform Afforestation Efficiency in Global Climate Change Mitigation Strategies. PNAS Nexus 2023, 2, pgad352. [Google Scholar] [CrossRef]
  49. Wu, X.; Zhang, J.; Geng, X.; Wang, T.; Wang, K.; Liu, S. Increasing Green Infrastructure-Based Ecological Resilience in Urban Systems: A Perspective from Locating Ecological and Disturbance Sources in a Resource-Based City. Sustain. Cities Soc. 2020, 61, 102354. [Google Scholar] [CrossRef]
  50. Li, L.; Wang, N.; Hao, Z.; Sun, B.; Gao, B.; Gou, M.; Wang, P.; Pei, N. Urbanization Intensifies the Imbalance between Human Development and Biodiversity Conservation: Insights from the Coupling Analysis of Human Activities and Habitat Quality. Land Degrad. Dev. 2024, 35, 3606–3626. [Google Scholar] [CrossRef]
Figure 1. Geographic location (a), elevation (b), and land use type (c) of Inner Mongolia.
Land 14 01692 g001
Figure 2. The flowchart of this study.
Land 14 01692 g002
Figure 3. Spatial distribution of ecological environment (a) and urbanization level (b) in Inner Mongolia.
Land 14 01692 g003
Figure 4. Spatial variation in coupling coordination degree (a) and characteristic (b) in Inner Mongolia.
Land 14 01692 g004
Figure 5. Spatial autocorrelation of coupling coordination degree in Inner Mongolia (H, L, IG stand for high, low, and insignificant, respectively).
Land 14 01692 g005
Figure 6. Comprehensive functional zoning in Inner Mongolia.
Land 14 01692 g006
Table 1. Data description in this study.
TypeDataResolutionSources
Land use dataLand use data1 kmResources and Environment Data Center of the Chinese Academy of Sciences (https://www.resdc.cn/ (accessed on 25 May 2025))
Meteorology data Precipitation1 kmNational Tibetan Plateau Data Center (https://data.tpdc.ac.cn/ (accessed on 25 May 2025))
Temperature
Evapotranspiration
Topography dataDEM90 mGeospatial Data Cloud (https://www.gscloud.cn/ (accessed on 25 May 2025))
NDVINDVI500 mNational Aeronautics and Space Administration (NASA) (https://www.earthdata.nasa.gov/ (accessed on 25 May 2025))
POI dataPOI datatxtAmap (https://www.amap.com/ (accessed on 25 May 2025))
Social media dataCheck-in datatxtSina Weibo (https://weibo.com/ (accessed on 25 May 2025))
PM 2.5PM 2.51 kmNational Earth System Science Data Center (https://geodata.nnu.edu.cn/ (accessed on 25 May 2025))
Nighttime light dataNighttime light data1 kmNational Earth System Science Data Center (https://geodata.nnu.edu.cn/ (accessed on 25 May 2025))
CO2 emission dataCO2 emission data0.1°Emissions Database for Global Atmospheric Research (https://edgar.jrc.ec.europa.eu/emissions_data_and_maps (accessed on 25 May 2025))
Transport networkRailways shpOpenStreetMap (https://www.openstreetmap.org)
Highways
Ecological conservation redline datasetEcological conservation redline datasetshpTerritorial Spatial Planning of Inner Mongolia Autonomous Region (https://zrzy.nmg.gov.cn/zfxxgkzl/fdzdgknr/ghjh/gh/202407/t20240723_2545743.html (accessed on 25 May 2025))
Socio-economic dataPopulationxlsStatistical yearbook of Inner Mongolia
GDP
Table 4. The categories of coupling coordination degree adopted in this research.
CCD ValueDegreeRatioCharacteristic
D   ≤ 0.225Serious incoordination0 < U 1 / U 2 ≤ 2Lagged ecological environment
2 < U 1 / U 2 ≤ 4Balanced development
4 < U 1 / U 2 Lagged urbanization
0.226 < D   ≤ 0.292Moderate incoordination0 < U 1 / U 2 ≤ 2Lagged ecological environment
2 < U 1 / U 2 ≤ 4Balanced development
4 < U 1 / U 2 Lagged urbanization
0.293 < D ≤ 0.337Slight incoordination0 <   U 1 / U 2 ≤ 2Lagged ecological environment
2 < U 1 / U 2 ≤ 4Balanced development
4 < U 1 / U 2 Lagged urbanization
0.338 < D ≤ 0.393Marginal coordination0 < U 1 / U 2 ≤ 2Lagged ecological environment
2 < U 1 / U 2 ≤ 4Balanced development
4 < U 1 / U 2 Lagged urbanization
0.394 < D ≤ 0.515Adequate coordination0 < U 1 / U 2 ≤ 2Lagged ecological environment
2 < U 1 / U 2 ≤ 4Balanced development
4 < U 1 / U 2 Lagged urbanization
0.516 < D Highest coordination0 < U 1 / U 2 ≤ 2Lagged ecological environment
2 < U 1 / U 2 ≤ 4Balanced development
4< U 1 / U 2 Lagged urbanization
Disclaimer/Publisher’s Note: The statements, opinions and data contained in all publications are solely those of the individual author(s) and contributor(s) and not of MDPI and/or the editor(s). MDPI and/or the editor(s) disclaim responsibility for any injury to people or property resulting from any ideas, methods, instructions or products referred to in the content.