Abstract
Urbanization, characterized by population growth and socioeconomic development, is a major driving factor of land use land cover (LULC) change. A spatio-temporal understanding of land cover change is crucial, as it provides essential insights into the pattern of urban development. This study conducted a longitudinal analysis of LULC change in order to evaluate the tradeoffs of urban growth and sustainability challenges in the Himalayan region. Landsat time-series satellite imagery from 1988 to 2024 were analyzed for two major cities in Nepal—Kathmandu metropolitan city (KMC) and Pokhara metropolitan city (PMC). The LULC classification was conducted using a machine learning support vector machine (SVM) approach. For this study period, our analysis showed that KMC and PMC witnessed urban growth of over 400% and 250%, respectively. In the next step, LULC change and urban expansion patterns were predicted based on the urban development indicator using the Cellular Automata Markov chain (CA-Markov) model for the years 2040 and 2056. Based on the CA-Markov chain analysis, the projected expansion areas of the urban area for the two future years are 282.39 km2 and 337.37 km2 for Kathmandu, and 93.17 km2 and 114.15 km2 for PMC, respectively. The model was verified using several Kappa variables (K-location, K-standard, and K-no). Based on the LULC trends, the majority of urban expansion in both the study areas has occurred at the expense of prime farmlands, which raises grave concern over the sustainability of the food supply to feed an ever-increasing urban population. This haphazard urban sprawl poses a significant challenge for future planning and highlights the urgent need for effective strategies to ensure sustainable urban growth, especially in restoring local food supply to alleviate over-reliance on long-distance transport of agro-produce in high-altitude mountain regions. The alternative planning of sustainable urban growth could involve adequate consideration for urban farming and community gardening as an integral part of the urban fabric, both at the household and city infrastructure levels.
1. Introduction
The accelerated process of global urbanization has intensified human activities, particularly in high-density urban areas, resulting in the rapid transformation of land use and land cover (LULC) [1]. This in turn has significantly raised land surface temperature (LST) and has affected climate regulation [2], particularly in the context of environmental challenges to sustainable urban development [3,4]. Over the last two decades, there has been a rapid increase in urban population and changes in the physical environment in cities of Asia and Africa [5]. Lack of urban planning and delineated urban boundaries has supported urban sprawl, resulting in the encroachment upon environmentally sensitive zones, prime agricultural lands [6,7].
Nepal has seen unprecedented urban growth in the last two decades [8]. In 1992, 2.9% of the urban population lived in 10 municipalities, which increased to 66 % of the population living in 293 municipalities in 2021 [9]. The urban population growth rate was high in the last decade due to both political and economic factors [10]. Socioeconomic factors, including urban migration for economic opportunities, have contributed to over 60% of urban expansion in Nepal, which has led to immense pressures on urban development (physical, political, planning, and policy) [11]. The urban development process varies in the city core area, fringe area, and rural area [12]. Between 1996 and 2006, political conflict in Nepal led to numerous migration trends in search for safety [8]. This urban expansion has largely occurred at the expense of agricultural land in the major cities [13,14] and the plains of Nepal’s foothills (locally called the ‘Tarai’ region) [15]. However, Nepal’s urban areas lack adequate infrastructure and still a weak economic foundation [16]. Municipalities in Nepal function as de facto urban areas with a poor urban database, and urban data systems are underdeveloped. Urban development in Nepal is characterized by unplanned informal growth and extensive urban sprawl, resulting in significant deficits in basic infrastructure [17].
Differing factors influence the urbanization patterns with different weights in the core city, peri-urban, and fringe and rural areas of Nepal [13]. For example, in the Kathmandu valley, which is marked with the most prolific urban growth, these factors are topographical condition, public service opportunities, economic opportunities, and land market dynamics. Similarly, in Pokhara, the second largest city in Nepal, urban expansion has occurred in the traditional way as a capital city of Gandaki province and predominantly as the hub area of tourism activities in Western Nepal. The key drivers have been population growth, migration, financial investment opportunities, land market, real estate business, public service, and sociopolitical activities [18]. Similar growth trends have been observed in other major settlement areas in Nepal [19].
Nepal’s National Urban Development Strategy (NUDS) has set up an ambitious vision to establish benchmarks for infrastructure development and lead the process of urbanization over the next 15 years. The Kathmandu valley has developed a 20-year Strategic Development Master Plan (SDMP) to establish a safe, clean, organized, prosperous, and elegant city (nation capital region) [20]. The country’s Land Use Policy 2015 [21], Land Use Act 2019 [22], and Land Use Regulation [22] are major national documents guiding sustainable land use. Land use classification, protection of arable land, definition of risk zone, and green belt promotion are some of the major objectives. Land management challenges are complex, requiring cross-sectoral, recurring efforts to effectively translate policies into practical administration and management actions [23].
Further, there are administrative challenges to implement the policies and plan effectively, mainly at the local level. Political instability also poses additional challenges to developing long-term strategies for sustainable land use and management in Nepal. To overcome these limitations, greater data-driven evidence and better coordination are required at implementation levels, where local politicians and planners can work together to address public and environmental needs.
It has been found that population growth, economic activities, and political factors are major factors are associated in urban development in major cities of South Asia [13,24,25,26]. Urban centers in developing and developed countries vary significantly in terms of land area, building height, urban planning space, built environment, and economic activities [27]. Urban development and loss of cultivated land are major challenges facing many cities in South Asia, including Kathmandu metropolitan city (KMC) [13,28] and Pokhara metropolitan city (PMC) in Nepal [14,18]. In Islamabad, industrial activities, real estate growth environment, dynamic transit infrastructure, modernity, better facilities, population growth, and neighboring urban activities are contributing to rapid urban growth [26]. In the city of Dhaka, Bangladesh, economic opportunities, public services (medical and educational facilities), migration and population growth, infrastructure development, and other physical dynamics are major factors [25]. In Delhi, India, urban growth is mainly driven by transportation infrastructures, economic activities, increase in several commercial and residential complexes, establishment of several multinational companies and industrialization [29]. In the city of Colombo, urban expansion was due to population migration, intensive industrial activities, higher population concentration, and also long-term internal conflict (1983–2009) [24]. Sociopolitical instability and armed conflicts have played a role in the land cover transition in the city of Kabul, Afghanistan [30]. Population, growth, and rural–urban migration are the major driving factors of urbanization in the city of Thimpu in Bhutan [31], which have also been associated with air pollution and climate change [32,33,34]. This is contradictory to the patterns in Europe; higher immigration and lower land take rate were observed in many European cities, where more people moved into core cities with less land demand for new housing from 2006 to 2018 [35]. A growing trend of rural–urban migration and land abandonment has emerged as a significant problem in Nepal, affecting agricultural productivity, local economies, food security, and sustainable land management.
Urban land expansion and land use land cover (LULC) change are directly related to population growth, economic activities [3], and urbanization [36]. Urban development and land use land cover change pose a serious challenge to food security and climate change, impact biodiversity and water insecurity [37], and foster environmental degradation [4]. Rapid urbanization has been shown to significantly exacerbate urban heat island effects, with this impact being particularly evident across the urban–rural continuums (URCs). Unprecedented urbanization patterns and related LULC change have had a substantial effect on LST, which plays a significant role in facilitating essential insights into the thermal characteristics of the earth’s surface [32,34,38].
Remote sensing technology and GIS are essential tools for monitoring land cover, supporting urban and regional planning, and analyzing spatio-temporal change in LULC from local to global scales [14,32,39,40]. LULC models usually include a change demand sub-model, a transition potential sub-model, and an allocation model that decides exactly where and when land use and land cover change occur, as well as what type of change takes place [41]. The Cellular Automata (CA)-Markov model has been applied to evaluate future urban expansion on different land covers [32,42]. Cellular Automata (CA) predict spatial change based on past spatial analysis. LULC change and urban development growth models help track and analyze city expansion and its effects and provide support for urban planning and sustainable growth management [43,44,45].
Reducing the overuse of land is important to control the spread of cities and meet global development goals like SDG 11.3.1 [46]. To build cities sustainably, we need to understand how cities are growing and how land is being used [36]. Timely and accurate data on urbanization trends are vital to effective planning and sustainable policy development. Land use change maps help analyze land cover dynamics and forecast future economic and environmental impacts [41,45].
Rapid urbanization is leading to the shrinking of local farmlands, increasing the distance between food growers and consumers globally, in both developed and developing countries [47]. In order to address this unsustainable practice, long-term studies with predictions at the city level need to draw attention to policymakers for sustainable urban planning, integrating urban agriculture plans (where applicable), and a long-term strategy to reduce indefinite urban sprawls. Predicting future land use change patterns provides an understanding of ecological management and sustainable land use planning [48], specifically to identify where and how cities will grow and how much agriculture will be lost. Based on the estimated loss of agricultural land, planners, policy makers, and local administration can prioritize urban, agricultural, and other environmentally sensitive zones. This also supports identifying areas for urban farming and promotes urban agriculture to mitigate food insecurity. Community-based urban farming/gardening are emerging as key strategies for sustainable development, enhancing food security, promoting public health, controlling soil erosion, reducing urban heat island (UHI) effects, and improving the city environment [49,50]. With evidence of these types of research and databases, cities can make master plans including green belts, agriculture zones, and land use implementation regulations.
This study analyzed the growth patterns of two major cities in Nepal—Kathmandu metropolitan city (KMC) and Pokhara metropolitan city (PMC). Using historical trends and machine learning, a synthesis of projected future urban land expansion and cropland conversion into urban areas beyond 2050 is presented. Previous studies in Kathmandu and Pokhara have reported on unplanned, haphazard LULC change and unrestricted urban growth in prime farmland [14,51,52,53,54]. However, long-term urban expansion and the prediction of LULC dynamics are still lacking. This study principally addresses the following two research questions:
- (1)
- How did LULC change occur in the past (1988–2024), and which classes and locations were the most impacted by urbanization?
- (2)
- What patterns of growth and change are projected for the years 2040 and 2056 using Cellular Automata Markov chain (CA-Markov chain)?
The study outcomes draw the attention of researchers and policy makers to a long-term understanding of the dynamics of randomly growing cities in a land-locked/mountain region, offering avenues for effective strategic planning to combat sustainability challenges.
2. Materials and Methods
2.1. Study Area
This study focuses on two rapidly changing major urban agglomerations and prominent socioeconomic hubs in Nepal—Kathmandu metropolitan city (KMC) and Pokhara metropolitan city (PMC) (Figure 1). Kathmandu, the capital city of Nepal, is located within Bagmati Province and administratively incorporates Kathmandu, Bhaktapur, and Lalitpur districts, with two metropolitan cities and other local unities within the Bagmati watershed (Figure 1c). In three districts of Kathmandu valley witnessing rapid urbanization, evidenced by a steadily increasing population from 1,105,379 in 1991 to 1,645,091 in 2001, to 2,517,023 in 2011, reaching 3,025,386 in 2021 [9]. This demographic surge highlights intensified rural–urban migration, spatial expansion of built-up areas, and escalating pressure on the urban environment [13].
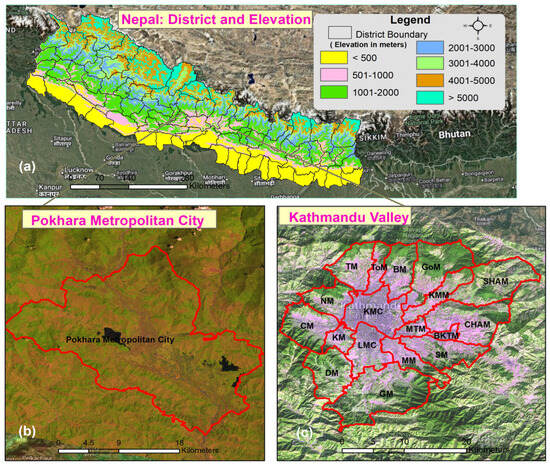
Figure 1.
Study area: (a) District map of Nepal with elevation. (b) Pokhara Valley (Pokhara metropolitan city). (c) Kathmandu valley (Kathmandu metropolitan city—KMC; Lalitpur metropolitan city—LMC; Bhaktapur Municipality—BKTM; Suryabinayak Municipality—SM; Shankharapur Municipality—SHAM; Madhyapur Thimi Municipality—MTM; Changunarayan Municipality—CHAM; Chandragiri Municipality—CM; Budhanilakantha Municipality—BM; Tokha Municipality—ToM; Tarakeshwor Municipality—TM; Nagarjun Municipality—NM; Kirtipur Municipality—KM; Godawari Municipality—GM; Gokarneshwor Municipality—GoM; Kageshwori Manahora Municipality—KMM; Mahalaxmi Municipality—MM; Dakshinkali Municipality—DN.
PMC lies between two major Himalayan ranges—the Annapurna Massif to the north and the lesser Himalaya to the south (Mahabharat Lekh). This valley consists of a relatively complex and dramatic geological evolution [55]. The population count of PMC was just 95,286 in 1991, increasing rapidly to 156,312 in 2001 and 255,465 in 2011, where the total area was 225 sq.km, reaching 513,504 people within a 464.24 sq.km area in 2021 [9,14]. Both KMC and PMC are faced with immense urban growth, characterized by population growth and socioeconomic development challenges.
Rapid urbanization has impacted the urban environment, causing landscape fragmentation, loss of biodiversity, air and water pollution, urban heat islands, and greenhouse gas emissions. Now these are common problems in the core area of Kathmandu and Pokhara. Migration from rural areas, population growth, political conditions, economic opportunities, land market, and government plans and policies are major driving factors of urbanization in the major cities of Nepal, including Kathmandu and Pokhara cities and other regions of the country [8,11,13,14,56,57].
2.2. Data
In this study, freely available maximum cloud-free Landsat (TM, ETM, and OLI) images from 1988 to 2024 were acquired from the United States Geological Survey (USGS) website—https://earthexplorer.usgs.gov (Appendix A, Table A1 and Table A2). All images were verified and projected to UTM Zone 45° N. Similarly, Shuttle Rader Topographical Mission (SRTM) 30 m resolution and administrative boundary vector data maps were acquired from the Survey Department of Nepal, and other spatial data were collected from OpenStreetMap (https://data.humdata.org/ (OSM 2025). Recent major land cover change information was verified using a Global Positioning System (GPS) during field visits in September and October 2024. In addition, Google Earth images (http://earth.google.com) were used for reference (Table 1).

Table 1.
Reference data used in the study.
2.3. Image Pre-Processing and Classification
Both Level 1 and Level 2 Landsat images are suitable for land cover classification of the study area. Landsat 5 TM and Landsat 7 ETM with SR data product were generated from the Landsat Ecosystem Disturbance Adaptive Processing System (LEDAPS), developed by NASA [59]. The Landsat 8-9 OLI-SR data were generated from the Landsat Surface Reflectance Code (LaSRC) product guide [60]. Terrain correction of Level 1 (LIT) images was applied to convert the digital number (DN) into radiance [61], where all images were processed in the ENVI (v5.3) software environment [62].
Major land cover classes (Table 2) were extracted using machine learning support vector machine (SVM) [61,63]. The classified data were further used for the analysis of LULC transition from one class to another by using TerrSet Libra GIS (20.0.1) and Selva, developed by Clark Labs, USA (https://www.clarku.edu), for the years 1988–1992, 1992–2000, 2000–2008, 2008–2016, and 2016–2024. Several previous scholars have agreed and accepted this supervised SVM classification approach with high accuracy [61,63,64]. SVMs generally apply one of four kernel functions: linear, polynomial, radial basic function (RBF), and sigmoid. The mathematical representations of each kernel are mentioned in the help section of ENVI version 5.3. The RBF kernel has been recognized as more effective during LULC classification with high accuracy [65].

Table 2.
Land cover classification scheme.
2.4. Accuracy Assessment
To generate the accuracy assessment, Google Earth (http://earth.google.com) and a topographical map (Survey Department, Government of Nepal, 1996/1998; scale 1:25,000) were used as references. Sample points were designed for the accuracy assessment. Overall accuracy (OA), User’s accuracy (UA), and Producer’s accuracy (PA) were tabulated as measures of the accuracy assessment using the following equations:
PA = Xii/X + i × 100%, where Xii = total number of correct cells in a class and X + i = sum of cell values in the column.
UA = Xii/X + i × 100%, where Xii = total number of correct cells in a class and X + i = sum of cell values in the row.
OA = D/N × 100%, where D = total number of correct cells summed along the major diagonal and N = total number of cells in the error matrix.
, KHAT (k), values were observed to determine how correct the remote sensing classification was and how in line with the reference data it was; the K value can be calculated as recommended by [28,34].
where Ao = observed accuracy, Ca = chance assessment, and Cag = chance agreement.
2.5. Cellular Automated (CA) Markov Chain and Simulation of LULC Change
There are multiple land cover simulation models in practice, including SLEUTH [66], DINAMICA [67], CLUE [68], CA-Markov [69] and ANN-CA [70]. The LULC change pattern was predicted using a simulation model, applying Artificial Neural Network (ANN)-MLP (Multi-Layer Perception) algorithms [70]. The CA-Markov model provides essential information about urban growth in the future based on past information [32,42]. Based on the prepared LULC change from 1988 to 2024, this model was applied to calculate the change and predict the future transition. Transition probability matrix tables were developed for 1992–2008, 2008–2024, 1992–2024, and 2024–2040. The transition probability matrix was calculated using a Markov model in TerrSet Libra GIS, which predicts urban growth for the years 2040 and 2056 in a 16-year interval, using Cellular Automata (CA)-Markov. These insights can be crucial to understanding the dynamics of the study area in order to make informed decisions related to land use planning and management.
The preparation of suitability maps is a difficult preliminary step in modeling LULC change and depends on access to information and data [71]. At first, the effective layers in the LULC of the region, including slope, distance from roads, distance from water resources, distance from built-up areas, and forest (Appendix B), were chosen based on specialized knowledge and research from TerrSet Libra GIS. The LULC patterns from 2008 to 2024 were the foundation of the predicted maps for 2040 and 2056. The CA model was constructed as per the required steps, as follows: (a) application of LULC map with similar classes and same time interval (1992, 2008, and 2024); (b) preparation of the driving factor layers; (c) preparation and calculation of the transition matrix; (d) validation of Kappa indices; and (e) simulation of the LULC maps for the future years between 2040 and 2056. The CA-Markov chain model combines spatial and temporal analyses to predict future LULC change. Transition probability maps from Markov chain analysis were used to guide the CA model, enabling accurate simulation of spatio-temporal dynamics. Applied in a dynamic urban setting, the model effectively forecasted future LULC patterns [32,69,72,73].
Transition potential modeling was conducted for the prediction of the LULC map for the year 2024 based on the LULC maps of 1992–2008. The Markov transition was conducted on the classified LULC map of state one (time 1) and state two (time 2), applying the following equation from the literature [32,38]:
L(t + 1) = Pij × L(t)
Here L represent the present land use status at time t. L(t + 1) is the defined land use status at time t + 1, and Pij is the transition probability matrix in a state. P is the transition probability of any designed time of conversion of LULC class one i at time 1 to j at the next time. The transition probability is defined from 0 to 1; a low transition probability is near 0, and a high probability is close to 1 [38].
Then, CA filters were designed as a standard 5 × 5 contiguity filter based on the following:
| 0 | 0 | 1 | 0 | 0 |
| 0 | 1 | 1 | 1 | 0 |
| 1 | 1 | 1 | 1 | 1 |
| 0 | 1 | 1 | 1 | 0 |
| 0 | 0 | 1 | 0 | 0 |
2.6. Validation
The model was verified using several Kappa variables (K-location, K-standard, and K-no) [43]. The actual LULC map of the study area for the year 2024 and the predicted map for the year 2024 were used for the validation of Markov. The comparison map is typically the output of a simulation or classification model, and its validity is assessed by comparing it to a reference map that represents reality. The years 2008 and 2024 were used as starting points to predict 2040 and continue. This method is an effective approach to predicting urban growth in the future [42]. It is used for validation, where an accuracy of more than 80% indicates the capability of the simulation model.
3. Results and Analysis
3.1. LULC Change Analysis for Kathmandu Valley
After careful classification of LULC change in Kathmandu valley, the accuracy of the classified LULC map of the study area was observed. Overall accuracy (OA), user’s accuracy (UA), and producer’s accuracy (PA) were evaluated in different years. The overall accuracy (OA) rates of KMC in 1988, 1992, 2000, 2008, 2016, and 2024 were 95%, 91%, 90%, 95%, 92%, and 92%, respectively. Furthermore, the land cover transition was observed based on the cross-section, and the transition table of LULC change was prepared for the years 1988–1992, 1992–2000, 2000–2008, 2008–2016, and 2016–2024. According to the proportional cross tabulations, the Overall Kappa values for the study periods 1988–1992, 1992–2000, 2000–2008, 2008–2016, and 2016–2024 were 0.9758, 0.9399, 0.9570, 0.9409, and 0.8890, respectively.
Based on the LULC data for different time spans, it is observed that the urban/built-up area in KMC has significantly increased from 37.98 sq.km to 197.41 sq.km between 1988 and 2024, with gradual growth being observed in interim years as follows: 40.70 sq.km (1992), 73.90 sq.km (2000), 95.45 sq.km (2008), and 138.37 sq.km (2016). This marked an overall increase of over 400%, with an annual growth rate of approximately 4%, highlighting rapid urban sprawl during 1988–2024 (Figure 2). On the contrary, the observed decline in cropland over the same period was from 418.32 sq.km to 245.08 sq.km, with the gradual reduction in interim years as follows: 417.70 sq.km (1992), 380.91 sq.km (2000), 356.63 sq.km (2008), and 313.78 sq.km (2016). Meanwhile, vegetation patches showed a steady increase from 230.69 sq.km to 242.17 sq.km. Other land expanded slightly from 1.97 sq.km to 5.00 sq.km, while waterbodies showed fluctuating patterns, reducing from 5.31 sq.km to 4.62 sq.km between 1988 and 2024 (Table 3, Figure 3). Notably, cropland in KMC shrank by 173.24 sq.km during 1988–2024 (overall reduction of 41%).
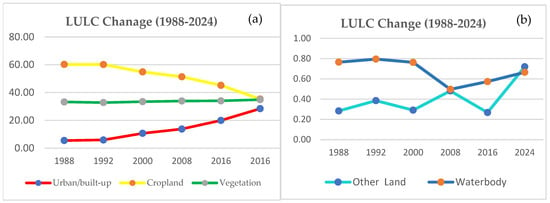
Figure 2.
LULC change in %: (a) urban, cropland, and vegetation; (b) other land and waterbodies.

Table 3.
LULC change in sq.km in Kathmandu during 1988–2024.
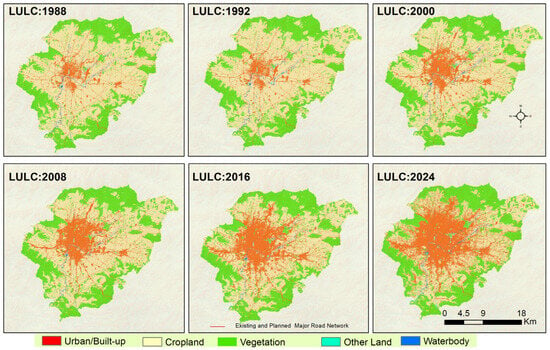
Figure 3.
LULC map of Kathmandu valley in 1988–2024. LULC 1988 and 2008 data were used from Sarif et al., 2020 [28].
Between 1988 and 1992, a modest increase in urban/built-up area of 2.72 sq.km was witnessed, with 2.58 sq.km of this growth being derived from cropland (Table 4, Figure 4). However, this trend intensified markedly in subsequent periods. From 1992 to 2000, urban expansion surged by 33.2 sq.km, with cropland accounting for 31.90 sq.km of this change. The trend persisted during 2000–2008, during which 21.55 sq.km of urban area emerged, primarily through the conversion of 20.48 sq.km of cropland. A similar pattern occurred between 2008 and 2016 in the transition table, where 40.97 sq.km of cropland was lost to urban development, contributing to a total built-up increase of 42.92 sq.km. The most pronounced shift occurred during 2016–2024, with 59.04 sq.km of urban expansion, overwhelmingly derived from the conversion of 59.45 sq.km of cropland.

Table 4.
Land use land cover transition in Kathmandu valley in 1988–2024.
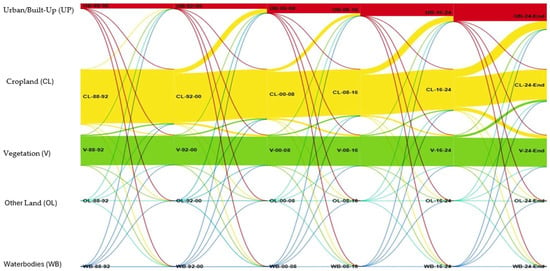
Figure 4.
Sankey plot of LULC transition between 1988 and 2024 in Kathmandu valley, where year 1988-88, year 1992-92, year 2000-00, year 2008-08, year 2016-16, and year 2024-24.
The vast majority of the expanded urban area was derived at the cost of cultivated land, which led to a decline in cropland area from 418.32 sq.km to 245.08 sq.km, which is an overall decline of 173.24 sq.km or around 41.41%, during 1988–2024.
3.2. LULC Change Analysis for Pokhara Metropolitan City
Based on the classified LULC maps of different years in the study area of Pokhara metropolitan city, overall accuracy (OA), user’s accuracy (UA), and producer’s accuracy (PA) were evaluated. The overall accuracy (OA) rates were 86% in 1988, 88% in 1992, 89% in 2000, 87% in 2008, 90% in 2016, and 92% in 2024. Similarly, land cover transition analysis is described in this section. Land cover transition was observed based on the cross-section, and the transition table of LULC change was prepared for the years 1988–1992, 1992–2000, 2000–2008, 2008–2016, and 2016–2024. According to the proportional cross tabulations, the Overall Kappa values were 0.9834 in 1988–1992, 0.9777 in 1992–2000, 0.9708 in 2000–2008, 0.9670 in 2008–2016, and 0.9752 in 2016–2024.
The detailed LULC change analysis for Pokhara during 1988–2024 shows that the urban/built-up area witnessed a steady increase from 19.42 sq.km to 68.68 sq.km in 2024, which is an increase of around 253.65%, with the gradual growth observed being 21.37 sq.km (1992), 26.76 sq.km (2000), 39.62 sq.km (2008), and 52.68 sq.km (2016). In contrast, cultivated land declined by around 17.55%, from 235.92 sq.km in 1988 to 184.52 sq.km in 2024. Gradual decreases were witnessed: 228.29 sq.km (1992), 225.05 sq.km (2000), 213.25 sq.km (2008), and 201.10 sq.km (2016). Meanwhile, vegetation cover slightly declined from 187.24 sq.km to 185.07 sq.km (it may be grassland rather than shrubland and dense forest), whereas ‘other land’ and waterbodies showed minor increases: other land increased from 5.51 sq.km in 1988 to 7.39 sq.km, and waterbodies increased from 14.72 sq.km to 16.24 sq.km. Similarly, swamp/wetland areas increased from 1.73 sq.km to 2.64 sq.km over the period. Overall, during 1988–2024, the urban/built-up area in Pokhara increased approximately by 253.7% with an average annual growth rate of 3.63%. In terms of cropland, it declined by 21.8% approximately with an average annual decline rate of 0.63%, indicating a steady reduction in agricultural land (Table 5, Figure 5 and Figure 6).

Table 5.
LULC change in Pokhara during 1988–2024.
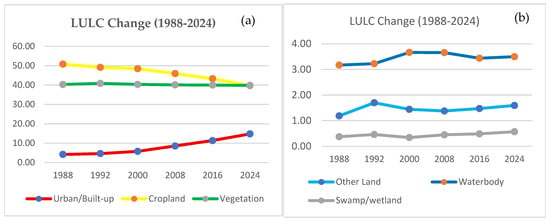
Figure 5.
LULC change in%: (a) urban, cropland, and vegetation; (b) other land, waterbody, and swamp areas.
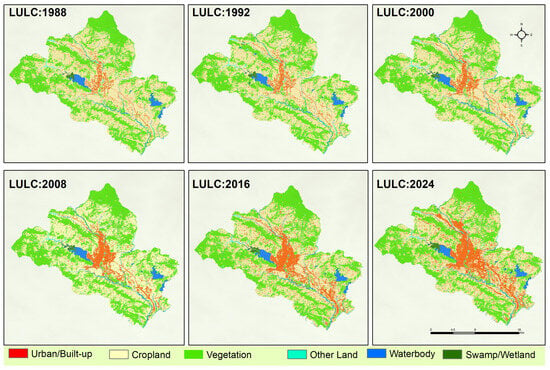
Figure 6.
LULC maps for PMC from 1988 to 2024.
During 1988–1992, Pokhara observed a 1.95 sq.km increase in urban/built-up area, 1.66 sq.km of which was converted from cropland. During 1992–2000, the built-up area increased by 5.39 sq.km, with 4.52 sq.km being derived from agricultural land. It continued to increase during 2000–2008, during which 12.86 sq.km of land was urbanized, with cropland conversion accounting for 11.44 sq.km The period from 2008 to 2016 exhibited a similar pattern, as 13.06 sq.km of urban growth occurred, of which 11.84 sq.km was at the expense of cultivated land. Most remarkably, from 2016 to 2024, the urban/built-up area expanded by 16 sq.km, nearly mirroring the 16.07 sq.km of cropland decrease (Table 6, Figure 7).

Table 6.
Land use land cover transition in Pokhara metropolitan city from 1988 to 2024.
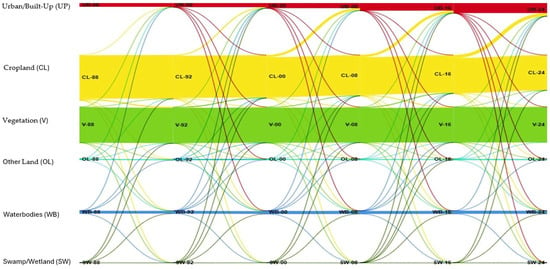
Figure 7.
Sankey plot of LULC transition between 1988 and 2024 in Pokhara, where year 1988-88, year 1992-92, year 2000-00, year 2008-08, year 2016-16, and year 2024-24.
3.3. CA-Markov Model
For the analysis of LULC change and urban growth prediction for the years 2040 and 2056, the transition probability matrices (for the periods 1992–2008 and 2008–2024) were evaluated based on past land cover. The prediction was evaluated based on the actual map of 2024 and the predicted map of 2024 and obtained acceptable accuracy (Kstandard = 0.8672, Kno = 0.9100, and Klocation = 0.9226), and similar accuracy was observed elsewhere.
3.3.1. LULC Prediction for Kathmandu Valley for 2040 and 2056
According to the prediction analysis for Kathmandu, the urban/built-up area is projected to expand from 197.41 sq.km in 2024 to 282.39 sq.km by 2040, marking an increase of 84.98 sq.km over the 16 years. This trend further continues to increase by 54.98 sq.km, reaching 337.37 sq.km by 2056. Overall, the urban/built-up area is expected to grow by 139.96 sq.km between 2024 and 2056, which is an increase of around 70.91% and an average annual growth rate of around 1.72%, highlighting significant urban expansion over the 32 years’ period (Table 7, and Figure 8 and Figure 9).

Table 7.
Distribution of LULC categories (sq.km) and percentage for 2024–2056 in Kathmandu valley.
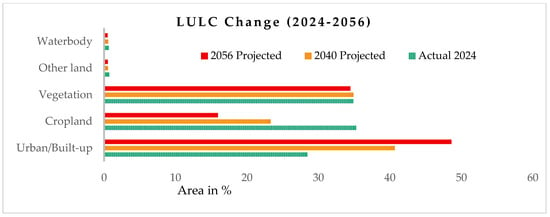
Figure 8.
LULC change in Kathmandu valley from 2024 to 2056.

Figure 9.
LULC maps: simulated maps, 2040 and 2056, Kathmandu valley (left) and (middle) panels, respectively); urban agglomeration, 1988–2056 (right) panel).
In sharp contrast, cropland is projected to undergo a significant reduction, decreasing from 245.08 sq.km. in 2024 to 161.86 sq.km in 2040 to 110.59 sq.km. in 2056. This represents an overall loss of 134.49 sq.km, equating to a 54.87% reduction over the 32-year period (Figure 8). The estimated average annual rate of decline is approximately 2.25%, which reflects a substantial decrease in agricultural land availability, with critical implications for food security and sustainable land use planning.
3.3.2. LULC Prediction for Pokhara for 2040 and 2056
The LULC prediction analysis for Pokhara indicates a substantial increase in urban/built-up area, which is expected to expand from 68.68 sq.km in 2024 to 93.17 in 2040 and 114.15 in 2056. This is a total increase of 45.47 sq.km over the 32-year period, corresponding to an overall increase of around 66.2% and an estimated average annual growth rate of 1.61%, reflecting the accelerating trend of urban sprawl. On the other hand, cropland in Pokhara is projected to decrease, from 184.52 sq.km in 2024 to 162.42 sq.km by 2040, and further to 143.81 sq.km by 2056. This corresponds to the decline of 40.71 sq.km over the 32 years, reflecting an overall decline of around 22.08% and an estimated average annual decline rate of 0.78%, indicating consistently declining agricultural land (Table 8, Figure 10 and Figure 11).

Table 8.
Distribution of LULC categories (sq.km) and percentage in 2024–2056 in Pokhara metropolitan city.
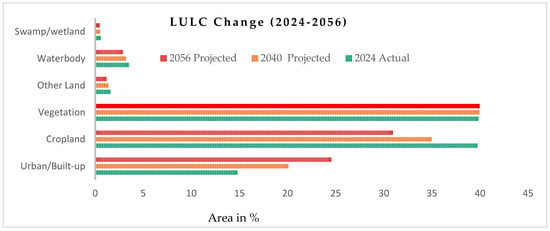
Figure 10.
LULC change in Pokhara metropolitan city from 2024 to 2056.

Figure 11.
LULC maps: simulated maps, 2040 and 2056 (left) and (middle) panels, respectively; urban agglomeration, 1988–2056 (right) panel.
4. Discussion and Conclusions
Urban areas are rapidly expanding and evolving in the Himalayan region. It is expected that the urban population will continue to increase [74]. Our longitudinal analysis has found expansion of the urban area between 1988 and 2024 in the Kathmandu valley from 37.98 sq.km to 197.41 sq.km and in Pokhara metropolitan city from 19.42 sq.km to 68.68 sq.km. By contrast, over the same period, the cropland reduced in Kathmandu Valley from 60.16% to 35.30% and in Pokhara metropolitan city from 50.78% to 39.72%. This shows that most of the boundaryless urbanization growth occurred in the absence of prime cropland. This trend of urban growth not only causes a loss in cultivated land, which also impacts the ability to produce food for the ever-increasing population locally, but also leads to encroachment of river/forest areas, thus resulting in wider environmental challenges.
Our results from the two case-study cities in Nepal show a clear link between urban growth and sustainable challenges, largely due to unplanned urbanization and the fragmentation of fertile agricultural land in the peri-urban areas. Based on CA-Markov chain analysis, the projected expansion of urban area for two future years, 2040 and 2056, are as follows: Kathmandu valley, 282.39 sq.km and 337.37 sq.km, respectively; PMC, 93.17 sq.km and 114. 15 sq.km, respectively. To date, the government’s ambition to build model cities and concrete strategic plans and slow implementation have resulted in limited progress. The continued migration from rural to urban settlement, supported by a loss of population in rural areas and an increase in land abandonment, poses a growing threat to environmental balance and requires urgent intervention. This projected urban growth could be reversed with timely implementation of strict policies, curbing unchecked population mobility, unplanned urbanization, and the fragmentation of fertile agricultural land. The latter has been considered one of the most detrimental consequences of urban development in major farmland areas in Nepal [75].
For the Kathmandu valley, extensive prior studies [13,51,53,54,76,77,78] have already documented the rapid and uncontrolled urban growth, suggesting intensification in anthropogenic activities and LULC transformations owing to increasing population pressure over the coming year. Only with strong policies for sustainable planning and coordination efforts, Kathmandu valley can overcome sustainability challenges [77]. Most of the South Asian cities have an increasing trend of urban growth. In the city of Delhi, India, the urban area increased from 461.35 sq.km in 1994 to 1273.55 sq.km in 2024 and is predicted to further increase to 2679.54 sq.km in 2030 [79]. A similar trend was observed in Islamabad, where the urban area was 355.10 sq.km in 2015 and 445.74 sq.km in 2022 and is predicted to increase to 531.70 sq.km in 2030 [80]. The urban area is expected to expand by 70.86% in the city of Dhaka, Bangladesh, by 2060, and agricultural land is expected to decline [73]. The city of Colombo, Sri Lanka, had an urban area of 98.037 sq.km in 1988 and 401. 68 sq.km in 2022 [81]. In the Himalayan city of Thimpu, urban area was 13.86 sq km (52.88%) in 2000 and increased to 17.20 sq.km (65.65) in 2018, and it is expected to continue to increase gradually [31]. Urban development was discontinued in the city of Kabul, Afghanistan, where the urban area was 229.9 sq.km in 1993 and reached 245.6 sq.km in 2020; political conflict and other causes played a role in urban development [30]. The current urban structure reflects political dominance over technical planning in the country, resulting in unbalanced growth, inadequate infrastructure, and further challenges from information infrastructure across newly declared municipalities [77,82]. The urban population will increase by about 90% in Asia and Africa by 2050 [74]. Due to global urban expansion, it is expected to cause a loss of 1.8 to 2.4% in global farmland by 2030 and intensify risks to the food system [83].
Hyper-concentrated floods in May 2012 in Pokhara (Seti flood) and in September 2024 in the Kathmandu valley (Bagmati, Manohara, Nakhkhu flood) have already affected the core city area and caused losses of life and property. The flash flood on the 5th of May 2012 in the Seti River claimed 72 lives [84], obliterated dozens of structures, and caused an estimated economic loss of NPR 50 million [85,86]. Anthropogenic activities and poor planning have increased risks in the Seti catchment, as the developed infrastructure is not designed for peak river flows, such as bridges, and instead of relocating vulnerable settlements, government policies are encouraging them by providing amenities [87]. River encroachment from infrastructure projects and slum settlements narrows the Seti River in Pokhara, increasing flood risk. A previous study found that PMC is at high risk of flood impacts [88].
Caused by rapid urbanization and river encroachment is a key driver of increased flooding risk in the Kathmandu valley [89]. Unplanned urban growth leads to many vulnerabilities [90], and this unplanned urbanization significantly amplifies future disaster risks, posing many challenges to reconstruction in dense urban areas [91]. The 2015 Nepal earthquake devastated the Kathmandu valley, destroying countless homes and historic sites, causing widespread casualties and displacement [92]. Applying multiple data from satellites, sensors, and other sources [93], scholars can gain deeper insights into patterns and risks associated with these hazards. Unplanned rapid urbanization is pushing development into floodplains and agricultural areas, which is increasing the environmental issues for a growing population [52,89,90,93]. However, there remains a significant gap in long-term disaster management planning in urban areas and in effectively transferring risk-related knowledge to local communities, particularly regarding hazard-prone areas.
The applied CA-Markov model correctly projected urban growth patterns based on the classified past and present LULC maps of the study area. The model presented high accuracy in simulating future urban land use distribution, affirming its predictive reliability [32,38,43]. In the Kathmandu valley and Pokhara, the LULC simulation reveals two primary land change dynamics: rapid and continuous urban expansion and significant agricultural land loss. Overall, in Kathmandu valley the urban/built-up area is expected to grow by 139.96 sq.km between 2024 and 2056, which is an increase of around 70.91% and an average annual growth rate of around 1.72%, highlighting significant urban expansion over the 32 years’ period. Similarly, 68.68 sq.km in 2024 to an expected 93.17 sq.km in 2040 and 114.15 sq.km in 2056, a total increase of 45.47 sq.km over the 32-years, in Pokhara city. A similar trend was observed in the other regions of Nepal and elsewhere. Historical LULC trends show that urban expansion varied over time, driven by shifting socioeconomic conditions, political causes, and access to public services [11,19]. In addition, LULC change has increased the rate of farmland abandonment, predominantly in the mountains and hill districts [94,95,96].
This study relies on historical data to predict LULC using the CA-Markov model and Landsat satellite images of continued urban development at moderate resolution (30 m). The classified database results may differ based on methodology and resolution of satellite images. High-quality training samples form the backbone of reliable land cover classification, and training data quality directly affects model precision, recall, and overall classification accuracy. Land use change models are essential tools for predicting how urban development, agriculture, and other natural landscapes will evolve over time. For the selection of input variables, resolution is the main source of uncertainty [97]. CA-Markov and CA-ANN parameters depend on assumptions, and these assumptions may not hold true with changing socioeconomic and environmental factors [98]. The overall prediction process depends only on the past and current states, and the predicted transitions occur in a linear and predictable manner, which often fails to capture the complexity of real change [48]. This predicted data assumption may not account for future changes, including new urban policies, population distribution, and other land use policies. To overcome these limitations, high-resolution time-series satellite images such as Sentinel-2, SPOT images, and other high-resolution images may be used for future studies [32,38]. It is recommended to delineate the boundaries of each zone to effectively control boundaryless urban development and ensure planned growth. Future research should continue using and applying more comprehensive LULC prediction models.
With proper planning and sustainable development, urban areas can become resilient, inclusive, and booming environments for future generations. The continued increase in urbanization has driven the need for new residential and commercial housing, space, and other urban development infrastructure. The alternative planning of sustainable urban growth could involve adequate consideration for urban farming as an integral part of the urban fabric, both at the household and city infrastructure levels. This holds significant potential to enhance social well-being while fostering sustainable cities of the future [99]. Urban agriculture has been widely recognized for its various social, economic, and environmental benefits [100]. Community gardening is emerging as a key strategy for sustainable development, enhancing food security, promoting public health, controlling soil erosion, reducing urban heat island (UHI) effects [49], and providing sociocultural benefits [101]. Rapid population growth in the city area and the rapid process of urbanization put pressure on food supply, so urban and peri-urban agriculture (UPA) helps make the city food system stronger and more reliable [102]. Urban agriculture in Paris is rapidly evolving with innovative projects [103]. Specifically, it has become a vital part of the urban food ecosystem and the overall economy, showing strong potential for its effective implementation with a developing-world focus in Asia [102] and in Africa [104]. It can help reduce food insecurity, improve the city environment by promoting public health, and mitigate pollution. However, successful implementation of urban agriculture strategies in the developing-world context needs a radical transformation of the planning process to facilitate sustainable urban growth.
To control boundaryless urban development in the Himalayan region, the future urban development area must be mapped and implemented based on government policies alongside communities’ priorities. Integrating government policies with accurate estimation of urban challenges such as ecosystem degradation, loss of urban forest and fertile agricultural land, loss of water resources, and the impact of climate change is essential. Similarly, any future urban growth in the region should be guided by risk-sensitive land use planning (RSLUP) and comprehensive urban risk management plans. Supporting policies must also prioritize resilient infrastructure, community-based disaster preparedness, and adequate early warning systems to successfully reduce any urban vulnerability. This approach can support the promotion of sustainable urban planning and settlement development at the national, provincial, and local levels in the Himalayan region.
Author Contributions
Conceptualization, B.R. and A.T.; methodology, B.R.; software, B.R.; validation, B.R., S.R. and A.T.; formal analysis, B.R.; investigation, writing—original draft preparation, B.R.; writing—review and editing, A.T. and S.R.; supervision, A.T.; funding acquisition, A.T. All authors have read and agreed to the published version of the manuscript.
Funding
Partial research funding was received from Research England, grant number QR GCRF2020/21- IG.0070.02.19, titled “Capacity building for monitoring nature-based engineering projects for mountainous region incorporating spatial imaging”.
Data Availability Statement
Original satellite data: Landsat time-series 5, 7, and 8/9 images (Landsat 5, hereafter Thematic Mapper (TM); Landsat 7, hereafter Enhanced Thematic Mapper Plus (ETM+); and Landsat 8/9, hereafter Operational Land Image (OLI)) were downloaded from https://earthexplorer.usgs.gov, and all classified information was included in the manuscript.
Acknowledgments
We would like to thank the editor and the anonymous reviewers for their constructive comments and suggestions to improve the quality of the manuscript.
Conflicts of Interest
The authors declare no conflicts of interest.
Appendix A

Table A1.
Satellite images (Path/Row 141/041) of Kathmandu used for the analysis were used for classification and verification based on different seasons.
Table A1.
Satellite images (Path/Row 141/041) of Kathmandu used for the analysis were used for classification and verification based on different seasons.
| Year | 1988 | 1992 | 2000 | 2008 | 2016 | 2024 |
|---|---|---|---|---|---|---|
| Months and Day | 3 April 12 October | 13 March 23 October | 19 March (TM) 22 Novembre | 26 April 20 November | 12 February 10 November | 13 March 23 October |
| Sensor | TM | TM | ETM | TM | OLI | OLI |

Table A2.
Satellite images (Path/Row 142/040) of Pokhara metropolitan city used for the analysis were used for classification and verification based on different seasons.
Table A2.
Satellite images (Path/Row 142/040) of Pokhara metropolitan city used for the analysis were used for classification and verification based on different seasons.
| Year | 1988 | 1992 | 2000 | 2008 | 2016 | 2024 |
|---|---|---|---|---|---|---|
| Months and Day | 6 February 19 October | 4 March 15 November | 15 February 10 October (1999) | 29 February 26 October | 22 March 01 November | 29 April 07 November |
| Sensor | TM | TM | ETM | TM | OLI | OLI |
Appendix B. Definition of Weights for Analysis
| Factors | Weight | Control Points |
| Distance from forest | 0.12 | 0–500 m, no suitability 500–5000, increasing suitability 5000 m, highest suitability |
| Slope | 0.16 | 0%, highest suitability 0–15%, decreasing suitability >15%, no suitability |
| Distance from major roads | 0.25 | 0–500 m, highest suitability 500–5000 m, decreasing suitability >5000 m, no suitability |
| Distance from waterbodies | 0.12 | 0–100 m, no suitability 100–7500, increasing suitability >7500 m, highest suitability |
| Distance from built-up areas | 0.35 | 0–100 m, highest suitability 100–5000 m, decreasing suitability >5000 m, no suitability |
Appendix C
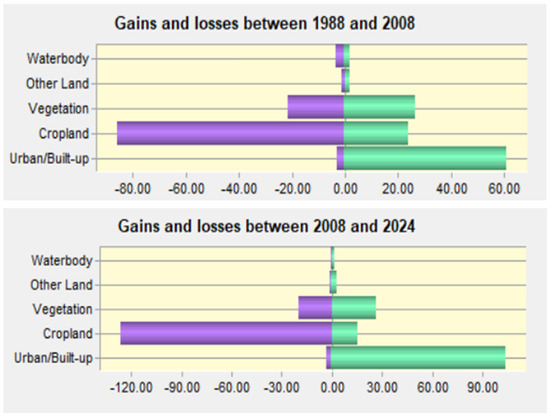
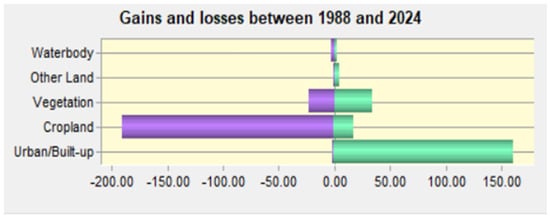
Figure A1.
Land use Transition of Kathmandu Valley (Gain and losses in Sq.km).
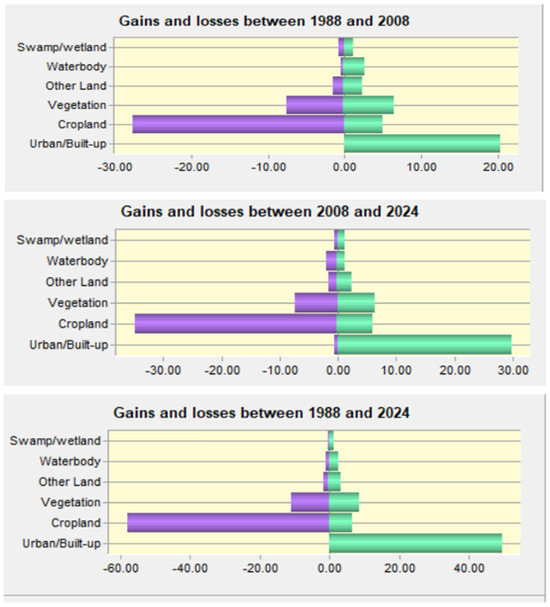
Figure A2.
Land use transition in Pokhara metropolitan city (Gain and losses in Sq.km).
References
- Fang, Z.; Ding, T.; Chen, J.; Xue, S.; Zhou, Q.; Wang, Y.; Huang, Z.; Yang, S. Impacts of land use/land cover changes on ecosystem services in ecologically fragile regions. Sci. Total Environ. 2022, 831, 154967. [Google Scholar] [CrossRef] [PubMed]
- Koko, A.F.; Wu, Y.; Abubakar, G.A.; Alabsi, A.A.N.; Hamed, R.; Bello, M. Thirty Years of Land Use/Land Cover Changes and Their Impact on Urban Climate: A Study of Kano Metropolis, Nigeria. Land 2021, 10, 1106. [Google Scholar] [CrossRef]
- Mahtta, R.; Fragkias, M.; Güneralp, B.; Mahendra, A.; Reba, M.; Wentz, E.A.; Seto, K.C. Urban land expansion: The role of population and economic growth for 300+ cities. Npj Urban Sustain. 2022, 2, 5. [Google Scholar] [CrossRef]
- Winkler, K.; Fuchs, R.; Rounsevell, M.; Herold, M. Global land use changes are four times greater than previously estimated. Nat. Commun. 2021, 12, 2501. [Google Scholar] [CrossRef] [PubMed]
- Seto, K.C. Exploring the dynamics of migration to mega-delta cities in Asia and Africa: Contemporary drivers and future scenarios. Glob. Environ. Change 2011, 21, S94–S107. [Google Scholar] [CrossRef]
- Pandey, B.; Seto, K.C. Urbanization and agricultural land loss in India: Comparing satellite estimates with census data. J. Environ. Manage. 2015, 148, 53–66. [Google Scholar] [CrossRef]
- Zhang, X.Q. The trends, promises and challenges of urbanisation in the world. Habitat. Int. 2016, 54, 241–252. [Google Scholar] [CrossRef]
- Elisa, M.; Gabriela, A. Nepal’s Urban Growth and Spatial Transition: An Initial Assessment; The World Bank: Washington, DC, USA, 2013. [Google Scholar]
- NSO. National Population and Housing Census 2021; National Planning Commission Office of the Prime Minister and Council of Ministers; National Statistical Office (NSO): Thapathali, Nepal, 2021.
- Timsina, T.P.; Anushiya, S.; Dilli Prasad, P.; Rachana, U. Trend of Urban Growth in Nepal with a Focus in Kathmandu Valley: A Review of Processes and Drivers of Change; Tomorrow’s Cities publications; The UKRI GCRF Urban Disaster Risk Hub ECCI High School Yards: Edinburgh, UK, 2020. [Google Scholar]
- Rijal, S.; Rimal, B.; Stork, N.; Sharma, H.P. Quantifying the drivers of urban expansion in Nepal. Environ. Monit. Assess. 2020, 192, 633. [Google Scholar] [CrossRef]
- Thapa, R.B.; Murayama, Y. Examining Spatiotemporal Urbanization Patterns in Kathmandu Valley, Nepal: Remote Sensing and Spatial Metrics Approaches. Remote Sens. 2009, 1, 534–556. [Google Scholar] [CrossRef]
- Thapa, R.B.; Murayama, Y. Drivers of urban growth in the Kathmandu valley, Nepal: Examining the efficacy of the analytic hierarchy process. Appl. Geogr. 2010, 30, 70–83. [Google Scholar] [CrossRef]
- Poudel, K.R.; Shrestha, S. Urban Spatial Growth and Geo-Environmental Risk in Pokhara Metropolitan City: A Geospatial Analysis. Nepal J. Environ. Sci. 2025, 13, 15–28. [Google Scholar] [CrossRef]
- Rimal, B.; Zhang, L.; Stork, N.; Sloan, S.; Rijal, S. Urban expansion occurred at the expense of agricultural lands in the Tarai region of Nepal from 1989 to 2016. Sustainability 2018, 10, 1341. [Google Scholar] [CrossRef]
- Bhattarai, K.; Adhikari, A.P.; Gautam, S.P. State of urbanization in Nepal: The official definition and reality. Environ. Chall. 2023, 13, 100776. [Google Scholar] [CrossRef]
- MoUD. National Urban Development Strategy (NUDS), Part A Main Document; Government of Nepal, Ministry of Urban Development Urban Development and Physical Planning Division, Singa Durbar: Kathmandu, Nepal, 2017.
- Poudel, K.R.; Thapa, R.B.; Ghimire, M.; Hamal, R. Urban Growth and Urban Land Use Dynamics of Pokhara City, Nepal: Challenge to Urban Sustainability? In Sustainability in South Asian Cities; Anand, S., Bhattacharyya, R., Das, M., Das, T.K., Pradhan, P.K., Eds.; Springer Nature: Singapore, 2025; pp. 421–439. [Google Scholar] [CrossRef]
- Rimal, B.; Paudel, B.; Rijal, S.; Pangali Sharma, T.P.; Pandey, P. Changing Pattern and Drivers of Land Use and Land Cover in Bagmati Province of Nepal. Himal. Rev. 2024, 45, 1–18. [Google Scholar] [CrossRef]
- KVDA. Vision 2035 and Beyond: 20 Years Strategic Development Master Plan (2015-2035) for Kathmandu Valley; Kathmandu Valley Development Authority (KVDA): Anamngar, Nepal; Nepal Government, Ministry of Urban Development (MoUD), Singa Durbar: Kathmandu, Nepal, 2015.
- MoLRM. National Land Use Policy 2015; Ministry of Land Reform and Management, Government of Nepal: Kathmandu, Nepal, 2015.
- MoLRM. Land Use Act of Nepal 2019; Ministry of Land Reform and Management, Government of Nepal: Kathmandu, Nepal, 2019.
- Nepal, P.; Khanal, N.R.; Zhang, Y.; Paudel, B.; Liu, L. Land use policies in Nepal: An overview. Land Degrad. Dev. 2020, 31, 2203–2212. [Google Scholar] [CrossRef]
- Subasinghe, S.; Estoque, R.C.; Murayama, Y. Spatiotemporal analysis of urban growth using GIS and remote sensing: A case study of the Colombo metropolitan area, Sri Lanka. ISPRS Int. J. Geo-Inf. 2016, 5, 197. [Google Scholar] [CrossRef]
- Rashid, K.J.; Akter, T.; Imrul Kayes, A.S.M.; Yachin Islam, M. Exploring the Spatio-temporal Patterns and Driving Forces of Urban Growth in Dhaka Megacity from 1990 to 2020. In Urban Commons, Future Smart Cities and Sustainability; Chatterjee, U., Bandyopadhyay, N., Setiawati, M.D., Sarkar, S., Eds.; Springer International Publishing: Cham, Switzerland, 2023; pp. 375–400. [Google Scholar] [CrossRef]
- Sarwar, S.; Khan, H.U.A.; Wu, F.; Hasan, S.; Zohaib, M.; Abbasi, M.; Hu, T. Forecasting Urban Sprawl Dynamics in Islamabad: A Neural Network Approach. Remote Sens. 2025, 17, 492. [Google Scholar] [CrossRef]
- Jedwab, R.; Loungani, P.; Yezer, A. Comparing cities in developed and developing countries: Population, land area, building height and crowding. Reg. Sci. Urban Econ. 2021, 86, 103609. [Google Scholar] [CrossRef]
- Sarif, M.O.; Rimal, B.; Stork, N.E. Assessment of changes in land use/land cover and land surface temperatures and their impact on surface Urban heat Island phenomena in the Kathmandu Valley (1988–2018). ISPRS Int. J. Geo-Inf. 2020, 9, 726. [Google Scholar] [CrossRef]
- Singh, B.; Venkatramanan, V.; Deshmukh, B. Monitoring of land use land cover dynamics and prediction of urban growth using Land Change Modeler in Delhi and its environs, India. Environ. Sci. Pollut. Res. 2022, 29, 71534–71554. [Google Scholar] [CrossRef] [PubMed]
- Hekmat, H.; Ahmad, T.; Singh, S.K.; Kanga, S.; Meraj, G.; Kumar, P. Land Use and Land Cover Changes in Kabul, Afghanistan Focusing on the Drivers Impacting Urban Dynamics during Five Decades 1973–2020. Geomatics 2023, 3, 447–464. [Google Scholar] [CrossRef]
- Wang, S.W.; Munkhnasan, L.; Lee, W.K. Land use and land cover change detection and prediction in Bhutan’s high altitude city of Thimphu, using cellular automata and Markov chain. Environ. Chall. 2021, 2, 100017. [Google Scholar] [CrossRef]
- Tariq, A.; Mumtaz, F. Modeling spatio-temporal assessment of land use land cover of Lahore and its impact on land surface temperature using multi-spectral remote sensing data. Environ. Sci. Pollut. Res. 2023, 30, 23908–23924. [Google Scholar] [CrossRef]
- Shi, Y.; Bilal, M.; Ho, H.C.; Omar, A. Urbanization and regional air pollution across South Asian developing countries—A nationwide land use regression for ambient PM2.5 assessment in Pakistan. Environ. Pollut. 2020, 266, 115145. [Google Scholar] [CrossRef]
- Hussain, S.; Mubeen, M.; Nasim, W.; Mumtaz, F.; Abdo, H.G.; Mostafazadeh, R.; Fahad, S. Assessment of future prediction of urban growth and climate change in district Multan, Pakistan using CA-Markov method. Urban Clim. 2024, 53, 101766. [Google Scholar] [CrossRef]
- Cortinovis, C.; Geneletti, D.; Haase, D. Higher immigration and lower land take rates are driving a new densification wave in European cities. Npj Urban Sustain. 2022, 2, 19. [Google Scholar] [CrossRef]
- Chakraborty, S.; Maity, I.; Dadashpoor, H.; Novotnẏ, J.; Banerji, S. Building in or out? Examining urban expansion patterns and land use efficiency across the global sample of 466 cities with million+ inhabitants. Habitat. Int. 2022, 120, 102503. [Google Scholar] [CrossRef]
- Poudel, N.; Shaw, R. Challenges of Urban Water Security and Drivers of Water Scarcity in Kathmandu Valley, Nepal. Urban Sci. 2025, 9, 54. [Google Scholar] [CrossRef]
- Farhan, M.; Wu, T.; Anwar, S.; Yang, J.; Naqvi, S.A.A.; Soufan, W.; Tariq, A. Predicting Land Use Land Cover Dynamics and Land Surface Temperature Changes Using CA-Markov-Chain Models in Islamabad, Pakistan (1992-2042). IEEE J Sel Top Appl Earth Obs. Remote Sens 2024, 7, 16255–16271. [Google Scholar] [CrossRef]
- Farhan, M.; Wu, T.; Amin, M.; Tariq, A.; Guluzade, R.; Alzahrani, H. Monitoring and prediction of the LULC change dynamics using time series remote sensing data with Google Earth Engine. Phys. Chem. Earth Parts A/B/C 2024, 136, 103689. [Google Scholar] [CrossRef]
- Küçük Matci, D.; Comert, R.; Avdan, U. Analyzing and Predicting Spatiotemporal Urban Sprawl in Eskişehir Using Remote Sensing Data. J. Indian Soc. Remote Sens. 2022, 50, 923–936. [Google Scholar] [CrossRef]
- Eastman, J.R.; Van Fossen, M.E.; Solarzano, L.A. Transition potential modeling for land cover change. GIS Spat. Anal. Model. 2005, 17, 357–386. [Google Scholar]
- Aburas, M.M.; Ho, Y.M.; Pradhan, B.; Salleh, A.H.; Alazaiza, M.Y.D. Spatio-temporal simulation of future urban growth trends using an integrated CA-Markov model. Arab. J. Geosci. 2021, 14, 131. [Google Scholar] [CrossRef]
- Keshtkar, H.; Voigt, W. Potential impacts of climate and landscape fragmentation changes on plant distributions: Coupling multi-temporal satellite imagery with GIS-based cellular automata model. Ecol. Inform. 2016, 32, 145–155. [Google Scholar] [CrossRef]
- Wu, D.; Liu, J.; Wang, S.; Wang, R. Simulating urban expansion by coupling a stochastic cellular automata model and socioeconomic indicators. Stoch. Environ. Res. Risk Assess. 2010, 24, 235–245. [Google Scholar] [CrossRef]
- Moghadam, H.S.; Helbich, M. Spatiotemporal urbanization processes in the megacity of Mumbai, India: A Markov chains-cellular automata urban growth model. Appl. Geogr. 2013, 40, 140–149. [Google Scholar] [CrossRef]
- Estoque, R.C.; Ooba, M.; Togawa, T.; Hijioka, Y.; Murayama, Y. Monitoring global land-use efficiency in the context of the UN 2030 Agenda for Sustainable Development. Habitat Int. 2021, 115, 102403. [Google Scholar] [CrossRef]
- Hu, G.; Li, X.; Liu, X.; Wang, S.; Zhang, X.; Shi, X.; Bai, X.; Hubacek, K. Mitigating the ripple effects of urbanization on farmland productivity and ecological security through inclusive urbanization strategies. Npj Urban Sustain. 2025, 5, 12. [Google Scholar] [CrossRef]
- Tahir, Z.; Haseeb, M.; Mahmood, S.A.; Batool, S.; Abdullah-Al-Wadud, M.; Ullah, S.; Tariq, A. Predicting land use and land cover changes for sustainable land management using CA-Markov modelling and GIS techniques. Sci. Rep. 2025, 15, 3271. [Google Scholar] [CrossRef] [PubMed]
- Tapia, C.; Randall, L.; Wang, S.; Aguiar Borges, L. Monitoring the contribution of urban agriculture to urban sustainability: An indicator-based framework. Sustain. Cities Soc. 2021, 74, 103130. [Google Scholar] [CrossRef]
- Tiwary, A.; Brown, N. Emerging Perspectives on Diverse Nature-Oriented Sustainability Strategies. Sustainability 2024, 16, 881. [Google Scholar] [CrossRef]
- Haack, B.N.; Rafter, A. Urban growth analysis and modeling in the Kathmandu Valley, Nepal. Habitat. Int. 2006, 30, 1056–1065. [Google Scholar] [CrossRef]
- Ishtiaque, A.; Shrestha, M.; Chhetri, N. Rapid urban growth in the Kathmandu Valley, Nepal: Monitoring land use land cover dynamics of a himalayan city with landsat imageries. Environments 2017, 4, 72. [Google Scholar] [CrossRef]
- Thapa, R.B.; Murayama, Y. Scenario based urban growth allocation in Kathmandu Valley, Nepal. Landsc. Urban Plan. 2012, 105, 140–148. [Google Scholar] [CrossRef]
- Haack, B. A History and Analysis of Mapping Urban Expansion in the Kathmandu Valley, Nepal. Cartogr. J. 2009, 46, 233–241. [Google Scholar] [CrossRef]
- Fort, M. The Pokhara Valley: A Product of a Natural Catastrophe. In Geomorphological Landscapes of the World, Dordrecht; Migon, P., Ed.; Springer: Dordrecht, The Netherlands, 2010; pp. 265–274. [Google Scholar] [CrossRef]
- Paudel, B.; Zhang, Y.; Yan, J.; Rai, R.; Li, L. Farmers’ perceptions of agricultural land use changes in Nepal and their major drivers. J. Environ. Manage. 2019, 235, 432–441. [Google Scholar] [CrossRef]
- Rai, R.; Zhang, Y.; Paudel, B.; Acharya, B.K.; Basnet, L. Land use and land cover dynamics and assessing the ecosystem service values in the trans-boundary Gandaki River Basin, Central Himalayas. Sustainability 2018, 10, 3052. [Google Scholar] [CrossRef]
- Rimal, B.; Zhang, L.; Keshtkar, H.; Sun, X.; Rijal, S. Quantifying the spatiotemporal pattern of urban expansion and hazard and risk area identification in the Kaski District of Nepal. Land 2018, 7, 37. [Google Scholar] [CrossRef]
- Masek, J.G.; Vermote, E.F.; Saleous, N.E.; Wolfe, R.; Hall, F.G.; Huemmrich, K.F.; Gao, F.; Kutler, J.; Lim, T.-K. A Landsat surface reflectance dataset for North America, 1990-2000. IEEE Geosci. Remote Sens. Lett. 2006, 3, 68–72. [Google Scholar] [CrossRef]
- USGS. Landsat 8-9 Collection 2 (C2) Level 2 Science Product (L2SP) Guide; Department of the Interior U.S. Geological Survey: Reston, VA, USA, 2024.
- Mahmoud, M.I.; Duker, A.; Conrad, C.; Thiel, M.; Ahmad, H.S. Analysis of settlement expansion and urban growth modelling using geoinformation for assessing potential impacts of urbanization on climate in Abuja City, Nigeria. Remote Sens. 2016, 8, 220. [Google Scholar] [CrossRef]
- Rimal, B.; Zhang, L.; Keshtkar, H.; Haack, B.N.; Rijal, S.; Zhang, P. Land use/land cover dynamics and modeling of urban land expansion by the integration of cellular automata and markov chain. ISPRS Int. J. Geo-Inf. 2018, 7, 154. [Google Scholar] [CrossRef]
- Kavzoglu, T.; Colkesen, I. A kernel functions analysis for support vector machines for land cover classification. Int. J. Appl. Earth Obs. Geoinf. 2009, 11, 352–359. [Google Scholar] [CrossRef]
- Pal, M.; Mather, P.M. Support vector machines for classification in remote sensing. Int. J. Remote Sens. 2005, 26, 1007–1011. [Google Scholar] [CrossRef]
- Rimal, B.; Sharma, R.; Kunwar, R.; Keshtkar, H.; Stork, N.E.; Rijal, S.; Rahman, S.A.; Baral, H. Effects of land use and land cover change on ecosystem services in the Koshi River Basin, Eastern Nepal. Ecosyst. Serv. 2019, 38, 100963. [Google Scholar] [CrossRef]
- Clarke, K.C. Land Use Change Modeling with SLEUTH: Improving Calibration with a Genetic Algorithm. In Geomatic Approaches for Modeling Land Change Scenarios; Camacho Olmedo, M.T., Paegelow, M., Mas, J.-F., Escobar, F., Eds.; Springer International Publishing: Cham, Switzerland, 2018; pp. 139–161. [Google Scholar] [CrossRef]
- Rodrigues, H.; Soares-Filho, B. A short presentation of Dinamica EGO. In Geomatic Approaches for Modeling Land Change Scenarios; Springer: Berlin/Heidelberg, Germany, 2017; pp. 493–498. [Google Scholar]
- Verburg, P.H.; Overmars, K.P. Dynamic Simulation of Land-Use Change Trajectories with the Clue-S Model. In Modelling Land-Use Change: Progress and Applications; Koomen, E., Stillwell, J., Bakema, A., Scholten, H.J., Eds.; Springer: Dordrecht, The Netherlands, 2007; pp. 321–337. [Google Scholar] [CrossRef]
- Zhang, Z.; Wei, Y.; Li, X.; Wan, D.; Shi, Z. Study on Tianjin Land-Cover Dynamic Changes, Driving Factor Analysis, and Forecasting. Land 2024, 13, 726. [Google Scholar] [CrossRef]
- Chisanga, C.B.; Phiri, D.; Mubanga, K.H. Multi-decade land cover/land use dynamics and future predictions for Zambia: 2000–2030. Discov. Environ. 2024, 2, 38. [Google Scholar] [CrossRef]
- Keshtkar, H.; Voigt, W. A spatiotemporal analysis of landscape change using an integrated Markov chain and cellular automata models. Model Earth Syst. Environ. 2016, 2, 1–13. [Google Scholar] [CrossRef]
- Belay, H.; Melesse, A.M.; Tegegne, G. Scenario-Based Land Use and Land Cover Change Detection and Prediction Using the Cellular Automata–Markov Model in the Gumara Watershed, Upper Blue Nile Basin, Ethiopia. Land 2024, 13, 396. [Google Scholar] [CrossRef]
- Hossein, M.d.K.; Ahmed, A.; Uddin, M.J.; Saifullah, A.S.M.; Babu, M.d.A.H.; Sarker, T. Prediction of land use and land cover changes (LULC) and urban growth analysis in Dhaka Metropolitan Area (DMA) using CA-Markov model and geospatial techniques. Arab. J. Geosci. 2023, 16, 468. [Google Scholar] [CrossRef]
- UNDESA. 2018 Revision of the World Urbanization Prospects; Population Division of the United Nations Department of Economic and Social Affairs (UN DESA): New York, NY, USA, 2019. [Google Scholar]
- Devkota, P.; Dhakal, S.; Shrestha, S.; Shrestha, U.B. Land use land cover changes in the major cities of Nepal from 1990 to 2020. Environ. Sustain. Indic. 2023, 17, 100227. [Google Scholar] [CrossRef]
- Thapa, S.; Sinclair, H.D.; Creed, M.J.; Borthwick, A.G.L.; Watson, C.S.; Muthusamy, M. Sediment Transport and Flood Risk: Impact of Newly Constructed Embankments on River Morphology and Flood Dynamics in Kathmandu, Nepal. Water Resour. Res. 2024, 60, e2024WR037742. [Google Scholar] [CrossRef]
- Singh, R.P.; Dhakal, J. Problems and Prospects of Urbanization in Kathmandu Valley. Int. J. Atharva 2024, 2, 19–33. [Google Scholar] [CrossRef]
- Chitrakar, R.M.; Baker, D.C.; Guaralda, M. Urban growth and development of contemporary neighbourhood public space in Kathmandu Valley, Nepal. Habitat. Int. 2016, 53, 30–38. [Google Scholar] [CrossRef]
- Tang, J.; Di, L. Past and future trajectories of farmland loss due to rapid urbanization using Landsat imagery and the Markov-CA model: A case study of Delhi, India. Remote Sens. 2019, 11, 180. [Google Scholar] [CrossRef]
- Abbas, H.; Tao, W.; Khan, G.; Alrefaei, A.F.; Iqbal, J.; Albeshr, M.F.; Kulsoom, I. Multilayer perceptron and Markov Chain analysis based hybrid-approach for predicting land use land cover change dynamics with Sentinel-2 imagery. Geocarto Int. 2023, 38, 2256297. [Google Scholar] [CrossRef]
- Fonseka, H.P.U.; Premasiri, H.M.R.; Chaminda, S.P.; Zhang, H. Morphological and Functional Polycentric Urbanization in Colombo Metropolitan of Sri Lanka Using Time-Series Satellite Images from 1988–2022. Sustainability 2024, 16, 7816. [Google Scholar] [CrossRef]
- Dixit, A.; Shaw, R. Smart Cities in Nepal: The concept, evolution and emerging patterns. Urban Gov. 2023, 3, 211–218. [Google Scholar] [CrossRef]
- D’Amour, C.B.; Reitsma, F.; Baiocchi, G.; Barthel, S.; Güneralp, B.; Erb, K.H.; Creutzig, F.; Seto, K.C. Future urban land expansion and implications for global croplands. Proc. Natl. Acad. Sci. USA 2017, 114, 8939–8944. [Google Scholar] [CrossRef] [PubMed]
- Kargel, J.S.; Paudel, L.; Leonard, G.; Regmi, D.; Joshi, S.; Poudel, K.; Thapa, B.; Watanabe, T.; Fort, M. Causes and Human Impacts of the Seti River (Nepal) Disaster of 2012. In Proceedings of the Glacial Flooding & Disaster Risk Management Knowledge Exchange and Field Training, Huaraz, Peru, 11–24 July 2013. [Google Scholar]
- Fischer, M.; Lehnigk, K.; Lützow, N.; Brettin, J.; Veh, G.; Larsen, I.J.; Korup, O.; Walz, A. Himalayan hazard cascades—modern and medieval outburst floods in Pokhara, Nepal. Earth Surf. Process. Landf. 2023, 48, 1135–1151. [Google Scholar] [CrossRef]
- Gurung, D.R.; Maharjan, S.B.; Khanal, N.R.; Joshi, G.; Murthy, M.S.R. Nepal Disaster Report 2015; Seti Flash Flood: Technical Analysis and DRR Interventions; Government of Nepal Ministry of Home Affairs: Kathmandu, Nepal, 2015.
- Gurung, N.; Fort, M.; Bell, R.; Arnaud-Fassetta, G.; Maharjan, N.R. Hydro-torrential hazard vs. anthropogenic activities along the Seti valley, Kaski, Nepal: Assessment and recommendations from a risk perspective. J. Nepal Geol. Soc. 2021, 62, 58–87. [Google Scholar] [CrossRef]
- Shrestha, A.; Thapa, S.; Ghimire, B.N.S. Flood Hazard Mapping and Vulnerability Analysis Along Seti River in Pokhara Metropolitan City. In Water Security and Sustainability; Bhuiyan, C., Flügel, W.-A., Jain, S.K., Eds.; Springer: Singapore, 2021; pp. 183–190. [Google Scholar]
- Danegulu, A.; Karki, S.; Bhattarai, P.K.; Pandey, V.P. Characterizing urban flooding in the Kathmandu Valley, Nepal: The influence of urbanization and river encroachment. Nat. Hazards 2024, 120, 10923–10947. [Google Scholar] [CrossRef]
- Bhattarai, K.; Conway, D. Urban Vulnerabilities in the Kathmandu Valley, Nepal: Visualizations of Human/Hazard Interactions. J. Geogr. Inf. Syst. 2010, 2, 63–84. [Google Scholar] [CrossRef]
- UN-Habitat. Urban Challenges Emerging One Month after Nepal Earthquake; UN-Habitat: Kathmandu, Nepal, 25 May 2015; Available online: https://unhabitat.org/urban-challenges-emerging-one-month-after-nepal-earthquake (accessed on 20 June 2025).
- Goda, K.; Kiyota, T.; Pokhrel, R.M.; Chiaro, G.; Katagiri, T.; Sharma, K.; Wilkinson, S. The 2015 Gorkha Nepal earthquake: Insights from earthquake damage survey. Front. Built Environ. 2015, 1, 8. [Google Scholar] [CrossRef]
- Khanal, N.; Uddin, K.; Matin, M.A.; Tenneson, K. Automatic detection of spatiotemporal urban expansion patterns by fusing OSM and Landsat data in Kathmandu. Remote Sens. 2019, 11, 2296. [Google Scholar] [CrossRef]
- Paudel, B.; Wu, X.; Zhang, Y.; Rai, R.; Liu, L.; Zhang, B.; Khanal, N.R.; Koirala, H.L.; Nepal, P. Farmland abandonment and its determinants in the different ecological villages of the Koshi river basin, central Himalayas: Synergy of high-resolution remote sensing and social surveys. Environ. Res. 2020, 188, 109711. [Google Scholar] [CrossRef] [PubMed]
- Rai, R.; Zhang, Y.; Paudel, B.; Khanal, N.R. Status of farmland abandonment and its determinants in the transboundary Gandaki River Basin. Sustainability 2019, 11, 5267. [Google Scholar] [CrossRef]
- Chaudhary, S.; Wang, Y.; Dixit, A.M.; Khanal, N.R.; Xu, P.; Fu, B.; Yan, K.; Liu, Q.; Lu, Y.; Li, M. A synopsis of farmland abandonment and its driving factors in Nepal. Land 2020, 9, 84. [Google Scholar] [CrossRef]
- Palmate, S.S.; Wagner, P.D.; Fohrer, N.; Pandey, A. Assessment of Uncertainties in Modelling Land Use Change with an Integrated Cellular Automata–Markov Chain Model. Environ. Model. Assess. 2022, 27, 275–293. [Google Scholar] [CrossRef]
- Behera, A.; Rawat, K.S.; Kumar, S.; Almuflih, A.S.; Almakayeel, N.; Qureshi, M.R.N. Simulation and projection of land use and land cover using remote sensing data and CA–Markov model case study. Geocarto. Int. 2025, 40, 2450441. [Google Scholar] [CrossRef]
- Chen, C.W. Can smart cities bring happiness to promote sustainable development? Contexts and clues of subjective well-being and urban livability. Dev. Built Environ. 2023, 13, 100108. [Google Scholar] [CrossRef]
- Pradhan, P.; Callaghan, M.; Hu, Y.; Dahal, K.; Hunecke, C.; Reusswig, F.; Lotze-Campen, H.; Kropp, J.P. A systematic review highlights that there are multiple benefits of urban agriculture besides food. Glob. Food Sec. 2023, 38, 100700. [Google Scholar] [CrossRef]
- Ilieva, R.T.; Cohen, N.; Israel, M.; Specht, K.; Fox-Kämper, R.; Fargue-Lelièvre, A.; Poniży, L.; Schoen, V.; Caputo, S.; Kirby, C.K.; et al. The Socio-Cultural Benefits of Urban Agriculture: A Review of the Literature. Land 2022, 11, 622. [Google Scholar] [CrossRef]
- FAO; Rikolto; RUAF. Urban and Peri-Urban Agriculture Sourcebook, From Production to Food Systems; FAO: Rome, Italy, 2022. [Google Scholar] [CrossRef]
- Aubry, C.; Daniel, A.-C. Innovative Commercial Urban Agriculture in the Paris Metropolitan Area. In Toward Sustainable Relations Between Agriculture and the City; Soulard, C.-T., Perrin, C., Valette, E., Eds.; Springer International Publishing: Cham, Switzerland, 2017; pp. 147–162. [Google Scholar] [CrossRef]
- Mwetulundila, P.; Indongo, N. The benefits of urban agriculture toward sustainable cities. Urban Agric. Reg. Food Syst. 2025, 10, e70016. [Google Scholar] [CrossRef]
Disclaimer/Publisher’s Note: The statements, opinions and data contained in all publications are solely those of the individual author(s) and contributor(s) and not of MDPI and/or the editor(s). MDPI and/or the editor(s) disclaim responsibility for any injury to people or property resulting from any ideas, methods, instructions or products referred to in the content. |
© 2025 by the authors. Licensee MDPI, Basel, Switzerland. This article is an open access article distributed under the terms and conditions of the Creative Commons Attribution (CC BY) license (https://creativecommons.org/licenses/by/4.0/).