Article

Evaluating Urban Underground Space Supply–Demand Imbalances Based on Remote Sensing and POI Data: Evidence from Nanjing, China

by
Ziyi Wang
1,
Guojie Liu
1,
Yi Hu
2 and
Liang Sun
1,*
1
School of Architecture and Design, China University of Mining and Technology, Xuzhou 221116, China
2
Urban Planning and Design Research Institute, Nanjing University, Nanjing 210018, China
*
Author to whom correspondence should be addressed.
Land 2025, 14(8), 1671; https://doi.org/10.3390/land14081671
Submission received: 23 June 2025 / Revised: 8 August 2025 / Accepted: 12 August 2025 / Published: 19 August 2025

Abstract

With rapid urbanization, the development of Urban Underground Space (UUS) has become essential to addressing various urban challenges. However, the accelerated expansion of UUS has also introduced problems such as duplicated infrastructure, functional deficiencies, and underutilized spaces. Fundamentally, these issues result from imbalances between the supply and demand for UUS, a phenomenon particularly pronounced in the central areas of major cities. Therefore, employing scientific methods to accurately identify and quantify these gaps is crucial. Leveraging recent advances in remote sensing and point-of-interest (POI) data, this study constructs a multi-source data-driven framework for assessing UUS supply–demand relationships, applied using a grid-based analysis to the central urban area of Nanjing. The results indicate that both the highest supply capacity and demand intensity occur in Xinjiekou Street in Nanjing’s Old City. Most high and medium–high supply and demand zones are concentrated in the Old City. Areas with prominent supply–demand conflicts are identified and classified into five types using the Jenks natural breaks method, further categorized into three groups based on their spatial characteristics, with tailored development strategies proposed accordingly. The proposed evaluation framework provides a robust scientific approach for analyzing UUS supply–demand relationships, offering significant theoretical and practical value for refined urban governance in large cities with extensive data availability.

1. Introduction

Urban underground space (UUS) refers to the subsurface spatial system within an urban administrative area, which may be either naturally formed or artificially constructed, and functions as an extension and functional supplement to above-ground space [1]. With the acceleration of urbanization, urban land resources have become increasingly scarce, making the development of UUS an inevitable solution for alleviating land shortages, optimizing urban functional structures, and meeting the evolving needs of urban development [2]. This issue has attracted widespread international attention. For example, the International Conference on UUS Utilization held in Tokyo declared that “the 21st century is the century of underground space development” [3]. Furthermore, the United Nations’ 2030 Agenda for Sustainable Development has emphasized the critical role played by underground space in energy conservation, disaster prevention, and maintaining stable urban microclimates.
In recent years, as urban development has increasingly adopted a three-dimensional approach, the extent of underground space development has expanded to include transportation, public service facilities, municipal infrastructure, and other sectors [3,4]. However, uneven development levels across different regions have led to issues such as oversaturation in older urban areas, underdevelopment in new districts, and spatial mismatches. These problems not only result in the inefficient use of urban resources but also contribute to increased operational costs for urban systems [5]. Fundamentally, these imbalances arise from mismatches between the supply and demand of UUS. Such contradictions diminish the strategic value of UUS as a resource and, to some extent, constrain the broader process of sustainable urban development. Existing research has examined UUS development from various perspectives, including geological conditions, land use, and policy guidance [6,7,8]. Nevertheless, significant gaps remain in the spatial identification and quantitative evaluation of supply–demand relationships. On the one hand, many studies heavily rely on traditional statistical data or planning documents, which are inadequate for accurately capturing the actual status of UUS at the regional scale. On the other hand, there is a lack of effective methods for identifying spatial and temporal mismatches between supply potential and actual demand, hindering the formulation of differentiated and refined spatial governance strategies. With the rapid advancement of remote sensing technologies and geospatial big data, urban spatial analysis methods have undergone continuous evolution. Multi-source remote sensing data have been widely utilized in domains such as urban heat environment monitoring, traffic pattern analysis, and economic activity assessment, offering high spatiotemporal resolution and valuable macro-scale insights [9,10,11,12]. However, in the realm of underground space research, the integration and application of multi-source remote sensing data remain limited. These data sources have not yet been systematically employed for supply–demand assessments, thereby impeding the accurate identification of spatial disparities and functional mismatches in UUS.
Building on the above, this study selects the central urban area of Nanjing as its research region and integrates multi-source remote sensing and geospatial data, including nighttime light imagery, population grid data, and point-of-interest (POI) information. A coupling evaluation model for UUS supply and demand is developed to systematically identify the spatial structure and characteristics of supply–demand relationships in different urban areas, analyze the underlying driving mechanisms, and propose differentiated spatial optimization strategies based on the classification of regional types.
This paper focuses on the following three core research objectives:
(1)
Construct an indicator system for UUS supply and demand based on remote sensing and POI data;
(2)
Identify the supply–demand patterns of underground space in Nanjing;
(3)
Propose development strategies tailored to different types of underground space regions.

2. Literature Review

2.1. Evaluation of UUS Supply and Demand

At present, numerous scholars have conducted research on the supply and demand of UUS, and studies on UUS supply can generally be categorized into two main approaches [13]. The first approach evaluates UUS based on spatial performance, employing methods such as the sales comparison approach, income capitalization method, replacement cost method, valuation method, and substitution cost method [12,13,14,15,16]. For instance, Liu et al. (2021) constructed a disaster prevention benefit model for underground space using the replacement cost method, revealing a strong correlation between disaster prevention benefits and urban resilience [14]. Ma et al. (2021) proposed a monetized evaluation method based on the substitution cost approach to assess the sustainability of the Bund Tunnel in Shanghai [15]. Mavrikos et al. (2021) integrated real estate appraisal and environmental economics to develop a comprehensive methodology for estimating the market value and environmental benefits of UUS, demonstrating that approximately one-third of its value can be attributed to environmental benefits [16]. The second approach emphasizes the construction of macro-level, multidimensional indicator systems to assess the potential of UUS resources. For example, Peng and Peng (2018) proposed an evaluation method incorporating construction suitability, potential value, and volume estimation [17]. Bobylev (2010) examined the use of UUS in Alexanderplatz, Berlin, finding that the function and density of underground infrastructure were closely related to land use types and geological conditions [18]. In this study, we select indicators that accurately reflect the current development status of UUS, forming the foundation for the supply-side evaluation system.
On the demand side, factors such as GDP, population density, geographical location, and user characteristics have been identified as key drivers of UUS utilization. For example, Deng et al. (2024) conducted a statistical analysis and found that per-capita GDP and GDP per kilometer were the primary determinants of UUS demand [19]. Li et al. (2016), through field research in Xinjiekou, Nanjing, emphasized the importance of factors such as location, building type, and visitor volume in demand forecasting for UUS [20]. He et al. (2012) employed regression analysis to develop a demand forecasting model for UUS in Shanghai, revealing that both population density and per-capita GDP had significant positive effects on UUS demand [21]. From the perspective of population and urban development needs, this study selects indicators such as urban location, socioeconomic development, and land use planning to establish the demand-side evaluation method (Table 1).

2.2. Applications of Remote Sensing and Geospatial Big Data in Urban Spatial Studies

The application of remote sensing and geospatial big data in urban research has gradually expanded from traditional surface monitoring to more advanced analyses, including the identification of social activities, economic distribution, and spatial behavior. Datasets such as remote sensing imagery, nighttime light data, land use classification, population heatmaps, and POI data have been widely utilized in studies related to urban heat island detection, building extraction, and functional zoning [30,31,32,33]. Notably, nighttime light remote sensing data have proven to be effective in delineating urban economic intensity and identifying activity hotspots, and they are frequently used to demarcate “urban cores” [32,34]. High-resolution population grid datasets transcend administrative boundaries and are applicable to both large-scale and micro-scale analyses. POI data are often integrated with remote sensing imagery for land use classification [10] and to analyze the distribution of service facilities [35]. Within the field of UUS research, Xu et al. combined space syntax analysis with POI data to identify the factors influencing underground space vitality in Wujiao Plaza, Shanghai [36]. Yin et al. employed POI data to determine the driving factors behind the development of underground parking spaces in Xi’an, providing a scientific basis for optimizing the spatial layout of underground parking in Xi’an’s central urban area [37]. In summary, existing studies on UUS supply and demand have primarily concentrated on economic valuation and demand-driving mechanisms. However, these studies are often constrained by limited spatial precision and outdated data, making it challenging to accurately capture the spatial characteristics of supply–demand mismatches in central urban areas. The advent of geospatial big data—such as remote sensing and POI datasets—has opened up new avenues for the precise identification and dynamic assessment of UUS supply–demand relationships.
Based on these considerations, this study integrates multi-source remote sensing and POI data to construct an evaluation framework for assessing the coupling between UUS supply and demand. Taking the central urban area of Nanjing as a case study, this research identifies spatial differences in UUS supply and demand, classifies regional types, and proposes corresponding spatial optimization strategies.

3. Study Area and Data Sources

3.1. Study Area

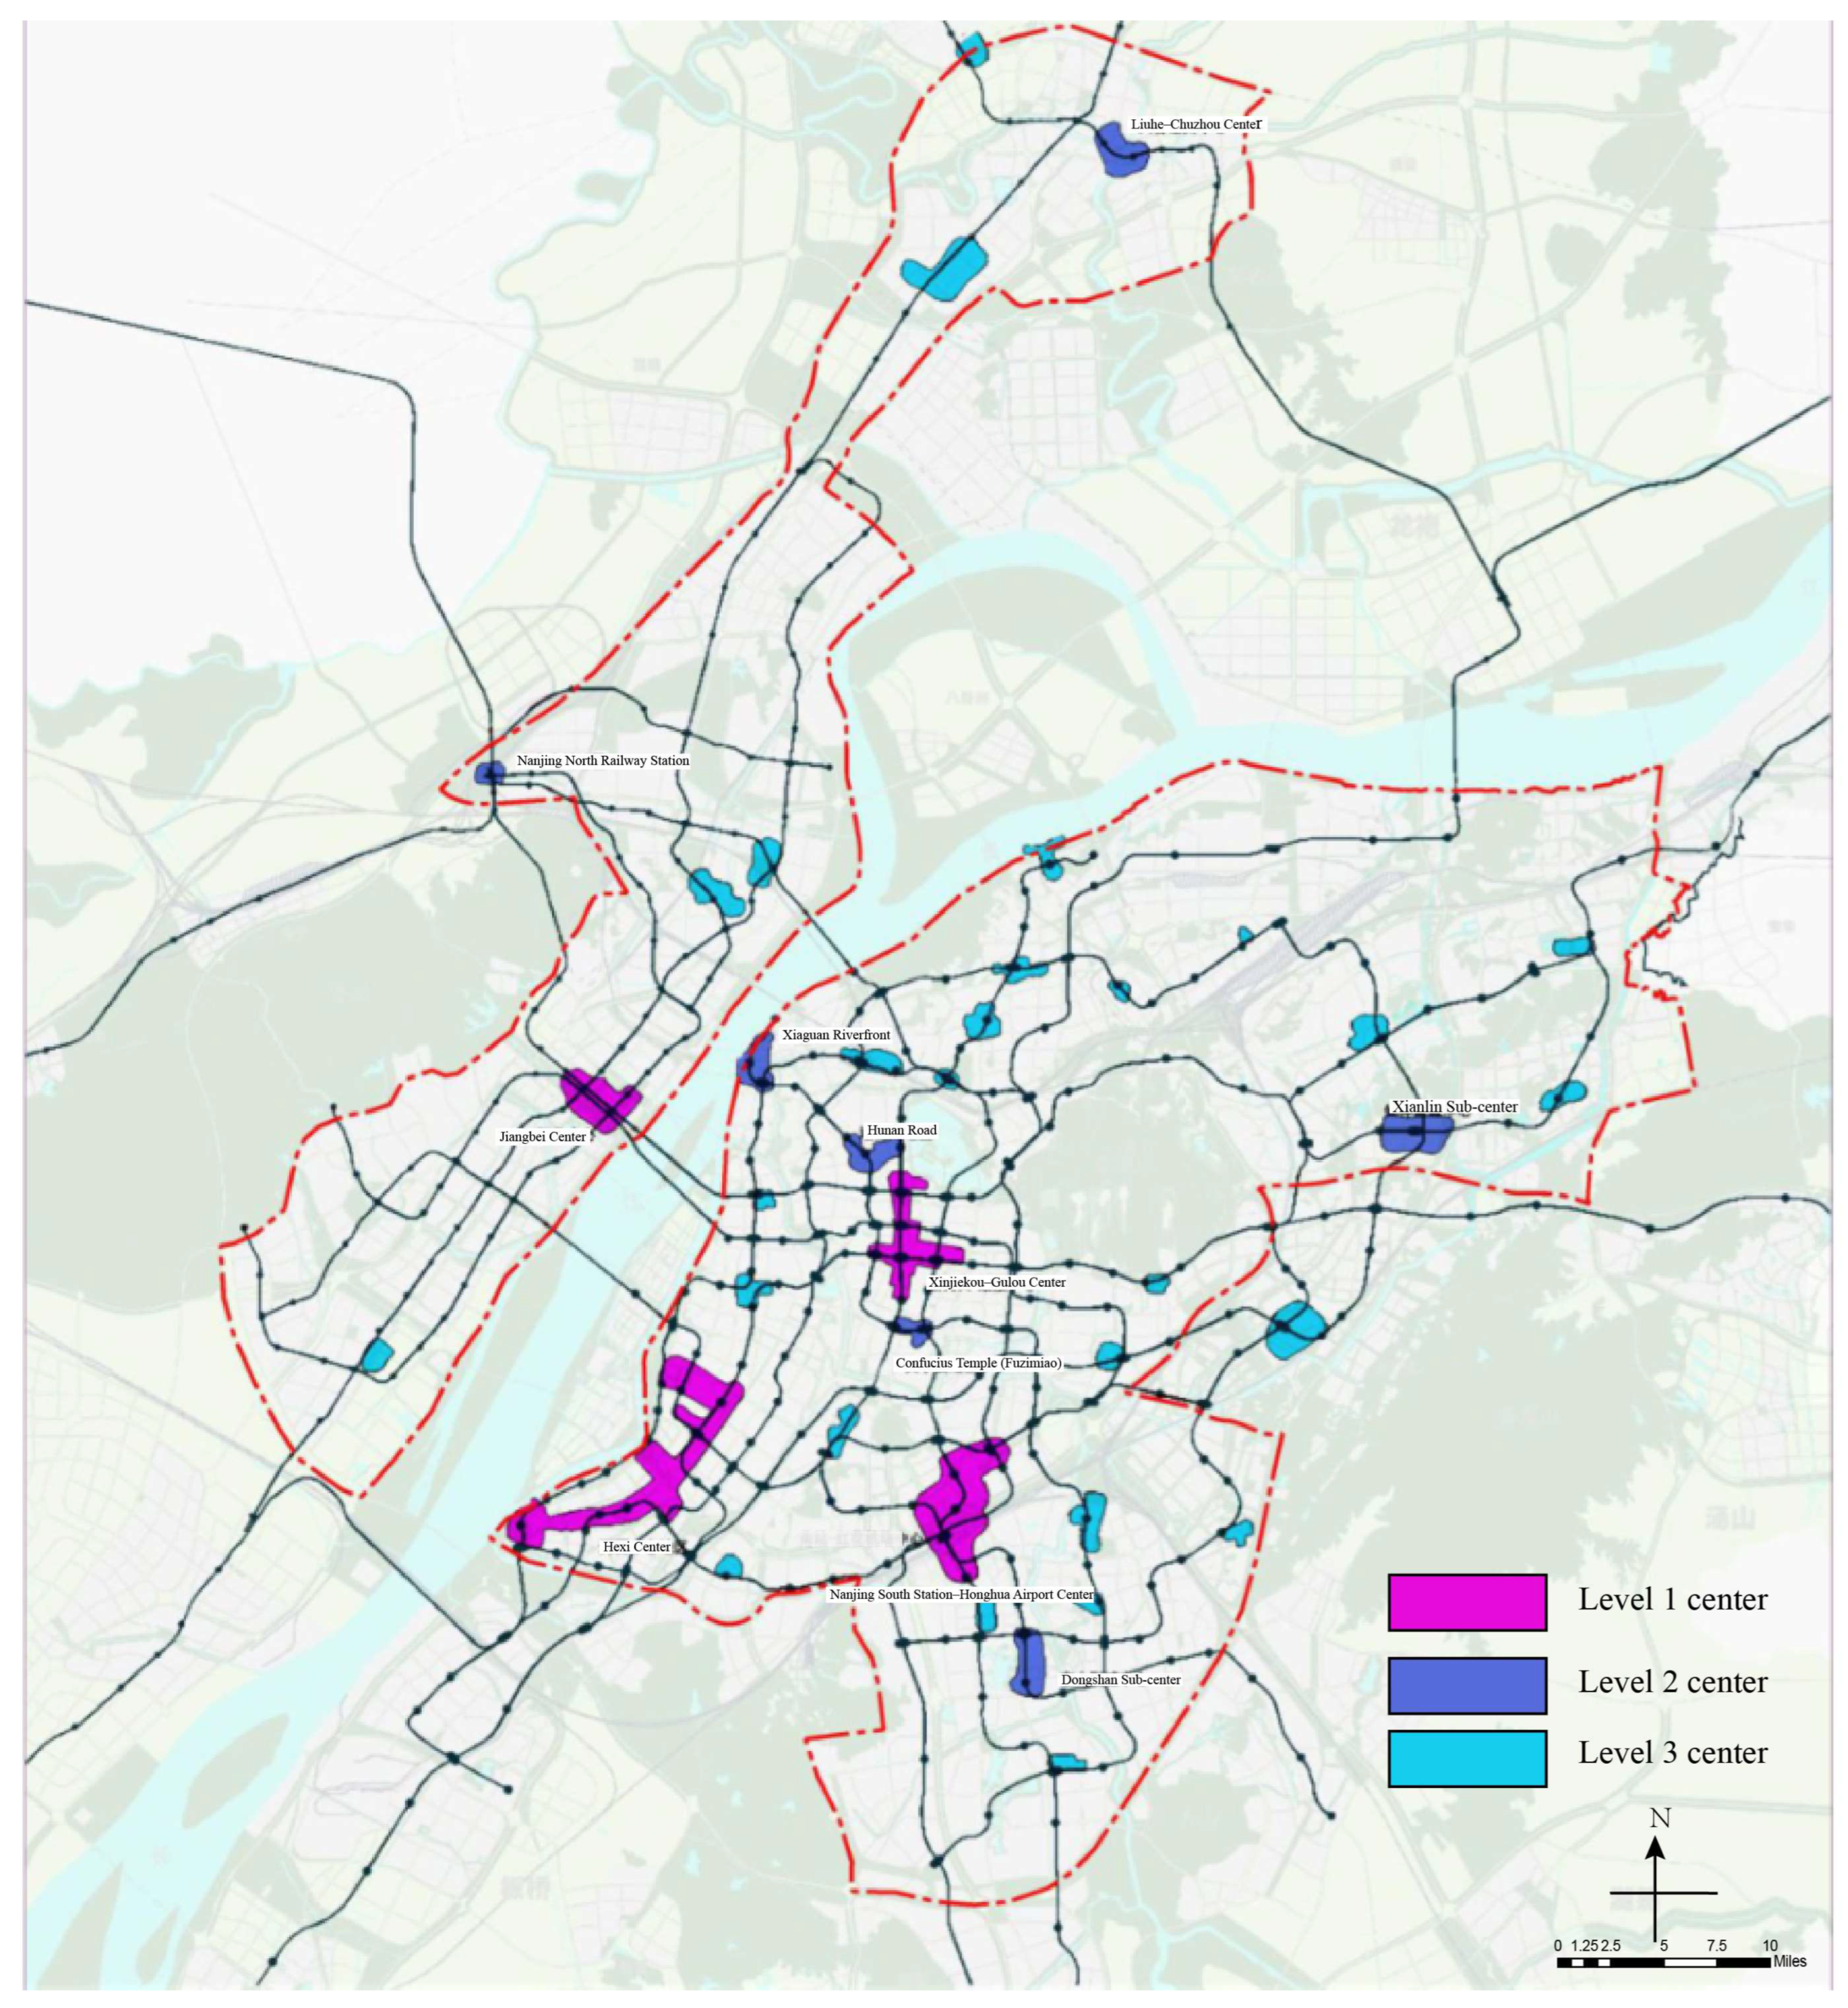
Nanjing is situated on the alluvial plain in the lower reaches of the Yangtze River (31°14′–32°37′ N, 118°22′–119°14′ E). As a core city within the world-class Yangtze River Delta urban agglomeration and a vital hub of the Yangtze River Economic Belt, Nanjing serves as a national gateway, facilitating development and connectivity to Central and Western China. The focus of this study is the central urban area of Nanjing, which covers a total area of 846 square kilometers. Its spatial structure follows a “one core and four sub-centers” pattern. The core area comprises four traditional districts: the Old City, Hexi, Tiebei, and Chengnan. The four sub-centers include Jiangbei New District, Dongshan Area, Qilin Area, and Xianlin Area [25], as shown in Figure 1. This region encompasses Nanjing’s primary administrative, commercial, transportation, and cultural functions. It also represents the most spatially constrained and intensively developed zone in terms of underground space utilization.

The Development Status of Underground Space in Nanjing

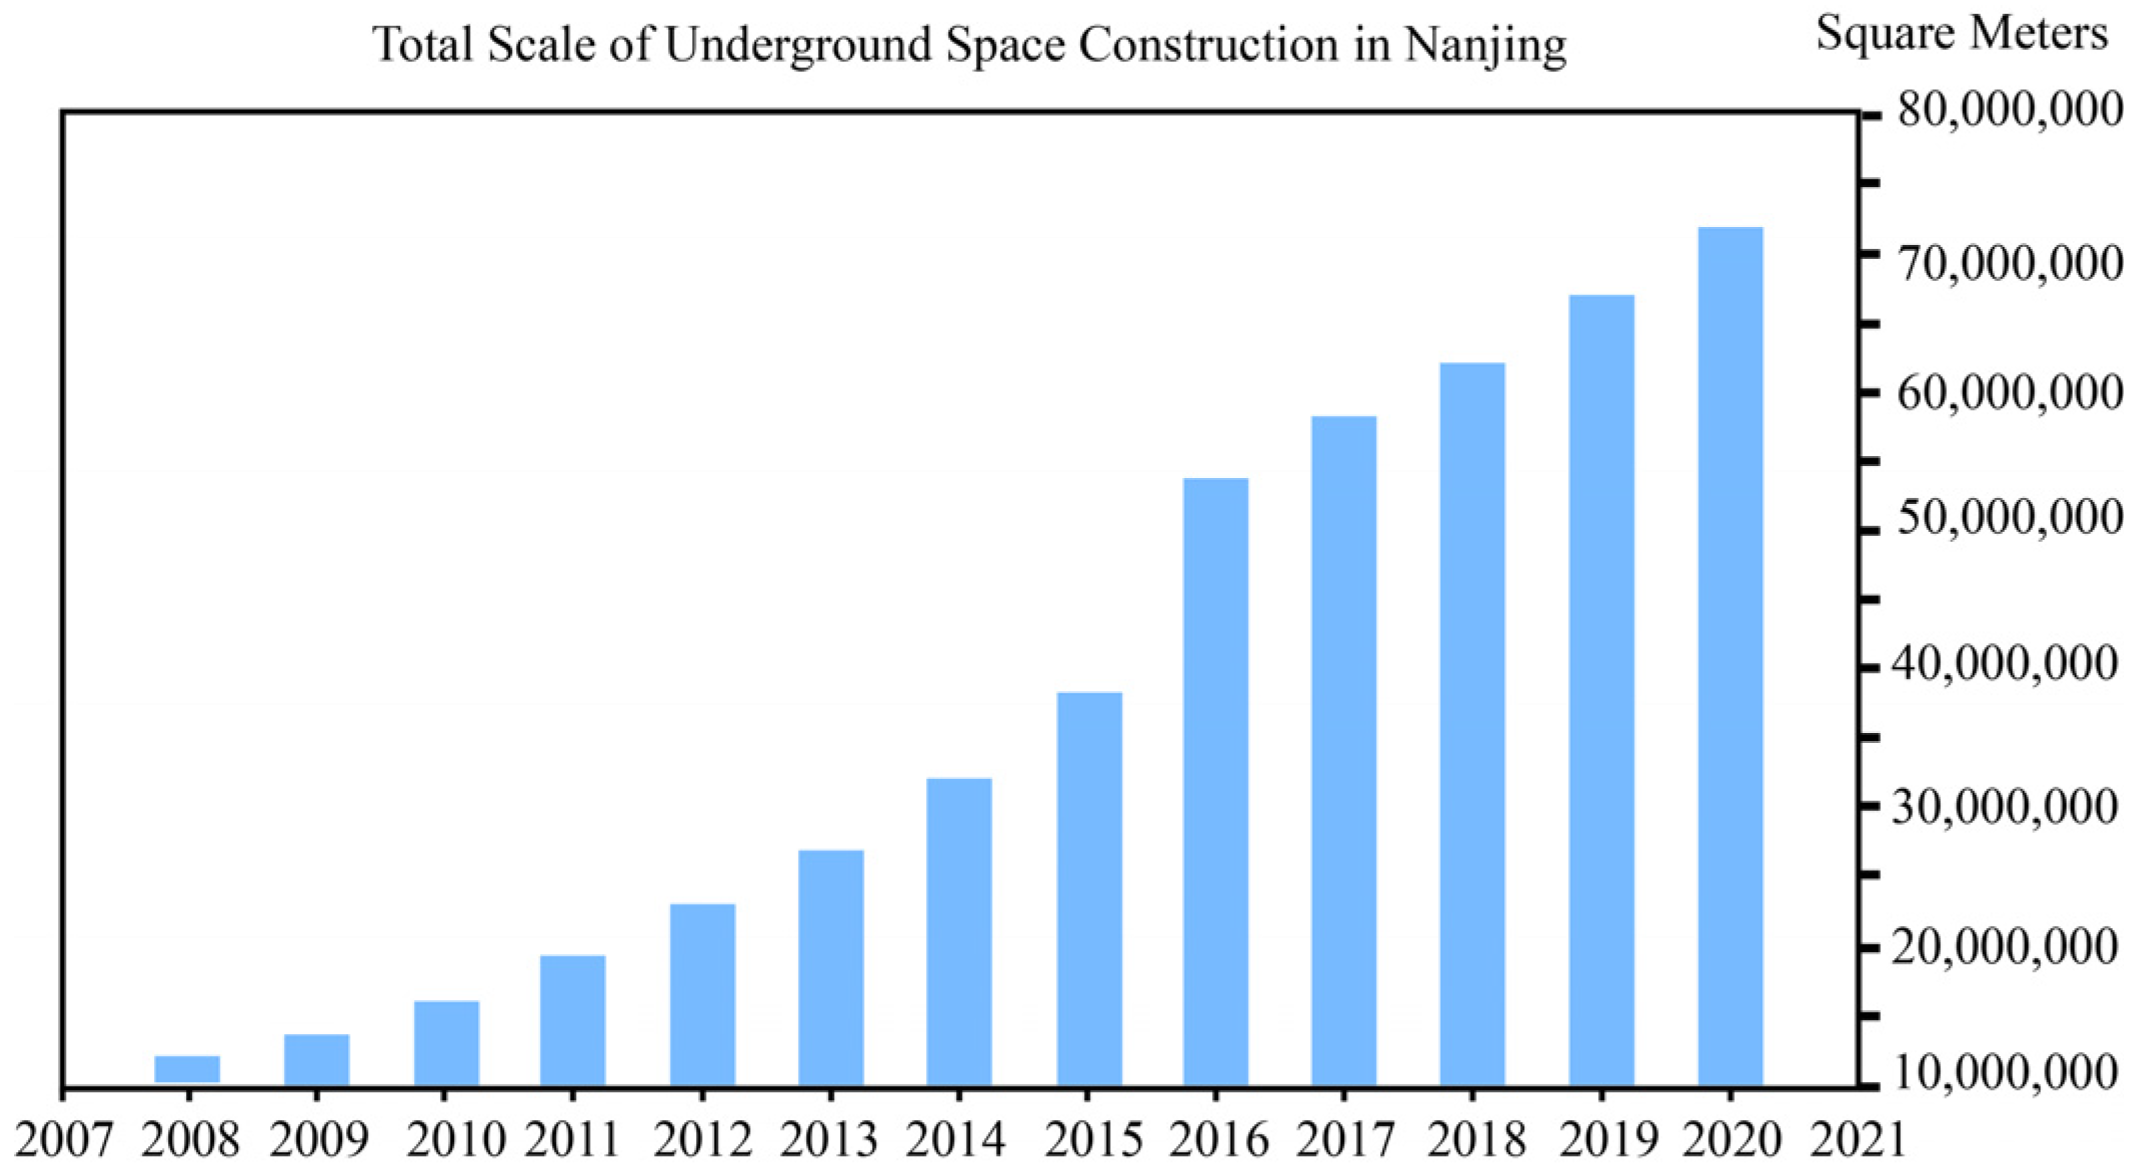
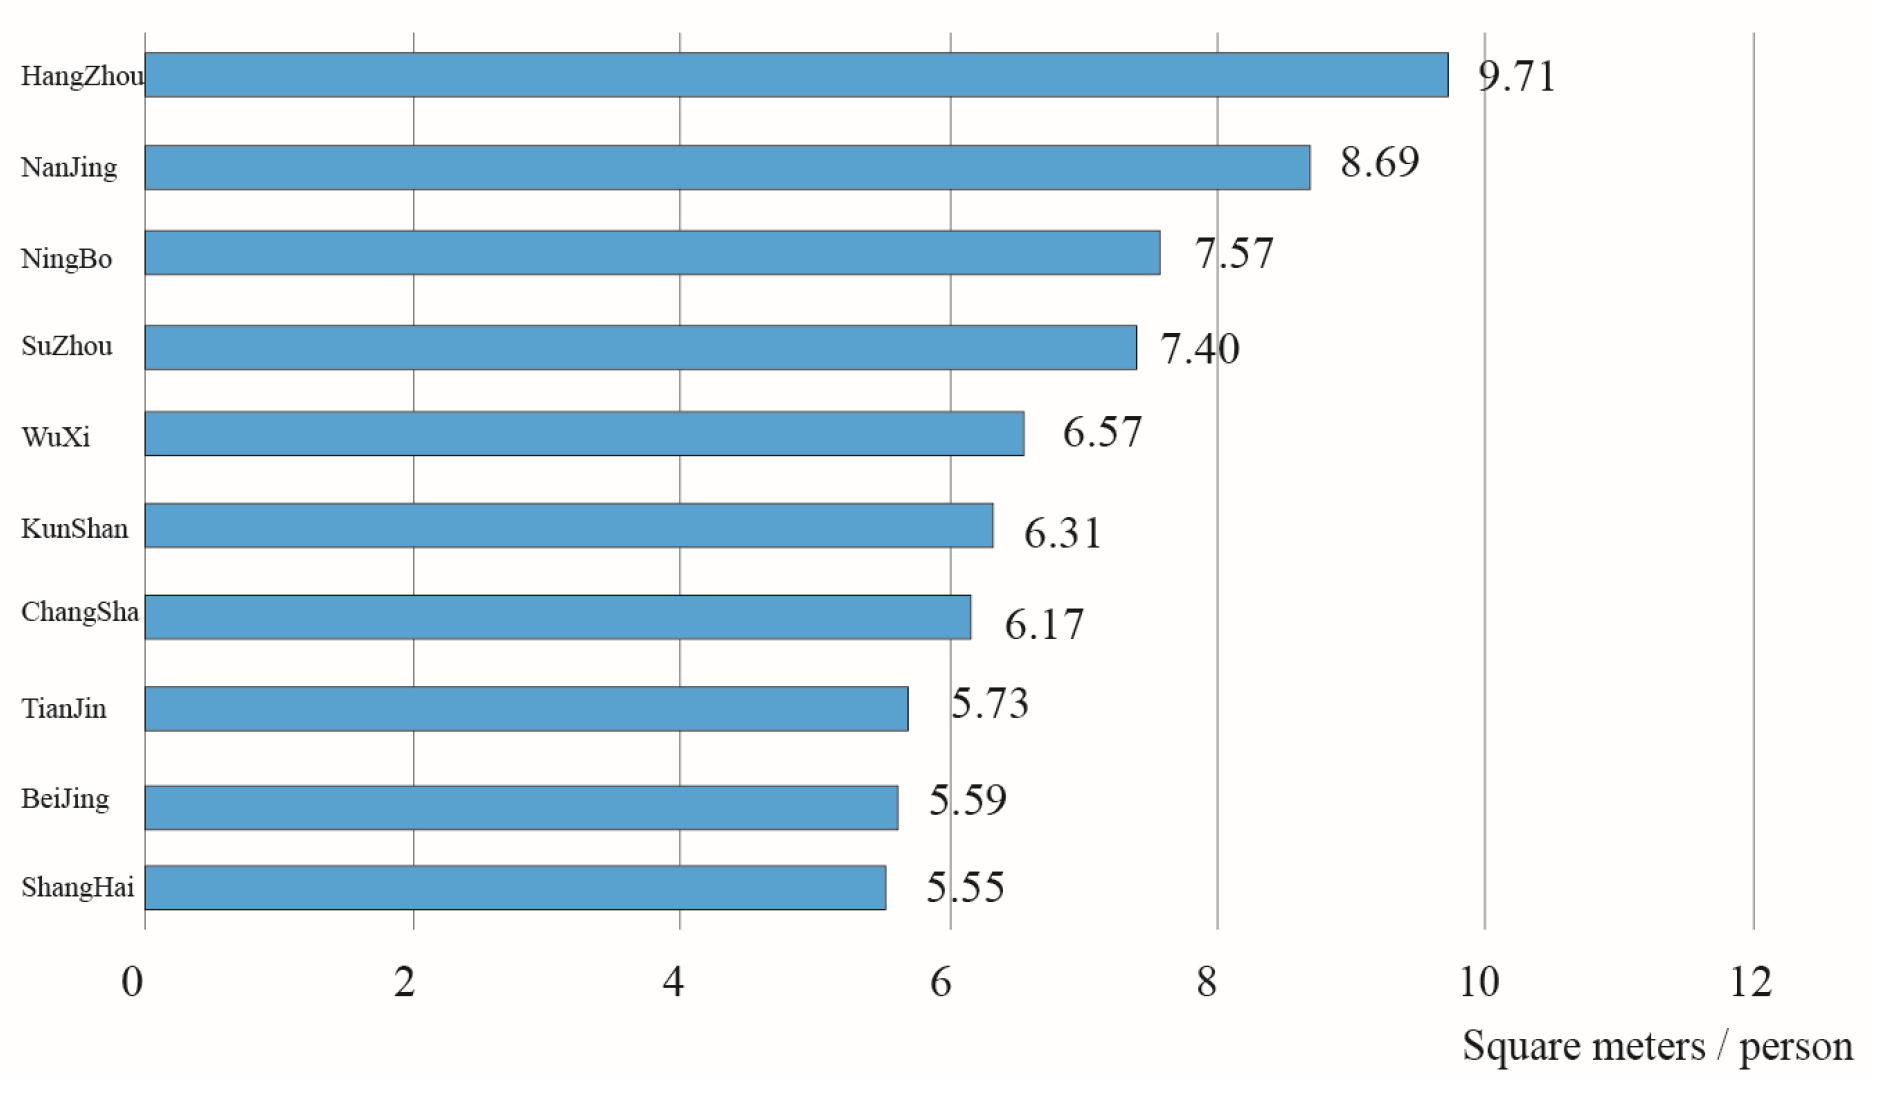
In terms of scale and function development, under the promotion of China’s new urbanization strategy, the development of underground space (UUS) in Nanjing has shown a significant acceleration. According to recent statistical data, the underground space in Nanjing increased from less than 15 million cubic meters in 2008 to over 50 million cubic meters in 2016, and 7.19 million cubic meters in 2020, with a significant average annual growth rate Figure 2. Especially during the “13th Five-Year Plan”, the newly added underground space reached 34 million square meters, with an average annual growth rate of 13.2%, far exceeding the national average. According to the Blue Book on Underground Space Development (2023), by the end of 2022, the per-capita underground space in Nanjing had reached 8.69 square meters Figure 3, and the city has ranked among the top three in China’s sub-provincial cities for five consecutive years.
In terms of underground space functionality, Nanjing’s “14th Five-Year Plan” for underground space development and utilization points out that the types of functions in underground space development are showing a trend of diversification and integration. During the “13th Five-Year Plan”, the construction of several large public building projects, such as Hexi Shimao Center and Hexi Golden Eagle World, as well as multiple municipal comprehensive utility tunnels, greatly enriched the functions of underground space. The focus has gradually shifted from primarily rail transit, parking lots, and civil air defense projects to a more diversified and integrated mix of functions, including parking, commerce, transportation, civil defense, and municipal infrastructure.
Regarding spatial distribution and development direction, in terms of spatial layout, Nanjing has formed a development structure of “four cities, eleven zones, and multiple points”, with the main urban area accounting for 55.84% of the total underground space area and the sub-city accounting for 31.03% Figure 4. In recent years, with the promotion of large key projects and the TOD model, the underground space development intensity has continuously increased in areas such as Xinjiekou, central Hexi, Nanjing South Station, and the core area of Jiangbei New District. Underground space along station areas such as Jiangning, Liuhe, Pukou, and Lishui has shifted towards integrated development, further reinforcing this development pattern.

3.2. Data Sources

The data utilized in this study are primarily sourced from POI data, remote sensing imagery, and planning documents. The POI data capture the current state of underground space utilization in Nanjing and were collected by using Python (Python 3.8.0) to scrape location information from Gaode Maps (Amap) [38]. Data extraction targeted specific attribute keywords such as “subway”, “underground”, “underground garage”, “sunken”, “civil defense”, and underground building floor numbers. The raw data were subsequently filtered and deduplicated, with POIs of minimal quantity and limited relevance to underground development excluded. After data processing, a total of 9266 valid POIs were retained. These included underground parking facilities (2397 POIs), underground public service facilities—comprising underground commercial facilities (4256 POIs), underground cultural facilities (1560 POIs), and other facilities (710 POIs)—and metro stations (337 POIs). These categories constituted the core dataset for this research (Figure 5). Remote sensing data were primarily used to represent the spatial distribution and intensity of urban activities on the demand side. Nighttime light data were obtained from the 2020 NPP-VIIRS nighttime light imagery. Population density data were derived from the WorldPop project (2020 China dataset), with an original resolution of 100 m, which was spatially aggregated to a 1 km resolution using weighted methods (Figure 3). This study adopted the WGS_1984 geographic coordinate system and the WGS_1984_UTM_Zone_50N projected coordinate system. All raster data were resampled to a uniform grid size of 1 km × 1 km.

4. Methods

4.1. Evaluation of UUS Supply Intensity

As highlighted in previous studies, large-scale UUS development is primarily concentrated in sectors such as underground parking, commercial spaces, cultural facilities, and metro stations. Furthermore, the number of projects in each development category serves as an effective indicator of the current state of UUS development, particularly its supply capacity. Accordingly, this study incorporates the characteristics of various development modes and employs multiple calculation methods to provide a comprehensive assessment of the current status of underground space development.

4.1.1. Underground Parking Facilities

(1) Supply Intensity of Underground Parking Facilities (x1)
In this study, the number of POIs is used to quantify the development intensity of underground parking facilities within each research unit. The calculation formula is as follows:
x 1 = U P i A i
where U P i denotes the number of underground parking facility POIs in study area i. A i   represents the area of study area i.
(2) Underground Parking Rate (x2)
The underground parking rate represents the proportion of underground parking facilities relative to the total number of parking facilities in the city. It serves as a key indicator for evaluating the functional structure and infrastructure allocation of UUS. The calculation is as follows:
x 2 = U P i U P i + P i
where U P i represents the number of underground parking facility POIs in study area i.   P i denotes the number of above-ground parking facility POIs in study area i.

4.1.2. Underground Public Service Facilities

(1) Supply Intensity of Underground Public Service Facilities (x3)
The spatial distribution density of underground public service facilities is a key indicator for evaluating the intensity of underground space development within a given area. Indicator x3 is calculated as the ratio of the total number of POIs for underground commercial facilities, underground cultural facilities, and other underground public service facilities to the area of the corresponding zone.
x 3 = U C i + U C F i + U O i A i
where U C i   represents the number of underground commercial facility POIs in study area. U C F i denotes the number of underground cultural facility POIs in study area i. U O i refers to the number of other underground public service facility POIs in study area i.
(2) Development Ratio of Underground Public Service Facilities within Metro Catchment Areas (x4)
The metro catchment area is defined as the area within a 500 m radius of a metro station [39,40]. This index is used to assess the development intensity of underground public service facilities within metro-affected zones:
x 4 = D U P S , i R U P S , i
D U P S , i = U P S M , i A M . i
R U P S , i = U P S M , i U P S i
where D U P S , i denotes the density of underground public service facility POIs in the metro station domain in study area i. R U P S , i denotes the proportion of underground public service facility POIs in the metro station domain in study area i. U P S M , i denotes the number of underground public service facility POIs in the metro station domain in study area i. A M . i denotes the total area of the metro station domain in study area i.

4.1.3. Underground Metro Stations

(1) Supply Intensity of Underground Metro Stations (x5)
This index is calculated in a manner similar to x1. For metro stations situated at the boundary of two or more zones, the station is counted in each relevant zone. Transfer stations are counted according to the number of serviced lines to reflect their relative spatial volume.

4.1.4. Comprehensive Evaluation

(1) Index Normalization
To eliminate the effect of dimensional differences and enhance comparability, all indicators are normalized to a [0, 1] range using the following formula:
x i , j = X i , j M i n ( X i , j ) Max X i , j M i n ( X i , j )
where X i , j denotes the standardized score of indicator j within study area i.  M i n ( X i , j ) denotes the minimum value of indicator j across all study areas. Max X i , j denotes the maximum value of indicator j across all study areas. i is the sequence number of the study subarea. j is the sequence number of the assessment indicator.
(2) Weight Determination using the CRITIC Method
To capture the varying impacts of each indicator on underground space supply, this study employs the CRITIC (Criteria Importance Through Intercriteria Correlation) method proposed by Diakoulaki et al. [41]. This objective weighting approach accounts for both the contrast intensity and the degree of conflict among indicators:
C j , s = σ j , s ( 1 r j k , s )
W j , s = C j , s C j , s
where C j , s denotes the information content of indicator j of the secondary supply. σ j , s denotes the standard deviation of indicator j of the secondary supply S, which is used to measure the comparative strength of the indicators. r j k , s denotes Spearman’s correlation coefficient between indicator j of the secondary supply S and indicator k, which is used to reveal the level of conflict between the two indicators. W j , s denotes the objective weights of indicator j of the secondary supply.
The weight W s of each sub-indicator is also determined using the CRITIC method (Table 2). Then, the final value of the underground space supply capacity in study area i is calculated as follows:
V i = x i , j ( W j , s W s )
where V i denotes the final value of the underground space supply capacity in study area i.   x i , j is the normalized score of indicator j in study area i. W s represents the weight of the sub-level supply factor.

4.2. Evaluation of UIUS Development Demand

As highlighted in the preceding literature review, various factors—including economic conditions, population density, and the current state of above-ground construction—have been shown to be key drivers of UUS development. Considering both the relevance of these factors to UUS development and the availability of corresponding data, this study ultimately selects seven evaluation indicators across three dimensions: urban spatial location, socioeconomic development, and urban planning. The selected indicators are urban spatial location, metro accessibility, bus accessibility, population density, regional economic value, land use type, and floor area ratio, collectively reflecting the demand for UUS development.

4.2.1. Urban Spatial Location

(1) Urban Spatial Location (y1)
Urban spatial location is a key factor influencing the demand for UUS development [42]. In this study, high-resolution nighttime light imagery is utilized to classify the spatial structure into four categories: core areas, key areas, general areas, and other areas [43,44]. Each category is assigned a corresponding score.
y 1 = r m A m , i A i
where r m denotes the subsurface space demand score for urban spatial locations from (Table 3). A m , i denotes the total area for which study area i was scored.
(2) Metro Accessibility (y2)
The construction of metro stations is a significant driver of UUS development [45]. This study divides metro station service areas into three levels based on distance, assigning different scores to each. The scoring is mainly based on the Technical Guidelines for Regulatory Detailed Planning of Shanghai (2016 Revision), which offers a method for evaluating rail transit service coverage. As a leading city in underground space and metro development, Shanghai provides mature experience and standards for reference [46]. While Nanjing’s underground space development is slightly behind Shanghai and Beijing, it has grown rapidly in recent years [2]. Therefore, adopting Shanghai’s advanced practices is highly relevant for improving the planning and development of Nanjing’s underground space. The accessibility score is determined based on the extent of metro station service coverage within each research unit:
y 2 = A m , i A i
A m , i = 1.0 A a , i + 0.7 A b , i + 0.3 A c , i
where A m , i denotes the total service area of metro stations in study area i. A a , i denotes the area of 500 m of the buffer zone of metro stations in study area i. A b , i denotes the area of the buffer zone from 500 m to 800 m of the buffer zone of metro stations in study area i. A c , i denotes the area of the buffer zone from 800 m to 1500 m of the buffer zone of metro stations in study area i.
(3) Bus Accessibility (y3)
Bus service is another key indicator of transportation accessibility. This index is calculated based on the density of bus station POIs within each research unit.

4.2.2. Socioeconomic Development

(1) Population Density (y4)
Population density reflects the resident-level demand for UUS. It is calculated as the total population within each research unit divided by the unit’s area.
(2) Regional Economic Value (y5)
Regional economic output is one of the primary factors driving underground space demand.

4.2.3. Urban Planning

(1) Land Use Type (y6)
Land use type is a critical determinant of UUS demand [47], as it directly influences the functional orientation and scale of underground space construction. According to the research on the impact of land use types on the demand and value of underground space resources in Urban Underground Space Resource Assessment and Development Planning, and in combination with the Nanjing Territorial Spatial Master Plan (2021–2035) (Table 4), corresponding scores are assigned to different land use categories:
y 6 = s l L l , i A i
where s l denotes the subsurface space requirement score that indicates land use purpose L, as shown in Table 4. L l , i denotes the total area of land use L in study area i.
(2) Floor Area Ratio (y7)
Higher floor area ratios (FARs) are generally associated with greater demand for UUS to accommodate building facilities, parking, commercial functions, and public services. The average FAR is calculated as the total built-up floor area divided by the area of each research unit, using data from the Resource and Environmental Science and Data Center.

4.2.4. Comprehensive Evaluation

The final demand score D i for each research unit is calculated using a process similar to the supply-side assessment. Weights for each sub-indicator are shown below (Table 5):

4.3. Supply–Demand Ratio Evaluation

The supply–demand ratio (SDR) has been widely applied in the field of ecosystem services to assess the degree of alignment between an ecosystem’s service capacity and the societal demand for those services within a given area [48,49]. In recent years, this concept has been extended to fields such as urban planning, public facility allocation, and transportation service evaluation [50,51,52], and it has become an important tool for evaluating spatial equity and efficiency in resource distribution. Similarly to ecosystems, UUS can also be regarded as a form of natural resource. Therefore, this study adopts the supply–demand ratio to evaluate the development status of UUS. The calculation formula is as follows:
R U U S   =   V i D i ( V m a x + D m a x ) / 2
where R U U S denotes the supply–demand ratio of underground urban space. V i and D i represent the supply and demand values of underground space in study area i, respectively. V m a x and D m a x represent the maximum values of underground space supply and demand across all study areas, respectively. See Table 6.

5. Results

5.1. Evaluation of UUS Supply Capacity

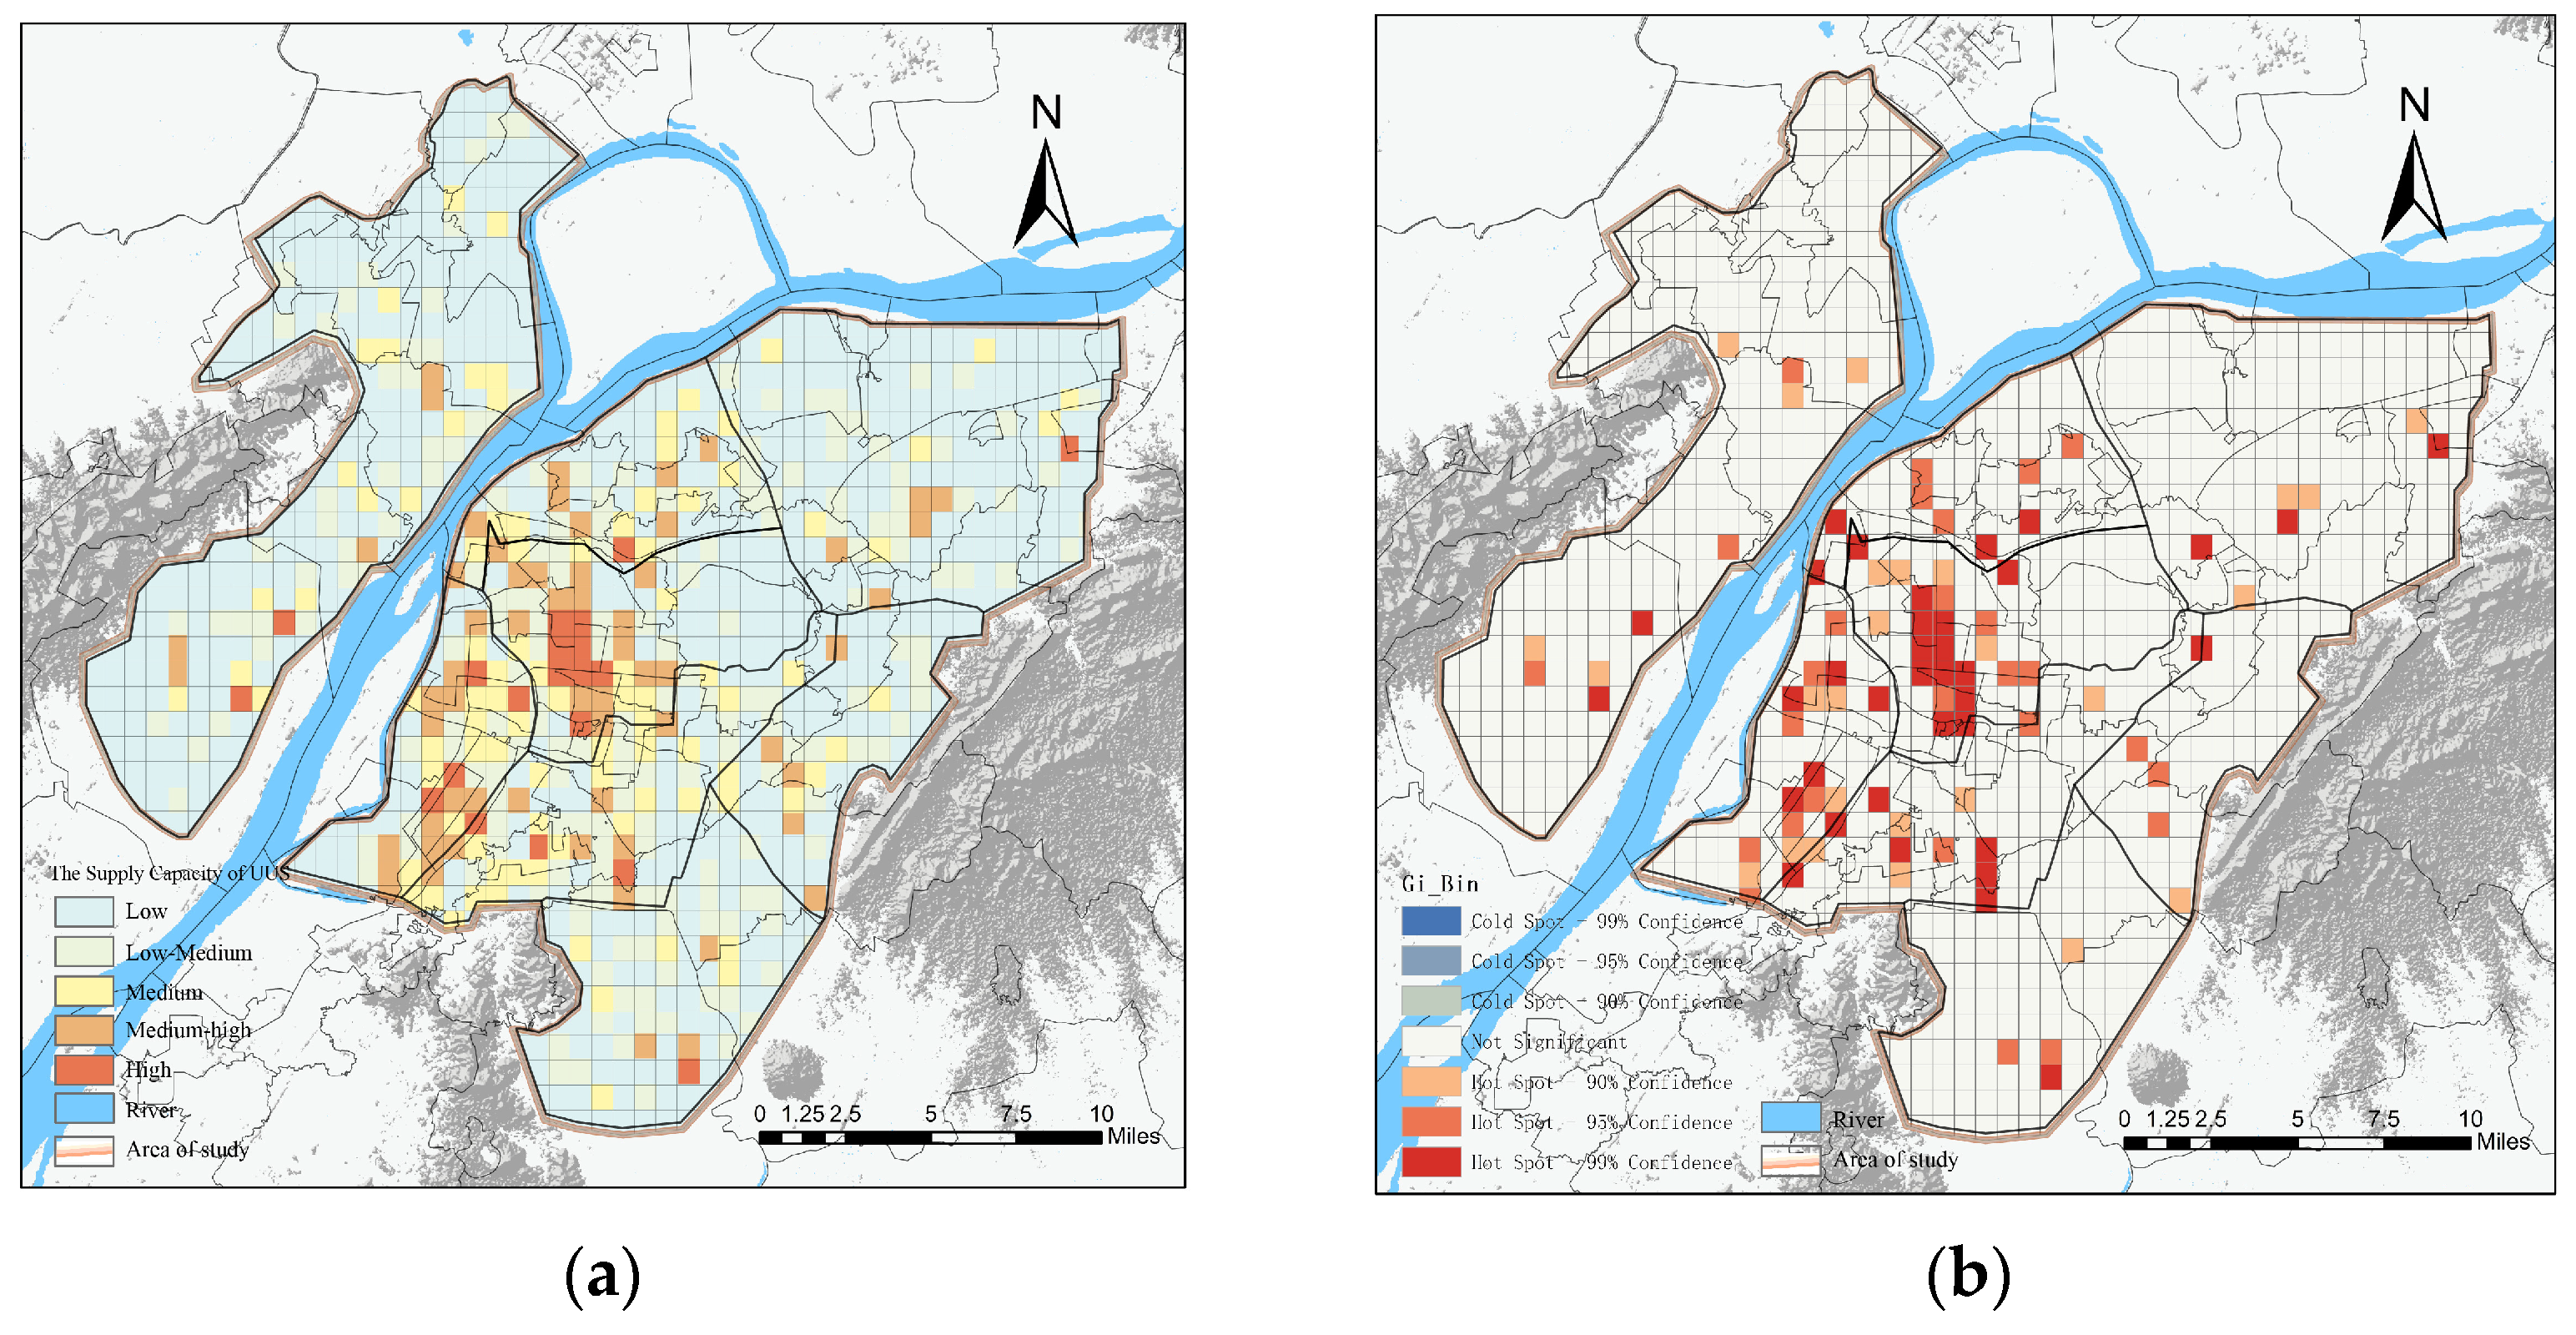
To clearly reveal the spatial distribution characteristics of UUS supply capacity in the central urban area of Nanjing, this study employs the Jenks natural breaks method to classify the composite supply score into five categories: low, low–medium, medium, medium–high, and high supply capacity areas (Figure 6). The results indicate that the average UUS supply capacity in Nanjing’s central urban area is 0.060. Among all subdistricts, Xinjiekou in the Old City records the highest score at 0.664, significantly exceeding the average. Other high-supply areas are primarily concentrated in the Old City, Tiebei, Hexi, and Chengnan districts, where metro networks are dense, commercial activity is robust, and supporting facilities such as parking and public services are well-developed (Figure 3). Medium-level supply capacity areas are mostly distributed around high-value zones, forming transitional buffer zones. Additionally, a small number of medium-supply areas are scattered throughout peripheral new towns such as Xianlin, Qilin, and Dongshan, likely due to differences in development pace, planning guidance, or geological conditions. Low-supply capacity areas, which constitute the largest proportion, are mainly found in Xianlin, Qilin, Dongshan, and Jiangbei New District. Although development efforts have increased in these regions in recent years, underground space utilization remains at an early stage, and facility density is relatively low. Some ecological buffer zones and areas along the Yangtze River are also classified as low-supply capacity areas due to significant topographical and geological constraints. To further elucidate the spatial clustering characteristics of UUS supply, a hotspot–coldspot analysis was conducted. The findings reveal that high-supply areas display a certain degree of spatial clustering, predominantly within the Old City, whereas low-supply areas exhibit no obvious spatial aggregation. This spatial distribution provides a critical basis for subsequent supply–demand matching analysis and planning optimization.

5.2. Evaluation of UUS Demand

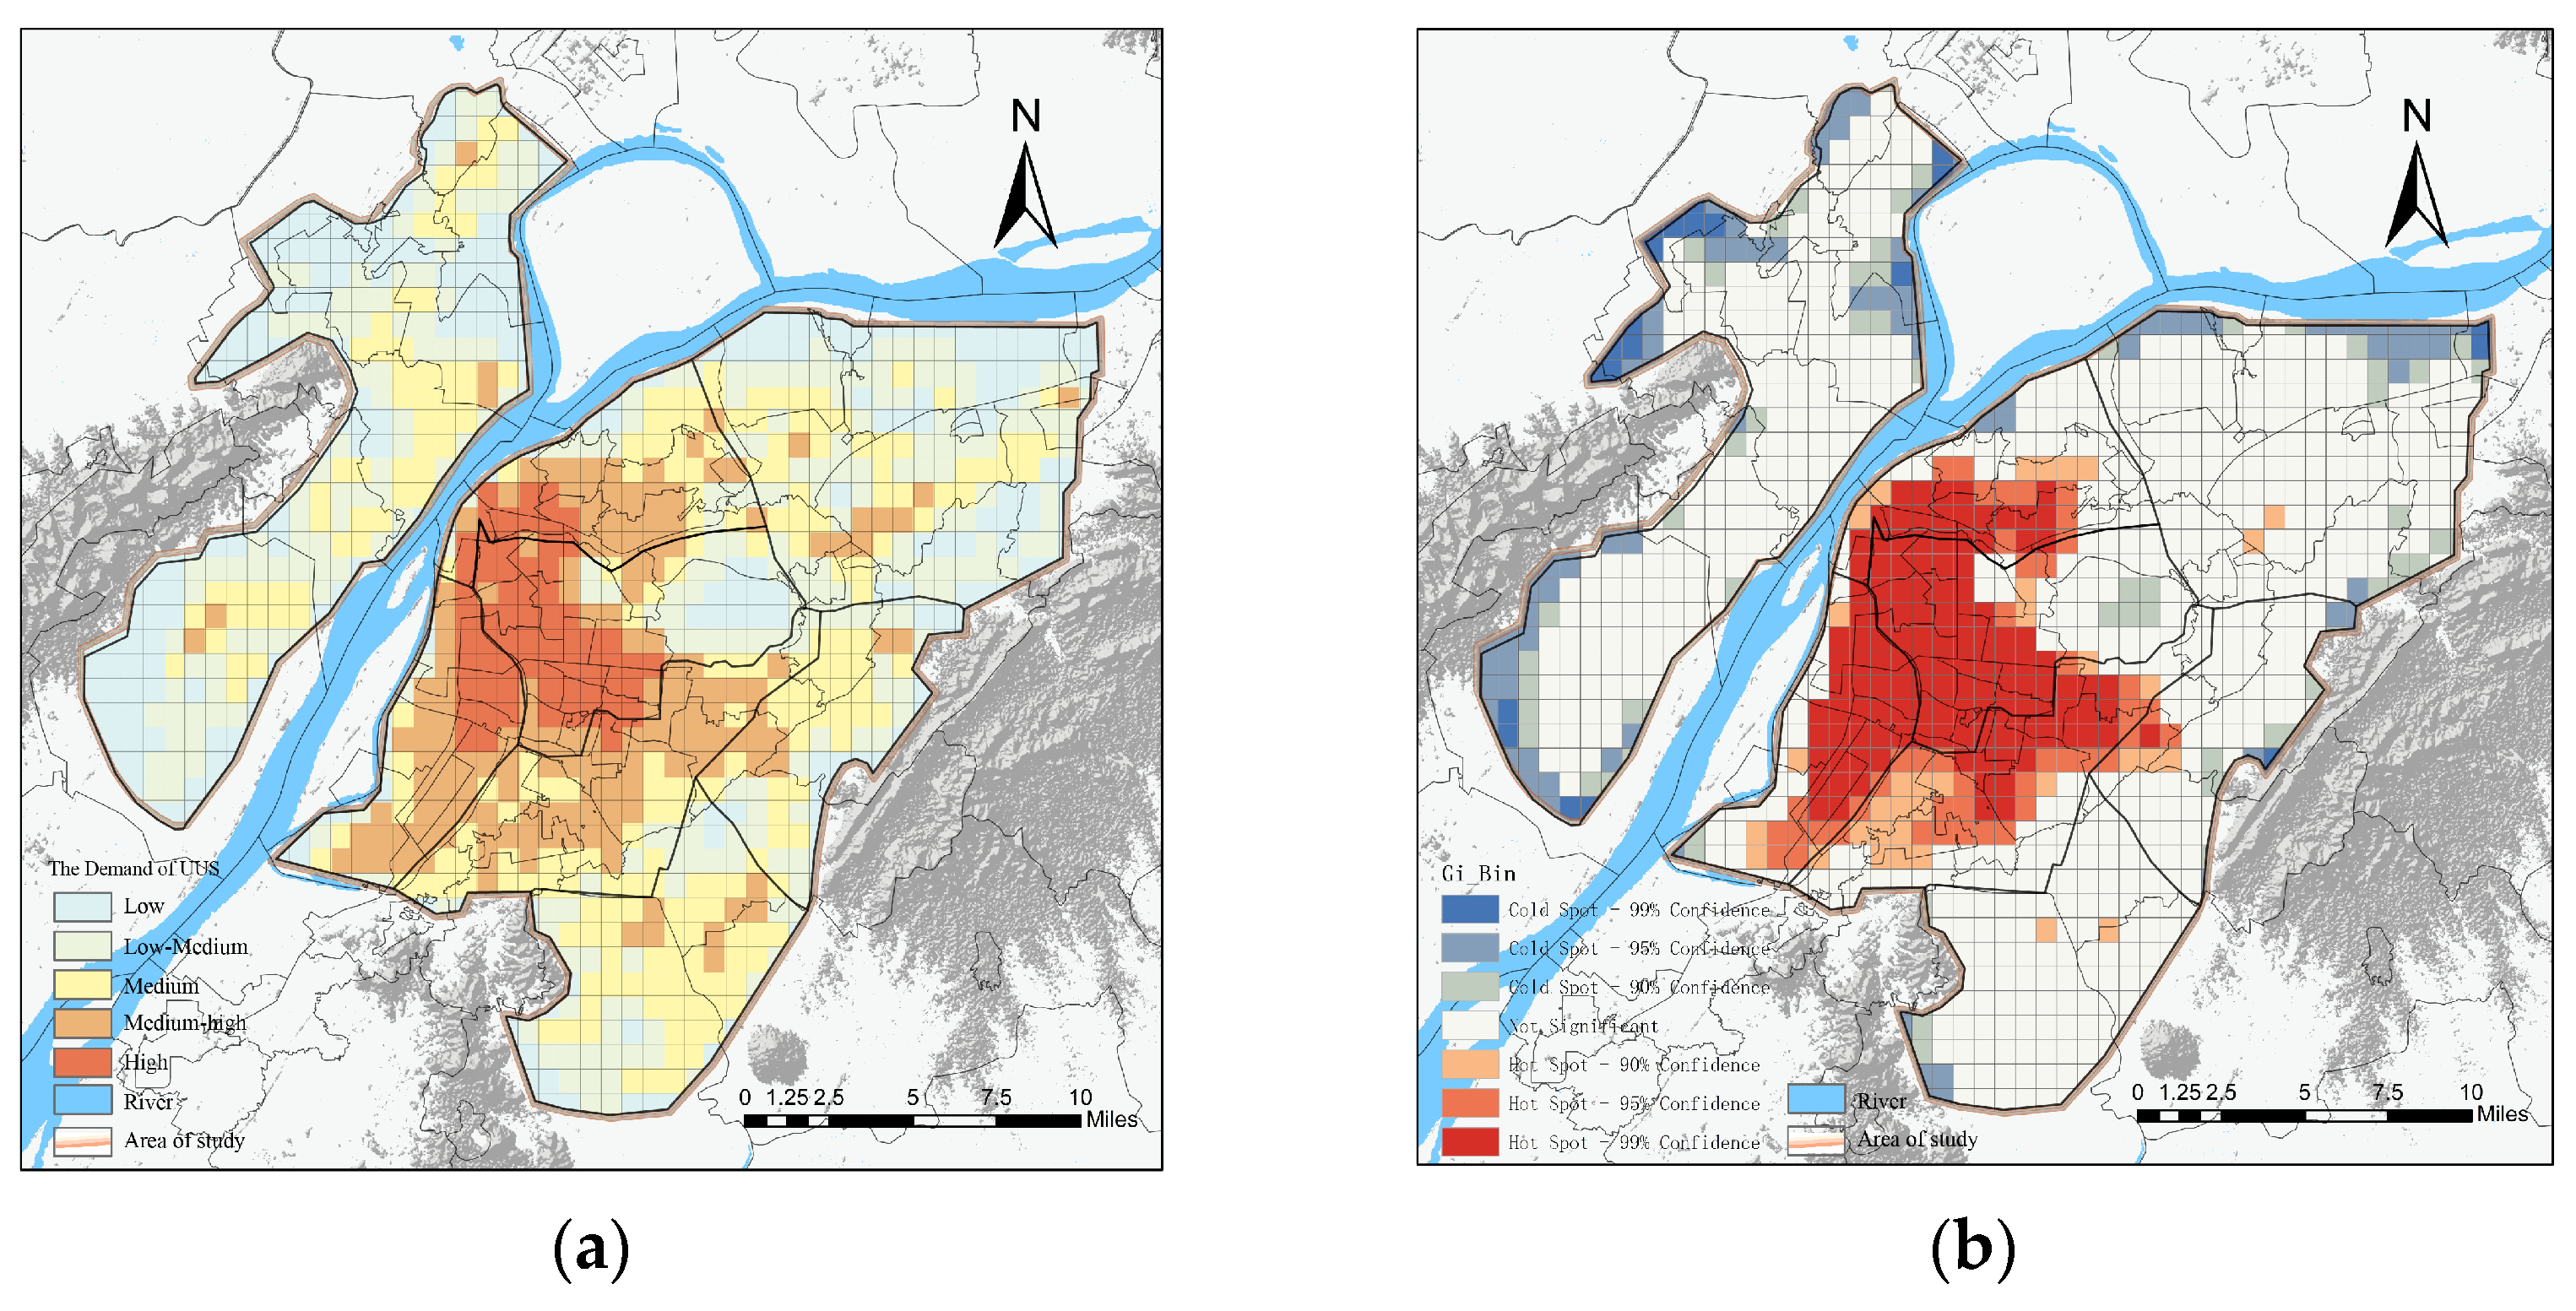
Similarly, the Jenks natural breaks method was applied to classify UUS demand in Nanjing’s central urban area into five levels (Figure 7), thereby revealing the spatial distribution characteristics of UUS demand. The analysis shows that the average UUS demand score across the study area is 0.248, which is notably higher than the average supply score. The highest demand value was observed in Xinjiekou subdistrict in the Old City, reaching 0.844—significantly above the overall mean—indicating exceptionally strong demand for underground space in this area. High-demand areas display clear spatial clustering, primarily concentrated in the Old City, Tiebei, and Hexi districts, and largely overlap with high-supply areas. However, the spatial extent of high-demand zones clearly exceeds that of high-supply areas. These high-demand areas are typically characterized by high population density, elevated floor area ratios, intense commercial activity, and rich historical and cultural resources, all of which contribute to strong development pressure for underground space. Medium–high- and medium-demand areas are mostly distributed around the high-demand zones, forming distinct transition belts. Compared with supply, demand zones exhibit greater continuity and a more distinct spatial structure. Low-demand areas are mainly located on the urban periphery, including Xianlin, Qilin, Dongshan, and Jiangbei New District, especially near administrative boundaries. Additionally, some parts of the Old City, such as the Zijinshan area, also display relatively low demand, likely due to ecological protection and development restrictions. The results of the hotspot–coldspot analysis further corroborate these spatial patterns. Hotspot areas of underground space demand are highly concentrated in the Old City and closely align with its administrative boundaries, exhibiting strong spatial agglomeration. In contrast, coldspot areas are predominantly found along the periphery of the study area, forming belt-like patterns with a more dispersed spatial distribution.

5.3. Evaluation of the Supply–Demand Ratio of UUS

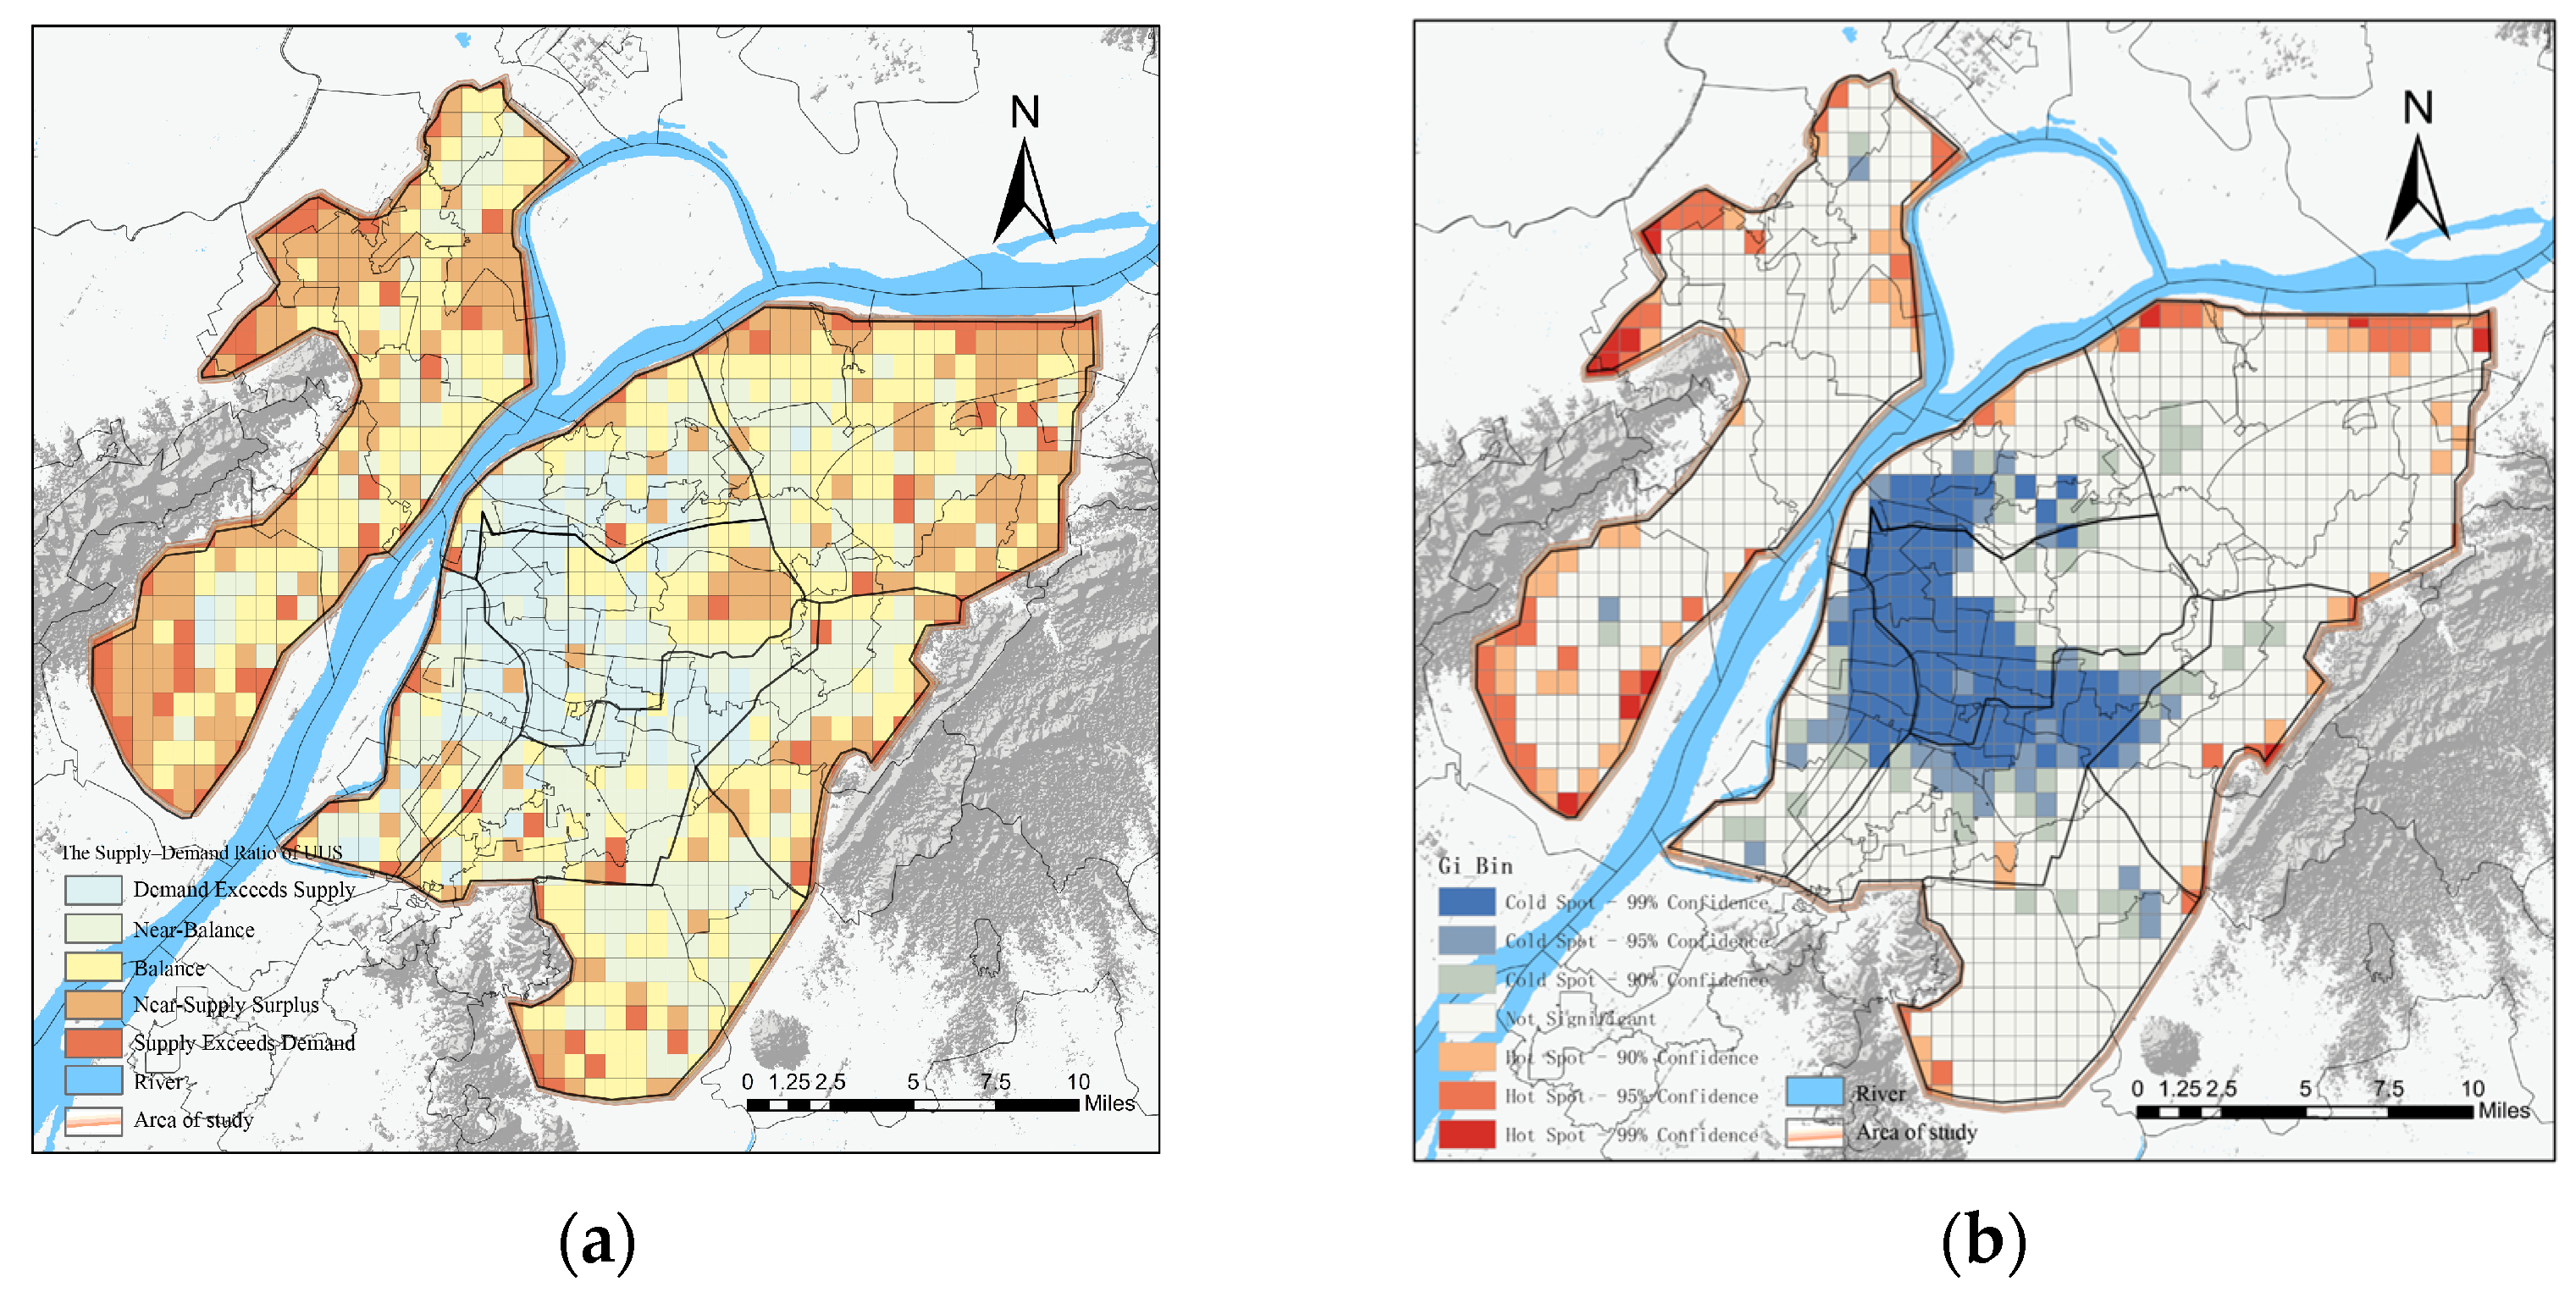
In analyzing UUS supply–demand relationships, this study continues to employ the Jenks natural breaks method to classify the supply–demand ratio into five levels (Figure 8): “Demand Exceeds Supply”, “Near-Balance”, “Balanced”, “Near-Supply Surplus”, and “Supply Exceeds Demand”. The results indicate that areas where demand exceeds supply are primarily concentrated in the core of the Old City and adjacent districts such as Tiebei, Hexi, and parts of Chengnan, forming a relatively continuous belt of supply–demand tension. These zones are typically characterized by a high degree of urban functional overlap, elevated population density, intense commercial activity, and rich historical and cultural resources. As above-ground space approaches development saturation, reliance on underground space intensifies, resulting in particularly pronounced supply–demand imbalances. In contrast, “Near-Balance” and “Balanced” areas represent zones with relatively reasonable underground space development, predominantly located in emerging districts such as Xianlin, Qilin, Dongshan, and Jiangbei New District. These areas remain in the development stage and maintain a functional alignment between underground supply and urban needs, presenting opportunities for future adjustment and optimization. “Supply Exceeds Demand” and “Near-Supply Surplus” areas reflect some degree of foresight in underground space planning but also expose mismatches between resource allocation and current needs. These areas are mostly situated on the outskirts of Jiangbei New District, in the northeastern part of Xianlin, and in some scattered locations. Such patterns may be attributed to proactive regional planning outpacing actual development, delays in transportation infrastructure, or the incomplete realization of planned urban functions. Hotspot–coldspot analysis further reveals the spatial clustering characteristics of supply–demand relationships. Coldspot areas—where demand exceeds supply—show significant spatial agglomeration, mainly in the Old City, Tiebei, and Chengnan, which experience the most acute supply–demand imbalance. In contrast, hotspot areas—where supply exceeds demand—are fewer and mainly distributed along the periphery of Xianlin and Jiangbei New District, forming belt-like or scattered patterns with a relatively dispersed spatial structure.

6. Discussion and Conclusions

6.1. Discussion

6.1.1. A Supply–Demand Evaluation Framework for UUS Supported by Multi-Source Remote Sensing Data

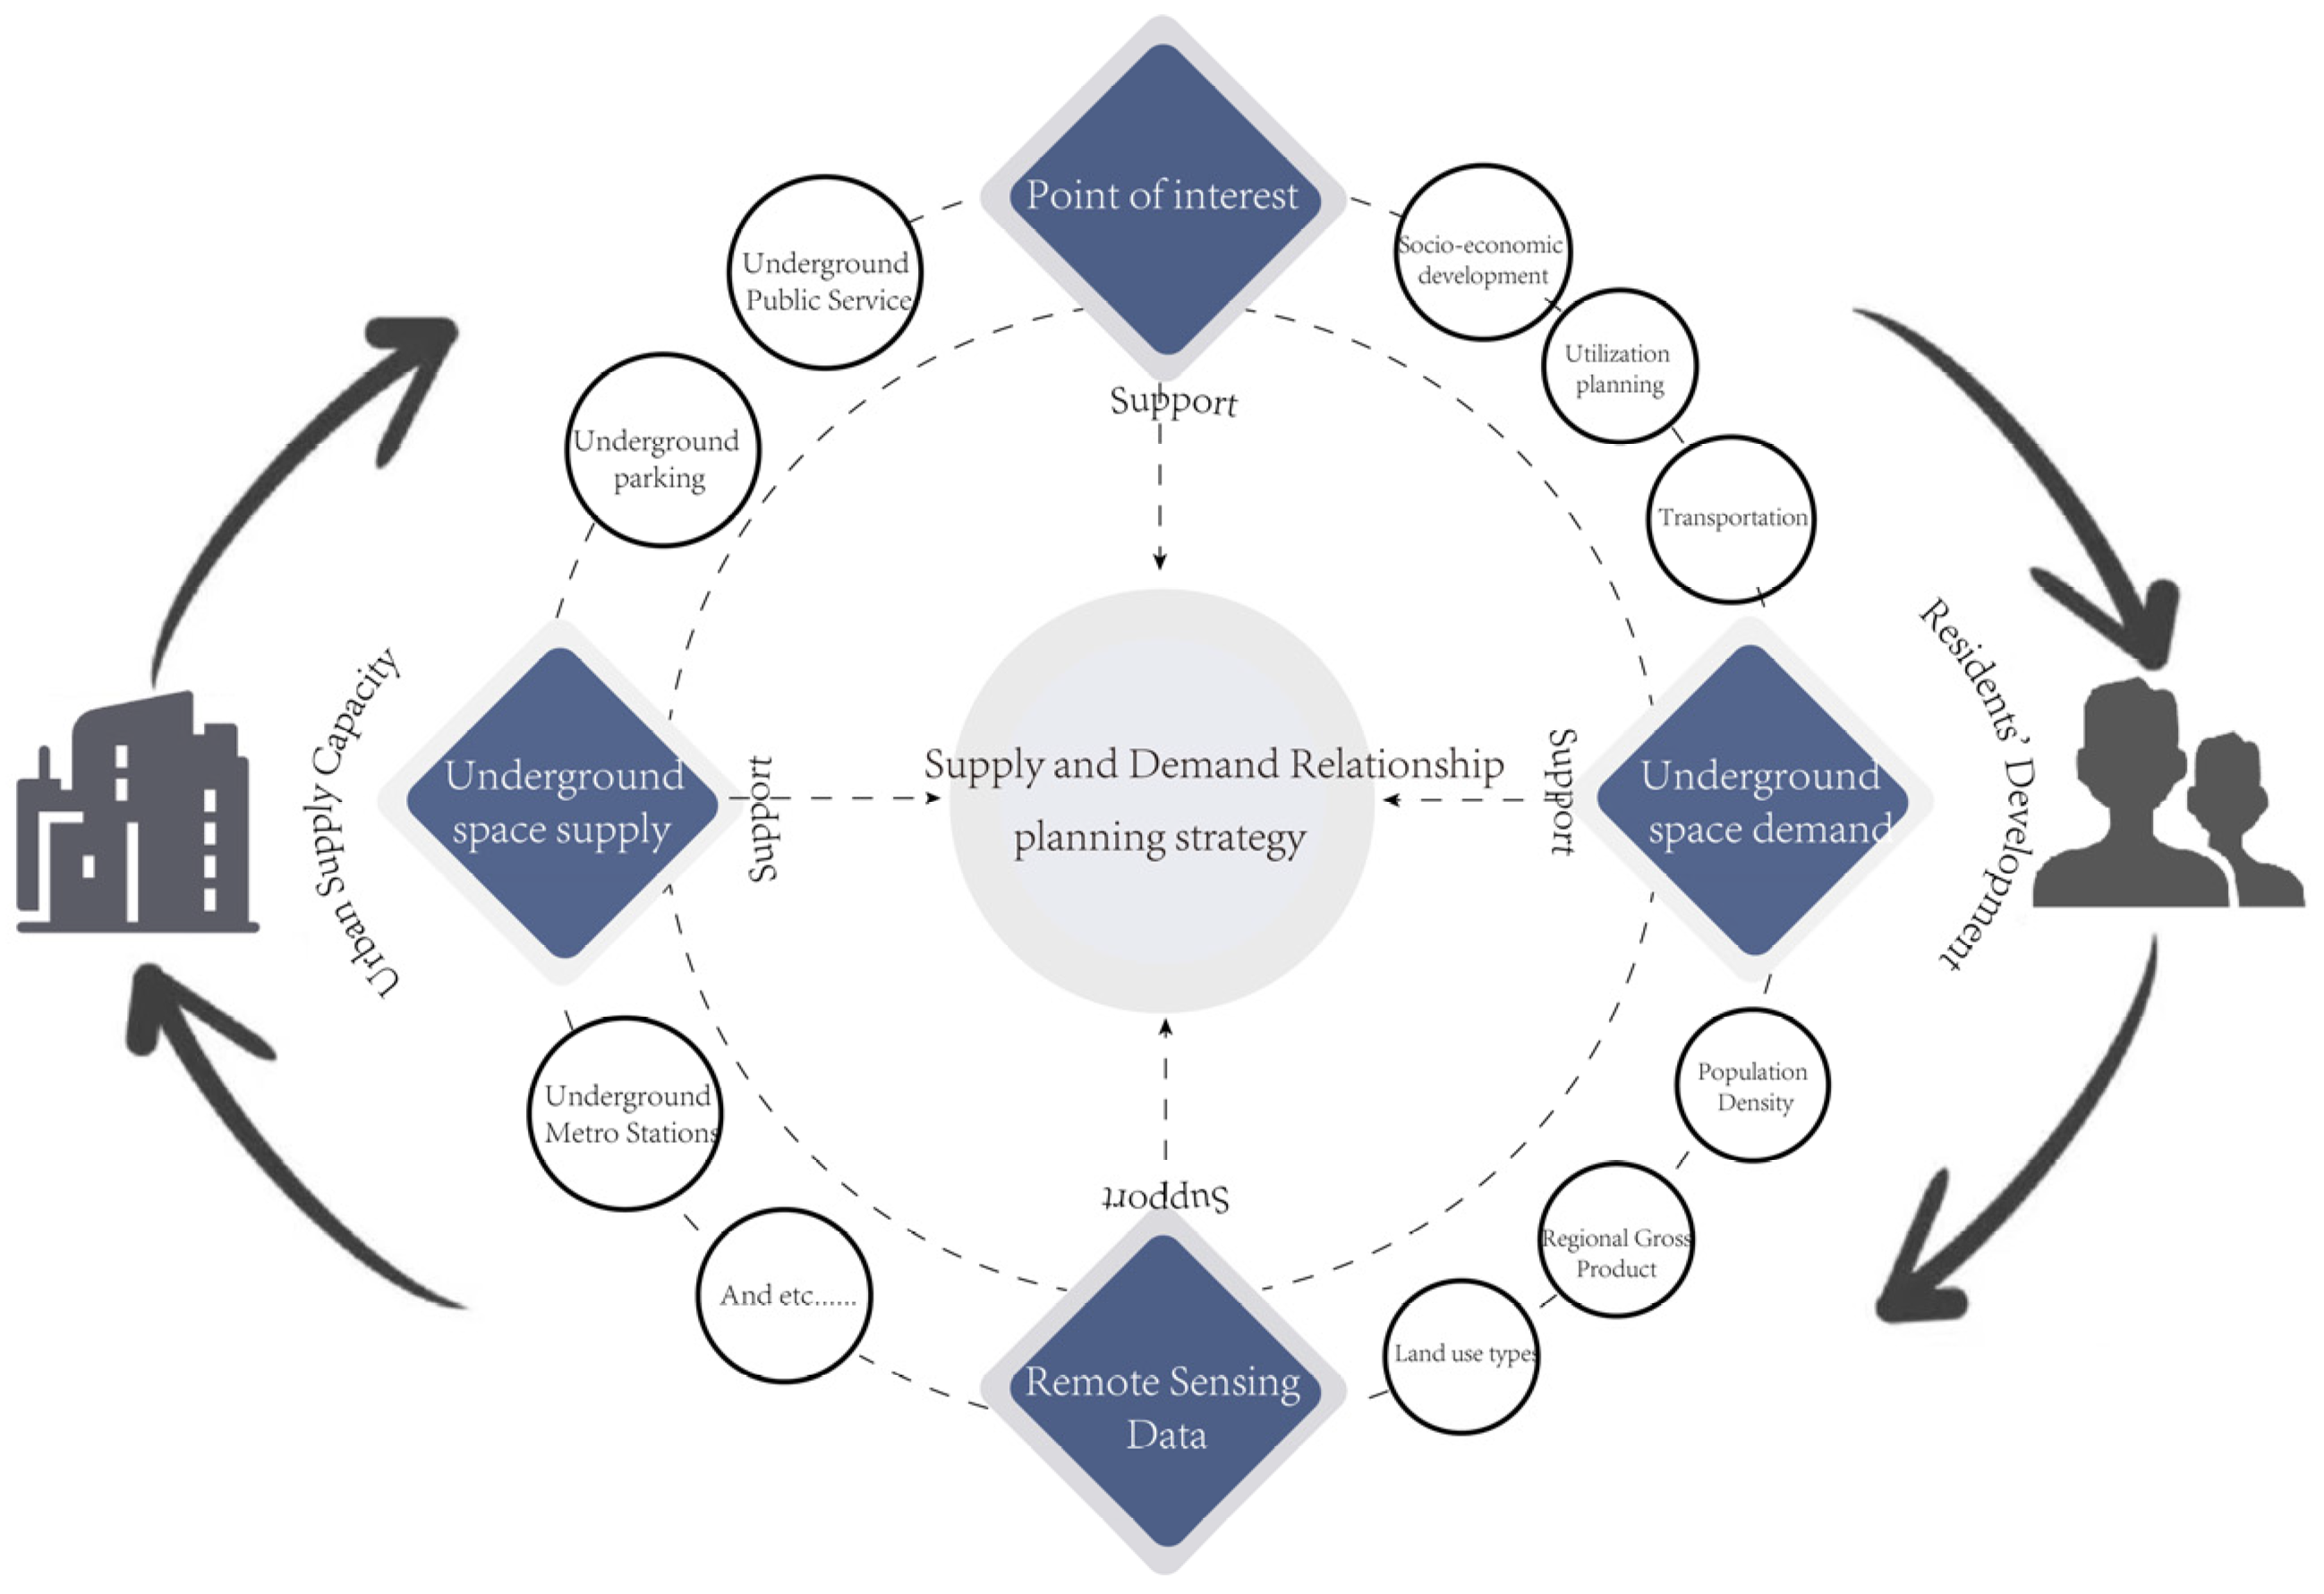
This study is rooted in the practical issue of the imbalance between the supply and demand of UUS. Adopting a dual perspective that considers both the development of UUS and the evolving needs of current residents, it integrates multi-source remote sensing and geographic data—including POI, nighttime light data, and population grids—to construct a systematic evaluation framework for assessing the UUS supply–demand relationship [53]. This approach is characterized by two notable methodological features Figure 9:
Firstly, in terms of the theoretical framework, this study integrates the two dimensions of underground space supply and demand to identify the current contradictions in underground space. Traditional studies mostly focus on analyzing a single dimension and then compare it with relevant data to identify areas with supply–demand contradictions. For example, Xu et al. predicted the demand for underground space development in Nanjing from an economic perspective and then compared it with the city’s underground space planning, finding that the planning lagged behind the demand, leading to the conclusion that the supply–demand contradiction is prominent [47]. However, existing underground space planning data often suffer from being outdated or reflecting premature development, making it difficult to accurately represent the actual development status of underground space. Furthermore, these data have poor comparability, as compared to the evaluation prediction results, and the relevant planning data are more macro and focus on specific areas. To address this issue, this study introduces POI data, which can more accurately reflect the current state of underground space development. Additionally, it considers both supply and demand from the same dimension, ensuring the logical consistency and comparability of the evaluation results, thus providing support for precise and differentiated governance strategies.
Secondly, in terms of methodology, this study combines remote sensing data and POI data, using the supply–demand ratio and cold–hotspot analysis tools to conduct underground space contradiction identification research at the grid scale. This overcomes the limitations of traditional studies, which overly rely on static, low-granularity, and infrequently updated planning data. While systematically identifying underground space supply–demand contradictions, this approach further identifies spatial aggregation characteristics. In the past, underground space data collection and integration mostly relied on field surveys or the manual vectorization of existing planning data, which greatly affected the efficiency and accuracy of the research. For example, due to the long cycle of manual surveys, some underground spaces might be in use when surveyed but abandoned by the time the study is conducted, leading to biased results. In contrast, the POI data used in this study can quickly capture the development status of underground spaces and, through its attribute fields, provide insights into the usage of these spaces, thus improving both data accuracy and research efficiency. For example, compared to the block-level analysis conducted by Qiao et al. [54], the grid-based evaluation unit design in this study enables scalable and adaptable assessments from micro to regional scales.
Finally, although this study mainly focuses on the central area of Nanjing, the flexibility of the POI and remote sensing data used in this framework allows for the incorporation of specific local data and considerations according to the characteristics of different types of cities. This enables the framework to be applied to various urban contexts, thereby facilitating more accurate and region-specific decision-making for underground space development. For example, in cities with significant topographical features, geological data can be integrated into the existing framework to address the constraints related to unstable terrain or geological disasters in underground space development. For cities located near coastlines, sea level rise and flood risks are important factors affecting underground space development, and the framework can be expanded to include environmental parameters such as tide levels and storm surges.

6.1.2. Identification and Optimization of the Supply–Demand Relationship of UUS in the Central Urban Area of Nanjing

This study reveals significant spatial disparities between the supply and demand of UUS in Nanjing’s central urban area, with a pronounced imbalance between the two. For example, Yulu Che et al. employed a gray neural network model to predict the city’s underground space demand from 2023 to 2030 and found that projected demand substantially exceeds the planned underground development capacity, underscoring the severity of the supply–demand contradiction in Nanjing [47]. Similarly, Li Xiaozhao conducted quantitative and comparative analyses to forecast underground space demand in Xinjiekou, concluding that the area continues to exhibit strong demand for further underground development [20]. These findings validate the scientific soundness of the methodological framework advanced in this study. Based on the analysis of the research results, this phenomenon may be attributed to the following factors:
Urban Functional Evolution: There are marked differences in UUS supply, demand, and supply–demand ratios between the Old City and newly developed urban districts. The Old City has experienced long-term accumulation, leading to intensive commercial development, high population density, and concentrated transportation infrastructure, making it the most intensively developed area for underground space in Nanjing [55]. However, this region also faces significant constraints, such as surface space saturation and cultural heritage protection requirements, which limit opportunities for further underground development. Consequently, existing underground facilities are often insufficient to meet rising demand, resulting in a persistent state of imbalance. By contrast, emerging districts tend to be more planning-driven and have been developed more recently. Although their infrastructure may be largely complete, the resident population is not yet fully established, leading to the underutilization of facilities, spatial redundancy, and inefficiencies in resource allocation.
Natural geographical constraints: Analysis of supply, demand, and the supply–demand ratio reveals that the results for the Old City area near Zijin Mountain differ markedly from those of other regions. Further examination indicates that these areas are subject to strict ecological protection requirements. Areas along the Yangtze River and around Zijin Mountain are characterized by unstable hydrogeological conditions, elevated geological disaster risks, and rigorous ecological protection policies, all of which impose substantial constraints on underground space development.
Based on the evaluation results and the preceding analysis, the central urban area of Nanjing can be divided into three functional zones, for each of which differentiated planning and optimization strategies are proposed:
Old City Zones: These zomes emphasize stock enhancement and functional integration. Urban micro-renewal, integrated underground development, and stratified space utilization should be leveraged to improve land use efficiency. In historically sensitive areas, minimally invasive technologies—such as micro-shield tunneling—can be employed to create underground commercial, parking, or transit spaces without disturbing surface functions. The integration of property rights should be promoted to renovate aging underground infrastructure and reallocate functions, thereby alleviating development pressure. For example, in the Hexi Central Business District (CBD), a vertical stratification development strategy can be adopted, with differentiated construction requirements proposed according to depth. Specifically, shallow underground spaces (above −15 m) may be designated for rail transit, medium-depth layers (−15 to −30 m) for multifunctional composite uses, and deeper layers (below −30 m) reserved for energy storage infrastructure.
Emerging Zones: In response to the supply–demand imbalance resulting from premature development in regions such as Xianlin and Dongshan, we propose establishing a “Population–Industry–Underground Space” dynamic matching model, which will facilitate tailored regional transformation strategies. Specifically, for areas such as Xianlin University Town, which possess inherent advantages in research and education, we recommend leveraging the proximity of metro stations to develop underground innovation spaces. These spaces should align with the research, industrial, and educational needs of local universities, incorporating facilities such as smart warehousing and shared infrastructure, while rigorously controlling the construction of non-essential utility tunnels. In the case of Dongshan District, the development of underground logistics corridors should be prioritized, leveraging the planning of the Zhi East Innovation Corridor to connect the Jiangning Development Zone with the central urban area. Additionally, parking facilities should be developed in a phased and flexible manner, based on demand projections. The government should also implement dynamic adjustments to the development sequencing and promote a “mixed-use land” policy, whereby underground commercial and municipal facilities are bundled for joint development. Through precise demand forecasting and flexible supply mechanisms, this approach will reduce vacancy rates in underground spaces and facilitate the transformation of areas such as Xianlin and Dongshan from a focus on “scale expansion” to one of “precise adaptation”.
Ecological Constraint Zones: Clear development boundaries should be established and spatial flexibility should be preserved. In these areas, explicit thresholds for underground development depth and usage restrictions should be set. A “shallow-use restriction, deep-reserve” development strategy is recommended: shallow spaces above −20 m should be designated for low-impact uses such as utility corridors and ventilation systems, while deeper spaces are reserved as strategic reserves. Additionally, a risk monitoring and ecological compensation mechanism should be established to ensure that underground development proceeds in parallel with ecological safety.

6.1.3. Limitations

Although this study constructs an urban UUS supply–demand coupling evaluation framework based on multi-source remote sensing and geospatial data and achieves initial results in spatial visualization and structural identification, several limitations remain.
First, while remote sensing data provide strong advantages for macro-scale representation, indicators such as nighttime lights and population grids primarily reflect surface activities. They lack the capacity to directly capture the spatial structure and actual capacity of underground facilities. Second, the POI data are sourced from public platforms and may omit confidential infrastructure such as municipal pipelines or emergency shelters. Additionally, POI attributes may be affected by ambiguous classifications and cross-labeling, impacting the accuracy and reliability of supply-side indicators. It is recommended that future research incorporates methods such as machine learning in combination with other databases for cross-validation to reduce errors. Additionally, since POI data are unable to directly reflect the actual area and capacity of underground spaces, collaboration with relevant organizations to obtain more precise data would be beneficial. Third, the current model mainly relies on static data and does not incorporate dynamic variables such as urban expansion, population migration, or transportation evolution. Consequently, it is unable to predict future trends in supply–demand changes. And for indicators that are difficult to quantify directly, subjective adjustments were mainly made based on relevant experience. In the future, it would be beneficial to explore more objective approaches for these indicators. Fourth, although this study considers ecological and geological influences, the evaluation framework does not yet integrate engineering geological constraints such as groundwater levels, seismic zones, or soil stability, which may lead to deviations from real-world development feasibility. Finally, the analysis is primarily conducted at the grid level within the central urban area and lacks a linkage mechanism to micro-scale parcels or broader regional coordination frameworks. Future research should further integrate high-resolution remote sensing and geological data, incorporate urban evolution simulation and dynamic demand forecasting methods, and develop a multi-scale evaluation framework for UUS that encompasses structure, function, and safety. This would facilitate a transition from static identification to dynamic regulation, and from localized analysis to holistic urban system governance.

6.2. Conclusions

This study constructs a supply–demand evaluation framework for UUS in central city areas using multi-source remote sensing and geospatial data and applies this framework to the central urban area of Nanjing, China.
The main conclusions are as follows:
(1) The supply–demand evaluation framework driven by multi-source data exhibits high applicability across diverse urban contexts. The UUS supply–demand assessment framework constructed in this study, which integrates POI and remote sensing data, effectively supports the spatial identification and relational characterization of UUS. It demonstrates strong capabilities in spatial visualization and holds significant potential for broader application. This framework can serve as a scientific basis and decision-making reference for zoning optimization, structural adjustment, and refined governance of UUS development in megacities.
(2) Significant Spatial Disparities in UUS Supply Capacity in Nanjing. Overall, the Old City Zones possess a strong foundation for UUS development, supported by well-established infrastructure. High-supply zones are primarily concentrated in functionally mature areas such as Xinjiekou and Zhujiang Road, displaying clear spatial clustering. In contrast, newly developed and peripheral regions exhibit a relatively weak supply capacity.
(3) Core–Periphery Diffusion Characteristics in Underground Space Development Demand in Nanjing. The spatial distribution of UUS demand in Nanjing exhibits a pattern of “Old City core–transitional periphery–declining edges”. High-demand areas are concentrated in regions such as Xinjiekou, Hexi, Tiebeiluo, and the southern part of the city, largely influenced by commercial clustering, high population density, and the presence of public transport hubs. This has resulted in a spatially multi-core agglomeration pattern.
(4) Concentrated Spatial Distribution of UUS Supply–Demand Imbalances in Nanjing. This study identifies a prominent “demand exceeds supply” phenomenon in the core area of Nanjing’s Old City and its surrounding regions. In particular, along the Xinjiekou–Hexi–Tiebei corridor, supply–demand imbalances are spatially concentrated, highlighting structurally constrained zones in UUS development.
Although this study has achieved the spatial visualization and structural identification of underground space supply and demand relationships, there is still room for improvement in terms of data accuracy, dynamic process simulation, and multi-scale collaborative analysis. Future research could strengthen collaboration with relevant departments to obtain higher-resolution remote sensing, geological, and engineering data and incorporate simulation methods for urban evolution and dynamic demand changes. This would promote a shift from static identification to dynamic regulation within the evaluation system, enabling a deeper transition from spatial visualization to policy formulation and management decision-making.

Author Contributions

Conceptualization, Z.W. and G.L.; methodology, Z.W., G.L. and Y.H.; software, Z.W., G.L. and Y.H.; validation, G.L. and Y.H.; formal analysis, Z.W. and Y.H.; investigation, Z.W., G.L. and Y.H.; resources, L.S.; data curation, Z.W. and Y.H.; writing—original draft preparation, Z.W. and G.L.; writing—review and editing, Z.W., G.L. and L.S.; visualization, Z.W. and Y.H.; supervision, L.S.; project administration, L.S.; funding acquisition, Z.W. All authors have read and agreed to the published version of the manuscript.

Funding

This research was funded by the National Natural Science Foundation of China (Youth Program), grant number 42401352.

Data Availability Statement

The original contributions presented in this study are included in the article. Further inquiries can be directed to the corresponding author(s).

Conflicts of Interest

The authors declare no conflict of interest.

References

  1. Hunt, D.V.L.; Makana, L.O.; Jefferson, I.; Rogers, C.D.F. Liveable Cities and Urban Underground Space. Tunn. Undergr. Space Technol. 2016, 55, 8–20. [Google Scholar] [CrossRef]
  2. Chen, Z.-L.; Chen, J.-Y.; Liu, H.; Zhang, Z.-F. Present Status and Development Trends of Underground Space in Chinese Cities: Evaluation and Analysis. Tunn. Undergr. Space Technol. 2018, 71, 253–270. [Google Scholar] [CrossRef]
  3. Zhao, J.-W.; Peng, F.-L.; Wang, T.-Q.; Zhang, X.-Y.; Jiang, B.-N. Advances in Master Planning of Urban Underground Space (UUS) in China. Tunn. Undergr. Space Technol. 2016, 55, 290–307. [Google Scholar] [CrossRef]
  4. Liu, S.-C.; Peng, F.-L.; Qiao, Y.-K.; Dong, Y.-H. Quantitative Evaluation of the Contribution of Underground Space to Urban Resilience: A Case Study in China. Undergr. Space 2024, 17, 1–24. [Google Scholar] [CrossRef]
  5. Hong, X.; Ji, X. Spatial Pattern of Underground Space Development in Major Cities in China: Evaluation and Analysis. Math. Probl. Eng. 2021, 2021, 2125776. [Google Scholar] [CrossRef]
  6. Lu, Z.; Wu, L.; Zhuang, X.; Rabczuk, T. Quantitative Assessment of Engineering Geological Suitability for Multilayer Urban Underground Space. Tunn. Undergr. Space Technol. 2016, 59, 65–76. [Google Scholar] [CrossRef]
  7. Bobylev, N. Mainstreaming Sustainable Development into a City’s Master Plan: A Case of Urban Underground Space Use. Land Use Policy 2009, 26, 1128–1137. [Google Scholar] [CrossRef]
  8. Sterling, R.; Admiraal, H.; Bobylev, N.; Parker, H.; Godard, J.-P.; Vähäaho, I.; Rogers, C.D.F.; Shi, X.; Hanamura, T. Sustainability Issues for Underground Space in Urban Areas. Proc. Inst. Civ. Eng.—Urban Des. Plan. 2012, 165, 241–254. [Google Scholar] [CrossRef]
  9. Zheng, Q.; Weng, Q.; Wang, K. Characterizing Urban Land Changes of 30 Global Megacities Using Nighttime Light Time Series Stacks. ISPRS J. Photogramm. Remote Sens. 2021, 173, 10–23. [Google Scholar] [CrossRef]
  10. Xiong, S.; Zhang, X.; Wang, H.; Lei, Y.; Tan, G.; Du, S. Mapping the First Dataset of Global Urban Land Uses with Sentinel-2 Imagery and POI Prompt. Remote Sens. Environ. 2025, 327, 114824. [Google Scholar] [CrossRef]
  11. Chen, Y.; Yang, J.; Yang, R.; Xiao, X.; Xia, J. (Cecilia) Contribution of Urban Functional Zones to the Spatial Distribution of Urban Thermal Environment. Build. Environ. 2022, 216, 109000. [Google Scholar] [CrossRef]
  12. Yang, J.; Yu, W.; Baklanov, A.; He, B.; Ge, Q. Mainstreaming the Local Climate Zone Framework for Climate-Resilient Cities. Nat. Commun. 2025, 16, 5705. [Google Scholar] [CrossRef] [PubMed]
  13. Ma, C.-X.; Peng, F.-L. Evaluation of Spatial Performance and Supply-Demand Ratios of Urban Underground Space Based on POI Data: A Case Study of Shanghai. Tunn. Undergr. Space Technol. 2023, 131, 104775. [Google Scholar] [CrossRef]
  14. Liu, S.-C.; Peng, F.-L.; Qiao, Y.-K.; Zhang, J.-B. Evaluating Disaster Prevention Benefits of Underground Space from the Perspective of Urban Resilience. Int. J. Disaster Risk Reduct. 2021, 58, 102206. [Google Scholar] [CrossRef]
  15. Ma, C.-X.; Peng, F.-L. Monetary Evaluation Method of Comprehensive Benefits of Complex Underground Roads for Motor Vehicles Orienting Urban Sustainable Development. Sustain. Cities Soc. 2021, 65, 102569. [Google Scholar] [CrossRef]
  16. Mavrikos, A.; Kaliampakos, D. An Integrated Methodology for Estimating the Value of Underground Space. Tunn. Undergr. Space Technol. 2021, 109, 103770. [Google Scholar] [CrossRef]
  17. Peng, J.; Peng, F.-L. A GIS-Based Evaluation Method of Underground Space Resources for Urban Spatial Planning: Part 2 Application. Tunn. Undergr. Space Technol. 2018, 77, 142–165. [Google Scholar] [CrossRef]
  18. Bobylev, N. Underground Space in the Alexanderplatz Area, Berlin: Research into the Quantification of Urban Underground Space Use. Tunn. Undergr. Space Technol. 2010, 25, 495–507. [Google Scholar] [CrossRef]
  19. Deng, Y.; Chen, J.; Zou, B.; Chen, Q.; Ma, J.; Shen, C. Research on the Driving Factors and Prediction Model of Urban Underground Space Demand in China. Sustainability 2024, 16, 3700. [Google Scholar] [CrossRef]
  20. Li, X.; Xu, H.; Li, C.; Sun, L.; Wang, R. Study on the Demand and Driving Factors of Urban Underground Space Use. Tunn. Undergr. Space Technol. 2016, 55, 52–58. [Google Scholar] [CrossRef]
  21. He, L.; Song, Y.; Dai, S.; Durbak, K. Quantitative Research on the Capacity of Urban Underground Space—The Case of Shanghai, China. Tunn. Undergr. Space Technol. 2012, 32, 168–179. [Google Scholar] [CrossRef]
  22. Ni, X.; Li, J.; Xu, J.; Shen, Y.; Liu, X. Grey Relation Analysis and Multiple Criteria Decision Analysis Method Model for Suitability Evaluation of Underground Space Development. Eng. Geol. 2024, 338, 107608. [Google Scholar] [CrossRef]
  23. Ma, C.-X.; Peng, F.-L.; Qiao, Y.-K.; Li, H. Evaluation of Spatial Performance of Metro-Led Urban Underground Public Space: A Case Study in Shanghai. Tunn. Undergr. Space Technol. 2022, 124, 104484. [Google Scholar] [CrossRef]
  24. Wang, X.; Zhen, F.; Huang, X.; Zhang, M.; Liu, Z. Factors Influencing the Development Potential of Urban Underground Space: Structural Equation Model Approach. Tunn. Undergr. Space Technol. 2013, 38, 235–243. [Google Scholar] [CrossRef]
  25. Chen, Y.; Chen, Z.; Guo, D.; Zhao, Z.; Lin, T.; Zhang, C. Underground Space Use of Urban Built-up Areas in the Central City of Nanjing: Insight Based on a Dynamic Population Distribution. Undergr. Space 2022, 7, 748–766. [Google Scholar] [CrossRef]
  26. Zhu, H.; Huang, X.; Li, X.; Zhang, L.; Liu, X. Evaluation of urban underground space resources using digitalization technologies. Undergr. Space 2016, 1, 124–136. [Google Scholar] [CrossRef]
  27. Tan, F.; Wang, J.; Jiao, Y.-Y.; Ma, B.; He, L. Suitability Evaluation of Underground Space Based on Finite Interval Cloud Model and Genetic Algorithm Combination Weighting. Tunn. Undergr. Space Technol. 2021, 108, 103743. [Google Scholar] [CrossRef]
  28. Dong, Y.-H.; Peng, F.-L.; Bao, Z.-H.; Qiao, Y.-K. Identification of the Spatial Distribution Pattern and Driving Forces of Underground Parking Space Based on Multi-Source Data: A Case Study of Fuzhou City in China. Sustain. Cities Soc. 2021, 72, 103084. [Google Scholar] [CrossRef]
  29. Zhang, Y.; Zhu, J.; Liao, Z.; Guo, J.; Xie, H.; Peng, Q. An Intelligent Planning Model for the Development and Utilization of Urban Underground Space with an Application to the Luohu District in Shenzhen. Tunn. Undergr. Space Technol. 2021, 112, 103933. [Google Scholar] [CrossRef]
  30. Singh, P.; Kikon, N.; Verma, P. Impact of Land Use Change and Urbanization on Urban Heat Island in Lucknow City, Central India. A Remote Sensing Based Estimate. Sustain. Cities Soc. 2017, 32, 100–114. [Google Scholar] [CrossRef]
  31. Zhang, A.; Han, Z.; Sun, G.; Chen, X.; Cheng, J.; Zhang, H. An Impervious Surfaces Extraction Method Based on Optical, Ascending and Descending SAR Remote Sensing Imagery in High-Density Urban Core Areas. Int. J. Appl. Earth Obs. Geoinf. 2025, 140, 104595. [Google Scholar] [CrossRef]
  32. Sun, R.; Su, X.; Yuan, Q.; Jiao, H.; He, J.; Zheng, L. Urban Region Function Classification via Fusing Optical Imagery and Social Media Data: A Spatio-Temporal Transformer Interaction Approach. Inf. Fusion 2025, 121, 103140. [Google Scholar] [CrossRef]
  33. Chen, Y.; Yang, J.; Yu, W.; Ren, J.; Xiao, X.; Xia, J.C. Relationship between Urban Spatial Form and Seasonal Land Surface Temperature under Different Grid Scales. Sustain. Cities Soc. 2023, 89, 104374. [Google Scholar] [CrossRef]
  34. Yang, J.; Ren, J.; Creutzig, F.; Zhao, B.; Sun, W.; Xiao, X.; Xia, J.; Ge, Q. Continuous Assessment of the Factors Driving the Urban Surface Thermal Environment in 1469 Cities Worldwide. Cell Rep. Sustain. 2025, 1, 100463. [Google Scholar] [CrossRef]
  35. Huang, C.; Feng, Y.; Wei, Y.; Sun, D.; Li, X.; Zhong, F. Assessing Regional Public Service Facility Accessibility Using Multisource Geospatial Data: A Case Study of Underdeveloped Areas in China. Remote Sens. 2024, 16, 409. [Google Scholar] [CrossRef]
  36. Xu, Y.; Chen, X. Quantitative Analysis of Spatial Vitality and Spatial Characteristics of Urban Underground Space (UUS) in Metro Area. Tunn. Undergr. Space Technol. 2021, 111, 103875. [Google Scholar] [CrossRef]
  37. Yin, J.; Dong, Y.H.; Peng, F.L. Identification of Driving Factors for Underground Parking Space in Xi’an Based on POI Data. Chin. J. Undergr. Space Eng. 2022, 18, 554–572. [Google Scholar]
  38. Yu, H.; Yang, J.; Li, T.; Jin, Y.; Sun, D. Morphological and Functional Polycentric Structure Assessment of Megacity: An Integrated Approach with Spatial Distribution and Interaction. Sustain. Cities Soc. 2022, 80, 103800. [Google Scholar] [CrossRef]
  39. Bian, J.W. Research on transportation planning for spatial development in large cities. Planners 2005, 8, 5–9. [Google Scholar]
  40. Yang, Y.H.; Qiao, Z.M.; Hu, R.J.; Cai, Y. Research on the layout patterns of underground space in metro station areas. Urban Mass. Transit. 2021, 24, 25–29. [Google Scholar] [CrossRef]
  41. Diakoulaki, D.; Mavrotas, G.; Papayannakis, L. Determining Objective Weights in Multiple Criteria Problems: The Critic Method. Comput. Oper. Res. 1995, 22, 763–770. [Google Scholar] [CrossRef]
  42. Chen, Z.L.; Wang, Y.B.; Liu, H.; Xiao, Q.F. Research on demand forecasting of urban underground space. Planners 2007, 10, 9–13. [Google Scholar]
  43. Xu, X.L. China’s monthly nighttime light dataset. Resour. Environ. Sci. Data Platf. 2022. [Google Scholar] [CrossRef]
  44. Peng, J.; Peng, F.-L. A GIS-Based Evaluation Method of Underground Space Resources for Urban Spatial Planning: Part 1 Methodology. Tunn. Undergr. Space Technol. 2018, 74, 82–95. [Google Scholar] [CrossRef]
  45. Tang, Z.; Chen, S. Social Justice Performance Evaluation of the Distribution of the Rail Transit Network in Central Shanghai. Shanghai Urban Plan. 2016, 2, 102–108. [Google Scholar]
  46. Chen, H.; Zhao, K.; Zhang, Z.; Zhang, H.; Lu, L. Methods for the Performance Evaluation and Design Optimization of Metro Transit-Oriented Development Sites Based on Urban Big Data. Land 2024, 13, 1233. [Google Scholar] [CrossRef]
  47. Xu, S.Y.; Xu, S.L.; Cui, J. Demand forecasting for urban underground space resource development and utilization: An economic analysis. J. Nanjing Univ. Sci. Technol. 2023, 36, 26–36. [Google Scholar] [CrossRef]
  48. He, G.; Zhang, L.; Wei, X.; Jin, G. Scale Effects on the Supply–Demand Mismatches of Ecosystem Services in Hubei Province, China. Ecol. Indic. 2023, 153, 110461. [Google Scholar] [CrossRef]
  49. Li, J.; Jiang, H.; Bai, Y.; Alatalo, J.M.; Li, X.; Jiang, H.; Liu, G.; Xu, J. Indicators for Spatial–Temporal Comparisons of Ecosystem Service Status between Regions: A Case Study of the Taihu River Basin, China. Ecol. Indic. 2016, 60, 1008–1016. [Google Scholar] [CrossRef]
  50. Deng, C.; Liu, J.; Liu, Y.; Li, Z.; Nie, X.; Hu, X.; Wang, L.; Zhang, Y.; Zhang, G.; Zhu, D.; et al. Spatiotemporal Dislocation of Urbanization and Ecological Construction Increased the Ecosystem Service Supply and Demand Imbalance. J. Environ. Manag. 2021, 288, 112478. [Google Scholar] [CrossRef]
  51. Zhou, D.; Sun, J.Y.; Gu, G.B.; Zhong, C.J.; Wang, T. Taxi driver passenger-seeking route optimization method based on trajectory data. J. Chongqing Jiaotong Univ. 2024, 43, 83–90. [Google Scholar]
  52. Liu, B.; Tian, Y.; Guo, M.; Tran, D.; Alwah, A.A.Q.; Xu, D. Evaluating the Disparity between Supply and Demand of Park Green Space Using a Multi-Dimensional Spatial Equity Evaluation Framework. Cities 2022, 121, 103484. [Google Scholar] [CrossRef]
  53. Luo, X.; Yang, J.; Sun, W.; He, B. Suitability of Human Settlements in Mountainous Areas from the Perspective of Ventilation: A Case Study of the Main Urban Area of Chongqing. J. Clean. Prod. 2021, 310, 127467. [Google Scholar] [CrossRef]
  54. Qiao, Y.-K.; Peng, F.-L. Lessons Learnt from Urban Underground Space Use in Shanghai—From Lujiazui Business District to Hongqiao Central Business District. Tunn. Undergr. Space Technol. 2016, 55, 308–319. [Google Scholar] [CrossRef]
  55. Huang, Y.; Pu, L.J.; Zhu, M. Research on the development history, current situation, and regional differences of urban underground space utilization in Nanjing. Mod. Urban Res. 2018, 12, 69–75. [Google Scholar]
Figure 1. Location map of the study area.
Land 14 01671 g001
Figure 2. Total scale of underground space construction in Nanjing. Source: Report on Underground Space Development in Nanjing.
Land 14 01671 g002
Figure 3. Top 10 cities in terms of per-capita underground space area in 2022. Source: Blue Book on Urban Underground Space Development in China (2023).
Land 14 01671 g003
Figure 4. The structure of underground space development in Nanjing. Source: The 14th Five-Year Plan for Underground Space Development in Nanjing.
Land 14 01671 g004
Figure 5. POI kernel density and remote sensing data. (a) Kernel density of underground parking facilities. (b) Kernel density of underground public service facilities. (c) Kernel density of metro stations. (d) Economic grid. (e) Nighttime light data. (f) Population grid.
Land 14 01671 g005
Figure 6. Evaluation of underground space supply capacity in the central urban area of Nanjing: (a) zoning map of underground space supply; (b) hotspot analysis map of underground space supply.
Land 14 01671 g006
Figure 7. Evaluation of underground space demand in the central urban area of Nanjing: (a) zoning map of underground space demand; (b) hotspot–coldspot analysis map.
Land 14 01671 g007
Figure 8. Evaluation of underground space demand ratio in central Nanjing: (a) zoning map of the underground space supply–demand relationship; (b) hotspot and coldspot analysis of the supply–demand relationship.
Land 14 01671 g008
Figure 9. Methodological framework for evaluating UUS supply and demand.
Land 14 01671 g009
Table 1. Influencing factors of UUS development demand.
Indicator CategorySpecific Indicators
Urban Spatial LocationUrban Spatial Position [17,22]
Metro Service Accessibility [17,23]
Bus Service Accessibility [24]
Socioeconomic DevelopmentPopulation Density [20,21,25]
Gross Regional Product [26,27,28]
Land Use PlanningLand Use Type [17,29]
Floor Area Ratio (FAR) [15,19]
Table 2. Weights of UUS supply indicators.
Secondary FactorWSjWj,s
Underground Parking Facilities40.18%x124.86%
x275.14%
Underground Public Service Facilities14.77%x348.02%
x451.98%
Underground Metro Stations40.05%x5--
Table 3. UUS demand score by urban spatial location.
LocationSl
Core areas1.0
Key areas0.8
General area0.6
Other areas0.4
Table 4. UUS demand scores by land use type.
Land Use Type Sl
Urban Construction Land Commercial land1.0
Administrative land, cultural land, and transportation hub land (road land)0.8
Residential land0.6
Public service facility land0.4
Other urban construction land0.2
Non-urban Construction LandData0.0
Table 5. Weights of UUS development demand indicators.
Secondary FactorWSjWj,s
Urban spatial location43.61%y129.62%
y241.49%
y328.89%
Socioeconomic development33.01%y436.16%
y563.84%
Urban planning 23.38%y623.10%
y776.90%
Table 6. Related indicators and calculation methods.
Primary IndicatorsSecondary IndicatorsData TypesIndicator CalculationData Source
Evaluation of UUS Supply IntensityUnderground Parking FacilitiesSupply Intensity of Underground Parking FacilitiesPOIThe underground parking POI data in each grid divided by the grid area.Web scraping
Underground Parking RatePOIThe number of underground parking POIs in each grid divided by the total number of parking POIs in the grid.Web scraping
Underground Public Service FacilitiesSupply Intensity of Underground Public Service FacilitiesPOIThe total number of underground public service facility POIs in each grid divided by the grid area.Web scraping
Development Ratio of Underground Public Service Facilities within Metro Catchment AreasPOIThe total number of underground public service facility POIs in each grid divided by the grid area.Web scraping
Underground Metro StationsSupply Intensity of Underground Metro StationsPOIThe number of public service facility POIs within a 500 m radius of the subway station in each grid divided by the grid area.Web scraping
Evaluation of UIUS Development DemandUrban Spatial LocationUrban Spatial LocationNighttime lighting dataDirectly use the datasetResource and Environmental Science Data Platform
Metro AccessibilityPOIAssign values based on distance decayWeb scraping
Bus AccessibilityPOIThe number of bus stop POIs in each grid divided by the grid area.Web scraping
Socioeconomic DevelopmentPopulation DensityPopulation dataDirectly use the datasetWorldPop
Regional Economic ValueEconomic dataDirectly use the datasetResource and Environmental Science Data Platform
Urban PlanningLand Use TypePlanning dataAssign values based on land use type codes.
Floor Area RatioBuilding footprint dataThe total building area in each grid divided by the grid data.Resource and Environmental Science Data Platform
Disclaimer/Publisher’s Note: The statements, opinions and data contained in all publications are solely those of the individual author(s) and contributor(s) and not of MDPI and/or the editor(s). MDPI and/or the editor(s) disclaim responsibility for any injury to people or property resulting from any ideas, methods, instructions or products referred to in the content.