Article

Research on the Impact of the National Agricultural Green Development Pilot Zone Policy on Agricultural Carbon Emission Efficiency—A Quasi-Natural Experiment in 41 Cities in the Yangtze River Delta, China

1
School of Marxism, Northeast Agricultural University, Harbin 150030, China
2
College of Economics and Management, Northeast Forestry University, Harbin 150040, China
*
Author to whom correspondence should be addressed.
Land 2025, 14(8), 1670; https://doi.org/10.3390/land14081670
Submission received: 30 June 2025 / Revised: 6 August 2025 / Accepted: 12 August 2025 / Published: 18 August 2025

Abstract

Improving the agricultural carbon emission efficiency (ACEE) has important practical significance for the green development of agriculture (GDA). However, few studies have analyzed the impact of the national agricultural green development pilot zone (NAGDPZ) policy on the ACEE. This study is based on panel data from 41 cities in the Yangtze River Delta (YRD) from 2013 to 2023. Through the creation of the NAGDPZ, a quasi-natural experiment was designed. By using the difference-in-differences (DID) method, a systematic analysis was conducted on the impact of the NAGDPZ policy on the ACEE. The research findings are as follows: (1) The overall ACEE in the YRD region has improved, and the spatial distribution is higher in the southeast and lower in the northwest. (2) The NAGDPZ policy can significantly enhance the ACEE, with a coefficient of 0.049. This positive effect is still observed even after many robustness tests. (3) The NAGDPZ policy has expanded the agricultural operation scale (AOS) and enhanced agricultural labor productivity (ALP), improving the ACEE. Therefore, it is suggested that the pilot scope of the NAGDPZ should be expanded.

1. Introduction

Agricultural Carbon emissions (ACEs) account for more than 20% of the total global carbon emissions [1,2] and have become an important issue for the sustainable development of mankind. China is a developing country and also a major agricultural country. During its development process, a considerable amount of ACEs have been generated [3,4]. Reducing ACEs has become an important part of China’s agricultural modernization. Improving carbon emission efficiency is the main way to effectively reduce ACEs and promote high-quality agricultural development [5,6]. Improving the ACEE is of great significance to China. The NAGDPZ is a large-scale pilot project in China that aims to promote the GDA [7]. Its aim is to promote agricultural economic development while reducing various agricultural pollutions, including ACE, and enhancing the capacity for GDA. Analysis of the impact of the NAGDPZ on ACEE can provide realistic evidence for the evaluation of the environmental benefits of this policy. However, at present, there are relatively few studies addressing this aspect.
ACEE has received high attention from scholars. Existing academic literature mainly focuses on the definition, calculation, and influencing factors of the ACEE for analysis. The definition of ACEE reflects the ideal minimum ACEs or maximum output under given input–output conditions and can reflect the level of agricultural productivity under ACE constraints [8]. When the ACEE improves, it results in the growth of the agricultural economy or a reduction in ACEs under the same input [9]. In terms of the calculation of ACEE, some scholars use the ratio of the GDP output level per unit of carbon dioxide in agriculture to measure ACEE [10]. However, more scholars measure the efficiency by constructing the index system of ACEE. The main calculation models are data envelopment analysis (DEA) models (for example, the non-expected output super slacks-based measure (N-S-SBM) model) [11,12,13,14,15,16]. In addition, the combination of these DEA models and the Malmquist index model represents an important method for calculating ACEE [17,18]. In terms of influencing factors for ACEE, factors such as economic development [19], changes in rural population structure [20], urbanization [21], integrated urban–rural development [22], grain subsidy [23], technological innovation [24], digital inclusive finance [9], and digital economy [25] will all have an impact on ACEE. In the system of influencing factors for ACEE, government policies are an important component. Existing research indicates that government policies have a significant impact on ACEs [26], and green agricultural development policies are crucial for reducing ACEs [27]. Existing studies have analyzed the roles of policy-based agricultural insurance [28], the “village consolidation and resettlement” policy [29], the smart agriculture policy [30], the farmland leasing policy [31], and the high-standard farmland construction policy [32] in ACEs and ACEE. Furthermore, existing studies have also pointed out that pilot policies oriented towards promoting green development will have a positive impact on carbon emissions [33,34]. Some studies have also explored the reduction effect of pilot policies such as the big data comprehensive experimental zone policy [35] on ACEs. It can be seen that the research on ACEE is very rich, which provides scientific support for improving ACEE. In particular, research on the impact of various agricultural policies on ACEE reveals the important role of policies. However, it should be noted that existing research rarely specifically discusses the role of agricultural green development policies such as the NAGDPZ in ACEE.
The NAGDPZ has also seen some studies explore the role of this policy in the agricultural ecological environment. For example, Gao et al. [7] took Zhejiang and Jiangsu provinces as research areas and analyzed the NAGDPZ policy’s impact on the government’s activities supporting environmental protection. The results showed that after the implementation of the policy, the investment of local governments in Zhejiang Province in environmental protection increased. Yao et al. [36] analyzed the impact of the NAGDPZ policy on the green total factor productivity of agriculture (AGTFP). They pointed out that the implementation of this policy pilot significantly improved the AGTFP by enhancing technical efficiency. Li et al. [37] took Hubei Province as a research area and analyzed the impact of the NAGDPZ policy on agricultural ecological efficiency (AEE). The analysis found that the NAGDPZ policy enhanced AEE, and agricultural innovation was an important mediating variable enabling the policy to play its role. Existing research has demonstrated the positive effects of the NAGDPZ policy on the agricultural ecological environment, providing practical evidence for the in-depth implementation and further promotion of this policy, and holds academic and practical value. However, at present, there are still relatively few studies on the impact of the NAGDPZ policy on ACEE, and the above-mentioned studies are not specifically focused on ACEE. This imposes certain constraints on the improvement in ACEE.
The YRD region has received high attention from the academic community [38,39,40]. The YRD region is facing increasing pressure from human activities and the ecological environment [41,42], and its agricultural ecological environment is also facing severe challenges [43,44]. The development of agriculture urgently needs green transformation [45]. Meanwhile, the YRD region is also an important area of the NAGDPZ. It includes Zhejiang Province, which has been selected as an NAGDPZ [7], as well as two major grain-producing areas, Jiangsu and Anhui, and Shanghai, a municipality directly under the central government that has been selected as an NAGDPZ. Therefore, exploring the impact of the NAGDPZ policy in the YRD region on ACEE can not only provide scientific support for agricultural green development in this key area but also offer references for the implementation of the NAGDPZ policy in other regions of China. It is also conducive to providing a reference for the implementation of agricultural green development policies in other countries around the world. However, existing research has not systematically discussed the ACEE of the YRD region specifically in terms of the NAGDPZ. This is not conducive to effectively improving the ACEE and reducing ACEs in this region.
This study analyzes the influence of the NAGDPZ policy on ACEE and further explores its influencing mechanisms. The contributions of this article are as follows: (1) Through comparison with existing studies on the factors influencing ACEE, this study explores the role and mechanism of the NAGDPZ policy on the ACEE, which has been less analyzed in existing studies, and further enriches the system used to analyze the ACEE’s influencing factors. (2) Compared with existing research on the NAGDPZ, this study expands current knowledge. For example, the main goal of the research of Gao et al. [7] and Yao et al. [36] was to explore the role of the establishment of the NAGDPZ in environmental input and AGTFP, without considering the issue of ACEs. Although Li et al. [37] took ACEs into account in the calculation of AEE, there are differences when compared with this study in terms of the research area, index setting, and mechanism of action. Moreover, one is an analysis at the urban level, and the other is an analysis at the county level. This study will provide a new perspective on NAGDPZ research. (3) In terms of theory, this article provides new empirical analysis support for environmental regulation theory, verifies the positive significance of composite environmental regulation for the low-carbon development of agriculture (LCDA), and at the same time, theoretically reveals the mechanism by which the NAGDPZ policy enhances the expansion of AOS and the improvement of ALP in ACEE.
The purpose of this article is to discuss the impact of the NAGDPZ policy on ACEE, thereby providing some suggestions for the implementation of this policy and offering references for improving ACEE so as to promote LCDA. The main structure of this article is as follows: Section 2 contains a theoretical analysis and outlines the hypotheses, offering theoretical discussions on the impact of the NAGDPZ policy on ACEE and its mechanism. Section 3 covers the research area, model setup, and data sources. Section 4 provides an empirical analysis, using the results to prove the hypotheses and elucidate the robustness of the analytical content. Section 5 is a discussion, mainly focusing on the value of the research results and their relationship with existing achievements. Section 6 details the conclusion and policy recommendations.

2. Theoretical Analysis and Hypotheses

2.1. The Direct Impact of the NAGDPZ Policy on ACEE

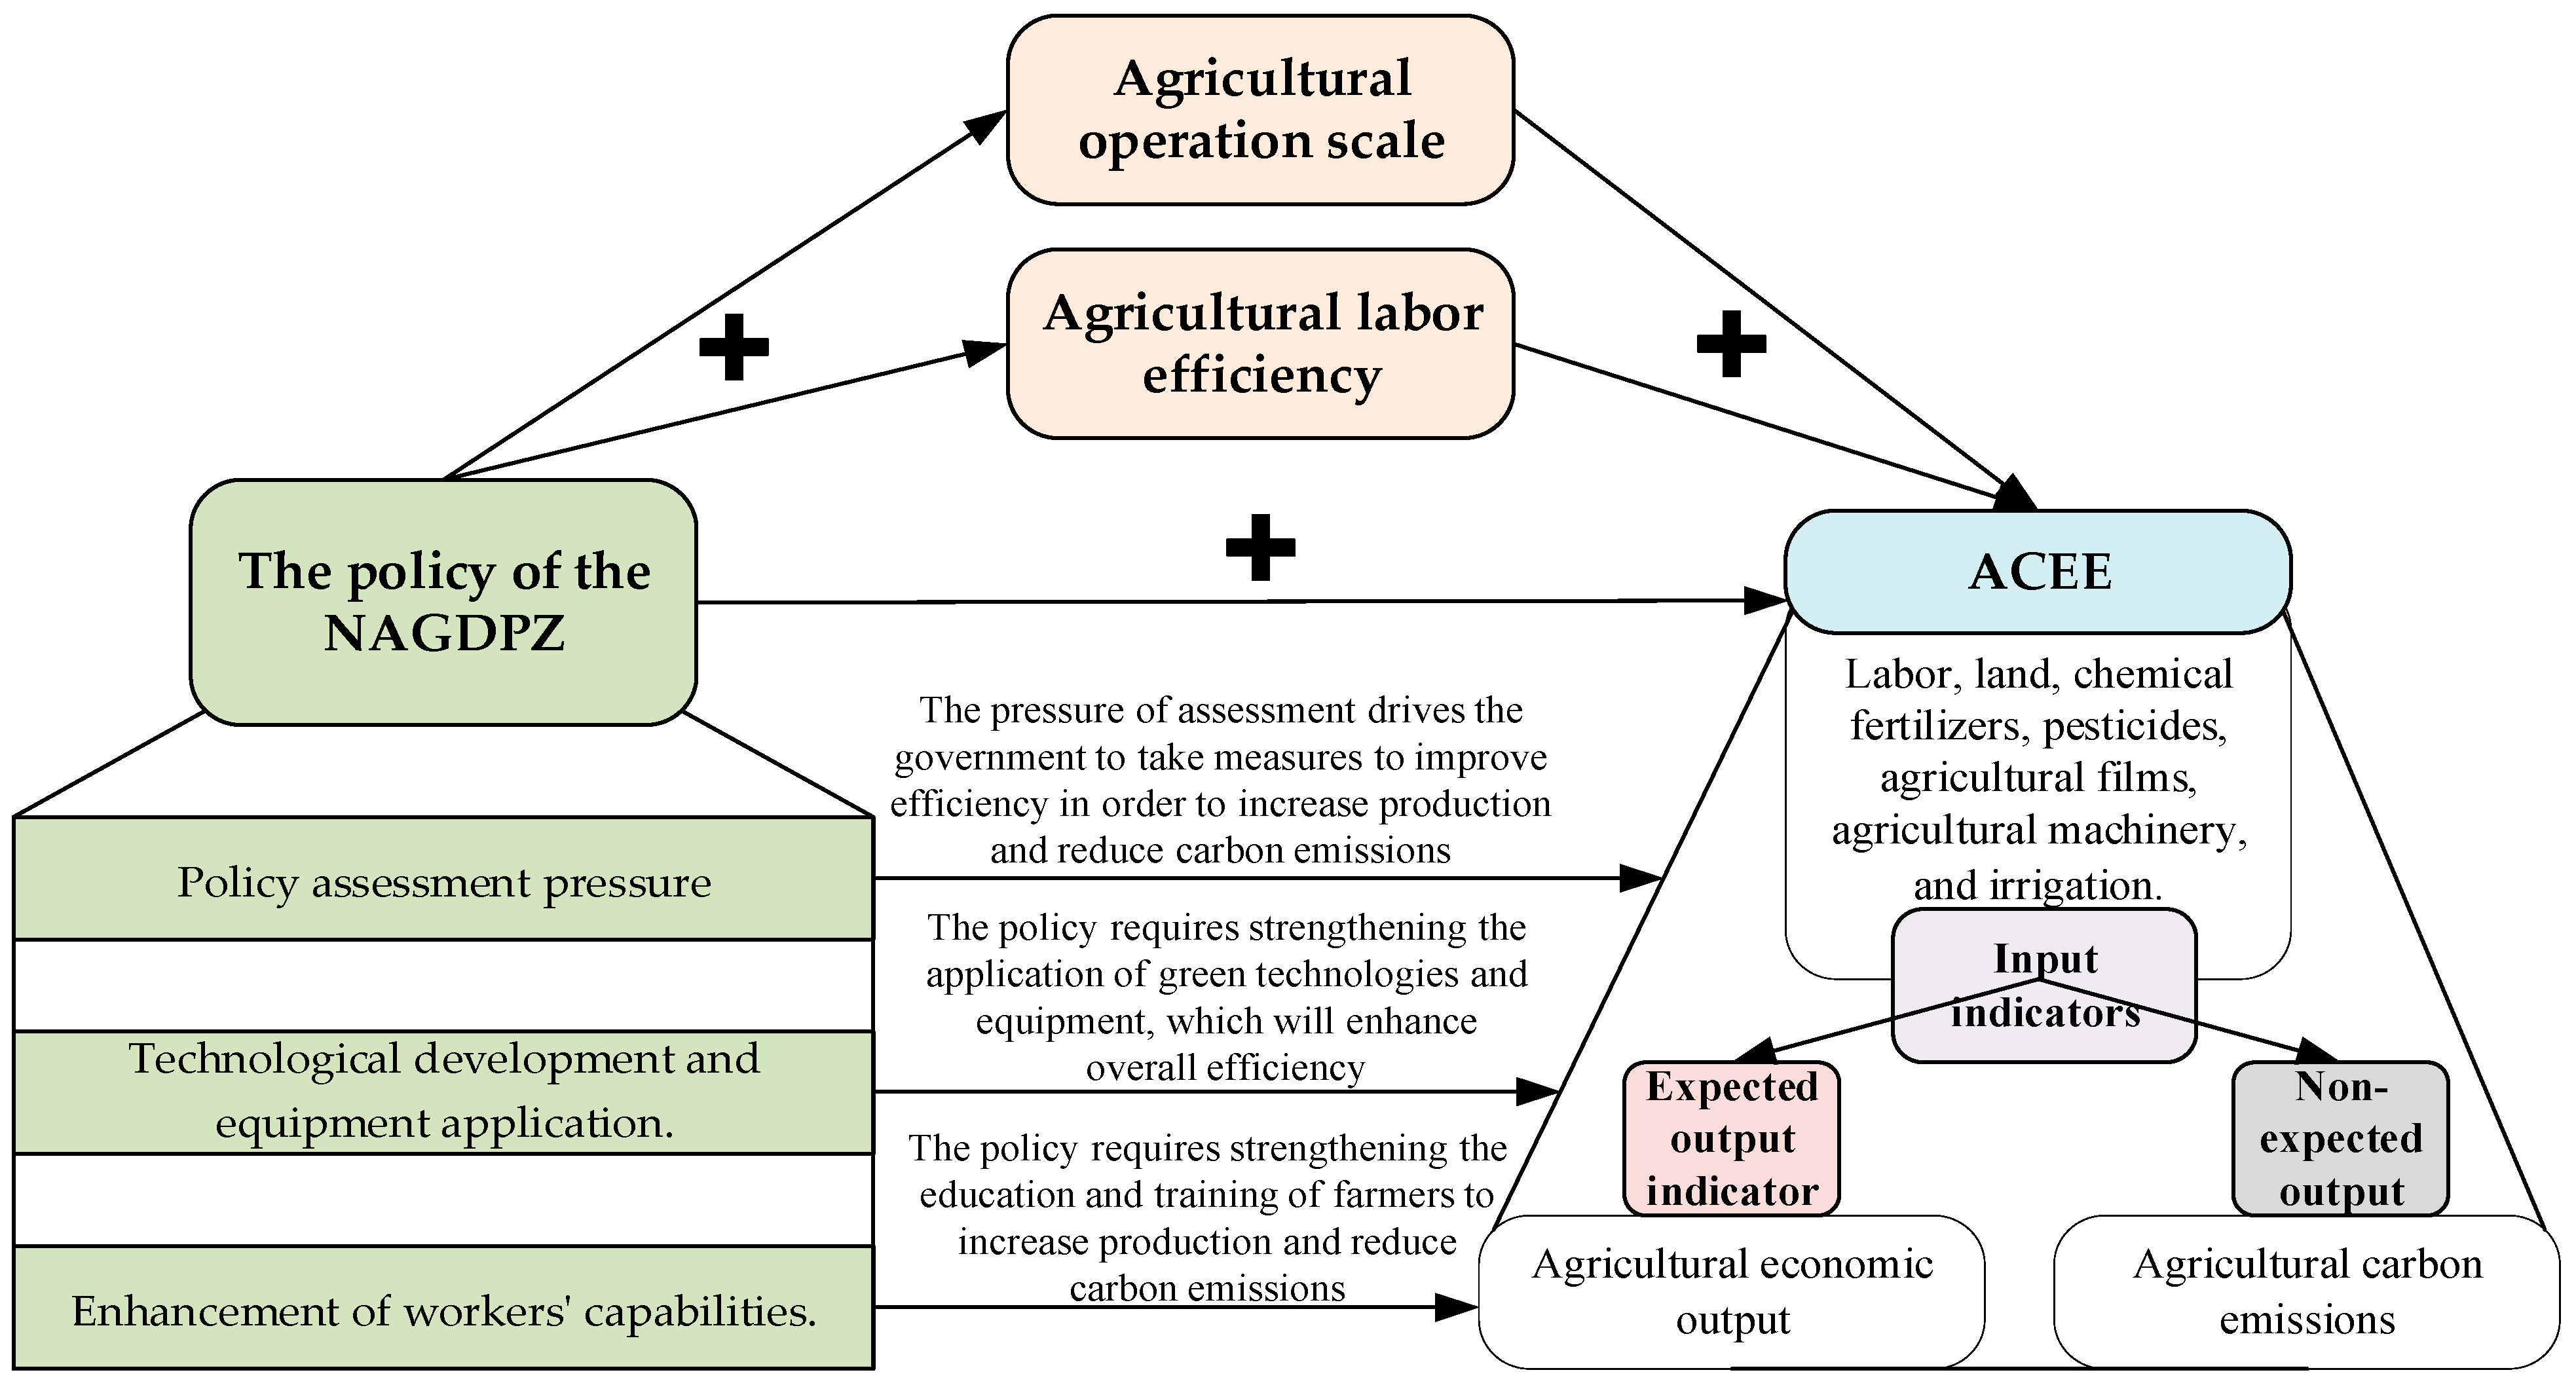
The NAGDPZ policy is a type of environmental regulation. Studies have pointed out the positive significance of environmental regulations in improving carbon emission efficiency [46,47], and. Some studies have also analyzed the influence of agricultural environmental regulations on the ACEE. For instance, Fan and Li [48] pointed out that under the effect of innovation compensation, formal environmental regulations can enhance ACEE in the long term. According to the theory of environmental regulation, agricultural carbon emissions have typical negative externalities. Agricultural enterprises and farmers generate ACEs during the agricultural production process due to the use of chemical fertilizers, pesticides, and agricultural films, but they do not bear the cost for this; meanwhile, society as a whole ends up paying the price for it, thus causing the allocation of resources to deviate from the optimal level. To address environmental pollution such as agricultural carbon emissions, the government needs to implement environmental regulations. The NAGDPZ policy is a policy pilot program designed to reduce ACEs and other pollutants. It improves agricultural production and operation activities through various means such as administrative orders, technological promotion, and personnel training, aiming to promote agricultural economic growth while reducing ACEs, thereby enhancing ACEE. Figure 1 is a framework thought diagram of the influencing process.
(1) Policy assessment. The establishment of the NAGDPZ is a local environmental policy issued by the central government, including financial incentives and strict assessment. This situation puts local governments under great pressure in achieving their goals [49]. Relevant policy documents show that the NAGDPZ policy has established a strict assessment system covering over 20 ecological indicators such as the organic matter content of cultivated soil, the effective utilization coefficient of irrigation water in farmland, and the reduction ratio of pesticides and fertilizers. Regular assessments are conducted on each pilot zone, and regions that fail to meet the standards will be required to rectify or even have their pilot programs canceled. There is a competitive relationship among local governments in China, and local governments have the motivation to promote economic development and reduce pollution to enhance their political achievements [50]. Under the pressure of strict policy assessment, local governments will take more proactive and effective measures to ensure the efficient utilization of agricultural resources, thereby achieving agricultural economic growth and increasing the expected output of ACEE. Meanwhile, policy assessment also forces regional governments to take measures to accelerate LCDA, reduce carbon sources such as chemical fertilizers, and thereby reduce the unintended output of ACEE. Under the pressure of policy assessment, various resources have been utilized more efficiently, the agricultural economy has grown, ACEs have decreased, and the overall ACEE has improved.
(2) Technological development and equipment application. The process of creating the NAGDPZ attaches great importance to the development and application of agricultural green technologies. Relevant policy documents mention the need to actively promote the application of agricultural green technologies such as water and fertilizer integration technology, green pesticide and fertilizer technology, and agricultural film residue recovery technology. The application of these agricultural green technologies can reduce the pollution of carbon sources. As existing research points out, the innovation and development of green technologies can significantly reduce carbon emissions [51,52,53]. Meanwhile, these green agricultural technologies can improve the agricultural production space, which is conducive to increasing agricultural output and ensuring the growth of the agricultural economy. In addition, the process of creating the NAGDPZ also requires accelerating the application of low-carbon agricultural machinery to enhance the level of agricultural mechanization while promoting LCDA. The improvement in agricultural mechanization will enhance agricultural technical efficiency [54], enabling the limited agricultural input to achieve a greater economic output through the application of low-carbon agricultural machinery. Moreover, compared with traditional agricultural machinery, low-carbon agricultural machinery is more efficient and energy-saving, which is conducive to reducing the use of agricultural diesel. The reduction in agricultural diesel will directly lower ACEs. As existing research indicates, agricultural mechanization can promote the GDA [55]. During the creation process of the NAGDPZ, the policy settings regarding the application of green agricultural technologies and machinery have increased the expected agricultural output and reduced ACEs, thereby promoting the improvement in ACEE.
(3) Enhancement in workers’ capabilities. Human capital is an important factor affecting ACEE. The accumulation of human capital is conducive to improving ACEE [56,57]. The quality and ability of agricultural laborers will directly affect the efficiency of production activities. The process of creating the NAGDPZ requires strengthening the education and training of farmers. Relevant policy documents propose that the NAGDPZ should cultivate a group of agricultural talents and new professional farmers who understand the concept of GDA and master green production technology and skills. Training farmers is of great significance for promoting economic development, reducing farmers’ losses, and increasing their income [58], and learning and training are conducive to enhancing farmers’ sustainable management capabilities [59]. The educational and training activities undertaken during the process of NAGDPZ creation will enhance the working ability of agricultural workers in the NAGDPZ, enabling them to use agricultural materials more efficiently and thereby create greater expected outputs. At the same time, training is also an important way to enhance farmers’ willingness to use green production technologies, including low-carbon technologies [60], which can significantly increase the possibility of farmers adopting biopesticides [61], thereby reducing carbon sources such as chemical fertilizers and lowering the ACEs that may form during the production process. The training activities undertaken during the process of NAGDPZ creation will accelerate the dissemination of knowledge related to low-carbon agricultural development, guide agricultural workers toward consciously reducing pesticide and chemical fertilizer use and instead employing green organic fertilizers and green pesticides in the actual production process, and lower ACEs by reducing carbon sources. Therefore, the relevant policy settings regarding labor force training in the NAGDPZ are also conducive to enhancing ACEE.
Hypothesis 1.
The NAGDPZ policy can enhance ACEE.

2.2. The Impact Mechanism of the NAGDPZ Policy on ACEE

2.2.1. Mechanism for Expanding Agricultural Scale

The NAGDPZ policy can promote the expansion of the regional AOS and thereby enhance ACEE. The improvement in ACEE depends on the full and effective utilization of various agricultural inputs, so that the same agricultural inputs can achieve greater expected outputs and generate less ACEs. When the AOS is large, agricultural operators have greater space and more abundant funds to achieve the scientific allocation of agricultural materials, such as labor force, land, and make effective use of them. Meanwhile, the expansion of the AOS is also conducive to the application of various advanced technologies and equipment in agriculture, thereby enabling agricultural operation entities to increase production and reduce emissions by leveraging the role of science and technology, and achieving an improvement in ACEE. In addition, large-scale agricultural operations can more effectively control the emissions of various agricultural pollutants, thereby reducing the production of greenhouse gases from related pollutants. Small-scale agricultural operations have relatively scattered sites and numerous responsible persons, making it difficult to achieve effective supervision. With the expansion of business scale, agricultural production is often more concentrated, and the pollution arising from this is also more concentrated, which is conducive to unified disposal and thereby reduces carbon emissions. Of course, large-scale agricultural operations do not necessarily lead to economies of scale. They also depend on the management level of managers, the natural endowment of the region, the development of technology, etc. However, the analysis results of numerous existing studies have proved that the expansion of the AOS in China at the present stage has played a relatively large role in reducing emissions. For instance, Bai et al. [62] found that large-scale agricultural operators pay more attention to the input efficiency of chemical substances such as fertilizers, which can effectively promote LCDA. Guan et al. [63] pointed out that large-scale agricultural operations are conducive to reducing ACEs in the long term; Zhu et al. [64] found that large-scale agricultural operations can not only increase food production and soil carbon storage but also reduce greenhouse gases. It is indicated that the expansion of AOS is conducive to increasing the expected output of agriculture and reducing the unexpected output. The policy of the NAGDPZ requires strengthening the development of various forms of moderate-scale operations and extending the green industrial system. All these policy measures are conducive to promoting the expansion of the AOS in pilot areas to build a more complete agricultural industrial system.
Hypothesis 2.
The NAGDPZ policy can promote the expansion of the regional AOS and thereby enhance ACEE.

2.2.2. Mechanism for Enhancing Labor Productivity

The NAGDPZ policy can promote the improvement in ALP in the region and thereby enhance ACEE. ALP generally refers to the agricultural output generated per unit of agricultural labor input [65]. Improving the ALP translates to enhancements in the working ability of agricultural workers. On the one hand, agricultural workers at a higher level can use agricultural materials such as land, chemical fertilizers, and pesticides more effectively, achieving higher agricultural output. On the other hand, agricultural workers of a higher level can make better use of low-carbon agricultural technologies and equipment, thereby reducing ACEs. In addition, agricultural workers with greater experience and higher education levels can better understand modern ecological protection knowledge and related concepts, which is conducive to promoting the implementation of low-carbon development concepts in specific agricultural practices. At the same time, they promote the dissemination of low-carbon concepts through cooperation and contact with others, thereby driving the overall low-carbon development of the agricultural industry chain. Therefore, the improvement in ALP is of great significance for the enhancement in ACEE. The NAGDPZ policy requires strengthening the education and training of farmers. These activities will enhance the working efficiency of the agricultural labor force, thereby reducing ACEE.
Hypothesis 3.
The NAGDPZ policy can promote the improvement in ALP in the region and thereby enhance ACEE.

3. Research Area, Model Settings, and Data Sources

3.1. Research Area

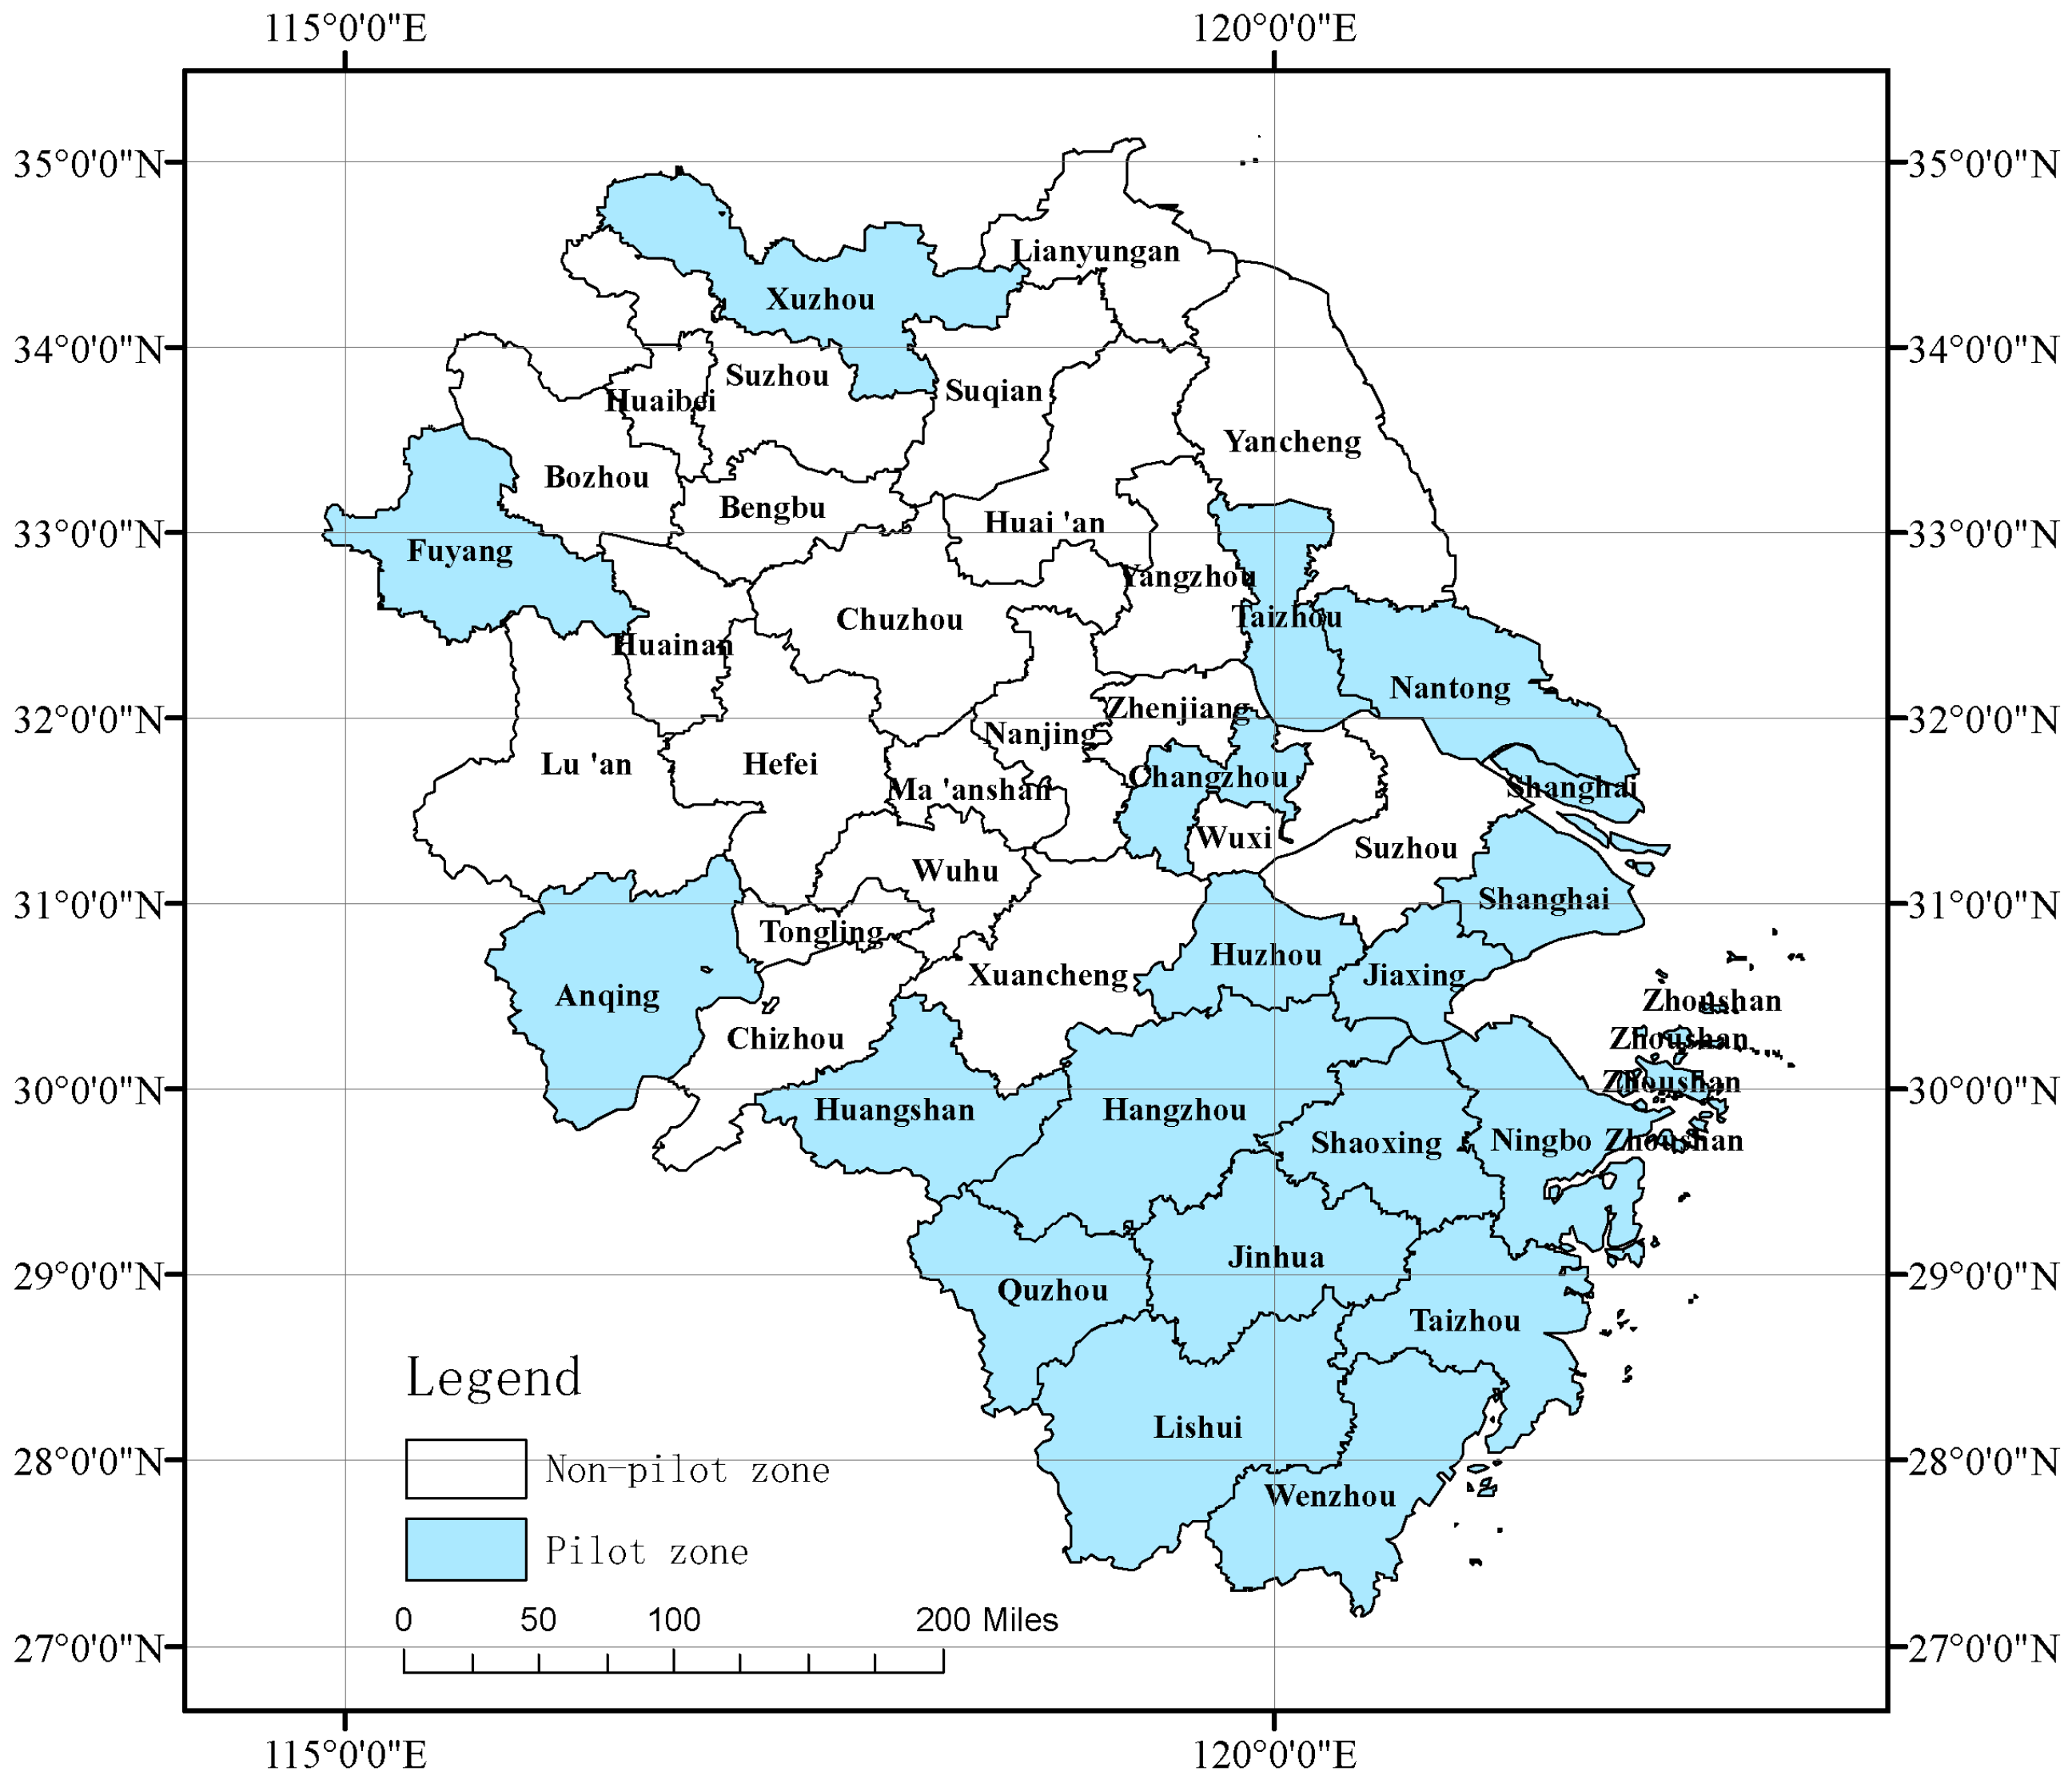
The YRD is located in the southeast coastal area of China. It governs three provinces (Anhui, Jiangsu, Zhejiang) and Shanghai (Figure 2). The YRD is an important agricultural base in China, with abundant agricultural resources [66]. In 2017 and 2019, a total of 19 regions in the YRD were selected into the NAGDPZ.

3.2. Model Settings

3.2.1. N-S-SBM Model

DEA is a non-parametric efficiency measurement method that uses linear programming to determine whether decision units (DMUs) of the same category are effective in production [67]. Based on the DEA model, the N-S-SBM model was established. This model allows for the existence of multiple input variables and multiple output variables and can also take into account undesired outputs without the need to pre-determine the functional relationship, offering numerous conveniences. Referring to the practices of existing studies [16,68,69], the N-S-SBM model is used to calculate the ACEE. Suppose there are n DMUs in the evaluation of ACEE, D M U j   ( j = 1 , 2 , , n ) , and each D M U has m inputs, x i = ( i = 1 , 2 , , q m ) . Then, the expected output is recorded as y r = ( r = 1 , 2 , , q 1 ) and the non-expected output is recorded as b t = ( t = 1 , 2 , , q 2 ) . The model is shown in Formula (1):
A C E E = m i n 1 + 1 m i = 1 m S i x i k 1 1 q 1 + q 2 r = 1 q 1 S r + y i k + r = 1 q 2 S r b b r k
j = 1 , j k n x i j λ j S i x i k j = 1 , j k n y r j λ j + S r + y r k j = 1 , j k n b i j λ j S t b x i k 1 1 q 1 + q 2 r = 1 q 1 S r + y i k + r = 1 q 2 S r b b r k > 0 λ 0 , S i 0 , S r + 0
Here, i = 1 , 2 , , m ; r = 1 , 2 , , q ; j = 1 , 2 , , n ( j k ) . A C E E represents the ACEE; S i , S r + , S t b , respectively, represent the slack variables of input, expected output, and non-expected output; λ is the weight vector.

3.2.2. DID Model

Referring to existing research [7,70], the DID method is used to analyze the impact of the NAGDPZ on ACEE.
A C E E i t = c 1 + c d i d d i d i t + ξ Z i t + ν i + μ t + ε i t
In the Formula (2), A C E E i t is the ACEE; i, t is the i-th city in the t-th year; d i d i t represents the selection situation of the NAGDPZ. The cities selected as the treatment group are assigned a value of 1 in the year they are selected as pilot zones and thereafter, i.e., d i d i t = 1; otherwise, it is 0. Z i t is the control variables; ν i , μ t represents the fixed effect of city and year; ε i t is the random disturbance term; c 1 is the intercept term; c d i d , ξ is the coefficient to be estimated.

3.2.3. Instrumental Variable Model

The impact of the NAGDPZ on ACEE may be endogenous. To further address the endogeneity issue, this paper intends to use an instrumental variable model to test and handle endogeneity. The first-stage model setting of instrumental variables is as follows:
d i d i t ¯ = c 2 + c i v I V i t + ξ Z i t + ν i + μ t + ε i t
d i d i t ¯ is the dummy variable of the NAGDPZ based on instrumental variable fitting, I V is the instrumental variable, c 2 is the intercept term of Equation (3), c i v is the coefficient of the instrumental variable, and the meanings of the other variables are as given below Equation (2). The second-stage model of the instrumental variable incorporates the implementation situation of the NAGDPZ fitted in the first stage into Equation (2).
A C E E i t = c 3 + C d i d ¯ d i d i t ¯ + ξ Z i t + ν i + μ t + ε i t
Here, c 3 is the intercept term, and C d i d ¯ is the coefficient of the dummy variable d i d i t ¯ for the NAGDPZ based on instrumental variable fitting. At this point, since d i d i t ¯ is determined by instrumental variables and other exogenous variables, the C d i d ¯ obtained by regression again is unbiased.

3.2.4. Mediating Effect Model

This paper adopts a two-step approach to identify the mechanism of action. The first formula is Equation (2). The second formula is Equation (5), which reflects the impact of the NAGDPZ policy on mediating variables. As for the influence of mediating variables on ACEE, this paper explains it based on the existing literature or practical experience.
M i t = c 4 + c d i d d i d i t + ξ Z i t + ν i + μ t + ε i t
In Equation (5), M i t is the mediating variable, c 4 is the intercept term, and other variables are set as in Equation (2).

3.3. Indicator Settings

3.3.1. ACEE

Referring to existing research [15,16], it can be assumed that the input indicators of ACEE generally include labor, land, chemical fertilizers, pesticides, agricultural films, agricultural machinery, and irrigation. The expected output indicator is generally agricultural economic output, and the non-expected output is ACEs.
Labor input is expressed by the quantity of agricultural labor force. Referring to existing research practices [71], this paper calculates it by multiplying the number of employed people in the primary industry by the proportion of regional agricultural output value to the output value of agriculture, forestry, animal husbandry, and fishery.
Other inputs refer to existing studies [15,16,70], and are reflected by the total sown area of crops, the converted pure amount of chemical fertilizer application, the usage number of pesticides, the usage amount of agricultural plastic films, the total power of agricultural machinery, and the effective irrigated area. Expected output indicators are measured by agricultural output value.
The unintended output of this article is ACEs. Referring to existing studies [63,72,73], the total ace is equal to the sum of the products of the carbon source and its carbon emission coefficient. The carbon source and its carbon emission coefficient are shown in Table 1.

3.3.2. Virtual Variable of NAGDPZ

In June 2017, the Chinese government issued the “Notice of the General Office of the Ministry of Agriculture on Conducting the Evaluation and Determination Work of the First Batch of National Agricultural Sustainable Development Experimental Demonstration Zones”, initiating the evaluation work of national agricultural sustainable development experimental demonstration zones (which later became NAGDPZ). In December 2017, the Chinese government released the first batch of 40 demonstration zones. In the second half of 2019, 2022, and 2023, the Chinese government released three batches of the listed areas of the NAGDPZ. During the process of creating the NAGDPZ, great importance was attached to the issue of agricultural carbon emissions. Relevant policy documents have repeatedly proposed to “strive to form a green, circular and low-carbon production system” and “promote the low-carbon and circular development of the agricultural industrial chain”, and the continuous emphasis on policy requirements such as reducing the use of chemical fertilizers and pesticides is also closely related to ACEs.
Up to now, there are four batches of the NAGDPZ. The list of the first batch of pilot zones was announced in December 2017, while the list of the second, third, and fourth batches of pilot zones was announced in 2019, 2022, and 2023, respectively. When Gao et al. [7], Yao et al. [36], and Li et al. [37] set up quasi-natural experiments based on the NAGDPZ, they mostly considered the first batch of cities announced in 2017. The main reason is that the subsequent pilot zones may not have produced effects, or the effects may not be sufficient compared with the research periods of these studies. Referring to existing research practices and comprehensively taking into account the research intervals, this study considers the first and second batches of pilot zones. When a city or a county or district under its jurisdiction is included in the list of the NAGDPZ, this study sets each year after the city is included in the list as the treatment group, and vice versa as the control group. As the list of the first batch of pilot zones was announced in the second half of 2017, its effect may not start to show until the following year. Therefore, the first batch of pilot zones is set with 2018 as the boundary. Cities selected for the first batch of pilot zones are set as 0 before 2018 and as 1 after 2018. The second batch uses 2020 as the boundary.

3.3.3. Control Variable

(1) Urbanization (K1). Urbanization significantly affects regional agricultural development and influences ACEs [76], so it also needs to be controlled. It is represented by using the regional urbanization rate.
(2) Regional industrial structure (K2). The industrial structure of a region will affect its overall economic development and also impact its agricultural development. In particular, the level of industrial development will affect the mobility of the agricultural labor force and the production and manufacture of materials. It is represented by the proportion of the added value of the secondary industry in the regional GDP.
(3) Level of agricultural mechanization (K3). Machinery can effectively enhance agricultural production efficiency and affect ACEs [63], so it needs to be controlled. It is represented by the ratio of the total power of agricultural machinery to the sown area of crops.
(4) Government participation level (K4). The participation of the government will affect agricultural production and operation and have an impact on ACEs [70,77], thereby exerting an effect on ACEE. Referring to existing research, the ratio of government fiscal expenditure to fiscal revenue is used to represent the government’s participation.
(5) Level of digital development (K5). The advancement of informatization and digitalization holds practical value for the governance of agricultural pollution. Considering that telecommunication services are closely related to the overall digitalization and informatization development of the region, the urban telecommunication service revenue is used for representation.

3.3.4. Instrumental Variable

In this paper, we construct the instrumental variable based on the undulation of urban terrain. On one hand, since the undulation of the terrain is a natural factor, no matter how the ACEE changes, it cannot affect the undulation of the terrain in the region. On the other hand, the undulation of the terrain is closely related to agricultural development and has an important connection with the national agricultural policy, which is in line with correlation research. When the terrain of a region is less undulating, it will be more suitable for agricultural development and thus may shoulder a heavier agricultural responsibility. For instance, regions like Anhui and Jiangsu, which have less undulating terrain, have been classified as major grain-producing areas and are tasked with ensuring food security. When the region undertakes the task of food security, its agricultural development may pay more attention to the output of agricultural products, and the corresponding levels of green and low-carbon agricultural development may be restricted. On the contrary, the terrain of the region is highly undulating and uneven. It may bear less responsibility for agricultural production and be able to better promote LCDA. Considering that the selection of NAGDPZ requires regions to have a better level of GDA and LCDA, areas with greater terrain undulations, due to less pressure on agricultural production, may have a lower reliance on chemical fertilizers and pesticides, and are more likely to achieve agricultural green development and be selected as pilot zones. For instance, in Zhejiang Province, which has the most undulating terrain in the YRD region, the entire province has been selected as a pilot zone. It can be seen that the undulation of the terrain is closely related to the establishment of NAGDPZ. To this end, based on the urban terrain undulation measured by Feng et al. [78], it is multiplied by the year to construct the panel instrumental variable.

3.3.5. Mediating Variables

Theoretical analysis indicates that the NAGDPZ policy can enhance ACEE by expanding the AOS and improving ALP. Therefore, the AOS and ALP are mediating variables. Referring to existing research [63], the AOS is characterized by the ratio of the total sown area of crops to the number of agricultural laborers (logarithm), which reflects the sown area of crops corresponding to each agricultural labor force. When this indicator is larger, it indicates that a single labor force can use more land for agricultural production. Referring to existing studies [79,80], ALP is characterized by the ratio of agricultural GDP to the number of agricultural labor forces (logarithm), which reflects the economic output generated by a single labor force. The higher this indicator is, the greater the output a single labor force can achieve.

3.4. Data Sources

The main basic data involved in the research come from the “China Urban Statistical Yearbook”, “China Rural Statistical Yearbook”, as well as the provincial statistical yearbooks of Anhui, Jiangsu, and Zhejiang, and the publicly available online information of relevant government departments. For the data on pesticide usage, agricultural film usage, and diesel usage, it cannot be obtained through public channels for Jiangsu Province. Referring to existing research [81], the data of Jiangsu Province was calculated in combination with the “top-down” approach of provincial capital cities. The main approach is to use the proportion of cultivated land as a weight coefficient to convert provincial data into municipal-level data. Data from the Chinese Department of Natural Resources, sharing land survey results on the application service platform, was used. The missing data are supplemented via the interpolation method. Indicators related to agricultural prices are processed using the agricultural production price index. The remaining data involving price changes are processed using the CPI index, with 2013 as the base year. Before conducting quantitative analysis, the data should be standardized to eliminate the influence of unit dimensions.

4. Empirical Analysis and Results

4.1. The Spatiotemporal Evolution Characteristics of ACEE in the YRD

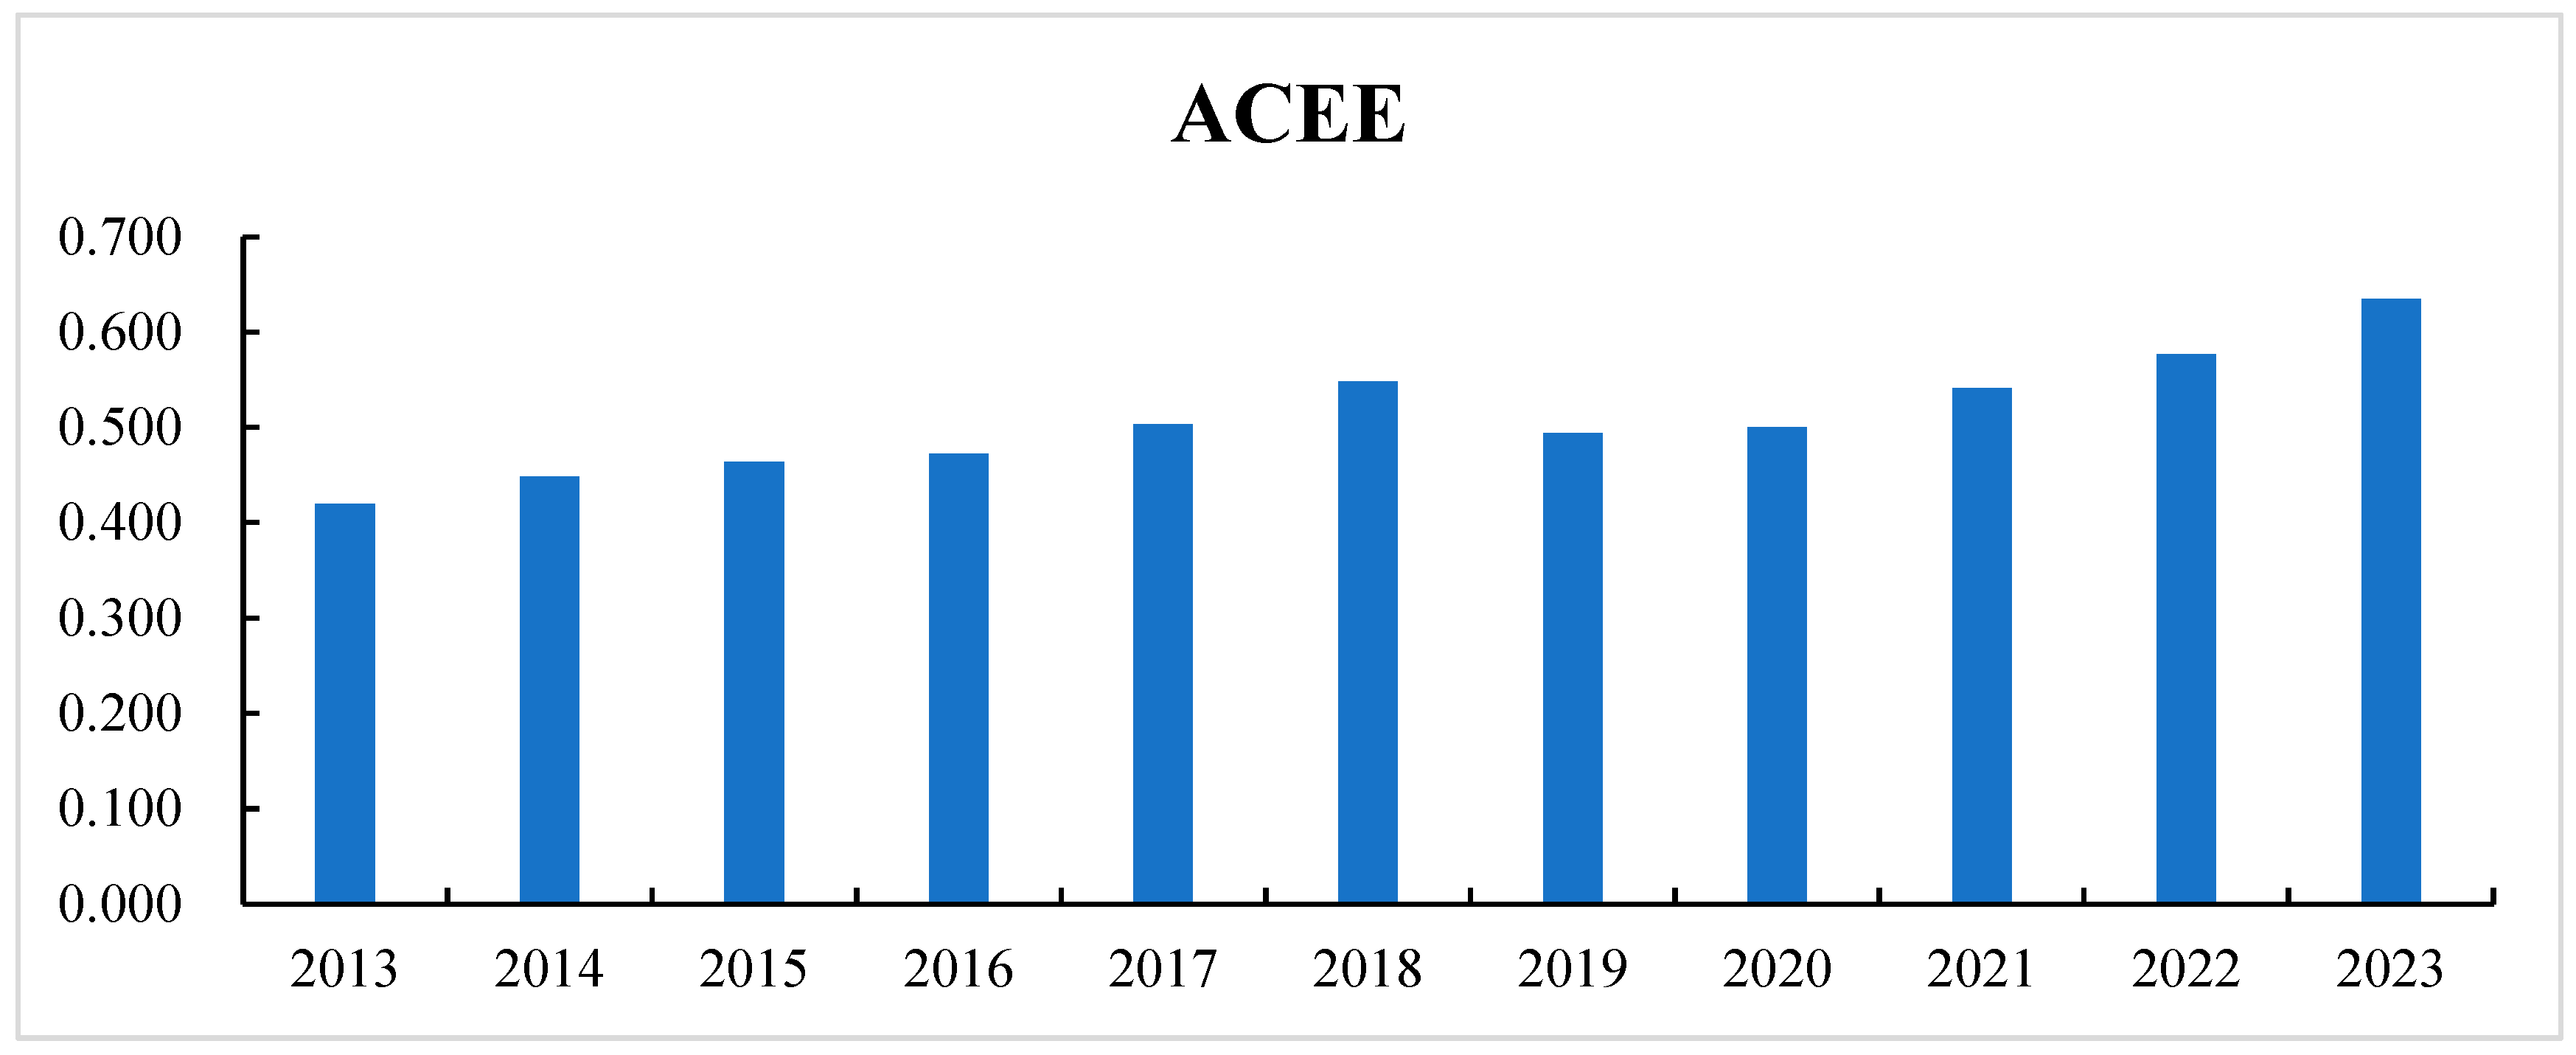
Figure 3 shows the annual average variation in ACEE in the YRD region from 2013 to 2023. It can be seen that the overall ACEE in the YRD region has improved from 2013 to 2023. The average ACEE has risen from 0.420 in 2013 to 0.635 in 2023, an increase of 51.295% (The percentage calculated using the unrounded original data.). This indicates that the overall agricultural production level in the YRD has been improved, and ACEs have decreased.
The average value of ACEE saw a relatively significant improvement from 2015 to 2018. A possible reason for this is that in 2015, China launched a campaign to prevent and control agricultural non-point source pollution, reducing the use of agricultural fertilizers and pesticides and lowering the unintended output of ACEE, thereby achieving an increase in ACEE. The ACEE in 2019 and 2020 declined compared with that in 2018, possibly due to the impact of the COVID-19 pandemic. The steady growth of ACEE from 2021 to 2023 indicates that agricultural development in the YRD region has gradually shaken off the impact of the pandemic.
Figure 4 shows the spatial distribution of the ACEE in the YRD region in the three years of 2013, 2018, and 2023. Generally speaking, the ACEE in Anhui Province is relatively low, while that in the areas surrounding Shanghai is relatively high. The distribution of ACEE is roughly higher in the southeast and lower in the northwest.
A possible reason lies in that Anhui, as a major grain-producing area, needs to ensure grain output and is relatively dependent on agricultural chemicals. Therefore, the green transformation of agriculture is relatively slow. Although Jiangsu is also a major grain-producing area, its economic development is relatively rapid and its technological level is relatively high, which is conducive to improving the LCDA. Shanghai and its surrounding areas are rich in funds and advanced in technology, which can provide effective support for the LCDA. Thus, various agricultural resources can be utilized more efficiently, achieving higher agricultural output value and generating fewer ACEs.

4.2. The Impact Effect of the NAGDPZ Policy on ACEE

4.2.1. Benchmark Regression Analysis

The results of the impact of the NAGDPZ policy on ACEE are shown in Table 2. Collinearity tests were conducted on the models before the analysis. In Table 2, the impact of the NAGDPZ policy on ACEE is significantly positive at the 10% statistical level. When considering the control variables, the coefficient is 0.049, indicating that the NAGDPZ policy can significantly improve ACEE. Hypothesis 1 holds.

4.2.2. Parallel Trend Hypothesis Evaluation

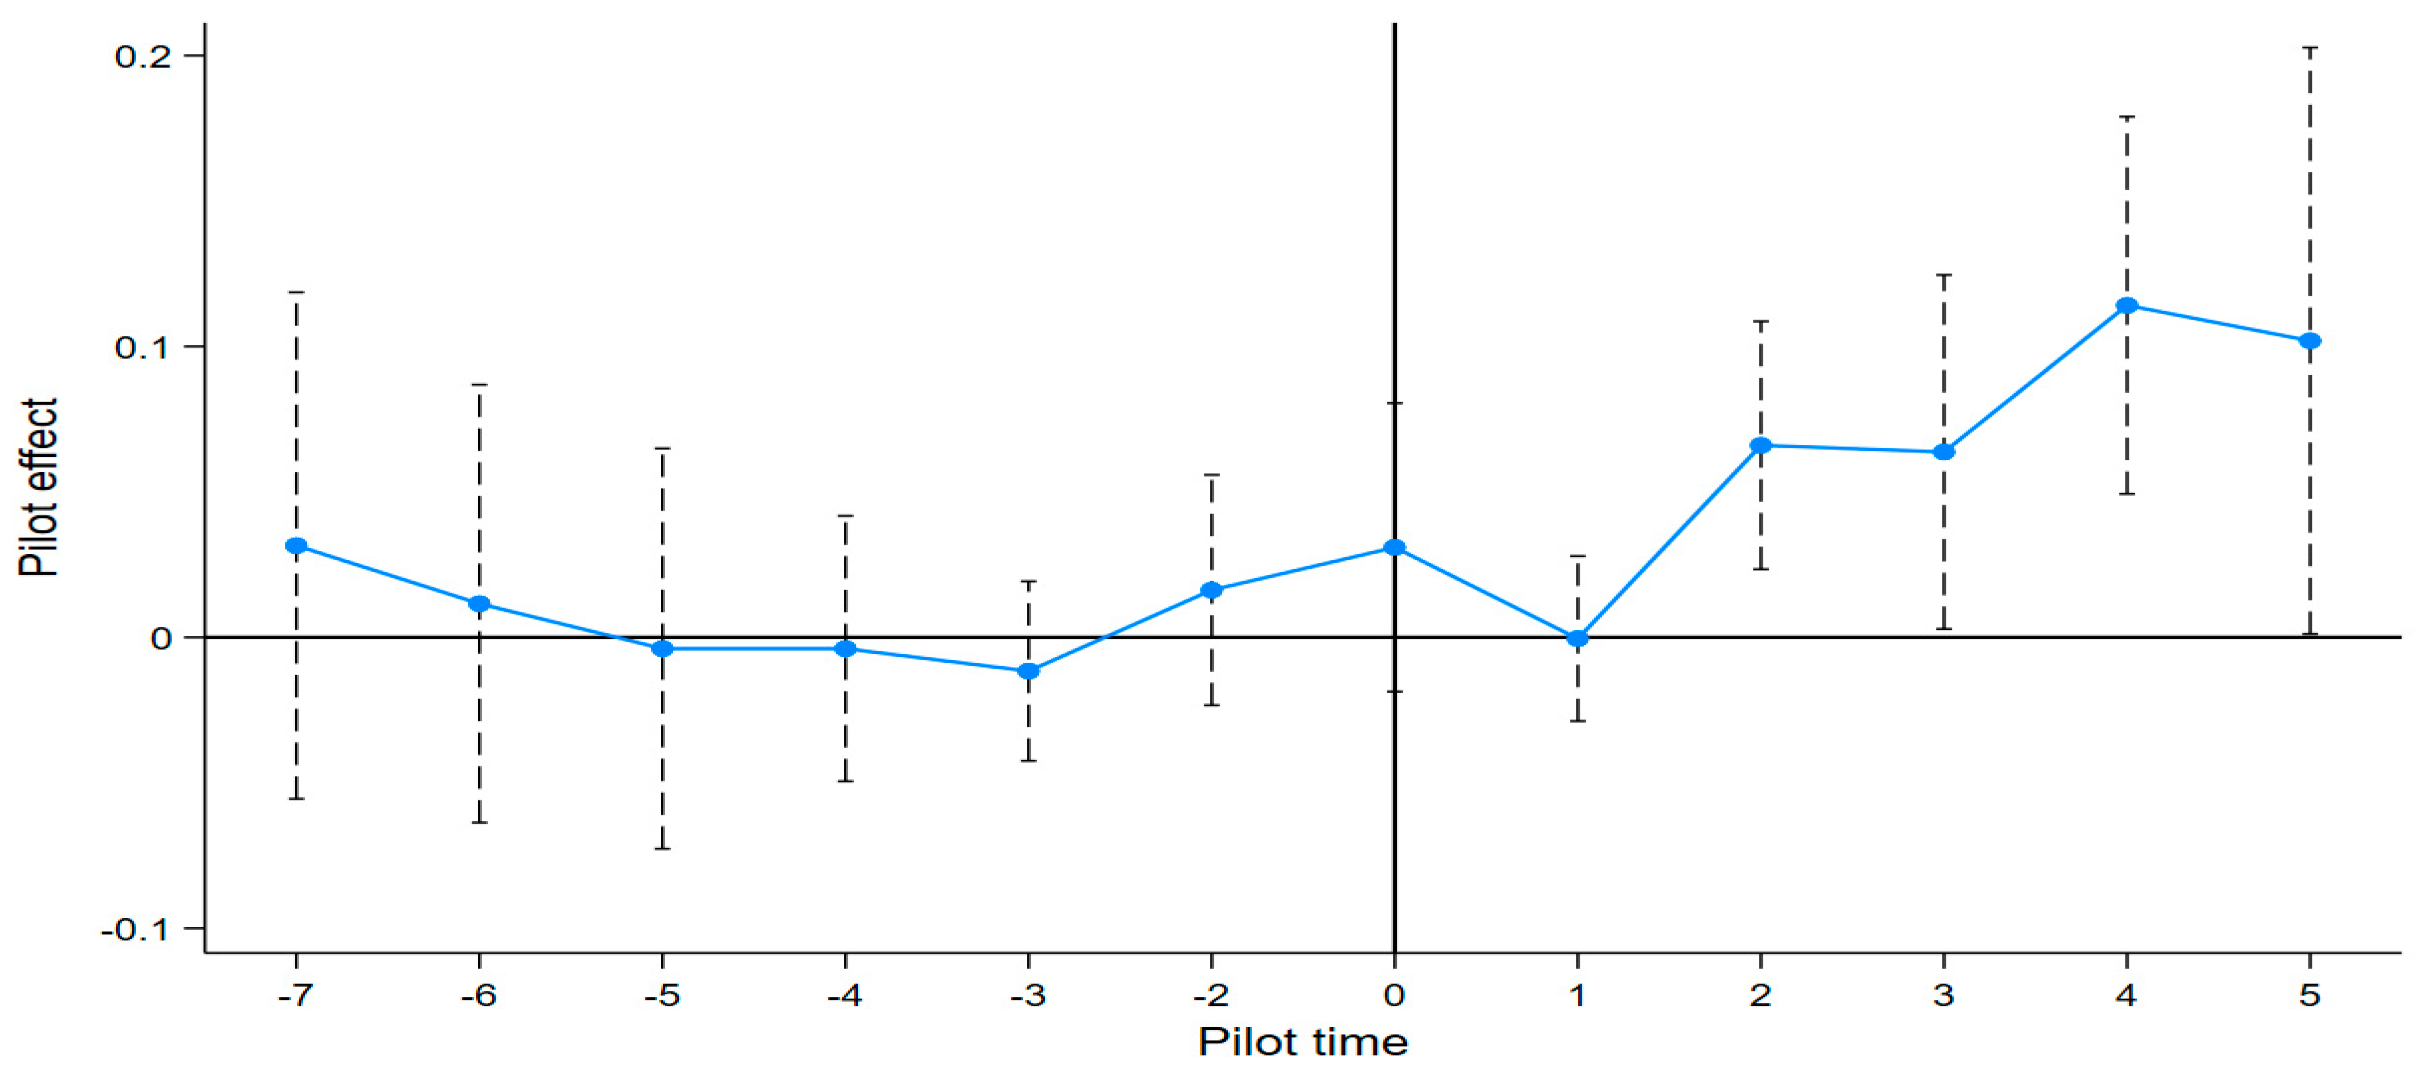
Referring to existing research practices [82,83,84], the parallel trend hypothesis was evaluated for the models. It can be seen from Figure 5 that before the establishment of the NAGDPZ, the effects of each dummy variable on the ACEE were not significant, indicating that the differences between the treatment group and the control group were stable before the policy began. After the NAGDPZ policy was imposed, some results were significantly positive, indicating that the data analysis results are consistent with the parallel trend hypothesis. The confidence interval in the figure is 90%.

4.2.3. Placebo Test

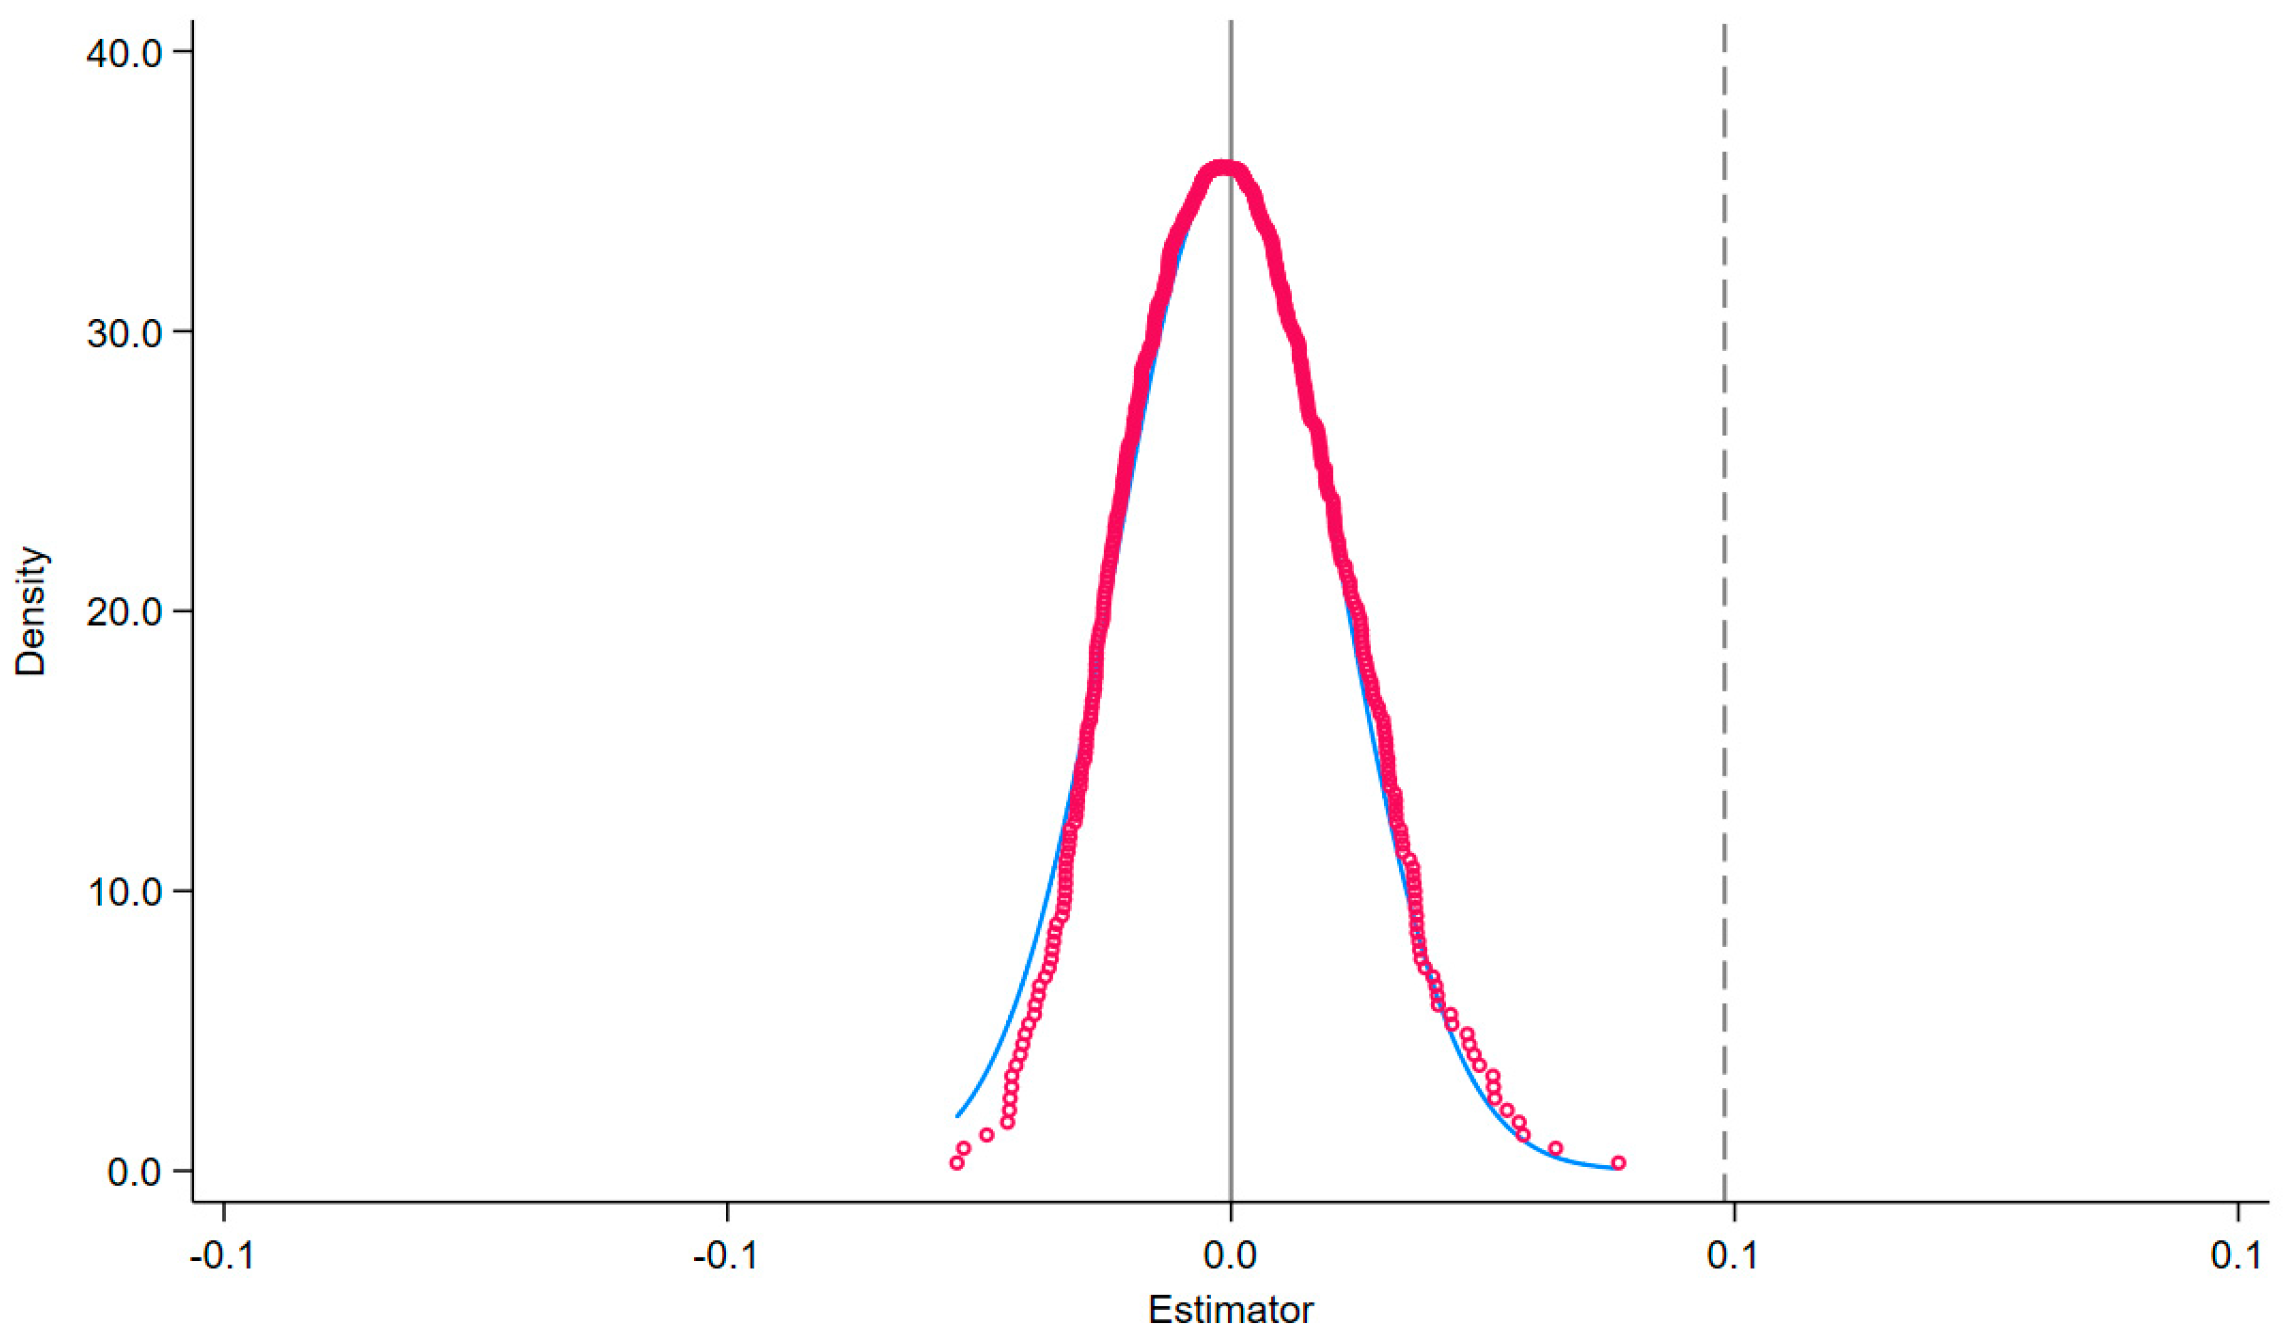
Unobservable factors that act simultaneously with the NAGDPZ policy may affect the estimation results. To this end, referring to existing studies [82,83], this study further conducted a placebo test. This study randomly selected pilot cities, then estimated their impact on ACEE, and conducted 500 simulations of the random process. In Figure 6, the coefficients of all the estimated values are far from the true estimated values represented by the vertical line on the right. This indicates that Hypothesis 1 is robust. The results are shown in Figure 6.

4.2.4. PSM-DID Analysis

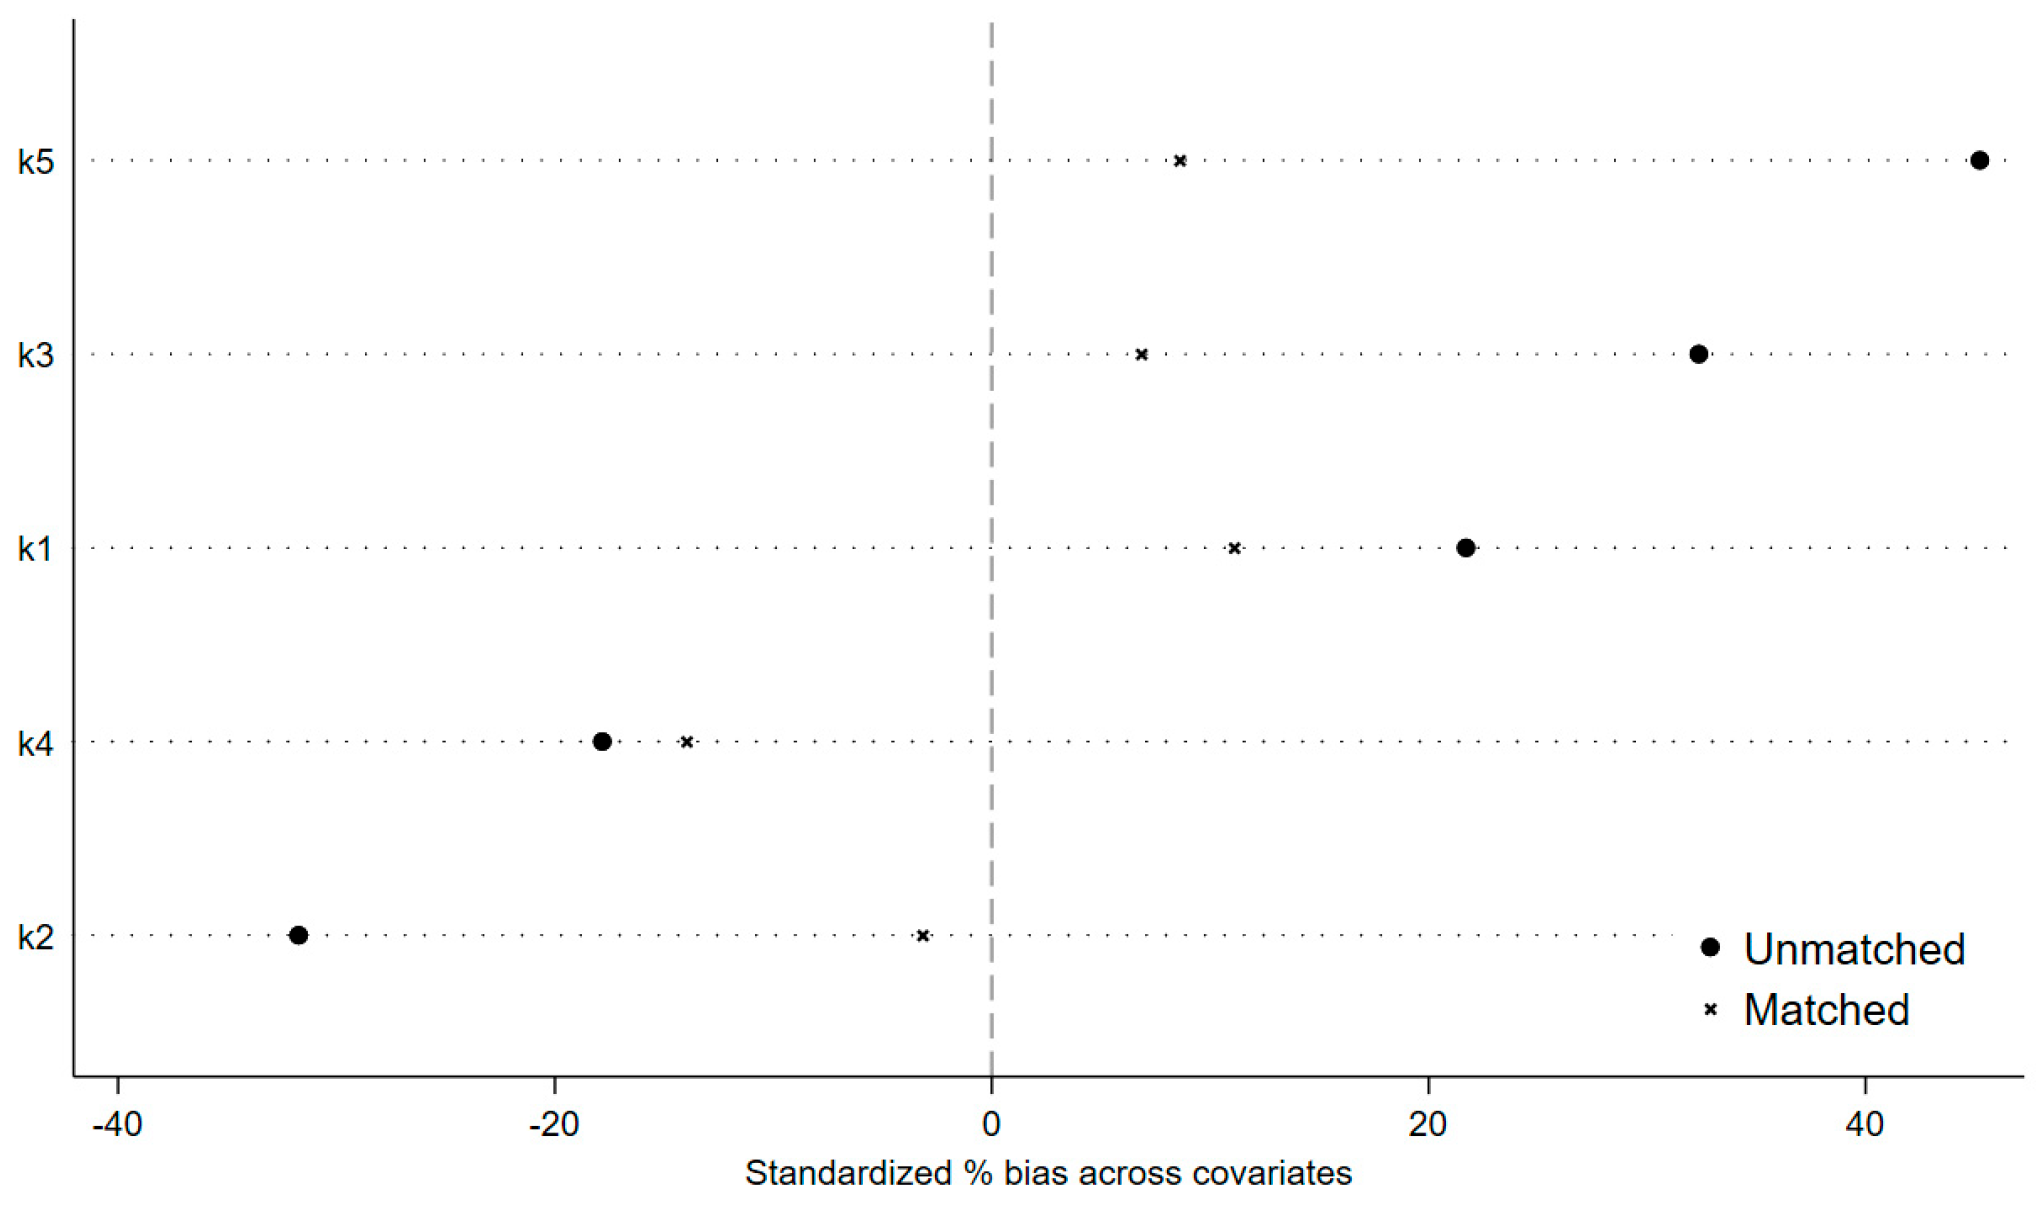
The establishment of the NAGDPZ is not a completely random pilot project, and there may be selection biases in its establishment process. To this end, referring to existing studies [82,85], the PSM-DID model was utilized to solve the problem of selection bias. In this study, the sample cities were matched using the kernel matching method, and all control variables were used as covariates. During the PSM calculation process, the ATT values of the match were significantly positive at the 10% statistical level. After kernel matching, the absolute values of the standard deviations of all covariates were less than 15% (Figure 7).
After matching was completed, the DID method was used for calculation again. In Table 3, after matching, the NAGDPZ policy still has a significant promoting effect on ACEE.

4.2.5. Exclude the Influence of Other Policies

During the research period, beyond the NAGDPZ policy, there are still other environmental governance efforts or policy pilots that may have an impact on ACEE.
For instance, China’s launch of the “Agricultural Non-Point Source Pollution Prevention and Control Campaign” in 2015 and the “Blue Sky Defense Campaign” in 2018, two nationwide environmental pollution control activities, may also affect the ACEE. Furthermore, the core aim of the “Low-carbon City” pilot program is to reduce urban carbon emissions [86,87], which will also affect ACEs and thereby have an impact on the ACEE. In addition, existing research indicates that the “Broadband China” pilot program will also affect carbon emissions [88,89]. To reduce the interference of these concurrent environmental governance works or policy pilots on the impact of the NAGDPZ policy on ACEE, this study further incorporates these governance works and policy pilots as control variables into the analysis system. Among them, the battle against agricultural non-point source pollution and the battle for blue skies are governance works carried out in all regions of the country. Therefore, the “Implementation Opinions on Winning the Battle Against Agricultural Non-point Source Pollution” released on 10 April 2015, and the “Three-Year Action Plan for Winning the Battle for Blue Skies” released on 27 June 2018, are taken as the key points for the release of relevant policy documents. For previous years, the value is set to 0, and for subsequent years, it is set to 1. “Low-carbon City” and “Broadband China” are policy pilot projects. Referring to the setting of policy pilot projects via the difference-in-differences method, if city i is selected for a certain pilot project in year t, then the corresponding policy value for city i in year t and subsequent years is 1; otherwise, it is 0. In Table 4, the NAGDPZ policy still has a significant positive impact on ACEE while controlling for the influence of other environmental governance efforts and policy pilots.

4.2.6. Endogeneity Analysis

The instrumental variable model was utilized to handle endogeneity. In Table 5 that the dummy variable of the NAGDPZ based on instrumental variable fitting still has a significantly positive impact on ACEE, indicating that the results remain robust after the disposal of endogeneity. Meanwhile, this study conducted an underidentification test, weak identification test, and overidentification test, and all the results were passed.

4.2.7. Other Robustness Tests

This paper also conducts the following robustness analysis: (1) The explanatory variables were adjusted. The third batch of the NAGDPZ announced in the second half of 2022 was added to the analysis system. Considering that they were announced in the second half of 2022, 2023 was taken as the year when the policy effects manifested. At the same time, the impact of the three batches of the NAGDPZ on ACEE was analyzed. Results in Table 6 Model (1). (2) Extreme values were excluded. Considering that extreme values might affect the robustness of the analysis, tailing was performed on all continuous variables at the 5% and 95% quantiles. Then, the calculation was carried out again using the DID method according to the settings of Equation (2), and results in Model (2). (3) The research area was adjusted. Considering that Shanghai is a municipality directly under the central government and has significant differences from other cities in the YRD, Shanghai was removed from the research area and the DID method was used again for calculation. Results in Table 6 Model (3). (4) The research period was adjusted to 2014–2023. The DID method was used again for calculation. Results in Table 6 Model (4). In Table 6, the NAGDPZ policy has a significantly positive impact on ACEE, once again demonstrating the robustness of this result.

4.3. Analysis of the Impact Mechanism of the NAGDPZ Policy on ACEE

In Table 7, models (1) and (2) present the analysis results of the impact of the NAGDPZ policy on the AOS and ALP.
As can be seen from model (1) in Table 7, the NAGDPZ policy has a significant positive impact on the AOS at the statistical level of 5%, with a coefficient of 0.052, indicating that the establishment of the NAGDPZ has significantly expanded the AOS. As theoretical analysis points out, the expansion of the AOS is conducive to optimizing the allocation of production factors, promoting the application of low-carbon technologies and improving pollution supervision, thereby enhancing agricultural economic output and reducing ACE, and achieving an improvement in ACEE. Therefore, the NAGDPZ policy can expand the AOS and thereby enhance the ACEE. Hypothesis 2 holds true. Existing research [62,63,64] also indicates that the expansion of the AOS can reduce ACEs.
As can be seen from model (2) in Table 7, the NAGDPZ policy has a significant positive impact on ALP at the statistical level of 1%, with a coefficient of 0.061, indicating that the establishment of the NAGDPZ has significantly improved ALP. According to theoretical analysis, under the improvement in ALP, agricultural workers can better coordinate and utilize various agricultural production factors, thereby enhancing the utilization efficiency of each factor and achieving a higher expected output. At the same time, they can also better apply low-carbon technologies and equipment to reduce ACEs. This is conducive to promoting the overall low-carbon development of the agricultural industrial chain. From this, it can be said that the NAGDPZ policy can promote the improvement in regional ALP and thereby enhance the ACEE. Hypothesis 3 holds true.

5. Discussion

Research on the factors influencing the ACEE is a well-established topic, but few scholars have explored the impact of the NAGDPZ policy on ACEE. This study aimed to fill this gap, identifying the positive role of the NAGDPZ policy on ACEE and exploring its mechanism of action. This study is an expansion on current academic research.
The YRD region is an important area for agricultural development in China and is confronted with severe agricultural ecological and environmental problems [43,44]. The establishment of the NAGDPZ has effectively enhanced the ACEE in this region, promoted the green growth of agriculture, and achieved positive results. This is similar to the positive effects of the NAGDPZ policy demonstrated by Gao et al. [7], Yao et al. [36], and Li et al. [37] on agricultural environmental protection input, AGTFP, and AEE. Of course, this study has certain differences from these studies in terms of research topics, research areas, and influencing mechanisms. However, it is precisely the existence of such differences that enables this study, together with the above-mentioned studies, to jointly demonstrate the positive effect of the NAGDPZ policy on the agricultural ecological environment, providing realistic evidence for the in-depth implementation of this policy pilot.
The positive effect of the NAGDPZ on ACEE indicates that the implementation of agricultural sustainable development policies or corresponding pilot projects has positive significance for the LCDA. Other regions in China and other developing countries around the world can draw on this practice, accelerate the implementation of green agricultural development policies, and carry out various regional pilot projects conducive to agricultural pollution control so as to accelerate the sustainable development of agriculture. However, it should be recognized that the implementation of the NAGDPZ policy relies on sufficient financial support. Whether it is the innovation and application of agricultural low-carbon technologies, the use of green agricultural machinery, or the education and training of farmers, all require financial support. However, some regions in China may lack sufficient financial funds to facilitate the efficient implementation of this policy. This requires these regions to obtain the support of the central government of China and economically developed regions, and at the same time accelerate social financing. Furthermore, some developing countries elsewhere in the world are even more lacking in funds. Their agricultural foundation and level of LCDA in the early stage may also be relatively poor. How to obtain sufficient funds to carry out pilot projects for green agricultural development is an important issue restricting the GDA and LCDA of some developing countries.

6. Conclusions and Policy Recommendations

6.1. Conclusions

The establishment of the NAGDPZ has an impact on ACEE. However, there are few existing studies analyzing this topic, and thus they cannot fully demonstrate the positive role of the NAGDPZ policy. This study conducted a systematic analysis of the policy’s impact on ACEE and found the following:
(1) The overall ACEE in the YRD region has improved, and the spatial distribution is higher in the southeast and lower in the northwest. The average ACEE in the YRD region has increased from 0.420 in 2013 to 0.635 in 2023, an increase of 51.295%. In terms of spatial distribution, the ACEE in the northeastern part of Anhui Province is relatively low, while that in the areas surrounding Shanghai is relatively high.
(2) The NAGDPZ policy can significantly enhance ACEE. The impact of the NAGDPZ policy on ACEE is significantly positive at the statistical level of 10%, with a coefficient of 0.049. This positive influence effect still holds after many robustness tests such as the parallel trend test, placebo test, PSM-DID analysis, and exclusion of the influence of other policies.
(3) The NAGDPZ policy enhances ACEE by expanding the AOS and improving ALP. The NAGDPZ policy has a significant positive impact on the AOS and ALP, with coefficients of 0.052 and 0.061, respectively. The improvement in the AOS and ALP is conducive to enhancing ACEE.

6.2. Policy Recommendations

(1) The NAGDPZ policy can significantly enhance the ACEE. Therefore, it is suggested that one expands the scope of the NAGDPZ and includes more regions in the construction of the pilot zone. The YRD region should actively represent the experience of creating an NAGDPZ and drive the low-carbon transformation of agriculture in the Yangtze River Economic Belt and other regions, ultimately enhancing ACEE.
(2) The NAGDPZ policy enhances ACEE by expanding the AOS. To this end, it is suggested that one accelerates the confirmation and certification of land rights, improves the rural land leasing market, and promotes the transfer of agricultural land to provide land support for moderate-scale agricultural operations; in addition, we suggest promoting the popularization of low-carbon agricultural technologies and green mechanical equipment that match the level of moderate-scale operation so as to enhance agricultural output under the background of moderate-scale operation and to reduce ACEs.
(3) The NAGDPZ policy enhances ACEE by improving ALP. To this end, it is suggested that one continues to strengthen the training and education of farmers through online teaching, sending experts to rural areas and using other means, to further improve ALP; in addition, we suggest building an external talent pool and making full use of local talents working outside to provide guidance for the construction of the NAGDPZ, enriching human capital.
Of course, due to the limitations of this study, there are still some deficiencies that need to be improved further: (1) This study only conducted research on the YRD region, while the NAGDPZ policy has been implemented nationwide, and its impact on the ACEE in other regions still needs to be analyzed. This represents a future research direction. (2) This study only explored the mechanisms of AOS expansion and ALP improvement in the NAGDPZ policy’s impact on the ACEE. Other influencing mechanisms have not yet been analyzed and need to be addressed in the future.
Author Contributions

Conceptualization, S.L. and H.L.; methodology, H.L.; software, S.L.; validation, S.L., H.L. and J.S.; formal analysis, S.L.; investigation, S.L.; data curation, S.L. and H.L.; writing—original draft preparation, S.L., H.L. and J.S. All authors have read and agreed to the published version of the manuscript.

Funding

This research was funded by National Social Science Foundation of China Later-stage Funding Project, grant number 20FGLB059.

Data Availability Statement

Dataset is available upon request from the authors.

Conflicts of Interest

The authors declare no conflicts of interest.

Abbreviations

The following abbreviations are used in this manuscript:
ACEEAgricultural carbon emission efficiency
NAGDPZNational agricultural green development pilot zone
GDAGreen development of agriculture
YRDYangtze River Delta
ACEsAgricultural carbon emissions
PSMPropensity score method
DIDDifferences-in-differences
AOSAgricultural operation scale
ALPAgricultural labor productivity
DEAData envelopment analysis
N-S-SBMNon-expected output super slacks-based measure
AGTFPGreen total factor productivity of agriculture
AEEAgricultural ecological efficiency
LCDALow-carbon development of agriculture
DMUs Decision units
K1Urbanization
K2Regional industrial structure
K3Level of agricultural mechanization
K4Government participation level
K5Level of digital development

References

  1. Rosenzweig, C.; Mbow, C.; Barioni, L.G.; Benton, T.G.; Herrero, M.; Krishnapillai, M.; Liwenga, E.T.; Pradhan, P.; Rivera-Ferre, M.G.; Sapkota, T.; et al. Climate change responses benefit from a global food system approach. Nat. Food 2020, 1, 94–97. [Google Scholar] [CrossRef] [PubMed]
  2. Zhao, R.; Liu, Y.; Tian, M.; Ding, M.; Cao, L.; Zhang, Z.; Chuai, X.; Xiao, L.; Yao, L. Impacts of water and land resources exploitation on agricultural carbon emissions: The water-land-energy-carbon nexus. Land Use Policy 2018, 72, 480–492. [Google Scholar] [CrossRef]
  3. Chen, Y.; Li, M.; Su, K.; Li, X. Spatial-Temporal Characteristics of the Driving Factors of Agricultural Carbon Emissions: Empirical Evidence from Fujian, China. Energies 2019, 12, 3102. [Google Scholar] [CrossRef]
  4. Li, J.; Gao, M.; Luo, E.; Wang, J.; Zhang, X. Does rural energy poverty alleviation really reduce agricultural carbon emissions? The case of China. Energy Econ. 2023, 119, 106576. [Google Scholar] [CrossRef]
  5. Liu, M.; Yang, L. Spatial pattern of China’s agricultural carbon emission performance. Ecol. Indic. 2021, 133, 108345. [Google Scholar] [CrossRef]
  6. Liu, H.; Gao, Q.; Pang, S.; Li, J.; Li, Q. Marginal potential for agricultural R&D innovation to improve agricultural carbon efficiency declines under low-carbon constraints. Sustain. Futures 2025, 9, 100549. [Google Scholar] [CrossRef]
  7. Gao, Q.; Chen, H.; Zhao, M.; Zeng, M. Research on the Impact and Spillover Effect of Green Agricultural Reform Policy Pilot on Governmental Environmental Protection Behaviors Based on Quasi-Natural Experiments of China’s Two Provinces from 2012 to 2020. Sustainability 2023, 15, 2665. [Google Scholar] [CrossRef]
  8. Sun, C.; Xia, E.; Huang, J.; Tong, H. Coupling and coordination of food security and agricultural carbon emission efficiency: Changing trends, influencing factors, and different government priority scenarios. J. Environ. Manag. 2024, 370, 122533. [Google Scholar] [CrossRef]
  9. Jin, S.; Chen, Z.; Bao, B.; Zhang, X. Study on the influence of digital financial inclusion on agricultural carbon emission efficiency in the Yangtze River Economic Belt. Int. J. Low-Carbon Technol. 2023, 18, 968–979. [Google Scholar] [CrossRef]
  10. Liao, X.; Qin, S.; Wang, Y.; Zhu, H.; Qi, X. Effects of Land Transfer on Agricultural Carbon Productivity and Its Regional Differentiation in China. Land 2023, 12, 1358. [Google Scholar] [CrossRef]
  11. Xiao, P.; Xu, J.; Yu, Z.; Qian, P.; Lu, M.; Ma, C. Spatiotemporal Pattern Differentiation and Influencing Factors of Cultivated Land Use Efficiency in Hubei Province under Carbon Emission Constraints. Sustainability 2022, 14, 7042. [Google Scholar] [CrossRef]
  12. Shu, Q.; Su, Y.; Li, H.; Li, F.; Zhao, Y.; Du, C. Study on the Spatial Structure and Drivers of Agricultural Carbon Emission Efficiency in Belt and Road Initiative Countries. Sustainability 2023, 15, 10720. [Google Scholar] [CrossRef]
  13. Wang, W.; Yin, X.; Wang, C.; Zhuo, M. Urban expansion and agricultural carbon emission efficiency: The moderating role of land property rights stability. J. Clean. Prod. 2025, 486, 144488. [Google Scholar] [CrossRef]
  14. Qing, Y.; Zhao, B.; Wen, C. The Coupling and Coordination of Agricultural Carbon Emissions Efficiency and Economic Growth in the Yellow River Basin, China. Sustainability 2023, 15, 971. [Google Scholar] [CrossRef]
  15. Zhang, C.; Su, Y.; Yang, G.; Chen, D.; Yang, R. Spatial-Temporal Characteristics of Cultivated Land Use Efficiency in Major Function-Oriented Zones: A Case Study of Zhejiang Province, China. Land 2020, 9, 114. [Google Scholar] [CrossRef]
  16. Wang, X.; Liu, Y. Enhancing Agricultural Ecological Efficiency in China: An Evolution and Pathways under the Carbon Neutrality Vision. Land 2024, 13, 187. [Google Scholar] [CrossRef]
  17. Hu, Y.; Liu, X.; Zhang, Z.; Wang, S.; Zhou, H. Spatiotemporal Heterogeneity of Agricultural Land Eco-Efficiency: A Case Study of 128 Cities in the Yangtze River Basin. Water 2022, 14, 422. [Google Scholar] [CrossRef]
  18. Wang, R.; Feng, Y. Research on China’s agricultural carbon emission efficiency evaluation and regional differentiation based on DEA and Theil models. Int. J. Environ. Sci. Technol. 2021, 18, 1453–1464. [Google Scholar] [CrossRef]
  19. Jingjie, L.; Shanwei, L.; Qian, L.; Junli, D. Agricultural carbon emission efficiency evaluation and influencing factors in Zhejiang province, China. Front. Environ. Sci. 2022, 10, 1005251. [Google Scholar] [CrossRef]
  20. Weini, C.; Dejun, H.; Yu, Z.; Bo, C. The Impact of Rural Population Decline on the Economic Efficiency of Agricultural Carbon Emissions: A Case Study of the Contiguous Karst Areas in Yunnan–Guizhou Provinces, China. Agriculture 2025, 15, 1081. [Google Scholar] [CrossRef]
  21. Analysis of the interactive effects of new urbanization and agricultural carbon emission efficiency. Glob. NEST J. 2024, 26, 1–9. [CrossRef]
  22. Huiqiang, X.I.E.; Xiaodi, W.U. Impact and its mechanism of urban-rural integration on the efficiency of agricultural carbon emissions in China. Resour. Sci. 2023, 45, 48–61. [Google Scholar] [CrossRef]
  23. Muhammad, I.; Noor, F.; Sabahat, S. Impact of Grain Subsidy Policy on Agricultural Ecological Efficiency: Evidence from Pakistan. Glob. Econ. Rev. 2024, IX, 59–73. [Google Scholar] [CrossRef]
  24. Peng, W.; Hu, Z.; Li, J.; Li, C. Urban Agglomeration Technology Innovation Networks, Spatial Spillover, and Agricultural Ecological Efficiency: Evidence from the Urban Agglomeration in the Middle Reaches of the Yangtze River in China. Sustainability 2025, 17, 5109. [Google Scholar] [CrossRef]
  25. Zhu, S.; Li, Y.; Liu, J.; Huang, J.; Maneejuk, P. A Non-Linear Exploration of the Digital Economy’s Impact on Agricultural Carbon Emission Efficiency in China. Agriculture 2024, 14, 2245. [Google Scholar] [CrossRef]
  26. Zhang, Y.; Zhu, J.; Wang, K.; Zhang, J. Are Governmental Policies an Effective Way to Reduce Agricultural Carbon Emissions? An Empirical Study of Shandong in Main Grain Producing Areas of China. Agriculture 2024, 14, 1940. [Google Scholar] [CrossRef]
  27. Song, S.; Zhao, S.; Zhang, Y.; Ma, Y. Carbon Emissions from Agricultural Inputs in China over the Past Three Decades. Agriculture 2023, 13, 919. [Google Scholar] [CrossRef]
  28. Dong, Y.; Gu, L. Can Policy-Based Agricultural Insurance Promote Agricultural Carbon Emission Reduction? Causal Inference Based on Double Machine Learning. Sustainability 2025, 17, 4086. [Google Scholar] [CrossRef]
  29. Wang, Y.; Zhang, L.; Yan, J.; Liu, J.; Zhong, M.; Cheng, S. How the “Village Merger and Resettlement” Policy Reshapes Agricultural Carbon Emissions: An Analysis of Effects and Mechanisms from Chinese Rural Practices. Agriculture 2025, 15, 451. [Google Scholar] [CrossRef]
  30. Zhang, Z.; Jiang, S.; Shen, B.; Mei, Y.Y.; Zhang, X.R. The carbon emission reduction effect of smart agricultural policy—Evidence from China. Front. Sustain. Food Syst. 2024, 8, 1–14. [Google Scholar] [CrossRef]
  31. Wang, S.; Zeng, B.; Feng, Y.; Cao, F. How Does Agricultural Land Lease Policy Affect Agricultural Carbon Emission? Evidence of Carbon Reduction Through Decreasing Transaction Costs in the Context of Heterogeneous Efficiency. Land 2024, 13, 2192. [Google Scholar] [CrossRef]
  32. Ren, J.; Chen, X.; Miao, Z.; Gao, T. How Does High-Standard Farmland Construction Affect Agroecological Efficiency—From the Perspective of Factor Endowment. Land 2024, 13, 1673. [Google Scholar] [CrossRef]
  33. Sun, W.; Shen, J. The impact of low-carbon city pilot on carbon emissions of high-polluting enterprises − Based on financing constraint perspective. Energy Rep. 2024, 12, 762–774. [Google Scholar] [CrossRef]
  34. Hou, X.; Hu, Q.; Liang, X.; Xu, J. How Do Low-Carbon City Pilots Affect Carbon Emissions? Staggered Difference in Difference Evidence from Chinese Firms. Econ. Anal. Policy 2023, 79, 664–686. [Google Scholar] [CrossRef]
  35. Zhang, Y.; Wang, Y.; Su, C.; Guo, J.; Xu, C. Assessing the impact of China’s National Big Data Comprehensive Pilot Zone policy on agricultural carbon emissions. Agric. Econ. 2025, 71, 242–253. [Google Scholar] [CrossRef]
  36. Yao, L.; Si, W.; Si, R. Evaluating the Effects of the ‘Pilot Zone’ Policy on China’s Agricultural Green Development. Sustainability 2024, 16, 5149. [Google Scholar] [CrossRef]
  37. Li, S.; Shangguan, L. Has the Policy of National Agricultural Green Development Pilot Zones Enhanced the Agricultural Eco-Efficiency? Observation Based on the County-Level Data from Hubei Province of China. Sustainability 2024, 16, 9265. [Google Scholar] [CrossRef]
  38. Jin, Y.; Xu, Y. Carbon reduction of urban form strategies: Regional heterogeneity in Yangtze River Delta, China. Land Use Policy 2024, 141, 107154. [Google Scholar] [CrossRef]
  39. Yin, C.; Chen, R.; Xiao, X.; Qin, Y.; Meng, F.; Yao, Y.; Pan, L.; Zheng, L. Spatio-temporal evolution of vertical urban growth in China’s Yangtze River Delta from 1990 to 2020. Land Use Policy 2025, 153, 107542. [Google Scholar] [CrossRef]
  40. Wang, J.; Chen, Y.; Liu, Z.; Liu, X.; Li, X. An in-depth multiscale analysis of farmland abandonment and recultivation dynamics in the Yangtze River Delta, China: A landscape ecology perspective empowered by google earth engine. Environ. Sustain. Indic. 2024, 24, 100541. [Google Scholar] [CrossRef]
  41. Wang, Y.; Gu, X.; Yu, H. Spatiotemporal Variation in the Yangtze River Delta Urban Agglomeration from 1980 to 2020 and Future Trends in Ecosystem Services. Land 2023, 12, 929. [Google Scholar] [CrossRef]
  42. Li, L.; An, J.Y.; Zhou, M.; Yan, R.S.; Huang, C.; Lu, Q.; Lin, L.; Wang, Y.J.; Tao, S.K.; Qiao, L.P.; et al. Source apportionment of fine particles and its chemical components over the Yangtze River Delta, China during a heavy haze pollution episode. Atmos. Environ. 2015, 123, 415–429. [Google Scholar] [CrossRef]
  43. Wang, H.; Liu, C.; Xiong, L.; Wang, F. The spatial spillover effect and impact paths of agricultural industry agglomeration on agricultural non-point source pollution: A case study in Yangtze River Delta, China. J. Clean. Prod. 2023, 401, 136600. [Google Scholar] [CrossRef]
  44. Ruxue, Y.; Caiyao, X.; Fanbin, K. Decoupling agriculture pollution and carbon reduction from economic growth in the Yangtze River Delta, China. PLoS ONE 2023, 18, e0280268. [Google Scholar] [CrossRef]
  45. Wang, F.; Wang, H.; Liu, C.; Xiong, L.; Kong, F. Does economic agglomeration improve agricultural green total factor productivity? Evidence from China’s Yangtze river delta. Sci. Prog. 2022, 105, 003685042211354. [Google Scholar] [CrossRef]
  46. Hong, Q.; Cui, L.; Hong, P. The impact of carbon emissions trading on energy efficiency: Evidence from quasi-experiment in China’s carbon emissions trading pilot. Energy Econ. 2022, 110, 106025. [Google Scholar] [CrossRef]
  47. Lin, X.; Cui, W.; Wang, D. The heterogeneous effects of environmental regulation on industrial carbon emission efficiency in China using a panel quantile regression. Environ. Sci. Pollut. Res. 2023, 30, 55255–55277. [Google Scholar] [CrossRef] [PubMed]
  48. Fan, B.; Li, M. The Effect of Heterogeneous Environmental Regulations on Carbon Emission Efficiency of the Grain Production Industry: Evidence from China’s Inter-Provincial Panel Data. Sustainability 2022, 14, 14492. [Google Scholar] [CrossRef]
  49. Guo, Z.; Zhang, X. Has the healthy city pilot policy improved urban air quality in China? Evidence from a quasi-natural experiment. Energy Econ. 2024, 129, 107260. [Google Scholar] [CrossRef]
  50. Wang, B.; Zhang, Y.; Feng, S. Impact of the low-carbon city pilot project on China’s land transfers in high energy-consuming industries. J. Clean. Prod. 2022, 363, 132491. [Google Scholar] [CrossRef]
  51. Shan, S.; Genç, S.Y.; Kamran, H.W.; Dinca, G. Role of green technology innovation and renewable energy in carbon neutrality: A sustainable investigation from Turkey. J. Environ. Manag. 2021, 294, 113004. [Google Scholar] [CrossRef] [PubMed]
  52. Chang, K.; Liu, L.; Luo, D.; Xing, K. The impact of green technology innovation on carbon dioxide emissions: The role of local environmental regulations. J. Environ. Manag. 2023, 340, 117990. [Google Scholar] [CrossRef] [PubMed]
  53. Chen, H.; Yi, J.; Chen, A.; Peng, D.; Yang, J. Green technology innovation and CO2 emission in China: Evidence from a spatial-temporal analysis and a nonlinear spatial durbin model. Energy Policy 2023, 172, 113338. [Google Scholar] [CrossRef]
  54. Shi, M.; Paudel, K.P.; Chen, F.-b. Mechanization and efficiency in rice production in China. J. Integr. Agric. 2021, 20, 1996–2008. [Google Scholar] [CrossRef]
  55. Chi, Y.; Zhou, W.; Wang, Z.; Hu, Y.; Han, X. The Influence Paths of Agricultural Mechanization on Green Agricultural Development. Sustainability 2021, 13, 12984. [Google Scholar] [CrossRef]
  56. Yang, H.; Wang, X.; Bin, P. Agriculture carbon-emission reduction and changing factors behind agricultural eco-efficiency growth in China. J. Clean. Prod. 2022, 334, 130193. [Google Scholar] [CrossRef]
  57. Liu, H.; Wen, S.; Wang, Z. Agricultural Production Agglomeration and Total Factor Carbon Productivity: Based on NDDF-MML Index Analysis. China Agric. Econ. Rev. 2022, 14, 709–740. [Google Scholar] [CrossRef]
  58. Mthombeni, D.L.; Antwi, M.A.; Oduniyi, O.S. Factors influencing access to agro-processing training for small-scale crop farmers in Gauteng province of South Africa. Agric. Food Secur. 2022, 11, 31. [Google Scholar] [CrossRef]
  59. Kansanga, M.M.; Bezner Kerr, R.; Lupafya, E.; Dakishoni, L.; Luginaah, I. Does participatory farmer-to-farmer training improve the adoption of sustainable land management practices? Land Use Policy 2021, 108, 105477. [Google Scholar] [CrossRef]
  60. Luo, L.; Qiao, D.; Tang, J.; Wan, A.; Qiu, L.; Liu, X.; Liu, Y.; Fu, X. Training of Farmers’ Cooperatives, Value Perception and Members’ Willingness of Green Production. Agriculture 2022, 12, 1145. [Google Scholar] [CrossRef]
  61. Liu, Y.; Shi, R.; Peng, Y.; Wang, W.; Fu, X. Impacts of Technology Training Provided by Agricultural Cooperatives on Farmers’ Adoption of Biopesticides in China. Agriculture 2022, 12, 316. [Google Scholar] [CrossRef]
  62. Bai, J.; Liu, J.; Ma, L.; Zhang, W. The Impact of Farmland Management Scale on Carbon Emissions. Land 2023, 12, 1760. [Google Scholar] [CrossRef]
  63. Guan, N.; Lingyun, L.; Kai, D.; Meng, X.; Du, Y. Agricultural mechanization, large-scale operation and agricultural carbon emissions. Cogent Food Agric. 2023, 9, 2238430. [Google Scholar] [CrossRef]
  64. Zhu, Y.; Waqas, M.A.; Li, Y.e.; Zou, X.; Jiang, D.; Wilkes, A.; Qin, X.; Gao, Q.; Wan, Y.; Hasbagan, G. Large-scale farming operations are win-win for grain production, soil carbon storage and mitigation of greenhouse gases. J. Clean. Prod. 2018, 172, 2143–2152. [Google Scholar] [CrossRef]
  65. Baležentis, T.; Li, T.; Chen, X. Has agricultural labor restructuring improved agricultural labor productivity in China? A decomposition approach. Socio-Econ. Plan. Sci. 2021, 76, 100967. [Google Scholar] [CrossRef]
  66. Bai, J.; Chen, H.; Gu, X.; Ji, Y.; Zhu, X. Temporal and spatial characteristics of carbon emissions from cultivated land use and their influencing factors: A case study of the Yangtze River Delta region. Int. Rev. Econ. Financ. 2024, 96, 103501. [Google Scholar] [CrossRef]
  67. Song, H.; Jiang, H.; Zhang, S.; Luan, J. Land Circulation, Scale Operation, and Agricultural Carbon Reduction Efficiency: Evidence from China. Discret. Dyn. Nat. Soc. 2021, 2021, 9288895. [Google Scholar] [CrossRef]
  68. Chen, Y.; Liu, L. Improving eco-efficiency in coal mining area for sustainability development: An emergy and super-efficiency SBM-DEA with undesirable output. J. Clean. Prod. 2022, 339, 130701. [Google Scholar] [CrossRef]
  69. Chang, M.; Li, X.; Li, F.; Zhao, H. Impact of Farmers’ Livelihoods on Agricultural Carbon Emission Efficiency Under the Background of Population Urbanization: Evidence from China. Agriculture 2024, 14, 2343. [Google Scholar] [CrossRef]
  70. Du, Y.; Liu, H.; Huang, H.; Li, X. The carbon emission reduction effect of agricultural policy—Evidence from China. J. Clean. Prod. 2023, 406, 137005. [Google Scholar] [CrossRef]
  71. Qianru, C.; Hualin, X. Temporal-Spatial Differentiation and Optimization Analysis of Cultivated Land Green Utilization Efficiency in China. Land 2019, 8, 158. [Google Scholar] [CrossRef]
  72. Ji, M.; Li, J.; Zhang, M. What drives the agricultural carbon emissions for low-carbon transition? Evidence from China. Environ. Impact Assess. Rev. 2024, 105, 107440. [Google Scholar] [CrossRef]
  73. Chen, M.; Xiao, H.; Zhao, H.; Liu, L. The power of attention: Government climate-risk attention and agricultural-land carbon emissions. Environ. Res. 2024, 251, 118661. [Google Scholar] [CrossRef] [PubMed]
  74. Rattan, L.; Anjali, D. Carbon Footprint and Sustainability of Agricultural Production Systems in Punjab, India, and Ohio, USA. J. Crop Improv. 2009, 23, 332–350. [Google Scholar] [CrossRef]
  75. Bai, Y.; Deng, X.; Jiang, S.; Zhao, Z.; Miao, Y. Relationship between climate change and low-carbon agricultural production: A case study in Hebei Province, China. Ecol. Indic. 2019, 105, 438–447. [Google Scholar] [CrossRef]
  76. Chang, H.; Ding, Q.; Zhao, W.; Hou, N.; Liu, W. The digital economy, industrial structure upgrading, and carbon emission intensity—Empirical evidence from China’s provinces. Energy Strategy Rev. 2023, 50, 101218. [Google Scholar] [CrossRef]
  77. Li, J.; Sheng, X.; Zhang, S.; Wang, Y. Research on the Impact of the Digital Economy and Technological Innovation on Agricultural Carbon Emissions. Land 2024, 13, 821. [Google Scholar] [CrossRef]
  78. Feng, Z.M.; Yang, Y.Z.; You, Z. Relief Degree of Land Surface Dataset of China (1 km). J. Glob. Change Data Discov. 2018, 2, 151–155. [Google Scholar] [CrossRef]
  79. Giannakis, E.; Bruggeman, A. Exploring the labour productivity of agricultural systems across European regions: A multilevel approach. Land Use Policy 2018, 77, 94–106. [Google Scholar] [CrossRef]
  80. Combary, O.; Traore, S. Impacts of Health Services on Agricultural Labor Productivity of Rural Households in Burkina Faso. Agric. Resour. Econ. Rev. 2021, 50, 150–169. [Google Scholar] [CrossRef]
  81. Qinghua, X.U.; Guangsheng, Z. Spatial Spillover Effects of the Impact of Agricultural Mechanization on Carbon Emission Intensity in Agriculture: An Empirical Study Based on the Panel Data of 282 Cities. China Econ. Transit. (CET) 2023, 6, 458–482. [Google Scholar] [CrossRef]
  82. Qiu, Y.; Zhang, T.; Cao, Y.; Yin, J.; Chen, N. Impact of low-carbon city pilot policy on the status of urban transport carbon emission networks: Empirical evidence based on China’s aviation, railway, and water transportation. Sustain. Cities Soc. 2025, 130, 106568. [Google Scholar] [CrossRef]
  83. Duan, H.; Zhao, J.Z. Navigating towards Sustainability: The influence of China’s low-carbon city pilot initiatives on corporate ESG performance. Sustain. Cities Soc. 2025, 129, 106490. [Google Scholar] [CrossRef]
  84. Xie, L.; Hui, S. Low-carbon transition policy and employment structure: Evidence from China’s Low-carbon City Pilot. Cities 2025, 162, 105985. [Google Scholar] [CrossRef]
  85. Li, S.; Wang, Y.; Xu, X. Can low-carbon city pilot policy improve urban energy-environmental efficiency? Evidence from China. Energy Rep. 2025, 13, 2933–2945. [Google Scholar] [CrossRef]
  86. Yu, Y.; Zhang, N. Low-carbon city pilot and carbon emission efficiency: Quasi-experimental evidence from China. Energy Econ. 2021, 96, 105125. [Google Scholar] [CrossRef]
  87. Huo, W.; Qi, J.; Yang, T.; Liu, J.; Liu, M.; Zhou, Z. Effects of China’s pilot low-carbon city policy on carbon emission reduction: A quasi-natural experiment based on satellite data. Technol. Forecast. Soc. Change 2022, 175, 121422. [Google Scholar] [CrossRef]
  88. Yi, F.; Ziheng, N.; Zhong, S. Does information and communication technology reduce carbon emissions in China? Evidence from the quasi-natural experiment of the “Broadband China” pilot policy. J. Environ. Plan. Manag. 2025, 68, 1–27. [Google Scholar] [CrossRef]
  89. Peng, H.-R.; Ling, K.; Zhang, Y.-J. The carbon emission reduction effect of digital infrastructure development: Evidence from the broadband China policy. J. Clean. Prod. 2024, 434, 140060. [Google Scholar] [CrossRef]
Figure 1. Analytical framework for the impact of NAGDPZ on ACEE.
Land 14 01670 g001
Figure 2. Research area.
Land 14 01670 g002
Figure 3. The annual average changes in ACEE in the YRD region from 2013 to 2023.
Land 14 01670 g003
Figure 4. Spatial distribution of ACEE in YRD region.
Land 14 01670 g004
Figure 5. Parallel trend hypothesis assessment of the impact of the NAGDPZ policy on ACEE.
Land 14 01670 g005
Figure 6. The placebo test of the impact of the NAGDPZ policy on ACEE. Note: The blue line represents the kernel density curve, and the red dots are the regression coefficients.
Land 14 01670 g006
Figure 7. Changes in the absolute value of the standard deviation of the covariates.
Land 14 01670 g007
Table 1. Carbon sources in ACEs and their coefficients.
Carbon SourceCarbon Emission CoefficientSource
Diesel0.5927 kg/kgIntergovernmental Panel on Climate Change 2013
Fertilizer0.8956 kg/kgOak Ridge National Laboratory in the United States
Pesticide4.9341 kg/kg
Agricultural film5.1800 kg/kgInstitute of Agricultural Resources and Ecology, Nanjing Agricultural University
Irrigation25 kg/haLal and Dubey [74]
Farming312.60 kg/km2Bai et al. [75]
Note: When calculating the carbon emissions from agricultural irrigation, the coefficient of thermal power was further taken into account, and the final value was 20.476 kg/ha.
Table 2. The impact of the NAGDPZ policy on ACEE.
(1)(2)
VariablesACEEACEE
NAGDPZ0.048 *0.049 *
(1.922)(2.017)
Constant0.270 ***0.126
(14.268)(0.861)
Observations451451
R-squared0.4020.412
Number of id4141
Control variableNOYES
City FEYESYES
Year FEYESYES
Note: Robust t-statistics in parentheses: *** p < 0.01, * p < 0.1.
Table 3. The ACEE of NAGDPZ policy after PSM matching.
(1)(2)
VariablesACEEACEE
NAGDPZ0.055 **0.050 *
(2.152)(2.001)
Constant0.247 ***0.245 *
(20.056)(1.728)
Observations431431
Number of id0.4870.505
R-squared4040
Control variableNOYES
City FEYESYES
Year FEYESYES
Note: Robust t-statistics in parentheses: *** p < 0.01, ** p < 0.05, and * p < 0.1.
Table 4. The impact of NAGDPZ policy on ACEE when other policies are controlled.
(1)(2)(3)(4)
VariablesACEEACEEACEEACEE
NAGDPZ0.049 *0.049 *0.047 *0.049 *
(2.017)(2.017)(1.902)(2.016)
Agricultural Non-Point Source Pollution Prevention and Control Campaign0.155
(1.633)
Blue Sky Defense Campaign 0.155
(1.633)
“Low-carbon City” pilot program 0.040
(1.138)
“Broadband China” pilot program −0.018
(−0.601)
Constant0.1260.1260.1180.121
(0.861)(0.861)(0.814)(0.809)
Observations451451451451
R-squared0.4120.4120.4170.413
Number of id41414141
Control variableYESYESYESYES
City FEYESYESYESYES
Year FEYESYESYESYES
Note: Robust t-statistics in parentheses: * p < 0.1.
Table 5. The impact of the NAGDPZ policy on ACEE using instrumental variable models.
(1)(2)
VariablesNAGDPZACEE
Instrumental variable 305.786 ***
(10.07)
Dummy variables of NAGDPZ after instrumental variable fitting 0.076 **
(2.10)
Observations451451
Number of id4141
Control variableYESYES
City FEYESYES
Year FEYESYES
Kleibergen–Paap rk LM statistic53.073
Cragg–Donald Wald F statistic79.212
Overidentification test of all instruments0.000
Note: Robust z-statistics in parentheses: *** p < 0.01, ** p < 0.05.
Table 6. Multiple robustness testing of the impact of the NAGDPZ policy on ACEE.
(1)(2)(3)(4)
VariablesACEEACEEACEEACEE
NAGDPZ0.063 **0.042 *0.053 **0.043 *
(2.405)(1.851)(2.249)(1.980)
Constant0.1350.0950.249 *0.152
(0.908)(0.666)(1.828)(1.144)
Observations451451440410
Number of id41414041
R-squared0.4210.4240.4890.418
Control variableYESYESYESYES
City FEYESYESYESYES
Year FEYESYESYESYES
Note: Robust t-statistics in parentheses: ** p < 0.05, * p < 0.1.
Table 7. Results of the impact mechanism of NAGDPZ policy on ACEE.
(1)(2)
VariablesAOSALP
NAGDPZ0.052 **0.061 ***
(2.271)(2.722)
Constant0.423 ***0.202
(3.128)(1.463)
Observations451451
R-squared0.4530.572
Number of id4141
Control variableYESYES
City FEYESYES
Year FEYESYES
Note: Robust t-statistics in parentheses: *** p < 0.01, ** p < 0.05.
Disclaimer/Publisher’s Note: The statements, opinions and data contained in all publications are solely those of the individual author(s) and contributor(s) and not of MDPI and/or the editor(s). MDPI and/or the editor(s) disclaim responsibility for any injury to people or property resulting from any ideas, methods, instructions or products referred to in the content.