Article

Spatial–Temporal Changes and Driving Forces of Sandy Desertification in Dengkou County, China, Based on Refined Interpretation and Validation

1
China Geological Survey, Hohhot General Survey of Natural Resources Center, Hohhot 010010, China
2
Northeast Geological S&T Innovation Center of China Geological Survey, Shenyang 110000, China
3
Innovation Base for Water Resource Exploration and Eco-Environmental Effects in the Daheihe Basin of the Yellow River, Hohhot 010010, China
4
School of Earth Science and Resources, China University of Geosciences (Beijing), Beijing 100083, China
5
School of Environment, Northeast Normal University, Changchun 130024, China
*
Author to whom correspondence should be addressed.
Land 2025, 14(8), 1666; https://doi.org/10.3390/land14081666
Submission received: 2 July 2025 / Revised: 9 August 2025 / Accepted: 15 August 2025 / Published: 18 August 2025

Abstract

Sandy desertification is a major ecological and environmental challenge worldwide, posing a severe threat to ecological security in arid regions. A systematic understanding of the spatial–temporal dynamics of sandy desertification and their driving forces enables effective support for ecological engineering in China. We visually interpreted five Landsat imaging periods (1986–2023) to map sandy desert areas (SDA), which were confirmed by 176 field samples. Driving forces were measured using the Geographical Detector model, and changes in the extent and intensity of SDA were evaluated using intensity analysis and center of gravity migration. The results indicate the following: (1) On the temporal scale, sandy desertification land in Dengkou County experienced a significant reversal over the past 40 years, with a total reduction of 1204.72 km2. On the spatial scale, the main areas of reduction were located in the central and southwestern regions. (2) Sandy desertification in Dengkou County underwent a process of initial reversal, followed by expansion, and then another reversal. The periods 1986–1995 and 2004–2023 were reversal phases, while 1995–2004 was a development phase. (3) Livestock density showed the strongest influence among anthropogenic factors (q = 0.224), suggesting a strong correlation with sandy desertification patterns. Among natural factors, geological conditions exert the most significant influence (q = 0.182). Every pair of driving factors, with the exception of slope aspect and soil moisture, showed either additive or synergistic effects, increasing their combined influence on desertification. The results provide a scientific basis for local ecological restoration and desertification control.

1. Introduction

Sandy desertification is a serious ecological, economic, and environmental issue worldwide [1,2,3]. It refers to land degradation characterized primarily by wind-blown sand activity in arid, semi-arid, and some sub-humid areas, resulting from an imbalance in the human–land relationship [4]. It poses severe threats to food security, ecosystems, socio-economic systems, and sustainable development [5,6,7]. Sandy desertification primarily develops under the influence of human factors, based on underlying natural conditions [8]. Under global warming, precipitation decreases and wind speeds increase in sandy desert-sensitive areas, accelerating evaporation, triggering drought, and further intensifying the desertification process [9]. In addition to climatic factors, environmental conditions and human activities also have significant impacts on sandy desertification.
China is one of the countries most severely affected by sandy desertification worldwide [10,11]. The Inner Mongolia Autonomous Region ranks among the top in China in terms of sandy desertification land area, with the western part of Inner Mongolia being particularly affected [12]. In Dengkou County, sandy desertification has been increasingly aggravated by wind erosion from the Ulan Buh Desert and the overexploitation of water and soil resources in the Hetao Plain [13,14,15]. Although large-scale desertification monitoring studies have covered Dengkou County, high-resolution and long-term time-series monitoring remains insufficient [16]. To promote science-based desertification control, enhance the quality and stability of desert ecosystems, and support the ecological restoration of the “Jizi bend” of the Yellow River, conducting high-resolution, long-term monitoring of sandy desertification and analyzing its driving factors in Dengkou County is of great theoretical importance and provides practical support for national policy implementation and regional desertification control.
Early monitoring of sandy desertification primarily relies on field surveys and numerical simulations [17]. With the continuous advancement of remote sensing technology, it is now widely applied in sandy desertification monitoring [18,19]. Currently, two main approaches are used for remote sensing-based monitoring of sandy desertification: visual interpretation of satellite imagery and extraction of indices that can characterize sandy desert features. The visual interpretation method relies on features such as color, texture, shape, and spatial structure in satellite images to identify vegetation cover, proportions of mobile sand, and landform types, enabling the classification and evaluation of sandy desertification land [20,21]. Many scholars have conducted sandy desertification monitoring across various regions of China using visual interpretation methods [22,23]. Another approach involves calculating remote sensing indices from different spectral bands of satellite multispectral imagery to reflect specific land surface features. Common indices used to characterize sandy desertification include the normalized difference vegetation index (NDVI), Albedo, the modified soil adjusted vegetation index (MSAVI), the sandy feature index (SFI), land surface temperature (LST), and the Topsoil Grain Size Index (TGSI). By combining multiple indices in machine learning classification or constructing indices such as the desertification difference index (DDI) and the desertification monitoring index (DMI), researchers have achieved effective identification and dynamic monitoring of sandy desertification [24,25,26]. However, these methods still have certain limitations. For instance, NDVI may struggle to eliminate the interference of atmospheric and soil factors on vegetation reflectance. Moreover, relying solely on a limited set of indices is insufficient to capture the complexity and true extent of sandy desertification [9,27,28]. To address these shortcomings, this study employed a high-precision classification approach based on visual interpretation and field validation, aiming to compensate for the limitations of previous studies that depended primarily on a small number of indices.
The process of sandy desertification is driven by multiple factors, and conducting a comprehensive analysis of these driving forces contributes to a deeper understanding of its underlying mechanisms [29,30,31]. However, most existing studies lack specificity and comprehensiveness in the selection of driving factors. Notably, sandy desert landscapes are widely distributed in Dengkou County, but the subsurface strata beneath the dunes vary significantly, and the sandy desert process is closely related to geological evolution [32,33]. Therefore, this study incorporated geological conditions as a natural factor to enable a more comprehensive analysis of the driving forces behind sandy desertification in Dengkou County. Against this background, the Geographical Detector—a statistical method used to identify spatial differentiation and its driving mechanisms—enables quantitative analysis of various factors influencing sandy desertification [34]. Its core principle is that if a factor significantly influences sandy desertification, its spatial distribution should be consistent with the spatial distribution of sandy desertification [35]. In addition, this method can detect interactions between variables and assess the strength, direction, and potential nonlinearity of their effects on sandy desertification [36]. In recent years, this model has been applied in fields such as drought monitoring, sandy desert monitoring, and climate change analysis [37,38,39].
The land use transfer matrix and dynamic degree model are fundamental methods for analyzing the spatial–temporal dynamics of sandy desertification [23,40]. However, these traditional methods focus solely on the scale of sandy desert change, while neglecting its intensity [41]. To this end, this study employed the intensity analysis method, which simultaneously considers the scale and intensity of change [42], to quantitatively analyze the temporal dynamics of sandy desertification land in Dengkou County.
This study aims to (1) map the spatial distribution of sandy desertification in Dengkou County based on visual interpretation and field validation, (2) quantify the change process and transition patterns of sandy desertification, (3) comprehensively explore the major driving factors of sandy desertification in Dengkou County.

2. Materials and Methods

2.1. Study Area

Dengkou County (40°09′–40°57′ N, 106°09′–107°10′ E) is located in the southwestern part of Bayannur, Inner Mongolia, in the middle to upper reaches of the Yellow River. It is bordered by the Langshan Mountains to the north and the Ulan Buh Desert to the west, covering a total area of 3678.3 km2 (Figure 1) [43]. The county has a permanent population of 90,196, a GDP of approximately RMB 16.773 billion, and about 459,700 livestock, accounting for 5.9%, 29.7%, and 5.3% of Bayannur City, respectively. The elevation in the county ranges from 1030 to 2046 m. Excluding mountainous areas, the terrain slopes from southeast to northwest, with a total elevation drop of 23 m from the main canal headgate in the southeast to the Ulan Buh sandy area in the northwest [44]. The region has a temperate continental climate with distinct seasons—hot and dry summers, and cold, dry winters. The mean annual precipitation is 143.4 mm, the mean annual evaporation is 2387.6 mm, the mean annual temperature is 7.6 °C, the average wind speed is 2.7 m/s, and the frost-free period lasts about 136 days [45]. The region exhibits arid climatic characteristics, with low precipitation and high evaporation, which adversely affect the process of sandy desertification. The Yellow River section within Dengkou County spans 52 km, with an annual runoff of approximately 983 m3/s and an irrigated area of 146.09 km2 [46]. In the Hetao region of the county, the groundwater depth ranges from 0.5 to 3 m; in sandy desert areas, it ranges from 3 to 10 m; and in piedmont alluvial lands, it ranges from 3 to 30 m [47]. Abundant irrigation water resources and a shallow groundwater table have provided strong support for the transformation of deserts into oases in Dengkou County.
The northwestern mountainous area of Dengkou County is primarily characterized by exposed bedrock at the surface, with rocks mainly consisting of metamorphic rocks from the Archean and Proterozoic eras, as well as intrusive rocks from the Paleozoic era. The alluvial fans at the foot of the mountains are covered by Quaternary deposits extending southeastward toward the Yellow River. These strata include Upper Pleistocene alluvial gravel and sand, Upper Pleistocene lacustrine clay (paleolake), and Holocene aeolian sand (desert), lacustrine deposits (modern lakes), and alluvial deposits (riverbeds). The majority of soils in Dengkou County exhibit a light texture. In the eastern Hetao Plain region, soils are predominantly loamy with deep soil layers. Meadow-type irrigation-silted layers are generally 35 cm thick, and soil salinization is relatively severe. In the southwestern sandy areas, soils are mainly sandy, with local distributions of zonal soil-gray desert soil. Although most of Dengkou County’s surface is covered by aeolian sand, underlying lacustrine clay layers are present in many areas. These regions exhibit favorable soil water retention capacity, making them favorable areas for desertification control and scientifically based greening efforts.

2.2. Data and Processing

2.2.1. Remote Sensing Data

Landsat data are jointly collected by the National Aeronautics and Space Administration (NASA) and the United States Geological Survey (USGS). These data offer long temporal coverage, high data quality, fine spatial resolution, and a wide range of spectral bands. Five sets of Landsat satellite images from 1986, 1995, 2004, 2015, and 2023 were downloaded from the official website of the U.S. Geological Survey (https://earthexplorer.usgs.gov/, accessed on 2 March 2024). The selection of the image years was based on two criteria. (1) Representativeness of temporal intervals: As sandy desertification is a long-term evolutionary process with limited short-term variation, approximately 10-year intervals were chosen to better capture temporal dynamics, while ensuring data availability. (2) Data availability and quality: Priority was given to years during the vegetation growing season (June to September) with cloud coverage less than 5%. If the target year did not meet these conditions, the nearest qualified year was selected as a substitute. Details of the image acquisition are provided in Table 1.
Data preprocessing included radiometric calibration, atmospheric correction, geometric correction, mosaicking, cropping, and spatial projection [18]. All processing steps were conducted using ENVI 5.3 software (https://envi.geoscene.cn/). Radiometric calibration was performed using the Calibration Utilities; atmospheric correction was conducted using the FLAASH module; and geometric correction was based on a 1:100,000 topographic map of Dengkou County. All images were referenced to the WGS 1984 ellipsoid and projected to the Albers coordinate system. Nearest neighbor resampling was used to ensure that the root mean square error (RMSE) was less than one pixel. For land classification in the study area, the band combinations used were TM (3(R), 2(G), 1(B)) and OLI (4(R), 3(G), 2(B)); for sandy desertification classification, the combinations were TM (4(R), 3(G), 2(B)) and OLI (5(R), 4(G), 3(B)).

2.2.2. Influencing Factor Data

The development and evolution of sandy desertification are influenced by multiple factors. In this study, fifteen representative and quantifiable factors were selected from both natural and anthropogenic dimensions. Natural factors include elevation (ELE), slope (SLP), aspect (ASP), geological conditions (GC), soil type (ST), precipitation (PRE), temperature (TEM), potential evapotranspiration (PET), aridity index (AI), wind velocity (WV), and soil moisture (SM). Anthropogenic factors include population density (POP), gross domestic product (GDP), nighttime lights (NL) [48], and livestock density (LIV) [49]. Detailed information for each factor is provided in Table 2.

2.3. Methods

2.3.1. Identification, Classification, and Validation of Sandy Desert Areas

Based on the spectral characteristics of remote sensing imagery in the study area, and with reference to previous studies [35,50], the region was classified into three categories through visual interpretation: sandy desert areas (SDA), gravel desert areas (GDA), and mountainous areas (MA), incorporating terrain, geological conditions, and surface material information obtained from field surveys. Vegetation in the SDA is dominated by xerophytic and extremely xerophytic shrubs or semi-shrubs, accompanied by sparse herbaceous plants. The landscape mainly consists of slowly accumulated sandy land, sand dunes, and shrub-covered sandy areas. Vegetation in the GDA mainly consists of xerophytic and extremely xerophytic shrubs and semi-shrubs, with sparse herbaceous plants. These areas are primarily distributed across alluvial plains and wind-eroded gobi deserts with abundant and diverse gravel types. Vegetation in the MA primarily includes xerophytic and extremely xerophytic shrubs and semi-shrubs. The terrain is rugged, and soil development is poor. The classification system, interpretation indicators, and field photographs are presented in Table 3. It is worth noting that the interpretation indicators are derived from 2023 Landsat 8 imagery, while the field photographs were taken during on-site surveys in August 2024.
In the SDA, the land was classified into four severity levels—Slight, Moderate, Serious, and Extremely severe—based on technical specifications and previous research [51,52], using visual interpretation. Slight sandy desertification is characterized by minimal wind and sand activity, or by cultivated sandy farmland where crops generally grow normally in average years, with a low seedling loss rate (less than 20%). Moderate sandy desertification shows weak or unnoticeable wind-blown sand activity, or occurs on cultivated land with poor crop growth, a higher seedling loss rate (20% ≤ loss rate < 30%), and uneven spatial distribution. Serious sandy desertification involves evident wind-blown sand activity or clearly visible drifting sand patterns, or refers to cultivated land where crop growth is severely hindered and the seedling loss rate is equal to or greater than 30%. Extremely severe sandy desertification is defined by landscapes almost entirely covered by drifting sand, with sparse and scattered vegetation, or where cultivation is nearly impossible due to severe sand burial and vegetation degradation. The classification system, interpretation indicators, and field photographs are presented in Table 4.
The visual interpretation of sandy desertification was carried out using ArcGIS 10.8. After interpretation, topological relationships were established, errors were corrected, and the results were exported in vector format. For driving factor analysis, the vector files were converted into raster data with a resolution of 30 m. A total of 176 ground truth points were used to validate both the classification of the study area and the grading of sandy desertification. Among them, 162 points were in the SDA, 8 in GDA, and 6 in MA. The selection criteria for validation points were divided into two aspects. For study area classification, road accessibility and spatial distribution uniformity were prioritized. For sandy desertification grading, the validation points were mainly located in areas with Moderate and Serious sandy desertification, as Slight and Extremely severe sandy desertification were more easily distinguishable. Additionally, accessibility, spatial uniformity, and randomness were also considered during point selection. The classification of the study area achieved an accuracy of 100%, and the interpretation accuracy of sandy desertification grading reached 86%, which met the required precision. Errors were subsequently corrected.

2.3.2. Intensity Analysis

Intensity analysis is a quantitative method used to analyze changes between land use/land cover categories [53]. It is applicable to analyses involving two or more time intervals and two or more land category types. Intensity analysis consists of three levels: interval level, category level, and transition level.
The mathematical symbols in the equation are defined as follows: subscript i denotes the category at the initial time point of a given time interval; subscript j denotes the category at the ending time point of a given time interval; subscript m refers to the category that transitions to another class; subscript n refers to the category that receives transitions from other classes; T represents the total number of time intervals; subscript t indicates a specific time interval between years Yt and Yt+1, where t ranges from 1 to T − 1; Yt denotes the calendar year at time t.
The interval level analyzes the scale and speed of changes across different time intervals. St represents the annual percentage of the total area that actually changes during each time interval. U represents the annual percentage of the total area that would change over the entire study period. By comparing the values of St and U, the overall speed of change in a specific interval can be assessed. If St is greater than U, the interval exhibits a faster rate of change; if St is less than U, the interval exhibits a slower rate of change. St and U were calculated using Equations (1) and (2) [42,54]:
S t = j = 1 J i = 1 J c tij C t i i / j = 1 J i = 1 J C t i j Y t + 1 Y t × 100 %
U = t = 1 T 1 j = 1 J i = 1 J c tij C t i i / j = 1 J i = 1 J C t i j Y T Y 1 × 100 %
The category level analyzes the magnitude and intensity of total gains and losses for each category within a given time interval, and how these changes vary across categories. Lti represents the annual percentage loss of category i during the interval [YT, YT+1], based on its initial total area. Gtj represents the annual percentage gain of category j during the interval [YT, YT+1], based on its final total area, emphasizing the transition from non-j categories to j. Lti and Gtj were calculated using Equations (3) and (4) [42,54]:
L t i = j = 1 J c t i j C t i i / Y t + 1 Y t j = 1 J C t i j × 100 %
G t j = i = 1 J C tij C t j j / Y t + 1 Y t i = 1 J C t i j × 100 %
The transition level analyzes the variation in transition scale and intensity from a given category to other available categories. Rtin represents the annual transition intensity from category i to category n during the interval [YT, YT+1]. Wtn represents the uniform transition intensity from all non-n categories at time Yt to category n during the interval [YT, YT+1]. Qtmj represents the annual transition intensity from category m to category j during the interval [YT, YT+1]. Vtm represents the uniform transition intensity from category m at time Yt+1 to all non-m categories during the interval [YT, YT+1]. Rtin, Wtn, Qtmj, and Vtm were calculated using Equations (5)–(8) [42,54]:
R t i n = C t i n Y t + 1 Y t j = 1 J C t i j × 100 %
W t n = i = 1 J C t i n C t n n Y t + 1 Y t j = 1 J i = 1 J C t i j C t n j × 100 %
Q t m j = C t m j Y t + 1 Y t i = 1 J C t i j × 100 %
V t m = j = 1 J C t m j C t m m Y t + 1 Y t i = 1 J j = 1 J C t i j C t i m × 100 %

2.3.3. The Center of Gravity Migration Model

The center of gravity analysis effectively visualizes the overall spatial characteristics of sandy desert changes within a region [55]. By calculating the direction and distance of movement for different severity levels of sandy desert land, spatial development trends can be identified. The direction and distance of such migration can be quantified by tracking the changes in the coordinates of the center of gravity, calculated using Equations (9) and (10) [56]:
X t = i = 1 n C t i × X t i / i = 1 n C t i
Y t = i = 1 n C t i × Y t i / i = 1 n C t i
In the equation, Xt and Yt represent the longitude and latitude coordinates of the center of gravity for a given type of sandy desert land in year t; n is the number of sandy desert patches of that type in year t; Xti and Yti are the coordinates of the geometric center of the i-th patch of that sandy desert type in year t; Cti denotes the area of the i-th patch of that sandy desert type in year t.

2.3.4. Geographical Detector

The Geographical Detector is a statistical method used to detect spatial heterogeneity and identify underlying driving forces [37]. The Geographical Detector includes four components: the factor detector, the interaction detector, the risk detector, and the ecological detector. In this study, the factor detector and interaction detector were applied to explore the driving effects of 15 natural and anthropogenic factors on sandy desertification.
Factor detector: It measures the spatial heterogeneity of variable Y and evaluates the extent to which factor X explains the spatial variation of Y. The explanatory power of factor X on attribute Y is quantified using a q-value, which ranges from 0 to 1. A higher q-value indicates a stronger explanatory power. The q-value was calculated using Equation (11) [34]:
q = 1 h = 1 L N h σ h 2 N σ 2 = 1 S S W S S T S S W = h = 1 L N h σ h 2 , S S T = N σ 2
In the equation, h = 1, …, L represents the stratification of variable Y or factor X, corresponding to classifications or spatial partitions. Nh is the number of units in stratum h, and N is the total number of units in the entire study area. σ h 2 denotes the variance of Y within stratum h, and σ2 is the overall variance of Y in the study area. SSW represents the sum of within-stratum variances, and SST denotes the total variance across the entire area.
Interaction detector: This component identifies the interaction between different risk factors X, and assesses whether the combined effect of X1 and X2 increases, decreases, or remains independent in explaining the spatial variation of Y. First, the individual explanatory powers of X1 and X2 on Y are calculated, represented by q(X1) and q(X2), respectively. Then, the interaction q-value of X1 and X2, denoted as q(X1X2), is calculated. By comparing q(X1), q(X2), and q(X1X2), the type of interaction between the two factors can be determined [34]. Detailed information on interaction types and interpretation criteria is provided in Table 5.

3. Results

3.1. Study Area Classification

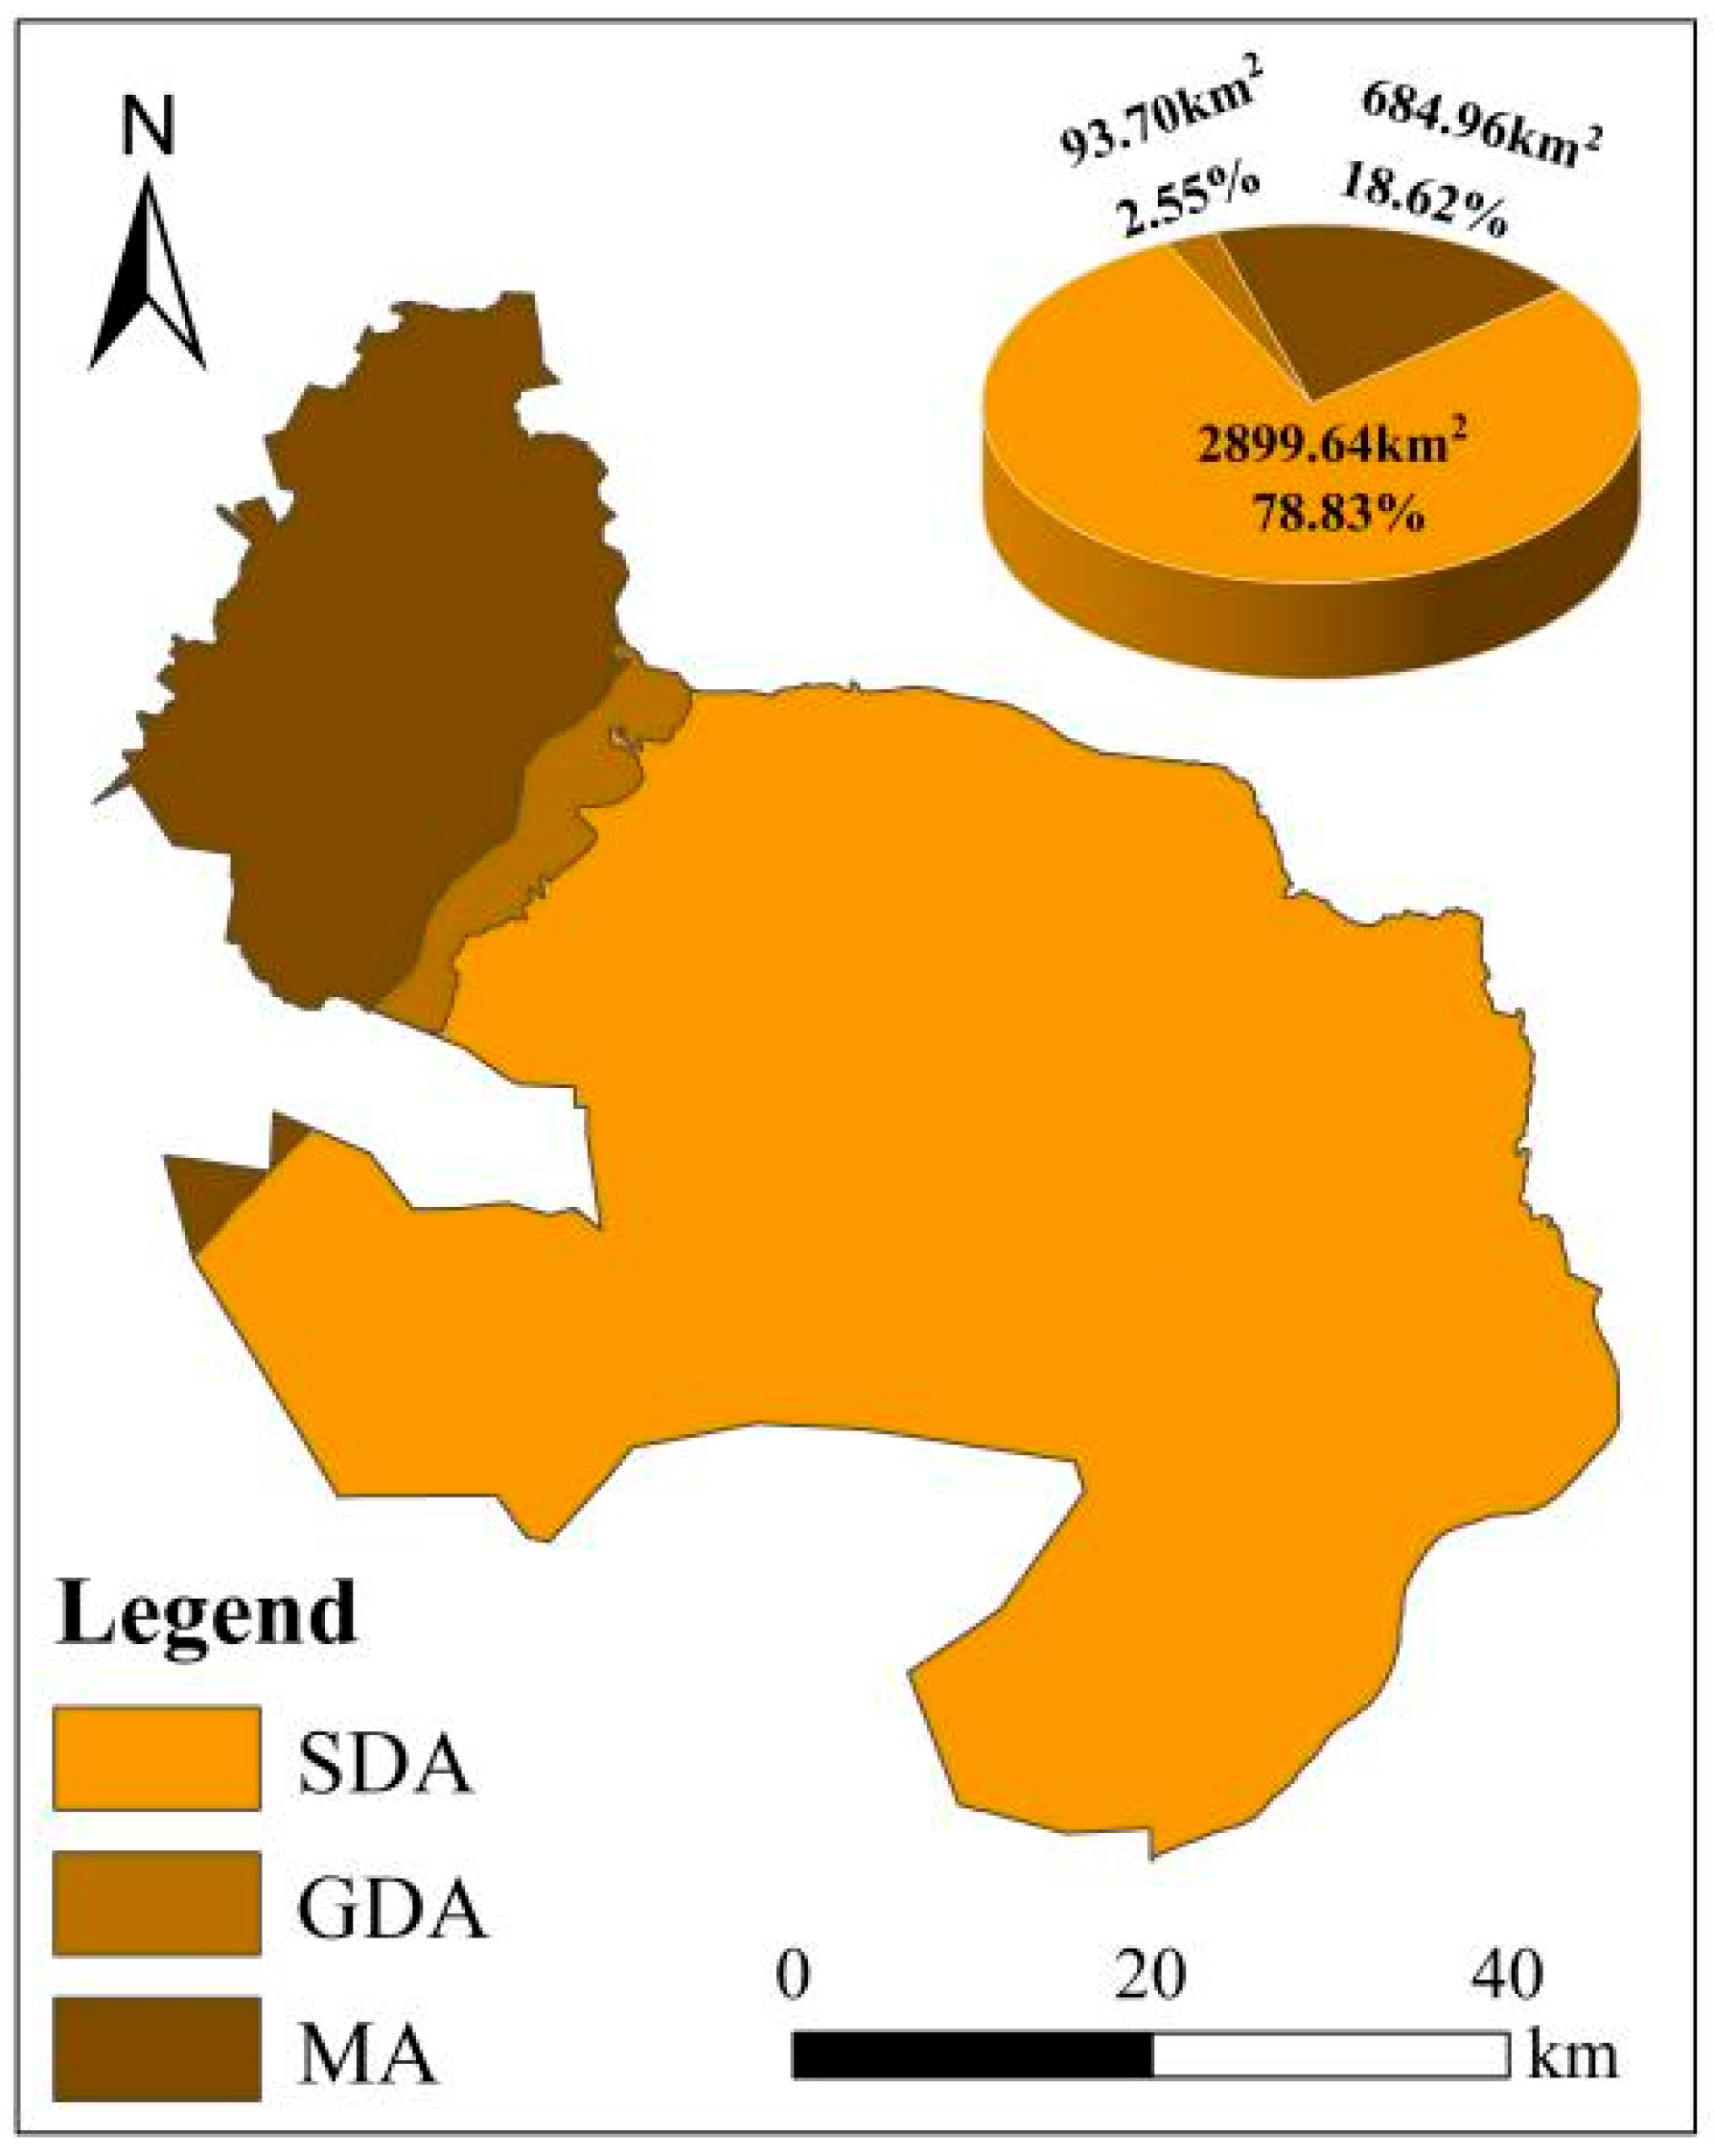
Based on the interpretation indicators defined in Table 3, the 2023 remote sensing imagery of Dengkou County was classified into different land categories using the visual interpretation method (Figure 2). The results indicate that Dengkou County is predominantly composed of SDA, located at the junction of the Hetao Plain and the Ulan Buh Desert. GDA are distributed along the alluvial fans at the foot of the Langshan Mountains, while MA are located in the western section of the Langshan range. The areas of the three categories are 2899.64 km2, 93.70 km2, and 684.96 km2, accounting for 78.73%, 2.55%, and 18.62% of Dengkou County’s total area, respectively.

3.2. Spatial–Temporal Dynamics of Sandy Desertification

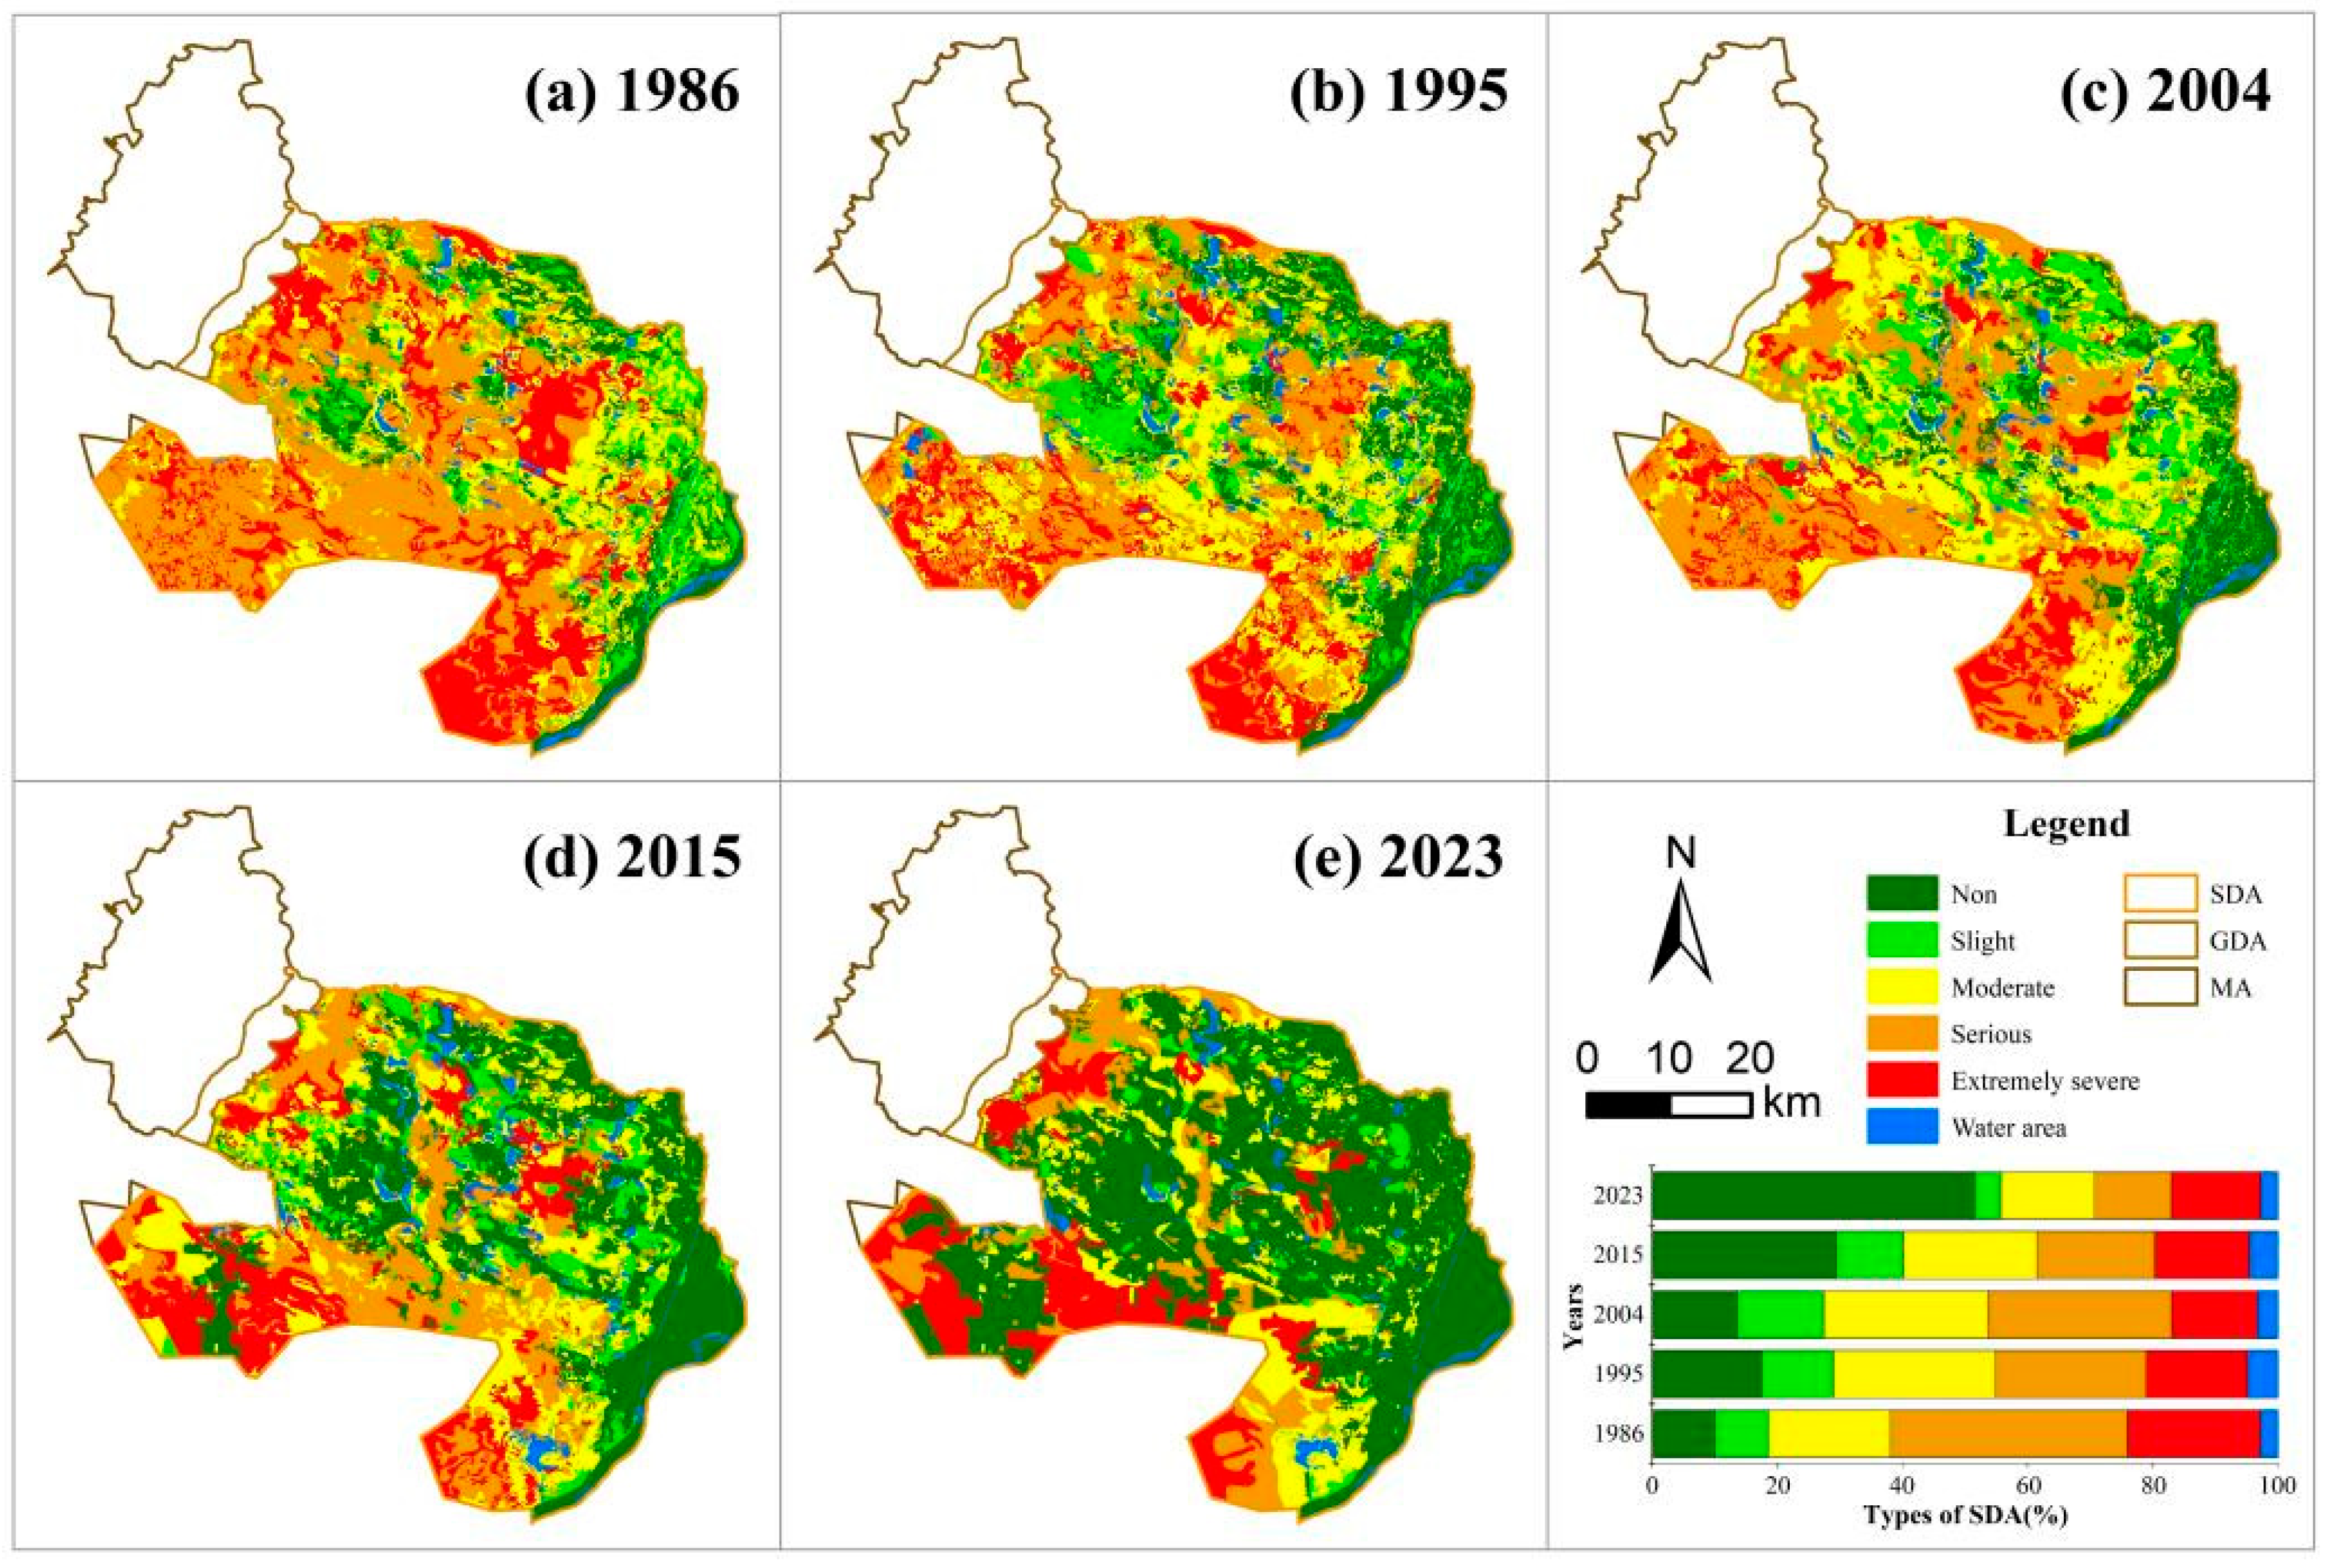
Based on the 2023 classification results and the interpretation indicators defined in Table 4, sandy desertification land in the sandy desert area was classified into different severity levels across five time periods using a visual interpretation method. After classification, statistical analyses were conducted to determine the area (Table 6), spatial distribution (Figure 3), and center of gravity migration characteristics (Figure 4) of sandy desertification at each level for each year.
In 1986, 1995, 2004, 2015, and 2023, the area of sandy desertification land in Dengkou County was 2528.06 km2, 2250.91 km2, 2409.38 km2, 1913.33 km2, and 1325 km2, respectively, accounting for 87.19%, 77.63%, 83.09%, 65.99%, and 47.70% of the total SDA. Across all periods, Moderate and Serious sandy desertification were the dominant types, accounting for more than 59.66% of the total sandy desertification land area.
From a temporal perspective, the area of sandy desertification land decreased from 1986 to 1995, increased from 1995 to 2004, and continued to decline from 2004 to 2023. Overall, from 1986 to 2023, sandy desertification was significantly reversed, with an increase of 1204.79 km2 in non-sandy desertification land. All categories of sandy desertification showed a decreasing trend, with Serious sandy desertification experiencing the most substantial reduction—743.21 km2—accounting for 61.78% of the total decrease.
As shown in Figure 3, sandy desertification land was primarily distributed in the southwestern part of Dengkou County, while the central region exhibited a mosaic pattern of sandy desertification land and non-sandy desertification land. Specifically, Slight sandy desertification land was mainly distributed in the eastern part of Dengkou County, within the Yellow River irrigation zone bordering the Hetao Plain. Moderate sandy desertification land appeared in scattered patches across the central part of the county. Serious and Extremely severe sandy desertification land was mainly concentrated in three regions: the eastern Langshan alluvial fan, the central part of Dengkou County, and the northern part of the Ulan Buh Desert. From 1986 to 2023, non-sandy desertification land gradually expanded, showing a spatial trend of spreading from the periphery toward the central and southwestern regions.
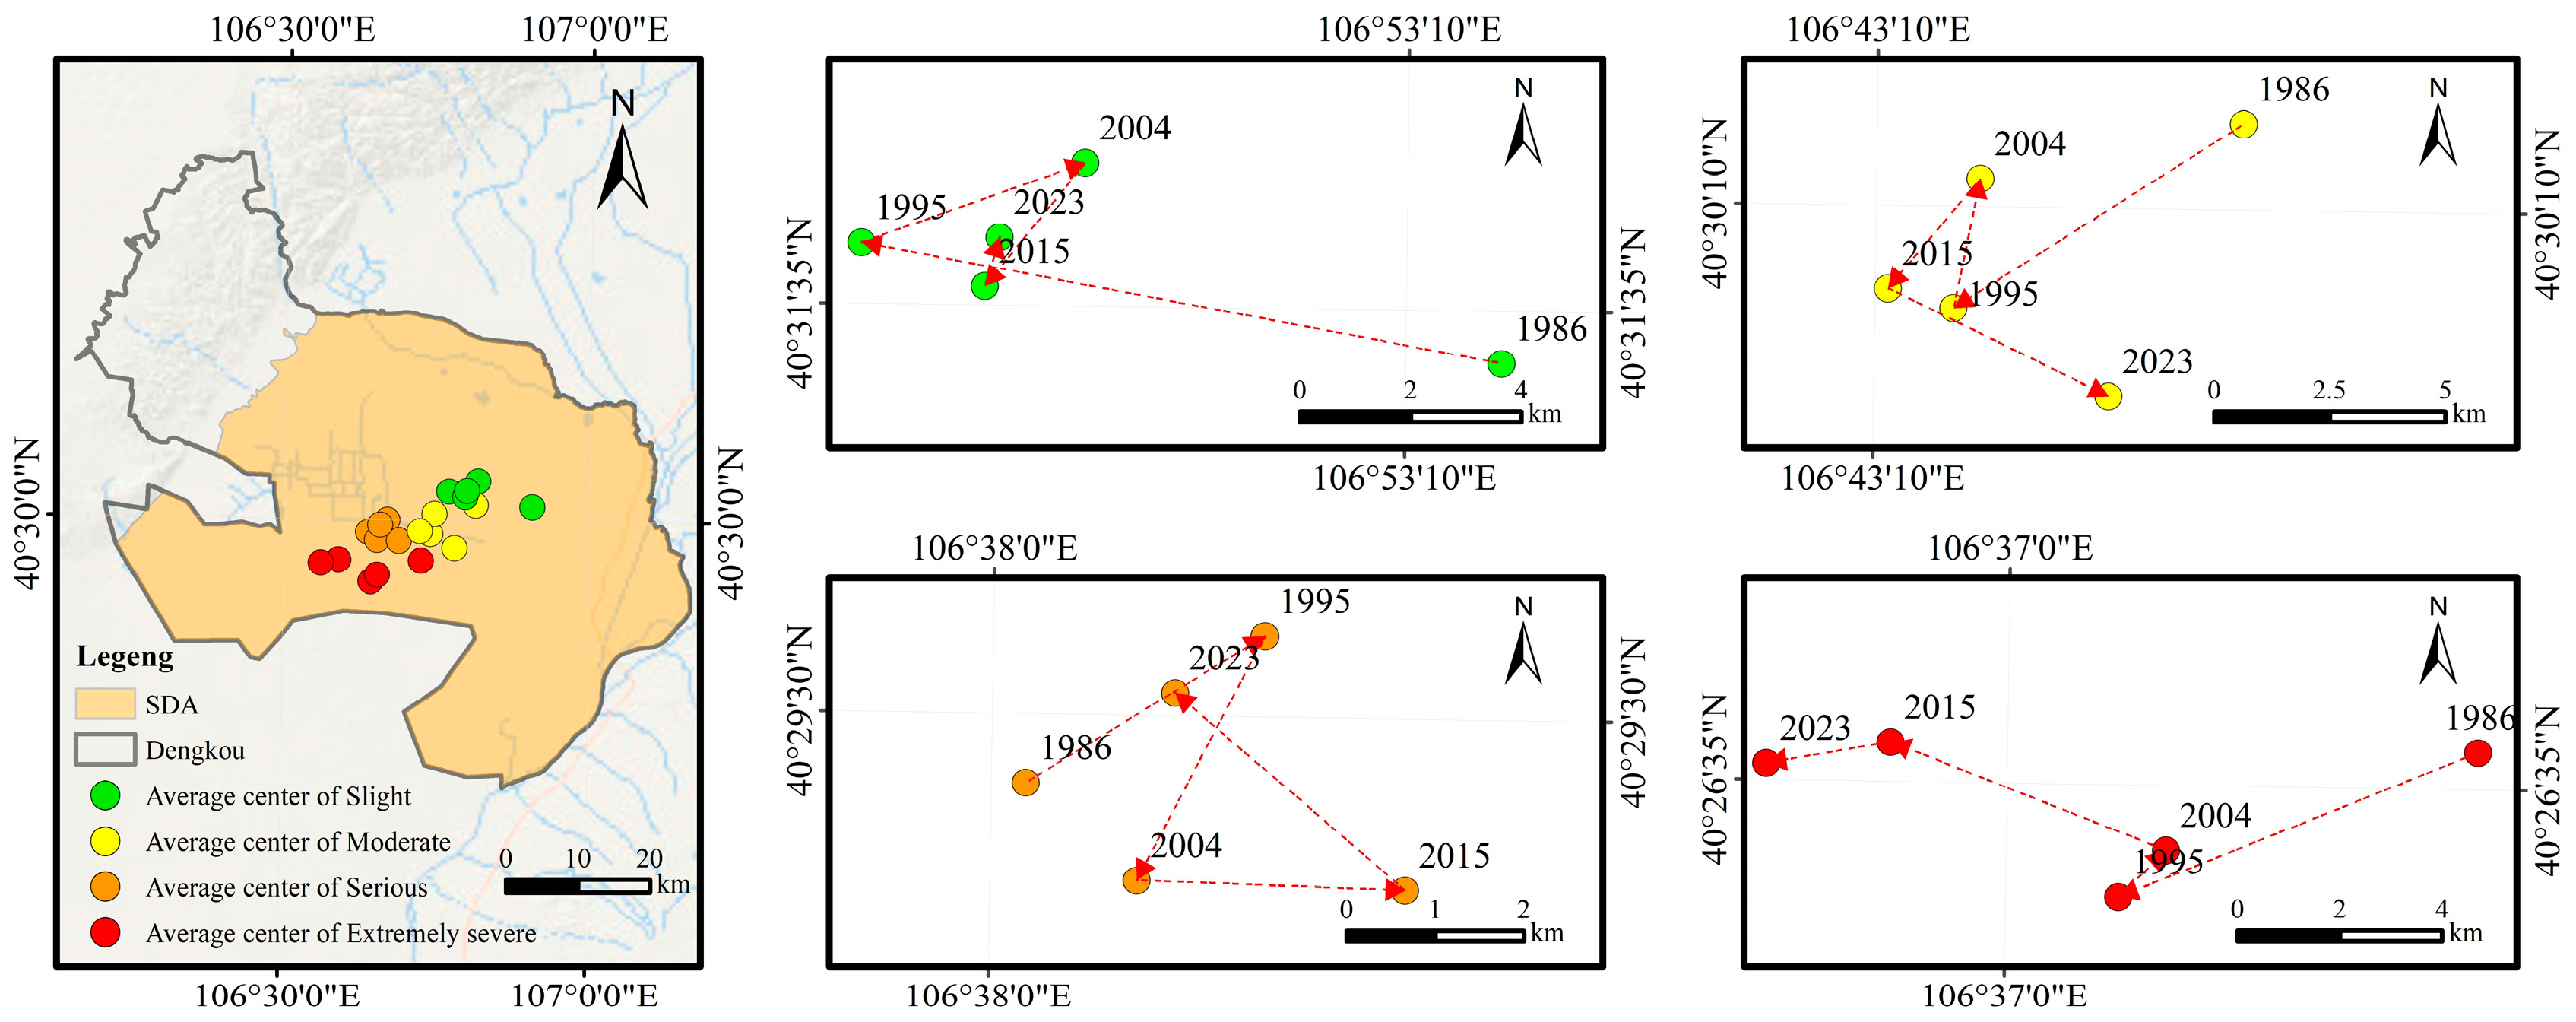
Figure 4 illustrates the spatial migration characteristics of the centers of gravity for different types of sandy desertification land in Dengkou County. The centers of Slight, Moderate, Serious, and Extremely severe sandy desertification land were sequentially distributed from the northeast to the southwest, demonstrating a gradient pattern of increasing sandy desertification severity along this direction. This pattern aligns with the spatial orientation from the Hetao Plain to the Ulan Buh Desert, indicating that the degree of sandy desertification in the SDA intensified from the Hetao Plain toward the Ulan Buh Desert.
From 1986 to 2023, the centers of Slight, Moderate, Serious, and Extremely severe sandy desertification land migrated toward the northwest, southwest, northeast, and west, respectively. The corresponding migration distances were 9.34 km, 6.61 km, 1.96 km, and 13.93 km, with the center of Extremely severe sandy desertification land showing the most notable migration direction and distance. Overall, over the past four decades, the center of gravity of sandy desertification land in Dengkou County has exhibited a westward shift, indicating significant improvement in sandy desertification conditions in the central and eastern regions.

3.3. Scale and Intensity of Sandy Desertification Transitions

3.3.1. Interval Level

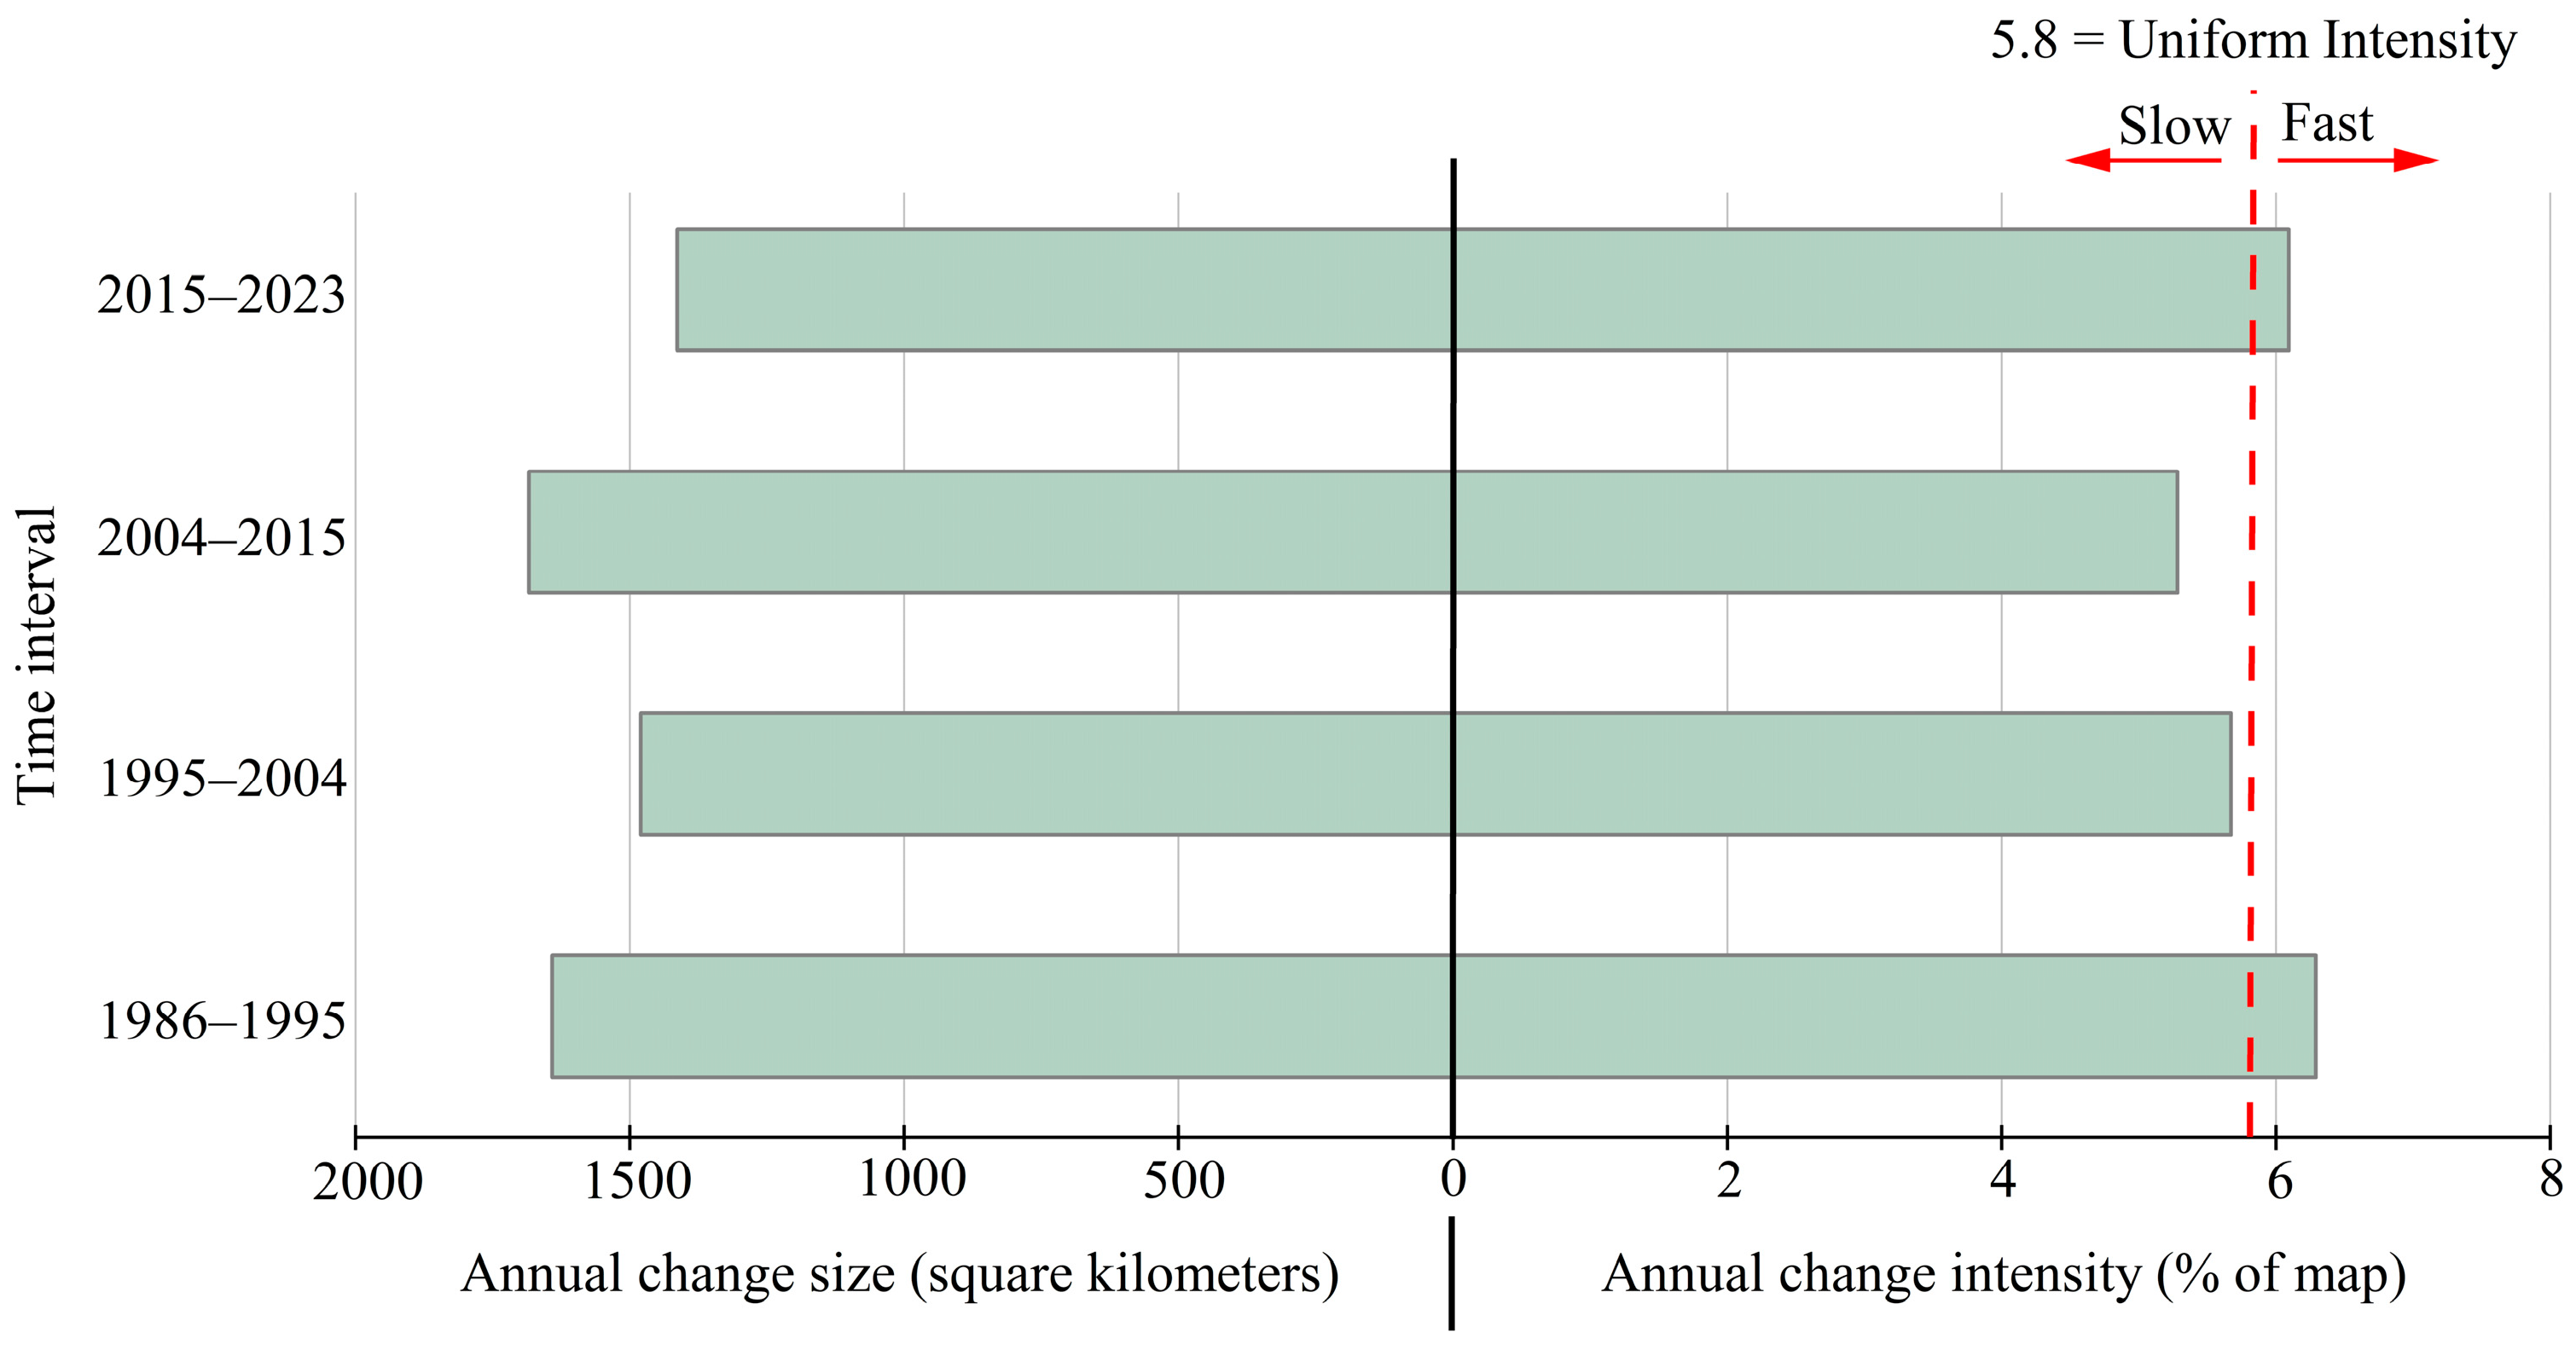
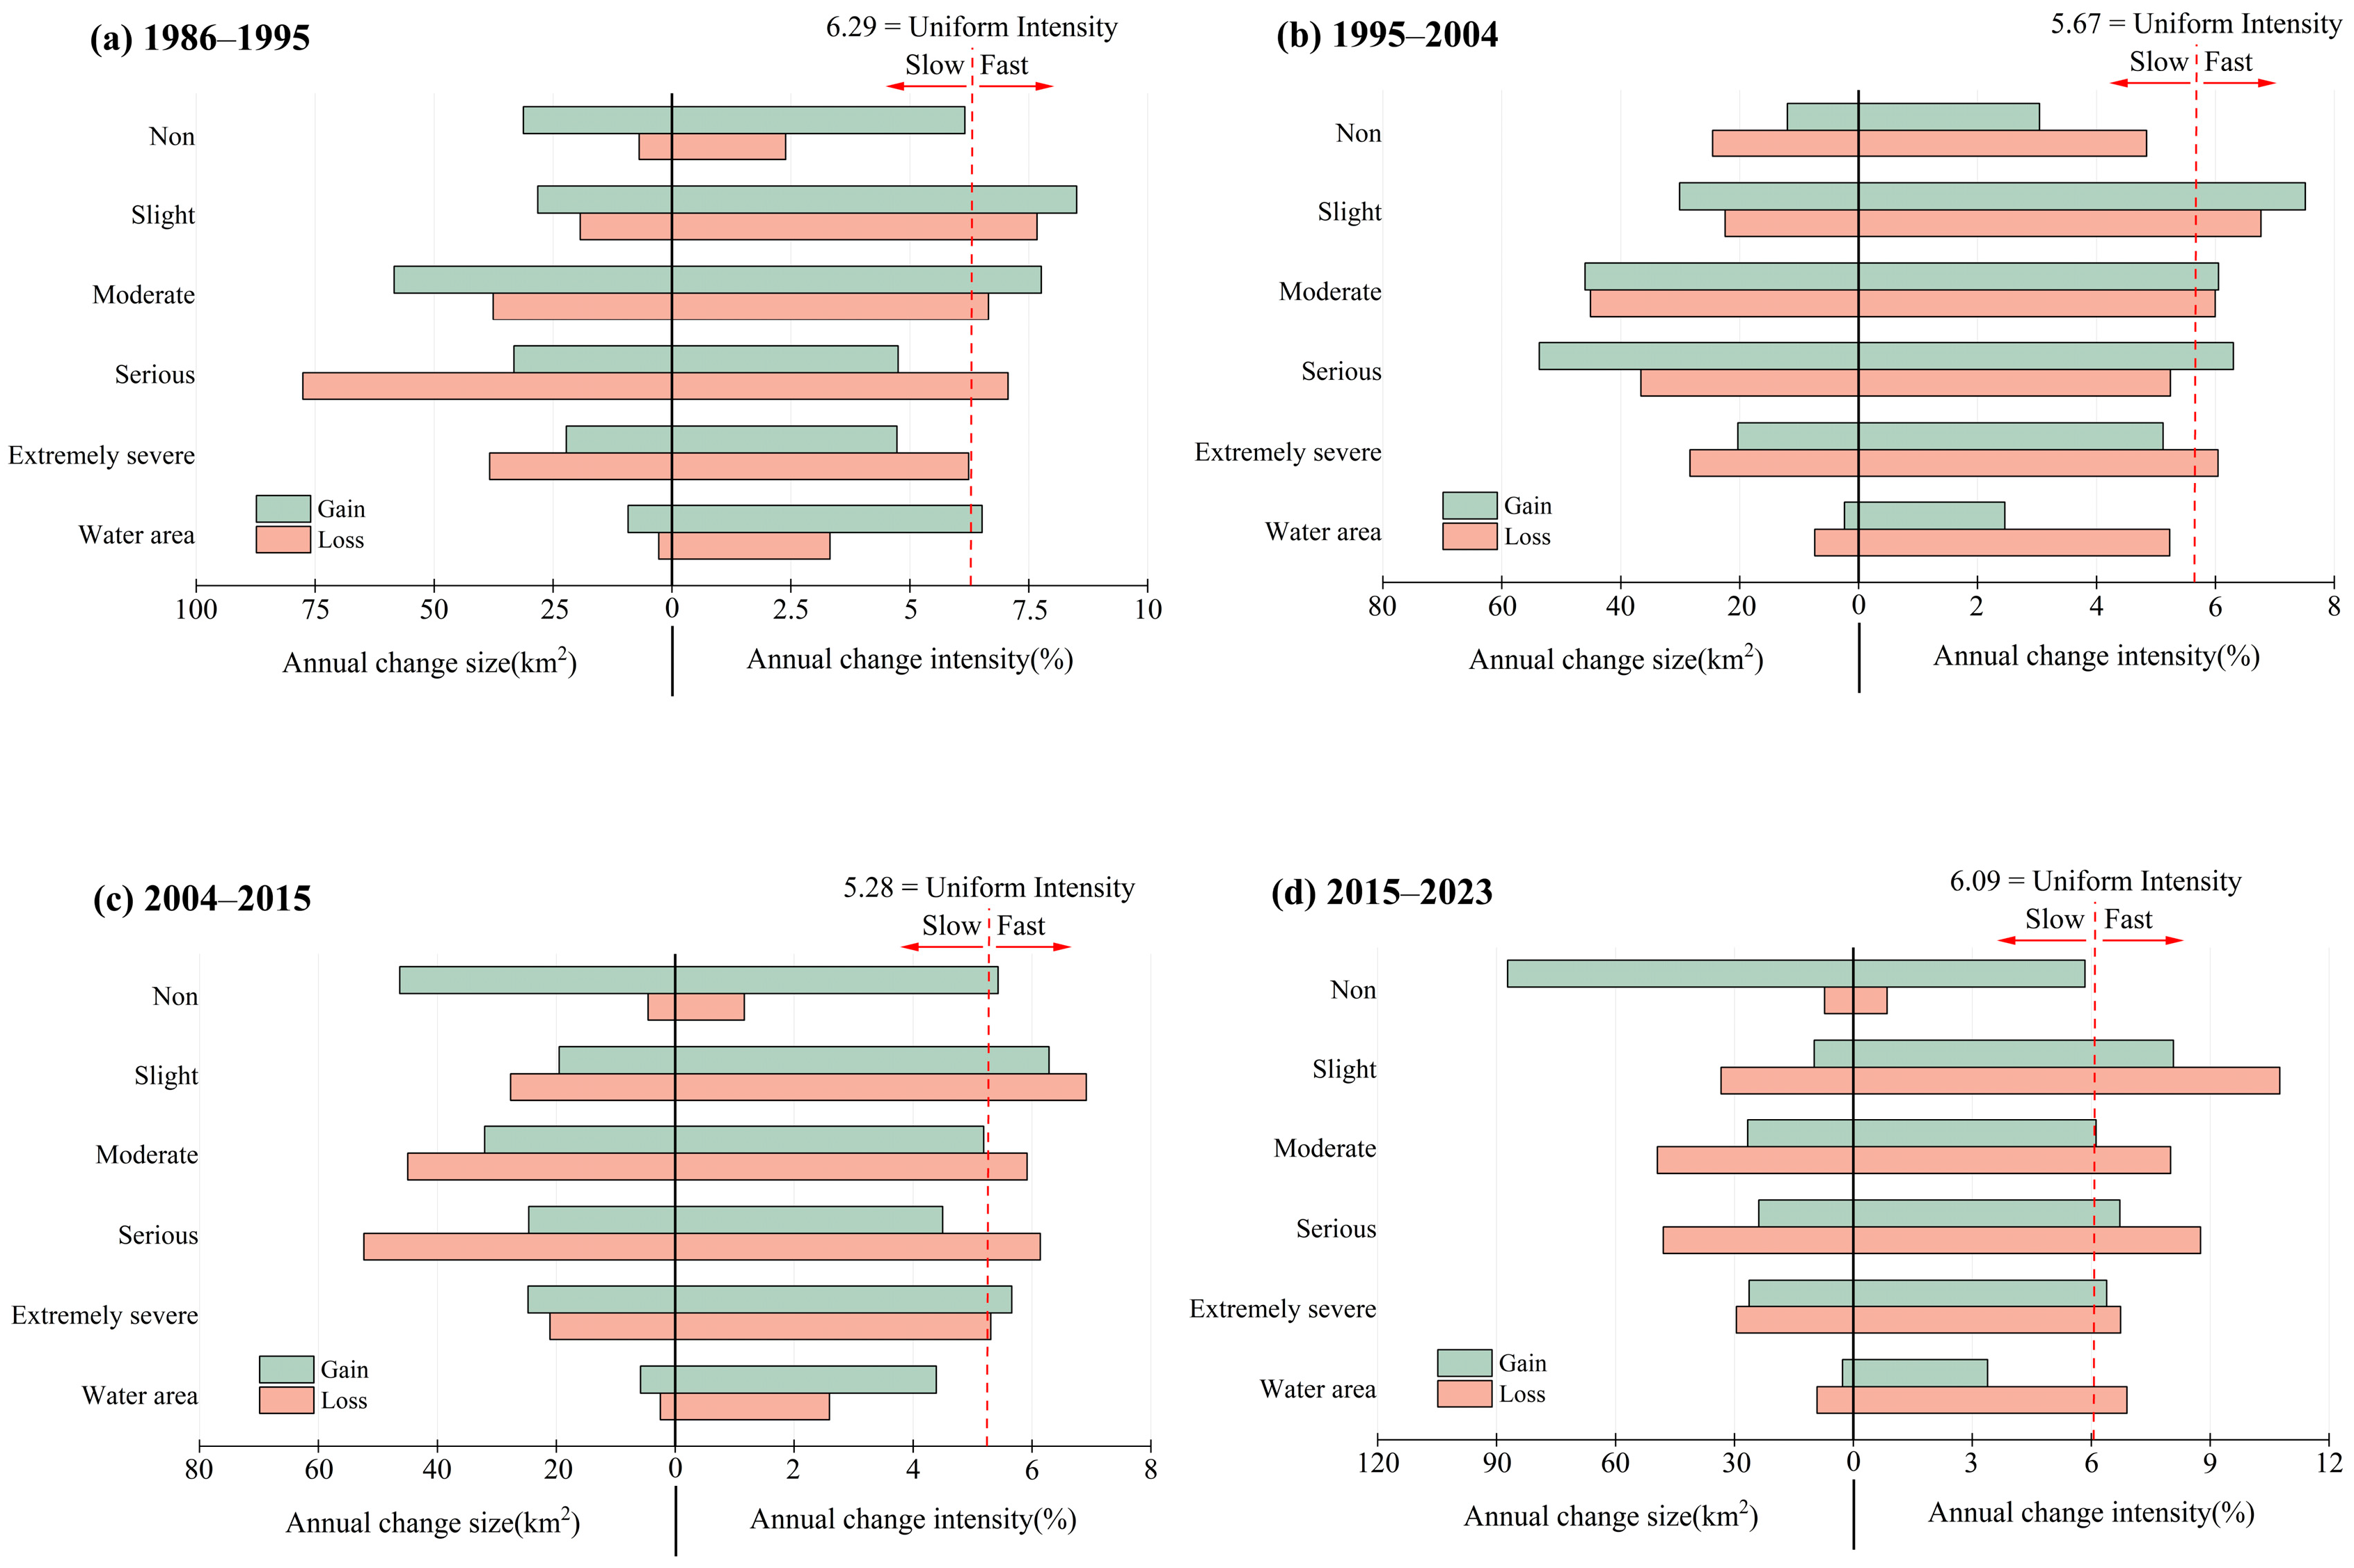
The interval level analysis examined the area and intensity of changes in sandy desertification land and water bodies across different time periods (Figure 5). In the figure, the left side of the axis shows the total area of sandy desertification land changes for each period, while the right side indicates the annual average change area, reflecting the overall transition intensity among different types of sandy desertification land. The red dashed line represents the overall annual average change area from 1986 to 2023; values to the right of the line indicate faster changes during that period, while values to the left indicate slower changes.
The results show that the annual average change areas in the periods 1986–1995 and 2015–2023 were above the overall average, indicating more intense changes in sandy desertification land during these two stages. Among them, the highest change intensity occurred during 1986–1995. In contrast, the change intensities during 1995–2004 and 2004–2015 were relatively mild.

3.3.2. Category Level

The category level analysis examined the increase and decrease in area and intensity of different types of sandy desertification land and water bodies within each time interval. In Figure 6, the left side of the axis shows the annual average area change for each land category, while the right side shows the annual average intensity. The red dashed line represents the mean intensity; values to the right of the line indicate more active changes in that land category, while values to the left suggest milder variations.
The results show that during 1986–1995 (Figure 6a), the increase in area and intensity of non, Slight, and Moderate sandy desertification land exceeded their respective decreases. In contrast, Serious and Extremely severe sandy desertification land exhibited the opposite trend. This indicates a reversal trend in sandy desertification during this period, primarily driven by the mitigation of Serious and Extremely severe sandy desertification land. From 1995 to 2004, Slight, Moderate, and Serious sandy desertification land showed increases in area and intensity that exceeded their reductions. In contrast, non- and Extremely severe sandy desertification land exhibited the opposite trend. This reflects an expansion of sandy desertification during this period, mainly driven by the growth of Slight, Moderate, and Serious sandy desertification land. From 2004 to 2015, the area and intensity of increases in non- and Extremely severe sandy desertification land surpassed the corresponding decreases. In contrast, Slight, Moderate, and Serious sandy desertification land exhibited the opposite trend. This indicates a reversal trend primarily driven by the mitigation of Slight, Moderate, and Serious sandy desertification land. From 2015 to 2023, non-sandy desertification land showed higher increases in area and intensity than decreases. All types of sandy desertification land exhibited the opposite pattern. This reflects an overall reversal trend in sandy desertification during this period, with all levels of sandy desertification land undergoing mitigation.
In summary, the sandy desertification conditions improved during the periods 1986–1995, 2004–2015, and 2015–2023, with the most significant improvement occurring between 2015 and 2023. In contrast, sandy desertification exhibited a worsening trend from 1995 to 2004.

3.3.3. Transition Level

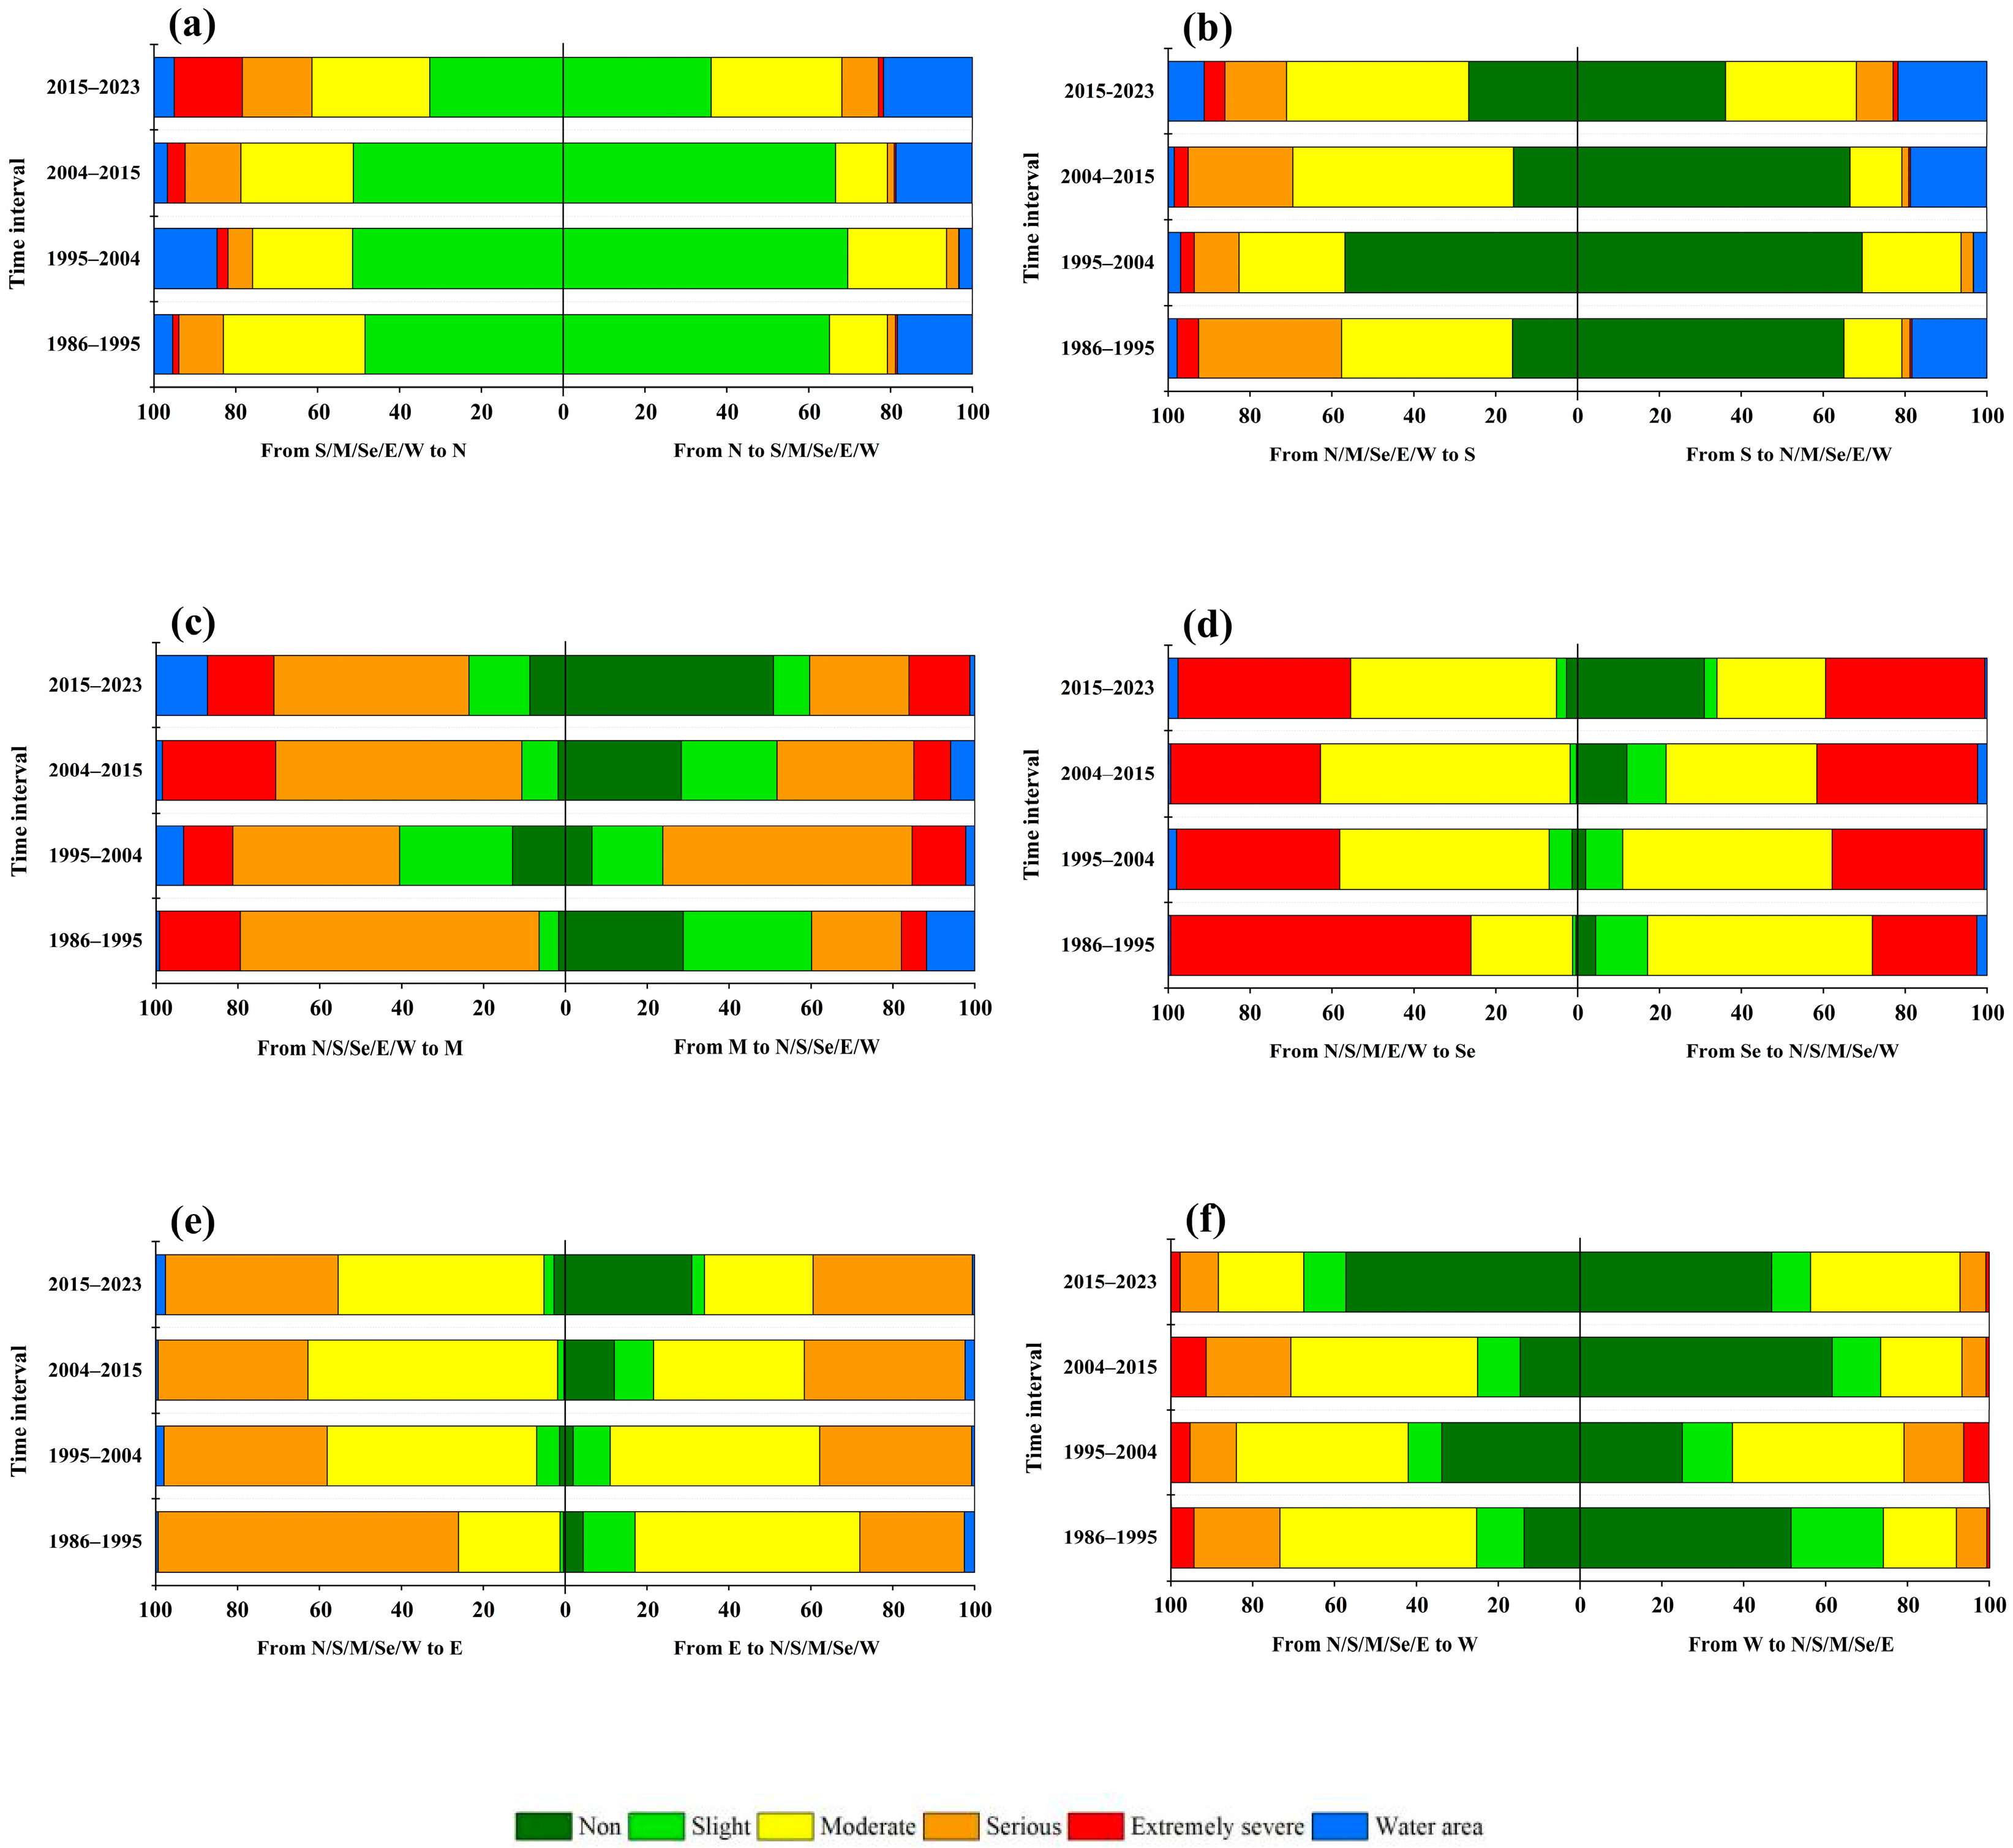
The transition level analysis examined the area and intensity of mutual conversions between different land categories. Figure 7 illustrates the transition areas. Taking Figure 7a as an example, the left side of the axis represents the percentage of land area converted from other categories into non-sandy desertification land, while the right side shows the percentage of area converted from non-sandy desertification land to other categories.
Figure 7a shows that the inflow and outflow of non-sandy desertification land primarily involved Slight sandy desertification land during each period. Figure 7b indicates that the conversions into and out of Slight sandy desertification land mainly occurred between non- and Moderate sandy desertification land. Figure 7c–e also reflect this adjacent-level transition pattern, indicating that sandy desertification land in Dengkou County mainly shifts between neighboring severity levels. In addition, transitions into and out of water bodies primarily involved non- and Moderate sandy desertification land.
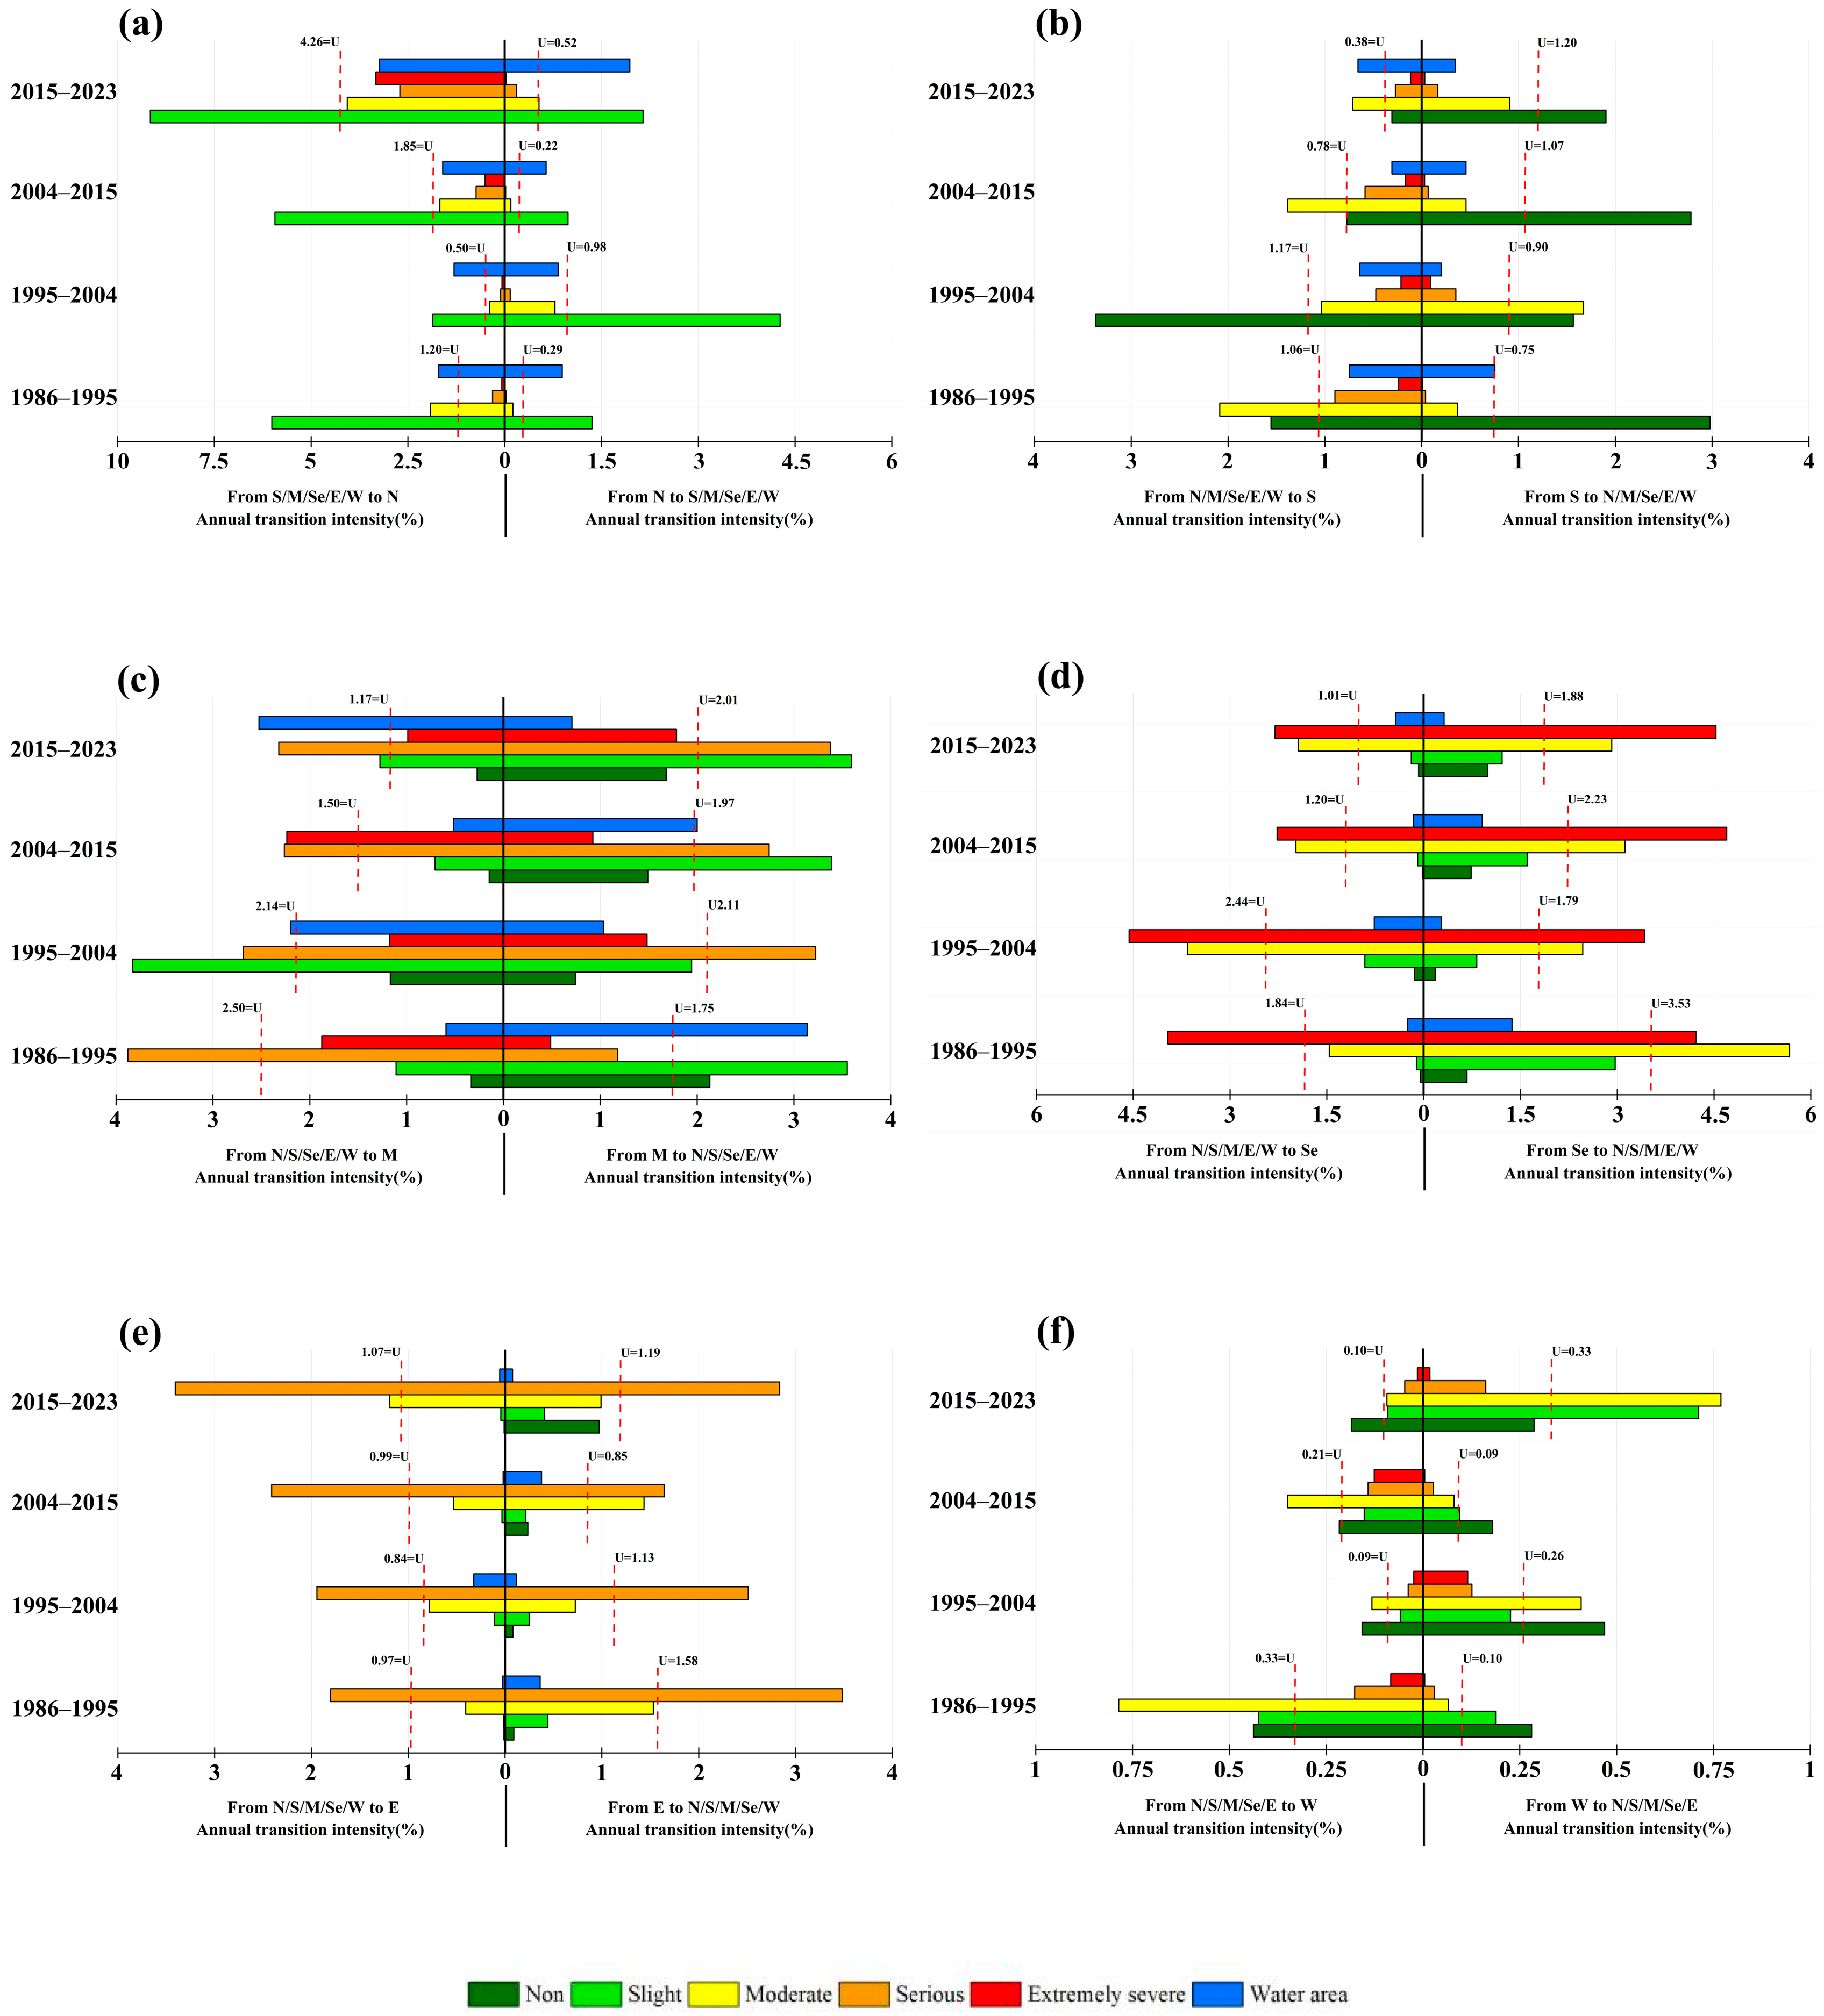
Figure 8 illustrates the transition intensity. Taking Figure 8a as an example, the left side of the axis represents the intensity of conversions from other land categories to non-sandy desertification land, while the right side represents the intensity of conversions from non-sandy desertification land to other categories. The red dashed line indicates the average intensity; values exceeding the line suggest more active transitions into or out of non-sandy desertification land, whereas values below the line indicate relatively weaker transition intensity.
Figure 8a shows that the most active transitions into and out of non-sandy desertification land during each period occurred with Slight sandy desertification land. Figure 8b–e also demonstrate the pattern of high transition intensity between adjacent severity levels. The periods 1986–1995, 2004–2015, and 2015–2023 exhibit a pattern of active transitions from more severe to less severe sandy desertification levels and relatively mild transitions in the opposite direction, indicating an overall improvement in sandy desertification during these stages. In contrast, the 1995–2004 period shows the opposite trend, suggesting a worsening of sandy desertification.

3.4. Driving Forces of Sandy Desertification

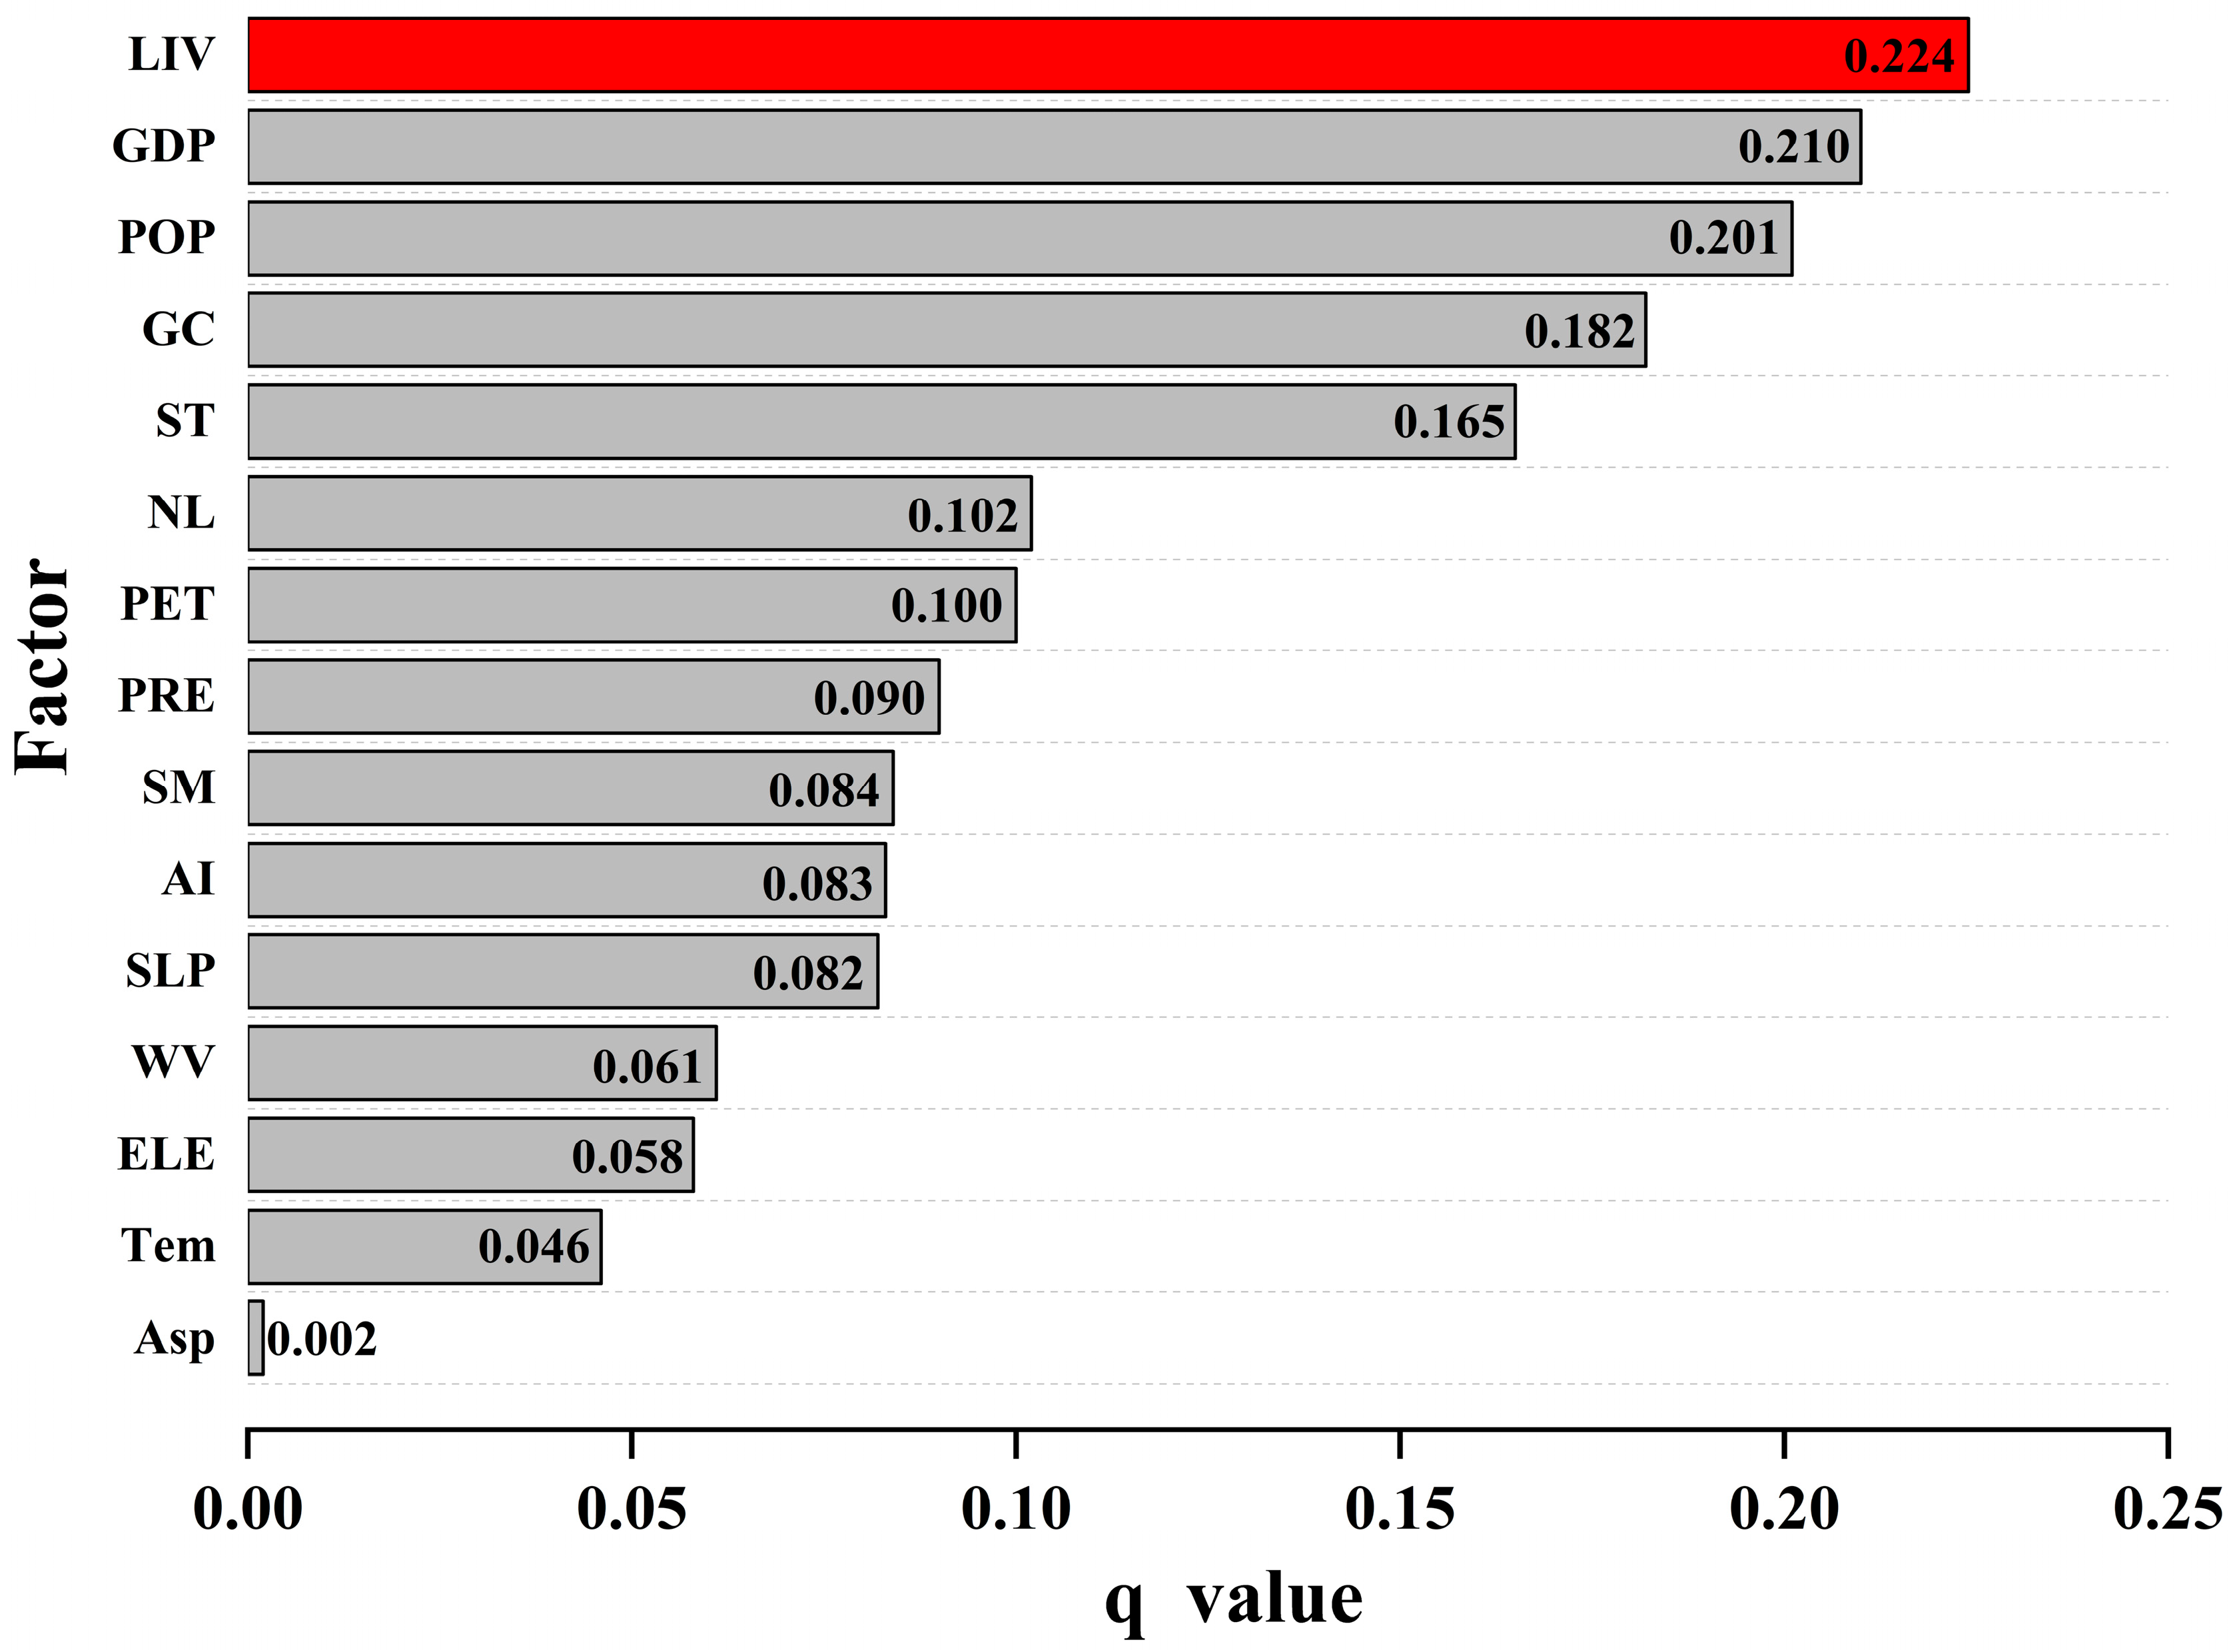
The factor detection results (Figure 9) indicated that livestock density, GDP, population density, geological conditions, soil type, and nighttime light exhibited relatively high q-values, suggesting strong explanatory power for the spatial distribution of sandy desertification. Among these, livestock density had the highest q-value at 0.224. Additionally, GDP (0.210) and population density (0.201) also ranked among the top three, all of which are anthropogenic, indicating that anthropogenic factors are the primary drivers of sandy desertification. Among natural factors, geological conditions showed the highest explanatory power (0.182), followed by soil type (0.165). Meteorological factors—including potential evapotranspiration, precipitation, wind velocity, and temperature—had moderate explanatory power, whereas topographic factors such as elevation, slope, and aspect contributed less significantly.
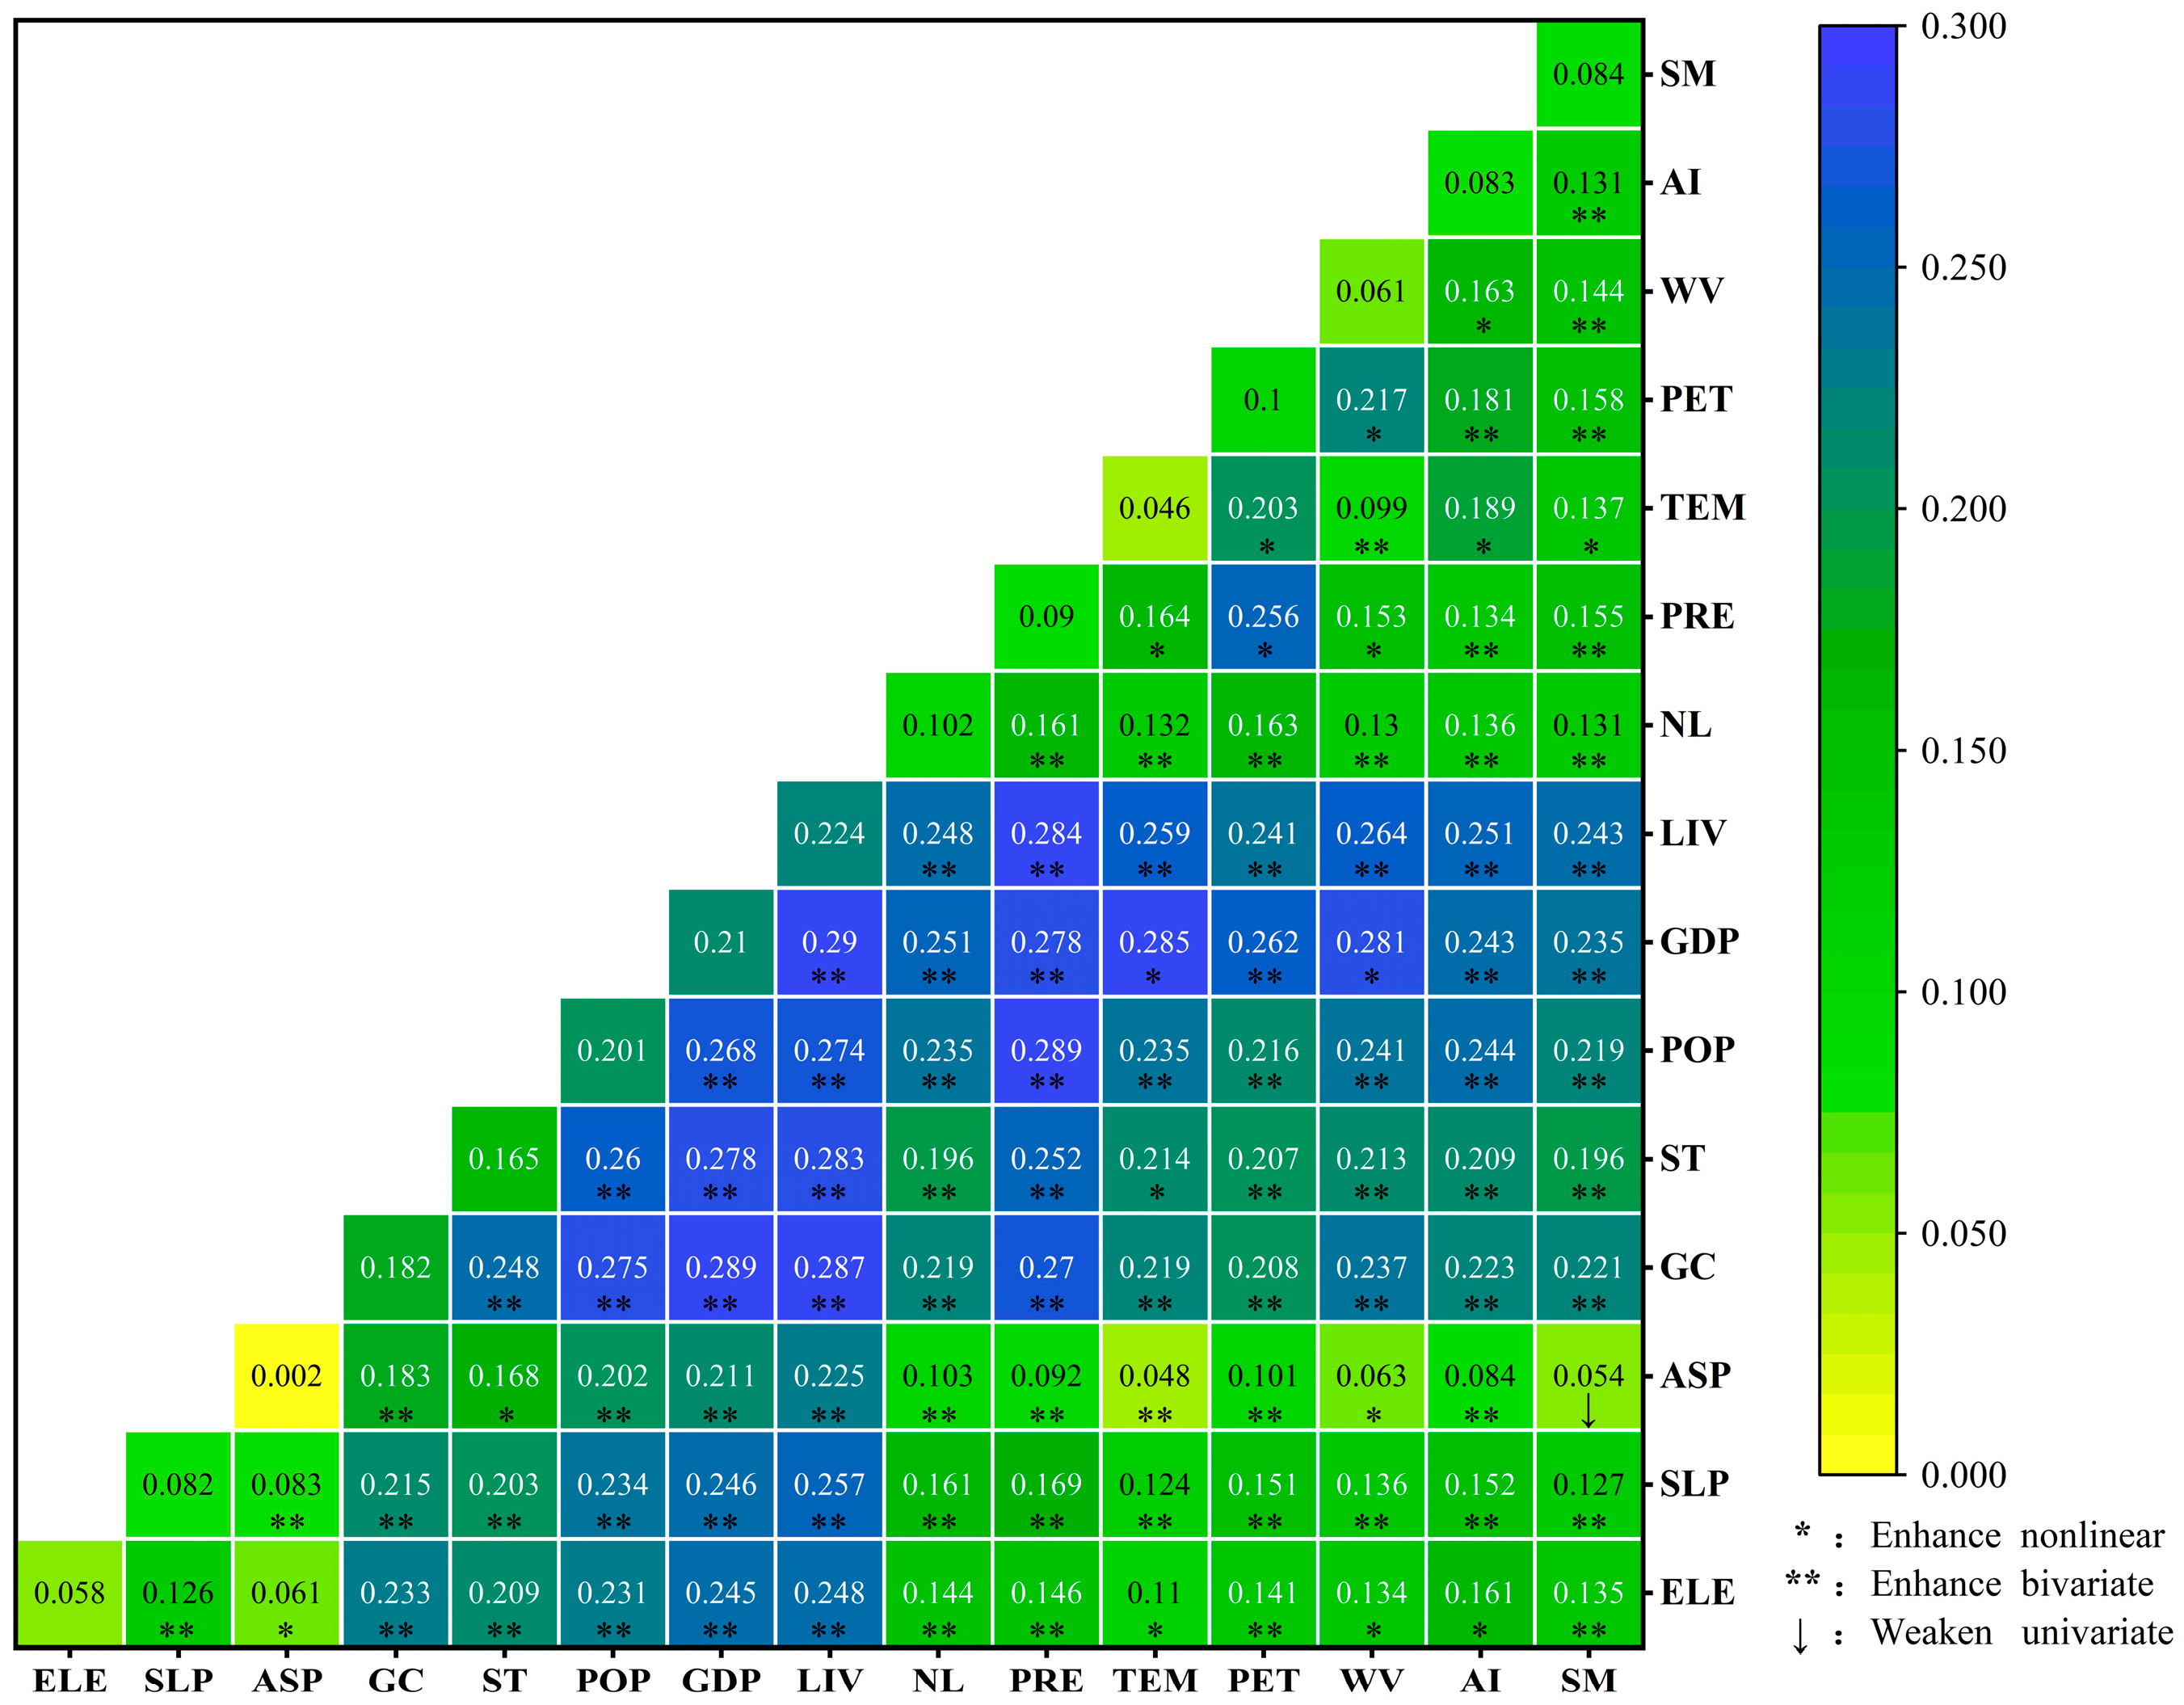
The occurrence and recovery of sandy desertification are not driven by a single factor, but rather the result of multiple factors acting in combination. Two-factor interaction detection can be used to assess whether the combined effect of two driving factors enhances or weakens the impact on sandy desertification. The results (Figure 10) showed that, except for the interaction between aspect and soil moisture, all two-factor interactions exhibit either bivariate enhancement or nonlinear enhancement. This suggests that interactions between paired factors can more effectively explain the driving mechanisms of sandy desertification. The interaction between livestock density and GDP demonstrated the highest explanatory power, with a q-value of 0.29. This was followed by GDP and geological conditions (0.289), population density and precipitation (0.289), livestock density and geological conditions (0.287), temperature and GDP (0.285), and livestock density and precipitation (0.284). Overall, interactions among anthropogenic, climatic, and environmental factors exhibit relatively high explanatory power, indicating that combinations of these factors significantly enhance their influence on sandy desertification in Dengkou County. In contrast, the explanatory power of interactions between topographic factors and other variables is relatively limited.

4. Discussion

4.1. Classification of Dengkou County

Dengkou County exhibits diverse geomorphic types, generally distributed from northwest to southeast as the towering Langshan Mountains, arid alluvial plains, the Ulan Buh Desert, and the Yellow River floodplain. These geomorphic zones differ significantly in surface sediment and vegetation characteristics, making it inappropriate to interpret sandy desertification using a uniform standard. Therefore, to enhance interpretation accuracy and ground validation, Dengkou County was divided into SDA, GDA, and MA based on its geomorphological, geological, and vegetation features. However, this study primarily relied on visual interpretation for regional classification and sandy desertification grading, which introduces a certain level of subjectivity. In the future, machine learning or multi-index models will be integrated with visual interpretation to reduce the subjective bias associated with visual interpretation. Meanwhile, where conditions permit, UAV technology will be introduced to refine the boundary delineation of different land categories, thereby improving classification accuracy and the representativeness of the dataset [57].

4.2. Spatial–Temporal Changes of Sandy Desertification

This study monitored the dynamics of sandy desertification in Dengkou County over the past four decades using remote sensing imagery and visual interpretation methods. The results indicated a significant reversal of sandy desertification in Dengkou County, consistent with the general trend reported by other researchers monitoring desertification in various regions of northern China [16,18,25,58]. This reversal is largely attributed to a series of ecological protection projects launched by the Chinese government since the early 21st century, including the “Three-North Shelterbelt Project”, the “Natural Forest Protection Project”, and the “Grain for Green Project”, all of which have promoted the overall restoration of desertification land in northern China [59,60]. Specifically, in response to national ecological policies, Dengkou County implemented various sand prevention and control measures, including “engineering-based sand fixation + shrub planting + degraded forest restoration + forest tending”, the “photovoltaic + Haloxylon Bunge + Atriplex canescens Nutt + Yellow River drip irrigation” model, and straw checkerboard sand fixation. Following the “Water Determines Green” principle, the county planned and established a new shelterbelt composed of trees, shrubs, and grasses along sand-crossing roads to serve as a windbreak and sand-fixing boundary. In addition, Dengkou County has carried out sand prevention and control practices since the 1950s, gradually developing the “Dengkou Model” and establishing a large-scale shelterbelt system totaling 308 km in length [61,62]. Subsequently, Dengkou County established “The Hatengtaohai National Nature Reserve in Inner Mongolia” and promoted ecological projects such as “Photovoltaic sandy desertification Control”, “Ant Forests”, and “Joint Prevention and Control of Sand Flow along the Yellow River Bank” [63,64,65,66].
Among the four study periods, sandy desertification worsened only during 1995–2004, accompanied by a substantial reduction in water bodies. Previous studies found that during 2000–2010, large areas of farmland were reclaimed in Dengkou County at the expense of forests, grasslands, and water bodies [43]. In the early stages of reclamation, the destruction of original vegetation and soil structure weakened the soil’s sand-fixation capacity, increasing the risk of wind and water erosion [67,68]. Particularly in arid regions, the accelerated evaporation of soil moisture further exacerbates sandy desertification [69].
Meanwhile, we found that transitions between different types of sandy desertification land were primarily between adjacent levels, consistent with other studies on sandy desertification and aligning with the adjacent-level transition rule in geography [9,70]. At the transition level, the inflow and outflow areas of water bodies were mainly associated with non- and moderately sandy desertification land. Field investigations revealed that in some areas, dense reed growth obscured the water surface, making it difficult for satellite imagery to accurately reflect water body information. During visual interpretation, such conditions often led to misclassification of water bodies as non-sandy desertification land. On the other hand, during artificial canal diversion, some Moderate sandy desertification land temporarily transformed into small lakes. However, as the diverted water volume decreased, these lakes gradually reverted to their original state of Moderate sandy desertification land.
Moreover, we found that the degree of sandy desertification in Dengkou County gradually intensified from the Hetao Plain toward the Ulan Buh Desert. This pattern can be attributed to the low wind erosion resistance of the Ulan Buh Desert and the prevailing northeast and southwest wind directions in the region, which cause sand materials to primarily drift northeastward, eroding the edges of the Hetao Plain [71,72].

4.3. Drivers of Sandy Desertification

The Geographical Detector was employed to quantitatively assess the driving effects of natural and anthropogenic factors on the process of sandy desertification. The results of the factor detector indicated that anthropogenic factors were the primary drivers of sandy desertification in the desert area of Dengkou County, which is consistent with findings from related studies [73,74]. This is mainly attributed to the construction of the Sanshenggong Water Conservancy Project in Dengkou County in 1959, which introduced artificial canal irrigation to the Hetao Plain [75]. Since then, China has continuously implemented a series of sand prevention and control policies, strengthening ecological management and environmental restoration [76,77]. With policy support and proactive human intervention, sandy desertification in Dengkou County has been effectively curbed and gradually improved over the past 40 years.
Among natural factors, geological conditions and soil types play a significant driving role in the process of sandy desertification. Dengkou County is located on the edge of the Ulan Buh Desert. Although most of its surface was covered by sand dunes 40 years ago, the underlying strata beneath the dunes vary considerably. Previous studies have shown that the geomorphology of the Ulan Buh Desert was mainly shaped by the disintegration of the Jilantai–Hetao paleolake and climate changes since the Late Quaternary. Over the past 10,000 years, the study area has experienced alternating expansion and contraction of lakes and deserts [33]. By the Han Dynasty (~2 ka), the region had a relatively favorable ecological environment, enabling agricultural settlement and large-scale land reclamation [32]. The formation of the modern desert landscape in the northern Ulan Buh Desert has been influenced by geological structures and climate, while large-scale land abandonment since the Han Dynasty has further intensified the desertification process [78,79]. Influenced by the degradation of the Jilantai–Hetao paleolake and the Yellow River’s course shifts that formed oxbow lakes, the central area of Dengkou County developed extensive ancient lacustrine strata. These strata are generally thinly covered by aeolian sands on top, while the sublayers are rich in clay, endowing the soil with water retention and wind erosion resistance—conditions favorable for farmland reclamation, afforestation, and other ecological restoration efforts [80,81]. Therefore, the geological characteristics of Dengkou County significantly influence the evolution of sandy desertification and provide favorable conditions for implementing desertification control projects.
Climatic factors such as precipitation, wind speed, temperature, and potential evapotranspiration have been proven to be major drivers of the sandy desertification process [38,82,83]. However, Dengkou County lies in a desert–oasis ecotone and benefits from Yellow River irrigation and shallow groundwater levels. These favorable conditions reduce the dependence of cultivated vegetation on natural precipitation, thereby weakening the driving role of precipitation in the local sandy desertification process [84,85]. In recent years, due to the implementation of policies and projects aimed at desertification control, anthropogenic factors have had a significant impact on sandy desertification, which has indirectly reduced the influence of climatic factors on sandy desertification over the past few decades [86]. However, from a long-term perspective, arid climate remains the core influencing factor. In addition, except for the mountainous areas, Dengkou County has a generally flat terrain with minor elevation and topographic variation, which weakens the role of topographic factors such as elevation, slope, and aspect in the local sandy desertification driving mechanisms [45].
The impact of two-factor interaction detection on sandy desertification is generally greater than that of factor detection, a finding consistent with previous studies [29,87]. In the factor detection results, climatic factors showed relatively low explanatory power. However, in bivariate interaction analysis, the influence of climatic factors was significantly enhanced due to the combined effect of anthropogenic factors. This indicates that the explanatory power for the sandy desertification process was greatly improved under the joint influence of natural and anthropogenic factors.
In recent years, under the background of China’s active promotion of ecological projects for desertification prevention and control, the results of the sixth national survey on desertification and land degradation indicated a “dual reversal” in both desertification and sandy desertification, characterized by continuous reductions in both affected area and severity [12]. These findings are consistent with our analysis. However, challenges such as groundwater overexploitation, ecosystem imbalance caused by large-scale desertification control projects and human interventions, as well as soil degradation resulting from overreliance on single plant species for sand control, remain prominent issues that need to be comprehensively addressed in practical engineering applications. With the increase in vegetation cover suppressing surface sand-dust activities, sandstorm events in northern China have generally shown a declining trend. However, in recent years, extreme climate events have continued to pose severe challenges to sandstorm control [88,89]. In reality, the overall situation of desertification control and sandy desert prevention in China remains critical [11]. Nonetheless, with the implementation of policies such as “Water Determines Green” and “Treating Water Resources as a Rigid Constraint”, desertification control is facing increasingly refined and stringent challenges.

5. Conclusions

Based on remote sensing imagery, this study monitored the changes in sandy desertification in Dengkou County over the past four decades using visual interpretation and field verification. By integrating both natural and anthropogenic factors, the main driving mechanisms were analyzed. The main findings are as follows:
(1)
The SDA in Dengkou County was primarily located at the junction of the Hetao Plain and the Ulan Buh Desert, covering 2899.64 km2, accounting for 78.73% of the county’s total area.
(2)
From 1986 to 2023, sandy desertification land in Dengkou County experienced a significant reversal, with non-sandy desertification land increasing by 1204.79 km2. Among all types, Serious sandy desertification land showed the largest reversal area of 743.21 km2. Spatially, the reversal exhibited a trend of expansion from the periphery toward the central and southwestern regions. The severity of sandy desertification gradually increased from the Hetao Plain to the Ulan Buh Desert. Overall, the central and eastern regions experienced effective mitigation of sandy desertification.
(3)
Sandy desertification land exhibited a pattern of adjacent-level transitions. From 1986–1995, 2004–2015, and 2015–2023, land with more severe sandy desertification tended to shift toward lighter categories, indicating a certain degree of improvement, with the 2015–2023 period showing the most significant recovery. In contrast, the trend during 1995–2004 was the opposite, with sandy desertification worsening.
(4)
Over the past four decades, anthropogenic factors were the primary drivers of sandy desertification land changes in Dengkou County, with livestock density having the strongest explanatory power (q = 0.224). Among natural factors, geological conditions had the strongest influence (q = 0.182). Moreover, two-factor interactions exhibited stronger explanatory power than single factors. Interactions among anthropogenic, climatic, and environmental factors generally demonstrated higher explanatory capability.
Although sandy desertification in Dengkou County has been significantly reversed due to ecological engineering and anthropogenic interventions, the potential secondary environmental issues should not be overlooked. Future desertification control efforts should scientifically evaluate the relative influence of human and natural factors, and incorporate key characteristics such as geological conditions, groundwater, and soil properties. This approach will help optimize afforestation area selection and vegetation configuration for improved accuracy and sustainability, offering a valuable reference for surrounding regions and even the entire country in combating desertification.

Author Contributions

Conceptualization, Z.Z. and S.Z.; methodology, Z.Z. and S.Z.; software, Z.Z., L.M. and C.E.; validation, Z.Z., S.Z., C.W. and X.D.; formal analysis, Z.Z.; investigation, Z.Z., S.Z., C.W. and X.D.; resources, S.Z., P.B. and W.Z.; data curation, Z.Z. and S.Z.; writing—original draft preparation, Z.Z.; writing—review and editing, Z.Z. and S.Z.; visualization, Z.Z., L.M. and C.E.; supervision, P.B. and W.Z.; project administration, S.Z., P.B. and W.Z.; funding acquisition, S.Z., P.B. and W.Z. All authors have read and agreed to the published version of the manuscript.

Funding

This study was supported by the China Geological Survey Project (DD20230701102, DD20240701603, DD20230469), the funding project of Northeast Geological S&T Innovation Center of China Geological Survey (NO. QCJJ2024-32), and the Natural Science Foundation of Inner Mongolia Autonomous Region of China (NO. 2025QN04005).

Data Availability Statement

Data sharing is not applicable.

Acknowledgments

We would like to thank the National Earth System Science Data Center, National Science & Technology Infrastructure of China and the Data Center for Resources and Environmental Sciences Chinese-Academy of Sciences.

Conflicts of Interest

The authors declare no conflict of interest.

References

  1. Zhang, Z.; Huisingh, D. Combating desertification in China: Monitoring, control, management and revegetation. J. Clean. Prod. 2018, 182, 765–775. [Google Scholar] [CrossRef]
  2. Cheng, L.; Lu, Q.; Wu, B.; Yin, C.; Bao, Y.; Gong, L. Estimation of the costs of desertification in China: A critical review. Land Degrad. Dev. 2018, 29, 975–983. [Google Scholar] [CrossRef]
  3. Miao, L.; Moore, J.C.; Zeng, F.; Lei, J.; Ding, J.; He, B.; Cui, X. Footprint of research in desertification management in China. Land Degrad. Dev. 2015, 26, 450–457. [Google Scholar] [CrossRef]
  4. Wang, T. Several Issues in China's Desertification Research—3. Key Areas for Desertification Research and Control. J. Desert Res. 2004, 1, 3–11. (In Chinese) [Google Scholar]
  5. Barbier, E.B.; Hochard, J.P. Land degradation and poverty. Nat. Sustain. 2018, 1, 623–631. [Google Scholar] [CrossRef]
  6. Dharumarajan, S.; Bishop, T.F.; Hegde, R.; Singh, S.K. Desertification vulnerability index—An effective approach to assess desertification processes: A case study in Anantapur District, Andhra Pradesh, India. Land Degrad. Dev. 2018, 29, 150–161. [Google Scholar] [CrossRef]
  7. Kalyan, S.; Sharma, D.; Sharma, A. Spatio-temporal variation in desert vulnerability using desertification index over the Banas River Basin in Rajasthan, India. Arab. J. Geosci. 2021, 14, 54. [Google Scholar] [CrossRef]
  8. Wang, T.; Zhu, Z.D. Several Issues in China's Desertification Research—1. The Concept and Connotation of Desertification. J. Desert Res. 2003, 3, 3–8. (In Chinese) [Google Scholar]
  9. Li, J.; Cao, C.; Xu, M.; Yang, X.; Gao, X.; Wang, K.; Guo, H.; Yang, Y. A 20-Year Analysis of the Dynamics and Driving Factors of Grassland Desertification in Xilingol, China. Remote Sens. 2023, 15, 5716. [Google Scholar] [CrossRef]
  10. Yang, X.; Zhang, K.; Jia, B.; Ci, L. Desertification assessment in China: An overview. J. Arid. Environ. 2005, 63, 517–531. [Google Scholar] [CrossRef]
  11. Wang, X.; Ma, Q. Major Progress, Evolution and Prospects of China’s Desertification Control Research in the Past 45 Years—A Bibliometric Analysis Based on Citespace. Arid. Land Geogr. 2025, 48, 234–246. (In Chinese) [Google Scholar]
  12. Zan, G.; Wang, C.; Li, F.; Liu, Z.; Sun, T. Main Results and Analysis of the Sixth National Survey on Desertification and Land Degradation. For. Resour. Manag. 2023, 1, 001. (In Chinese) [Google Scholar]
  13. Yang, X.; Cai, M.; Ye, P.; Ye, M.; Li, C.; Wu, H.; Lu, J.; Wang, T.; Zhao, Z.; Lu, Y. Provenance of aeolian sands in the Hetao Plain, northwestern China. Aeolian Res. 2018, 32, 92–101. [Google Scholar] [CrossRef]
  14. Luan, X.-B.; Wu, P.-T.; Sun, S.-K.; Li, X.-L.; Wang, Y.-B.; Gao, X.-R. Impact of land use change on hydrologic processes in a large plain irrigation district. Water Resour. Manag. 2018, 32, 3203–3217. [Google Scholar] [CrossRef]
  15. Wang, R.; Xia, H.; Qin, Y.; Niu, W.; Pan, L.; Li, R.; Zhao, X.; Bian, X.; Fu, P. Dynamic monitoring of surface water area during 1989–2019 in the Hetao plain using landsat data in Google Earth Engine. Water 2020, 12, 3010. [Google Scholar] [CrossRef]
  16. Jiang, Z.; Ni, X.; Xing, M. A study on spatial and temporal dynamic changes of desertification in northern China from 2000 to 2020. Remote Sens. 2023, 15, 1368. [Google Scholar] [CrossRef]
  17. McGinnies, W.G. Desert Research: Selected References 1965-1968. (With an Appendix of Reference Prior to 1965 and Permuted Title Index) Compiled by Patricia Paylore and WG McGinnies; University of Arizona: Tucson, AZ, USA, 1969. [Google Scholar]
  18. Guo, B.; Zang, W.; Han, B.; Yang, F.; Luo, W.; He, T.; Fan, Y.; Yang, X.; Chen, S. Dynamic monitoring of desertification in Naiman Banner based on feature space models with typical surface parameters derived from LANDSAT images. Land Degrad. Dev. 2020, 31, 1573–1592. [Google Scholar] [CrossRef]
  19. Wang, Y.; Zhang, J.; Tong, S.; Guo, E. Monitoring the trends of aeolian desertified lands based on time-series remote sensing data in the Horqin Sandy Land, China. Catena 2017, 157, 286–298. [Google Scholar] [CrossRef]
  20. Hu, G.; Dong, Z.; Lu, J.; Yan, C. Driving forces responsible for aeolian desertification in the source region of the Yangtze River from 1975 to 2005. Earth Sci. 2012, 66, 257–263. [Google Scholar] [CrossRef]
  21. Zhang, C.-L.; Li, Q.; Shen, Y.-P.; Zhou, N.; Wang, X.-S.; Li, J.; Jia, W.-R. Monitoring of aeolian desertification on the Qinghai-Tibet Plateau from the 1970s to 2015 using Landsat images. Sci. Total Environ. 2018, 619, 1648–1659. [Google Scholar] [CrossRef]
  22. Duan, H.-C.; Wang, T.; Xue, X.; Liu, S.-L.; Guo, J. Dynamics of aeolian desertification and its driving forces in the Horqin Sandy Land, Northern China. Environ. Monit. Assess. 2014, 186, 6083–6096. [Google Scholar] [CrossRef]
  23. Zhao, H.; Yan, C.; Li, S.; Wang, Y. Remote Sensing Monitoring and Driving Force Analysis of Land Desertification in the Yellow River Basin from 2000 to 2020. J. Desert Res. 2023, 43, 127–137. (In Chinese) [Google Scholar]
  24. Zeng, Y.; Xiang, N.; Feng, Z.; Xv, H. Study on Albedo-NDVI Feature Space and Remote Sensing Monitoring Index for Desertification. Sci. Geogr. Sin. 2006, 26, 75–81. (In Chinese) [Google Scholar]
  25. Bai, Z.; Han, L.; Jiang, X.; Liu, M.; Li, L.; Liu, H.; Lu, J. Spatiotemporal evolution of desertification based on integrated remote sensing indices in Duolun County, Inner Mongolia. Ecol. Inform. 2022, 70, 101750. [Google Scholar]
  26. Feng, K.; Wang, T.; Liu, S.; Kang, W.; Chen, X.; Guo, Z.; Zhi, Y. Monitoring desertification using machine-learning techniques with multiple indicators derived from MODIS images in Mu Us Sandy Land, China. Remote Sens. 2022, 14, 2663. [Google Scholar] [CrossRef]
  27. Chen, S.; Ren, H.; Liu, R.; Tao, Y.; Zheng, Y.; Liu, H. Mapping sandy land using the new sand differential emissivity index from thermal infrared emissivity data. IEEE Trans. Geosci. Remote Sens. 2020, 59, 5464–5478. [Google Scholar] [CrossRef]
  28. Wang, S.; Han, L.; Yang, J.; Li, Y.; Zhao, Q.; Liu, Y.; Wu, H. An Improved Method for Classifying Desertification Grades Based on Multi-Index Fusion. Bulletion Surv. Mapp. 2021, 4, 8–12. (In Chinese) [Google Scholar]
  29. Han, J.; Wang, J.; Chen, L.; Xiang, J.; Ling, Z.; Li, Q.; Wang, E. Driving factors of desertification in Qaidam Basin, China: An 18-year analysis using the geographic detector model. Ecol. Indic. 2021, 124, 107404. [Google Scholar] [CrossRef]
  30. Ngabire, M.; Wang, T.; Liao, J.; Sahbeni, G. Quantitative analysis of desertification-driving mechanisms in the Shiyang River Basin: Examining Interactive effects of Key factors through the Geographic detector model. Remote Sens. 2023, 15, 2960. [Google Scholar] [CrossRef]
  31. Zhi, Y.; Liu, S.; Wang, T.; Duan, H.; Kang, W. Quantifying the impact of natural and human activity factors on desertification in the Qinghai-Tibetan Plateau. Catena 2024, 246, 108392. [Google Scholar] [CrossRef]
  32. Zhao, H.; Li, G.; Sheng, Y.; Jin, M.; Chen, F. Early–middle Holocene lake-desert evolution in northern Ulan Buh Desert, China. Palaeogeogr. Palaeoclimatol. Palaeoecol. 2012, 331, 31–38. [Google Scholar] [CrossRef]
  33. Chen, F.; Li, G.; Zhao, H.; Jin, M.; Chen, X.; Fan, Y.; Liu, X.; Wu, D.; Madsen, D. Landscape evolution of the Ulan Buh Desert in northern China during the late Quaternary. Quat. Res. 2014, 81, 476–487. [Google Scholar] [CrossRef]
  34. Wang, J.; Xu, C. Geographical Detector: Principles and Prospects. Acta Geogr. Sin. 2017, 72, 116–134. (In Chinese) [Google Scholar]
  35. Lu, R.; Liu, S.; Duan, H.; Kang, W.; Zhi, Y. Combining the SHAP Method and Machine Learning Algorithm for Desert Type Extraction and Change Analysis on the Qinghai–Tibetan Plateau. Remote Sens. 2024, 16, 4414. [Google Scholar] [CrossRef]
  36. Wang, G.; Peng, W.; Zhang, L. Estimate of population density and diagnosis of main factors of spatial heterogeneity in the metropolitan scale, western China. Heliyon. 2023, 9, e16285. [Google Scholar] [CrossRef]
  37. Qin, H.; Schaefer, D.A.; Shen, T.; Wang, J.; Liu, Z.; Chen, H.; Hu, P.; Zhu, Y.; Cheng, J.; Wu, J.; et al. Drought Driving Factors as Revealed by Geographic Detector Model and Random Forest in Yunnan, China. Forests 2025, 16, 505. [Google Scholar] [CrossRef]
  38. Wang, Y.; Guo, E.; Kang, Y.; Ma, H. Assessment of land desertification and its drivers on the Mongolian plateau using intensity analysis and the geographical detector technique. Remote Sens. 2022, 14, 6365. [Google Scholar] [CrossRef]
  39. Pei, L.; Wang, C.; Sun, L.; Wang, L. Temporal and spatial variation (2001–2020) characteristics of wind speed in the water erosion area of the typical black soil region, northeast China. Int. J. Environ. Res. Public Health 2022, 19, 10473. [Google Scholar] [CrossRef]
  40. Ma, H.; Wang, Y.; Guo, E. Remote Sensing Monitoring of Land Desertification in Ongniud Banner Based on GEE. Arid. Zone Res. 2023, 40, 504–516. (In Chinese) [Google Scholar]
  41. Deng, Z.; Quan, B. Intensity analysis to communicate detailed detection of land use and land cover change in Chang-Zhu-Tan Metropolitan Region, China. Forests 2023, 14, 939. [Google Scholar] [CrossRef]
  42. Aldwaik, S.Z.; Pontius, R.G., Jr. Intensity analysis to unify measurements of size and stationarity of land changes by interval, category, and transition. Landsc. Urban Plan. 2012, 106, 103–114. [Google Scholar] [CrossRef]
  43. Ge, G.; Zhang, J.; Chen, X.; Liu, X.; Hao, Y.; Yang, X.; Kwon, S. Effects of land use and land cover change on ecosystem services in an arid desert-oasis ecotone along the Yellow River of China. Ecol. Eng. 2022, 176, 106512. [Google Scholar] [CrossRef]
  44. Yu, Q.; Yue, D.; Zhang, Q.; Lv, Q.; Li, N.; Hou, H. Landscape Pattern Evolution and Ecological Network Construction in Dengkou County. J. Desert Res. 2017, 37, 601–609. (In Chinese) [Google Scholar]
  45. Yu, Q.; Yue, D.; Wang, J.; Zhang, Q.; Li, Y.; Yu, Y.; Chen, J.; Li, N. The optimization of urban ecological infrastructure network based on the changes of county landscape patterns: A typical case study of ecological fragile zone located at Deng Kou (Inner Mongolia). J. Clean. Prod. 2017, 163, S54–S67. [Google Scholar] [CrossRef]
  46. Ma, H.; Yue, D.; Yang, D.; Yu, Q.; Zhang, Q.; Huang, Y. Interpolation Study of Groundwater Table Depth Based on Data Assimilation. Trans. Chin. Soc. Agric. Mach. 2017, 48, 206–214. (In Chinese) [Google Scholar]
  47. Yu, Q.; Yue, D.; Yang, D.; Ma, H.; Zhang, Q.; Yin, B. Optimization of Ecological Node Layout Based on the BCBS Model. Trans. Chin. Soc. Agric. Mach. 2016, 47, 329–336. (In Chinese) [Google Scholar]
  48. Zhang, L.; Ren, Z.; Chen, B.; Gong, P.; Xu, B.; Fu, H. A prolonged artificial nighttime-light dataset of China (1984–2020). Sci. Data 2024, 11, 414. [Google Scholar] [CrossRef] [PubMed]
  49. Gilbert, M.; Nicolas, G.; Cinardi, G.; Van Boeckel, T.P.; Vanwambeke, S.O.; Wint, G.; Robinson, T.P. Global distribution data for cattle, buffaloes, horses, sheep, goats, pigs, chickens and ducks in 2010. Sci. Data 2018, 5, 180227. [Google Scholar] [CrossRef] [PubMed]
  50. Gao, J.; Wu, B.; Pang, Y.; Su, Z.; Hasi, E.; Luo, F.; Bian, K. Grain Size Characteristics of Surface Sediments on the Accumulation Gobi in the Eastern Foothills of Langshan Mountains, Inner Mongolia. J. Arid. Land Resour. Environ. 2020, 34, 97–103. (In Chinese) [Google Scholar]
  51. State Forestry Administration of China. Technical Code of Practice on the Sandified Land Monitoring (GB/T 24255-2009); China Standards Press: Beijing, China, 2009.
  52. Feng, K.; Wang, T.; Liu, S.; Yan, C.; Kang, W.; Chen, X.; Guo, Z. Path analysis model to identify and analyse the causes of aeolian desertification in Mu Us Sandy Land, China. Ecol. Indic. 2021, 124, 107386. [Google Scholar] [CrossRef]
  53. Nyamekye, C.; Kwofie, S.; Ghansah, B.; Agyapong, E.; Boamah, L.A. Assessing urban growth in Ghana using machine learning and intensity analysis: A case study of the New Juaben Municipality. Land Use Policy 2020, 99, 105057. [Google Scholar] [CrossRef]
  54. Shoyama, K.; Braimoh, A.K.; Avtar, R.; Saito, O. Land transition and intensity analysis of cropland expansion in Northern Ghana. Environ. Manag. 2018, 62, 892–905. [Google Scholar] [CrossRef]
  55. Wang, B.; Si, J.; Jia, B.; He, X.; Zhou, D.; Zhu, X.; Liu, Z.; Ndayambaza, B.; Bai, X. Monitoring Spatial-Temporal Variability of Vegetation Coverage and Its Influencing Factors in the Yellow River Source Region from 2000 to 2020. Remote Sens. 2024, 16, 4772. [Google Scholar] [CrossRef]
  56. Wang, X.; Bao, Y. Discussion on Research Methods for Dynamic Land Use Change. Prog. Geogr. 1999, 18, 83–89. (In Chinese) [Google Scholar]
  57. Xu, X.; Liu, L.; Han, P.; Gong, X.; Zhang, Q. Accuracy of vegetation indices in assessing different grades of grassland desertification from UAV. Int. J. Environ. Res. Public Health 2022, 19, 16793. [Google Scholar] [CrossRef]
  58. Li, T.; Wang, Y.; Fan, X.; Wang, L.; Li, X.; Zhao, L.; Kattel, G.R.; Guo, X.; Fan, M. Spatiotemporal changes of desertification areas in the Alxa Desert obtained from satellite imagery. Earth Surf. Process. Landf. 2025, 50, e70020. [Google Scholar] [CrossRef]
  59. Zhai, J.; Wang, L.; Liu, Y.; Wang, C.; Mao, X. Assessing the effects of China’s three-north shelter forest program over 40 years. Sci. Total Environ. 2023, 857, 159354. [Google Scholar] [CrossRef]
  60. Zheng, J.; Wei, X.; Liu, Y.; Liu, G.; Wang, W.; Liu, W. Review of regional carbon counting methods for the Chinese major ecological engineering programs. J. For. Res. 2016, 27, 727–738. [Google Scholar] [CrossRef]
  61. Cui, G.; Xiao, C.; Lei, J.; Li, X.; Bao, Y.; Lu, Q. Major Power Governance: Strategic Choices and Future Vision for Desertification Control in China. Bull. Chin. Acad. Sci. 2023, 38, 943–955. (In Chinese) [Google Scholar]
  62. Li, Z. Desertification Control Strategy in the Northern Reclamation Area of the Ulan Buh Desert. J. Desert Res. 1987, 7, 49–53. (In Chinese) [Google Scholar]
  63. Zhang, J.; Qian, Z.; Xu, W.; Zhang, H.; Wang, Z. Assessment of Ten-Year Changes (2000–2010) in Ecosystem Patterns of National Nature Reserves. Acta Ecologica Sinica. 2017, 37, 8067–8076. (In Chinese) [Google Scholar]
  64. Liu, Y.; Zhang, J.; Mu, R.; Wang, D.; Wang, Z.; An, J.; Li, X. Effects of Two Ecological Governance Measures for Photovoltaic Power Stations on Plant Growth and Soil Nutrients. Plants 2025, 14, 797. [Google Scholar] [CrossRef]
  65. Ma, K.; Xu, Y.; Fang, F. Study on Temperature and Precipitation Changes from 1959 to 2018 in Ant Forest Plantation Area, Ordos City. J. Water Resour. Water Eng. 2019, 30, 109–115. (In Chinese) [Google Scholar]
  66. Liao, J.; Du, Q. Collaborative Governance of the Yellow River Basin: Practical Needs, Implementation Paths and Legislative Guarantee. China Popul. Resour. Environ. 2021, 31, 39–46. (In Chinese) [Google Scholar]
  67. Jia, K.; Zhang, J.; Ma, Z.; Ye, W. Study on Land Use Change and Its Response to Desertification in Ecologically Fragile Areas: A Case Study of the Central Arid Zone of Ningxia. J. Arid. Land Resour. Environ. 2011, 25, 98–103. (In Chinese) [Google Scholar]
  68. Liu, Z.; Yu, H.; Wang, H. Principles and Implementation Priorities of Integrated Management of 'Mountains, Rivers, Forests, Farmlands, Lakes, Grasslands, and Deserts' in the Horqin Sandy Land. Chin. J. Appl. Ecol. 2022, 33, 3441–3447. (In Chinese) [Google Scholar]
  69. Cao, Y.; Fu, C.; Wang, X.; Dong, L.; Yao, S.; Xue, B.; Wu, H.; Wu, H. Decoding the dramatic hundred-year water level variations of a typical great lake in semi-arid region of northeastern Asia. Sci. Total Environ. 2021, 770, 145353. [Google Scholar] [CrossRef]
  70. Zhi, Y.; Liu, S.; Wang, T.; Duan, H.; Kang, W. Extraction of Desertification Information and Spatiotemporal Change in the Qinghai-Tibetan Plateau Based on Optimal Feature Space Combination. Land Degrad. Dev. 2025, 36, 2746–2763. [Google Scholar] [CrossRef]
  71. Zhao, Y.; Gao, G.; Ding, G.; Wang, L.; Chen, Y.; Zhao, Y.; Yu, M.; Zhang, Y. Assessing the influencing factors of soil susceptibility to wind erosion: A wind tunnel experiment with a machine learning and model-agnostic interpretation approach. Catena 2022, 215, 106324. [Google Scholar] [CrossRef]
  72. Cai, J.; Wang, J.; Xiao, H.; Xin, Z.; Wang, B.; Li, J. Wind-Sand Characteristics of the Ulan Buh Desert Oasis and the Protection Effect of Shelterbelts. Sci. Soil Water Conserv. 2024, 22, 136–145. (In Chinese) [Google Scholar]
  73. Cui, B.; Wang, G.; Wei, G.; Gui, D.; Abd-Elmabod, S.K.; Goethals, P.; Ahmed, Z. Proactive policies are the key to reversing desertification in the main stream of the Tarim River in the past 30 years. J. Environ. Manag. 2024, 370, 122919. [Google Scholar] [CrossRef] [PubMed]
  74. Xi, L.; Qi, Z.; Feng, Y.; Cao, X.; Cui, M.; Zou, J.; Feng, S. Construction of a Desertification Composite Index and Its Application in the Spatiotemporal Analysis of Land Desertification in the Ring-Tarim Basin over 30 Years. Remote Sens. 2025, 17, 644. [Google Scholar] [CrossRef]
  75. Zhao, W. Understanding and Analysis of Sediment Management at the San Sheng Gong Water Conservancy Hub on the Yellow River. Inn. Mong. Water Resour. 2004, 02, 56–58. (In Chinese) [Google Scholar]
  76. Liu, K.; Wang, B.; Zhang, F.; Wu, X.; Wang, R.; Zhang, F.; Jia, R.; Zhang, H.; Wei, L.; Dong, L.; et al. Ecological Effects of Photovoltaic Power Station Construction: Research Progress and Prospect of Photovoltaic-Based Desertification Control. J. Desert Res. 2025, 45, 277–291. (In Chinese) [Google Scholar]
  77. Liu, L.; Wang, T.; Li, X.; Xie, Z.; Wu, J.; Song, L. Spatiotemporal Variation Characteristics of Wind Prevention and Sand Fixation Function of the Shelterbelt System in Inner Mongolia in the Past 15 Years. Chin. J. Ecol. 2021, 40, 3436–3447. (In Chinese) [Google Scholar]
  78. Fan, Y.; Wang, Y.; Mou, X.; Zhao, H.; Zhang, F.; Zhang, F.; Liu, W.; Hui, Z.; Huang, X.; Ma, J. Environmental status of the Jilantai Basin, North China, on the northwestern margin of the modern Asian summer monsoon domain during Marine Isotope Stage 3. J. Asian Earth Sci. 2017, 147, 178–192. [Google Scholar] [CrossRef]
  79. Li, G.; Jin, M.; Chen, X.; Wen, L.; Zhang, J.; Madsen, D.; Zhao, H.; Wang, X.; Fan, T.; Duan, Y.; et al. Environmental changes in the Ulan Buh Desert, southern Inner Mongolia, China since the middle Pleistocene based on sedimentology, chronology and proxy indexes. Quat. Sci. Rev. 2015, 128, 69–80. [Google Scholar] [CrossRef]
  80. Huang, J.; Li, Y.; Fu, C.; Chen, F.; Fu, Q.; Dai, A.; Shinoda, M.; Ma, Z.; Guo, W.; Li, Z.; et al. Dryland climate change: Recent progress and challenges. Rev. Geophys. 2017, 55, 719–778. [Google Scholar] [CrossRef]
  81. Fu, G.; Qiu, X.; Xu, X.; Zhang, W.; Zang, F.; Zhao, C. The role of biochar particle size and application rate in promoting the hydraulic and physical properties of sandy desert soil. Catena 2021, 207, 105607. [Google Scholar] [CrossRef]
  82. Zhu, L.; Meng, J.; Zhu, L. Applying Geodetector to disentangle the contributions of natural and anthropogenic factors to NDVI variations in the middle reaches of the Heihe River Basin. Ecol. Indic. 2020, 117, 106545. [Google Scholar] [CrossRef]
  83. Li, H.; Yang, X. Temperate dryland vegetation changes under a warming climate and strong human intervention—With a particular reference to the district Xilin Gol, Inner Mongolia, China. Catena 2014, 119, 9–20. [Google Scholar] [CrossRef]
  84. Gao, Z.; Guo, H.; Li, S.; Wang, J.; Ye, H.; Han, S.; Cao, W. Remote sensing of wetland evolution in predicting shallow groundwater arsenic distribution in two typical inland basins. Sci. Total Environ. 2022, 806, 150496. [Google Scholar] [CrossRef] [PubMed]
  85. Wang, J.; Ge, Z.; Xia, R.; He, S.; Zhan, S. Hydrogeochemistry and stable isotopes of water: Characteristics, influencing factors and sources in a semi-arid irrigated basin, Hetao Plain. J. Arid Environ. 2025, 227, 105313. [Google Scholar] [CrossRef]
  86. Yu, Q.; Yue, D.; Wang, Y.; Kai, S.; Fang, M.; Ma, H.; Zhang, Q.; Huang, Y. Optimization of ecological node layout and stability analysis of ecological network in desert oasis: A typical case study of ecological fragile zone located at Deng Kou County (Inner Mongolia). Ecol. Indic. 2018, 84, 304–318. [Google Scholar] [CrossRef]
  87. Shao, W.; Li, L.; Yan, M.; Meng, Z.; Zhang, L.; Zhang, Q.; Chen, Y. Thirty years’ spatio-temporal evolution of desertification degrees and driving factors in Turpan–Hami Basin, Xinjiang, China. Ecol. Indic. 2024, 166, 112484. [Google Scholar] [CrossRef]
  88. Zhang, Y.; Wang, J.; Ochir, A.; Chonokhuu, S.; Togtokh, C. Dynamic evolution of spring sand and dust storms and cross-border response in Mongolian plateau from 2000 to 2021. Int. J. Digit. Earth 2023, 16, 2341–2355. [Google Scholar] [CrossRef]
  89. Cheng, X.; Xu, Z.; Yu, Y.; Zhang, X. Changes in the Frequency of Sand-Dust Events in the China-Mongolia Region Since 2001 Revealed by Satellite Remote Sensing and Their Causes. J. Desert Res. 2025, 45, 47–60. (In Chinese) [Google Scholar]
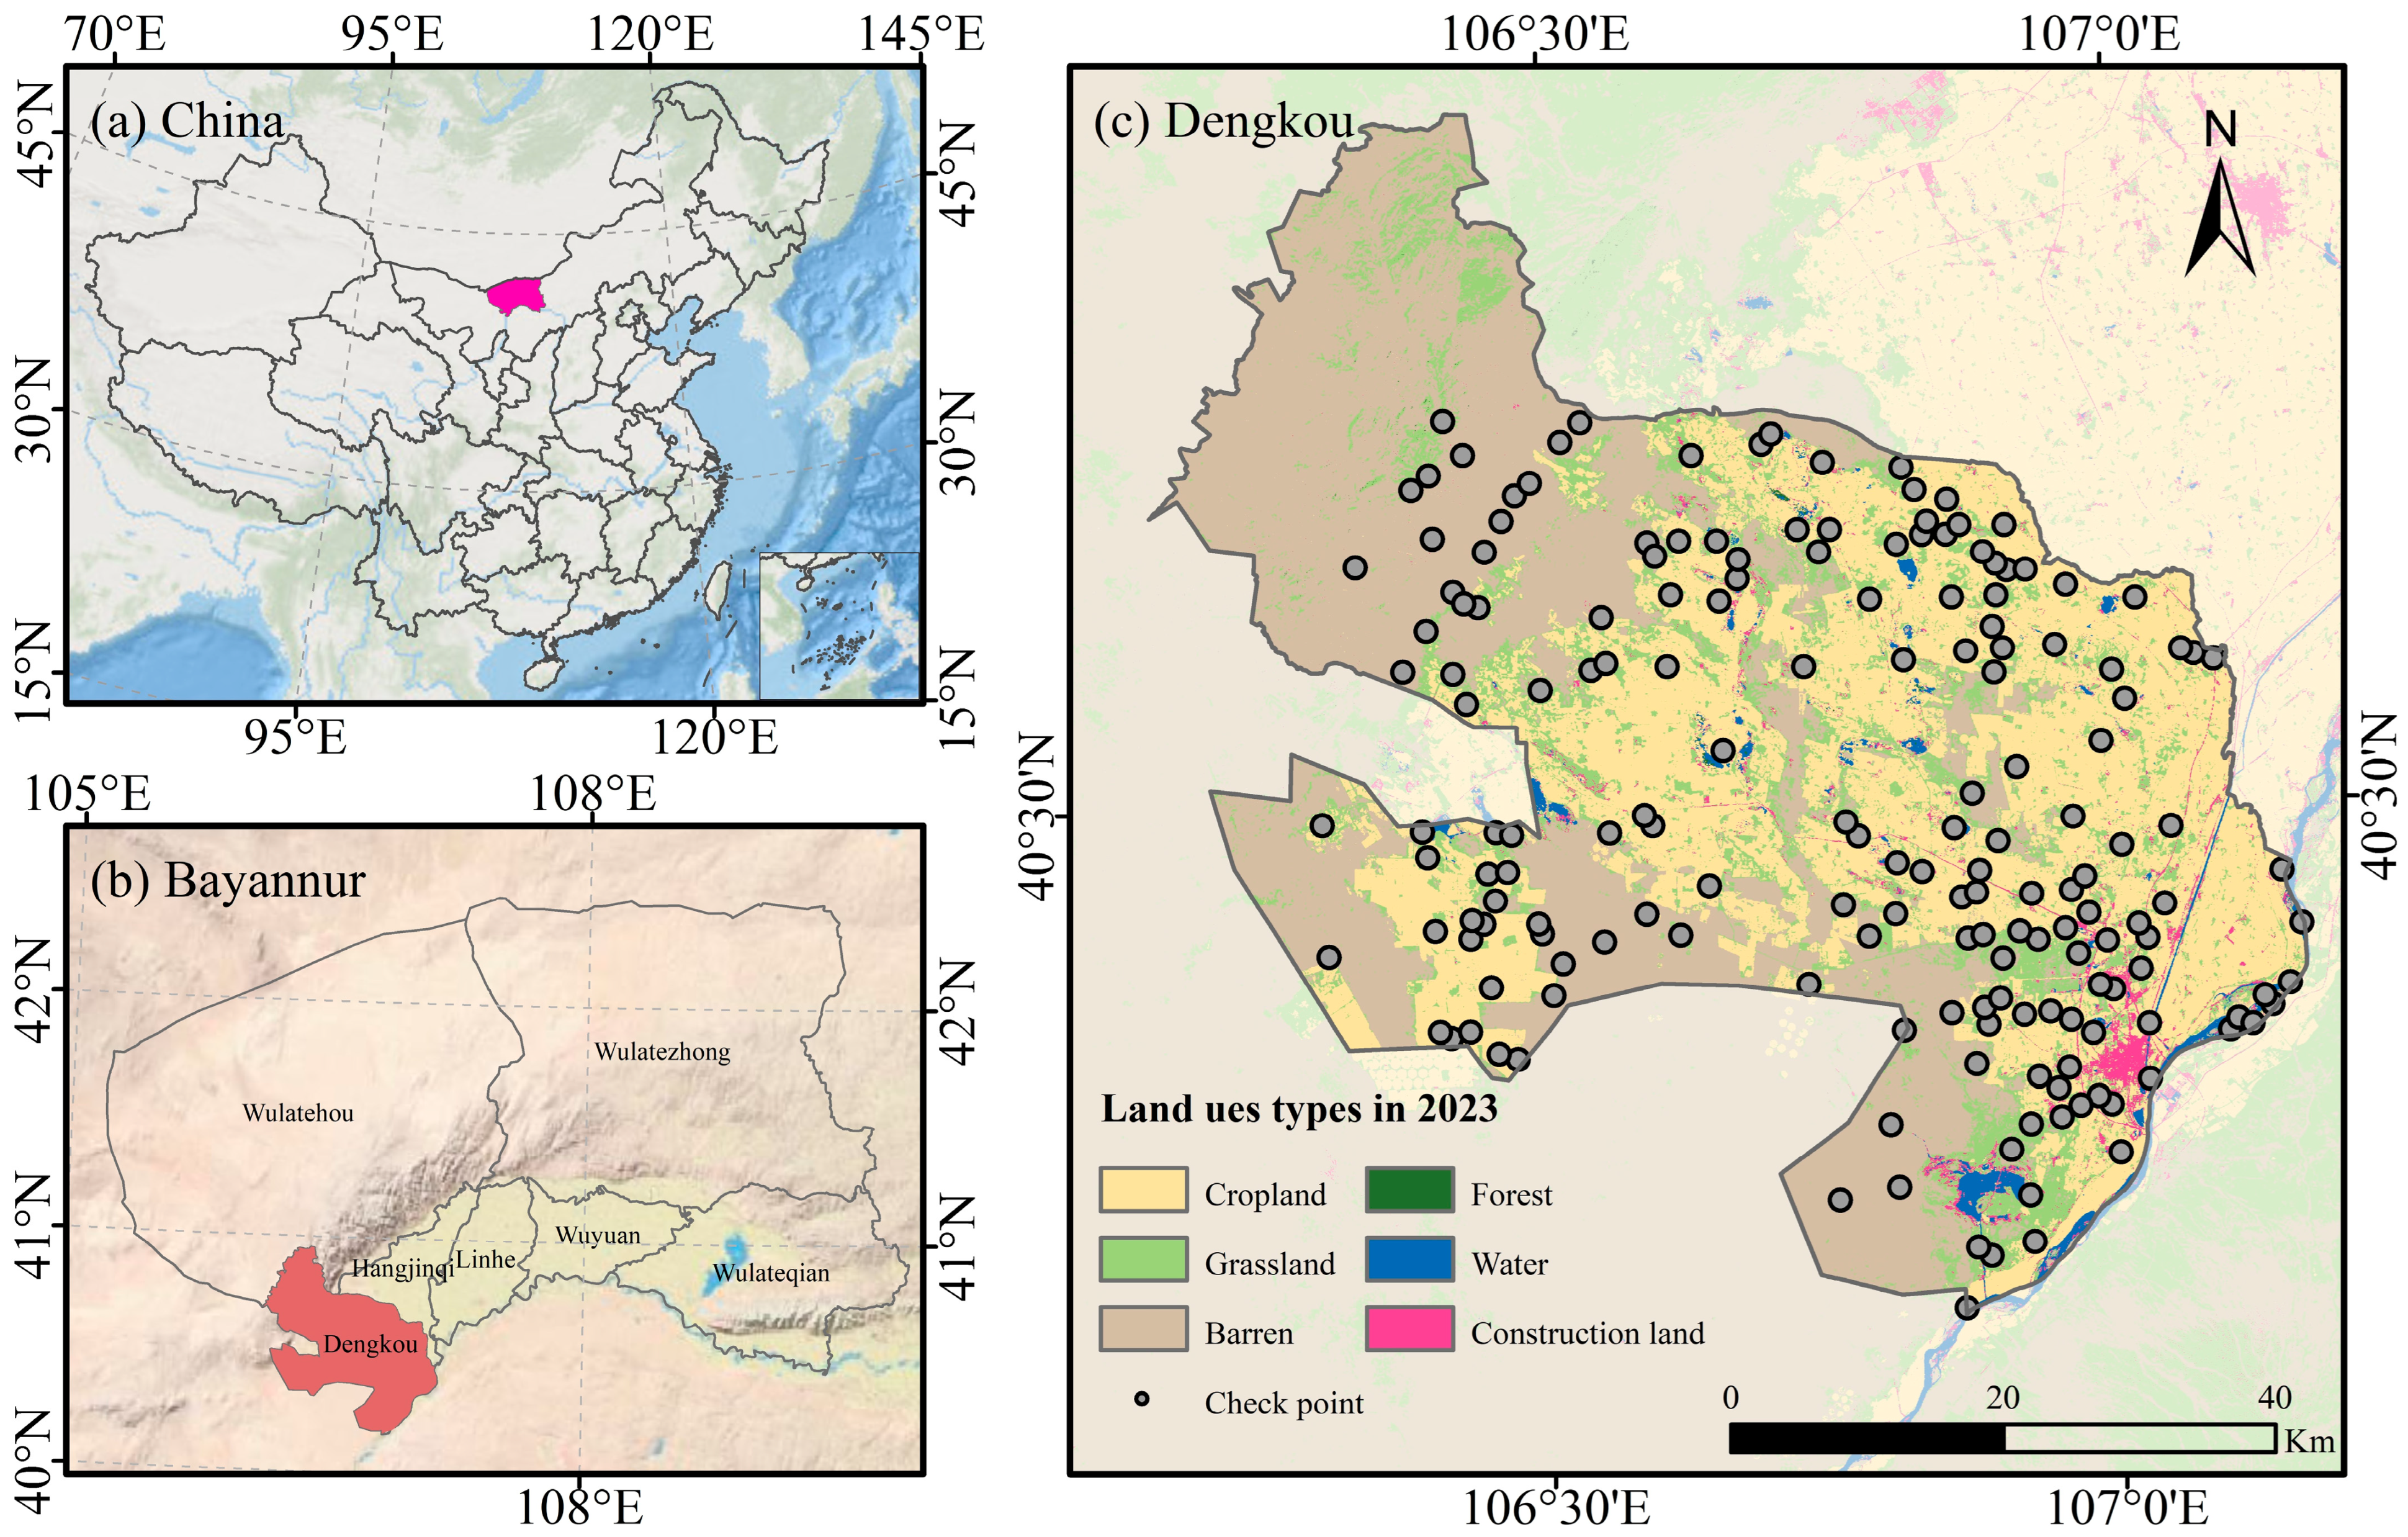
Figure 1. Overview of the study area. (a) Location of the prefecture-level city containing the study area. (b) Location of the study area. (c) Land use types in 2023 and distribution of field validation points.
Land 14 01666 g001
Figure 2. Classification results of the study area.
Land 14 01666 g002
Figure 3. Spatial distribution of sandy desertification land.
Land 14 01666 g003
Figure 4. Migration characteristics of the centers of gravity for sandy desertification of different severities.
Land 14 01666 g004
Figure 5. Interval level of intensity analysis.
Land 14 01666 g005
Figure 6. Category level of intensity analysis.
Land 14 01666 g006
Figure 7. Transition area at the transition level in intensity analysis. (a) Non, (b) Slight, (c) Moderate, (d) Serious, (e) Extremely severe, (f) Water.
Land 14 01666 g007
Figure 8. Transition intensity at the transition level in intensity analysis. (a) Non, (b) Slight, (c) Moderate, (d) Serious, (e) Extremely severe, (f) Water.
Land 14 01666 g008
Figure 9. Results of the factor detector.
Land 14 01666 g009
Figure 10. Results of the interaction detector.
Land 14 01666 g010
Table 1. Landsat image information.
YearSensor TypePath/Row (Date)
1986TM129/32 (31 July), 130/32 (7 August)
1995TM129/32 (10 September), 130/32 (29 June)
2004TM129/32 (18 September), 130/32 (8 August)
2015OLI129/32 (1 September), 130/32 (6 July)
2023OLI129/32 (5 July), 130/32 (29 August)
Table 2. Data description and sources.
DataYearUnitResolutionData Sources
Elevation2015m90 mNational Aeronautics and Space Administration
(https://earthexplorer.usgs.gov/,
access on 20 February 2024)
Slope°
Aspect-
Geological Conditions2004-100 mGeological Cloud
(https://geocloud.cgs.gov.cn/,
accessed on 6 March 2024)
Soil type1995-1 kmData Center for Resources and Environmental Sciences Chinese-Academy of Sciences (https://www.resdc.cn/,
accessed on 6 March 2024)
Precipitation1986–2023mm1 kmNational Earth System Science Data Center, National Science & Technology Infrastructure of China
(http://www.geodata.cn,
accessed on 11 March 2024)
Temperature°C
Potential
evapotranspiration
mm
Aridity index-
Wind velocity1986–2020m/s
Soil moisture1986–2020m3/m325 kmScience Data Bank
(https://www.scidb.cn/,
accessed on 13 March 2024)
Population density1990–2020persons/km21 kmData Center for Resources and Environmental Sciences Chinese-Academy of Sciences (https://www.resdc.cn/,
accessed on 7 March 2024)
Gross domestic product1995–2020billion RMB1 km
Nighttime light1986–2020-1 kmScientific Data
(www.nature.com/scientificdata,
accessed on 2 April 2024)
Livestock density 2010 2015heads/km210 km
Table 3. The classification system of the study area.
TypeSurface CharacterizationLandsat ImageActual Photos
SDAThe surface is covered by sand particles with diameters ranging from 0.0039 to 2 mm. Land 14 01666 i001Land 14 01666 i002
GDAThe surface is covered by gravel ranging from 2 to 256 mm in diameter. Land 14 01666 i003Land 14 01666 i004
MAThe surface is dominated by exposed bedrock and rock debris. Land 14 01666 i005Land 14 01666 i006
Table 4. The classification system of sandy desertification.
TypeVegetation CoverageLandsat False-Color Synthesis ImageActual Photos
Slight sandy desertification≥50%Land 14 01666 i007Land 14 01666 i008
Moderate sandy desertification30–50%Land 14 01666 i009Land 14 01666 i010
Serious sandy desertification10–30%Land 14 01666 i011Land 14 01666 i012
Extremely severe sandy desertification<10%Land 14 01666 i013Land 14 01666 i014
Table 5. Definition of interaction detector.
DescriptionInteraction
q(X1∩X2) < Min(q(X1), q(X2))Weaken, nonlinear
Min(q(X1), q(X2)) < q(X1∩X2) < Max(q(X1), q(X2))Weaken, univariate
q(X1∩X2) > Max(q(X1), q(X2))Enhance, bivariate
q(X1∩X2) = q(X1) + q(X2)Independent
q(X1∩X2) > q(X1) + q(X2)Enhance, nonlinear
Table 6. Area and changes of sandy desertification land.
Year Non
(km2)
Slight
(km2)
Moderate
(km2)
Serious
(km2)
Extremely
Severe (km2)
Water
Area (km2)
1986288.34251.35564.341098.2614.1783.24
1995507.43331.59751.69698.5469.13141.3
2004394.22400.42759.93852.37396.6696.04
2015853.62310.57617.85547.52437.39132.70
20231493.13122.54435.51354.99411.9681.51
1986–1995219.0980.24187.35−399.70−145.0458.06
1995–2004−113.2168.838.24153.87−72.47−45.26
2004–2015459.40−89.85−142.08−304.8540.7336.66
2015–2023639.50−188.03−182.33−192.52−25.43−51.19
1986–20231204.79−128.81−128.83−743.21−202.21−1.73
Disclaimer/Publisher’s Note: The statements, opinions and data contained in all publications are solely those of the individual author(s) and contributor(s) and not of MDPI and/or the editor(s). MDPI and/or the editor(s) disclaim responsibility for any injury to people or property resulting from any ideas, methods, instructions or products referred to in the content.