Abstract
The rural border areas of Serbia have been undergoing significant demographic shifts and transformations in land use. Between 2002 and 2022, these regions experienced a continuous population decline, an increase in the average age, and a growing share of single-person households. Simultaneously, there has been a reduction in agricultural land and a noticeable expansion of forested and grassland areas, particularly in hilly and mountainous terrain. This paper aims to explore the interrelationship between demographic indicators and land cover changes in these areas. Pearson’s correlation analysis was applied to data from the national population censuses and the CORINE Land Cover datasets for 1990 and 2018. The strongest positive correlation was found between the decline in the number of households and the reduction in agricultural land. Conversely, the expansion of forested areas showed a negative correlation with most demographic indicators. The findings reflect trends similar to those observed in other Eastern European countries but also reveal specific patterns of spatial marginalization unique to Serbia. In the study, the conclusion leads to the idea that depopulated border areas are in transition between past and future functions that will be influenced by their resource base.
1. Introduction
Uneven regional development is not only a challenge facing rural and border areas but also a complex outcome of long-standing natural, social, and institutional factors, such as geographic isolation, unequal resource allocation, and inadequate governance across multiple levels. When development efforts are not implemented sustainably and equitably across all regions, persistent disparities emerge between urban centers and peripheral territories. In many European countries, economic activity and capital tend to concentrate in urban hubs, while peripheral areas, especially rural ones, lag due to geographical, economic, and political constraints [1,2]. Yet their development should also be guided by pillars of sustainability focused on primarily on the environment [3].
Some authors [4] highlight that country border regions are particularly vulnerable to unfavorable development trends, often reflected in economic stagnation, underdeveloped infrastructure, and adverse demographic shifts. These processes lead to pronounced depopulation, undermining the development potential of these areas and leaving long-term consequences on their socio-economic structure [5,6]. Rural communities frequently struggle to identify and implement effective, practical responses to these multifaceted challenges [7]. Although most rural border regions in Serbia are confronted with demographic difficulties, the intensity and dynamics of these processes vary. Some municipalities have experienced a steady population decline for decades, while others have only recently entered a phase of accelerated depopulation. These differences are shaped by a combination of geographic, economic, and historical factors, including changes in state borders following the breakup of the Socialist Federal Republic of Yugoslavia in the 1990s. Municipalities that once lay in the country’s interior found themselves redefined as border areas, leading to production reduction and population decline [8].
Demographic changes—particularly depopulation—have a direct impact on land use in rural and border regions. The outmigration of the working-age population, combined with population aging, leads to the abandonment of agricultural land, often resulting in natural reforestation or, conversely, in soil degradation due to the lack of maintenance [9,10]. Depopulation has already affected the natural reforestation of border areas in Serbia in several locations, but research shows that the absence of people can also contribute to fires that destroy forest areas [11]. In certain parts of Serbia, reduced economic activity has triggered shifts in dominant land use patterns, where traditional agricultural practices are being replaced by abandoned or repurposed land. Moreover, infrastructural neglect and declining investment further contribute to the downturn in agricultural production [12], inhibited market integration, weak state presence, smuggling, land degradation, climate vulnerability, water resource depletion and loss of biodiversity.
The primary objective of this paper is to examine the relationship between depopulation and land use change through a quantitative analysis of demographic trends in Serbia’s rural border regions. Special attention is given to identifying patterns of agricultural land abandonment and the transition to alternative land uses.
The scientific and practical relevance of this research lies in its contribution to understanding the causal linkages between demographic and spatial processes in Serbia’s rural and border areas. From a scholarly perspective, the study deepens existing knowledge on the dynamics of depopulation and its spatial consequences. The paper introduces a novel empirical linkage between long-term demographic decline and land cover transformation in rural border regions based on 14 demographic indicators and land cover types and with an inclusion of external migration factors from EU border effects. From a practical standpoint, the findings can serve as a valuable reference for policymakers in the development of strategic frameworks and planning documents tailored to border areas. Given the significance of this issue, responsibility spans across all levels of governance, from local to national, as well as specialized agencies involved in the management of state-owned forests, watercourses, and natural hazard prevention. A nuanced understanding of land use change is essential for informed decision-making in rural development, agriculture, environmental protection, and regional policy, particularly in efforts aimed at mitigating depopulation, aging and emigration and ensuring the sustainable use of available resources.
2. Literature Review
Rural depopulation is a phenomenon with profound implications for spatial organization and land use. Although its causes are multifaceted, the most significant drivers include migration, demographic transition, and economic restructuring. Depopulation is particularly pronounced in peripheral and border regions, where infrastructural limitations and restricted access to markets hinder development [13]. Alongside outmigration, declining birth rates and population aging further accelerate population loss in rural areas [14,15].
An increasing number of rural regions across Europe are experiencing depopulation [16], with the dominant trend being a steady and moderate decline [17]. Between 1950 and 2007, the rural population in Europe decreased by approximately 20 million people, dropping from 45% to just 36% of the total population [18]. In developed European countries, the rural population declines by about 1.5% annually [19]. In 2018, the urban population in the European Union accounted for 72.1% of the total—367 million out of 508 million inhabitants [20]. According to a Eurostat farm structure survey, 55.8% of European farmers were over 55 years old, 31.4% were over 65, and only 6% were under 35. This highlights a significant challenge for the future of rural development, commonly referred to as the “young farmer problem”, which reflects the low rate of generational renewal in the agricultural sector [21].
Processes of industrialization and urbanization triggered large-scale migratory flows in most developed countries as early as the 19th century [4,22], while in developing countries these dynamics became prominent during the second half of the 20th century. In Western Europe, several rural regions have been identified as demographically isolated or at risk of isolation [23]. In the Baltic states, as well as in Portugal and Spain, rural settlements have witnessed a dramatic population decline [24,25]. Similar trends are evident in Bulgaria, particularly in the mountainous central areas [26], and in the northern and southwestern parts of Hungary [27]. Border regions of Slovenia and Romania are also experiencing marked depopulation [28,29]. These tendencies are mirrored in Serbia as well, especially in the country’s southern regions, where some villages have been entirely abandoned [13]. Over time, clusters of deserted areas have emerged [30,31].
In the 21st century, the population of Serbia has been in constant decline. In 2002, it amounted to 7,498,000, but in the 2011 census, it was reduced by 4.1% (7,186,862) compared to the previous census and in 2022 by 6.9% (6,690,887 inhabitants) compared to the 2011 census. This decline is the result of an increase in the rate of negative natural growth (from −3.3‰ in 2002 to −7‰ in 2022), as well as a negative migration balance (−46.4‰ in 2002 and −63.5‰ in 2022). In addition to the above, there are numerous negative demographic trends in Serbia related to
- A reduction in the share of the population in rural settlements from 43.6% in 2002 to 38% in 2022;
- Dispersion of households, as indicated by the increase in the number of households in urban settlements (from 1,481,304 in 2002 to 1,675,091 in 2022), as opposed to the decrease in rural settlements (from 1,039,886 in 2002 to 914,253 in 2022). The decrease in the average number of members per household at the level of Serbia is an indicator of negative demographic tendencies, from 2.98 in 2002 to 2.55 in 2022;
- Increasing the number and share of single-person households from 20% in 2002 to approximately 30% in 2022;
- Increasing the average age of the population, from 40.2 years in 2002 to 43.9 years in 2022, of which the average age is higher in rural settlements (41.6 years in 2002 and 45.3 years in 2022) compared to urban settlements (41.3 years in 2002 and 43 years in year 2022);
- A reduction in the number and share of the active population from 45.3% in 2002 to 40.9% in year 2022 [32,33,34,35,36,37].
Demographic processes in Serbia’s border areas have been the subject of research at various territorial levels, ranging from individual municipalities to the entire border zone. With the intensification of depopulation, driven by outmigration, the closure of households, and declining natural population growth, these issues have gained increased attention in the 21st-century academic discourse. While some studies have focused on analyzing a single demographic process, others have explored the interrelationships between multiple factors.
Comprehensive analyses of demographic characteristics have been conducted for the entire border region between Serbia and Bulgaria [38], as well as for individual municipalities [39]. In the border region of Srem, adjacent to Croatia, the influence of migration on population growth was identified toward the end of the 20th century [40]. Other authors [41] examined the effects of natural population change and migration movements in the special-purpose area of Vlasina for the period 1961–2011. Issues of population decline and depopulation were central to research on Stara planina between 2002 and 2011 [42], as well as in rural settlements along the Bulgarian border [43,44,45], and in settlements along the Romanian border [46,47]. In the municipality of Kikinda, a high unemployment rate has been linked to ongoing depopulation [48]. Fertility trends and the influence of demographic factors have been analyzed in case studies of Sremska Mitrovica and Šabac [49]. The combined effects of depopulation and aging were interpreted through the example of Crna Trava [50], while Stojsavljević and colleagues investigated the economic activity of the population in Pirot based on the 2011 census data [51].
The older publications were primarily focused on individual demographic phenomena [8,27,39,41,43,45], whereas more recent studies increasingly address the interplay of multiple processes (such as depopulation, emigration, and population aging) and their effects on landscape transformation, land use change, and regional development. This shift reflects a growing recognition that population decline in rural areas directly influences land use, which in turn has significant implications for environmental sustainability [52]. The decline in agricultural activity, particularly in hilly and mountainous regions, often leads to the abandonment of cultivated land and the spontaneous succession of vegetation [53]. Additionally, the emigration of the working-age population disrupts traditional land management practices, contributing to the fragmentation and parceling of land [19]. In post-socialist countries (such as Serbia), these processes have been further intensified by the transition to market economies, characterized by privatization and the deregulation of the agricultural sector [29].
Globally, land use change affected approximately 32% of the Earth’s land surface between 1960 and 2019. This was driven by agricultural abandonment and reforestation in countries of the Northern Hemisphere, as well as deforestation and agricultural expansion in parts of South America, Africa, and Oceania [54]. In Western Germany, changes in how land is used (such as for farming, housing, or forests) are closely linked to natural population dynamics (like birth and death rates) and net migration (how many people are moving in or out). In contrast, in Eastern Germany, where the population is shrinking more severely, land use is influenced less by population changes and more by economic factors—such as job availability, income levels, and investment trends [29]. Three primary drivers of land abandonment have been identified: environmental factors (e.g., topography, soil quality, erosion, and climate) (Figure 1), socioeconomic variables (e.g., market conditions, depopulation, technology, land ownership, and accessibility), and land management practices [53].
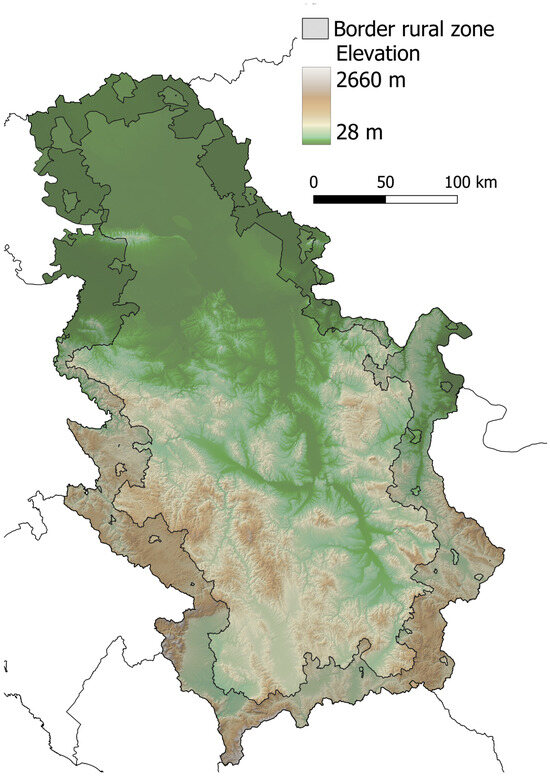
Figure 1.
Topographic map of Serbia.
General depopulation and agricultural land abandonment may lead to changes in vegetation cover, depending on local ecological and pedological characteristics. In areas where natural succession dominates following the cessation of agricultural use, there is typically a gradual spread of spontaneous vegetation, especially pioneer tree and shrub species [55]. Conversely, in regions formerly dominated by fruit or viticultural crops, depopulation may result in reduced vegetation cover due to a lack of maintenance and the progressive decay of cultivated plants. Furthermore, in historically sparsely vegetated areas, depopulation does not necessarily lead to vegetation expansion. Therefore, the relationship between depopulation and vegetation change depends on previous land use, existing vegetation types, and natural succession dynamics.
After the collapse of socialism in Eastern Europe, the shift from state-owned collective farms to private ownership caused large, unified agricultural lands to be broken into many small plots. This process, often poorly managed and lacking oversight, led to farmland being scattered and divided among many owners, many of whom lacked either the means or interest to cultivate it. As a result, a significant portion of land was left idle or abandoned, leading to a widespread increase in uncultivated and unused agricultural land across post-socialist countries [19]. From the 1970s through the 1980s, Russia’s total cultivated area reached its historical peak. However, the gradual decline in arable land began during the economic and political reforms of the Soviet Union between 1985 and 1991, and significantly accelerated following the USSR’s collapse in 1991, particularly in the forest zones and the semiarid areas of the Caspian Plain [56]. In the Great Morava River Basin—which encompasses central Serbia and accounts for nearly 43% of the country’s territory—the total area under arable land declined by 36.7% between 1961 and 2011, with the Južna Morava River Sub-Basin experiencing a reduction of over 70% [57]. In the immediate basin of the Great Morava, agricultural land decreased by 38% over the same period [58]. Concurrently, in the Južna Morava River basin, the population declined at an average annual rate of 0.87%, while the reduction in agricultural land averaged 1.2% per year and arable land by around 1% annually [19].
While depopulation often results in the degradation of traditional agriculture, some studies have pointed to potential ecological benefits, such as the regeneration of agroecosystems and reduced anthropogenic pressure on soils [54]. Nonetheless, it is important to emphasize that many countries have pursued agricultural intensification primarily in lowland regions below 200 m above sea level [59] (such as Vojvodina autonomous province in northern Serbia), while hilly and mountainous areas have faced significant losses of arable land and the erosion of traditional agricultural practices. Furthermore, market liberalization policies in several countries, including Serbia, have contributed to the declining competitiveness of local products from border regions, such as Pirot cheese (eastern Serbia) and Sjenica cheese (southwestern Serbia), thus further accelerating the abandonment of agricultural activity in these areas [60,61].
In the context of global climate change, abandoned agricultural land constitutes a valuable resource for the development of sustainable land use models, including renewable energy production and biodiversity conservation [52].
3. Study Area and Methods
3.1. Study Area
The rural border area of Serbia encompasses local self-government units (municipalities and cities) situated along the state border, excluding urban settlements (Figure 2). This rural border region represents a significant subject of analysis, as it is among the most affected areas in Europe by pronounced depopulation and land use changes. The total area under study covers 30,071.3 km2, which accounts for 34.03% of Serbia’s entire territory. The length of the border section adjacent to European Union member states measures 1344.8 km, while the section bordering non-EU countries extends for 1016.9 km. The population of Serbia’s rural border zone steadily declined from 2002 to 2022. Compared to the country’s total population, this area accounted for 12.6% in 2002 (941,652 inhabitants), 11.3% in 2011 (815,600 inhabitants), and 10.2% in 2022 (678,447 inhabitants). In 2022, the population density in the rural border area was approximately 22 inhabitants per km2, considerably lower than the national average of 75 inhabitants per km2. Its peripheral location along state borders, often distant from major economic centers, contributes to marginalization (mainstream economic, social, and political development) and hampers socioeconomic development. Key transportation routes traverse this border zone, including the Pan-European Corridor 10 and Corridor 7—the Danube waterway along the border with Croatia and Romania. Despite this infrastructure, agriculture in these regions is in decline, and investments as well as industrial development remain limited. Disparities in infrastructural connectivity negatively impact the competitiveness of local producers, sometimes exacerbating out-migration. Border municipalities also exhibit a unique geopolitical character due to their location in areas with historically and culturally interconnected populations on both sides of the border. The development of Serbia’s rural border area is additionally shaped by its ties to larger neighboring cities such as Szeged (Hungary), Timișoara (Romania), Sofia (Bulgaria), and Skopje and Kumanovo (North Macedonia). Nevertheless, administrative barriers and insufficient cross-border cooperation continue to influence the everyday life of the residents of border communes.
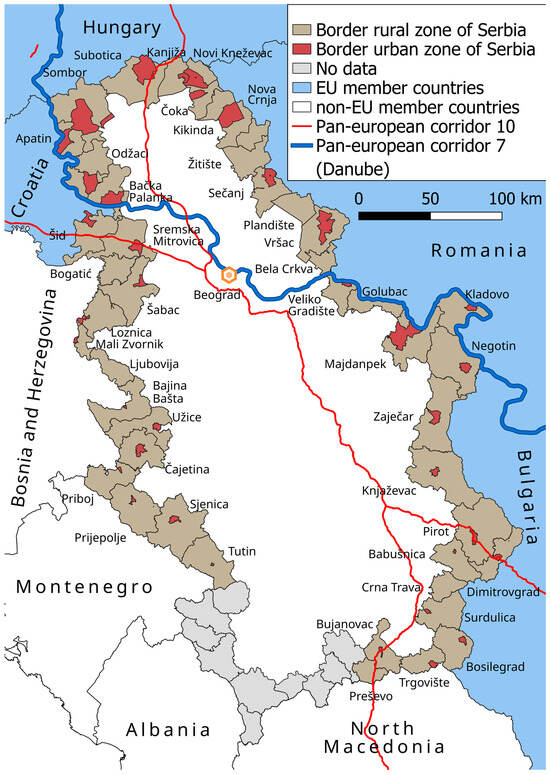
Figure 2.
Rural border region of Serbia.
3.2. Methodology and Data
To examine the relationship between demographic changes and land use dynamics in the rural border area of Serbia, a mixed approach combining spatial analysis and statistical methods was employed. Demographic data spanning the period from 2002 to 2022 were sourced from the Republic Statistical Office’s census database [32,33,34,35,36,37]. Land cover data were obtained from the CORINE Land Cover (CLC) database, and demographic indicators were analyzed using Pearson’s correlation coefficient (r) to assess potential associations.
Land cover change analysis utilized CORINE Land Cover datasets from 1990 and 2018 (CLC 1990 and CLC 2018), which were processed within the QGIS software environment (version 3.34.10 LTR). These datasets are produced at the European level under the Copernicus Land Monitoring Service program. The CLC methodology is based on the visual interpretation of satellite imagery, adhering to official guidelines of the Copernicus Land Monitoring Service program. The data are provided in vector format at a scale of 1:100,000, with a minimum mapping unit of 100 m for linear features and 25 hectares for areal features. This spatial resolution renders the database suitable for territorial analyses and long-term monitoring of land use trends. The CORINE nomenclature encompasses 44 hierarchical land cover classes from which we used only those which are in study area. However, it is important to acknowledge certain limitations of the CLC database, particularly regarding spatial resolution. The relatively large minimum cartographic unit can result in the loss of fine-scale details, which is especially critical in fragmented landscapes or when detecting minor land use changes. Additionally, the database is updated at multi-year intervals, which can limit the accuracy of tracking rapid or short-term dynamics in some areas. Despite these constraints, the CLC database remains one of the most authoritative and widely used sources for assessing long-term land cover trends across Europe [9,62,63]. In selecting temporal data points, emphasis was placed on the earliest and latest available datasets to capture the longest possible interval and to clearly illustrate major land cover changes over time. This approach aimed to highlight overarching long-term trends rather than focusing on incremental annual changes.
This paper employs the Pearson correlation coefficient method, which quantifies the degree of linear association between two quantitative variables. The coefficient values range from −1 to +1, where positive values indicate a direct (proportional) relationship, and negative values indicate an inverse relationship. The strength of the correlation is commonly classified as very weak, weak, moderate, strong, or very strong, depending on the magnitude of the coefficient r. The Pearson correlation coefficient is calculated using the following formula [64,65]:
where r—Pearson’s correlation coefficient (value between −1 and 1); n—number of observations (pairs of data); ∑X—sum of all values of variable X; ∑Y—sum of all values of variable Y; ∑XY—the sum of the products of the corresponding values of X and Y (for each pair: XiYi); ∑X2—sum of squares of all X values (for each Xi Xi2 is calculated); ∑Y2—sum of squares of all values of Y (for each Yi Yi2 is calculated). The index of change was calculated by dividing the land cover area in 2018 by its corresponding area in 1990 and multiplying the result by 100, where values above 100 indicate an increase and values below 100 indicate a decrease.
Based on data from the Republic Statistical Office [32,33,34,35,36,37], the following demographic indicators were analyzed for the period 2002–2022:
- −
- Total population (TP), at the level of local self-government units (LGUs), was selected to single out the zones with the highest concentration of population at the level of the rural border areas of Serbia;
- −
- The number of households (NH), at the level of LGU rural settlements, was selected to separate household concentration zones in this territory according to the number of inhabitants;
- −
- Share of single-person households (%) (SPH) was chosen because they are an indicator of the process of depopulation and senility of the population, which indicates a greater probability of the appearance of abandoned areas and the gradual spread of forest vegetation in areas with a higher share of SPH;
- −
- Average household size (AHS) was chosen because the decrease in the average number of members per household is an indicator of the decrease in natural growth, stratification of the household, and the aging process of the population in which the share of elderly households increases;
- −
- Natural population growth (NI) was chosen because low rates of natural growth are an indicator of previous emigration of the population and the cause of the depopulation process, which is reflected in the decline in the number of inhabitants, the decrease in the average number of members per household, and the abandonment of agricultural land;
- −
- Migration balance (MB) was determined at the level of the entire LGU for the entire inter-census period (1991–2002, 2002–2011, 2011–2022). It was chosen because the majority of middle-aged and working-age people emigrate. Population emigration processes indicate a decrease in the number and share of the active population, which is reflected in changes in the way land is used, in the form of a decrease in arable land, but also opportunities for investment in the development of industrial facilities and traffic infrastructure.
- −
- Average age (AA) was chosen because it is directly related to the processes of depopulation and emigration of the working population, which is reflected in the increase in the share of abandoned land;
- −
- The percentage of rural population (RP) is important for identifying changes in the number of inhabitants in rural settlements and their functional connections with urban settlements of a given LGU. They make it possible to identify rural marginal settlements, in which, due to the lack of functional connection with urban settlements, there is a conversion of areas, and at the same time, there is no justification for investing in the economy.
- −
- Percentage of population with higher and tertiary education (HE) from the total number of inhabitants at the LGU level is a significant indicator, which is directly related to the dominant sectors of the economy in which the population is employed; a higher share of the population in non-economic activities may be an indicator of less activity of the population in the activities of the primary sector, which is largely reflected in land use;
- −
- The percentage of the economically active population (AP) from the total number of inhabitants at the LGU level is a significant indicator of the share of the active population in the total population of the given territory. The active population represents the employed and unemployed population. A smaller percentage of the active population is an indicator of a larger share of the old and economically inactive population, which is manifested in a larger share of abandoned areas and transitional forest forms.
Additionally, the study utilized synthetic indicators, including the following:
- −
- Population change index (PCI) represents the ratio between the number of inhabitants in one year (TP2022) and the number of inhabitants in the previous census year (TP2011). This indicator was selected to identify LGUs in which the biggest changes occurred, to establish the relationship between changes in land use. It is calculated according to the formula
- −
- Household change index (HCI) represents the ratio between the number of households in one year (NH2022) and the number of households in the previous census year (NH2011). The selection of this variable is important to identify zones where the process of stratification of households occurs as a result of a change in the way of life of the population (an increasingly rare occurrence of different generations living in one household), but also the closure of households due to pronounced depopulation processes. It is calculated according to the formula
- −
- Aging coefficient (AC) represents the ratio between the population over 60 years old (TP60+) and the population up to 19 years old (TP 0–19). Higher values of this indicator imply a higher age of the population and lower demographic potential, which will be reflected in the transformation of land use. It is calculated according to the formula
- −
- Functional dependency ratio (FDR) represents the ratio between the population under 19 years (TP 0–19) and older than 60 years (TP 60+), on the one hand, and the number of working people (AP), on the other hand. This indicator is significant for the way land is used because a higher number of FDRs is an indicator of a reduced possibility for the population to cultivate the land. In the rural border area of Serbia, the increasing proportion of the elderly population contributes to the high values of this indicator. It is calculated according to the formula
Methodological challenges arose due to missing census data from 2011 for the municipalities of Bujanovac and Preševo. The Albanian national minority’s boycott of the census led to incomplete data for these areas. To address this, missing values were interpolated by calculating the mean between the 2002 and 2022 census figures, allowing the correlation analysis to proceed. Another methodological limitation concerns the lack of reliable data for border municipalities in the Autonomous Province of Kosovo and Metohija adjacent to North Macedonia, Albania, and Montenegro.
4. Results
4.1. Demographic Trends in the Rural Border Area
The analysis of demographic data reveals a long-term trend across most of Serbia’s rural border area. As shown in Figure 3, Figure 4 and Figure 5, demographic patterns of depopulation are particularly pronounced in the rural border regions adjoining Bulgaria and in the northern sections of the rural border with Romania.
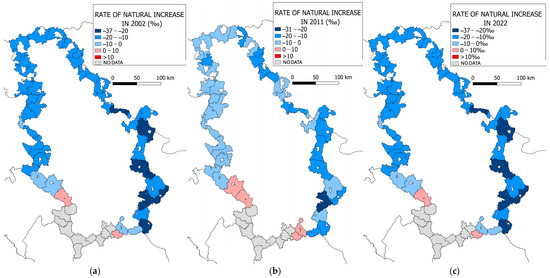
Figure 3.
Rate of natural increase in population in rural border region of Serbia in 2002 (a), 2011 (b) and 2022 (c) censuses.
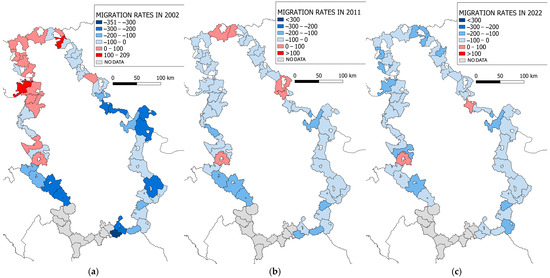
Figure 4.
Migration rates of population in rural border region of Serbia in 2002 (a), 2011 (b) and 2022 (c) censuses.
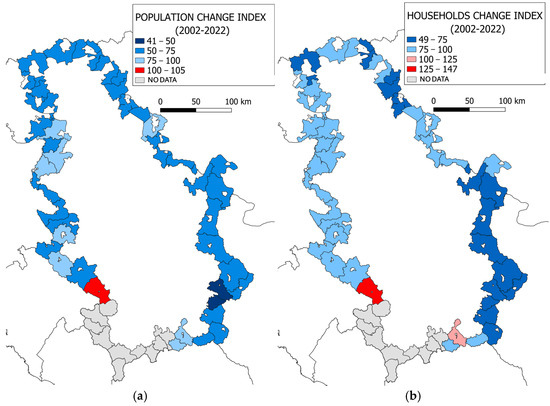
Figure 5.
Population change index (a) and household change index (b) in rural border region of Serbia (2002–2022).
Between 2002 and 2022, only four municipalities—Bujanovac, Preševo, Tutin, and Sjenica—recorded positive natural population growth. Negative growth in the remaining areas is largely driven by intensive out-migration, primarily involving younger and working-age individuals, which in turn accelerates demographic decline. Alongside this trend, the total number of households is gradually declining, a change driven not only by population out-migration but also by deeper shifts in family composition and living patterns. The household change index (hhci) indicates a decline of approximately 10% per inter-census period in the 21st century. In some municipalities, such as Babušnica and Crna Trava, the drop is even more severe, exceeding 25%. At the same time, the proportion of single-person households is increasing, especially in depopulated municipalities, where it reaches up to 48% (as in Crna Trava). This growth is also linked to the rising average age of the population, which increased by more than four years between 2002 and 2022. The causes include declining birth rates, out-migration of the working-age population, and increased life expectancy. The highest average ages are typically recorded in settlements located along the border with Bulgaria and Romania (Table 1).

Table 1.
Demographic indicators of the rural border area of Serbia.
A particularly alarming aspect is that many single-person households are composed of elderly individuals (those aged 65 and over), indicating heightened vulnerability and social isolation in the most affected areas.
In order to analyze the selected demographic indicators at the level of the rural border area of Serbia, a statistical analysis was performed regarding the arithmetic mean (Ar), maximum values (Max), minimum values (Min), interval of variation (IV), median (Med), coefficient of variation (CV), standard deviation (SD), and coefficient of skewness (CS). A detailed overview of all calculated statistical indicators and demographic variables is provided in Table A1, which is included in Appendix A of the manuscript.
The index of the change in the number of inhabitants between the two inter-census periods during this research in the rural border area of Serbia indicates approximately three times greater declines in the number of inhabitants compared to the national average. In the border municipalities of Serbia, in the period 2002–2022, the average number of inhabitants of rural settlements per municipality decreased by 28%, and households by 18.7%. This is also indicated by the lower values of the interval of variation between the maximum and minimum values for individual parameters.
In the 21st century, the share of single-member households in the border rural settlements of Serbia is constantly increasing, having increased from 20.3% in 2002 to 28% in 2022 (by over 40%). Compared to the level of the Republic of Serbia, the share of this indicator was approximately the same in 2002, while in 2022 it was higher (29.9%) at the level of Serbia, because there are more single-person households in urban areas, as a result of the increasing number of residents who choose an individual lifestyle. However, the share of single-person households at the level of other settlements in Serbia was lower in 2022 (26.8%). The deepening of this problem in the rural border area of Serbia is also indicated by the fact that the maximum value of this indicator in 2002 increased by 50% in 2022, while the minimum value increased by 68%. The average number of members per household in the rural border area is higher compared to Serbia (in 2002 it was 3.1 versus 2.97, and in 2022 it was 2.7 versus 2.55 in all of Serbia).
Increasingly negative trends in natural growth and the migration balance are the cause of the increasingly pronounced process of depopulation in the border area of Serbia. The tendency to decrease the natural increase will continue, due to the growing average age of the population and the emigration of the young and active population. According to the results of the 2002 census, the negative natural increase in the border area of Serbia was close to the level for the Republic of Serbia. In 2022, the values of natural increase in this area were lower (−10.3‰) compared to the level of Serbia (−7‰). In the border area of Serbia, the negative values of the migration balance increased in the 2022 census compared to the beginning of the 21st century. The values in both censuses are close to the values at the national level. Major deviations from the national average do not occur due to the lower mobility of the elderly population in rural settlements. The differences between the highest and lowest values of natural increase in the municipalities of the border area of Serbia are incomparably greater compared to the differences in the migration balance.
The decrease in natural growth in combination with pronounced emigration caused an increase in the average age of the population in the border area of Serbia, from 41 years in 2002 to 45.2 years in 2022. These values are higher than the national average, with a tendency to increase the difference in average age by 0.8 years in 2002 to 1.3 years in 2022. The increase in the maximum and minimum values of the average age of the population at the LGU level in the rural border area of Serbia indicates the intensification of the population aging process, with a tendency to further increase if population policy measures are not taken to encourage the birth rate and mitigate the emigration of the local population. A decrease in the interval of variation (IV) indicates the spread of this problem to an increasing number of LGUs. The values of the aging coefficient in the rural border area of Serbia were lower in 2002 (AC = 110.8) compared to the national average (AC = 141), while in 2022 the situation was reversed (in the rural border area of Serbia AC = 171.8, and at the level of Serbia AC = 150.1).
The share of the active population in the border area of Serbia is in decline, as a result of demographic trends (aging and emigration of the working population) and economic recession in certain areas. It was reduced from 41.8% in 2002 to 31.8% in 2022. The number of working people in the border area of Serbia decreased by 31% during that period (from 777,405 in 2002 to 536,159 in 2022). The share of the working population is significantly lower compared to Serbia, where the decline has been approximately 20% in the 21st century (from 3,398,227 in 2002, i.e., 45.3%, to 2,737,187 in 2022, i.e., 40.9%). As a consequence of the above, the high values of the functionally dependent population index are the result of the increasing number and share of the elderly population in the border area of Serbia. Compared to the level of Serbia, the values of this indicator were three times higher, while in 2022 the difference decreased, due to the problem of population aging at the level of the largest part of Serbia.
4.2. Correlation Matrix Results for Demographic and Synthetic Indicators
Using the Pearson correlation coefficient, the relationships among 14 demographic and synthetic indicators were analyzed for the three most recent census years (2002, 2011, and 2022) in the rural border area of Serbia. A total of 91 coefficients were calculated for each census year, yielding 273 coefficients overall. These results illustrate the degree of linear association between the selected indicators across different periods and enable the identification of changes in their interrelationships within the settlements of Serbia’s border region. All calculated correlation coefficients for each census year are graphically presented in Figure A1, which is included in Appendix A of this paper.
The analysis reveals that the most frequently observed correlation strength was very weak, followed by weak correlations (Table 2). In 2002, a total of 55 very weak and weak correlations were identified, 26 of which were positive and 29 negative. In 2011, 53 cases were identified with very weak and weak correlations, with a continued predominance of negative correlations in these categories. In 2022, 50 cases were recorded with very weak and weak correlations. However, that year showed a reversal in directionality: more very weak and weak positive correlations were observed than negative ones.
Table 2.
Results of the correlation matrix for demographic and synthetic indicators.
These findings suggest a trend of slight weakening in overall demographic interdependence over time, along with shifts like the correlations, from predominantly negative to more positive, between certain indicators. Correlation analysis was conducted to quantify the interdependence between demographic factors, revealing whether changes in one variable, such as aging, are systematically linked to shifts in another, like natural population growth. This approach also uncovers structural patterns shaping rural decline and detects deeper social transformations, for instance, the strong association between the rise in single-person households and population aging, which signals growing social isolation and vulnerability.
A very strong positive correlation was observed between the number of inhabitants and the number of households (r = 0.97 in 2002 and 2011; r = 0.96 in 2022), as well as between the average age and the aging coefficient (r = 0.92–0.95). These relationships are both logical and expected: a declining population is typically accompanied by a reduction in the number of households, while population aging corresponds with an increasing proportion of elderly individuals in the total population.
In 2002, a very strong positive correlation (r = 0.83) was also recorded between the average age and the share of single-person households, as well as between the average household size and the natural population increase. The strong correlation observed in 2011 and 2022 between the population change index, number of households, and natural increase (r = 0.87–0.91) demonstrates that vital demographic processes remain the primary drivers of overall demographic trends in rural border areas. This interdependence indicates that declines in natural population growth are closely mirrored by reductions in both total population and household numbers, reinforcing a cycle of depopulation. Such patterns highlight that demographic vitality—particularly birth rates and age structure—continues to dictate the structural stability of rural communities. Consequently, without interventions targeting natural increase and household formation, population decline is likely to persist, triggering further social fragmentation and land abandonment. Additionally, a very strong correlation was observed between the aging coefficient and the frequency of single-person households, further emphasizing the demographic implications of population aging.
Moreover, strong positive correlations (ranging from r = 0.62 to r = 0.80) were identified between several other indicator pairs: migration balance and the share of the active population, natural increase and average household size, and average age and the functional dependency ratio. These associations suggest that economic and demographic (vital) indicators exert a mutually reinforcing influence, particularly in the context of structurally vulnerable and demographically declining rural border areas.
On the other hand, very strong negative correlations were identified, most notably between the share of single-person households and the natural population increase (r = −0.90), as well as between the share of single-person households and average household size (r = −0.93 to −0.94). These inverse relationships highlight the demographic fragility of areas dominated by aging and increasingly fragmented households.
A significant negative correlation was also observed between the average age of the population and the population change index (r = −0.81), suggesting that municipalities with older populations experience lower levels of in- and out-migration. These areas, dominated by elderly residents and a growing share of single-person households, lack the demographic potential for natural renewal or migration-driven recovery, which further entrenches their vulnerability to long-term depopulation.
Strong negative correlations (r = −0.61 to −0.80) were recorded between household change and various demographic structures, including age, the aging coefficient, and the prevalence of single-person households. Furthermore, a negative correlation between natural population increase and average age reinforces the broader trend of demographic aging.
These results demonstrate the deeply interconnected nature of key demographic processes: depopulation, aging, shrinking household size, and the rise in single-person households amplify one another in a self-perpetuating cycle, accelerating structural demographic transformation in Serbia’s rural border areas. Particularly concerning is the strong link between population aging and declining demographic vitality, as this interaction reduces birth rates, limits in-migration, and increases social isolation, thereby heightening the risk of complete demographic collapse in the most vulnerable municipalities.
4.3. Land Use Changes
Natural conditions in border areas have a significant influence on the development of rural settlements and associated economic activities. Lowland areas (up to 200 m above sea level) cover 11,098.1 km2, or 43.0% of the rural border zone. These areas are predominantly located in the Autonomous Province of Vojvodina, along the borders with Croatia, Hungary, and Romania. Owing to fertile soils and favorable agro-ecological conditions, these zones represent traditional agricultural regions, characterized by arable farming, fruit growing, viticulture, and animal husbandry.
Mountainous terrain between 200 and 500 m accounts for 16.3% (4207.16 km2), while low-mountain areas (500–1000 m) comprise 22.4% (5789.14 km2) of the rural border area. Although agricultural potential is relatively limited in these regions, they historically supported livestock farming and forestry. Medium-altitude (1000–2000 m) and high-mountain regions (over 2000 m), totaling 5475.98 km2 and primarily located along the borders with Bulgaria, North Macedonia, and Montenegro, are characterized by harsh living conditions, less dense infrastructure, and severe depopulation. Terrain features significantly shape the spatial organization and sustainability of rural areas.
According to CORINE Land Cover (CLC) data for the period 1990–2018 (Table 3), the following land use changes were observed in Serbia’s rural border area:
Table 3.
Land use categories for Serbia rural border areas and index of change (1990–2018).
- Agricultural land decreased from 12,505.56 km2 to 12,167.91 km2 (change index: 97);
- Forests and grasslands increased from 11,611.04 km2 to 11,908.44 km2 (change index: 103);
- Settlement areas, industrial zones, and infrastructure categories showed moderate growth, while more significant increases were observed in areas of mineral resource exploitation (change index: 175) and green urban/public spaces (change index: 206).
These findings reflect broader processes of rural transformation, depopulation, and shifts in land use patterns, especially in environmentally and infrastructurally disadvantaged regions.
The increase in forest cover is most evident in hilly and mountainous regions, where the abandonment of arable land and natural reforestation through self-seeding have been recorded. This expansion largely involves secondary succession dominated by shrubs and degraded tree species rather than mature, ecologically stable forests. Such formations typically have lower biodiversity compared to primary forests, limited carbon sequestration capacity, and minimal commercial timber value. From an agricultural perspective, their spread signifies the irreversible loss of arable land, while for tourism, these degraded landscapes lack the aesthetic and recreational qualities of managed forests or traditional rural scenery. Consequently, rather than representing an ecological gain, this type of reforestation reflects a transitional and low-value land cover state, offering limited benefits for ecosystem services or local development. The most pronounced increases were observed in the border zones with Romania (forest area growth of 56%) and Bulgaria (18%). At the level of Serbia, forests and grassland areas increased from 31,662.74 km2 to 32,258.71 km2 (change index: 101.9). This result implies greater increases in forest and grassland areas in the rural border region in comparison to the increasing at the national level.
While significant reductions in agricultural land are evident in the border areas with Bulgaria, Montenegro, and North Macedonia, agriculture remains stable and intensive in the lowland border zones. In hilly regions, a shift from arable crops to fruit production has also been observed, reflecting a tendency toward less labor-intensive agricultural practices. At the level of Serbia, agricultural lands decreased from 42,422.554 km2 to 41,238.370 km2 in the period 1990–2018 (change index: 97.2). The values of the change index of agricultural lands are similar between the rural border area of Serbia and the entire territory of Serbia.
The increase in Industrial Zones in the border area of Serbia (change index: 133) is less in comparison with the increase at the national level from 172,069 km2 to 255,443 km2 (change index: 148.5). Transport infrastructure at the rural border area of Serbia increased from 4.28 km2 to 4.71 km2 (change index: 110). The increase in this category of land use is greater at the national level, with a change index of 117.7 (from 31.3 km2 to 36.84 km2).
The increase in areas of Mineral Resource Extraction zones are higher in rural border areas of Serbia (change index: 175) than the increase in this category at the national level, with a change index of 150.2 (from 95.46 km2 to 143.39 km2). The increase in areas of Urban Green Spaces, Sports and Recreational Facilities is higher in rural border areas of Serbia (change index: 206) than the increase at the national level, with a change index of 126.
4.4. Correlation Between Land Use Changes and Demographic Dynamics
In this subsection, a correlation analysis was conducted to examine the relationships between land use changes (based on CORINE Land Cover data from 1990 to 2018) and key demographic change indexes and indicators for Serbia’s rural border municipalities, with the aim of identifying patterns of spatial transformation associated with population decline. Correlation analysis confirms a strong link between land use changes and demographic processes in Serbia’s rural border areas. The most substantial land use and demographic changes were recorded along the border with Bulgaria, where both the population and household change indices are the lowest. The border belt with Montenegro is characterized by an increase in the share of single-person households and functionally dependent populations, coupled with a simultaneous decline in economically active residents (Table 4), indicating a deepening demographic dependency and reduced labor force potential.
Table 4.
Correlation between changes in land use and demographic changes in rural border area of Serbia.
The strongest positive correlation was identified between the reduction in agricultural land and the index of change in the number of households (r = 0.85), suggesting that households previously dependent on agriculture are gradually ceasing to exist. Conversely, forest and grassland expansion shows a strong negative correlation with most demographic indicators, particularly with the number of households (r = −0.74), reflecting processes of abandonment and rural depopulation.
Transport infrastructure exhibits a positive correlation with most demographic variables, most notably with the aging coefficient (r = 0.86), possibly reflecting a concentration of aging populations in more accessible areas. Meanwhile, industrial land exhibits predominantly weak negative correlations with population indicators, suggesting that limited industrial development in these rural border areas neither attracts nor retains population. This implies that existing industrial zones are too small, poorly connected, or economically weak to generate significant employment opportunities, meaning they fail to counteract out-migration or stimulate demographic stabilization.
5. Discussion
Since the 1950s, abandoned land has accumulated to up to 400 million ha globally, an area roughly half the size of Australia [66]. Demographic changes (population decline and aging workforce) have been identified as the main cause or one of the main causes of land abandonment in Europe and worldwide [66,67,68,69,70,71,72,73,74,75,76,77,78], but also in Serbia [7,19,30,79,80,81,82,83]. Although the driving forces behind it can be multifold and versatile, rural depopulation and urbanization are significant contributors to agricultural land abandonment [84].
The results of our research highlight the complex interdependence between demographic decline and land use change in the rural border areas of Serbia. The data confirm that processes of depopulation and population aging are closely linked to the abandonment of agricultural land and the expansion of forest and grassland areas, especially in hilly and mountainous regions. These transformations reflect not only long-term structural and socio-economic challenges but also a form of systemic demographic erosion, a gradual but persistent weakening of demographic structures caused by the combined effects of low birth rates, population aging, and long-term outmigration, particularly in marginalized and institutionally neglected rural areas. A particularly significant finding is the strong positive correlation between the reduction in the number of households and the decline in agricultural land (r = 0.85), suggesting that household closures directly contribute to land abandonment. This result aligns with previous studies that explored the influence of demographic factors on land use change in Central and Eastern Europe [29,53]. Moreover, the increase in forest and grassland cover in depopulated regions of southeastern Serbia confirms similar trends identified in Slovenia, Spain, and Romania, where rural exodus has triggered spontaneous vegetation succession and reforestation [25,28,53]. The study also confirms the existence of persistent demographic processes, such as the strong negative correlation between the aging index and natural population growth (r = −0.81), in line with findings across the broader European context. In many peripheral and mountainous rural areas, aging and the rise in single-person (often elderly) households are dominant trends [14,18]. The growing share of single-person households in border municipalities mirrors findings from Eurostat research, which point to profound demographic and social changes in rural EU regions [21].
However, certain results diverge from broader European patterns. In parts of Western Europe, the effects of depopulation have been partly mitigated through return migration, internal mobility, or adaptive reuse of rural areas [20]. In contrast, such compensatory mechanisms are almost absent in Serbia’s border municipalities. Unlike the cases of Portugal and Italy, where local identity and rural tourism are leveraged as tools for revitalization [25], these potentials in Serbia remain underutilized and insufficiently integrated into national development policies. This reflects a continued pattern of centralized state development and the practical absence of a regional administrative level in Serbia, as noted by Joksimović & Golić [2].
From a methodological perspective, this study represents a valuable attempt to quantitatively link long-term demographic indicators with spatial land use data. Nonetheless, some limitations must be acknowledged, such as the spatial resolution constraints of the CORINE database and the limited incorporation of broader migration and economic contexts (e.g., national and regional policies, urbanization, and economic conditions in neighboring countries).
Overall, the land use transformations identified in this study, such as the abandonment of agricultural land, the spread of secondary vegetation and unmanaged forests, and the shrinkage of cultivated areas, reflect not only the demographic vulnerabilities of rural border areas, including population aging, depopulation, and a shrinking active workforce, but also an institutional deficit in terms of policy response and strategic land management. Although formal rural development strategies exist, their practical implementation is hindered by numerous obstacles. Sustainable revitalization of these areas requires integrated, cross-sectoral policies that simultaneously address population retention and multifunctional land use. This includes connecting traditional agriculture with innovation and tourism.
This research supports the broader European literature on the demographic causes of land abandonment and vegetation succession, while also shedding light on the specific patterns of marginalization and spatial inertia in Serbia’s rural border areas. Without systemic and coordinated interventions, there is a high risk that these areas will continue along a path of socio-economic erosion and spatial degradation.
Although there is a broad consensus that depopulation has a decisive impact on changes in land use, some authors warn that land abandonment cannot be seen solely as a consequence of demographic trends. Estel et al. [85] point out that institutional frameworks, agricultural subsidies and local land management strategies often have an equally important or even more crucial influence. Socio-economic and institutional barriers such as lack of market opportunities, weak rural development policies and negative perceptions of living in the countryside are also important [86]. Land abandonment is often encouraged by external factors, such as the neoliberal economic model, which in Chile reduced access to land, led to loss of cultural identity and traditional livelihoods associated with working the land, in which former peasants migrate to urban areas and are incorporated into activities in the tertiary economic sector [87,88]. Natural factors, such as the proximity of forests, topographical constraints, soil quality and productivity, play a significant role in explaining land abandonment processes. Additionally, land abandonment is influenced by factors connected with policy, governance, the legal system, economics, culture, and human behavior, including, for example, land ownership structures and infrastructure accessibility [89]. Our research identified links between demographic changes and land use in Serbia, but the process of land abandonment is certainly influenced by all the previously mentioned drivers.
Numerous studies indicate that land abandonment is more pronounced in developed parts of the world, such as Europe, the United States of America, Australia and Japan, while in poor regions (Africa, Latin America, parts of Asia) these processes are much less prevalent [77,90,91]. This is a consequence of the fact that in Global South countries, especially in sub-Saharan Africa, demographic growth in rural areas is still high and agriculture has no alternative; i.e., it is often the only source of survival for the poor population. Due to demographic expansion and poverty, people still rely on agriculture for basic subsistence, even if it is not market-competitive; the land is under great pressure and is being used as unproductively as it is, and the conversion of forests to arable land is still very pronounced [92,93]. At the European level, in post-communist Eastern Europe (which includes Serbia in a broader sense), the abandonment of agricultural land after the 1990s was on a larger scale than in Western Europe. The main causes include the transition to a market economy, the collapse of collective farms and mass migration of the young population to cities or abroad [94,95]. At an even lower level, within certain European countries, less fertile land with numerous ecological restrictions is abandoned in hilly and mountainous areas that are economically marginalized, while more fertile land in the lowlands is abandoned to a much lesser extent [85,96,97,98]. As already mentioned, this is also the case in Serbia, where agricultural production is planned to be intensified in the northern lowlands, while hilly and mountainous areas in the central and southern parts of the country face a significant reduction in arable land [99].
In some cases, rural depopulation does not lead to land abandonment, but rather to an increase in agricultural land, but such cases are rare and are the result of state intervention. To address the problem of land abandonment, the Chinese central government issued the land transfer policy on agricultural land in 2014. This policy allows rural households to trade their land usage rights to others, if they are unwilling or unable to engage in agricultural production [100]. As a result of this policy, in the Taibus region of Inner Mongolia, 64.3% of the rural population migrated to other regions in 2020; however, arable land has increased by more than 10% in the last five years [75]. It shows the paradox of rural depopulation that stimulates land abandonment, but also the expansion of arable land through land transfers and land protection policies. However, such cases of simultaneous depopulation and increase in agricultural land are rare and, according to the available literature and our field research, have not been recorded in Serbia, or are of negligible extent.
Although previous research identified drivers and environmental impacts of land abandonment, few described what happens to abandoned land [101]. Opportunities that arise from abandoned lands have received little attention [102]. Few studies have discussed possible pathways for reutilisation of abandoned farmland [86]. Studies mostly focus on abandonment as an end-state, but some studies indicate it is also the start of new land use. In a study that analyzed 115 cases of land abandonment throughout Europe, three main trends in the use of abandoned land were determined: return to agricultural uses, revegetation, and urban transformation. Despite the potential for various uses, in as many as 85% of cases abandoned land undergoes a process of spontaneous vegetation succession (revegetation) [101]. This is in accordance with numerous studies, which highlighted secondary succession as the most common consequence of land abandonment [103]. Only a minority of lands (13% of case studies) returned to different forms of agricultural uses, and a negligible percentage (2%) went through urban transformation [101]. The return of agriculture on abandoned agricultural land in Serbia is negligible, because abandoned hill/mountain land is generally not worth recultivating due to natural limitations (low fertility, large terrain slopes), inaccessibility and isolation, poor road infrastructure, lack of labor force, market uncompetitiveness, etc. [99].
Although depopulation and land abandonment are generally considered negative processes from the point of view of socio-economic development, some authors point out that they bring certain spatial and ecological benefits [74,101,104]. The main benefits relate to the regeneration of natural ecosystems (the return of forest vegetation, indigenous plant species and wild animals) [30,54,105,106,107], reduction in anthropogenic pressures on the land [54], reduction in soil erosion caused by intensive farming or grazing [30,74,108], reduction in surface runoff and improvement of water quality [30,108,109,110], general reduction in environmental pollution, opportunities for the development of ecotourism and conservation projects, release of land for other purposes, etc. Abandoning agriculture that inadequately treated the soil with chemicals starts the processes of natural decontamination and cleaning of the soil from harmful substances. Abandonment of land, often accompanied by the return of forest vegetation, generally has a positive impact on reducing erosion in areas that were previously cultivated in an inadequate way [56,74,108,109,111,112], but also contributes to the fight against climate change, as it enables carbon sequestration [113,114,115,116,117,118]. The effects of these and similar processes in the abandoned rural border areas of Serbia have hardly been investigated so far [7,30], with the exception of the impact of depopulation on the intensity of erosive processes [10,55,57,58,80,82].
One of the most significant benefits relates to the fact that abandoning agriculture frees up areas that can be used in a more economically efficient and environmentally friendly way compared to the extensive farming that was practiced before. Such surfaces have become known in recent literature as so-called rural brownfield or agricultural brownfield [7,119,120,121]. Around the world, abandoned land spaces are increasingly being used for the production of energy from renewable sources [74,122,123]. In this sense, one of the most realistic scenarios in Serbia is the construction of solar power plants on abandoned land, for which there is good potential [124,125]. This would, in addition to increasing energy efficiency, reduce the need for fossil fuels and contribute to the fight against climate change. Of all the possible types of economic revitalization of abandoned land in border rural areas of Serbia, this one has proven to be the most successful in practice, because some solar power plants have already been built in border municipalities (Nova Crnja, Kikinda, Kladovo). Recent research shows that of the 100 most favorable locations for the construction of solar power plants in Serbia, as many as 27 are located in border municipalities (Zaječar: 4; Sombor and Subotica: 3 each; Sjenica, Loznica, Sremska Mitrovica, Kanjiža and Babušnica: 2 each; Čajetina, Kikinda Žitište, Bela Crkva, Negotin, Pirot and Bujanovac: 1 each) [126]. Abandoning agricultural land also creates benefits for the use of other renewable energy sources, primarily wind energy. For example, in the rural border areas of Serbia, there is significant potential for the use of wind energy, especially in the areas of southern Banat, eastern Serbia and the Peštar plateau [127,128,129]; this potential has already been partially utilized by building wind farms in the municipalities of Tutin, Vršac, Golubac, etc. Observing abandoned rural areas as development resources (rural brownfields) and not as limitations with a strategic approach can help create economic benefits for rural border municipalities of Serbia and contribute to more efficient land use.
The comparison of the demographic processes of the border areas of Serbia and neighboring countries encounters methodological difficulties due to the different definition of the border area, the existence of different degrees of administrative division (municipalities, cities, districts, communes), different census years and the lack of census data in the 21st century for the border municipalities of Serbia in Kosovo and Metohija towards Montenegro, Albania and North Macedonia. Despite this, if we ignore these differences and compare demographic changes of border areas in Serbia with demographic changes in border areas of neighboring countries in the period between the first and last population census held in the 21st century, similar trends are observed, i.e., population loss is present in the border zone towards all neighboring countries, on both sides of the border (Table 5).
Table 5.
Changes in the number of inhabitants in the border zone of Serbia and neighboring countries in the 21st century *.
The biggest demographic decline was achieved in the Serbia–Bulgaria border zone, with 29.4% in Serbia and even 35.2% in Bulgaria. Along the border with Croatia, the number of inhabitants on the Serbian side decreased by 26.7% and on the Croatian side by 33.9%. In the border zone with Romania, the depopulation was 29.1% in Serbia and 20.8% in Romania. Along the border with Hungary, the demographic decline is much more pronounced in Serbia (21.9%) than in Hungary (8.4%). In the border zone with Montenegro, the number of inhabitants in Serbian municipalities decreased by 12.9% and in Montenegrin municipalities by 20.0%. Along the border with North Macedonia, the demographic decline was the same on both the Serbian and Macedonian sides, amounting to 10.2% (Table 5). It is evident that all neighboring countries in their border area towards Serbia face the same or similar demographic problems, with the fact that in the border area towards Romania and Hungary, depopulation is more pronounced on the Serbian side of the border, while in the border area towards Montenegro, Bulgaria and Croatia it is more pronounced in the neighboring countries. It is certain that similar trends exist in the border zone of Serbia with Albania and Bosnia and Herzegovina, but a quantitative comparison is not possible, because no official population census was held in the border zone of Serbia with Albania in the 21st century, while in Bosnia and Herzegovina, after the collapse of the Socialist Federal Republic of Yugoslavia (SFRY), only one census was held in 2013.
The impact of the economic, demographic and political trends of the neighboring countries on the situation in the rural border areas of Serbia has not been sufficiently investigated, but the available research indicates that the intensity of cross-border ties and the use of opportunities for cross-border cooperation are at a low level [139,140,141,142]. A number of factors influenced this: the wars and economic crises in the former Yugoslavia in the 1990s broke the previous economic ties, which were not later restored to their former level; neighboring rural settlements on both sides of the border are often very poorly connected, among other things due to natural barriers, e.g., the Danube river towards Croatia and Romania and the Drina towards Bosnia and Herzegovina, Stara planina towards Bulgaria; frequent socio-political crises in Serbia from the 1990s until today; administrative barriers; pronounced asymmetry in development between bordering regions of Serbia and neighboring EU countries; distance of main economic centers from borders; etc. [142].
When some neighboring countries became members of the European Union (Hungary in 2004, Romania and Bulgaria in 2007, Croatia in 2013), it was expected that the positive effects of this membership would also be seen in the border areas of Serbia. For Serbia this meant on the one hand that it could enlarge its relations with the neighbors within the process of transition, and on the other hand that easier access to pre-accession funds was created through the implementation of strong cohesion relations, and the access to the funds was enabled [143,144,145]. However, significant impeding circumstances are related to a barrier effect of the border that is of particular importance given the fact that Serbia is located on the external borders of the EU [146]. The entry of neighboring countries into the European Union did not make the borders more permeable and did not make a significant positive contribution to the development of the border zone of Serbia towards those countries, among other things due to formal administrative/legal obstacles related to the competences of local self-government. Hungarian, Romanian and Croatian local-government systems are single-leveled, which means that all but the smallest settlements have their own local governments. In Serbia this is not the case, however. As a result, there are many cases in which municipalities make connections only with partner cities of similar size, while small settlements vainly seek individual good relations with the people of some settlements on the other side of the border, as there is no administrative body with which to connect and implement projects. These municipal systems present a significant administrative disadvantage for those living in small settlements, as their participation in projects is also limited in this way [146]. Although rural border municipalities can use pre-accession funds, projects have mainly been implemented in larger border urban centers (e.g., Sombor, Subotica, Vršac, Zaječar, Pirot, etc.), while poorly developed and demographically small rural municipalities remain marginalized due to their low absorption capacity [144].
The non-compliance of the Serbian economic and legal system with the standards of the European Union is one of the key factors that make it difficult to use the potential of cross-border cooperation in the border zone. Despite the proximity of urban centers such as Szeged or Timisoara, daily cross-border labor migration is also relatively modest in scale due to administrative barriers. Over the past three decades, the European Union has made various instruments of pre-accession assistance available to Serbia and other Western Balkan countries. The aim of these instruments is to help the Western Balkan countries overcome the challenges of the transition process and join the European integration process. Part of this assistance also concerns cooperation projects between border municipalities. In the last two decades, many such projects have been implemented, but real development effects have not been achieved to a significant extent [141].
Some residents of the border zones of Serbia have moved to members of the European Union, so in addition to the Serbian passport, in the last 15 years or so, they have also received citizenship of a neighboring country (especially Hungary and Croatia). However, possession of passports of European Union member states is most often used to secure travel freedom and facilitate emigration, i.e., leaving Serbia [147]. Research shows that migrant-sending states that allow dual citizenship experience significantly more emigration than dual-citizenship-forbidding migrant-sending states [148]. For example, by 2018 over 180,000 citizens of Serbia had obtained a second citizenship from Hungary. For residents of the border areas of Vojvodina with Hungarian citizenship comes European Union citizenship and the ability to work and study anywhere in the EU or to permanently move to the EU [147]. In this way, obtaining dual citizenship had negative demographic effects in the border zone of Serbia towards the countries of the European Union, because it encouraged and facilitated emigration, since holders of European Union passports have the right to freely move, live and work in any EU country without visas and work permits, which are necessary for those who have only Serbian citizenship.
Euroregions, as a form of strengthening cross-border cooperation, were one of the forms that gave the border regions of Serbia a chance for development. Since the 1990s, the border areas of Serbia have entered into formal cooperation with neighboring countries through the following Euroregions: Danube 21 with Bulgaria and Romania, Middle Danube–Iron Gates with Romania, Danube–Criș–Mureș–Tisa with Romania and Hungary, Drina–Sava–Majevica with Bosnia and Herzegovina and Croatia, Eurobalkan with Bulgaria and North Macedonia, Stara planina with Bulgaria, and Nišava with Bulgarian. However, the Euroregions did not achieve significant results in the economic and demographic development of the border zone [3,144]. In most cases, they only “exist on paper”. None of them have established stable sources of financing and an operational structure that would enable the realization of specific projects (agriculture, industry, transport, culture, education, tourism, cross-border employment, renewable energy sources, environmental protection, etc.) and improve cross-border cooperation. Local development, socio-economic benefits and demographic revitalization remain marginal [3]. Reasons include insufficient transparency of projects, weak participation of local actors, lack of sustainability control and centralized management without local capacity. Even the oldest among them, the Euroregion Danube–Criș–Mureș–Tisa is ineffective: in spite of the structural reform, the different political systems and the centralized, bureaucratic competences of the member states are still barriers to cooperation [144]. Despite implemented projects, the intensity of cooperation is incomparably lower than in Euroregions in Western Europe because homogenization processes are significant barriers to the development of border regions [149].
The influence of cross-border cooperation and its importance for the development of the border areas of Serbia have been examined the most in the northern part of the country (Vojvodina). In researching the results of the Interreg-IPA program in the period 2014–2020 for the border areas of Serbia with Hungary, Croatia, Romania and Bosnia and Herzegovina, it was concluded that, although programs are available, the utilization of funds is only about 50%, and projects are usually not maintained permanently. Problems of sustainability, weak local participation and limited influence on the economic development of border regions were pointed out [146]. The results of the projects are modest in terms of socio-economic transformation. The projects mostly remain at the level of cultural or environmental initiatives without a substantial contribution to starting local economies and stopping demographic stagnation in border municipalities [150].
Despite numerous restrictions and the generally low and unsatisfactory level of economic ties between the border rural areas of Serbia and neighboring countries, there are significant differences in the degree of cooperation with different neighbors, which is largely determined by the morphology of the terrain (plains and mountains), the level of development, cultural–historical ties, the negative legacy of the recent past (wars, nationalism), etc. Due to the flat terrain, cultural and historical ties from the time of Austria–Hungary and the fact that its neighbors are members of the European Union, Vojvodina has been particularly active in cross-border cooperation, with significant project funding and established networks. Vojvodina has a well-established framework for cross-border cooperation, with numerous projects funded and a regional government supporting initiatives. Vojvodina’s cultural diversity and established institutions contribute to its better results in cross-border cooperation compared to other Serbian regions [142].
Other border regions of Serbia lack similar research and data, indicating weaker cross-border cooperation and lower financial allocations [142]. For example, Serbia’s border with Bulgaria is mountainous for almost its entire length, with no good roads between neighboring rural settlements and with a very old population that is intensively decreasing in both countries, and several settlements have been completely abandoned. In this cross-border area, the demographic parameters are the worst on the entire border of Serbia towards neighboring countries, and the abandonment of agricultural land is intense. Despite the existence of several Euroregions on the Serbia–Bulgaria border, cross-border cooperation is at a low level and cannot contribute to stopping negative processes on both sides of the border [151], and the proximity of larger urban centers (Niš and Sofia) does not affect the mitigation of depopulation, but on the contrary encourages emigration. The fact that the rural regions of Bulgaria are generally considered the poorest parts of the European Union is also important [152,153]. Although cross-border projects have been implemented, it is questionable whether the projects really improve the well-being of the people in the region in a sustainable way. The economy and demography of the rural part of the border zone practically did not profit, and cooperation remains more at the institutional/formal level [154].
6. Practical Implications for Development Strategy and Policymakers
A variety of proposed measures address the complex challenges facing rural areas, spanning demographic, economic, infrastructural, and socio-cultural dimensions. To tackle demographic decline, scholars have suggested encouraging immigration and increasing birth rates through supportive family policies. One potential avenue for revitalization is the seasonal activation of rural areas through tourism, recreation, and targeted investments [155]. Numerous solutions have been proposed within the framework of tourism development, which is seen as a catalyst for economic diversification and spatial reactivation. These include the development of cross-border tourism [156], sustainable tourism [157], rural tourism [158], agritourism [159], and farm-based tourism [160]. Beyond tourism, other revitalization strategies involve the relocation of industrial facilities to rural areas through so-called Greenfield industrial parks, the generation of renewable energy sources [161], and the development of digital infrastructure and improved transportation networks [162]. Investments in information and communication technologies (ICT) have also been identified as essential for bridging the urban–rural digital divide [163,164]. Additional measures include support for rural entrepreneurship [165] and the valorization of endogenous resources through local culture, traditions, and community-based initiatives [166]. In the context of integrated rural development, agriculture can serve not only an economic function but also as a vehicle for the formation of territorial identity [167]. Each village in Serbia possesses unique customs and traditions, passed down “from generation to generation” [168], representing valuable cultural capital that can be mobilized for the creation of distinct rural identities.
Numerous development programs focus on rural revitalization across Europe and beyond. The Defasio program, for example, engages university students in rural internships to foster local development and social innovation [169]. The National Strategy for Inner Areas in Italy promotes tailored policies for peripheral regions [20]. The European Commission’s “Long-Term Vision for Rural Areas” (LTVRA) outlines a strategic framework for strengthening the role of rural areas in the EU’s socio-economic fabric [161]. Other notable programs include the National Demographic Project of the Russian Federation [170] and cross-border Euroregion cooperation, particularly along hydrographic corridors such as the Drina River between Serbia and Bosnia and Herzegovina, which support transboundary tourism and regional development [3].
Border regions, although historically sites of division, are increasingly being recognized as zones of contact and diversity, where differences in political systems, administrative structures, cultures, and everyday practices intersect [171]. In this context, cross-border cooperation emerges as a key driver of development. Examples include rural collaboration between Russia and Belarus [172], sustainable tourism initiatives between Kazakhstan and Uzbekistan [173], and cultural cooperation between Serbia and Romania [174]. To further support the integration and development of border regions, the European Union allocated EUR 10 billion for cross-border cooperation through Interreg programs during the 2014–2020 budget cycle, with comparable investments planned for the current programming period [175].
The recommendations outlined in this section are based on indicative patterns observed through correlation analysis and a review of regional development literature. However, policy formulation and implementation should be guided by more comprehensive multi-level assessments, considering the institutional, cultural, and economic specificity of each border region. The proposed development guidelines should be considered as preliminary and subject to refinement through in-depth socio-economic studies, stakeholder engagement, and territorial diagnostics.
7. Conclusions
Demographic processes in the settlements of Serbia’s rural border areas have demonstrated marked dynamics over the past decades, primarily characterized by depopulation and population aging. These trends have fundamentally altered population structures and, consequently, patterns of land use. The findings of this research confirm that negative natural population growth, when combined with intensive migration flows, has led to a substantial decrease in the number of inhabitants across the majority of analyzed municipalities that compose the borders of the country. Simultaneously, the increase in average age and the growing share of single-person households signal a heightened level of social and economic vulnerability in these areas.
The correlation analysis has shown that key demographic variables, particularly natural increase in population and migration balance, are directly associated with reductions in agricultural land and the expansion of abandoned or reforested areas. This trend is especially evident in hilly and mountainous regions, where the spontaneous reforestation of former arable land is accelerating.
The results of the conducted research represent the starting point for the next stage of research on land cover changes and demographic and development processes in the rural border area of Serbia. In the next stage of research, it is necessary to include more variables concerning socioeconomic (e.g., employment and available workforce), infrastructural (e.g., quality of road network and local communications), political–legal (e.g., EU accession process and cross-border cooperation) and other features. Future research should focus on realistic possibilities of economic revitalization (renewable energy sources, tourism, organic agriculture, protection and conservation, etc.), with the full awareness that in the current demographic and socioeconomic conditions, it is not realistic to expect even a partial demographic revitalization. Part of the research can be carried out in the form of case studies that can give concrete recommendations to the local authorities of certain rural border municipalities of Serbia.
This research should aim to identify sustainable rural development models that can help slow negative demographic trends while supporting the optimal use of land resources in Serbia’s rural border areas. It is important to acknowledge that land abandonment and subsequent reforestation can also be interpreted as part of a natural ecological transition, potentially offering benefits such as biodiversity recovery, soil regeneration, and carbon sequestration, rather than being inherently negative. Further research could combine qualitative methods, such as field interviews and participatory rural appraisals, to enrich our understanding of local development potential and constraints. At present, institutional responses to these challenges remain limited or ineffective. Despite the existence of formal rural revitalization strategies, their implementation is often hindered by insufficient financial support, weak intergovernmental coordination, the lack of a long-term development vision, and the absence of systemic monitoring and evaluation mechanisms.
This study ultimately underscores the need for an integrated approach to the planning and management of rural and border areas—one that considers socioeconomic and spatial dimensions as mutually dependent components of development. In the long run, only sustainable, multifunctional resource management frameworks, linking agriculture, forestry, tourism, and local entrepreneurship, can mitigate depopulation and foster resilience in this region.
Author Contributions
Conceptualization, V.M., M.S. and F.K.; methodology, V.M., M.S., F.K., M.J. and R.G.; data collection M.J. and R.G.; writing—original draft preparation, V.M., M.S. and F.K.; writing—review and editing, M.G., S.V. and D.Š. All authors have read and agreed to the published version of the manuscript.
Funding
This research was funded by the Ministry of Education, Science and Technological Development of the Republic of Serbia, grant number 451-03-47/2023-01/200091.
Data Availability Statement
The original contributions presented in this study are included in the article. Further inquiries can be directed to the corresponding author.
Conflicts of Interest
The authors declare no conflicts of interest.
Appendix A


Figure A1.
Pearson correlation matrix of demographic and synthetic indicators in the rural border area of Serbia in 2002 (a), 2011 (b) and 2022 (c) censuses.
Figure A1.
Pearson correlation matrix of demographic and synthetic indicators in the rural border area of Serbia in 2002 (a), 2011 (b) and 2022 (c) censuses.


Table A1.
Descriptive statistics of demographic indicators in the rural border area of Serbia (2002–2022).
Table A1.
Descriptive statistics of demographic indicators in the rural border area of Serbia (2002–2022).
| Year | TP | PCI | NH | HCI | SPH | NI | MB | AA | AC | RP | HE | AP | FDR | AHS | |
|---|---|---|---|---|---|---|---|---|---|---|---|---|---|---|---|
| Ar | 2002 | 20,470.7 | 88.6 | 6662 | 97 | 20.9 | −3.5 | −46.4 | 41.0 | 110.8 | 54.1 | 2.7 | 41.8 | 283.2 | 3.1 |
| 2022 | 14,748.8 | 83.2 | 5414.3 | 91 | 28 | −10.3 | −65.2 | 45.2 | 171.8 | 59.6 | 8.2 | 31.8 | 282.6 | 2.7 | |
| Max | 2002 | 67,730 | 102.8 | 20,718 | 124.4 | 32.3 | 28.9 | 208.6 | 54.5 | 475.3 | 100.0 | 4.6 | 49.2 | 425.6 | 5.1 |
| 2022 | 54,269 | 103.9 | 18,484 | 139.1 | 48.5 | 7.8 | 76.4 | 56.4 | 612.1 | 100.0 | 30.9 | 39.8 | 473.3 | 4.5 | |
| Min | 2002 | 2563 | 60.8 | 1144 | 79.1 | 5.1 | −23.6 | −350.5 | 29.3 | 27.1 | 24.7 | 0.9 | 21.1 | 239.1 | 2.2 |
| 2022 | 1063 | 63.0 | 565 | 68.5 | 8.6 | −37.3 | −145.4 | 33.8 | 42.8 | 23.6 | 3.8 | 18.5 | 229.1 | 1.9 | |
| IV | 2002 | 65,167 | 42.0 | 19,574 | 45.3 | 27.1 | 52.5 | 559.1 | 25.2 | 448.2 | 75.3 | 3.7 | 28.2 | 186.6 | 2.9 |
| 2022 | 53,206 | 40.9 | 17,919 | 70.6 | 39.9 | 45.1 | 221.7 | 22.6 | 569.3 | 76.4 | 27.1 | 21.4 | 244.1 | 2.6 | |
| Med | 2002 | 17,104.5 | 89.8 | 5182.5 | 94.8 | 21.5 | −5.6 | −32.3 | 41.5 | 115.5 | 62.8 | 2.6 | 40.8 | 280.0 | 2.9 |
| 2022 | 10,988.5 | 81.0 | 4266.5 | 90.7 | 29.9 | −14.4 | −70.3 | 45.5 | 178.7 | 57.4 | 8.0 | 31.2 | 274.8 | 2.5 | |
| CV | 2002 | 67.6 | 11.3 | 65.3 | 8.8 | 26.1 | −237 | −261.2 | 12.2 | 85.7 | 44.4 | 34.9 | 15.6 | 14.8 | 18.9 |
| 2022 | 77.1 | 10.6 | 70.5 | 12.4 | 23.6 | −85.4 | −68.1 | 10.4 | 76.3 | 50.8 | 48.7 | 13.8 | 19.5 | 18.2 | |
| SD | 2002 | 13,841.9 | 10 | 4350.9 | 8.6 | 5.5 | 8.3 | 121.2 | 5 | 95 | 24 | 0.9 | 6.5 | 41.9 | 0.6 |
| 2022 | 11,375.1 | 8.8 | 3819 | 11.3 | 7.3 | 8.8 | 44.4 | 4.7 | 131 | 25.4 | 4.0 | 4.7 | 55.2 | 0.5 | |
| CS | 2002 | 0.7 | −0.4 | 1 | 0.8 | −0.3 | 0.7 | −0.3 | −0.3 | −0.1 | −1.1 | 0.2 | 0.5 | 0.2 | 0.8 |
| 2022 | 1 | 0.7 | 0.9 | 0.1 | −0.8 | 1.4 | 0.3 | −0,2 | −0.2 | −0.9 | 0.2 | 1.8 | 0.4 | 1.1 |
References
- Lalić, M.; Bubalo Živković, M.; Đerčan, B.; Tekić, D. Quality of Life as a Limiting Factor in the Development of the Region along the Great Bačka Canal (Serbia). Sustainability 2024, 16, 2391. [Google Scholar] [CrossRef]
- Joksimović, M.; Golić, R. Indicators of Regional Inequality in Serbia. Collect. Pap. Fac. Geogr. Univ. Belgrade 2017, 65, 227–252. [Google Scholar] [CrossRef]
- Stankov, S.; Perić, M.; Doljak, D.; Vukovic, N. The Role of Euroregions as A Factor of Spatial Integration and Regional Development-The Focus on The Selected Border Area. J. Geogr. Inst. Cvijic 2021, 71, 295–310. [Google Scholar] [CrossRef]
- Viñas, C.D. Depopulation processes in European rural areas: A case study of Cantabria (Spain). Eur. Countrys. 2019, 11, 341–369. [Google Scholar] [CrossRef]
- Mickovic, B.; Mijanovic, D.; Spalevic, V.; Skataric, G.; Dudic, B. Contribution to the analysis of depopulation in rural areas of the Balkans: Case study of the Municipality of Niksic, Montenegro. Sustainability 2020, 12, 3328. [Google Scholar] [CrossRef]
- Wojewódzka-Wiewiórska, A. Depopulation in rural areas in Poland–Socio-economic local perspective. Res. Rural Dev. 2019, 2, 126–132. [Google Scholar] [CrossRef]
- Joksimović, M. Natural Resource Management in Depopulated Regions of Serbia—Birth of Rural Brownfields or Final Abandonment. Land 2025, 14, 403. [Google Scholar] [CrossRef]
- Anđelković-Stoilković, M. Representation of the demographic problems of Serbian border region in public policy. Demografija 2019, 16, 103–118. [Google Scholar] [CrossRef]
- Gallardo, M.; Cocero, D. Using the European CORINE Land Cover Database: A 2011–2021 Specific Review. In Sustainable Development Goals in Europe; Springer: Cham, Switzerland, 2023; pp. 303–325. [Google Scholar] [CrossRef]
- Krstić, F.; Paunović, S. Changes in soil erosion intensity in Jablanica region. Collect. Pap. Fac. Geogr. Univ. Belgrade 2022, 70, 83–93. [Google Scholar] [CrossRef]
- Gatarić, D.; Đerčan, B.; Živković, M.B.; Ostojić, M.; Manojlović, S.; Sibinović, M.; Lukić, T.; Jeftić, M.; Lutovac, M.; Lutovac, M. Can depopulation stop deforestation? the impact of demographic movement on forest cover changes in the settlements of the South Banat District (Serbia). Front. Environ. Sci. 2022, 10, 897201. [Google Scholar] [CrossRef]
- Gilbert, J.; Banik, N. Socio-Economic Impacts of Regional Transport Infrastructure in South Asia. In Infrastructure for Asian Connectivity; Edward Elgar Publishing: Cheltenham, UK, 2012; pp. 139–163. [Google Scholar]
- Todorović, M.; Drobnjaković, M.; Gligić-Simeunović, A. Specifics of rural areas of Serbia from the aspects of regional development. Econ. Agric. 2010, 57, 605–612. [Google Scholar]
- Ayuda, M.I.; Gómez, P.; Pinilla, V. Which rural settlements have lost the most population? An analysis of a case study of north-east Spain (Aragón) (1900–2001). Rural. Hist. 2023, 35, 170–188. [Google Scholar] [CrossRef]
- Mehri, N.; Messkoub, M.; Kunkel, S. Trends, determinants and the implications of population aging in Iran. Ageing Int. 2020, 45, 327–343. [Google Scholar] [CrossRef]
- Dax, T.; Fischer, M. An alternative policy approach to ruraldevelopment in regions facing population decline. Eur. Plan. Stud. 2018, 26, 297–315. [Google Scholar] [CrossRef]
- Newsham, N.; Rowe, F. Understanding trajectories of population decline across rural and urban Europe: A sequence analysis. Popul. Space Place 2023, 29, e2630. [Google Scholar] [CrossRef]
- Pinilla, V.; Sáez, L.A. What do public policies teach us about rural depopulation: The case study of Spain. Eur. Countrys. 2021, 13, 330–351. [Google Scholar] [CrossRef]
- Manojlović, S.; Sibinović, M.; Srejić, T.; Hadud, A.; Sabri, I. Agriculture land use change and demographic change in response to decline suspended sediment in Južna Morava River basin (Serbia). Sustainability 2021, 13, 3130. [Google Scholar] [CrossRef]
- Basile, G.; Cavallo, A. Rural identity, authenticity, and sustainability in Italian inner areas. Sustainability 2020, 12, 1272. [Google Scholar] [CrossRef]
- Plana-Farran, M.; Gallizo, J.L. The survival of family farms: Socioemotional wealth (SEW) and factors affecting intention to continue the business. Agriculture 2021, 11, 520. [Google Scholar] [CrossRef]
- Drobnjaković, M. Methodology of typological classification in the study of rural settlements in Serbia. J. Geogr. Inst. Cvijic 2019, 69, 157–173. [Google Scholar] [CrossRef]
- Diemer, A.; Iammarino, S.; Rodríguez-Pose, A.; Storper, M. The regional development trap in Europe. Econ. Geogr. 2022, 98, 487–509. [Google Scholar] [CrossRef]
- Almeida, M.A.P.D. Territorial inequalities: Depopulation and local development policies in the Portuguese rural world. J. Depopulation Rural. Dev. Stud. 2017, 22, 61–87. [Google Scholar] [CrossRef]
- Diaz-Sarachaga, J.M. Combining participatory processes and sustainable development goals to revitalize a rural area in Cantabria (Spain). Land 2020, 9, 412. [Google Scholar] [CrossRef]
- Čipin, I.; Ilieva, N. Coping with Demographic Decline in Croatia and Bulgaria; Friedrich-Ebert Stiftung: Zagreb, Croatia, 2017; pp. 1–18. [Google Scholar]
- Pénzes, J.; Pásztor, I.Z.; Tátrai, P. Demographic processes in developmentally peripheral areas of Hungary. Stanovništvo 2015, 53, 87–111. [Google Scholar] [CrossRef]
- Muntele, I.; Istrate, M.; Horea-Șerban, R.I.; Banica, A. Demographic Resilience in the Rural Area of Romania. A statistical-territorial approach of the last hundred years. Sustainability 2021, 13, 10902. [Google Scholar] [CrossRef]
- Horvat, U.; Žiberna, I. The correlation between demographic development and land-use changes in Slovenia. Acta Geogr. Slov. 2020, 60, 33–55. [Google Scholar] [CrossRef]
- Živanović, V.; Joksimović, M.; Golić, R.; Malinić, V.; Krstić, F.; Sedlak, M.; Kovjanić, A. Depopulated and Abandoned Areas in Serbia in the 21st Century–From a Local to a National Problem. Sustainability 2022, 14, 10765. [Google Scholar] [CrossRef]
- Joksimović, M.; Golić, R.; Krstić, F.; Malinić, V.; Vujadinović, S.; Šabić, D.; Gajić, M.; Nikolić, O.; Momčilović-Petronijević, A.; Nikolić, V. Depopulation Cluster: Settlements with 20 or Less Inhabitants in Serbia. Demografija 2023, 20, 99–118. [Google Scholar] [CrossRef]
- Republički zavod za statistiku. Opštine i Regioni u Republici Srbiji 2011–2022; Republički zavod za statistiku: Belgrade, Serbia.
- Republički zavod za statistiku. Opštine u Republici Srbiji 2002–2010; Republički zavod za statistiku: Belgrade, Serbia.
- Republički zavod za statistiku. Popisi Stanovništva, Domaćinstva i Stanova u Republici Srbiji—Pol i Starost—Podaci Po Naseljima (2002–2022); Republički zavod za statistiku: Belgrade, Serbia.
- Republički zavod za statistiku. Popisi Stanovništva, Domaćinstva i Stanova u Republici Srbiji 2002. i 2011.—Delatnost; Republički zavod za statistiku: Belgrade, Serbia.
- Republički zavod za statistiku. Demografska Statistika 2002–2020; Republički zavod za statistiku: Belgrade, Serbia, 2021.
- Republički zavod za statistiku. Prirodno Kretanje Stanovništva u Republici Srbiji 1961–2010; Republički zavod za statistiku: Belgrade, Serbia, 2012.
- Radovanović, S.; Gigović, L.J. Demographic Processes in the Border Region Serbia to Bulgaria. Demografija 2010, 8, 105–128. [Google Scholar]
- Šantić, D. Demografski profil opštine Knjaževac prema popisu stanovništva 2022. Godine. In Proceedings of the Knjaževački Kraj–Potencijali, Stanje i Perspective Razvoja 2, Knjaževac, Serbia, 24–26 April 2024; pp. 154–163. [Google Scholar]
- Lukić, T.; Bubalo-Živković, M.; Đerčan, B.; Jovanović, G. Population growth in the border villages of Srem, Serbia. Acta Geogr. Slov. 2014, 54, 51–65. [Google Scholar] [CrossRef]
- Radić, N.; Šantić, D.; Knežević, A. Stanovništvo kao faktor razvoja područja posebne namene Vlasina. In Proceedings of the Planska i Normativna Zaštita Prostora i Životne Sredine, Palić-Subotica, Serbia, 9–11 May 2019; pp. 451–458. [Google Scholar]
- Todorović, N.; Đurkin, D. Population dynamics of rural settlements and tourism development in the Stara planina mountain area (Serbia). In Proceedings of the 11th International Conference of the Hellenic Geographical Society, Lavrion, Greece, 12–15 April 2018; Hellenic Geographical Society: Lavrion, Greece; pp. 1–10. [Google Scholar]
- Bratić, M.; Stojiljković, F. Demographic movements in rural settlements municipality of Knjaževac. Glas. Antropološkog Društva Srb. 2015, 50, 49–57. [Google Scholar] [CrossRef]
- Golubović, N.M.; Radovanović, M.; Mihajlović, M. Aktuelni demografski procesi u opštini Bosilegrad i njihov uticaj na promenu broja stanovnika u periodu od 1963. do 2014. godine. Glas. Antropološkog Društva Srb. 2017, 52, 105–112. [Google Scholar] [CrossRef]
- Marković, K.; Radivojević, A.R.; Marković, R.S. Depopulation in the Visok micro-region: Toward demographic and economic revitalization. Open Geosci. 2025, 17, 20220703. [Google Scholar] [CrossRef]
- Arsenović, D.; Đurđev, B.S.; Ivkov-Džigurski, A. The ageing of population in Kanjiža municipality. Bull. Serbian Geogr. Soc. 2009, 89, 103–114. [Google Scholar] [CrossRef]
- Kovačević, T.; Đurđev, B.; Arsenović, D. Movement of population in the Romanian border region, Case studing: Nova Crnja municipality. Geogr. Timisiensis 2009, 18, 5–17. [Google Scholar]
- Pantelić, M.; Stojanović, V.; Stojsavljević, R. Unemployment as a major issue in Vojvodina Province: A case study of Kikinda municipality. Geogr. Timisiensis 2014, 23, 51–61. [Google Scholar]
- Solarević, M.; Đerčan, B. Sremska Mitrovica and Šabac 1900–2011: Historical demographic determination of fertility by the marriage framework. Matica Srp. J. Soc. Sci. 2016, 157–158, 489–505. [Google Scholar] [CrossRef]
- Krstić, F. Depopulation and demographic aging of population: Case study municipality of Crna Trava. Collect. Pap. Fac. Geogr. Univ. Belgrade 2017, 65, 343–353. [Google Scholar] [CrossRef]
- Stojsavljević, R.; Leščešen, I.; Miljković, D.; Kalkan, K. Ethno-demographic characteristics of Temska village. Res. Rev. Dep. Geogr. Tour. Hotel Manag. 2015, 44, 32–48. [Google Scholar]
- Xie, H.; Sun, Q.; Song, W. Exploring the ecological effects of rural land use changes: A bibliometric overview. Land 2024, 13, 303. [Google Scholar] [CrossRef]
- Bruno, D.; Sorando, R.; Álvarez-Farizo, B.; Castellano, C.; Céspedes, V.; Gallardo, B.; Jiménez, J.J.; López, M.V.; López-Flores, R.; Moret-Fernández, D.; et al. Depopulation impacts on ecosystem services in Mediterranean rural areas. Ecosyst. Serv. 2021, 52, 101369. [Google Scholar] [CrossRef]
- Del Pozo, A.; Catenacci-Aguilera, G.; Acosta-Gallo, B. Consequences of land use changes on native forest and agricultural areas in central-southern Chile during the last fifty years. Land 2024, 13, 610. [Google Scholar] [CrossRef]
- Manojlović, S.; Antić, M.; Šantić, D.; Sibinović, M.; Carević, I.; Srejić, T. Anthropogenic impact on erosion intensity: Case study of rural areas of Pirot and Dimitrovgrad municipalities, Serbia. Sustainability 2018, 10, 826. [Google Scholar] [CrossRef]
- Gusarov, A.V. Land-use/-cover changes and their effect on soil erosion and river suspended sediment load in different landscape zones of European Russia during 1970–2017. Water 2021, 13, 1631. [Google Scholar] [CrossRef]
- Manojlović, S.; Srejić, T.; Sibinović, M.; Milošević, M.V.; Bajat, B.; Kostadinov, S. Impact of precipitation and human activities on suspended sediment transport load in the Velika Morava River Basin (Serbia). Arab. J. Geosci. 2022, 15, 1209. [Google Scholar] [CrossRef]
- Srejić, T.; Manojlović, S.; Sibinović, M.; Bajat, B.; Novković, I.; Milošević, M.V.; Carević, I.; Todosijević, M.; Sedlak, M.G. Agricultural land use changes as a driving force of soil erosion in the Velika Morava River Basin, Serbia. Agriculture 2023, 13, 778. [Google Scholar] [CrossRef]
- Kiziridis, D.A.; Mastrogianni, A.; Pleniou, M.; Karadimou, E.; Tsiftsis, S.; Xystrakis, F.; Tsiripidis, I. Acceleration and Relocation of Abandonment in a Mediterranean Mountainous Landscape: Drivers, Consequences, and Management Implications. Land 2022, 11, 406. [Google Scholar] [CrossRef]
- Giraud, G.; Amblard, C.; Thiel, E.; Zaouche-Laniau, M.; Stojanović, Ž.; Pohar, J.; Butigan, R.; Cvetkovic, M.; Mugosa, B.; Kendrovski, V.; et al. A cross-cultural segmentation of western Balkan consumers: Focus on preferences toward traditional fresh cow cheese. J. Sci. Food Agric. 2013, 93, 3464–3472. [Google Scholar] [CrossRef] [PubMed]
- Filipović, J. Market-oriented sustainability of Sjenica sheep cheese. Sustainability 2019, 11, 834. [Google Scholar] [CrossRef]
- Büttner, G.; Feranec, J.; Jaffrain, G.; Mari, L.; Maucha, G.; Soukup, T. The CORINE land cover 2000 project. EARSeL Eproceedings 2004, 3, 331–346. [Google Scholar]
- Bielecka, E.; Jenerowicz, A. Intellectual structure of CORINE land cover research applications in web of science: A Europe-wide review. Remote Sens. 2019, 11, 2017. [Google Scholar] [CrossRef]
- Treiman, D.J. Quantitative Data Analysis: Doing Social Research to Test Ideas; John Wiley & Sons: Hoboken, NJ, USA, 2014. [Google Scholar]
- Schober, P.; Boer, C.; Schwarte, L.A. Correlation coefficients: Appropriate use and interpretation. Anesth. Analg. 2018, 126, 1763–1768. [Google Scholar] [CrossRef]
- Daskalova, G.N.; Kamp, J. Abandoning land transforms biodiversity. Science 2023, 380, 581–583. [Google Scholar] [CrossRef] [PubMed]
- Carver, S. Rewilding Through Land Abandonment. In Rewilding; Pettorelli, N., Durant, S.M., du Toit, J.T., Eds.; Cambridge University Press: Cambridge, UK, 2019; pp. 99–122. [Google Scholar]
- Chidi, C.L. Depopulation and rural land abandonment in the hills of Nepal. SSARSC Int. J. Geosci. Geoinformat. 2015, 3, 1–7. [Google Scholar]
- Dérer, P. Rethinking depopulation and land abandonment—The opportunity of rewilding. In The Overpopulation Project; Gothenburg University: Gothenburg, Sweden, 2018; Available online: https://overpopulation-project.com/rethinking-depopulation-and-land-abandonment-the-opportunity-of-rewilding/ (accessed on 29 July 2025).
- De Oteyza, M.O.G.; Sanchis, A.G.; Lopez, J.C. The Problem of Rural Depopulation in Spain. Towards a Sustainable, Person-Centred Model of Repopulation. Preprints 2023. [Google Scholar] [CrossRef]
- Gallardo, M.; Fernández-Portela, J.; Cocero, D.; Vilar, L. Land Use and Land Cover Changes in Depopulated Areas of Mediterranean Europe: A Case Study in Two Inland Provinces of Spain. Land 2023, 12, 1967. [Google Scholar] [CrossRef]
- Kerckhof, A.; Spalevic, V.; Van Eetvelde, V.; Nyssen, J. Factors of land abandonment in mountainous Mediterranean areas: The case of Montenegrin settlements. SpringerPlus 2016, 5, 485. [Google Scholar] [CrossRef]
- Kobayashi, Y.; Higa, M.; Higashiyama, K.; Nakamura, F. Drivers of land-use changes in societies with decreasing populations: A comparison of the factors affecting farmland abandonment in a food production area in Japan. PLoS ONE 2020, 15, e0235846. [Google Scholar] [CrossRef]
- Leal Filho, W.; Mandel, M.; Al-Amin, A.Q.; Feher, A.; Chiappetta Jabbour, C.J. An assessment of the causes and consequences of agricultural land abandonment in Europe. Int. J. Sustain. Dev. World Ecol. 2017, 24, 554–560. [Google Scholar] [CrossRef]
- Liu, Z. Rural Population Decline, Cultivated Land Expansion, and the Role of Land Transfers in the Farming-Pastoral Ecotone: A Case Study of Taibus, China. Land 2022, 11, 256. [Google Scholar] [CrossRef]
- Lloret, F.; Escudero, A.; Lloret, J.; Valladares, F. An ecological perspective for analysing rural depopulation and abandonment. People Nat. 2024, 6, 490–506. [Google Scholar] [CrossRef]
- Queiroz, C.; Beilin, R.; Folke, C.; Lindborg, R. Farmland abandonment: Threat or opportunity for biodiversity conservation? A global review. Front. Ecol. Environ. 2014, 12, 288–296. [Google Scholar] [CrossRef]
- Zhang, Z.; Ding, J.; Zhang, K.; Deng, X. Impact of Aging on Farmland Abandonment: Evidence from Rural China. Land 2025, 14, 393. [Google Scholar] [CrossRef]
- Babović, S.; Lović-Obradović, S.; Prigunova, I. Depopulation of villages in southeastern Serbia as hindrance to economic development. J. Geogr. Inst. Jovan Cvijic SASA 2016, 66, 61–74. [Google Scholar] [CrossRef]
- Gocić, M.; Dragićević, S.; Radivojević, A.; Martić Bursać, N.; Stričević, L.; Đorđević, M. Changes in Soil Erosion Intensity Caused by Land Use and Demographic Changes in the Jablanica River basin, Serbia. Agriculture 2020, 10, 345. [Google Scholar] [CrossRef]
- Jelić, S.; Jovanović, T.; Milojević, A. Depopulation of Rural Areas. J. Agric. Food Environ. Sci. 2019, 73, 38–46. [Google Scholar] [CrossRef]
- Manojlović, S.; Antić, M.; Sibinović, M.; Dragicević, S.; Novković, I. Soil erosion response to demographic and land use changes in the Nišava river basin, Serbia. Fresenius Environ. Bull. 2017, 26, 7547–7560. [Google Scholar]
- Živanović, Z.; Tošić, B.; Vesić, M. Rural Abandonment in the Balkans: Case Study of a Serbian Village. J. Fam. Hist. 2021, 46, 344–362. [Google Scholar] [CrossRef]
- Kabadayı, M.E.; Ettehadi Osgouei, P.; Sertel, E. Agricultural Land Abandonment in Bulgaria: A Long-Term Remote Sensing Perspective, 1950–1980. Land 2022, 11, 1855. [Google Scholar] [CrossRef]
- Estel, S.; Kuemmerle, T.; Alcántara, C.; Levers, C.; Prishchepov, A.; Hostert, P. Mapping farmland abandonment and recultivation across Europe using MODIS NDVI time series. Remote Sens. Environ. 2015, 163, 312–325. [Google Scholar] [CrossRef]
- Subedi, Y.R.; Kristiansen, P.; Cacho, O. Drivers and consequences of agricultural land abandonment and its reutilisation pathways: A systematic review. Environ. Dev. 2022, 42, 100681. [Google Scholar] [CrossRef]
- Uribe-Sierra, S.E.; Mansilla-Quiñones, P. Estudios del despoblamiento rural en Chile: Aproximaciones hacia un marco analítico desde la ecología política latinoamericana. Rev. Bras. Estud. Popul. 2022, 39, e0208. [Google Scholar]
- Mansilla-Quiñones, P.; Uribe-Sierra, S.E. Rural Shrinkage: Depopulation and Land Grabbing in Chilean Patagonia. Land 2024, 13, 11. [Google Scholar] [CrossRef]
- Juknelienė, D.; Narmontienė, V.; Valčiukienė, J.; Mozgeris, G. Driving Forces of Agricultural Land Abandonment: A Lithuanian Case. Land 2025, 14, 899. [Google Scholar] [CrossRef]
- Meyfroidt, P.; Lambin, E.F. Global forest transition prospects for an end to deforestation. Annu. Rev. Environ. Resour. 2011, 36, 343–371. [Google Scholar] [CrossRef]
- Li, S.; Li, X. Global understanding of farmland abandonment: A review and prospects. J. Geogr. Sci. 2017, 27, 1123–1150. [Google Scholar] [CrossRef]
- Jellason, N.P.; Robinson, E.J.Z.; Chapman, A.S.A.; Neina, D.; Devenish, A.J.M.; Po, J.Y.T.; Adolph, B. A Systematic Review of Drivers and Constraints on Agricultural Expansion in Sub-Saharan Africa. Land 2021, 10, 332. [Google Scholar] [CrossRef]
- Otsuka, K.; Place, F. Changes in Land Tenure and Agricultural Intensification in Sub-Saharan Africa; The United Nations University World Institute for Development Economics Research (UNU-WIDER): Helsinki, Finland, 2014. [Google Scholar] [CrossRef]
- Kuemmerle, T.; Hostert, P.; Radeloff, V.C.; van der Linden, S.; Perzanowski, K.; Kruhlov, I. Cross-border comparison of post-socialist farmland abandonment in the Carpathians. Ecosystems 2008, 11, 614–628. [Google Scholar] [CrossRef]
- Müller, D.; Kuemmerle, T.; Rusu, M.; Griffiths, P. Lost in transition: Determinants of post-socialist cropland abandonment in Romania. J. Land Use Sci. 2009, 4, 109–129. [Google Scholar] [CrossRef]
- Dax, T.; Schroll, K.; Machold, I.; Derszniak-Noirjean, M.; Schuh, B.; Gaupp-Berghausen, M. Land Abandonment in Mountain Areas of the EU: An Inevitable Side Effect of Farming Modernization and Neglected Threat to Sustainable Land Use. Land 2021, 10, 591. [Google Scholar] [CrossRef]
- Ioffe, G.; Nefedova, T.; Kirsten, D.B. Land abandonment in Russia. Eurasian Geogr. Econ. 2012, 53, 527–549. [Google Scholar] [CrossRef]
- Rounsevell, M.D.; Pedroli, B.; Erb, K.H.; Gramberger, M.; Busck, A.G.; Haberl, H.; Wolfslehner, B. Challenges for land system science. Land Use Policy 2012, 29, 899–910. [Google Scholar] [CrossRef]
- Cartwright, A.; Drobnjaković, M. Why is Farmland Abandoned in Some Places and Not in Others? In Accounting for Differences in Abandoned Farmland Rates in South-Eastern Serbia; Ministry of Agriculture, Republic of Serbia: Belgrade, Serbia, 2011. [Google Scholar] [CrossRef]
- Gao, J.; Song, G.; Sun, X. Does Labor Migration Affect Rural Land Transfer? Evidence from China. Land Use Policy 2020, 99, 105096. [Google Scholar] [CrossRef]
- Fayet, C.M.; Reilly, K.H.; Van Ham, C.; Verburg, P.H. What is the future of abandoned agricultural lands? A systematic review of alternative trajectories in Europe. Land Use Policy 2022, 112, 105833. [Google Scholar] [CrossRef]
- Munroe, D.K.; van Berkel, D.B.; Verburg, P.H.; Olson, J.L. Alternative trajectories of land abandonment: Causes, consequences and research challenges. Curr. Opin. Environ. Sustain. 2013, 5, 471–476. [Google Scholar] [CrossRef]
- Van der Zanden, E.H.; Verburg, P.H.; Schulp, C.J.; Verkerk, P.J. Trade-offs of European agricultural abandonment. Land Use Policy 2017, 62, 290–301. [Google Scholar] [CrossRef]
- Quintas-Soriano, C.; Buerkert, A.; Plieninger, T. Effects of land abandonment on nature contributions to people and good quality of life components in the Mediterranean region: A review. Land Use Policy 2022, 116, 106053. [Google Scholar] [CrossRef]
- Prévosto, B.; Kuiters, L.; Bernhardt-Römermann, M.; Dölle, M.; Schmidt, W.; Hoffmann, M.; Van Uytvanck, J.; Bohner, A.; Kreiner, D.; Stadler, J.; et al. Impacts of Land Abandonment on Vegetation: Successional Pathways in European Habitats. Folia Geobot. 2011, 46, 303–325. [Google Scholar] [CrossRef]
- Řehounková, K.; Tichý, L.; Prach, K. Succession in abandoned fields: Chronosequence data verified by monitoring of semi-permanent plots. J. Veg. Sci. 2024, 35, e13303. [Google Scholar] [CrossRef]
- Zakkak, S.; Radovic, A.; Panitsa, M.; Vassilev, K.; Shuka, L.; Kuttner, M.; Schindler, S.; Kati, V.; Woods, K. Vegetation patterns along agricultural land abandonment in the Balkans. J. Veg. Sci. 2018, 29, 877–886. [Google Scholar] [CrossRef]
- Cerdà, A.; Rodrigo-Comino, J.; Novara, A.; Brevik, E.C.; Vaezi, A.R.; Pulido, M.; Giménez-Morera, A.; Keesstra, S.D. Long-term impact of rainfed agricultural land abandonment on soil erosion in the Western Mediterranean basin. Prog. Progress. Phys. Geogr. Earth Environ. 2018, 42, 202–219. [Google Scholar] [CrossRef]
- Cerdà, A.; Ackermann, O.; Terol, E.; Rodrigo-Comino, J. Impact of Farmland Abandonment on Water Resources and Soil Conservation in Citrus Plantations in Eastern Spain. Water 2019, 11, 824. [Google Scholar] [CrossRef]
- Toková, L.; Hološ, S.; Šurda, P.; Kollár, J.; Lichner, Ľ. Impact of duration of land abandonment on infiltration and surface runoff in acidic sandy soil. Agriculture 2022, 12, 168. [Google Scholar] [CrossRef]
- Lana-Renault, N.; Nadal-Romero, E.; Cammeraat, E.; Llorente, J.Á. Critical Environmental Issues Confirm the Relevance of Abandoned Agricultural Land. Water 2020, 12, 1119. [Google Scholar] [CrossRef]
- Santarsiero, V.; Lanorte, A.; Nolè, G.; Cillis, G.; Tucci, B.; Murgante, B. Analysis of the Effect of Soil Erosion in Abandoned Agricultural Areas: The Case of NE Area of Basilicata Region (Southern Italy). Land 2023, 12, 645. [Google Scholar] [CrossRef]
- Novara, A.; Gristina, L.; Sala, G.; Galati, A.; Crescimanno, M.; Cerdà, A.; Badalamenti, E.; La Mantia, T. Agricultural land abandonment in Mediterranean environment provides ecosystem services via soil carbon sequestration. Sci. Total Environ. 2017, 576, 420–429. [Google Scholar] [CrossRef]
- Bell, S.M.; Terrer, C.; Barriocanal, C.; Jackson, R.B.; Rosell-Melé, A. Soil organic carbon accumulation rates on Mediterranean abandoned agricultural lands. Sci. Total Environ. 2021, 759, 143535. [Google Scholar] [CrossRef]
- Crawford, C.L.; Yin, H.; Radeloff, V.C.; Wilcove, D.S. Rural land abandonment is too ephemeral to provide major benefits for biodiversity and climate. Sci. Adv. 2022, 8, eabm8999. [Google Scholar] [CrossRef]
- Polyakov, V.; Abakumov, E. Estimation of carbon stocks and carbon sequestration rates in abandoned agricultural soils of northwest russia. Atmosphere 2023, 14, 1370. [Google Scholar] [CrossRef]
- Schneider, M.V.; Oberholzer, S.; Speranza, C.I. Revegetation is key for soil organic carbon sequestration on abandoned and degraded land in northern Spain. Geoderma Reg. 2024, 38, e00835. [Google Scholar] [CrossRef]
- Thibault, M.; Thiffault, E.; Bergeron, Y.; Ouimet, R.; Tremblay, S. Afforestation of abandoned agricultural lands for carbon sequestration: How does it compare with natural succession? Plant Soil 2022, 475, 605–621. [Google Scholar] [CrossRef]
- Navrátil, J.; Martinát, S.; Frazier, R.J.; Klusáček, P.; van der Horst, D.; Škrabal, J.; Krejčí, T.; Osman, R.; Pícha, K.; Dvořák, P. Preference and paradox: Local residents’ perspectives on the reuse of post-agricultural brownfield sites. Sociol. Rural. 2023, 63, 514–543. [Google Scholar] [CrossRef]
- Klusáček, P.; Charvátová, K.; Navrátil, J.; Krejčí, T.; Martinát, S. Regeneration of post-agricultural brownfield for social care needs in rural community: Is there any transferable experience? Int. J. Environ. Res. Public Health 2021, 19, 240. [Google Scholar] [CrossRef]
- Sardinha, I.D.; Craveiro, D.; Milheiras, S. A sustainability framework for redevelopment of rural brownfields: Stakeholder participation at SÃO DOMINGOS mine, Portugal. J. Clean. Prod. 2013, 57, 200–208. [Google Scholar] [CrossRef]
- Leirpoll, M.E.; Næss, J.S.; Cavalett, O.; Dorber, M.; Hu, X.; Cherubini, F. Optimal combination of bioenergy and solar photovoltaic for renewable energy production on abandoned cropland. Renew. Energy 2021, 168, 45–56. [Google Scholar] [CrossRef]
- Ronchetti, G.; Aiello, M. Potential of Abandoned Agricultural Lands for New Photovoltaic Installations. Sustainability 2025, 17, 694. [Google Scholar] [CrossRef]
- Tolmac, J.; Prvulovic, S.; Nedic, M.; Tolmac, D. Analysis of the Development Opportunities of Solar Systems in Serbia. Agric. Eng. 2019, 23, 85–92. [Google Scholar] [CrossRef]
- Potić, I.; Golić, R.; Joksimović, T. Analysis of insolation potential of Knjaževac Municipality (Serbia) using multi-criteria approach. Renew. Sustain. Energy Rev. 2016, 56, 235–245. [Google Scholar] [CrossRef]
- Zec, M. Mapping 100 Priority Locations for Solar Energy in Serbia; The Nature Conservancy: Arlington, VA, USA, 2023. [Google Scholar]
- Ristić, M.; Radovanović, L.; Perisić, J.; Vasović, I.; Đorđević, L. Analysis of the use of renewable energy sources in the republic of Serbia. In International Conference of Experimental and Numerical Investigations and New Technologies; Springer International Publishing: Cham, Switzerland, 2021; pp. 67–83. [Google Scholar]
- Potić, I.; Joksimović, T.; Milinčić, U.; Kićović, D.; Milinčić, M. Wind energy potential for the electricity production-Knjaževac Municipality case study (Serbia). Energy Strategy Rev. 2021, 33, 100589. [Google Scholar] [CrossRef]
- Pavlović, B.; Ivezić, D.; Živković, M. A multi-criteria approach for assessing the potential of renewable energy sources for electricity generation: Case Serbia. Energy Rep. 2021, 7, 8624–8632. [Google Scholar] [CrossRef]
- Republički zavod za statistiku. Uporedni Pregled Broja Stanovnika i Domaćinstava 1948–2022.—Podaci Po Naseljima; Republički zavod za statistiku: Belgrade, Serbia.
- Agencija za statistiku Bosne i Hercegovine. Popisi Stanovništva 1991. i 2013; Agencija za statistiku Bosne i Hercegovine: Sarajevo, Bosnia and Herzegovina.
- Monstat–Uprava za statistiku Crne Gore. Popisi Stanovništva 2003. i 2023.–Podaci Po Naseljima; Monstat–Uprava za statistiku Crne Gore: Podgorica, Montenegro.
- INSTAT–Republika e Shqipërisë, Instituti i Statistikave. Censet e Popullsisë Dhe Banesave; INSTAT–Republika e Shqipërisë, Instituti i Statistikave: Tirana, Albania.
- MAKSTAT–Republic of North Macedonia, State Statistical Office. Census of Population, Households and the Apartments 2002–2021; MAKSTAT–Republic of North Macedonia, State Statistical Office: Skopje, North Macedonia.
- National Statistical Institute of Republic of Bulgaria. Census of Population and Households 2001–2021; National Statistical Institute of Republic of Bulgaria: Sofia, Bulgaria.
- Institutul Național de Statistică. Recensământul Populației 2002–2021; Institutul Național de Statistică: București, Romania.
- Központi Statisztikai Hivatal. Népszámlálások 2001–2022; Központi Statisztikai Hivatal: Budapest, Hungary.
- Republika Hrvatska, Državni zavod za statistiku. Popisi Stanovništva 2001–2021; Državni zavod za statistiku: Zagreb, Croatia.
- Lukanov, K. Cross-Border Cooperation Problems in the Lower Danube Region. Der Donauraum 2019, 59, 11–24. [Google Scholar] [CrossRef]
- Koroutchev, R. The Serbian–Bulgarian Border Region: The Forgotten Backyard of Europe. Res. Rev. Dep. Geogr. Tour. Hotel Manag. 2012, 41, 118–133. [Google Scholar]
- Božić Miljković, I. Cross-border cooperation on the example of border municipalities of the Western Balkan countries. Econ. Entrep. Manag. Res. 2022, 1, 44–60. [Google Scholar]
- Ocokoljic, S. Perception of the Borderlands in Serbia. In Proceedings of the Mental Mapping. The Science of Orientation. New Approaches to Location–Spatial Patterns of the Global Economy Conference, Budapest, Hungary, 5–7 November 2019; Schenk Verlag: Passau, Germany, 2020; pp. 113–136, ISBN 978-3-944850-78-8. [Google Scholar]
- Fejes, Z.S. Republic of Serbia towards the European territorial cohesion and cross-border cooperation–with special focus on Vojvodina. Deturope–Cent. Eur. J. Reg. Dev. Tour. 2013, 5, 3. [Google Scholar] [CrossRef]
- Nagy, I. Cross-border cooperation on the external borders of the EU and the impact of the received EU CBC funds on AP Vojvodina/Serbia. Belgeo. Rev. Belg. Géographie 2020, 2, 38732. [Google Scholar] [CrossRef]
- Ricz, A.; Nagy, I.; Juhasz, B. A Vajdaságban elérhető gazdaságfejlesztési eszközök és az azok által elért eredmények. In Otthon a Kárpát-medencében: Területfejlesztési Szabadegyetem; Fábián, A., Bertalan, L., Eds.; Nyugat-magyarországi Egyetem Kiadó: Sopron, Hungary, 2015; pp. 389–414. [Google Scholar]
- Nagy, I.; Ricz, A.; Fekete, R. Results of the EU cross-border programme allocations and their geographical implications for border regions of Vojvodina/Serbia in the 2014–2020 programming period. Eur. XXI 2021, 40, 99–118. [Google Scholar] [CrossRef]
- Harpaz, Y. Citizenship 2.0: Dual Nationality as a Global Asset; Princeton University Press: Princeton, NJ, USA, 2019. [Google Scholar]
- Alarian, H.M.; Goodman, S.W. Dual citizenship allowance and migration flow: An origin story. Comp. Political Stud. 2017, 50, 133–167. [Google Scholar] [CrossRef]
- Codruta, D.D.; Abrudan, B.D. Euroregion Danube-Cris-Mures-Tisa (DKMT)–A successful story? Rev. Strateg. Manag. 2017, 1, 402–410. [Google Scholar]
- Počuča, M.; Matijašević-Obradović, J.; Golić, D. Impact of EU Regional Policy on the Development of Cross-Border Cooperation of AP Vojvodina and Possibilities of Use of the Pre-Accession Assistance. Ekon. Poljopr. 2018, 65, 1045–1057. [Google Scholar] [CrossRef]
- Koroutchev, R. The Bulgarian-Serbian border region: Problems and perspectives. Klagenfurter Geogr. Schriften 2013, 29, 128. [Google Scholar]
- Totev, S. Regional Disparities in Bulgaria and EU countries. Trakia J. Sci. 2017, 15, 1–5. [Google Scholar] [CrossRef]
- Veleva, R. Poverty in Bulgaria: A General Challenge. J. Manag. Sci. Appl. (JOMSA) 2023, 2, 233–240. [Google Scholar]
- Vassileva, A.; Stevanović, M.; Simić, M. Economic relations between Bulgaria and Serbia: Current state and opportunities. Megatrend Rev. 2020, 17, 141–156. [Google Scholar] [CrossRef]
- Drobnjaković, M.; Panić, M.; Stanojević, G.; Doljak, D.; Kokotović Kanazir, V. Detection of the Seasonally Activated Rural Areas. Sustainability 2022, 14, 1604. [Google Scholar] [CrossRef]
- Mikhaylova, A.A.; Wendt, J.A.; Hvaley, D.V.; Bógdał-Brzezińska, A.; Mikhaylov, A.S. Impact of Cross-Border Tourism on the Sustainable Development of Rural Areas in the Russian–Polish and Russian–Kazakh Borderlands. Sustainability 2022, 14, 2409. [Google Scholar] [CrossRef]
- Jojić-Glavonjić, T.; Kokotović-Kanazir, V.; Ljakoska, M. Local population analysis in the function of the protected area sustainable development. J. Geogr. Inst. Cvijic 2021, 71, 265–281. [Google Scholar] [CrossRef]
- López-Sanz, J.M.; Penelas-Leguía, A.; Gutiérrez-Rodríguez, P.; Cuesta-Valiño, P. Sustainable development and rural tourism in depopulated areas. Land 2021, 10, 985. [Google Scholar] [CrossRef]
- Wegren, S.K. The quest for rural sustainability in Russia. Sustainability 2016, 8, 602. [Google Scholar] [CrossRef]
- Cigale, D.; Lampič, B. Aspects of Tourism Sustainability on Organic Farms in Slovenia. J. Geogr. Inst. Cvijic 2023, 73, 251–267. [Google Scholar] [CrossRef]
- Ahlmeyer, F.; Volgmann, K. What Can We Expect for the Development of Rural Areas in Europe?—Trends of the Last Decade and Their Opportunities for Rural Regeneration. Sustainability 2023, 15, 5485. [Google Scholar] [CrossRef]
- Zarzo, J.L.B.; Sebastián, J.P.; Martínez, N.M. Fighting against depopulation in inland Spain. Alternatives from Art, Design and Architecture. Int. J. Arts. Arch. Des. 2020, 8, 138–147. [Google Scholar]
- Battino, S.; Lampreu, S. The role of the sharing economy for a sustainable and innovative development of rural areas: A case study in Sardinia (Italy). Sustainability 2019, 11, 3004. [Google Scholar] [CrossRef]
- Lozano Murciego, Á.; Jiménez-Bravo, D.M.; Pato Martínez, D.; Valera Román, A.; Luis Lazo, G. Voice assistant and route optimization system for logistics companies in depopulated rural areas. Sustainability 2020, 12, 5377. [Google Scholar] [CrossRef]
- López, M.; Cazorla, A.; Panta, M.D.P. Rural entrepreneurship strategies: Empirical experience in the Northern Sub-Plateau of Spain. Sustainability 2019, 11, 1243. [Google Scholar] [CrossRef]
- Vasta, A.; Figueiredo, E.; Valente, S.; Vihinen, H.; Nieto-Romero, M. Place-based policies for sustainability and rural development: The case of a Portuguese village “Spun” in traditional linen. Soc. Sci. 2019, 8, 289. [Google Scholar] [CrossRef]
- Šabić, D.; Vujadinović, S. Regional development and regional policy. Collect. Pap. Fac. Geogr. Univ. Belgrade 2017, 65, 463–477. [Google Scholar] [CrossRef]
- Marković, S.; Perić, M.; Mijatov, M.; Doljak, D.; Žolna, M. Application of tourist function indicators in tourism development. J. Geogr. Inst. Cvijic 2017, 67, 163–178. [Google Scholar] [CrossRef]
- García-Casarejos, N.; Sáez-Pérez, L.A. Internships for higher education students to promote the local sustainability of rural places. Sustainability 2020, 12, 4926. [Google Scholar] [CrossRef]
- Minasyan, L.; Kaneeva, A.; Ponomarev, P.; Nalivaichenko, P. Family as a social factor determining demographic trends. J. Geogr. Inst. Cvijic 2023, 73, 237–249. [Google Scholar] [CrossRef]
- Fuerst-Bjeliš, B. Other and/or Marginal: Coexistence of Identities in the Historical Borderlands of Croatia. Glob. Marginalization Confl. Political Econ. Soc. Process. 2020, 6, 89–99. [Google Scholar]
- Kolosov, V.; Morachevskaya, K. The role of an open border in the development of peripheral border regions: The case of Russian-Belarusian borderland. J. Borderl. Stud. 2022, 37, 533–550. [Google Scholar] [CrossRef]
- Sergeyeva, A.; Abdullina, A.; Nazarov, M.; Turdimambetov, I.; Maxmudov, M.; Yanchuk, S. Development of Cross-Border Tourism in Accordance with the Principles of Sustainable Development on the Kazakhstan-Uzbekistan Border. Sustainability 2022, 14, 12734. [Google Scholar] [CrossRef]
- Rădoi, I. European capital of culture, urban tourism and cross-border cooperation between Romania and Serbia. J. Balk. Near East. Stud. 2020, 22, 547–559. [Google Scholar] [CrossRef]
- Rehm, M.; Schröder, M.; Wenzelburger, G. Border Regions as Nuclei of European Integration? Evidence From Germany. J. Common Mark. Stud. 2025, 63, 485–506. [Google Scholar] [CrossRef]


Disclaimer/Publisher’s Note: The statements, opinions and data contained in all publications are solely those of the individual author(s) and contributor(s) and not of MDPI and/or the editor(s). MDPI and/or the editor(s) disclaim responsibility for any injury to people or property resulting from any ideas, methods, instructions or products referred to in the content. |
© 2025 by the authors. Licensee MDPI, Basel, Switzerland. This article is an open access article distributed under the terms and conditions of the Creative Commons Attribution (CC BY) license (https://creativecommons.org/licenses/by/4.0/).