Article

Identifying Zones of Threat to Groundwater Resources Under Combined Climate and Land-Use Dynamics in a Major Groundwater Reservoir (MGR 406, Poland)

Faculty of Geology, University of Warsaw, ul. Żwirki i Wigury 93, 02-089 Warsaw, Poland
*
Author to whom correspondence should be addressed.
Land 2025, 14(8), 1659; https://doi.org/10.3390/land14081659 (registering DOI)
Submission received: 15 July 2025 / Revised: 8 August 2025 / Accepted: 14 August 2025 / Published: 16 August 2025
(This article belongs to the Section Land Use, Impact Assessment and Sustainability)

Abstract

This study addresses the effects of climate variability and land-use change on groundwater recharge in Major Groundwater Reservoir 406 (MGR 406) in southeastern Poland, a key strategic water resource. It focuses on how regional shifts in precipitation patterns and spatial development influence the volume and distribution of renewable groundwater resources. The analysis integrates meteorological data (1951–2024), groundwater modeling outputs, groundwater-use data, and land cover changes from CORINE datasets (1990–2018). A spatial assessment of hydrogeological conditions was performed using the Groundwater Resources Assessment Index (GRAI), combining drought frequency, recharge conditions, land-use classes, and groundwater extraction levels. Results indicate a long-term increase in annual precipitation alongside more frequent but shorter drought episodes. Urban expansion and land sealing were found to reduce infiltration efficiency, particularly in and around the city of Lublin, where the highest extraction rates were recorded. The assessment identified several zones of high threat to groundwater resources, which have no sufficient legal protection. These findings highlight the need to integrate groundwater management into local spatial planning and land management strategies. The study concludes that balancing water use and recharge potential under evolving climate and land-use pressures are essential to ensuring the sustainability of groundwater resources in MGR 406.

1. Introduction

Due to climate change, which is increasingly recognized by both experts and the general public, special attention is being given to protecting water resources [1]. Among these, groundwater resources play a key role in terms of quality, quantity, and long-term sustainability. They are widely used in municipal services and industries.
In line with this approach, Poland designated Major Groundwater Reservoirs (MGRs) as early as 1990 [2]. According to the official definition, these are natural inland groundwater reserves with high quantitative and qualitative parameters. The criteria include a high potential yield for single wells (over 70 m3/h), high capacity for multi-well intakes (over 10,000 m3/day), and excellent water quality that typically does not require costly treatment. To date, 163 MGRs have been documented. However, three reservoirs still lack hydrogeological documentation [3].
Extensive research on MGRs in Poland has helped government authorities make informed decisions about water protection. These efforts aim to maintain hydrodynamic balance and ensure high water quality. The protection strategy combines legal, administrative, and scientific measures.
One of the most important measures is the monitoring of groundwater quality and quantity. It enables the early detection of threats and allows for the quick implementation of preventive or corrective actions. Another key element of the strategy is reducing human impact. This includes minimizing changes in the hydrodynamic field caused by intensive groundwater extraction, as well as addressing water quality issues—such as limiting agricultural, industrial, and urban pollution. The protection strategy also focuses on maintaining a balance between groundwater use and the volume of disposable groundwater resources. For this reason, accurate forecasting and effective spatial planning are essential. In Poland, the Polish Geological Institute (PGI) is the national authority responsible for coordinating the documentation of Major Groundwater Reservoirs (MGRs). These documents support legal actions that allow for the designation of protected areas, in accordance with the Water Law Act of 2017 [4]. Designating protected zones may require land-use restrictions. These can include detailed bans or limitations on construction, industrial activity, or farming. Land within these zones is intended only for low-risk activities that pose minimal threat of contamination. Projects with potential negative impacts may be prohibited entirely or restructured into safer alternatives.
According to the methodology by Herbich et al. [5], the boundaries of groundwater protection zones are defined based on hydrogeological criteria. These include calculations of the potential migration time of pollutants from the land surface to the aquifer or from deeper layers containing highly saline water. The exact delineation of protection zone boundaries is refined using land-use patterns. These boundaries should be kept as small as possible while still being effective and must take into account the existing legally protected areas, such as national parks, nature reserves, and Natura 2000 network sites. The final layout of the boundaries should follow clear spatial features, such as roads, forest edges, agricultural field borders, logging paths, and administrative boundaries. This approach ensures that protection zones are both scientifically justified and practically manageable.
The current procedure does not fully address the risk of declining renewable groundwater resources. This reduction may result from natural causes, especially weakened infiltration due to lower rainfall intensity. This reduction may result from changes in rainfall characteristics, particularly a decrease in effective infiltration due to the higher proportion of intense, short-duration precipitation events rather than from a decline in annual rainfall totals. As a consequence, groundwater levels may drop, posing a threat to major groundwater intakes within MGR areas. If this trend continues, an MGR or groundwater body could be classified as having a poor status under Directive 2000/60/EC [6], which would require corrective actions.
The aim of our study is to assess hydrogeological space in quantitative terms, similar to the approach taken by Gleeson et al. [7] in defining the groundwater footprint and Jain et al. [8] in evaluating vulnerability to drought. However, both methods are relatively general. In our case, the MGR area was documented using detailed groundwater modeling studies in 2008, allowing for a more precise analysis of hydrodynamic conditions. This approach requires a spatial and temporal analysis of precipitation, including the calculation of the Standardized Precipitation Index (SPI) [9], which quantifies hydrological droughts. This type of drought can directly lead to groundwater droughts [10]. The final goal is to identify areas most at risk of a drought, taking into account existing groundwater extraction and its relationship to legally protected areas, where land use should serve a protective function.

2. Materials and Methods

2.1. Location and Hydrogeological Conditions

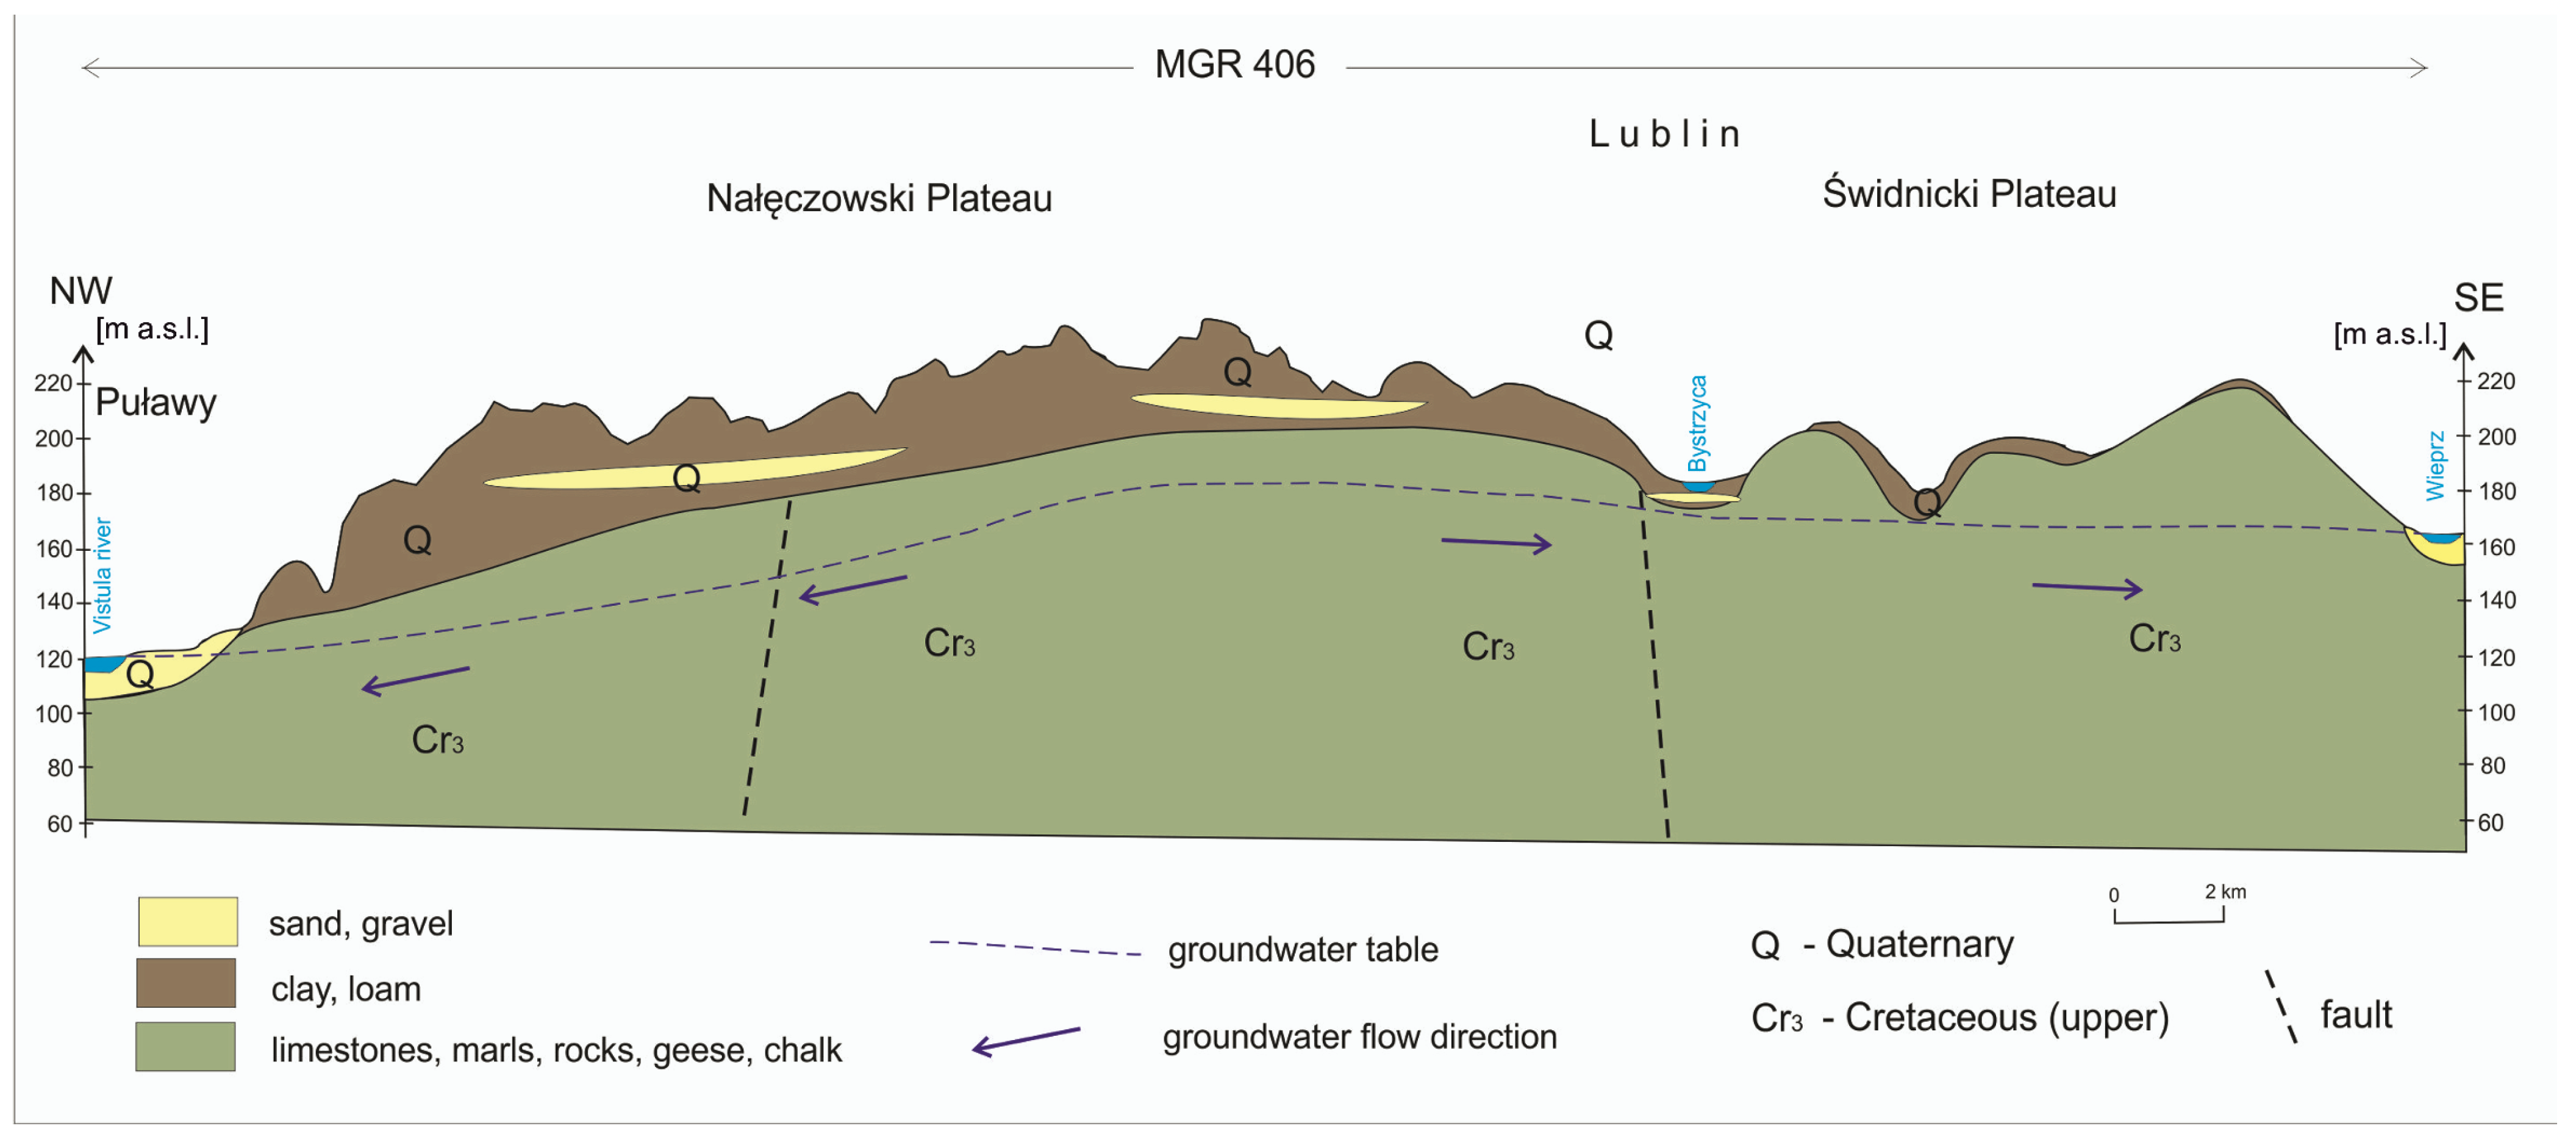
MGR 406 covers an area of 7492 km2 in southeastern Poland, located between the Vistula River to the west and its tributary, the Wieprz River, to the east and north (see Figure 1). Administratively, the area belongs mostly to the Lublin Voivodeship, with one municipality in the south falling under the Podkarpackie Voivodeship. This groundwater reservoir was designated based on the presence of a productive and so-called usable aquifer within Upper Cretaceous carbonate formations. These carbonate deposits appear either directly at the surface or are covered by younger sediments, mainly Quaternary, and locally Neogene or Paleogene (Figure 2).
Due to the similar lithological characteristics of Paleocene and Upper Cretaceous deposits, it is often difficult to distinguish a clear boundary between them. In the area around Nałęczów and Lublin, these formations are commonly treated as a single unit referred to as the Upper Cretaceous aquifer (Cr3). In other regions, Upper Cretaceous deposits form combined aquifer systems with Neogene or Quaternary formations. These are locally classified as the Neogene–Upper Cretaceous aquifer (Ng–Cr3) in the southern part of the reservoir, near Janów Lubelski.
Quaternary–Upper Cretaceous aquifers (Q–Cr3) are in the northeastern, eastern, and western parts, especially in the valleys and ancient riverbeds of the Vistula, Wieprz, Bystrzyca, Por, Chodelka, and Kurówka rivers. The Neogene aquifers consist of Miocene deposits, including detrital, lithothamnion, reef, and serpulid limestones, sands and sandstones. The Quaternary aquifers in river valleys are made up of sands of varying grain sizes. These sands lie directly on saturated Cretaceous deposits, forming a single groundwater reservoir. The Paleogene aquifer appears only in a small area in the northern part of MGR 406, near Baranów. It consists of deposits that are lithologically similar to the underlying Upper Cretaceous formations.
The main Upper Cretaceous aquifer has a thickness ranging from 100 to 150 m. It consists of marl, gaize, chalk, and other transitional lithological types. These formations change laterally and vertically, creating spatial variability in groundwater conditions. This variability increases with tectonic activity, which affects the fracturing of the rock mass. The aquifer’s hydrogeological properties are shaped by two main types of water-bearing fractures such as joint fractures and dislocation zone fractures. The hydraulic conductivity ranges from 0.96 to 14.4 m/day and locally reaches up to 43.2 m/day [12,13,14]. The groundwater table in the Upper Cretaceous aquifer is mostly unconfined, but in some areas, it can be confined.
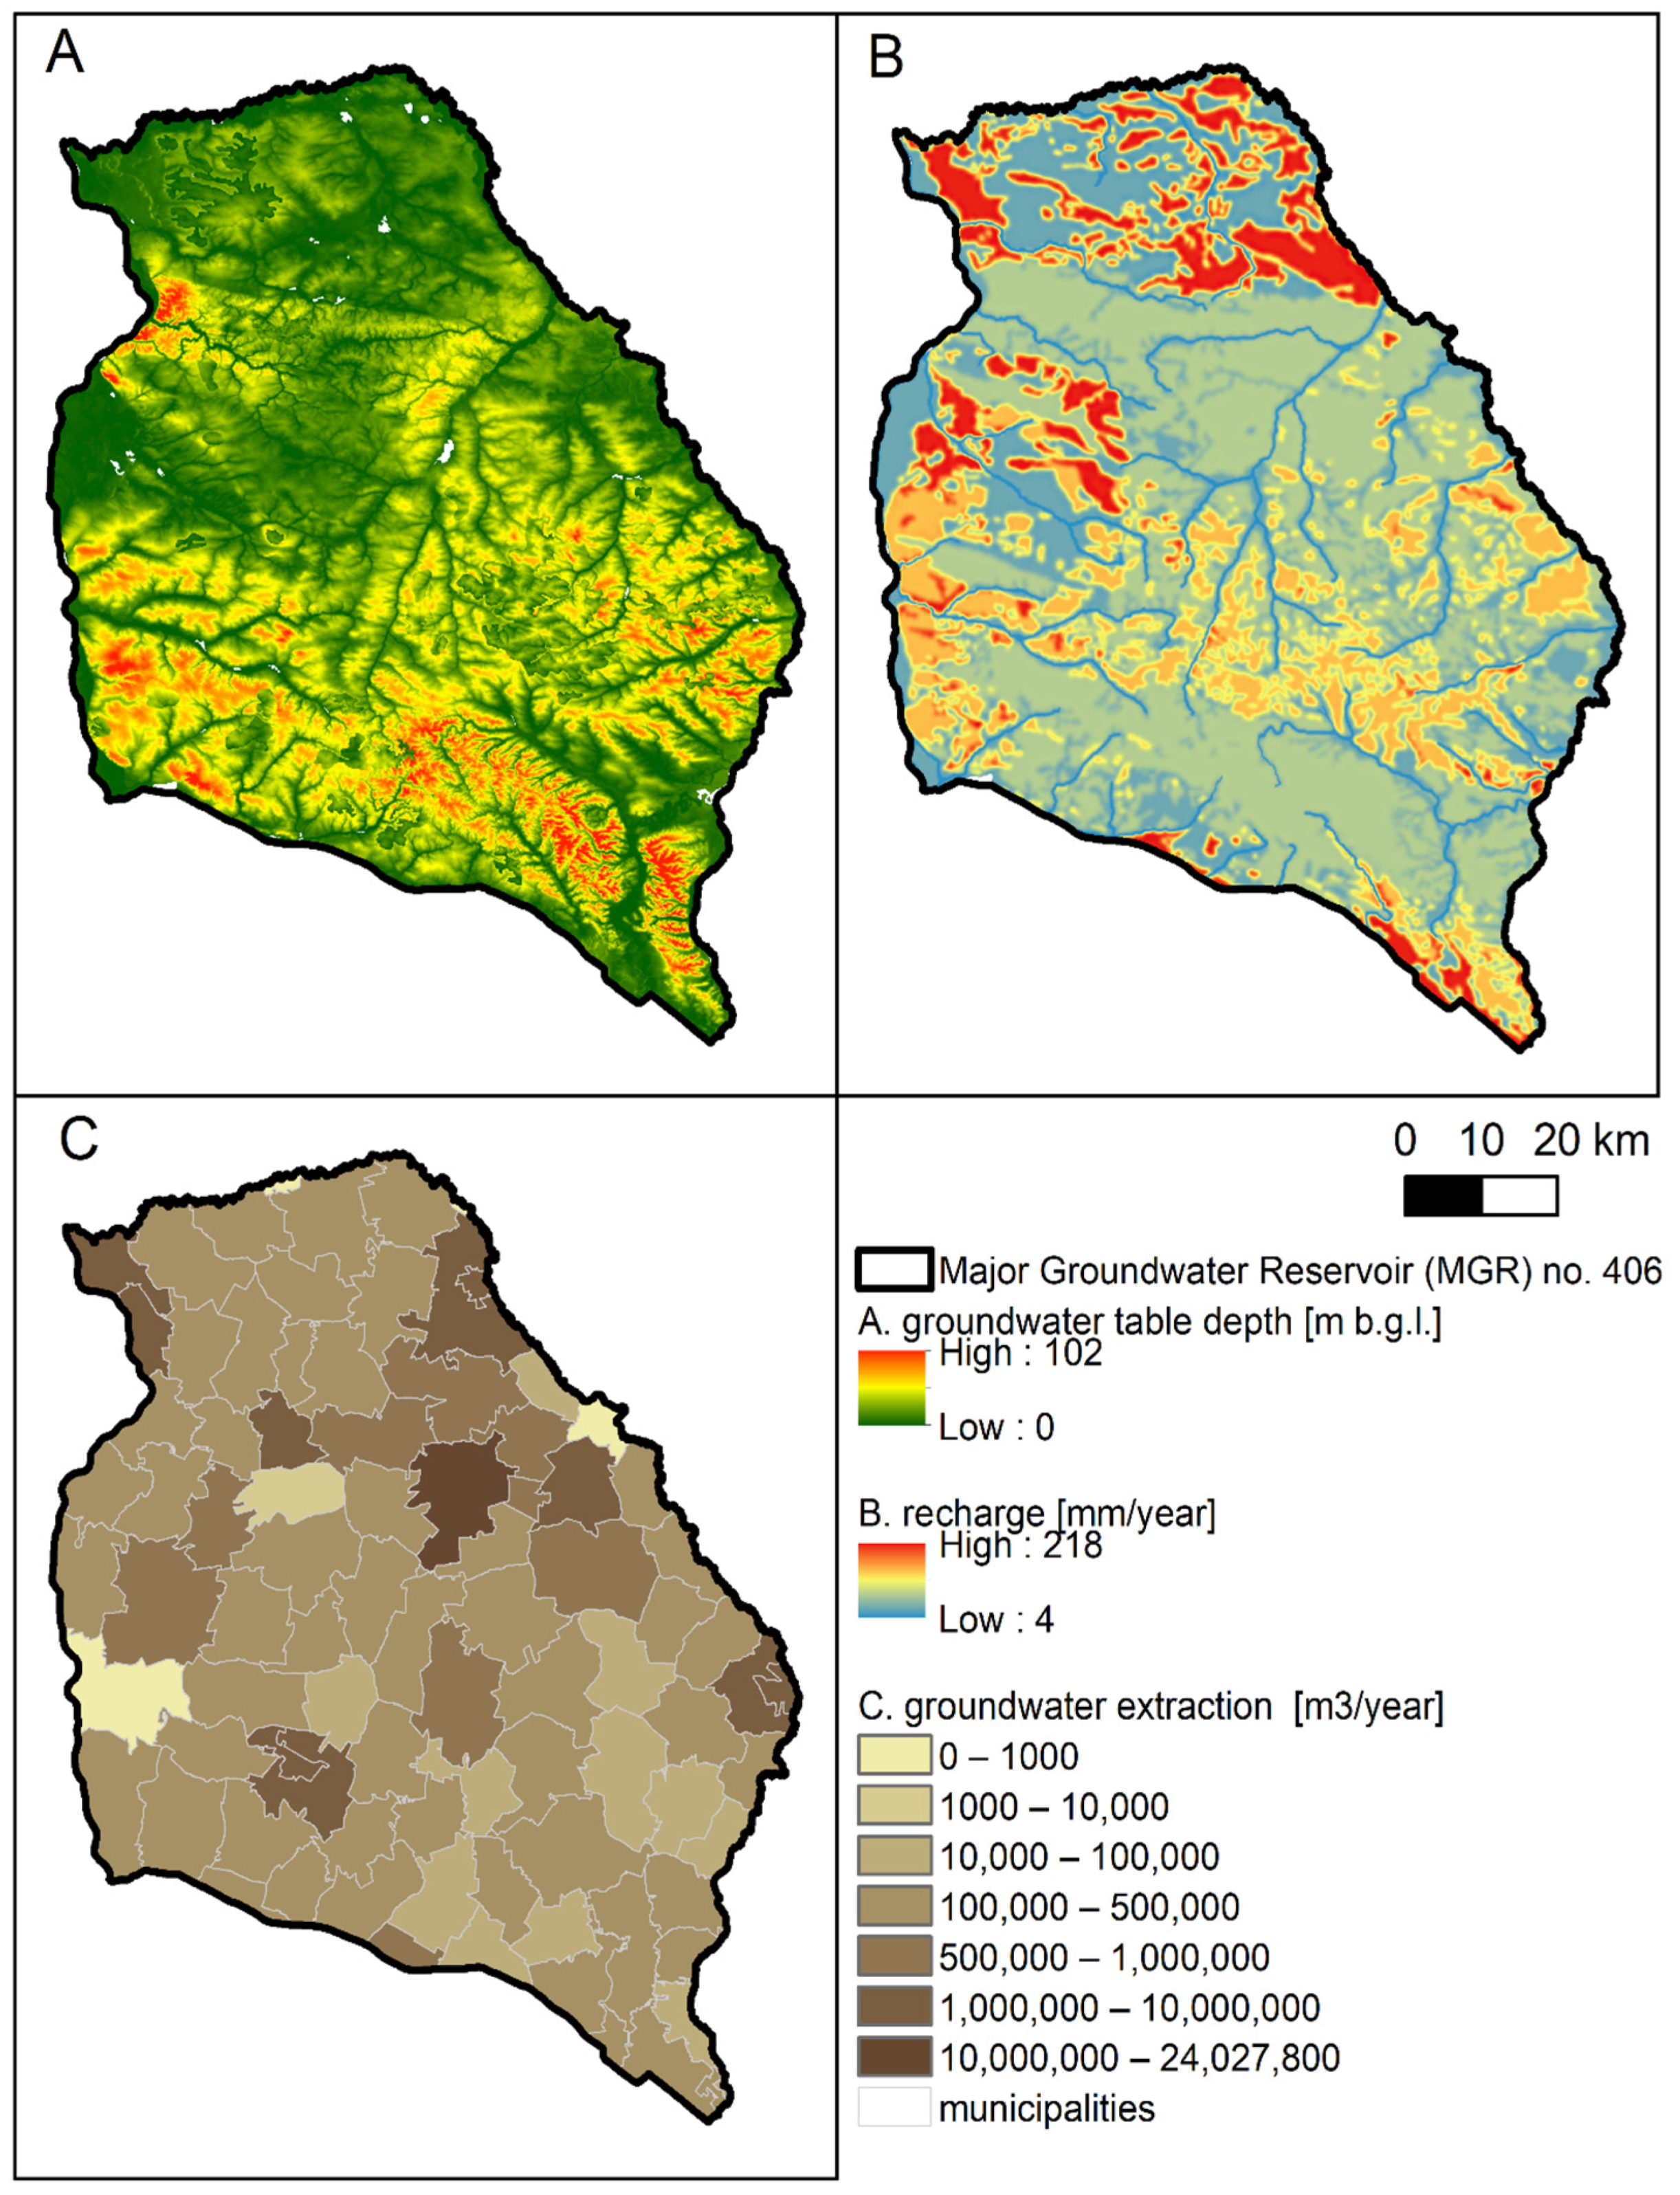
Based on modeling studies conducted in 2008 [11], two key data layers were developed and presented in Figure 3: the depth to the groundwater table and infiltration recharge rate. The groundwater table lies between 0.5 and 103 m below ground level, with an average depth of around 20 m, depending on proximity to rivers. The deepest levels are found in upland areas, especially in the southern Roztocze region and along the Vistula valley edge, where depths exceed 50 m. In river valleys, depths are typically less than 10 m.
Infiltration recharge in the study area ranges from 4 to 218 mm/year, with an average of 77 mm/year. The lowest values occur in river valleys due to the presence of drainage zones. In most other areas, recharge is typically around 65 mm/year, forming two latitudinal bands. A central zone shows recharge rates up to 120 mm/year, which is considered the main recharge area for the entire groundwater reservoir. The highest values, reaching 192 mm/year, are found in the northern part, where highly permeable Quaternary deposits are exposed. However, these zones are interrupted by areas with a much lower recharge, down to 30 mm/year. Renewable resources of MGR 406 are estimated at approximately 669 million m3/year, while available resources are estimated at approximately 384 million m3/year [11].
Groundwater use for domestic and industrial purposes is shown in Figure 3, based on the POBORY database [15]. Annual groundwater extraction was calculated for 82 municipalities in the study area. The total annual extraction is approximately 70 million m3, which represents about 12% of renewable resources and 18% of available resources. Two municipalities report no groundwater use. In 13 municipalities, extraction is below 100,000 m3/year. In 60 municipalities, it ranges between 100,000 and 1,000,000 m3/year. The highest extraction occurs in 7 municipalities, with Lublin exceeding 24 million m3/year. The second highest is Puławy, with over 6 million m3/year.
The most important factor influencing groundwater saturation in the reservoir is the degree of rock fracturing, which depends on lithological composition. In the northeastern part, clayey marls and writing chalk, rich in clay minerals, have a low fracture capacity and, therefore, a limited water-bearing potential. In contrast, harder rocks such as marls and gaize found in the western and southern parts of the reservoir show greater fracturing and better groundwater saturation. With increasing depth, fractures become compressed, which reduces the hydrogeological properties of the rocks. Outside fault-relief zones, gaize and hard calcareous marls typically have a hydraulic conductivity ranging from 2.6 to 43.2 m/day. In marls, values range from 1.4 to 19.0 m/day and in chalk and soft marls, from 0.9 to 9.5 m/day [16,17].

2.2. Precipitation Data

The raw precipitation data were obtained from the public dataset of the Institute of Meteorology and Water Management—National Research Institute (Poland) [18]. They represent monthly precipitation totals recorded at five measurement stations located within the MGR 406 area presented in Figure 1: Annopol, Frampol, Zakrzówek, Lublin-Radawiec, and Puławy.
It is important to note that the precipitation data cover different time spans across the five stations. Specifically, Annopol, Lublin-Radawiec, and Puławy provide continuous data from 1951 to 2024, while Zakrzówek and Frampol have data available from 1951 to 2015 and 1951 to 2016, respectively. This variation in data coverage may influence the assessment of precipitation and drought trends, particularly in decadal analyses.
The analysis of precipitation data included the characterization of long-term monthly averages, the temporal variability of annual totals, and regression-based trend estimation, as well as a comparison of decadal means and their trends. All monitoring stations were included in the analysis, with results presented both individually for each station and/or as aggregated means.
The Standardized Precipitation Index (SPI) was calculated for five monitoring stations using monthly precipitation values aggregated over a 12-month timescale. The SPI is recommended by the World Meteorological Organization (WMO) [19] as the primary index for monitoring and assessing meteorological drought conditions [20]. It quantifies precipitation anomalies by expressing observed values as standardized deviations from a fitted probability distribution function representing the long-term precipitation record.
The methodological approach follows the procedures outlined by McKee et al. [9] and Bloomfield and Marchant [21], enabling the identification and characterization of drought episodes, with SPI values ≤ −1.0 indicative of a meteorological drought. Key aspects of drought variability such as frequency, duration, and intensity were examined.

2.3. Spatial Development

Land use in the study area was analyzed using data from the CORINE Land Cover (CLC) database. This dataset is part of the European Environment Agency (EEA) program and includes data from the years 1990, 2000, 2008, 2012, and 2018 [22]. The CLC database provides consistent information on land cover across Europe. Its successive editions allow researchers to track changes and trends in land use over time. In this study, data were analyzed at the third level of classification, which offers sufficient detail to detect changes within the study area. The spatial resolution of the data is 20 m for vector layers or 100 m for raster layers. The analysis also included legally protected areas, based on national legislation and the Natura 2000 network [23].

2.4. Assessment

The hydrogeological space was assessed in terms of groundwater quantity and the risk of resource depletion. For the purpose of this study, the term Groundwater Resources Assessment Index (GRAI) is introduced to describe the composite indicator developed according to the methodology presented herein. This risk may result from low rainfall intensity, excessive groundwater extraction, and land-use patterns that reduce water retention in the environment. The procedure involved selecting relevant and publicly available data layers that best describe the quantitative status of groundwater resources (see Figure 4). Based on this analysis, areas most at risk of groundwater resource depletion were identified. These zones may be prioritized for designation as additional protection areas within MGR 406. The assessment included precipitation data, such as the average annual totals (1951–2024), number and duration of meteorological droughts (months with SPI < −1), and average SPI values during drought periods. Areas with lower rainfall, longer droughts, more drought episodes, and lower SPI values were classified as potentially vulnerable. Groundwater modeling provided spatial data on recharge rates and depth to the groundwater table. A lower recharge increases the risk of depletion. Shallow groundwater tables were considered more sensitive, as even small declines may have serious environmental impacts, including threats to Groundwater Dependent Ecosystems (GDEs) [24] (Peters et al., 2006). Land use was also analyzed. Due to the number of land cover classes, a ranking system was applied to the CLC Level 1, following Jain et al. [8]. In the context of climate change, urban sealing was identified as a key factor limiting recharge [25]. Therefore, artificial surfaces were considered the most vulnerable. Other high-risk land uses include wetlands and water bodies due to their strong dependence on rainfall and retention functions; next were non-irrigated agricultural areas, which may increase surface runoff and have high water demands. The lowest risk was assigned to forests and semi-natural areas, which support landscape retention and help mitigate drought effects [26].
In this study, no weighting factors were applied in the Groundwater Resources Assessment Index (GRAI)—all eight spatial layers were treated equally to avoid introducing bias, as no empirical basis existed for differential weighting. The relative importance of each layer was not ranked independently but was implicitly reflected in the inclusion of datasets considered most relevant to groundwater resource vulnerability, based on previous studies and data availability [8]. Subjectivity was limited to the classification of land-use categories, which followed a ranking adapted from Jain et al. [8] and applied only to the spatial development layer. All other layers were numerical datasets (precipitation, SPI, recharge, groundwater depth, etc.) and were processed objectively through a min–max normalization to a 0–1 range without introducing subjectivity. Assigning equal weights to all layers ensures transparency and the reproducibility of the method. While applying different weights could be considered in future studies, it might shift the spatial distribution of high-risk zones; however, it would not alter the main vulnerability patterns identified in this assessment.
The analysis focused primarily on numerical data, which did not require ranking. Ranking is a subjective procedure and was applied only to spatial developments, as justified earlier. All numerical parameters were normalized to ensure comparability. As a result, values range from 0 to 1. For layers representing the average annual precipitation, average SPI, infiltration recharge, and groundwater depth, the normalized values were inverted. This adjustment aligned the assessment results with the intended interpretation of each layer. Eight selected data layers were presented at a 50 × 50 m resolution. All continuous spatial layers were resampled to a 50 × 50 m resolution in a common coordinate system. The precipitation and drought-related parameters, originally available from five monitoring stations, were interpolated to a continuous surface using the Topo To Raster tool by entering minimal and maximal values for interpolation and with no enforcing; therefore, the results are characterized by a greater inertia, as there are no barriers between the interpolation points. This approach was chosen for its suitability in representing spatially continuous climate variables over large areas with sparse measurement networks. The interpolated grids were then clipped to the MGR 406 boundary and aligned with other thematic layers for subsequent overlay and summation. These layers were then summed to assess the level of groundwater resource vulnerability within MGR 406. The results were classified into intervals relative to the average value. This classification allowed for the identification of priority zones, where preventive measures should be considered to protect groundwater resources. These findings provide a valuable basis for spatial planning and investment decision-making.

3. Results

3.1. Precipitation Analysis

The analysis of long-term monthly precipitation data reveals a distinct seasonal pattern in rainfall distribution. The monthly averages, computed across all stations, exhibit a clear intra-annual variability characteristic of the temperate climate prevailing in the region.
The lowest mean monthly precipitation is observed in February (31.12 mm), closely followed by January (34.32 mm) and March (32.87 mm), which is indicative of reduced atmospheric moisture availability during the winter and early spring months. The summer months, particularly June (72.01 mm), July (85.52 mm), and August (66.86 mm), represent the peak precipitation season. July stands out as the wettest month, suggesting the dominance of convective rainfall events and thunderstorms associated with elevated temperatures and atmospheric instability. These findings align with the climatological norms of continental Central Europe, where precipitation is heavily influenced by both Atlantic cyclonic systems and local convective phenomena. The results underscore the importance of the summer rainfall season for water resource management, agriculture, and flood risk planning in the region.
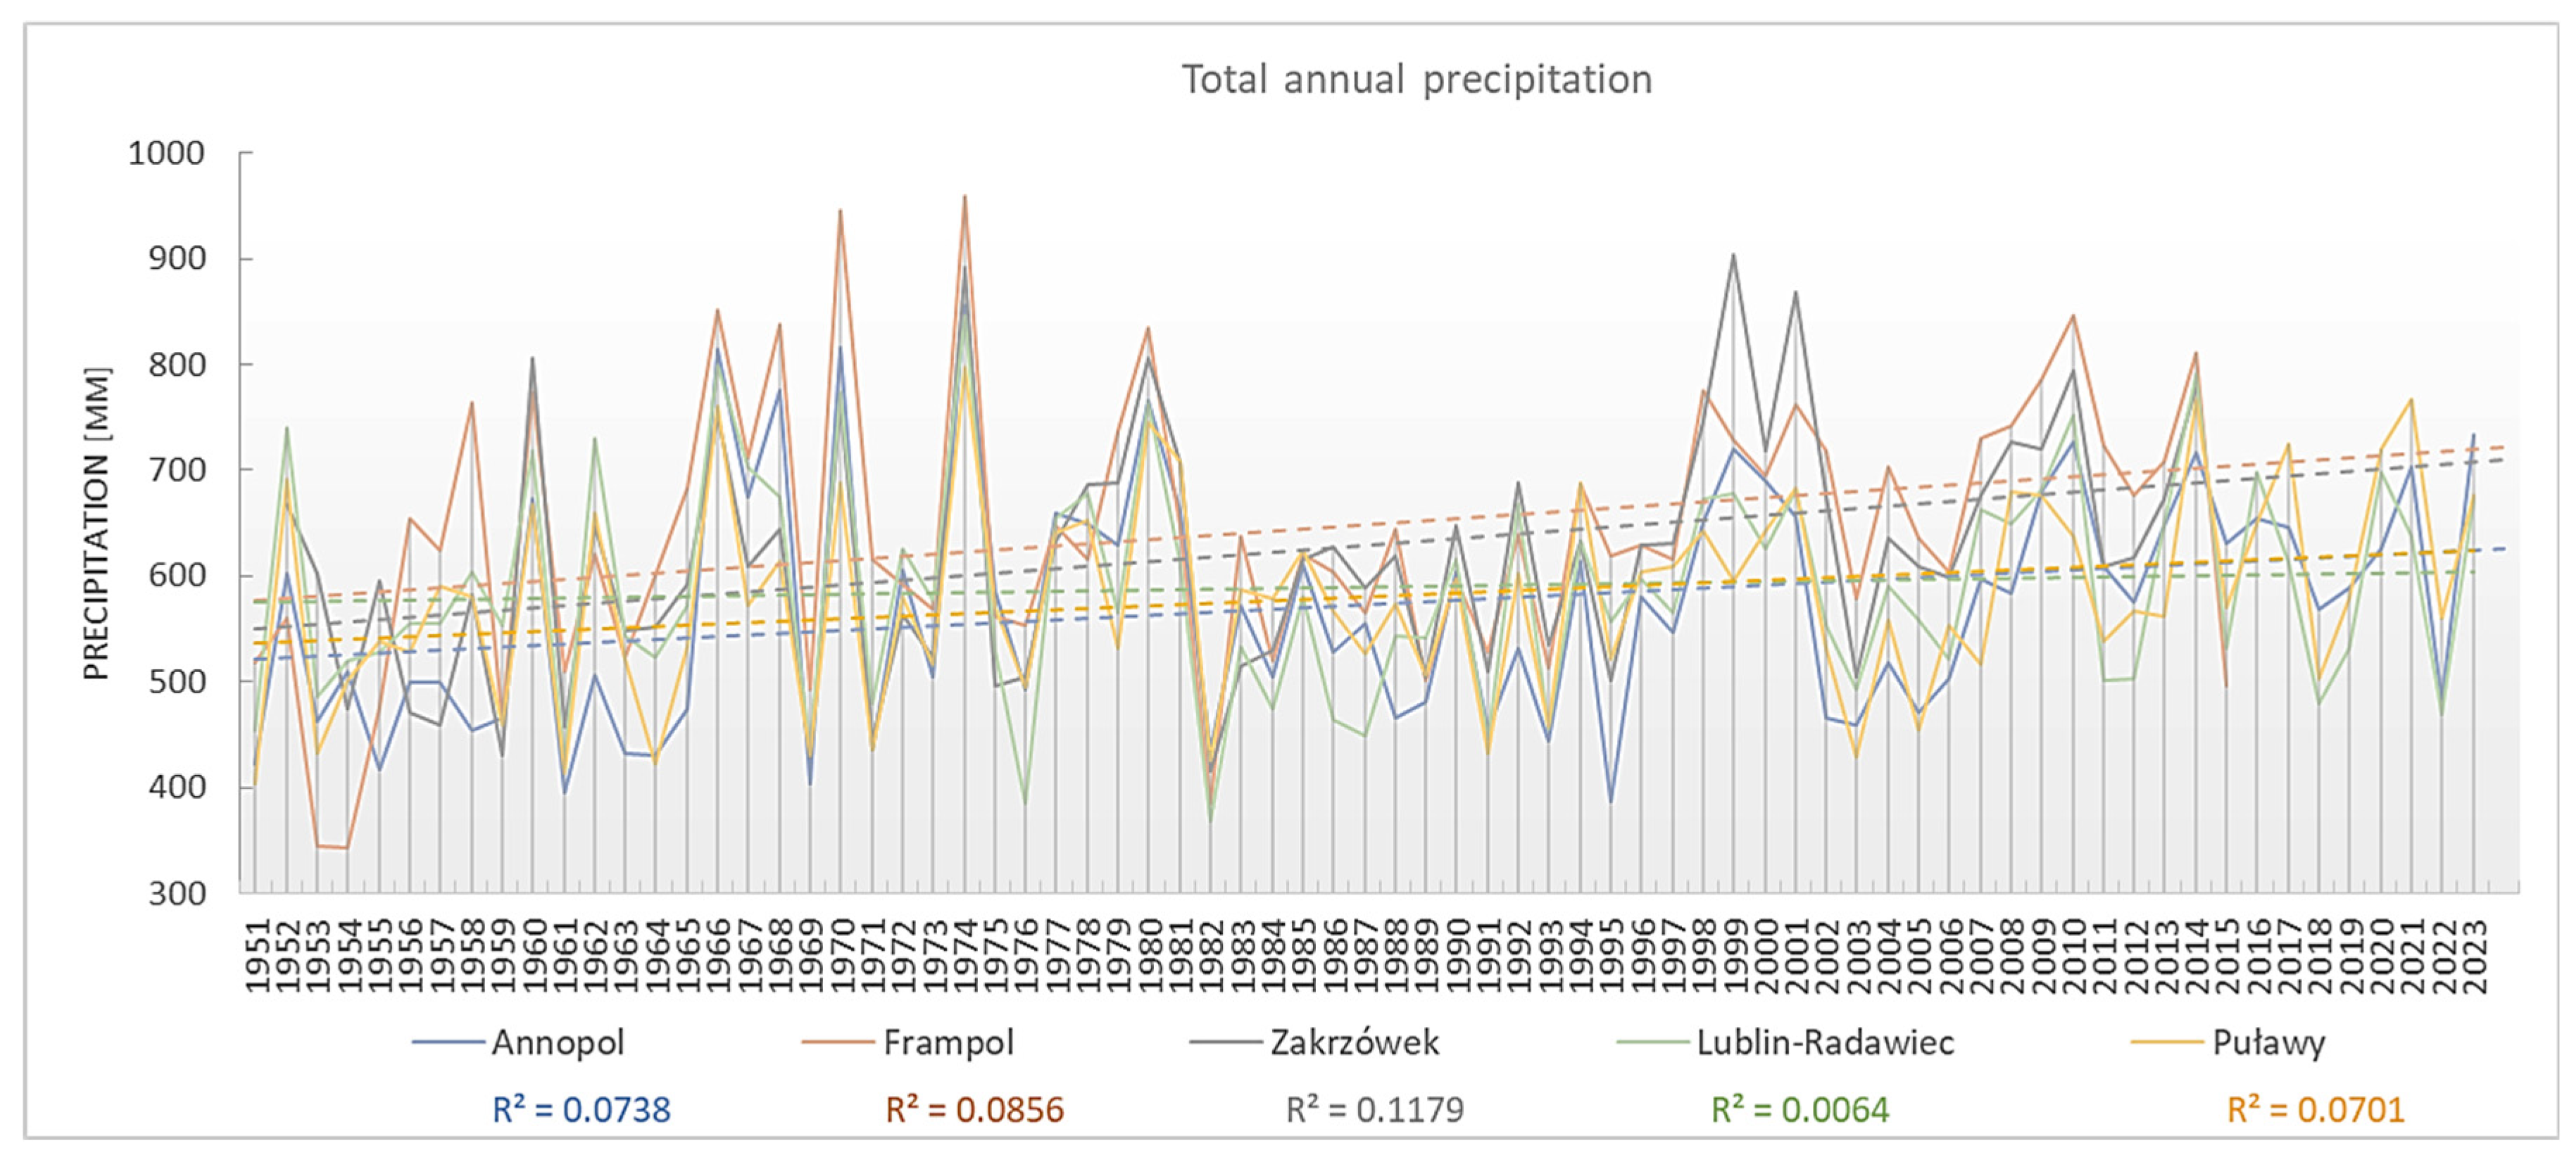
An evaluation of annual precipitation totals from five stations reveals generally increasing trends in the total yearly rainfall over the period 1951–2024. A linear regression analysis was applied to detect the direction and strength of these trends.
Zakrzówek exhibits the most pronounced upward trend, with an average annual increase of approximately 2.18 mm/year (p = 0.0059, R2 = 0.118). This statistically significant trend suggests a meaningful rise in yearly precipitation totals. Frampol and Annopol also show statistically significant increasing trends, with annual increases of 1.98 mm/year (p = 0.018) and 1.44 mm/year (p = 0.020), respectively. The strength of these trends, though moderate (R2 < 0.1), is still noteworthy over the long term. Puławy records a more modest yet statistically significant increase of 1.21 mm/year (p = 0.024). In contrast, Lublin-Radawiec shows a slight, statistically insignificant increase of 0.40 mm/year (p = 0.500, R2 ≈ 0.006). The weak trend and very low coefficient of determination, which can be seen in Figure 5, suggest high interannual variability and the absence of a persistent directional change.
To better understand long-term shifts and reduce interannual variability, decadal averages of annual precipitation were analyzed for all five stations. The decadal mean values allow a clearer view of systematic climatic trends over time.
Zakrzówek shows the strongest and most statistically significant upward trend, with an average increase of ~14.98 mm per decade (p = 0.024, R2 = 0.60). This indicates a persistent and substantial rise in precipitation over the long term. Frampol and Annopol also exhibit upward trends of ~12.09 mm/decade and ~8.46 mm/decade, respectively. Though not statistically significant at the 5% level (p = 0.21 and 0.24), the moderate R2 values (0.25 and 0.22) imply a relatively consistent increase over the decades. Puławy follows with a modest trend of ~6.68 mm/decade (p = 0.083, R2 = 0.42), bordering statistical significance. The data suggest increasing precipitation, albeit with somewhat more variability. Lublin-Radawiec, in contrast, shows a negligible and statistically insignificant trend (~1.59 mm/decade, p = 0.79, and R2 = 0.01). This implies high variability and the absence of a systematic increase or decrease over time.
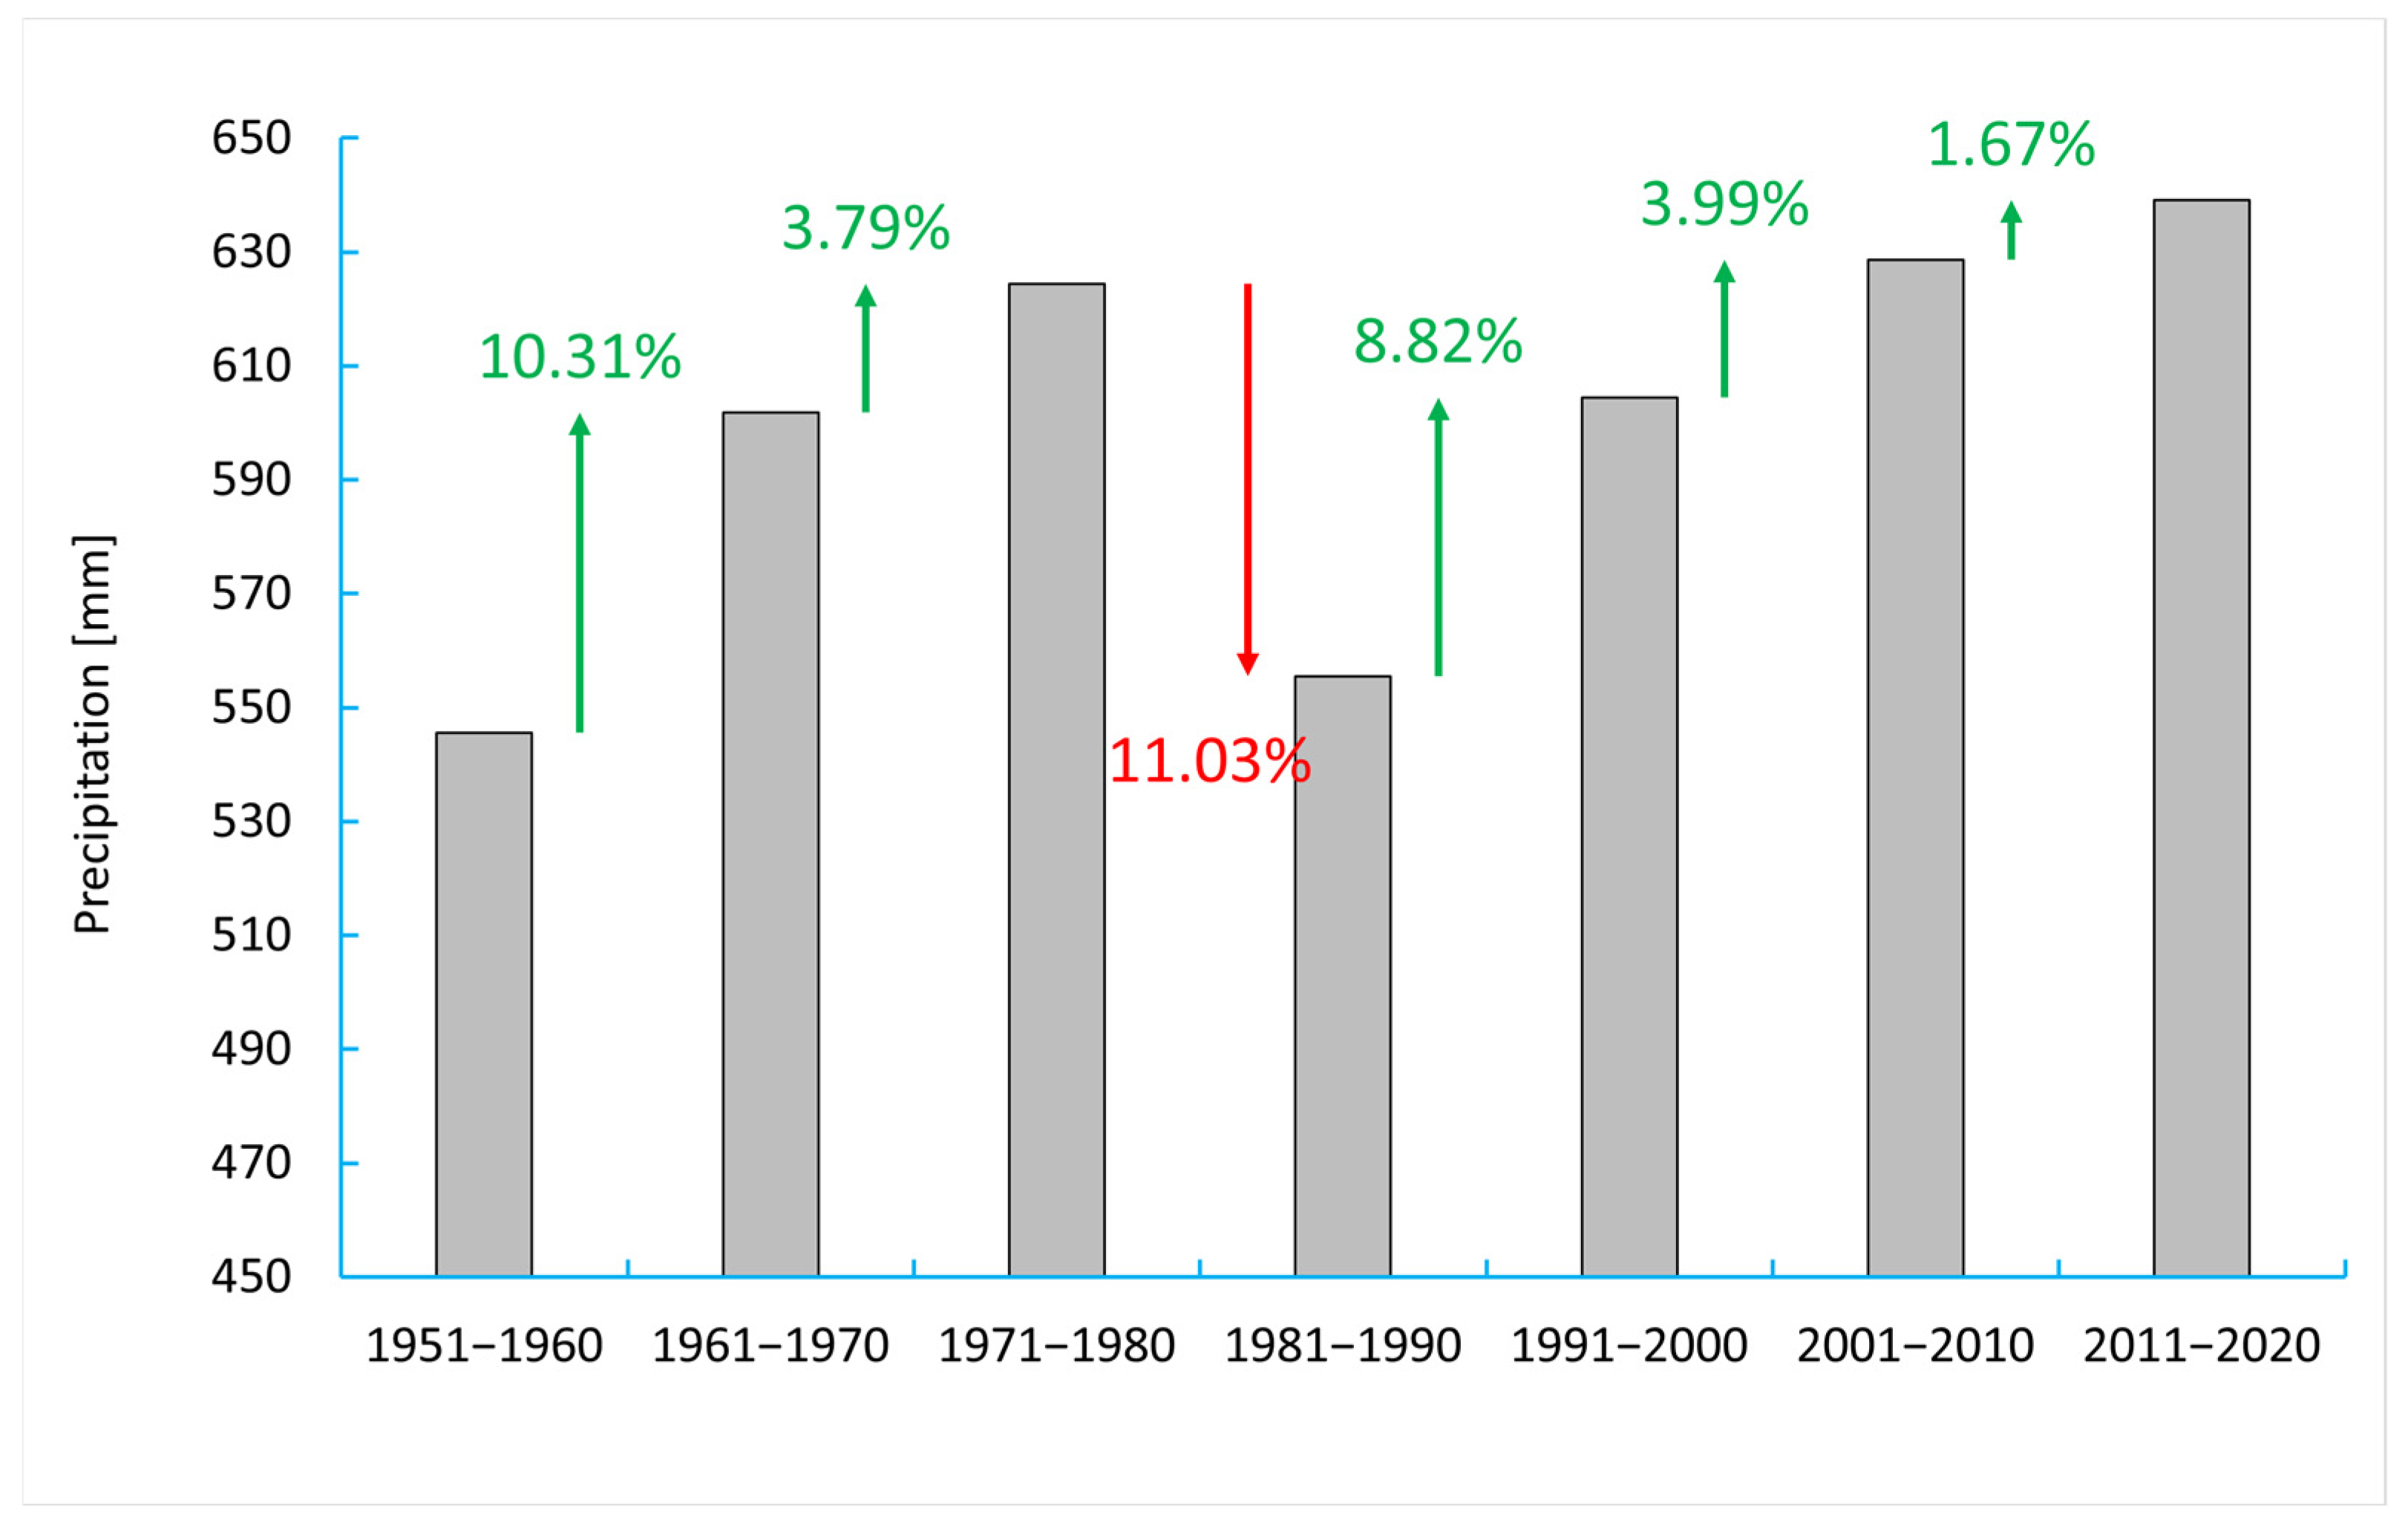
A marked reduction in precipitation was observed during the 1981–1990 decade across all monitoring stations, which is marked in Figure 6. This period exhibited the lowest average annual precipitation within the entire observation record, representing a distinct decline reaching up to 10–15% relative to the preceding decade.
Further analysis of the precipitation data shown in Figure 7 reveals distinct temporal variability in drought characteristics across decades and stations. A common pattern emerges of a higher drought frequency in the early (1950s) and late (1990–2010s) decades, while the middle decades (1970–1980s) were relatively less drought-prone. The 1950s and 1990s consistently show some of the lowest SPI values (most negative), indicating the most intense droughts. Frampol in particular reached a minimum SPI of −3.77 in 1954, making it the site of the strongest recorded drought in the dataset.
Importantly, the nature of droughts appears to be evolving: while the early decades were characterized by longer and more intense episodes, recent decades exhibit shorter but more frequent droughts. Drought episodes in the most recent decade are slightly shorter; the average duration of a single drought event at most stations currently ranges between approximately 3–4 months, whereas in some earlier decades (e.g., the 1960s), droughts commonly lasted 6–8 months on average. These episodes occur more frequently. At several stations (e.g., Puławy, Frampol, and Lublin), the number of drought episodes in the past decade exceeded those recorded during the 1970s–1990s. Average minimum SPI values (ranging from −1.4 to −1.6) do not differ significantly from those observed earlier (Table 1).
Characteristics for individual rainfall stations shown in Table 2 were included as spatial data for the analysis, which was the basis for interpolation for the entire MGR 406.

3.2. Spatial Development and Its Changes

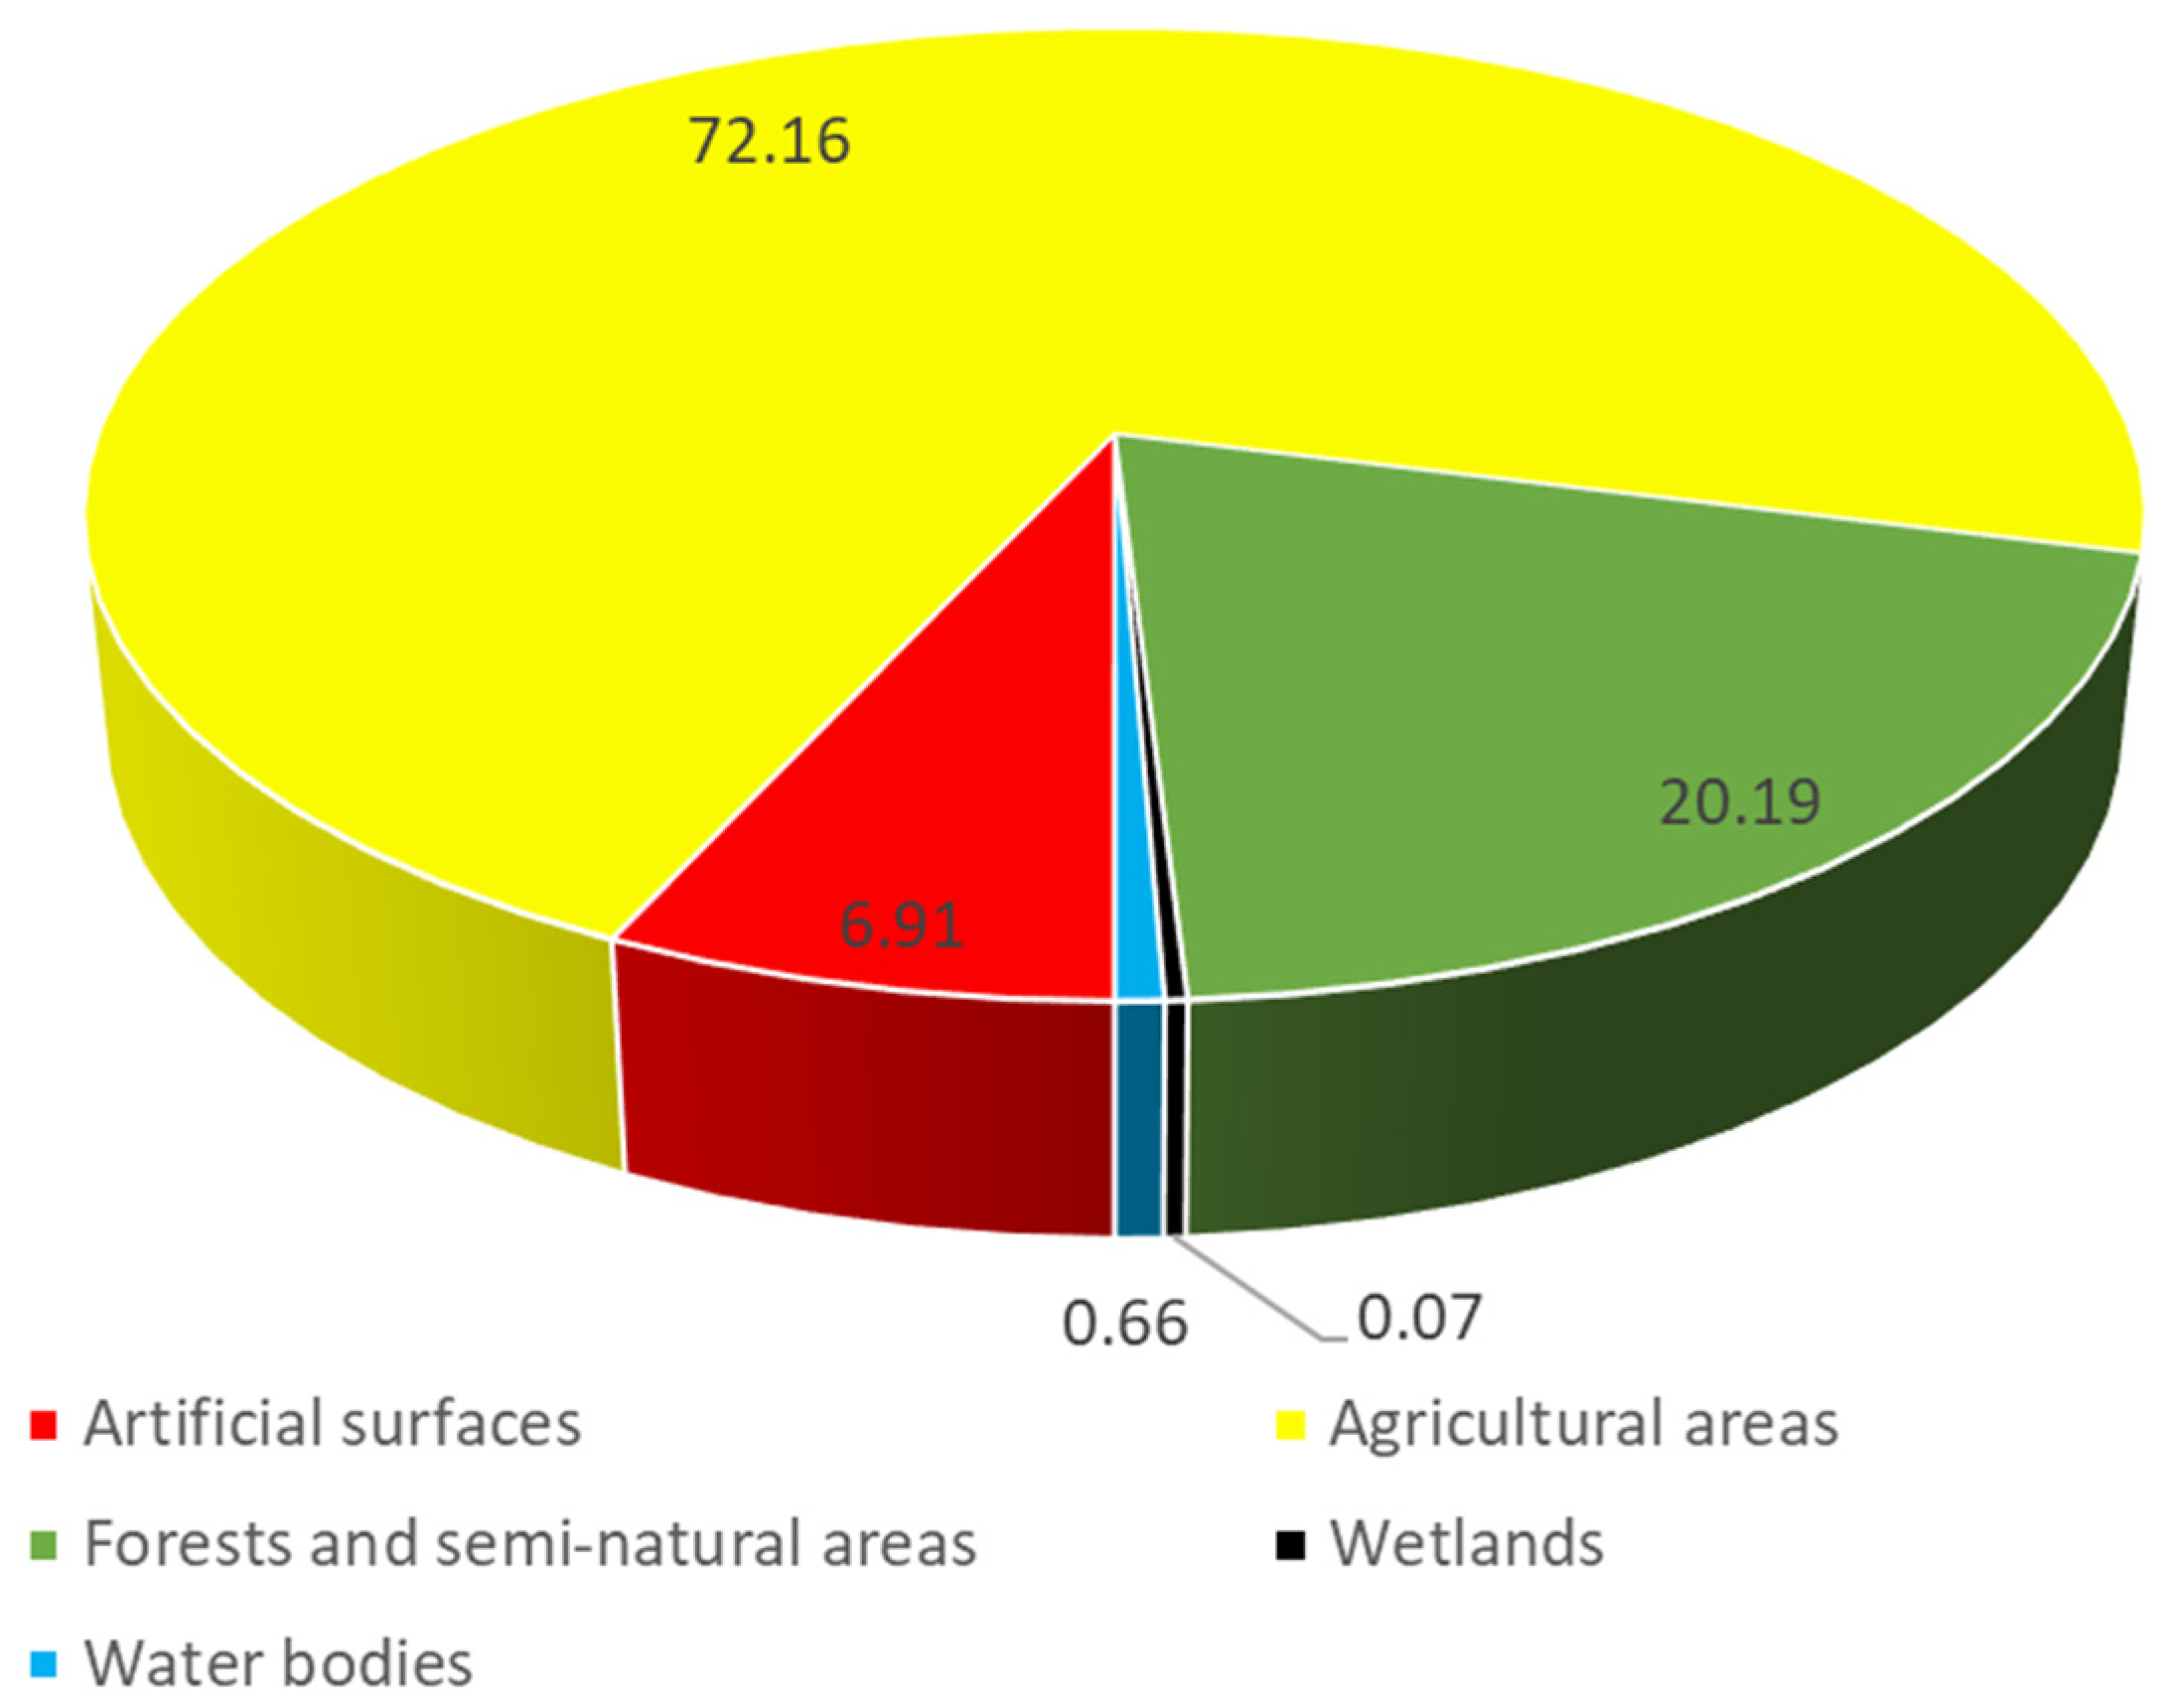
MGR 406 is located in southeastern Poland and is characterized by a low population density. The largest city in the region is Lublin, with 353,500 residents. All other towns have populations below 40,000. The area is predominantly agricultural, which can be seen in Figure 8. According to the 2018 CORINE Land Cover (CLC) data, agricultural areas cover 539,548.10 hectares, which accounts for 72.16% of the total area. The soils are mostly high quality, developed on loess and carbonate rocks, while lighter soils dominate the northern part. Among arable lands, class 211 is the most widespread (417,309 ha). Classes 231, 242, and 243 each cover between 20,000 and 40,000 hectares. The second major land-use category is forests and semi-natural areas, covering 150,978.48 hectares or 20.19% of the region. Classes 311–313 have similar shares. The largest forest complexes are found in the southern part within the Roztocze region, home to the Roztocze National Park. Artificial surfaces occupy 51,685.23 hectares, which is only 6.91% of the total. Class 112 has the highest share among urban categories, while others account for less than 1% each. A total of 101 major industrial facilities have been identified, indicating the presence of developed infrastructure. The road network is also significant, especially the S12, S17, and S19 expressways, which are still under construction in some sections. The area includes many legally protected zones, such as the Roztocze National Park, 18 Natura 2000 network sites, 16 nature reserves, 7 landscape parks, and 7 protected landscape areas.
Between 1990 and 2018, gradual changes in land cover structure were observed, based on the CLC classification and illustrated in Figure 9 using a Sankey diagram. Since 2006, agricultural areas have steadily declined, replaced by artificial surfaces. This trend has intensified over time. Starting in 2012, significant changes occurred within the artificial surfaces category. These were internal reorganizations, not shifts between land cover classes. Forested areas showed the most dynamic changes, though mainly within their own category. Some small transitions from the forest to artificial surfaces or agricultural land were recorded, with the most notable changes in 2012. Changes within natural areas mostly involved shifts between CLC classes 311–313, moving toward class 324, which reflects typical forest transformations. An unusual change occurred in 2000, when a large portion of agricultural land was reclassified as water bodies—the only major shift of this kind. In 2018, minor changes were noted, including small areas of farmland being converted to artificial surfaces. These transformations clearly indicate gradual urbanization. While not intense, it affects both the reduction in agricultural land and the restructuring of artificial surfaces, along with subtle changes in the forest and natural areas.
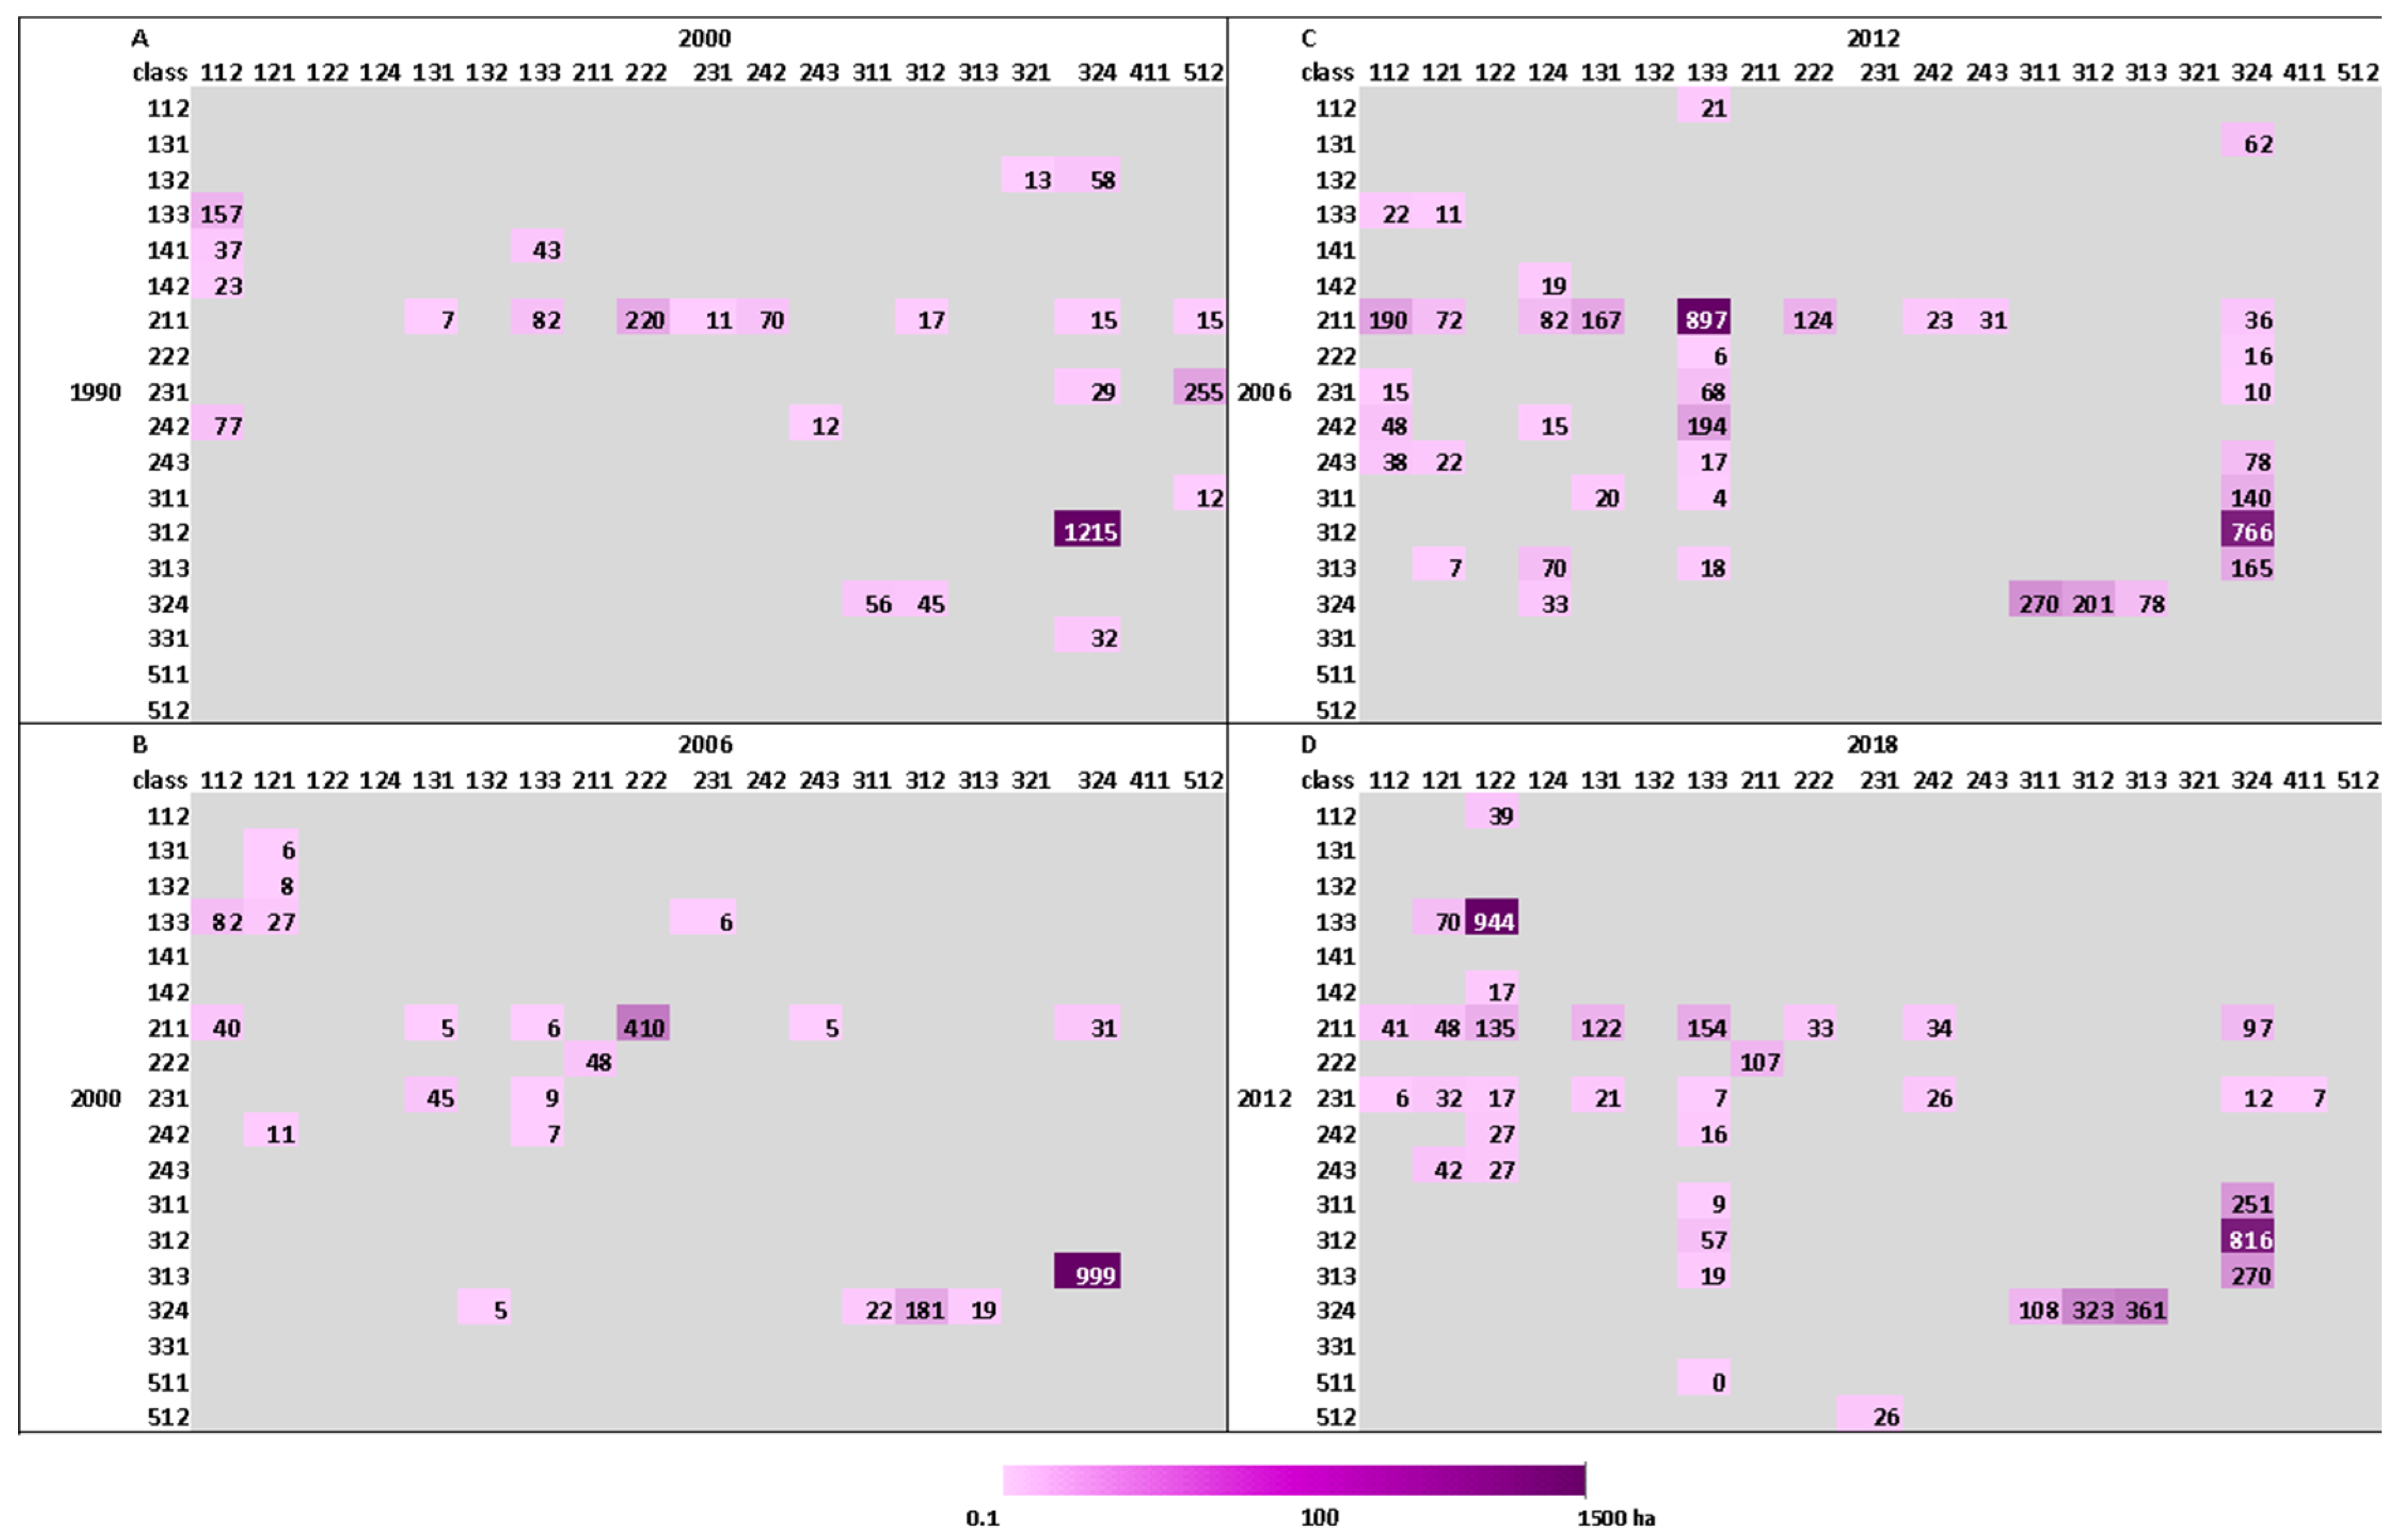
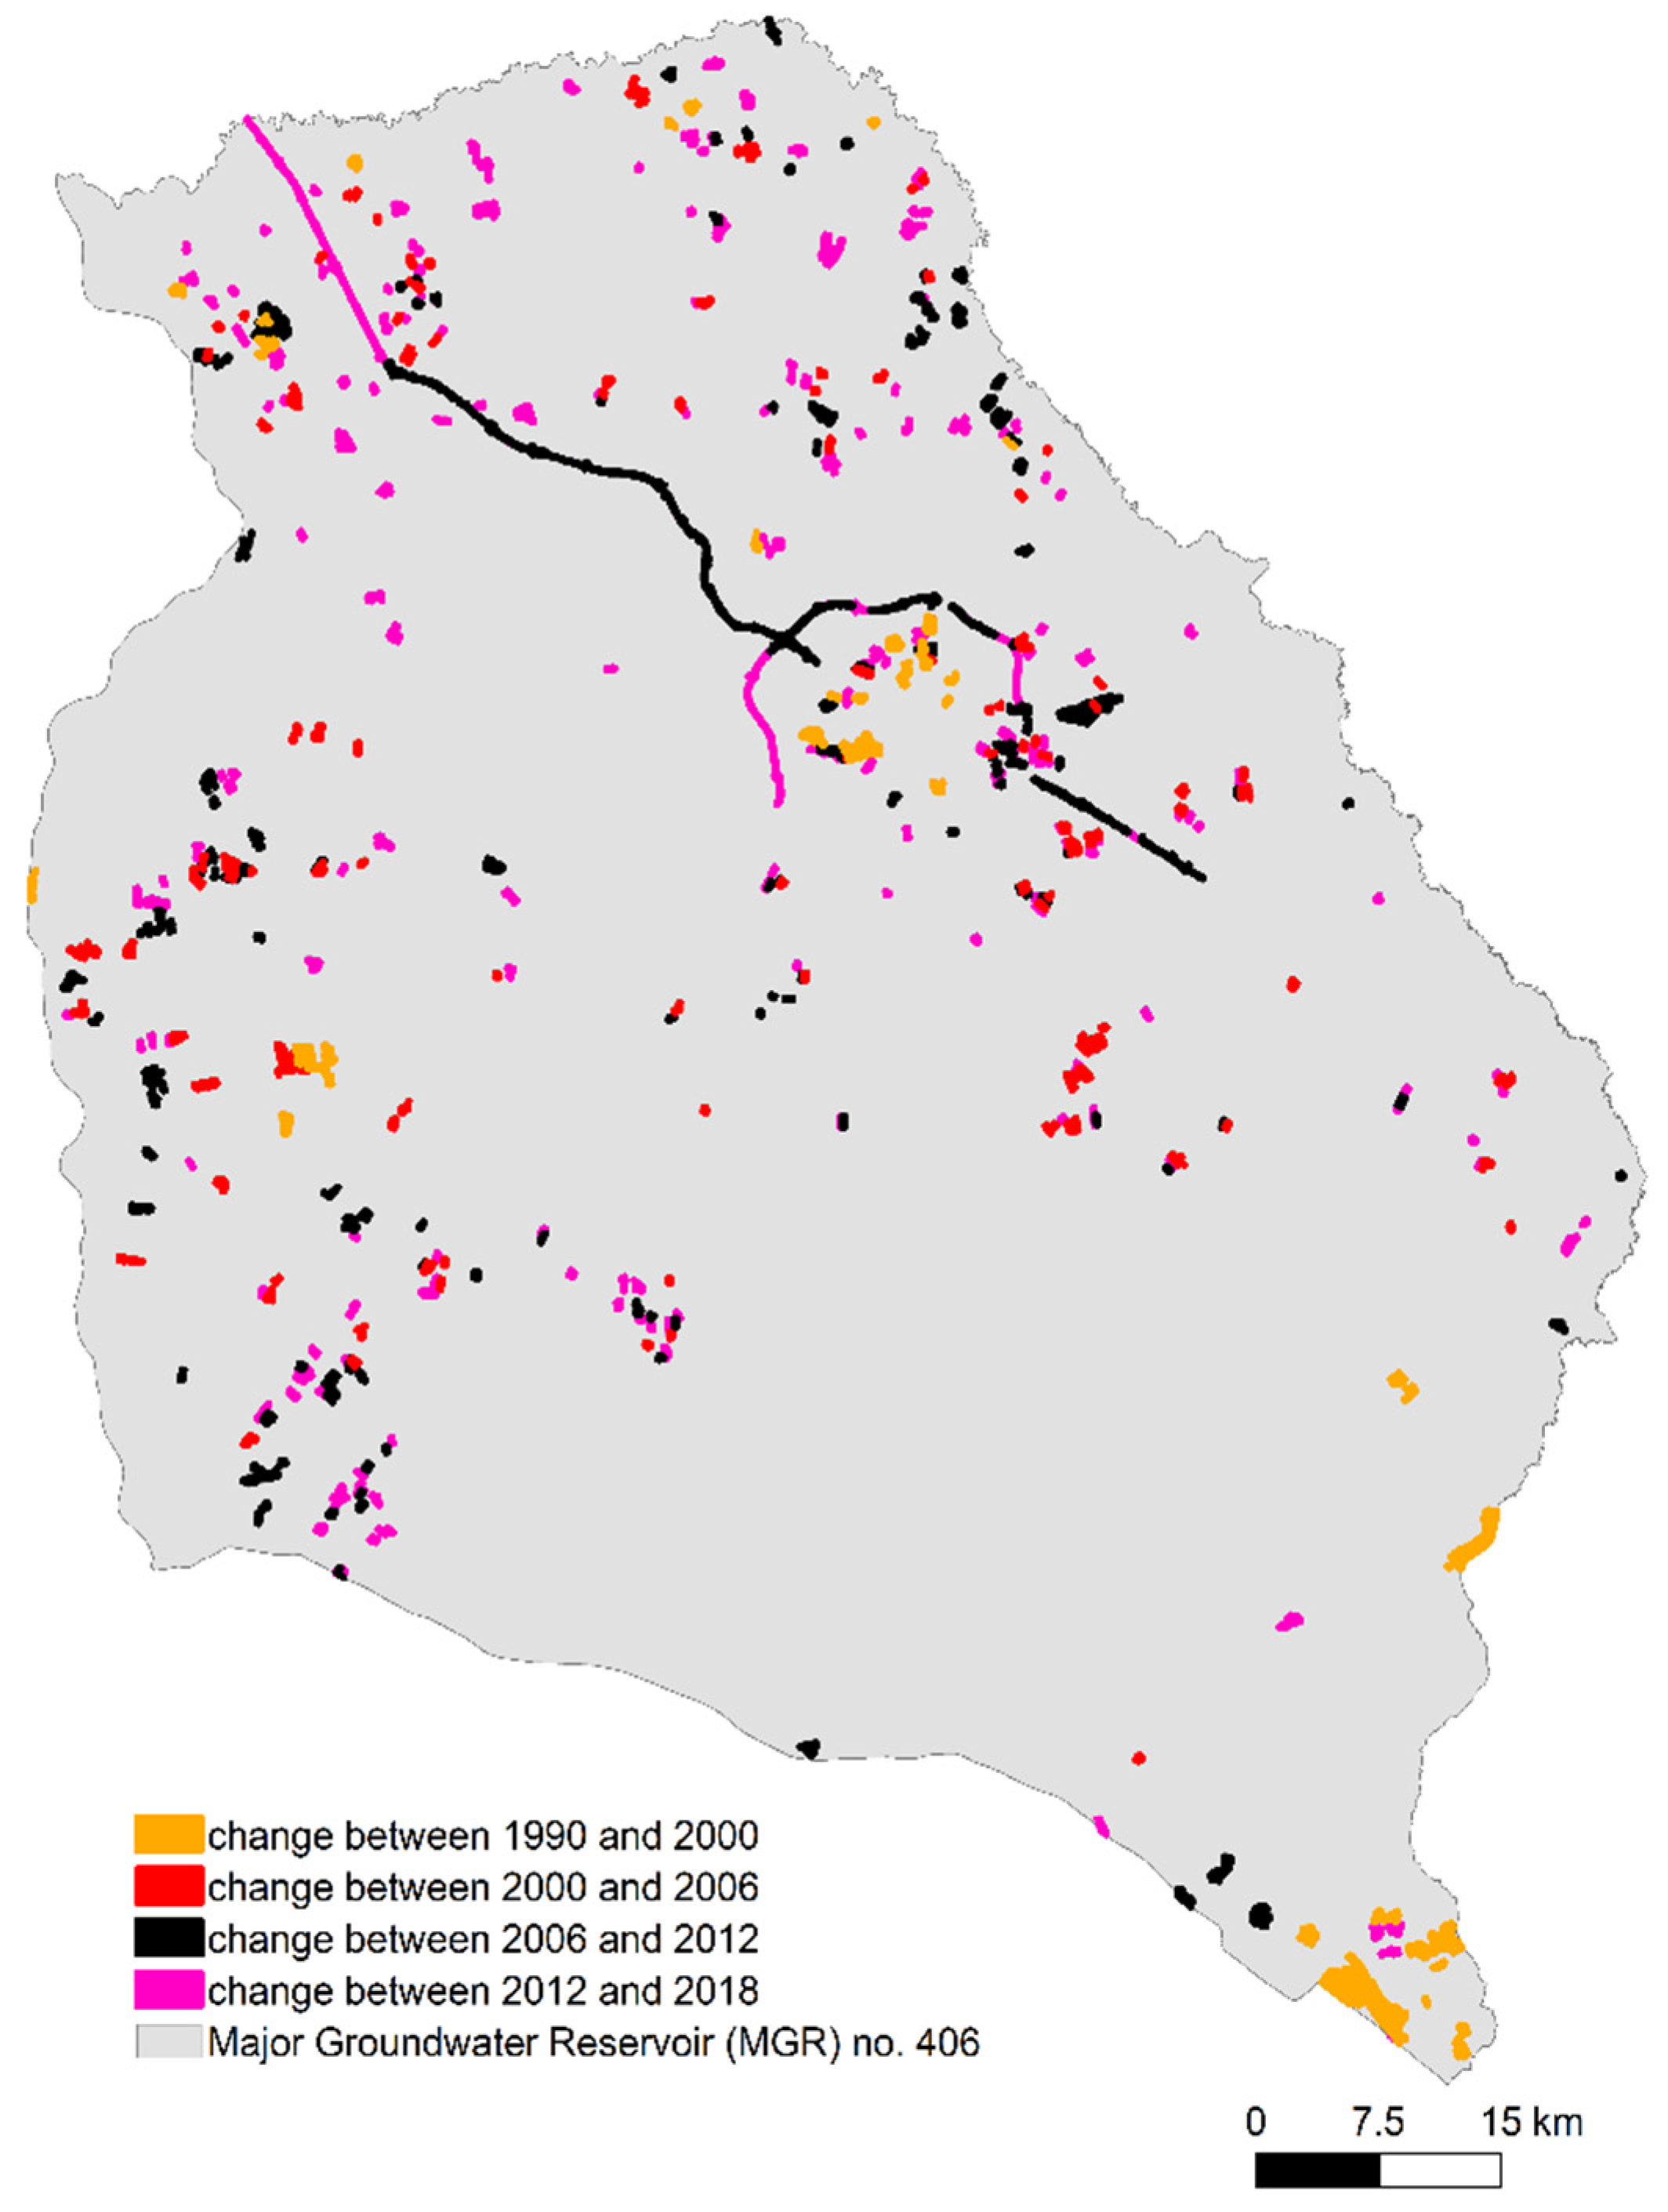
In Poland, 31 out of 44 Level 3 CLC land cover classes are present. Between 1990 and 2018, changes in land area affected 23 classes, showing varied transformation dynamics. From 1990 to 2000, land cover changes totaled 2755.5 hectares. All changes are presented in Figure 10 as a transition matrix and in Figure 11, where spatial changes are shown. The smallest changes occurred between 2000 and 2006 (1952.0 ha). In later periods, transformations intensified: 4055.3 ha from 2006 to 2012 and 4072.2 ha from 2012 to 2018. The most significant transitions included: class 312 to 324 in 2000, class 313 to 324 in 2006, class 211 to 133 in 2012, and class 133 to 122 in 2018. Within agricultural land, subtle but consistent changes were observed. The shift from class 211 (non-irrigated arable land) to class 222 (fruit trees and berry plantations) may reflect a strategic shift in agricultural production, driven by climate adaptation, soil conditions, and economic decisions. A notable transformation occurred between 1994 and 1998, when meadows and pastures were converted into the Nielisz reservoir on the Wieprz River—a major land cover change. Another key transformation involved 1208 hectares reclassified as class 122 (road and rail networks) between 2012 and 2018, linked to the completion of expressways S17 (Warsaw–Lublin) and S12 (Puławy–Lublin), and bypasses around Lublin. This process began in the 1990s, with the gradual conversion of agricultural land into class 133 (construction sites). As of 2018, 263 hectares remained in class 133, indicating that infrastructure development is still ongoing.

3.3. Threat to Groundwater Resources

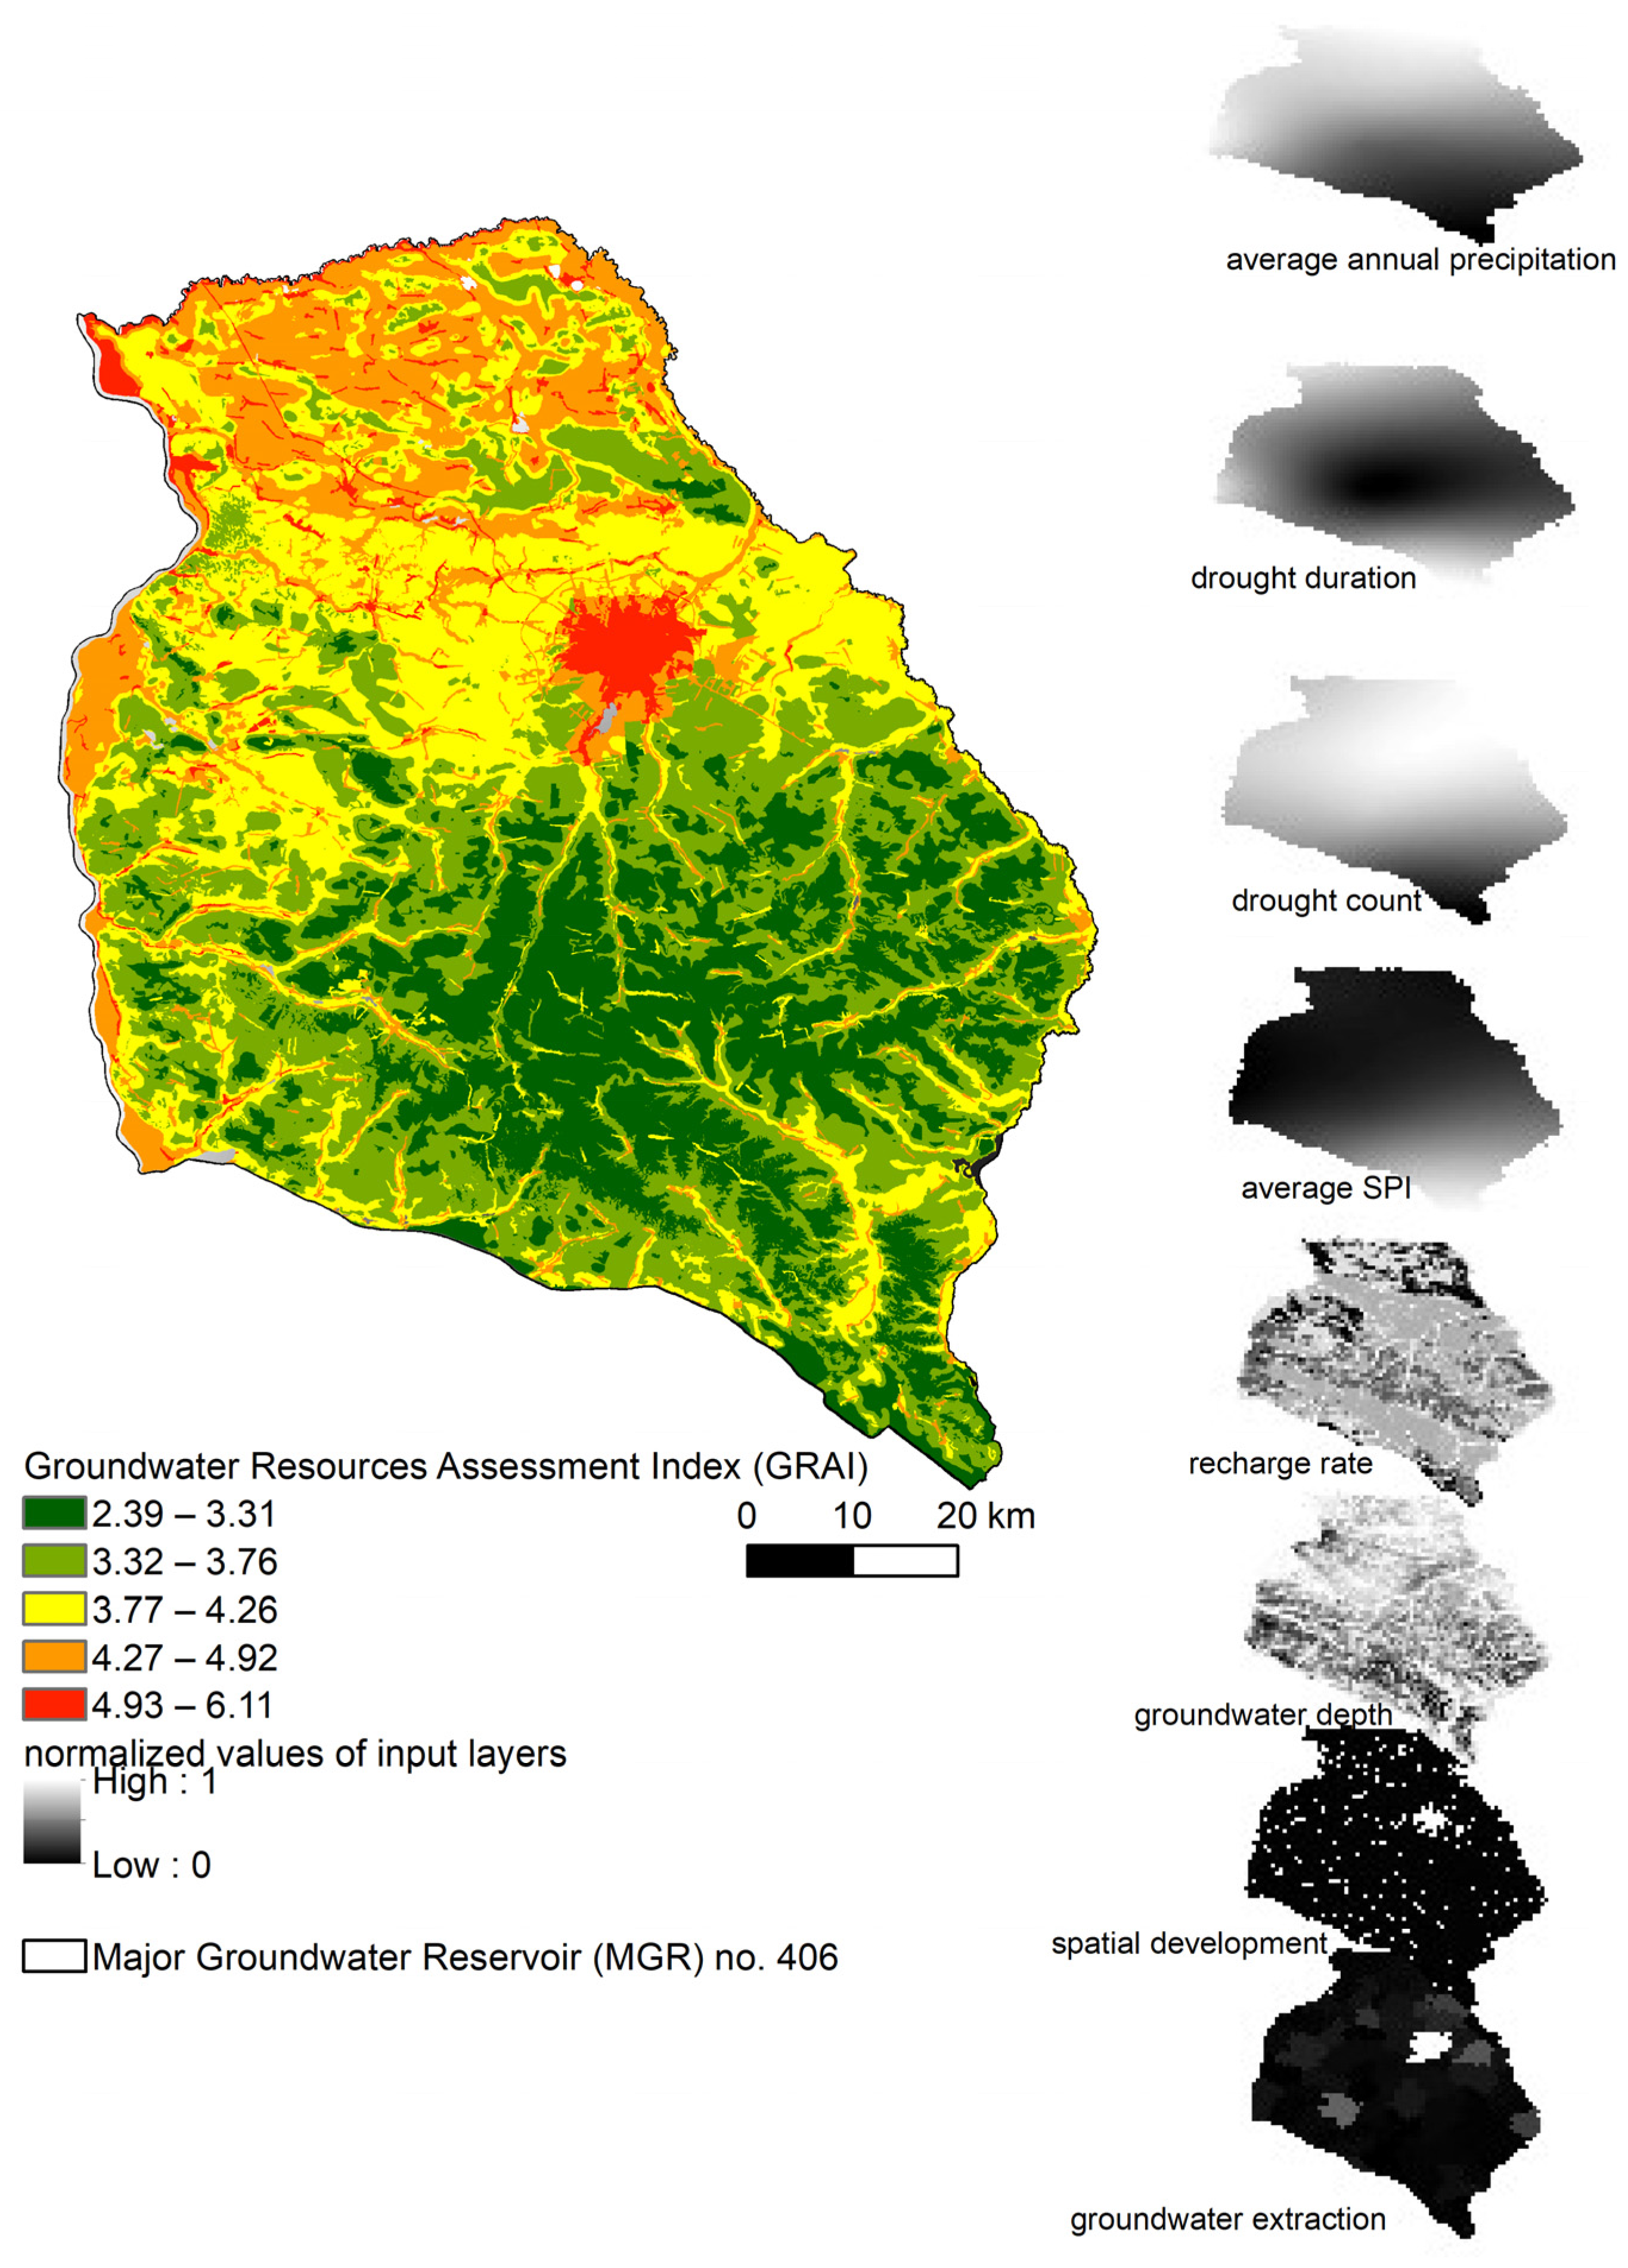
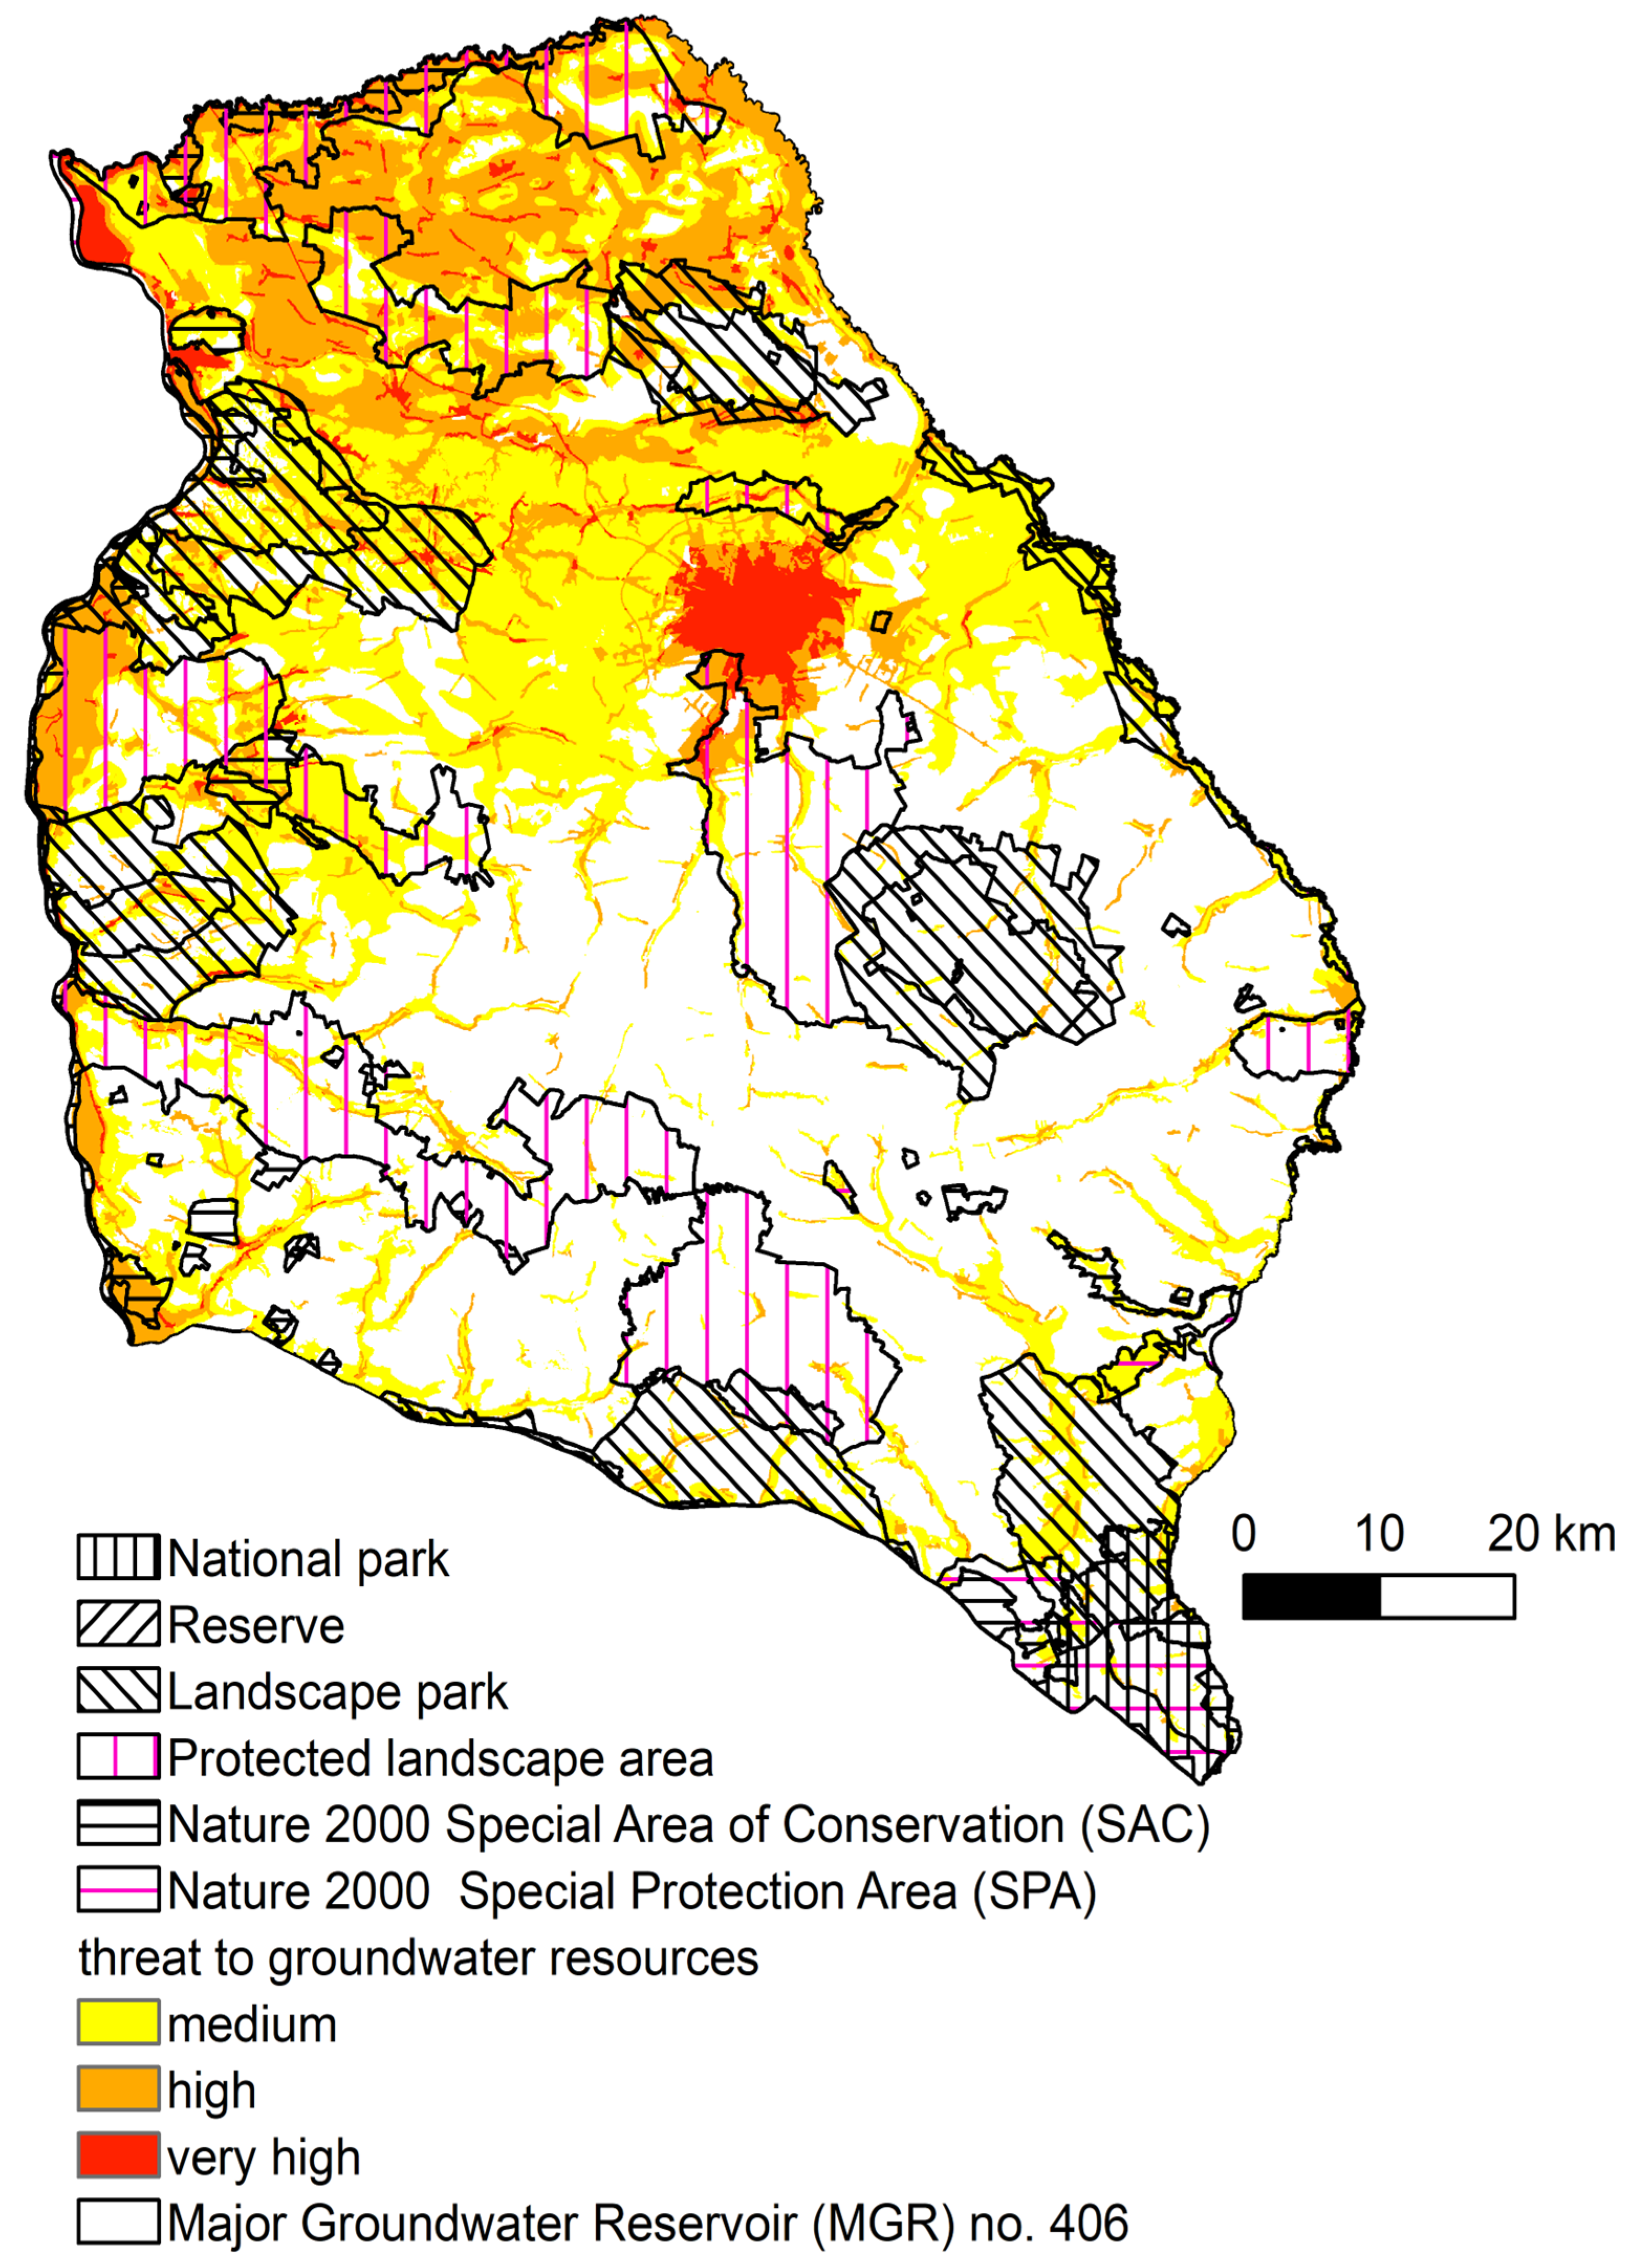
The groundwater threat assessment produced index values ranging from 2.38 to 6.11, within a theoretical scale of 0 to 8. These results indicate that the area is generally characterized by a low to moderate risk, although the chosen method of data presentation allowed for the identification of zones with a relatively high vulnerability. The average index value across the study area was 3.76, which served as a reference point for further interpretation. Values above the average were considered significant in terms of future groundwater risk. In Figure 12, the threat levels are visualized using a color-coded map based on the natural breaks classification method. Index values above the average are shown in yellow to red, indicating an elevated risk. Values below the average are displayed in green, suggesting relatively low concern. The highest index values (4.93–6.11) are concentrated around Lublin, the capital of the Lublin Voivodeship. Other high-risk zones (4.27–4.93) appeared as compact areas in the northern part of the region and along the Vistula River valley. Moderate-risk zones (3.76–4.27) stretched latitudinally across the central part of the area, near the latitude of Lublin. The lowest values (2.38–3.32) were found in the southern part, away from major river valleys. In smaller valleys, risk levels increased to 3.76–4.27, and at valley edges, some grid cells reached up to 4.93. In the northern part of the study area, groundwater protection is more challenging due to unfavorable climatic and hydrogeological conditions. These include low precipitation totals, frequent and prolonged droughts, and limited infiltration recharge in exposed Quaternary formations. Additionally, intensive groundwater extraction is observed north of Lublin, especially in the Lubartów municipality and Puławy, contributing to the increased pressure on water resources. In Lublin itself, the main factor driving the high risk is excessive groundwater use, which significantly exceeds levels in other municipalities. While most areas report an annual extraction between 100,000 and 1,000,000 m3, Lublin exceeds 24 million m3, placing substantial stress on local groundwater reserves.

4. Discussion

The spatial heterogeneity in precipitation trends among the stations within MGR 406 may reflect local geographic influences such as elevation and proximity to moisture sources. Zakrzówek’s more pronounced trend could relate to microclimatic conditions or a more consistent data coverage over time. Meanwhile, Lublin-Radawiec appears more climatically stable in terms of decadal precipitation totals. While interannual variability remains substantial, the decadal trends point toward a long-term transition to wetter conditions, a finding of both scientific and practical relevance for climate adaptation strategies in agriculture, water management, and urban infrastructure.
The results support a general regional tendency toward wetter conditions over the last seven decades, aligning with broader observations of increased precipitation in parts of Central and Eastern Europe. This is consistent with theoretical expectations of intensified hydrological cycles in response to global warming. The literature consistently shows that total annual rainfall and extreme precipitation events have intensified in Central and Eastern Europe during the period spanning 1950 to the present. This aligns with both theoretical expectations (warmer air carrying more moisture) and empirical observations from station data and regional climate assessments. Several studies confirm that both the total precipitation and the frequency of extreme precipitation events have increased in recent decades, largely in response to atmospheric warming and associated shifts in hydrological processes [27,28,29].
More recently, Uber et al. [30] provided evidence of enhanced rainfall erosivity (a proxy for intense precipitation) in Central Europe, comparing recent decades and highlighting a notable upward shift. These results are echoed by global assessments [19,29], which confirm an overall intensification of the hydrological cycle, particularly over land in mid-latitude regions such as Poland.
The observed drought pattern suggests a shift toward more frequent, moderate droughts rather than fewer, long-lasting extreme events. All five stations exhibit a relatively comparable average drought duration, suggesting regional coherence in drought persistence. However, differences in frequency and intensity highlight the importance of local factors such as topography, land use, and microclimate. Such variability poses challenges for water resource management, agriculture, and drought mitigation planning, especially in vulnerable catchments like MGR 406.
More frequent and seasonally intense droughts are consistent with broader Central and Eastern European hydroclimatic trends over recent decades [31,32,33,34,35]. These findings underscore the need for adaptive drought management strategies, especially as climate projections indicate continued increases in hydrological extremes in Central and Eastern Europe.
Changes in precipitation and drought patterns have important implications for groundwater recharge. Increased precipitation, particularly during intense summer events, can enhance recharge in permeable soils, though high-intensity rainfall may also increase runoff and reduce infiltration efficiency. Conversely, more frequent and prolonged droughts, as seen in recent decades, can significantly reduce groundwater replenishment. This is especially critical in catchments dependent on seasonal recharge dynamics, such as MGR 406, where groundwater serves as a key source for agriculture and public supply.
The spatial land-use analysis showed that, across the entire MGR 406 area, changes averaged 3.9% when comparing successive CORINE Land Cover layers from 1990 to 2018. The largest shift of 5.4% occurred in the 2012–2018 cycle. These figures suggest only minor land-use changes and a generally stable landscape that is unlikely to substantially increase the risk to groundwater quantity. Nonetheless, in zones already flagged as highly threatened, even a modest change could drive the gradual depletion of groundwater resources over time [36]. This pattern is most pronounced around Lublin and, to a lesser extent, Puławy (see Figure 13). It is also important to note that many of these transitions occur only between Level 3 classes in the CORINE system, while the broader Level 1 categories remain unchanged—particularly within Group 3—such as natural areas and forests, indicating that no deforestation has taken place that might further increase the groundwater resource risk.
The Groundwater Resources Assessment Index was applied to all large-scale legally protected areas, excluding small-scale forms such as natural monuments or ecological sites, whose presence should be considered at a broader scale when delineating exact protection zone boundaries. The results are summarized in Table 3. Most areas classified as low and medium threat have legal protection over 35–40% of their territory. In contrast, the most critical zones—those with the highest score on the Groundwater Resources Assessment Index and classified as a very high threat to groundwater resources—are the least protected, with under 25% coverage, and coincide with highly urbanized regions. Therefore, safeguarding groundwater quantities should be embedded within the development strategies of individual cities and entire metropolitan areas to ensure long-term water supply sustainability and a higher urban resilience to climate change [37]. Given the high degree of urban sealing, these strategies must also prioritize the renewability of groundwater resources through effective stormwater management [38].
An additional factor increasing the risk to groundwater resources in this area is the extraction of natural raw materials, primarily aggregates. Typically, sand, gravel, and carbonate deposits are mined by open-pit methods, which can cause local water-level drawdown, reduce resource renewability, and alter flow directions and velocities within the aquifer [39,40]. Currently, extraction is taking place at 65 sites, covering a total of 418 ha, 40 of which are dedicated to natural aggregate production. No depression cones have been observed, so it can be assumed that the overall impact on the volume of groundwater resources across MGR 406 is negligible.

5. Conclusions

This study assessed the threat to groundwater resources in the Major Groundwater Reservoir 406 (MGR 406), southeastern Poland, in the context of changing precipitation patterns and land use. The results indicate a statistically significant upward trend in annual precipitation at most monitoring stations from 1951 to 2024, with increases reaching up to +2.18 mm/year, which are confirmed by decadal average rises +14.98 mm/decade. Despite growing annual rainfall totals, drought episodes remain a critical concern. SPI-based analysis reveals that the number of droughts per decade has increased, with recent decades (2001–2020) showing up to 5–6 drought events, in contrast to 3–4 in the 1970s–1980s. The average drought duration has declined to 2–4 months, compared to 6–8 months in the 1950s–1960s, and minimum SPI values remained relatively stable, but the growing frequency signals a reduced recharge continuity. Groundwater abstraction data highlight the spatial pressure on groundwater resources. Annual extraction in Lublin represents a disproportionately high share of the reservoir’s total usage, but still, the total extraction in MGR 406 is 18% of available and 12% of renewable resources.
A land cover analysis based on CORINE data from the period of 1990–2018 reveals gradual but directional changes of 5.4% in the 2012–2018 period alone, mainly due to urban expansion. Although the overall land-use change was modest (average 3.9% per cycle), these shifts concentrated around urban centers intersect areas of the highest groundwater threat estimated through the assessment procedure. The Groundwater Resources Assessment Index (GRAI), including all theme layers, identified Lublin and adjacent municipalities as the highest-risk zones. In these areas, only 23.7% of land is legally protected, compared to over 40% in low-threat zones. This protection gap underscores the need to embed groundwater risk assessments in spatial planning. In summary, while the total rainfall shows a positive trend, recharge efficiency is constrained by drought fragmentation and land sealing. Sustainable management of MGR 406 requires targeted actions: improving legal protection in high-risk urban zones, enhancing infiltration through landscape planning, and integrating groundwater considerations into metropolitan infrastructure development.

Author Contributions

Conceptualization, S.Z., D.P. and E.K.; methodology, S.Z. and D.P.; software, S.Z. and K.S.; validation, D.P.; formal analysis, K.S.; investigation, K.S.; resources, K.S. and S.Z.; data curation, K.S.; writing—original draft preparation, S.Z., K.S. and D.P.; writing—review and editing, S.Z., K.S. and D.P.; visualization, S.Z.; supervision, S.Z. and D.P.; project administration, E.K.; funding acquisition, E.K. All authors have read and agreed to the published version of the manuscript.

Funding

This research received no external funding.

Conflicts of Interest

The authors declare no conflict of interest.

References

  1. Ciampittiello, M.; Marchetto, A.; Boggero, A. Water Resources Management under Climate Change: A Review. Sustainability 2024, 16, 3590. [Google Scholar] [CrossRef]
  2. Kleczkowski, A.S. (Ed.) Mapa Obszarów Głównych Zbiorników Wód Podziemnych (GZWP) w Polsce Wymagających Szczególnej Ochrony, Skala 1:500 000: Objaśnienia; IHiGI AGH: Kraków, Poland, 1990. [Google Scholar]
  3. Main Groundwater Reservoirs (MGR) in Poland. Available online: https://www.pgi.gov.pl/psh/dane-hydrogeologiczne-psh/947-bazy-danych-hydrogeologiczne/8890-gzwp.html (accessed on 10 May 2025).
  4. Water Law Act of 2017. Available online: https://isap.sejm.gov.pl/isap.nsf/DocDetails.xsp?id=WDU20170001566 (accessed on 14 May 2025).
  5. Herbich, P.; Kapuściński, J.; Nowicki, K.; Prażak, J.; Skrzypczyk, L. Metodyka Wyznaczania Obszarów Ochronnych Głównych Zbiorników Wód Podziemnych Dla Potrzeb Planowania i Gospodarowania Wodami w Obszarach Dorzeczy; Ministerstwo Środowiska: Warszawa, Poland, 2009. Available online: https://www.pgi.gov.pl/oferta-inst/wydawnictwa/ksiazki/naukowe-i-metodyczne/6252-metodyka-wyznaczania-obszarow-gzwp.html (accessed on 11 June 2025).
  6. Directive 2000/60/EC of the European Parliament and of the Council of 23 October 2000 Establishing a Framework for Community Action in The Field of Water Policy. Available online: https://eur-lex.europa.eu/eli/dir/2000/60/oj/eng (accessed on 12 June 2025).
  7. Gleeson, T.; Wada, Y.; Bierkens, M.F.P.; van Beek, L.P.H. Water balance of global aquifers revealed by groundwater footprint. Nature 2012, 488, 197–200. [Google Scholar] [CrossRef]
  8. Jain, V.K.; Pandey, R.P.; Jain, M.K. Spatio-temporal assessment of vulnerability to drought. Nat. Hazards 2015, 76, 443–469. [Google Scholar] [CrossRef]
  9. McKee, T.B.; Doesken, N.J.; Kleist, J. The relationship of drought frequency and duration of time scales. In Proceedings of the Eighth Conference on Applied Climatology, Anaheim, CA, USA, 17–23 January 1993; American Meteorological Society: Boston, MA, USA, 1993; pp. 179–186. [Google Scholar]
  10. Van Loon, A.F.; Van Lanen, H.A.J. A process-based typology of hydrological drought. Hydrol. Earth Syst. Sci. 2012, 16, 1915–1946. [Google Scholar] [CrossRef]
  11. Czerwińska-Tomczyk, J.; Rysak, A.; Łusiak, R.; Gil, R.; Zwoliński, Z. Dokumentacja Określająca Warunki Hydrogeologiczne Dla Ustanowienia Obszaru Ochronnego Zbiornika Wód Podziemnych Niecka Lubelska (GZWP nr 406); Państwowy Instytut Geologiczny: Lublin, Poland, 2008. [Google Scholar]
  12. Chart of Groundwater Body No. 88. Available online: https://bazadata.pgi.gov.pl/data/hydro/jcwpd/jcwpd88.pdf (accessed on 16 June 2025).
  13. Chart of Groundwater Body No. 89. Available online: https://bazadata.pgi.gov.pl/data/hydro/jcwpd/jcwpd89.pdf (accessed on 16 June 2025).
  14. Chart of Groundwater Body No. 90. Available online: https://bazadata.pgi.gov.pl/data/hydro/jcwpd/jcwpd90.pdf (accessed on 16 June 2025).
  15. POBORY Database, Data Available upon Request; National Geological Institute: Warsaw, Poland, 2025.
  16. Krajewski, S. Wody szczelinowe kredy lubelskiej. Prz. Geol. 1984, 32, 359–363. [Google Scholar]
  17. Krajewski, S.; Motyka, J. Model sieci hydraulicznej w skałach węglanowych w Polsce. Biul. PIG 1999, 388, 115–138. [Google Scholar]
  18. Institute of Meteorology and Water Management—National Research Institute. Precipitation Data. Available online: https://danepubliczne.imgw.pl/ (accessed on 13 May 2025).
  19. World Meteorological Organization (WMO); IPCC. Effects of Climate Change on the Water Cycle, WMO Bull. 2024. Available online: https://wmo.int/resources/wmo-bulletin (accessed on 11 June 2025).
  20. Hayes, M.J. Comparison of Major Drought Indices: Introduction, National Drought Mitigation Center. 2011. Available online: http://drought.unl.edu/monitoring/SPI.aspx (accessed on 11 June 2025).
  21. Bloomfield, J.P.; Marchant, B.P. Analysis of groundwater drought building in the standardized precipitation index approach. Hydrol. Earth Syst. Sci. 2013, 17, 4769–4787. [Google Scholar] [CrossRef]
  22. CORINE Land Cover 1990, 2000, 2008, 2012 and 2018. Available online: https://clc.gios.gov.pl/ (accessed on 8 May 2025).
  23. Natura 2000 Network. Available online: https://www.gov.pl/web/gdos/dostep-do-danych-geoprzestrzennych (accessed on 22 May 2025).
  24. Peters, E.; Bier, G.; van Lanen, H.A.J.; Torfs, P.J.J.F. Propagation and spatial distribution of drought in a groundwater catchment. J. Hydrol. 2006, 321, 257–275. [Google Scholar] [CrossRef]
  25. Krogulec, E.; Gruszczyński, T.; Kowalczyk, S.; Małecki, J.J.; Mieszkowski, R.; Porowska, D.; Sawicka, K.; Trzeciak, J.; Wojdalska, A.; Zabłocki, S.; et al. Causes of groundwater level and chemistry changes in an urban area; a case study of Warsaw, Poland. Acta Geol. Pol. 2022, 72, 495–517. [Google Scholar] [CrossRef]
  26. Water-Retention Potential of Europe’s Forests. A European Overview to Support Natural Water-Retention Measures; EEA Technical Report No 13/2015; Publications Office of the European Union: Luxembourg, 2015; ISBN 978-92-9213-694-9. Available online: https://www.eea.europa.eu/en/analysis/publications/water-retention-potential-of-forests (accessed on 7 May 2025).
  27. Thiery, W.; Gudmundsson, L.; Davin, E.L.; Seneviratne, S.I. Observed scaling of extreme precipitation with temperature in Central Europe. Environ. Res. Lett. 2019, 14, 124011. [Google Scholar]
  28. Fauer, D.; Rust, H.W. Nonstationary largescale statistics of precipitation extremes in Central Europe. Clim. Dyn. 2022, 59, 917–937. [Google Scholar]
  29. IPCC. Regional Fact Sheet—Europe. In Climate Change 2021: The Physical Science Basis. Contribution of Working Group I to the Sixth Assessment Report of the Intergovernmental Panel on Climate Change; IPCC: Geneva, Switzerland, 2021. [Google Scholar]
  30. Uber, M.; Panagos, P.; Ballabio, C. Past, present and future rainfall erosivity in Central Europe in response to climate change. Sci. Total Environ. 2024, 910, 168987. [Google Scholar]
  31. Spinoni, J.; Naumann, G.; Vogt, J. Pan-European seasonal trends and recent changes of drought frequency and severity. Glob. Planet. Change 2018, 161, 118–130. [Google Scholar] [CrossRef]
  32. Ionita, M.; Nagavciuc, V. Changes in drought features at European level over the last 120 years. Nat. Hazards Earth Syst. Sci. 2021, 21, 1685–1701. [Google Scholar] [CrossRef]
  33. Loyd-Hughes, B.; Zaidman, M.; Prudhomme, C. Trends in drought occurrence and severity at mid-latitude European meteorological stations (1951–2015). Clim. Dyn. 2022, 58, 765–783. [Google Scholar]
  34. Trnka, M.; Balek, J.; Štĕpánek, P.; Zahradníček, P.; Možný, P.; Eitzinger, J.; Žalud, Z.; Formayer, H.; Turňa, M.; Nejedlík, P.; et al. Drought trends over part of Central Europe between 1961 and 2014. Clim. Res. 2016, 70, 143–160. [Google Scholar] [CrossRef]
  35. Ionita, M.; Nagavciuc, V.; Kumar, R.; Rakovec, O. On the curious case of the recent decade, mid-spring precipitation deficit in central Europe. npj Clim. Atmos. Sci. 2020, 3, 49. [Google Scholar] [CrossRef]
  36. Yadav, S.K. Land Cover Change and Its Impact on Groundwater Resources: Findings and Recommendations. In Groundwater—New Advances and Challenges; Tarhouni, J., Ed.; IntechOpen: London, UK, 2023; Available online: https://www.intechopen.com/chapters/87133 (accessed on 13 June 2025).
  37. Foster, S.; Hirata, R.; Misra, S.; Garduño, H. Global Policy Overview of Groundwater in Urban Development—A Tale of 10 Cities! Water 2020, 12, 456. [Google Scholar] [CrossRef]
  38. Mohammad-Hosseinpour, A.; Molina, J.L. Improving the Sustainability of Urban Water Management through Innovative Groundwater Recharge System (GRS). Sustainability 2022, 14, 5990. [Google Scholar] [CrossRef]
  39. Różkowski, K.; Zdechlik, R.; Chudzik, W. Open-Pit Mine Dewatering Based on Water Recirculation—Case Study with Numerical Modelling. Energies 2021, 14, 4576. [Google Scholar] [CrossRef]
  40. Szczepiński, J. The Significance of Groundwater Flow Modeling Study for Simulation of Opencast Mine Dewatering, Flooding, and the Environmental Impact. Water 2019, 11, 848. [Google Scholar] [CrossRef]
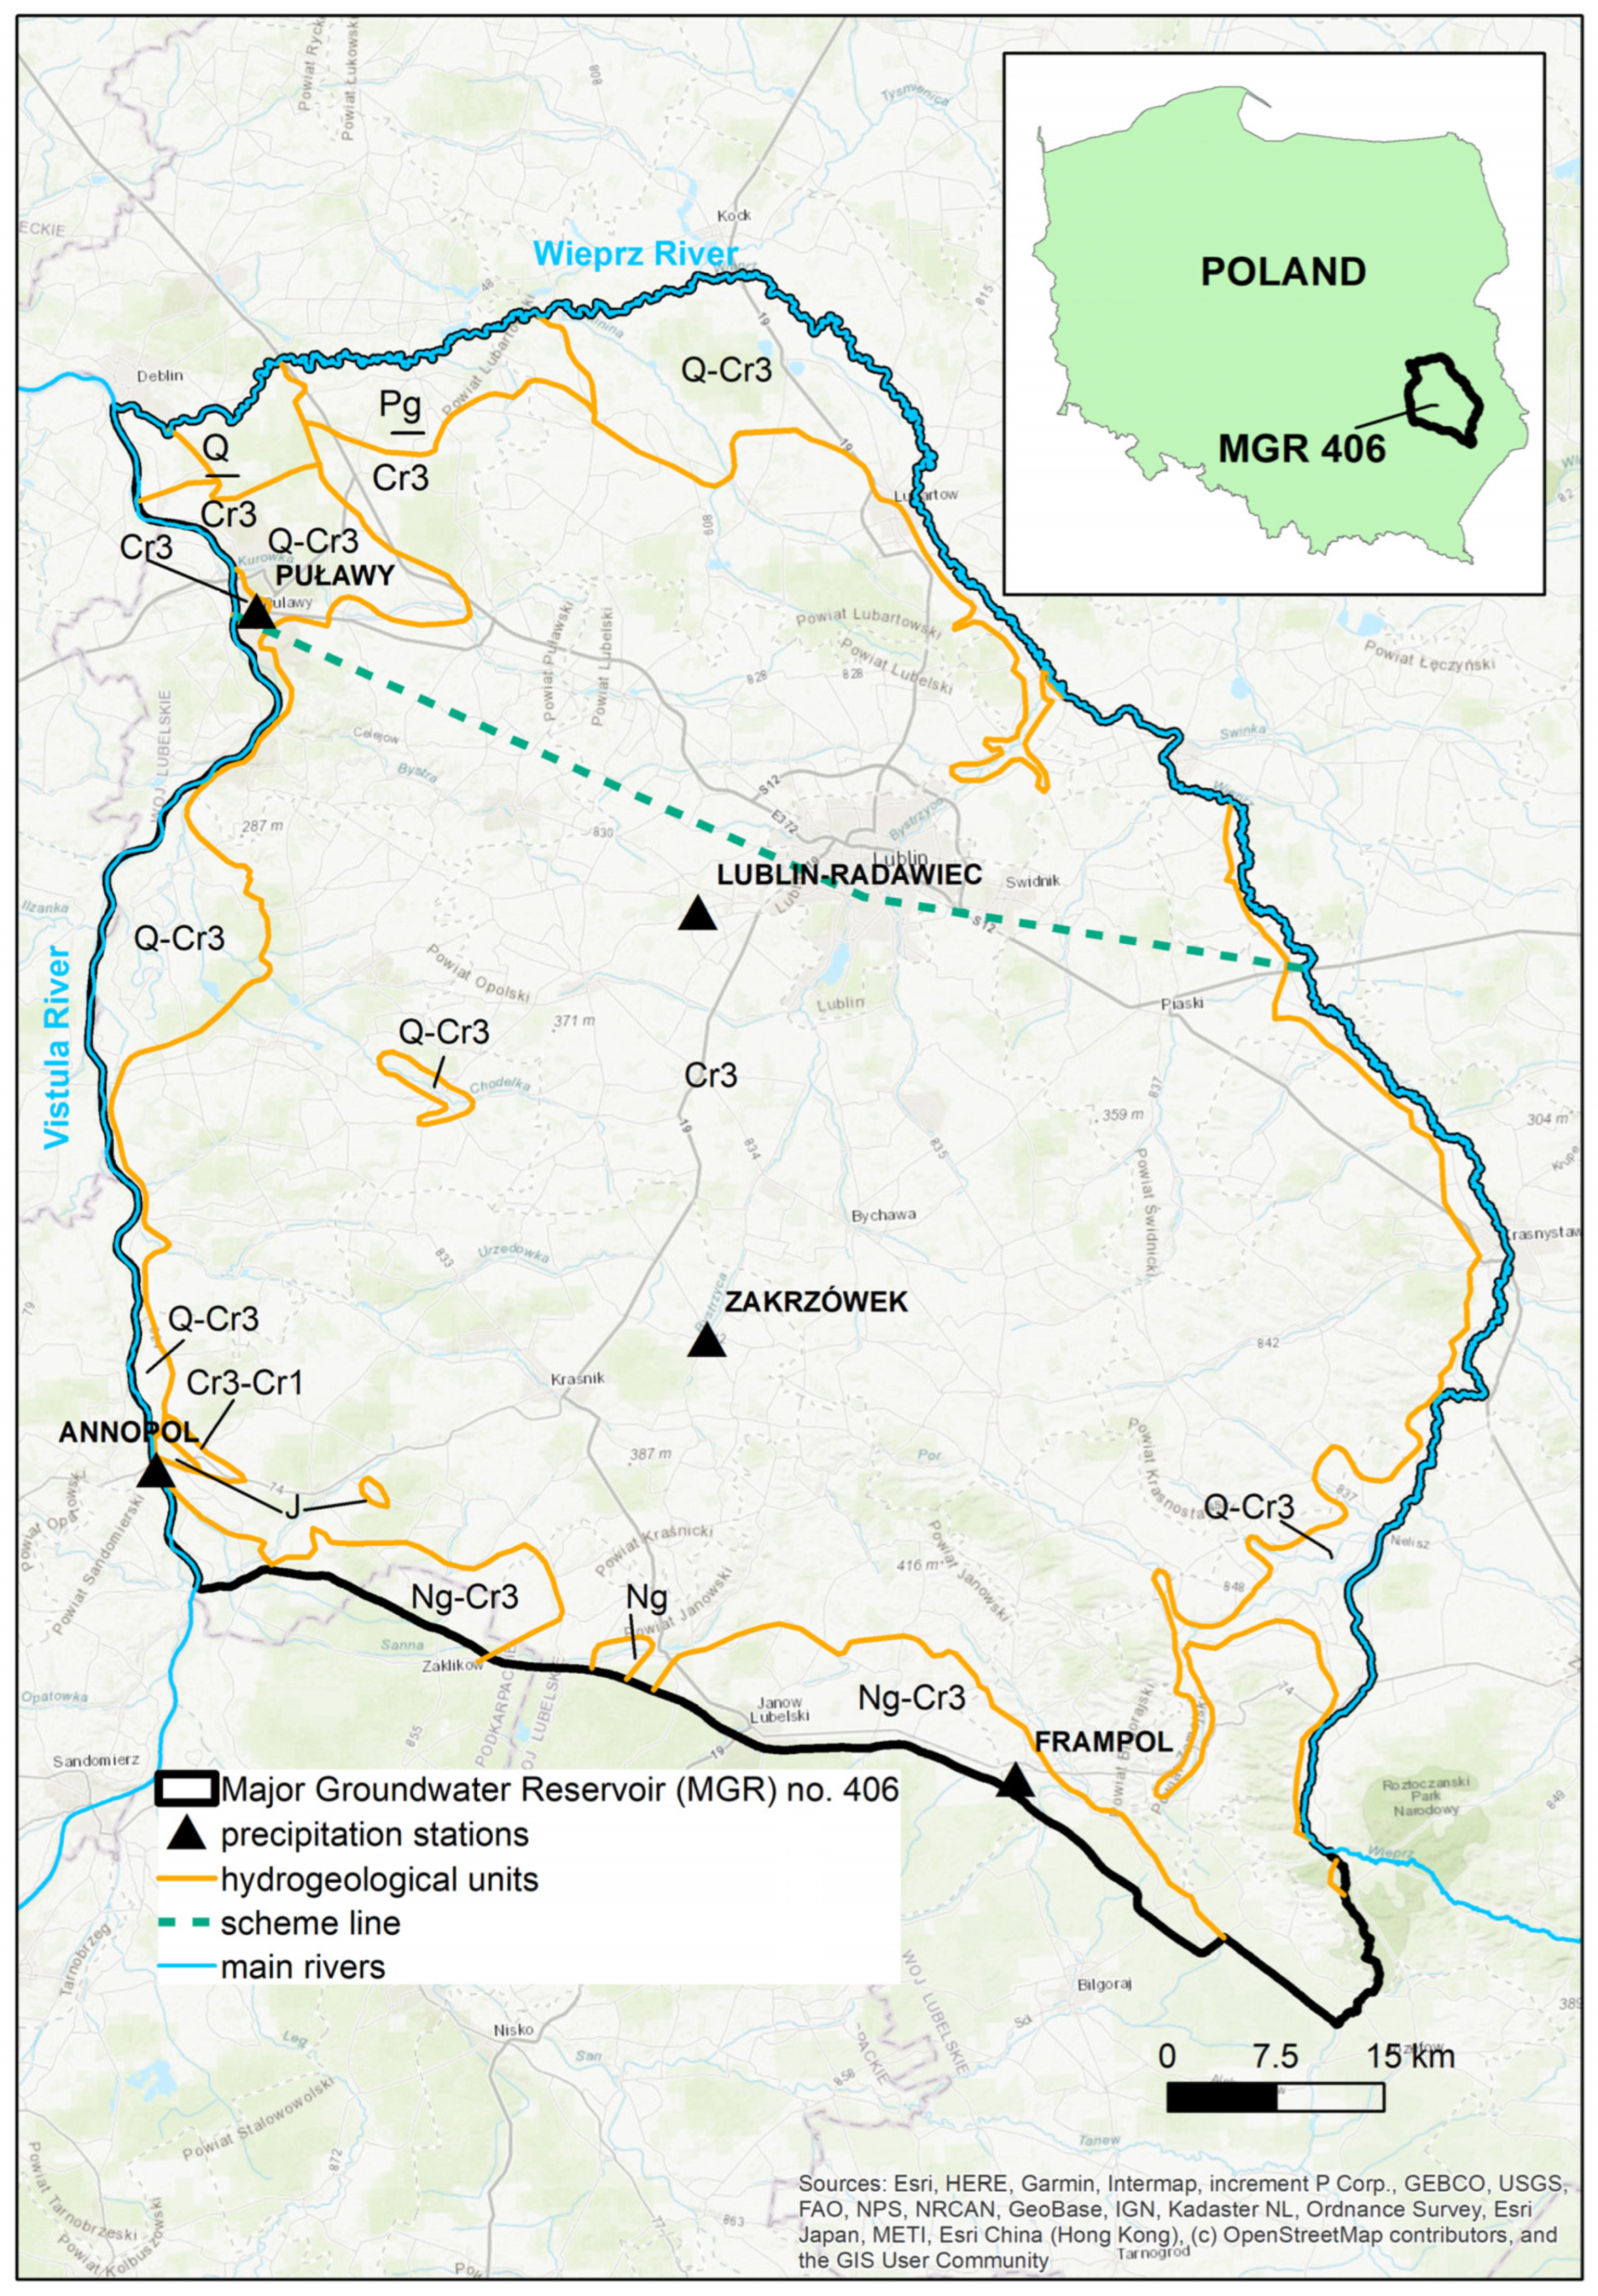
Figure 1. Location of MGR 406 and occurrence of main usable aquifers (simplified after [11]).
Land 14 01659 g001
Figure 2. Geological scheme of MGR 406.
Land 14 01659 g002
Figure 3. Selected elements of hydrogeological conditions of MGR 406: (A)—groundwater depth [11]; (B)—recharge [11]; and (C)—groundwater extraction in municipalities [15].
Land 14 01659 g003
Figure 4. Assessment procedure for MGR 406.
Land 14 01659 g004
Figure 5. Time series of total annual precipitation with trend lines for 5 rainfall stations in the MGR 406 region (1951–2024).
Land 14 01659 g005
Figure 6. Decadal average precipitation and interdecadal changes (in %) based on data from 5 rainfall stations in the MGR 406 Region (1951–2020).
Land 14 01659 g006
Figure 7. Temporal variability of the Standardized Precipitation Index at 5 rainfall stations in the MGR 406 area (1951–2024).
Land 14 01659 g007
Figure 8. Spatial development structure based on CLC Level 1.
Land 14 01659 g008
Figure 9. Sankey chart for CLC Level 1 class area changes between 1990 and 2018.
Land 14 01659 g009
Figure 10. Transition matrix of CLC class between: (A)—1990 and 2000; (B)—2000 and 2006; (C)—2006–2012; and (D)—2012–2018.
Land 14 01659 g010
Figure 11. Spatial changes in land use since 1990. The map shows the location and extent of major land cover transitions, with the most significant changes observed around urban areas and along key transport routes, as well as in selected forested zones undergoing reclassification.
Land 14 01659 g011
Figure 12. Normalized input layers and Groundwater Resources Assessment Index results. The map illustrates the spatial distribution of threat levels to groundwater resources, with high-risk zones (yellow to red) concentrated mainly around Lublin, Puławy, and in parts of the Vistula River valley, while low-risk zones (green) dominate southern and upland areas.
Land 14 01659 g012
Figure 13. Location of priority areas for groundwater resources protection relative to existing legally protected zones. The figure shows areas of highest assessed threat (red) in relation to national parks, Natura 2000 sites, and landscape parks, highlighting regions where legal protection is limited or absent.
Land 14 01659 g013
Table 1. Decadal characteristics of drought events based on SPI data from 5 precipitation stations (1951–2024) in MGR 406 area.
DecadeTotal EventsAvg. Duration [Months]Avg_SPIMax_Intensity [SPI]
1951–196067.0−1.90−3.77
1961–197044.9−1.52−2.28
1971–198043.4−1.46−2.75
1981–199044.2−1.50−2.59
1991–200032.6−1.32−2.39
2001–201052.3−1.03−2.12
2011–202052.0−1.37−2.27
2021–202414.5−1.70−1.93
Table 2. Input of precipitation analysis data for spatial distribution of parameters needed in assessment procedure.
Station NameY
Coordinate
X
Coordinate
Average SPI During DroughtDrought CountAverage Duration of Drought [Months]Average Annual Precipitation in 1951–2024 [mm]
ANNOPOL338,982.98699,235.71−1.44216.7572
FRAMPOL317,487.94759,015.21−1.89126.5641
PUŁAWY398,626.92706,217.46−1.51236.3580
ZAKRZÓWEK348,020.72737,562.48−1.50234.5620
LUBLIN-RADAWIEC377,719.68736,915.23−1.49265.1589
Table 3. Degree of legal protection of areas identified in the assessment.
Groundwater Resources Assessment Index (GRAI)Threat/RiskTotal Area
[km2]
Legally Protected AreasAreas Without Legal Protection
fromto[km2][%][km2][%]
2.393.31low1670.1679.340.7990.859.3
3.323.76low2444.1981.240.11462.959.9
3.774.26medium2040.4720.735.31319.764.7
4.274.92high1117.1431.138.6686.161.4
4.936.11very high220.952.323.7168.776.3
Disclaimer/Publisher’s Note: The statements, opinions and data contained in all publications are solely those of the individual author(s) and contributor(s) and not of MDPI and/or the editor(s). MDPI and/or the editor(s) disclaim responsibility for any injury to people or property resulting from any ideas, methods, instructions or products referred to in the content.