Article

Optimizing Agricultural Sustainability Through Land Use Changes Under the CAP Framework Using Multi-Criteria Decision Analysis in Northern Greece

1
Department of Agricultural Economics, Aristotle University of Thessaloniki, 54124 Thessaloniki, Greece
2
Agricultural Economics and Consumer Behavior Lab, University of Thessaly, 38446 Volos, Greece
*
Author to whom correspondence should be addressed.
Land 2025, 14(8), 1658; https://doi.org/10.3390/land14081658
Submission received: 17 July 2025 / Revised: 12 August 2025 / Accepted: 13 August 2025 / Published: 15 August 2025

Abstract

This research investigates the implementation of multi-criteria decision analysis (MCDA) within the framework of the Common Agricultural Policy (CAP) for the period of 2023–2027, focusing on optimizing agricultural sustainability and profitability in Northern Greece. Using data from three farmer groups across Central and Western Macedonia, the study explores the application of MCDA models within three distinct case studies: the first optimizes a farm system focused on input minimization (Loudias), while the second and third (Ryakio and Agia Paraskevi) adopt a more comprehensive approach to farm management. More specifically, the first case focused on maximizing gross margin, minimizing variable costs, and reducing fertilizer use without targeting a reduction in water usage. By contrast, the second case study adopted a holistic approach to farm management, integrating water conservation in the Ryakio farmer group. The third included the requirement to keep arable land fallow in the Agia Paraskevi farmer group, reflecting the CAP’s new mandates. The results indicate that MCDA facilitates strategic crop selection and land changes that significantly enhance farm management efficiency and sustainability. The optimization led to more significant percentage increases in gross margin for the second (Ryakio) and third (Agia Paraskevi) case studies compared to the first, with the Agia Paraskevi group showing the most substantial improvement.

1. Introduction

The global population is projected to surpass nine billion by 2050 [1,2]. A natural consequence of this growth is the increased demand for food production, leading to increased pressure on natural resources [3]. The agricultural sector, in particular, is responsible for the consumption of a considerable number of natural resources, imposing substantial environmental burdens [4]. The evident correlation between the agricultural sector and resource consumption explains the considerable strain the sector has experienced in recent years due to resource scarcity [5]. In their efforts to sustain agricultural output, farmers have faced declining incomes due to factors such as the rising costs of inputs, including fertilizers, pesticides, and fuel [6]. Within the European Union, these complex decisions are heavily influenced by the subsidy and regulatory framework of the Common Agricultural Policy (CAP), which acts as a primary driver of farmers’ land use choices and production strategies.
The increase in agricultural output has posed numerous challenges in the sustainable management of natural resources. Concurrently, there is a disparity in farmers’ incomes, prompting them to reduce input usage [7]. The CAP for the period of 2023–2027 encompasses a range of directives, laws, and regulations governing agricultural product trade, production, and interventions aimed at enhancing competitiveness, sustainability, and resilience while safeguarding the environment [8].
The Common Agricultural Policy (CAP) for 2023–2027 replaces the previous compliance framework with a new, results-oriented green architecture [9]. This green architecture is structured around three components: a mandatory baseline of enhanced conditionality, voluntary eco-schemes under Pillar I, and the pluriannual agri-environmental measures under Pillar II, providing a coherent framework for environmental protection and climate action [10]. This study models these components as they applied in the first year of the implementation of the new CAP framework. These schemes reward farmers for adopting ambitious practices beyond the baseline, such as crop diversification [11], and are designed so that Member States have significant flexibility through their National Strategic Plans [9,11]. In Greece’s CAP Strategic Plan, this enhanced conditionality is implemented through specific standards (known as Good Agricultural and Environmental Conditions—GAECs), such as mandatory crop rotation on arable land (GAEC 7) and the requirement to devote a minimum share of land to non-productive features (GAEC 8) [12].
The challenge of balancing increased agricultural production with environmental sustainability is becoming more pronounced. In response, the Common Agricultural Policy for the period of 2023–2027 sets targets for the responsible use of natural resources. There is a particular emphasis on minimizing the use of inputs such as chemical fertilizers, pesticides, water, fuels, and all other resources essential for agricultural production [1,2,3]. The successful implementation of these new CAP guidelines relies on the collaborative engagement of stakeholders within the agricultural sector, regulatory bodies, and the scientific research community. This ensures that the implementation of the new CAP guidelines effectively promotes competitiveness while safeguarding ecological integrity.
In recent years, operations research approaches have become instrumental in modeling complex agricultural challenges. These methods, which extensively utilize various mathematical models, aid significantly in decision making related to agricultural resource management [13,14]. Among these methodologies, MCDA has emerged as a critical tool for addressing intricate problems across agricultural planning, natural resource management, and policy modeling [15,16,17].
The utilization of MCDA in agriculture has been well documented, with applications ranging from enhancing natural resource governance to integrating environmental considerations into comprehensive policy frameworks [18,19,20,21,22]. For example, Bruzzese et al. (2023) [23] focus on employing multicriteria analysis to improve natural resource governance, while Cohen et al. (2019) [24] examine the integration of greenhouse gas (GHG) mitigation with development objectives through MCDA. Additionally, Riesgo and Gómez-Limón (2006) [25] have developed a multi-criteria model for policy scenario analysis in public management, demonstrating the adaptability of MCDA to various policy-related challenges. Despite extensive research and application, a significant gap remains in the adaptation of MCDA methodologies to the evolving requirements of agricultural policies, particularly the CAP for the period of 2023–2027. This policy emphasizes sustainability and cross-compliance with a strong focus on minimizing the use of chemical fertilizers, pesticides, water, and other inputs [1,2,3]. However, limited empirical research studies have applied MCDA under these updated policy conditions using real-world data, particularly in the Greek context. This study aims to fill that gap.
Accordingly, a mathematical model was developed within Measure 16: Cooperation of the Greek Rural Development Program (RDP), which falls under the second pillar of the CAP [26]. The model was based on a methodology that enabled the utilization of an MCDA approach and incorporates key objectives such as maximizing profit, minimizing input variability, and promoting the rational use of resources through land use changes. Special emphasis was placed on sustainable water use and reducing fertilizer application within the framework of environmental protection, aiming to enhance the competitiveness of farms. The model was adapted to the specific characteristics and priorities of each farmer group and implemented in collaboration with producer groups from Central and Western Macedonia. It proved particularly useful both for compliance with complex regulatory frameworks and for optimizing the economic performance of the participating farms [17].
The significance of this research lies in the application of the model, which, while adhering to cross-compliance regulations, maximizes the benefits for producers by identifying the most suitable practices based on their potential. Moreover, the reduction in input costs and the simultaneous adjustment of various production plans will increase both income and gross margin, irrespective of farm size. Subsequently, a multi-criteria decision support model was developed, adhering to the terms outlined in the CAP for the period of 2023–2027 and complying with multiple compliance regulations.
This study aims to bridge the research gap by applying MCDA models to optimize agricultural practices under the stringent guidelines of the new CAP. The research also seeks to provide actionable insights that align with CAP objectives. These objectives include enhancing competitiveness, improving sustainability, and strengthening resilience in agricultural practices, while ensuring environmental protection. By exploring the application of MCDA within the specific context of the CAP for 2023–2027, this research not only contributes to the academic discourse but also serves as a crucial decision-making resource for policymakers and farm managers in Central and Western Macedonia. The anticipated outcomes will facilitate the adoption of profitable and efficient crop varieties, promoting sustainable agricultural practices that are compliant with new regulatory standards. The findings aim to inform national and regional authorities responsible for implementing the CAP Strategic Plan, as well as farmer cooperatives and advisory services seeking to optimize their members’ sustainability and profitability. The remainder of this paper is structured as follows. Section 2 details the materials and methods, including the study area and the MCDA model. Section 3 presents the optimization results for each farmer group. Section 4 discusses and interprets these findings, and finally, Section 5 summarizes the key conclusions of the study.

2. Materials and Methods

2.1. Study Area and Farmer Groups

The research was conducted in Northern Greece, involving three distinct farmer groups, each treated as a separate case study to account for potentially different environmental and agroecological conditions. The first group, the Loudias farmer group, is located in the Regional Unit of Thessaloniki (Central Macedonia), consisting of 10 members who cultivate cotton, rice, and various cereals. The other two groups are in Western Macedonia: the Agia Paraskevi farmer group in the southern part of the Kozani regional unit, composed of 5 members cultivating various cereals, and the Ryakio farmer group in northern Kozani, with 5 members focusing on cereals and maize (Figure 1). While each group faces unique local factors, the two groups in the Kozani regional unit operate under broadly similar agro-climatic and governance conditions, which is why they are treated using the same approach.

2.2. Methodology—Weighted Goal Programming

Mathematical programming offers a specialized framework for optimizing the allocation of limited resources in planning or design processes [27]. The need to address complex agricultural issues led to the development of multi-criteria planning and design. By employing multi-criteria planning and design, a diverse array of factors is considered to tackle a problem effectively [27]. The MCDA model is selected as the primary tool in this analysis to achieve input minimization and profit maximization of the selected agricultural holdings within the framework of the new CAP (2023–2027).
The MCDA model incorporates the multifaceted nature of agriculture by considering economic, social, and environmental factors. Previous studies show that multi-criteria mathematical programming has been used to identify advantageous land use changes and to formulate farm plans optimized for efficiency [28,29]. Multi-criteria techniques to simulate agricultural systems, especially endorsing weighted goal programming for decision-making analysis, have been implemented in farm planning, decoupling strategies, and water agricultural policy [30,31].
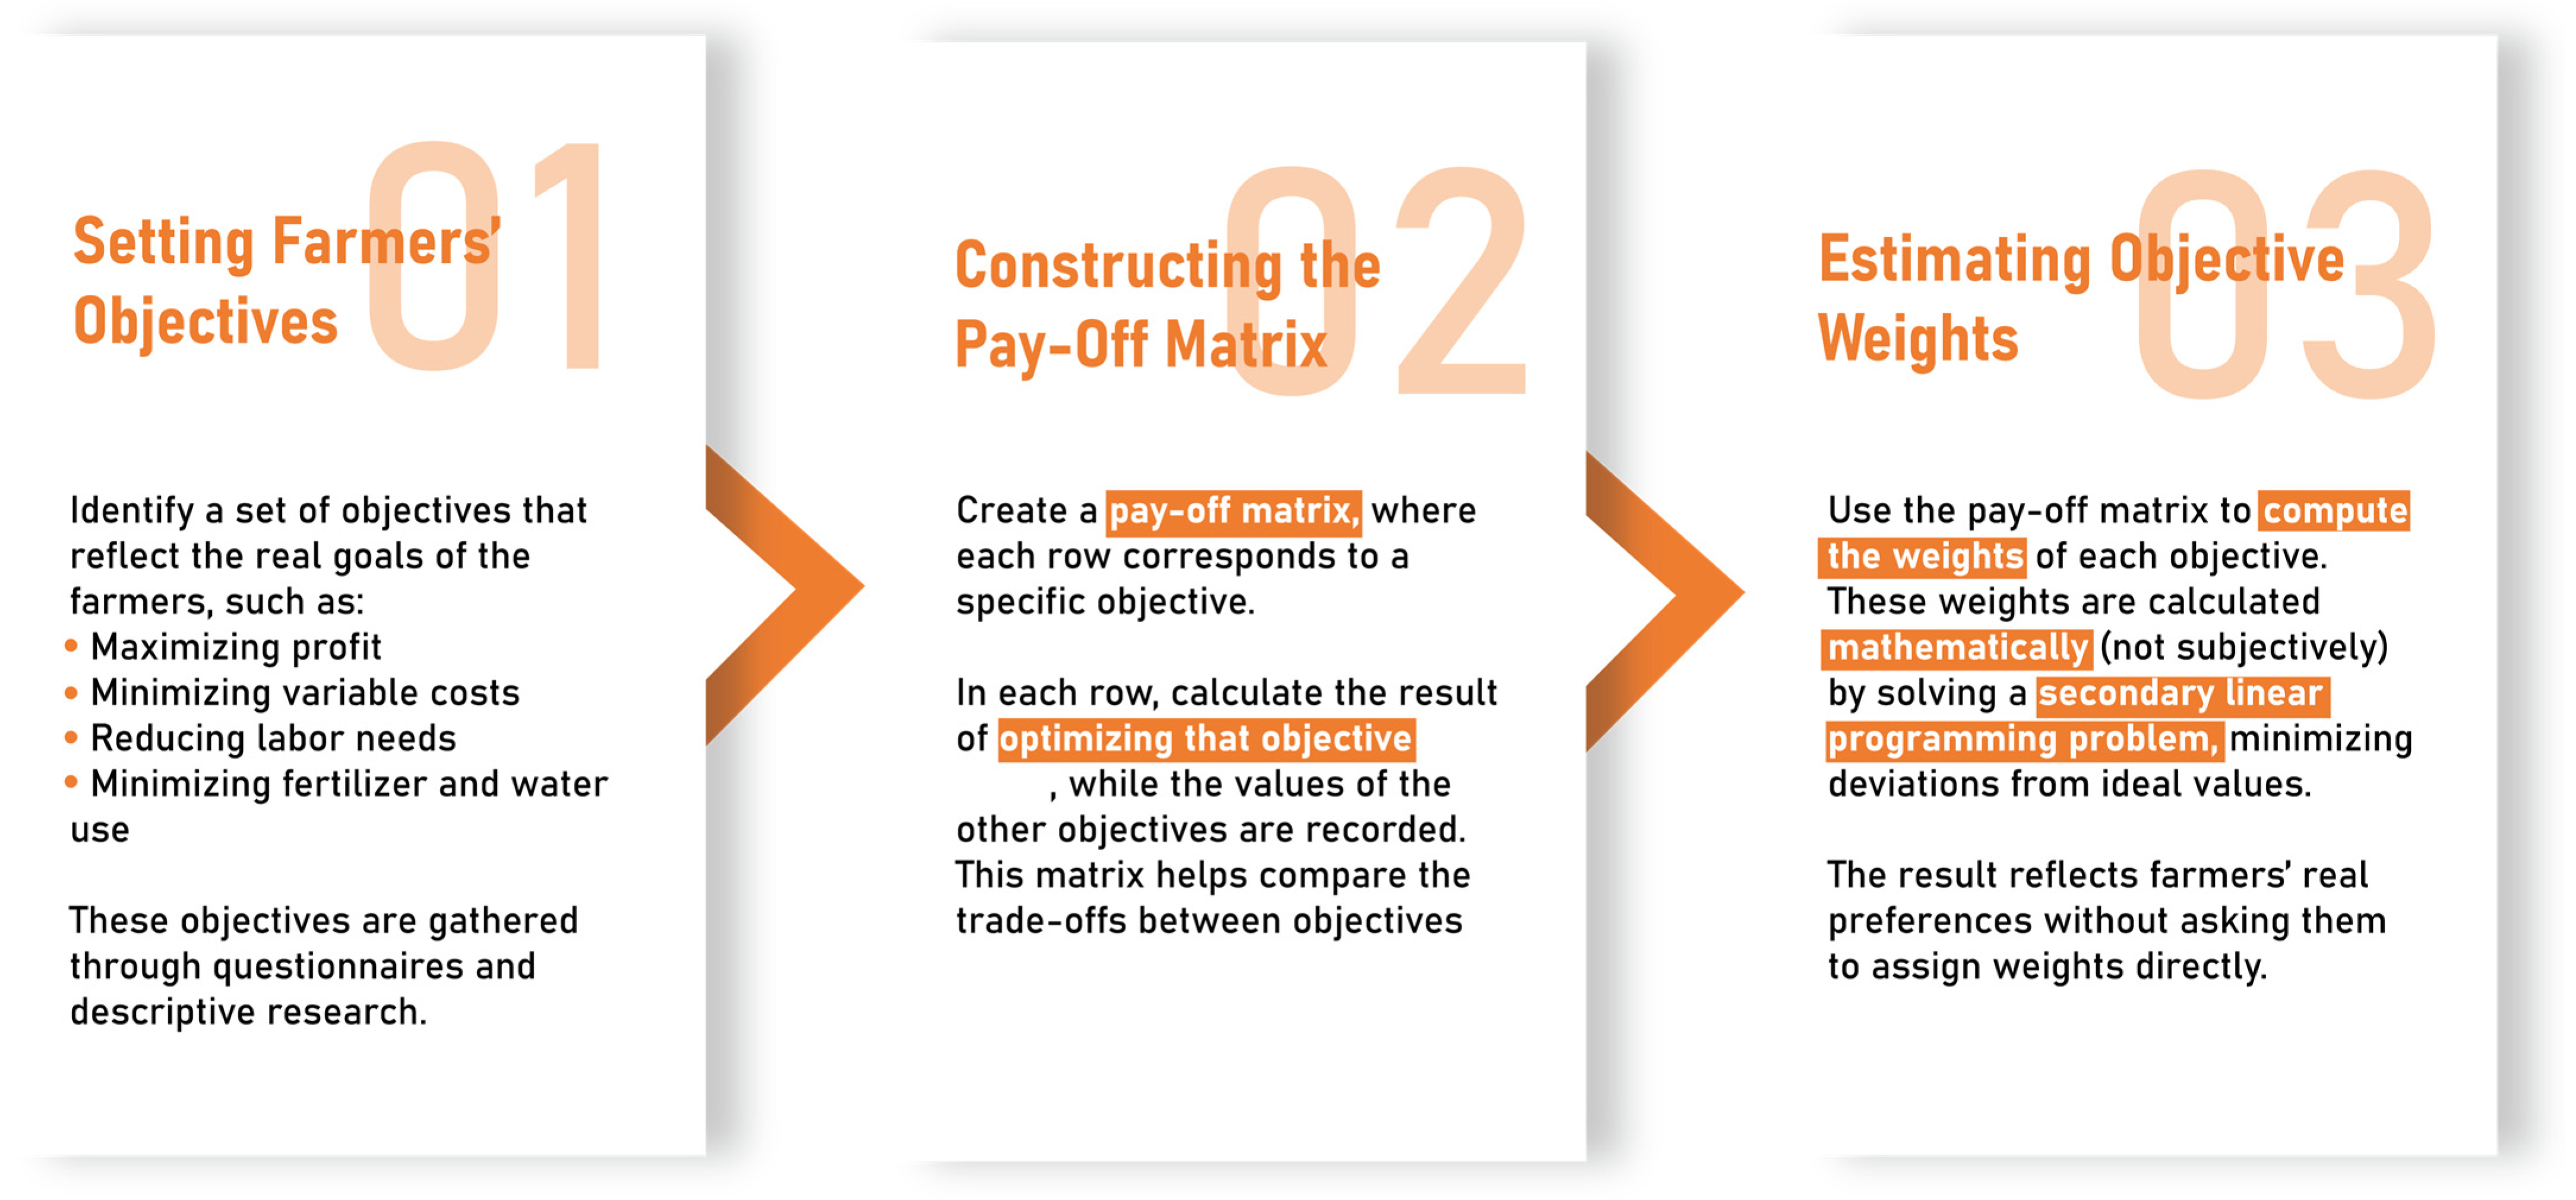
In the context of this study, the methodology of weighted goal programming was implemented through the following procedures [32,33] (Figure 2):
  • Specification of a set of objectives deemed critical for farmers;
  • Establishment of the payoff matrix corresponding to the identified objectives;
  • Utilization of the matrix to compute a series of weights that mirror farmers’ preferences.
The assignment of weights to the individual objectives in the model was not based on subjective judgment but followed a structured methodology. Specifically, a payoff matrix was employed alongside the solution of a secondary linear programming problem to estimate relative preferences. This approach aligns with the principles of weighted goal programming, allowing for the computation of weights by minimizing deviations from the ideal values of the objectives. As a result, the derived weights reflect the underlying preferences of farmers without requiring direct subjective input from either the farmers or the researchers.
Initially, the set of objectives f1(X), fi(X) … fn(X) is established, representing the farmers’ goals (e.g., maximizing profit, minimizing labor, etc.). The matrix elements are computed by optimizing one objective in each row. Fij is defined as the value of attribute i when objective j is optimized. Upon the completion of the payoff matrix, the subsequent system of q (number of objectives) is resolved using Equation (1) [17].
j = 1 q w j f i j = f i , i = 1,2 , , q
and
j = 1 q w j = 1
where:
wj is described as the weights adjusted to each target that reproduces the actual behavior of the farmer;
fij is described as the data in the payoff matrix;
fi is described as the value obtained for target i according to the existing production plan.
If the system does not produce a feasible set of weights (wj), variance/deviation variables must be introduced to achieve the nearest set of weights [34]. This engenders a weighted target scheduling problem incorporating percentage-deviation variables [35]. This solution is shown in the following linear programming (Equation (3)):
m i n i = 1 q n i + p i f i
s . t . j = 1 q w j f i j + n i p i = f i , i = 1,2 , . , q
and
j = 1 q w j = 1
where:
pi represents the positive deviation from target i;
ni represents the negative deviation from target i.
Taking all the above into account and applying weighted multi-objective scheduling, the subsequent sections of this paper aim to formulate the utility function with the overarching objective of enhancing the organization of agricultural production.

2.3. Model Specification

The MCDA applied in this paper includes the following components.

2.3.1. Variables

Each farmer group is associated with a set of variables Xi that represents its cultivated crops. These variables, referred to as “decision variables,” delineate the attributes of each farming system. Nonetheless, certain characteristics are not under the control of the farmers but are established by policymakers, constituting objective functions. The MCDA model utilizes baseline data from the 2022–2023 cultivation period to develop optimized crop plans. These optimized plans are designed to align with the new CAP 2023–2027 framework and are intended for implementation on pilot farms during the 2023–2024 cultivation period.

2.3.2. Objectives

According to the purpose of research and literature, the objectives are divided into the following categories:
1.
Minimization of variable cost (VC) refers to a decrease in the overall expenditure allocated to inputs. Variable costs in this study include expenses for seeds, fertilizers, pesticides, fuel, and machinery repairs (reduction up to 15%).
In the model, it is shown as minVC = ΣVCi × Xi;
2.
Minimization of labor (LAB) costs refers to a reduction in the total number of working hours. **Labor is measured in total hours of fieldwork required per crop, based on standard regional data (reduction up to 20%).
In the model, it is shown as minLAB = ΣLABi × Xi;
3.
Minimization of fertilizer (FER) use. Fertilizer use is measured in total kilograms of active nutrients applied (reduction up to 20%).
In the model, it is shown as minFER = ΣFERi × Xi;
4.
Maximization of gross margin (GM). Gross margin in this study is defined as total revenue (yield per hectare multiplied by price) minus total variable costs (from 15% to 20%).
In the model, it is shown as maxGM = ΣGMi × Xi;
5.
Minimization of water use (WAT): decrease in the total cubic meters per crop cultivation.
In the model, it is shown as minWAT = ΣWATi × Xi.
Gross margin is calculated by subtracting variable costs from total gross revenue. The objective is to maximize this margin. Direct and coupled CAP payments have been fully integrated into the calculation of the gross margin for each crop. This ensures that the impact of policy support is accurately reflected in the economic outcome of each alternative plan. Variable costs include expenses such as fertilizers, pesticides, fuel, irrigation fees, hired machinery services, and other consumable inputs. The aim is to minimize these costs. Labor minimization refers to reducing the total hours spent on agricultural activities, including both family labor and hired workers. Water use minimization refers to decreasing the total volume of irrigation water applied per crop [17]. Finally, fertilizers are measured in kilograms, as this is the unit of measurement used in the methodology to quantify their use accurately and consistently, with the objective of minimizing their application. Achieving these primary objectives also enables broader strategic goals, such as facilitating the diversification of existing crops or the introduction of new ones and allows for the iterative use of the model to enhance producer profits with alternative cropping strategies.
Achieving these objectives also facilitates additional goals, such as introducing new crops and permitting iterative utilization of the model across different input levels to enhance producer profits with alternative crops.
In the first case study involving the Loudias farmer group, the multi-criteria decision analysis model incorporated a comprehensive range of objectives, apart from water use minimization. Specifically, the objectives operationalized were the minimization of variable costs, labor costs, and fertilizer use, alongside the maximization of gross margin. These objectives, represented mathematically in the model as minVC, minLAB, minFER, and maxGM, respectively, aimed to enhance the efficiency and profitability of the farming operations without focusing on the reduction in water consumption.
Conversely, the second case study adopted a holistic approach to farm management, integrating water conservation in the farmer group of Ryakio. The third case study adopted a holistic approach to farm management and a requirement to keep arable land fallow in the farmer group of Agia Paraskevi, reflecting CAP’s new mandates [36]. This approach, signified within the model as minWAT, was in addition to the other objectives.

2.3.3. Constraints

To operate the model, it is crucial to delineate precise constraints as outlined below [17].
1.
Total cultivated land: Up to 100 hectares per farmer group.
In the model, it is shown as Σxi = 100;
2.
Labor: The total labor hours for each crop must not surpass the total available hours.
In the model, it is shown as Σ(xi × LABxi) ≤ TotalLAB;
3.
Fertilizers: The total quantity of fertilizer allocated to each crop within the area will not surpass the overall available fertilizer.
In the model, it is shown as Σ(xi × FERxi) ≤ TotalFER;
4.
Common agricultural policy: The CAP incentivizes many farmers to adhere to its regulations to secure subsidies and bolster their earnings. Consequently, it is crucial for the model to incorporate CAP-related constraints, such as the prudent utilization of water (Report on the CAP Strategic Plan) [26]. In this regard, it has been projected beforehand that this entails potential water conservation of no less than 20%.
In the model, it is shown as ΣWATi ≤ 0.2 × WATi;
5.
Market restrictions and other restrictions: Impose a maximum limit on cultivation expansion considering the market limitations. The term “market restriction,” as used in the model, refers to practical market limitations [17] rather than institutional or regulatory CAP rules. Specifically, some crops—although not bound by formal constraints—are subject to external limits related to demand, marketing capacity, or the availability of appropriate infrastructure. These factors impose a realistic upper boundary on the area that can be devoted to such crops in the short term. They are incorporated into the model as a safeguard to prevent overly optimistic or impractical crop planning recommendations;
6.
While crop rotation is a key GAEC 7 requirement, a specific rotational constraint was not included in this single-period optimization model. The model’s output is designed to be assessed for its rotational feasibility by farm advisors as a subsequent step.

2.3.4. Modeling of CAP Interventions

To accurately reflect the economic context, the GM objective in our MCDA model was calculated to include key financial support instruments from the Greek CAP Strategic Plan. Specifically, the Basic Income Support for Sustainability (BISS), the complementary redistributive payment, and relevant coupled support schemes (e.g., the coupled payment for cotton) were incorporated into the revenue calculations for each crop. The analysis assumes uniform application of these CAP instruments across the study regions, as the core direct payment and eco-scheme rates do not have significant subnational variations. Furthermore, the model also included potential revenue from relevant voluntary eco-schemes offered under the Greek Strategic Plan, such as the scheme for using resilient crop species like tritordeum that are adapted to dry heat and the scheme supporting the adoption of precision agriculture practices, allowing for a comprehensive assessment of their impact on the optimal crop mix.

3. Results

This section presents the analysis of the MCDA models to unveil the prevailing crop plans and pertinent technical and economic details. A multi-criteria decision analysis was then applied, leading to the derivation of the model’s crop plans to be embraced by each farmer group. This section delineates the current and optimal crop plans for each of the three farmer groups.

3.1. The Loudias Farmer Group

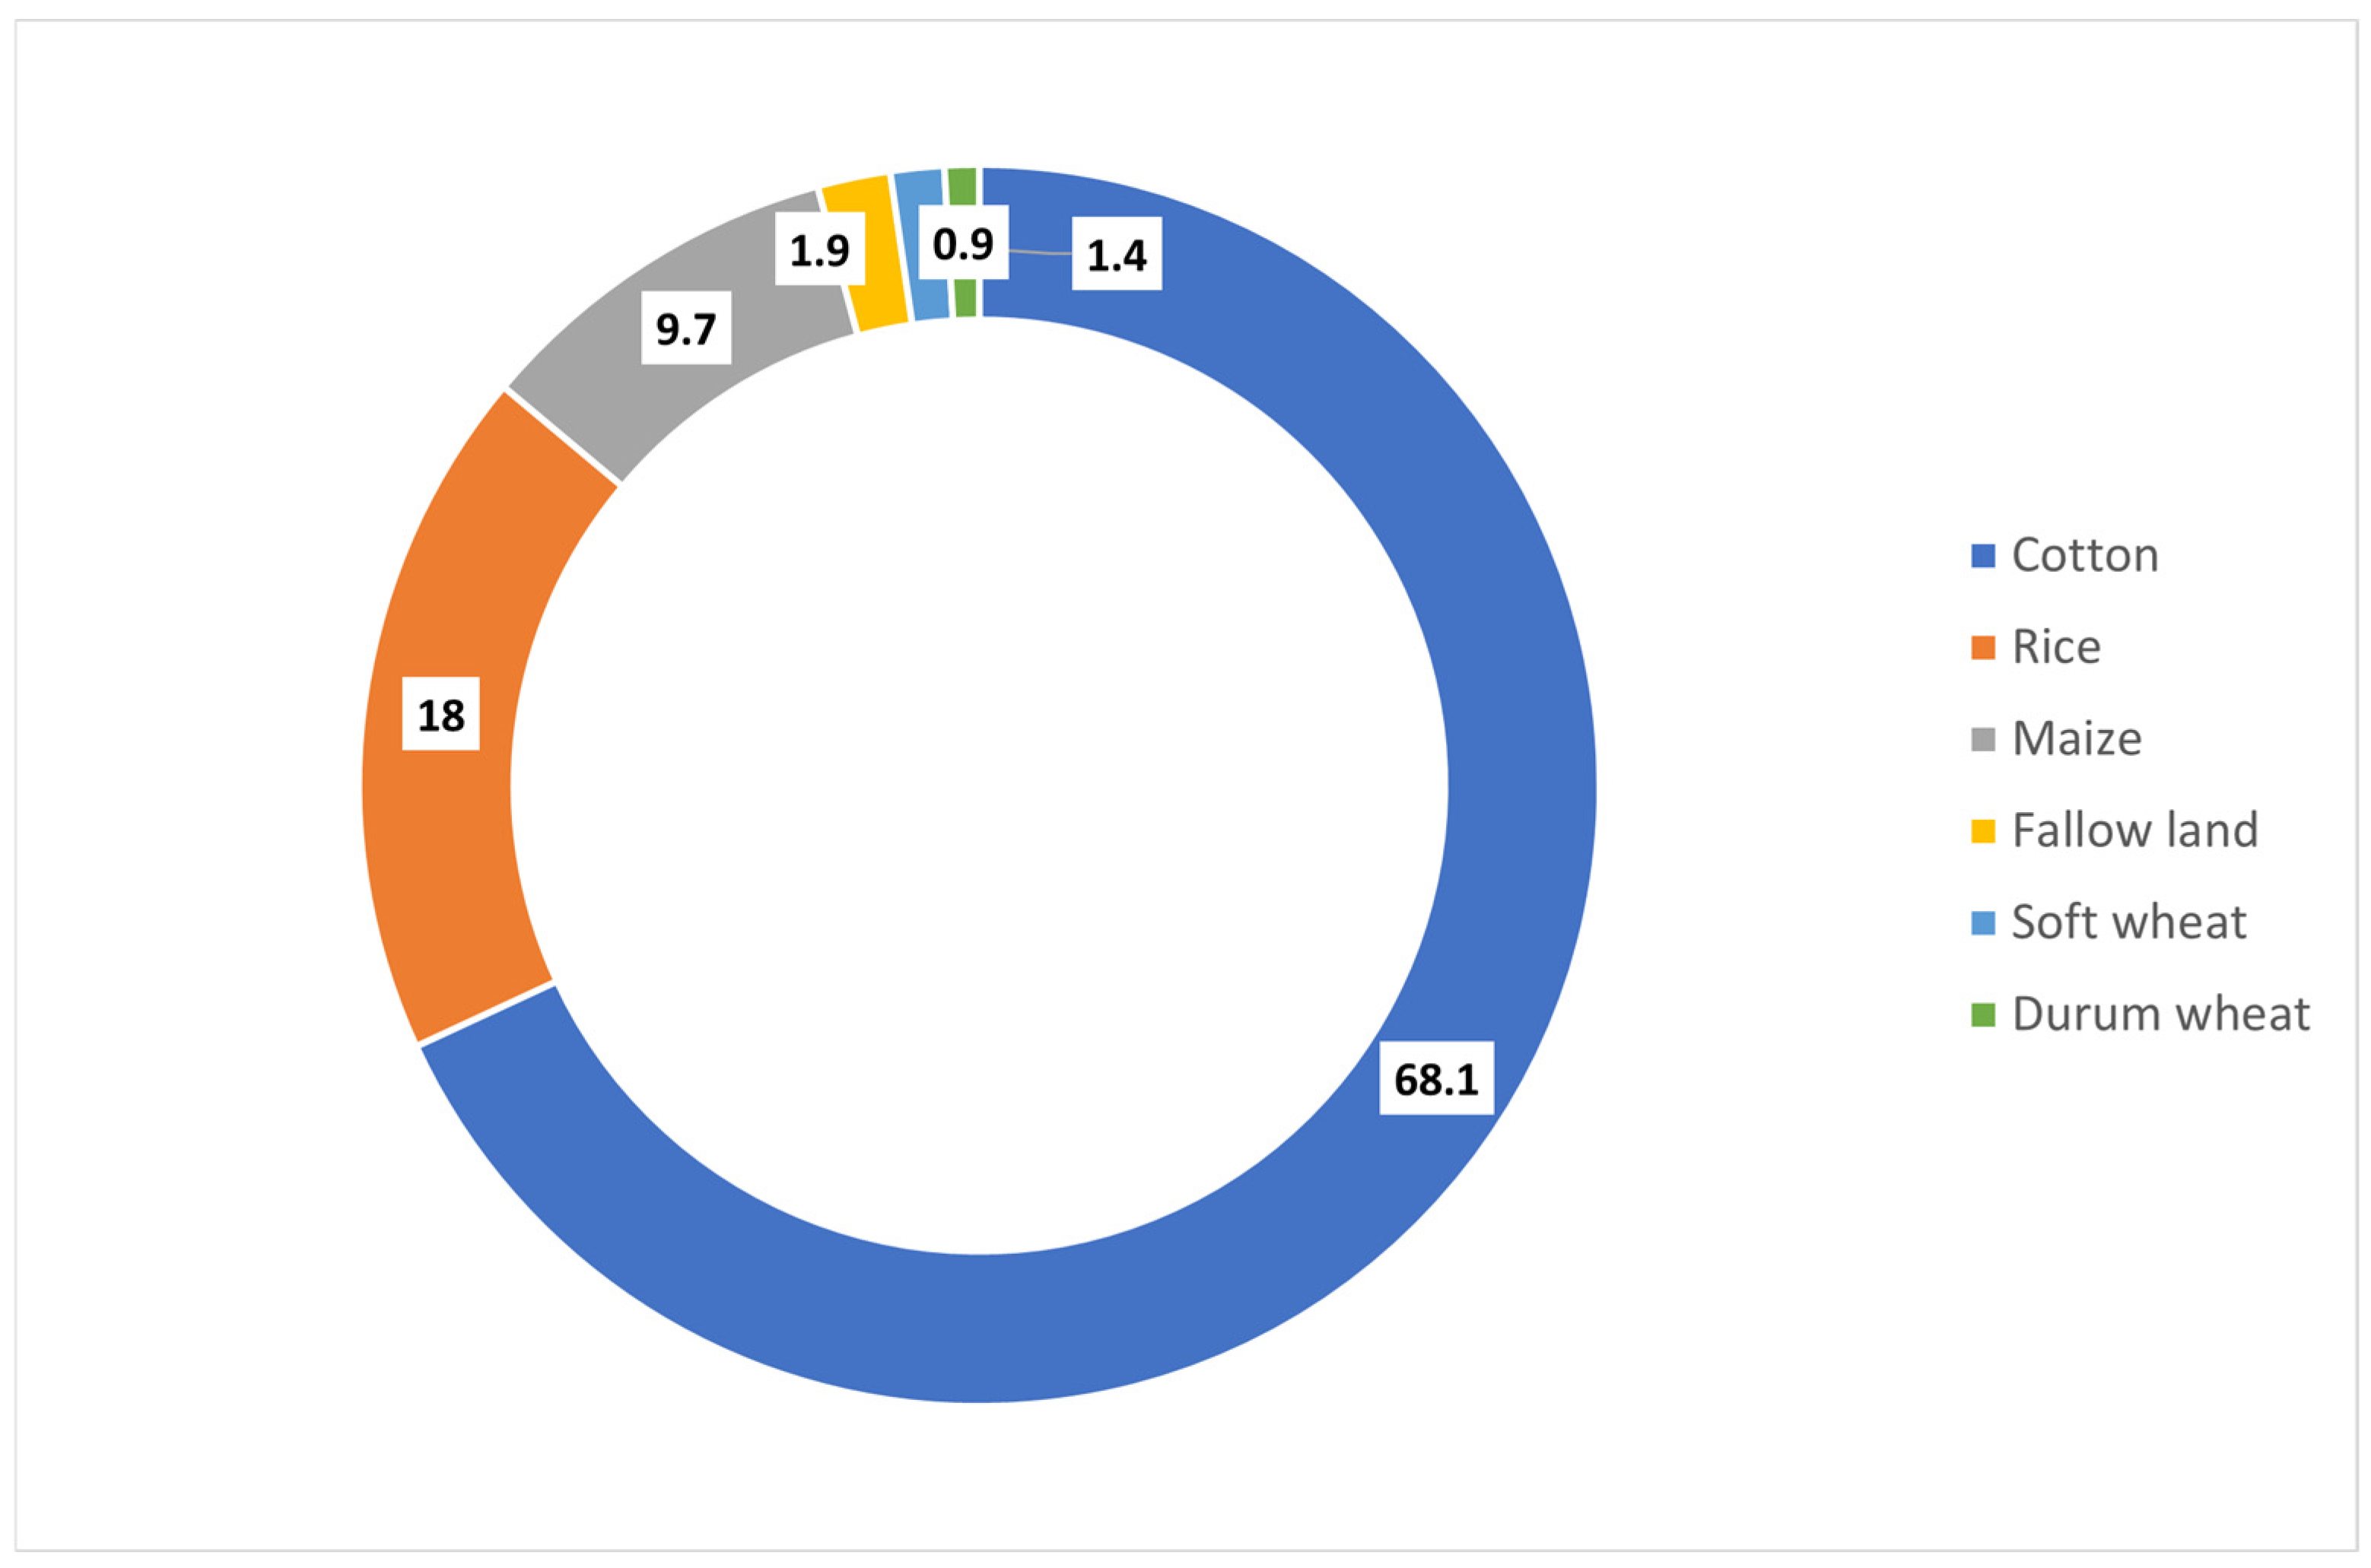
The Loudias farmer group from the first case study comprises 10 producers located in the Thessaloniki regional unit, collectively cultivating a total of 213.3 hectares. Among these, 68.1% of the total hectares are dedicated to cotton cultivation, 18% to rice, 9.7% to maize, 1.4% to soft wheat, 0.9% to durum wheat, and the remaining 1.9% are left fallow (Figure 3).
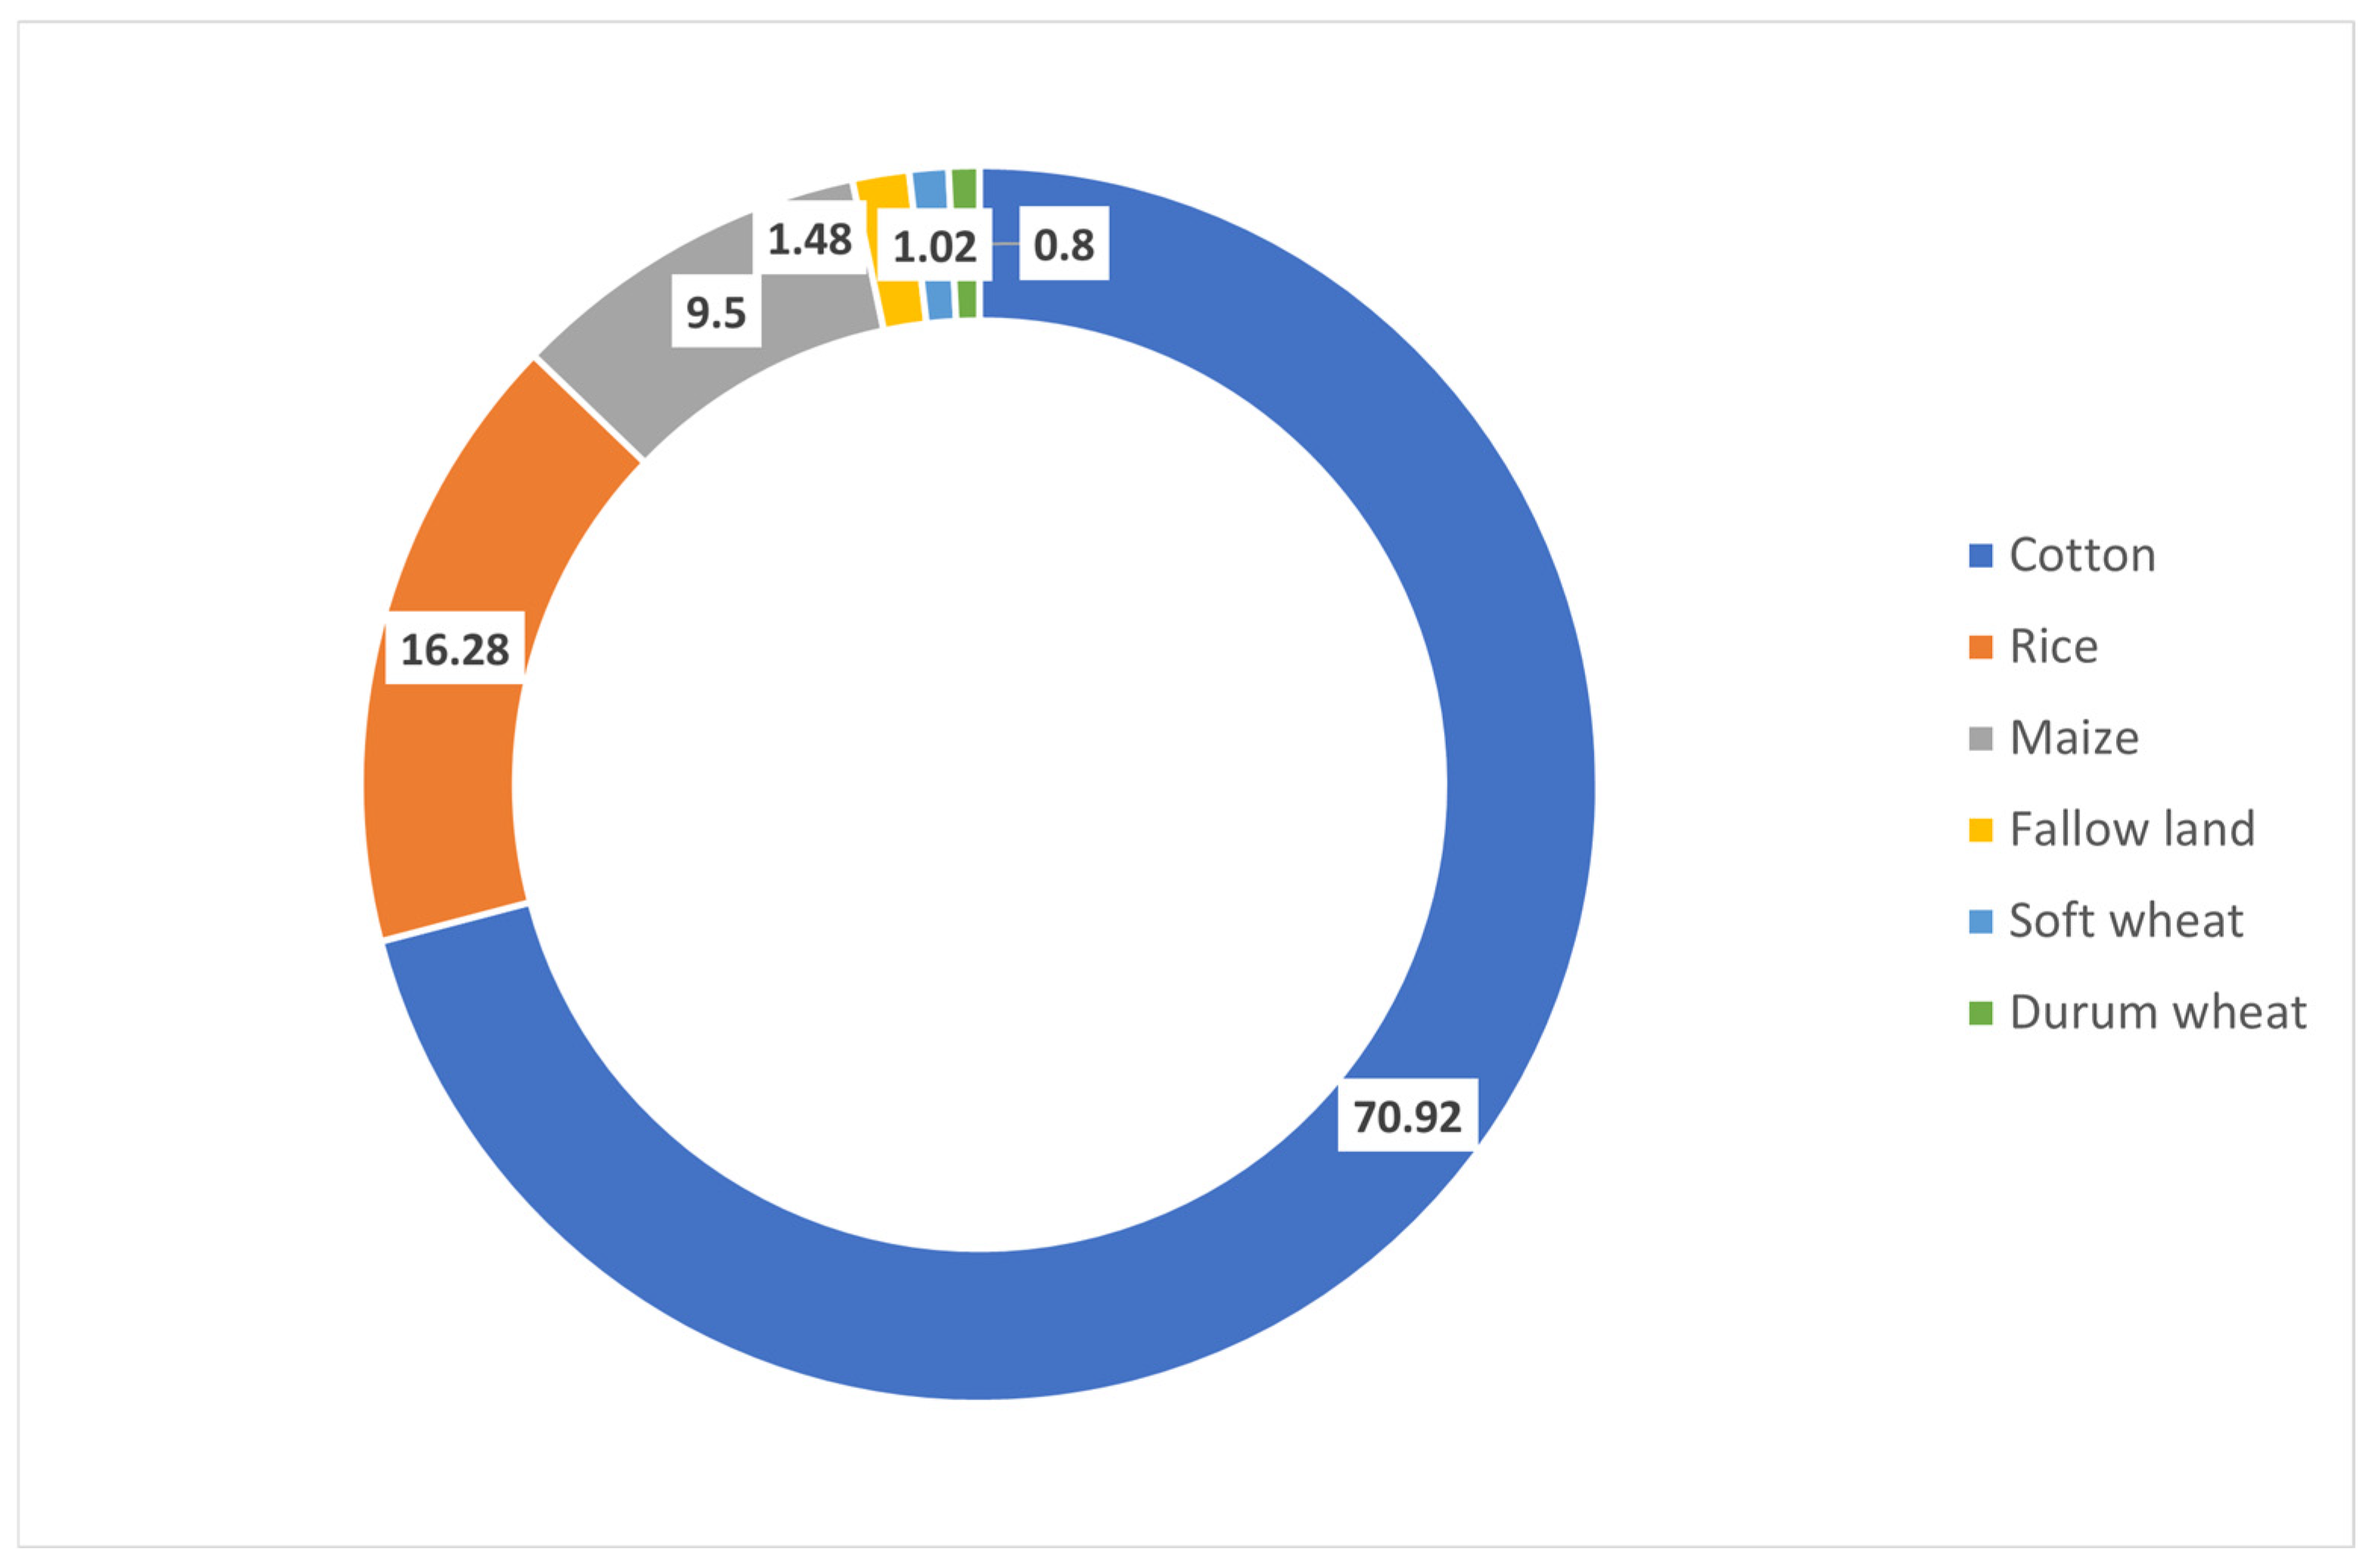
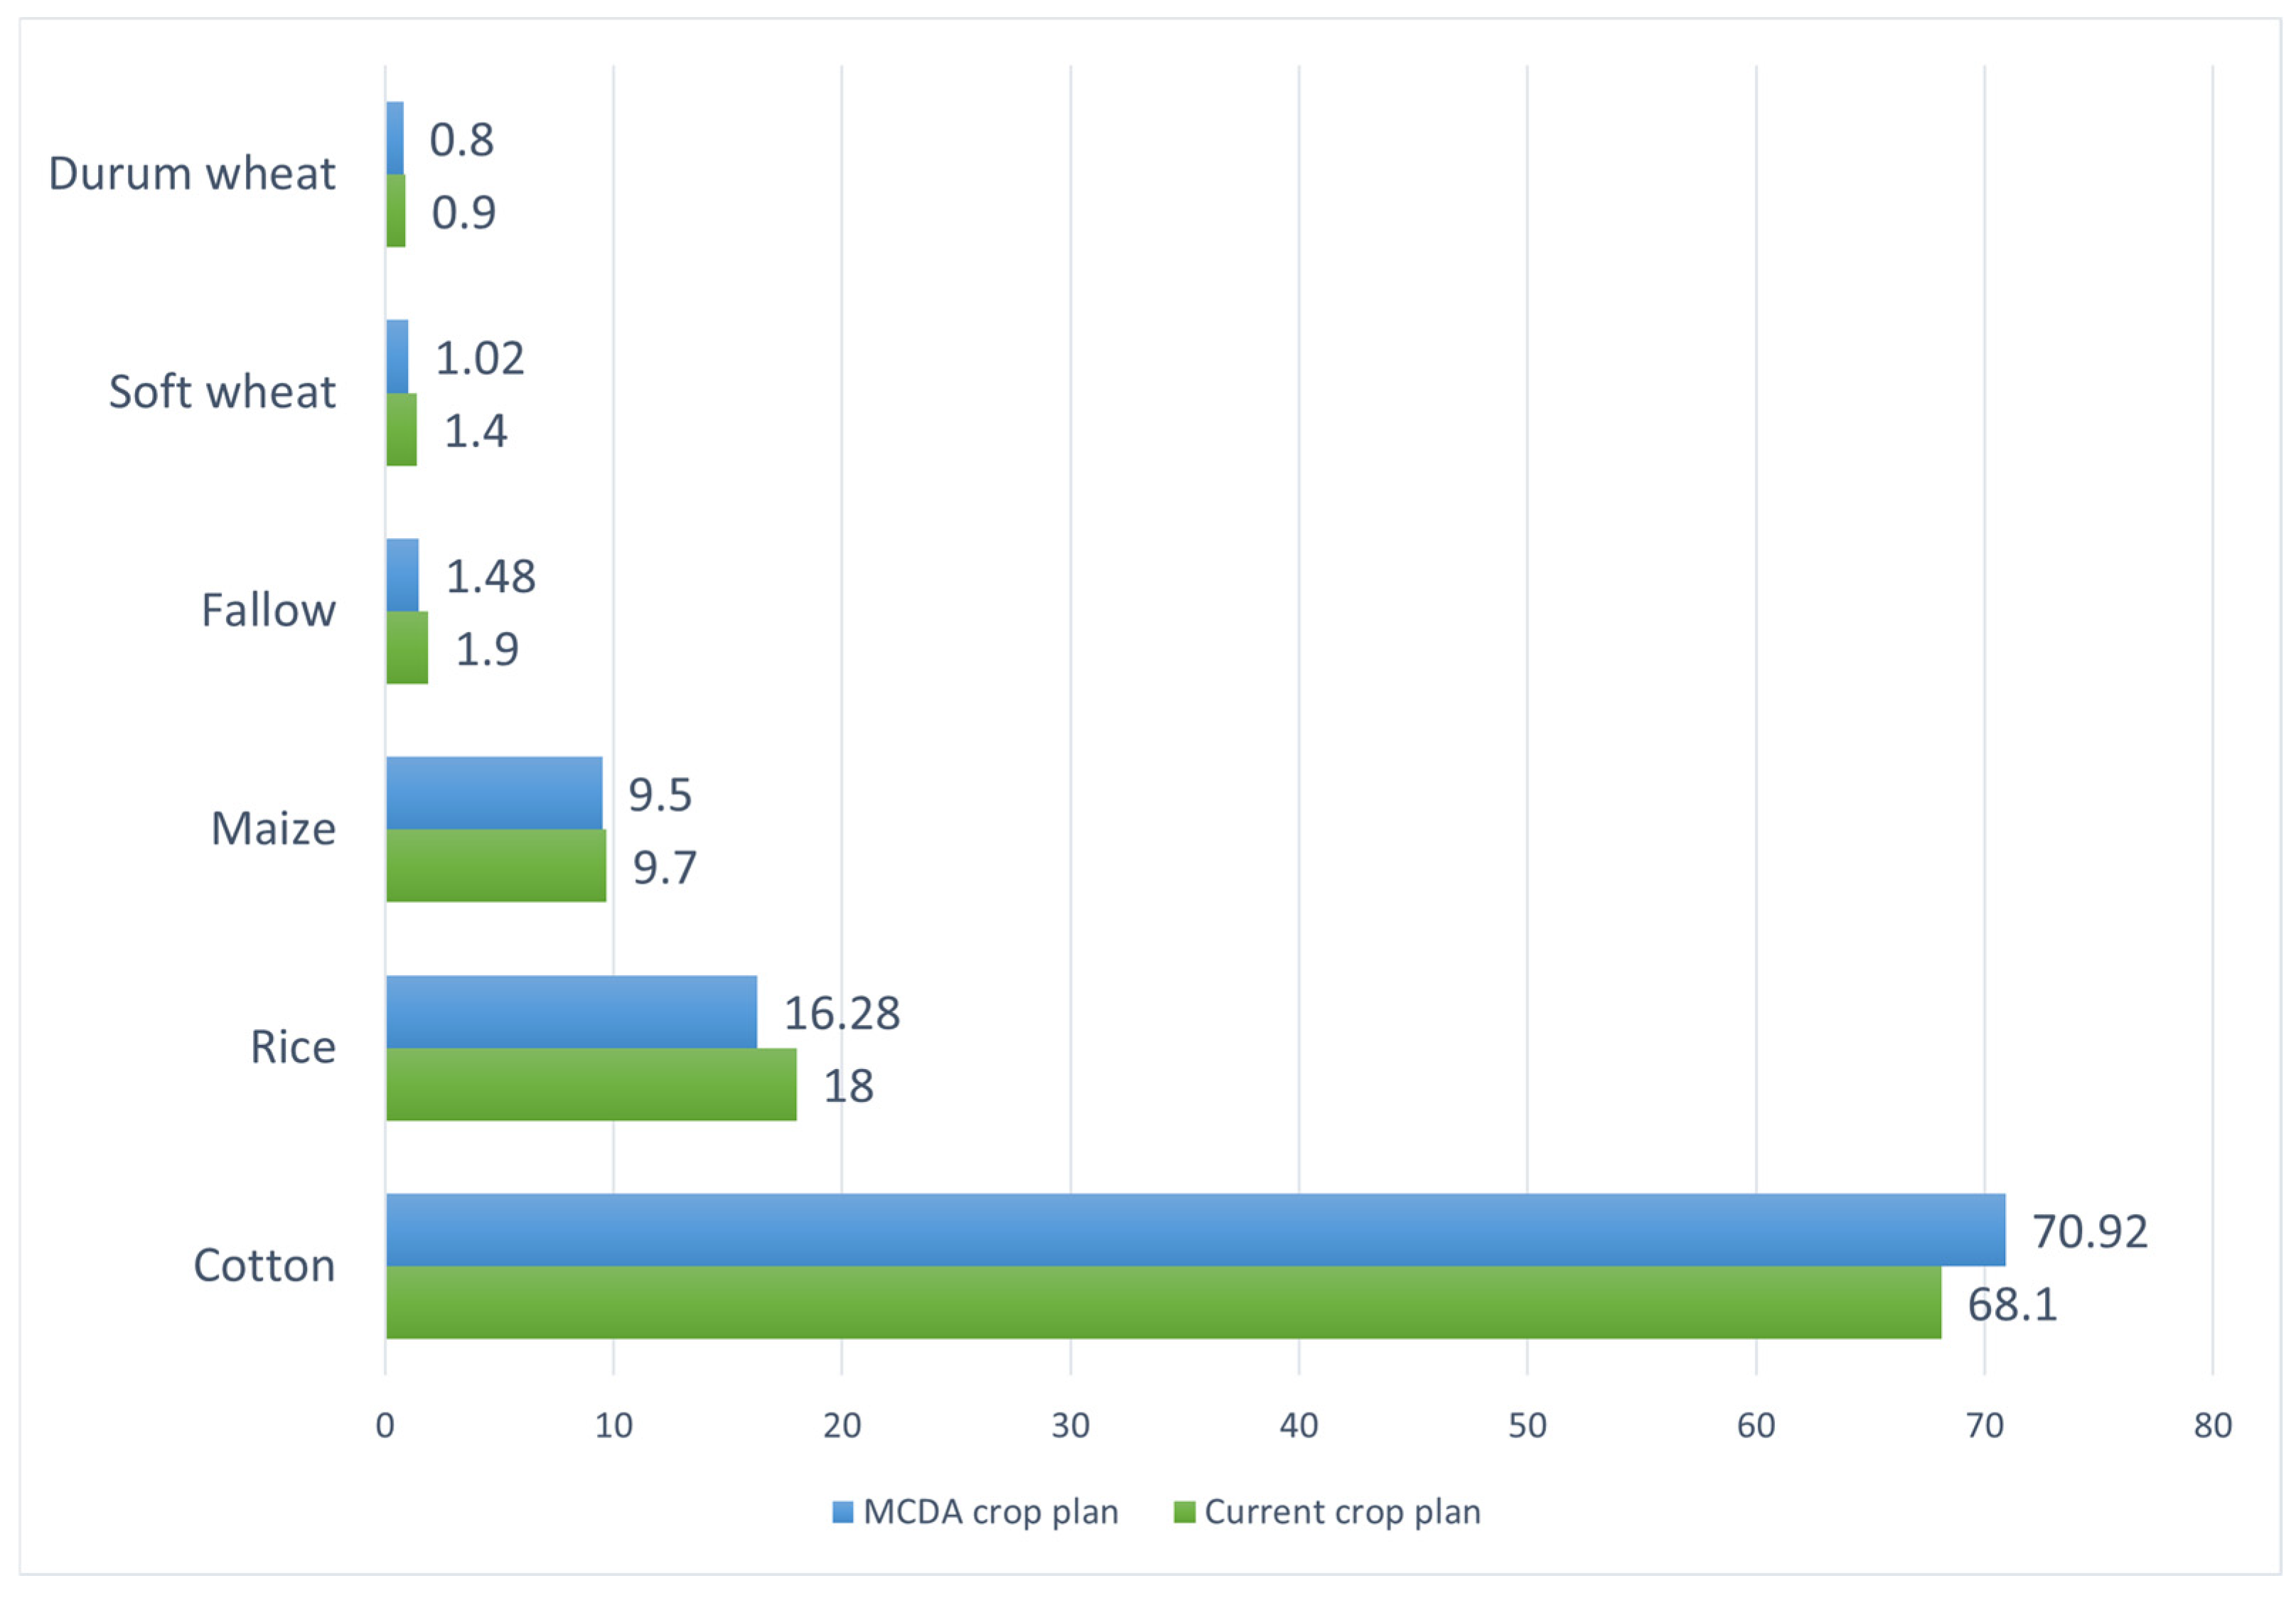
The implementation of the MCDA model suggests modifications to the agricultural land management strategy of the Loudias farmer group. These modifications entail revising the existing crop plan to enhance overall farm performance. Table 1 presents the proposed changes in land allocation. Notably, the types of crops remain unchanged, with only the proportions of cultivated land being adjusted. Under the optimal scenario, cotton cultivation increases by 4.14%, while reductions are recommended for rice (−9.56%), maize (−2.06%), soft wheat (−27.14%), durum wheat (−11.11%), and fallow land (−22.11%). These adjustments are intended to support the model’s objectives of maximizing gross margin and minimizing variable costs, labor requirements, and fertilizer input.
Following the implementation of the adjustments, the optimal crop configuration is illustrated in Figure 4.
Figure 5 presents a comparison of the current and proposed crop configurations.
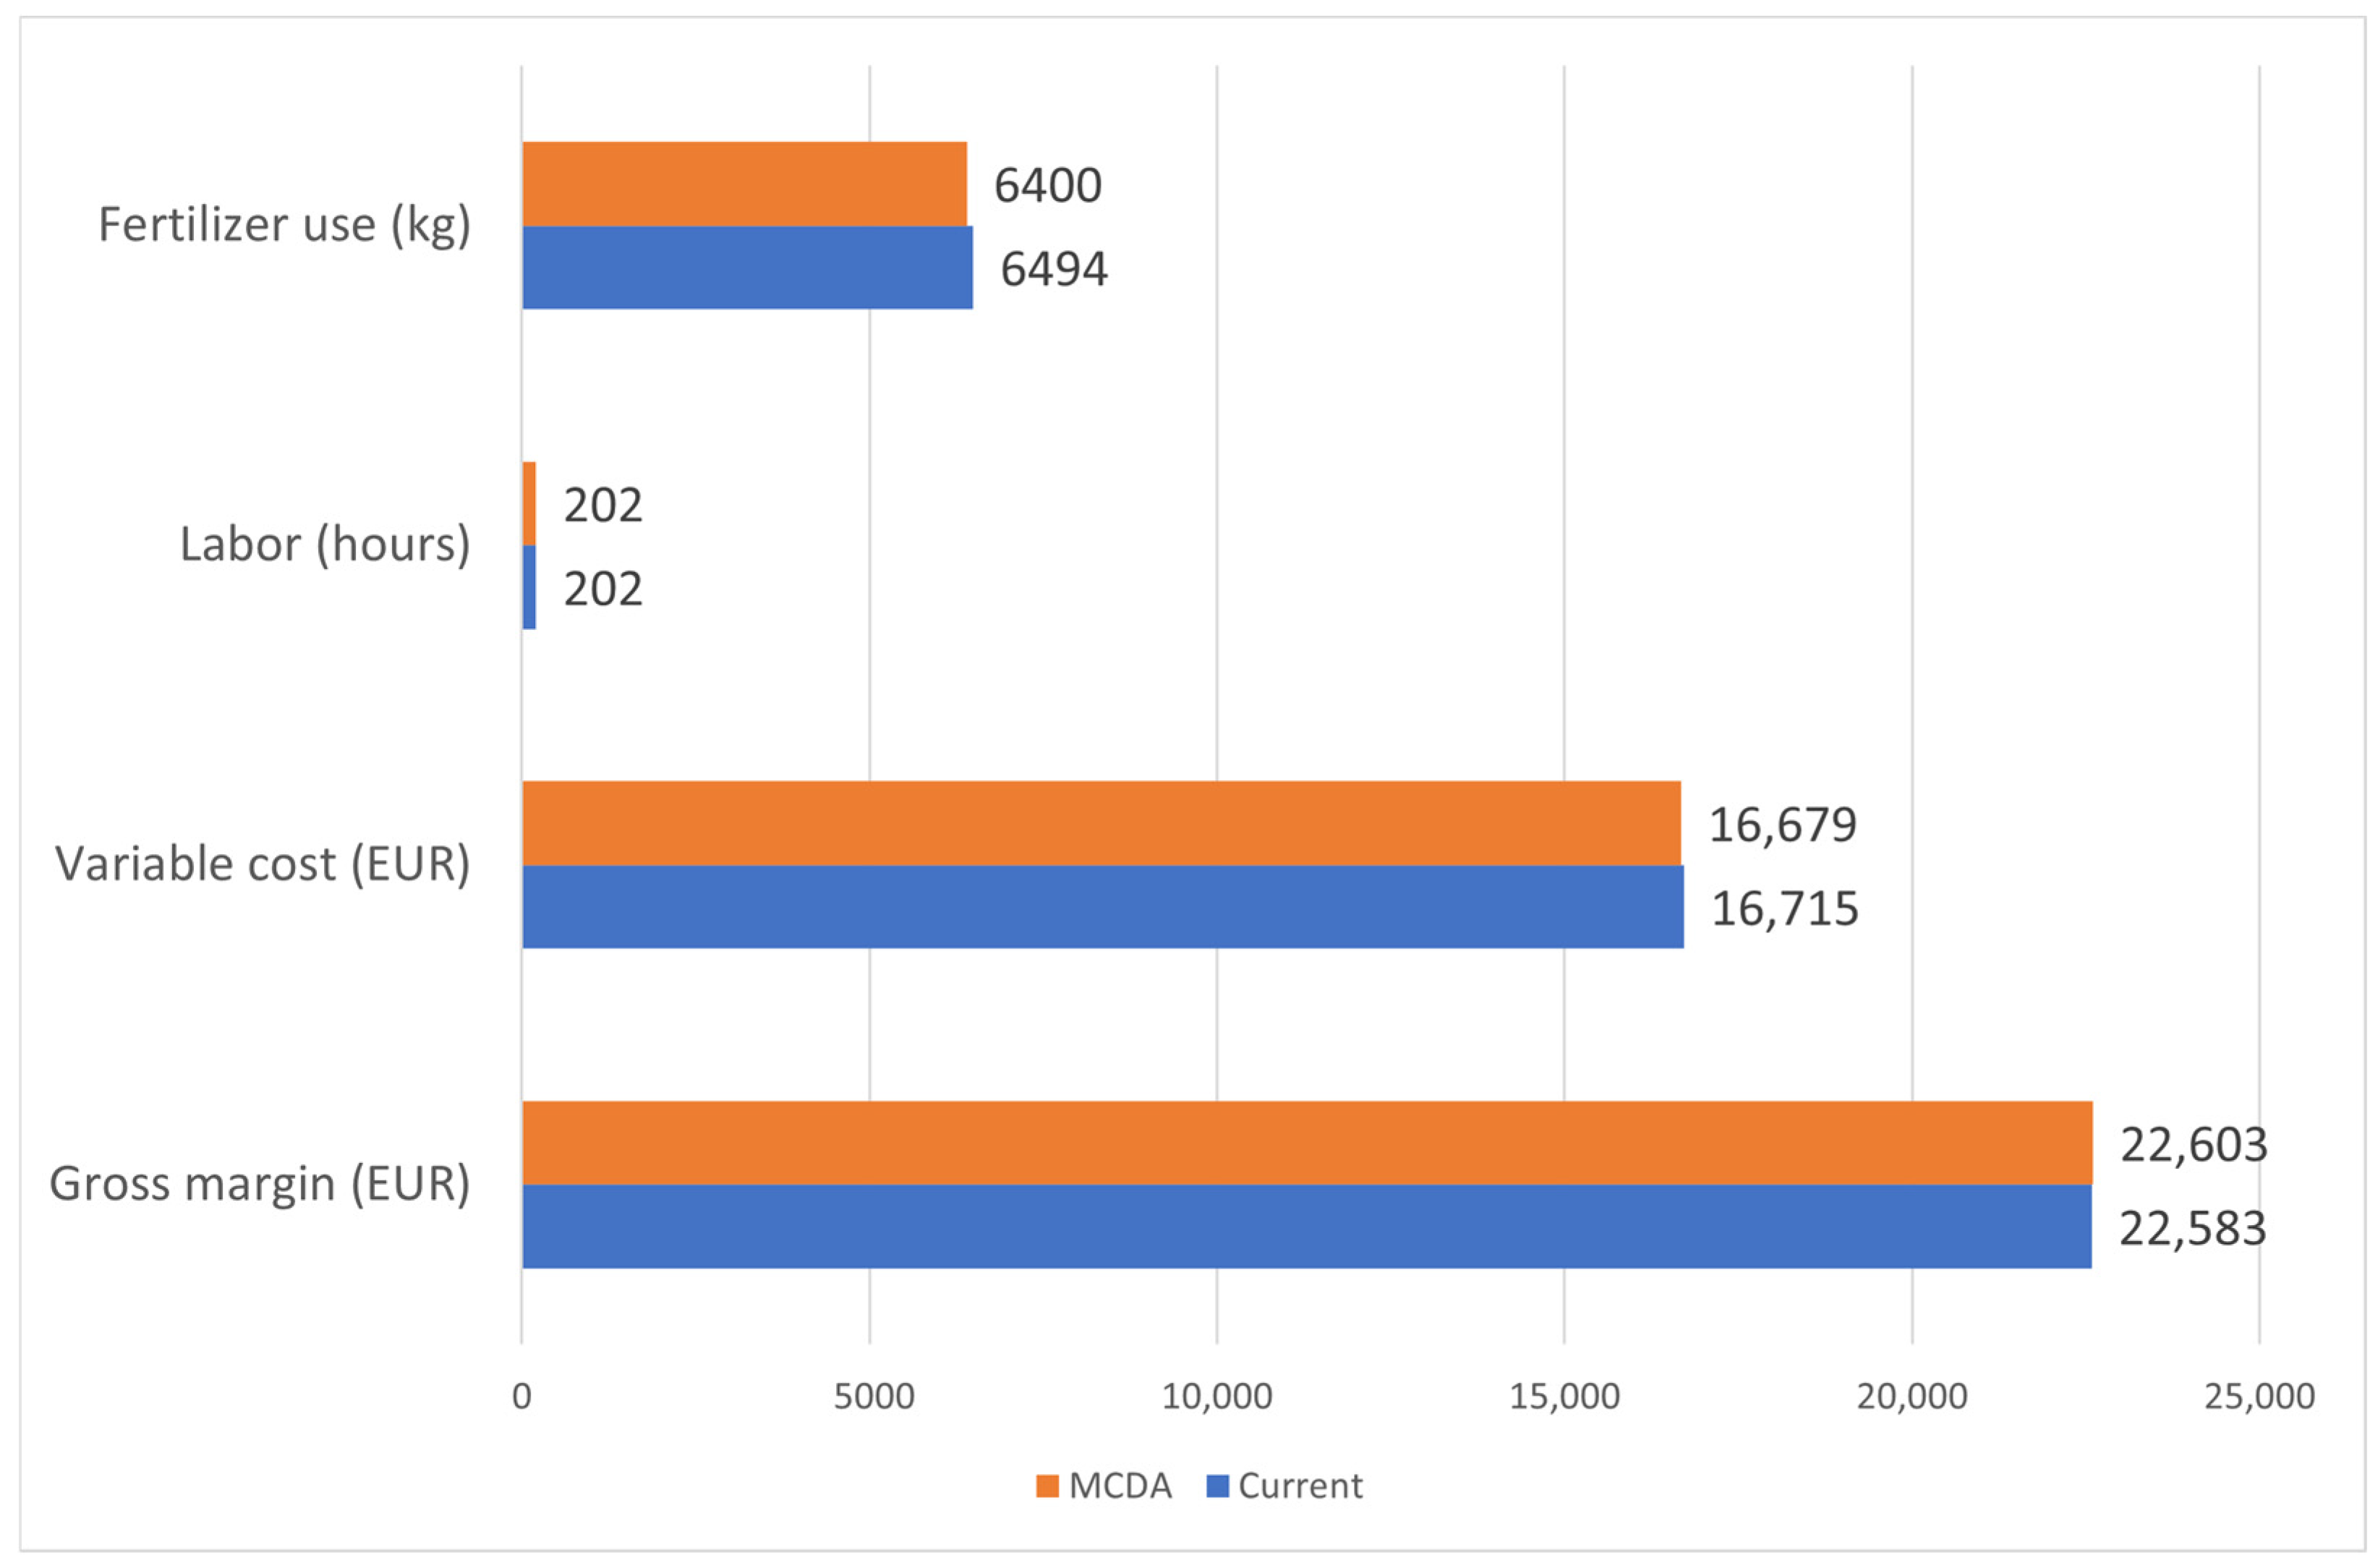
Table 2 summarizes the changes observed across four key performance indicators: gross margin, variable costs, labor, and fertilizer use. In the current crop plan, the gross margin is 22,583 EUR, while in the optimized plan generated by the MCDA model, it increases slightly to 22,603 EUR—an improvement of 0.09%. Variable costs decreased from 16,715 EUR to 16,679 EUR, reflecting a 0.21% reduction. The labor input remained unchanged following the optimization. Finally, fertilizer use declined from 6494 kg in the current plan to 6400 kg in the optimized scenario, indicating a 1.45% reduction.
Key differences between the current and optimized plans are shown in Figure 6.

3.2. The Agia Paraskevi Farmer Group—Current Crop Plan

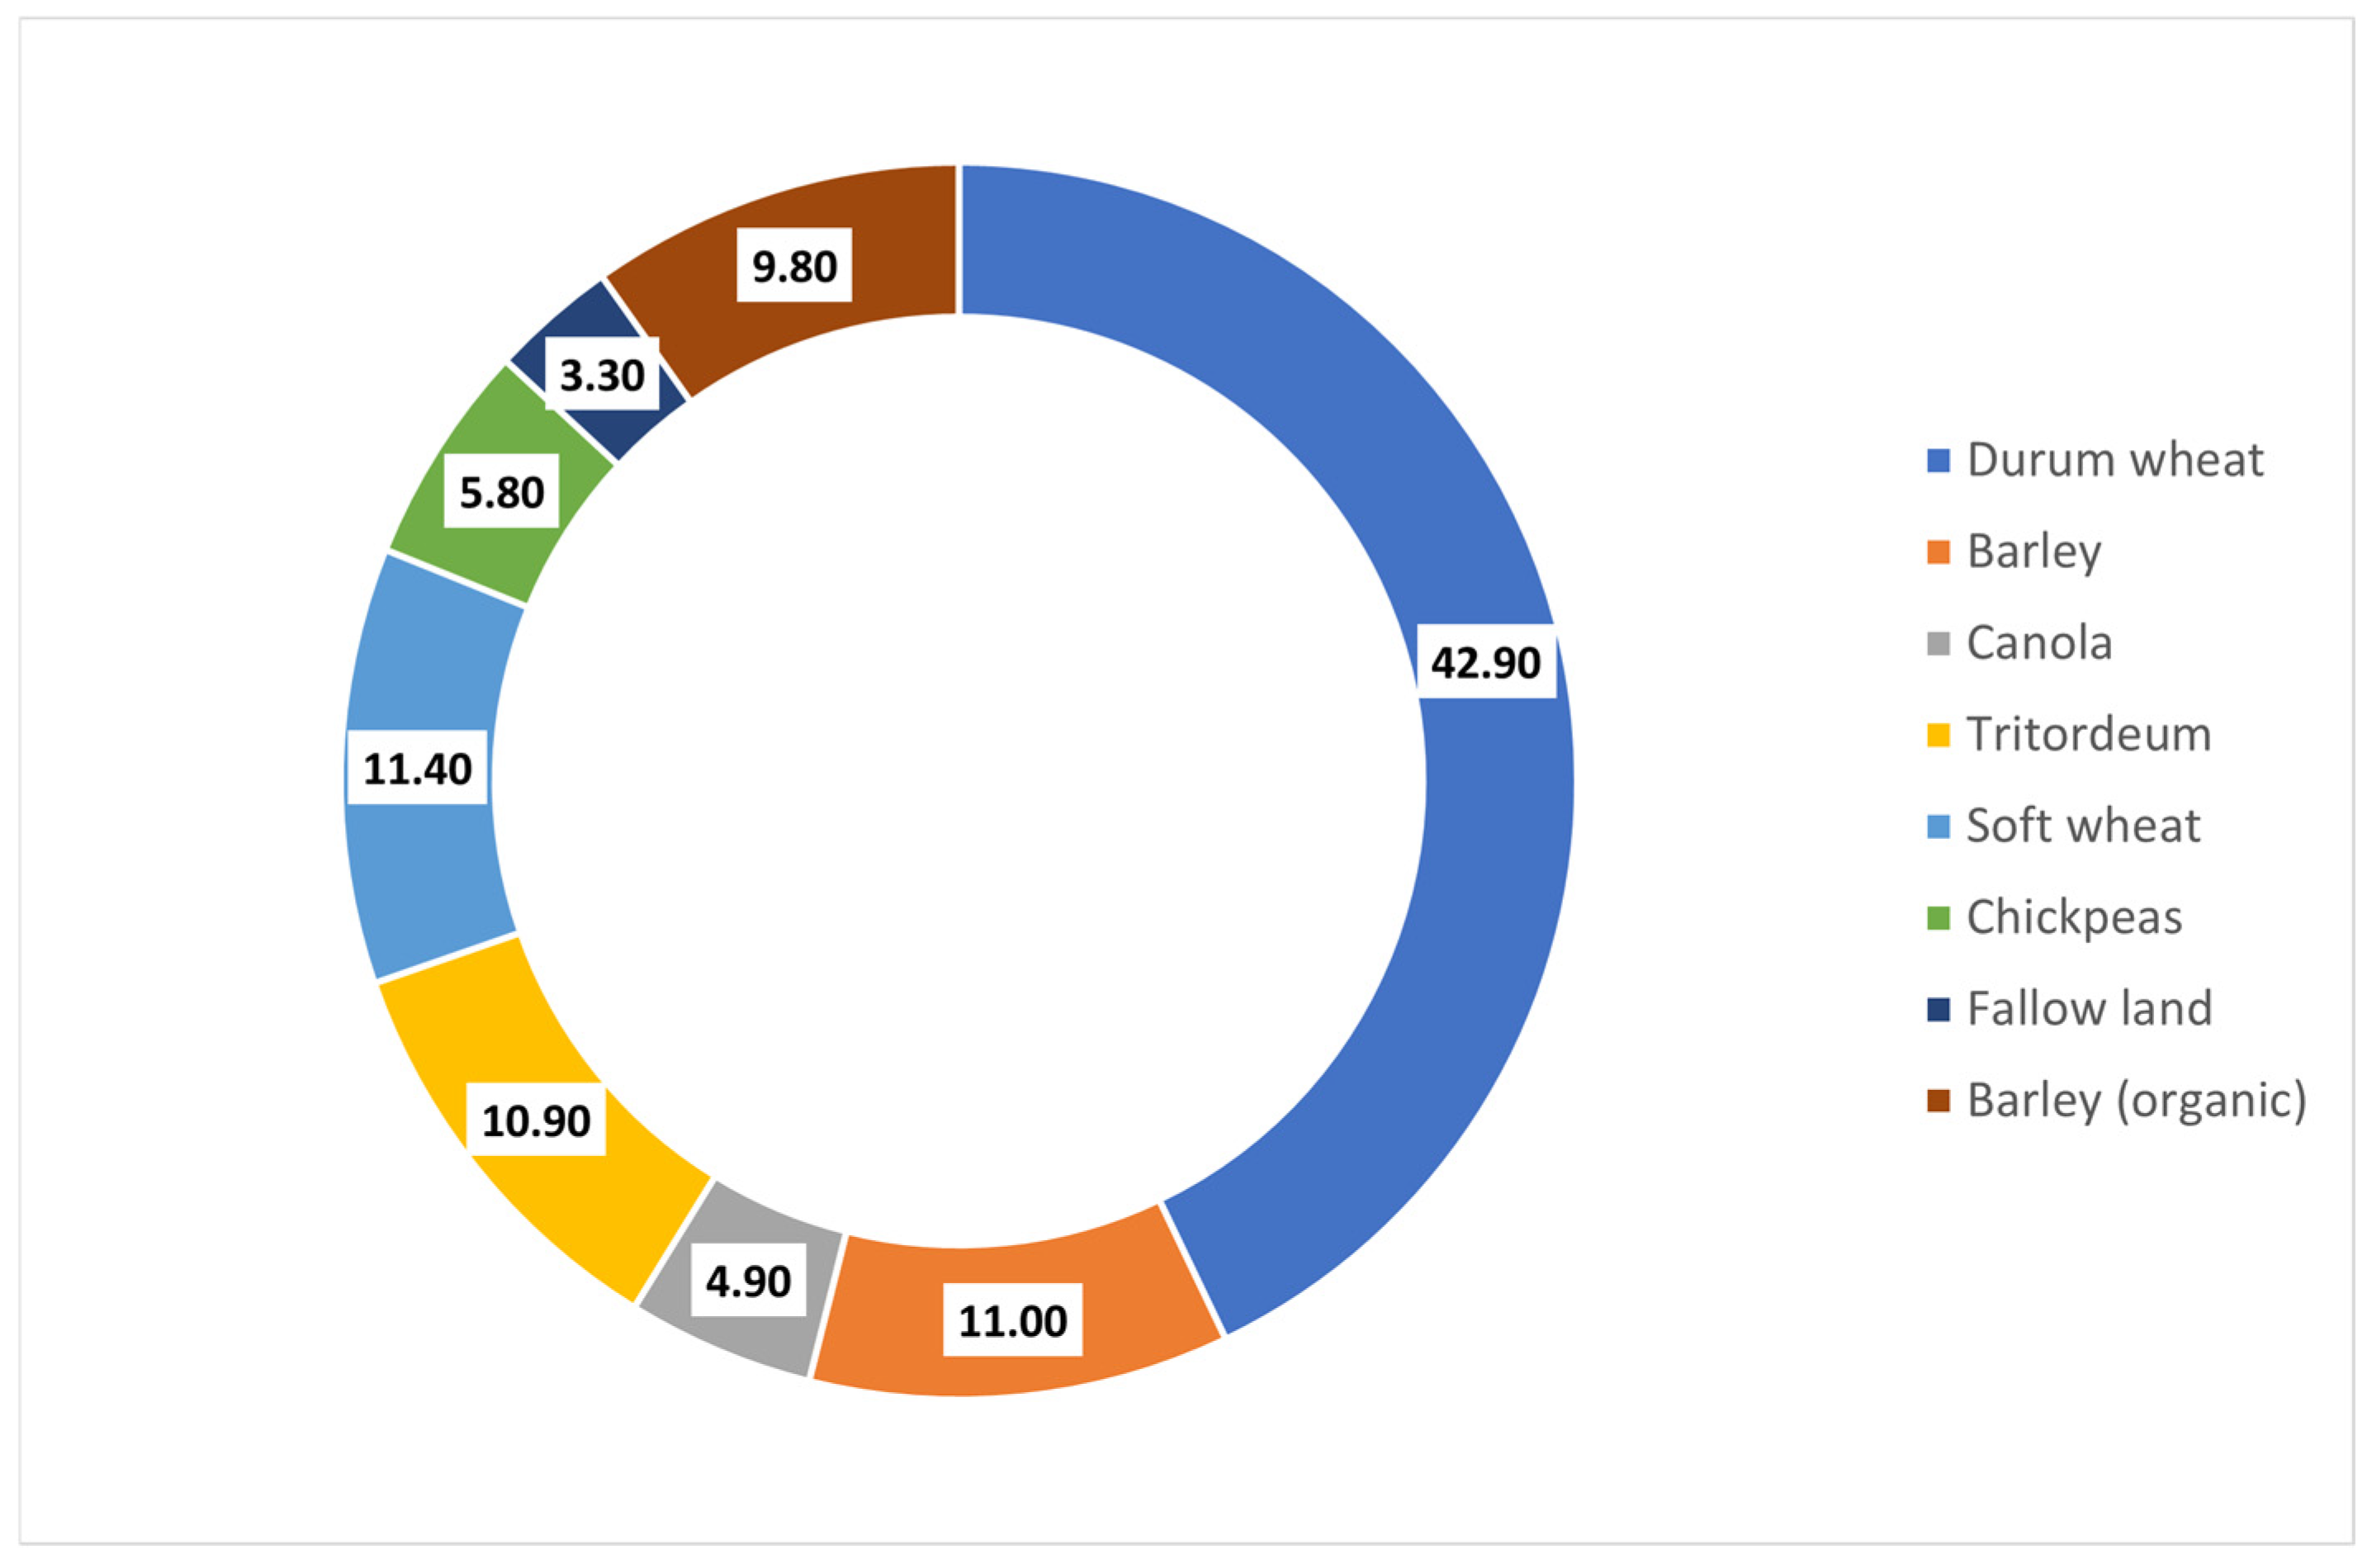
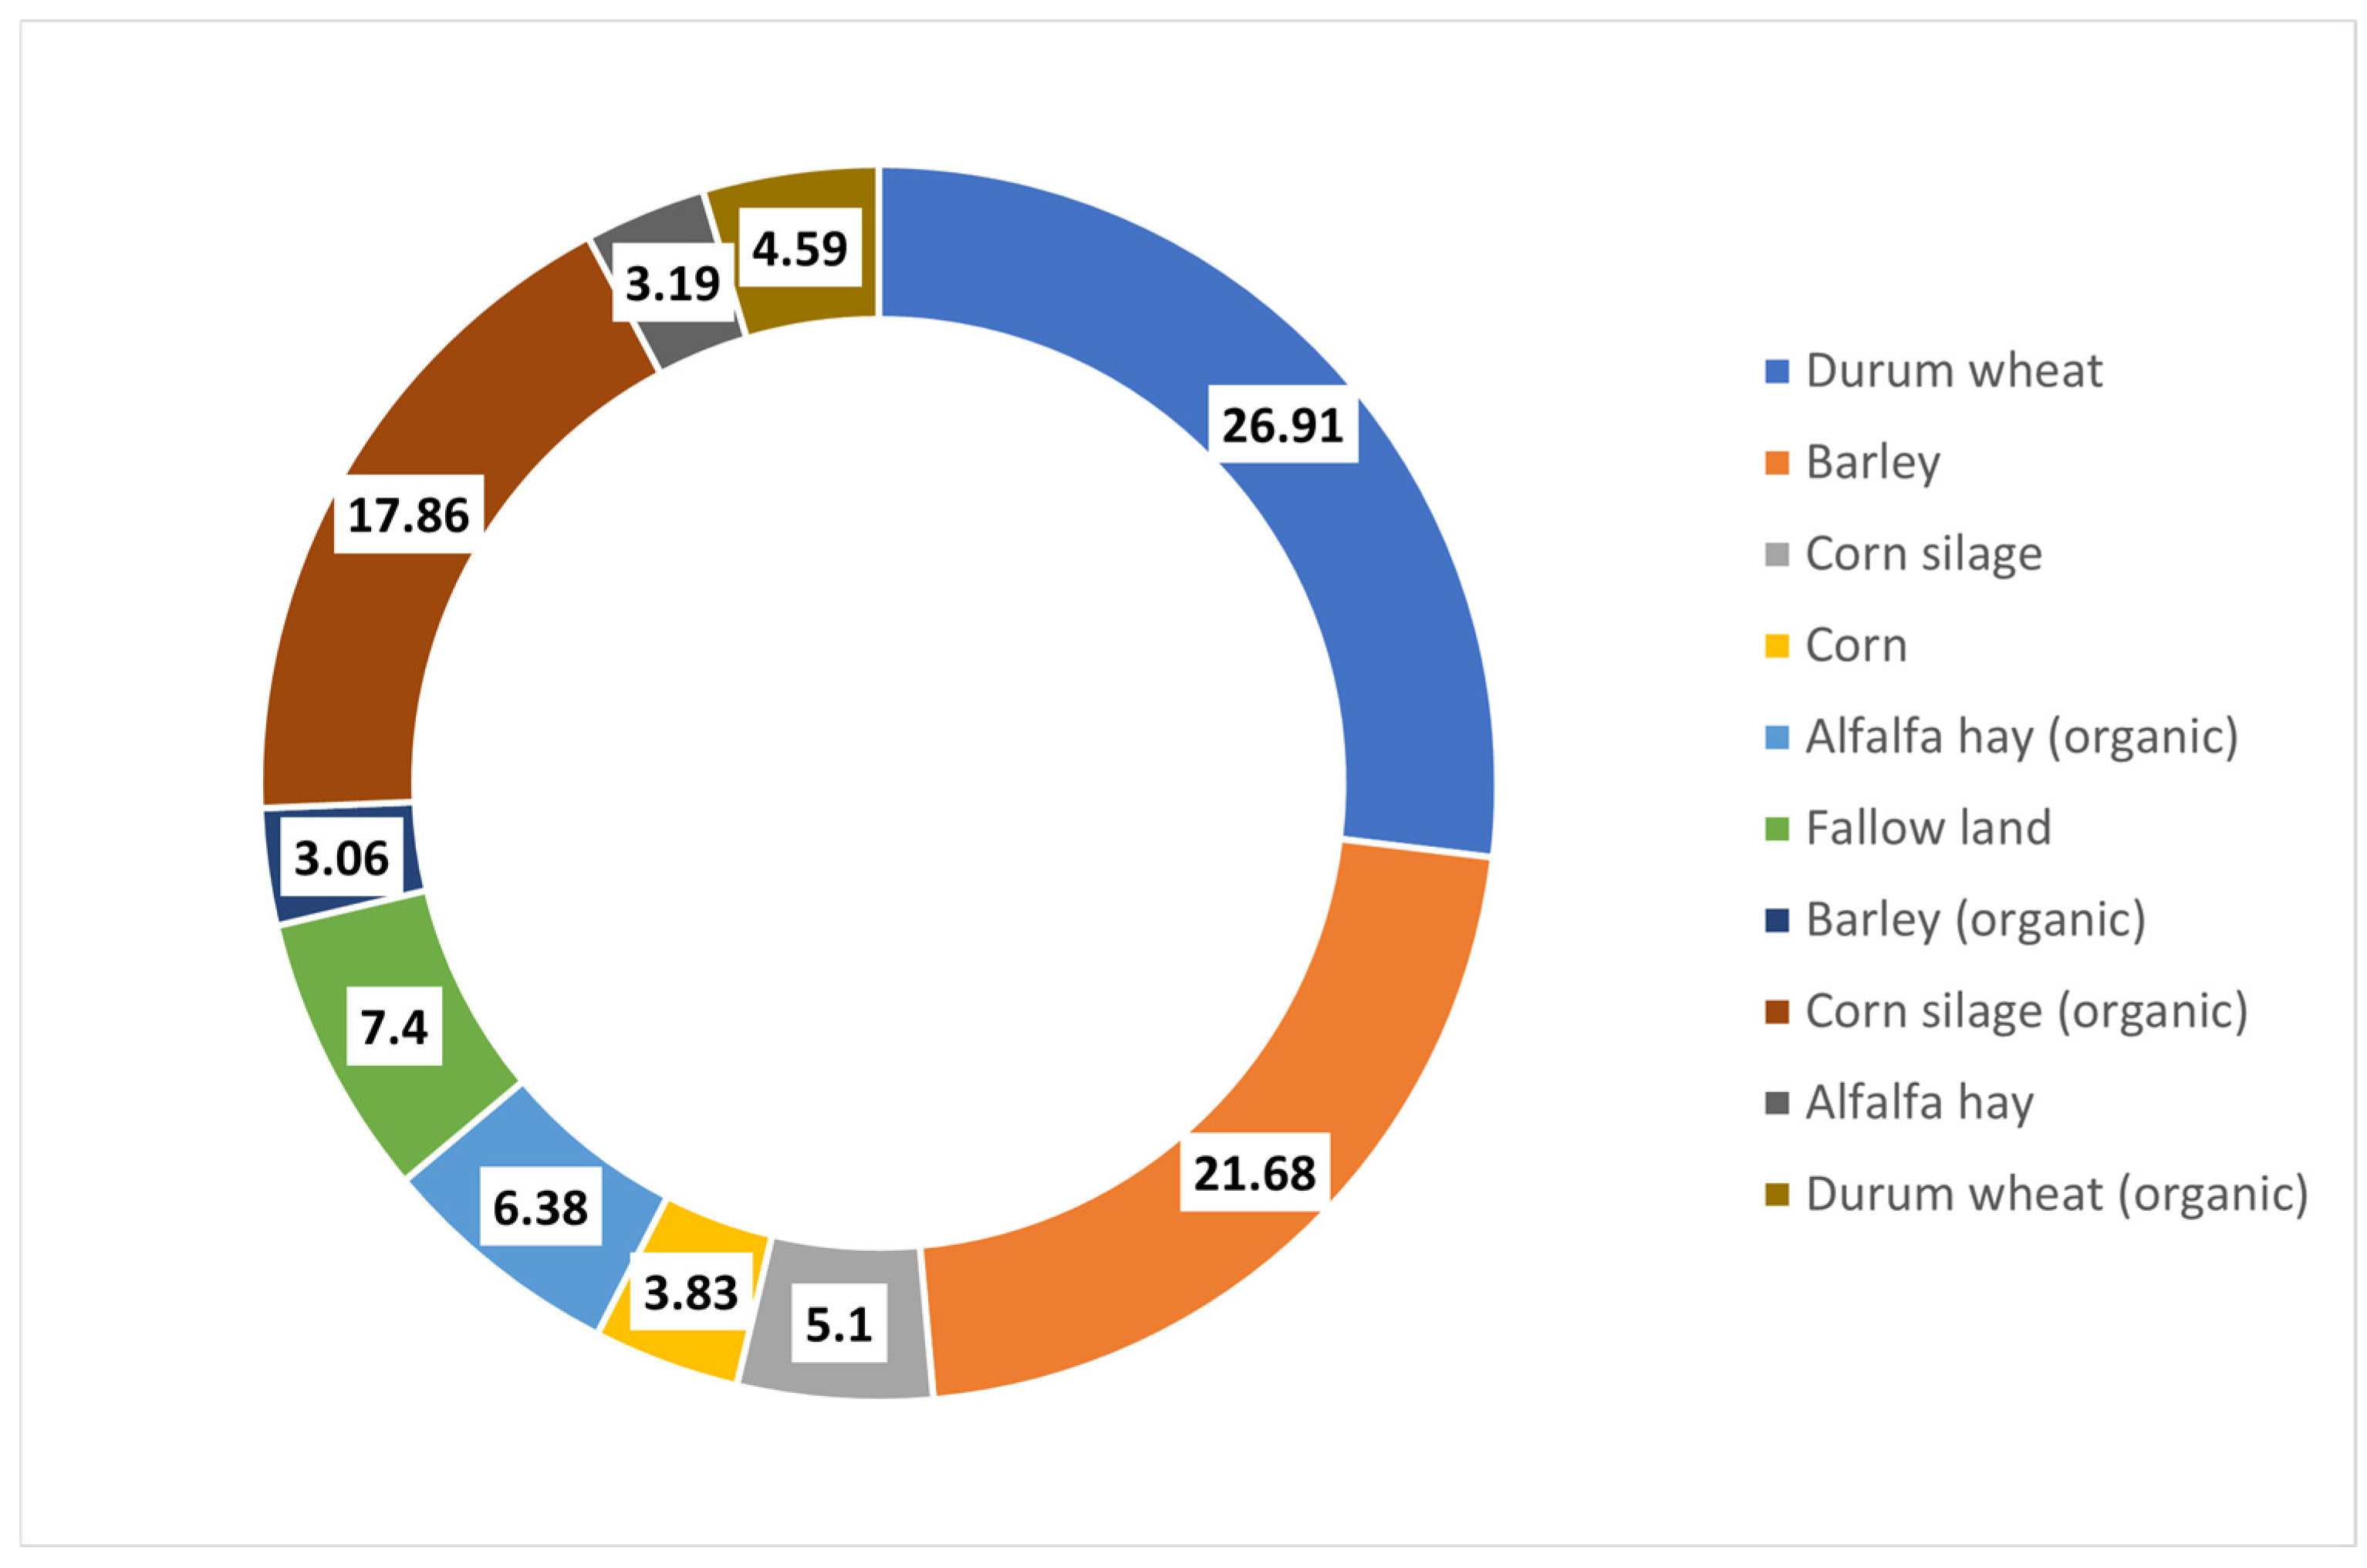
In the case of the Agia Paraskevi farmer group, the existing crop plan covers a total cultivated area of 251.3 hectares. The majority of this land is allocated to durum wheat (42.9%), followed by soft wheat (11.4%), barley (11%), tritordeum (10.9%), and organic barley (9.8%). Smaller portions are devoted to chickpeas (5.8%), canola (4.9%), and fallow land (3.3%) (Figure 7).

3.2.1. Optimal Land Change of the Agia Paraskevi Farmer Group

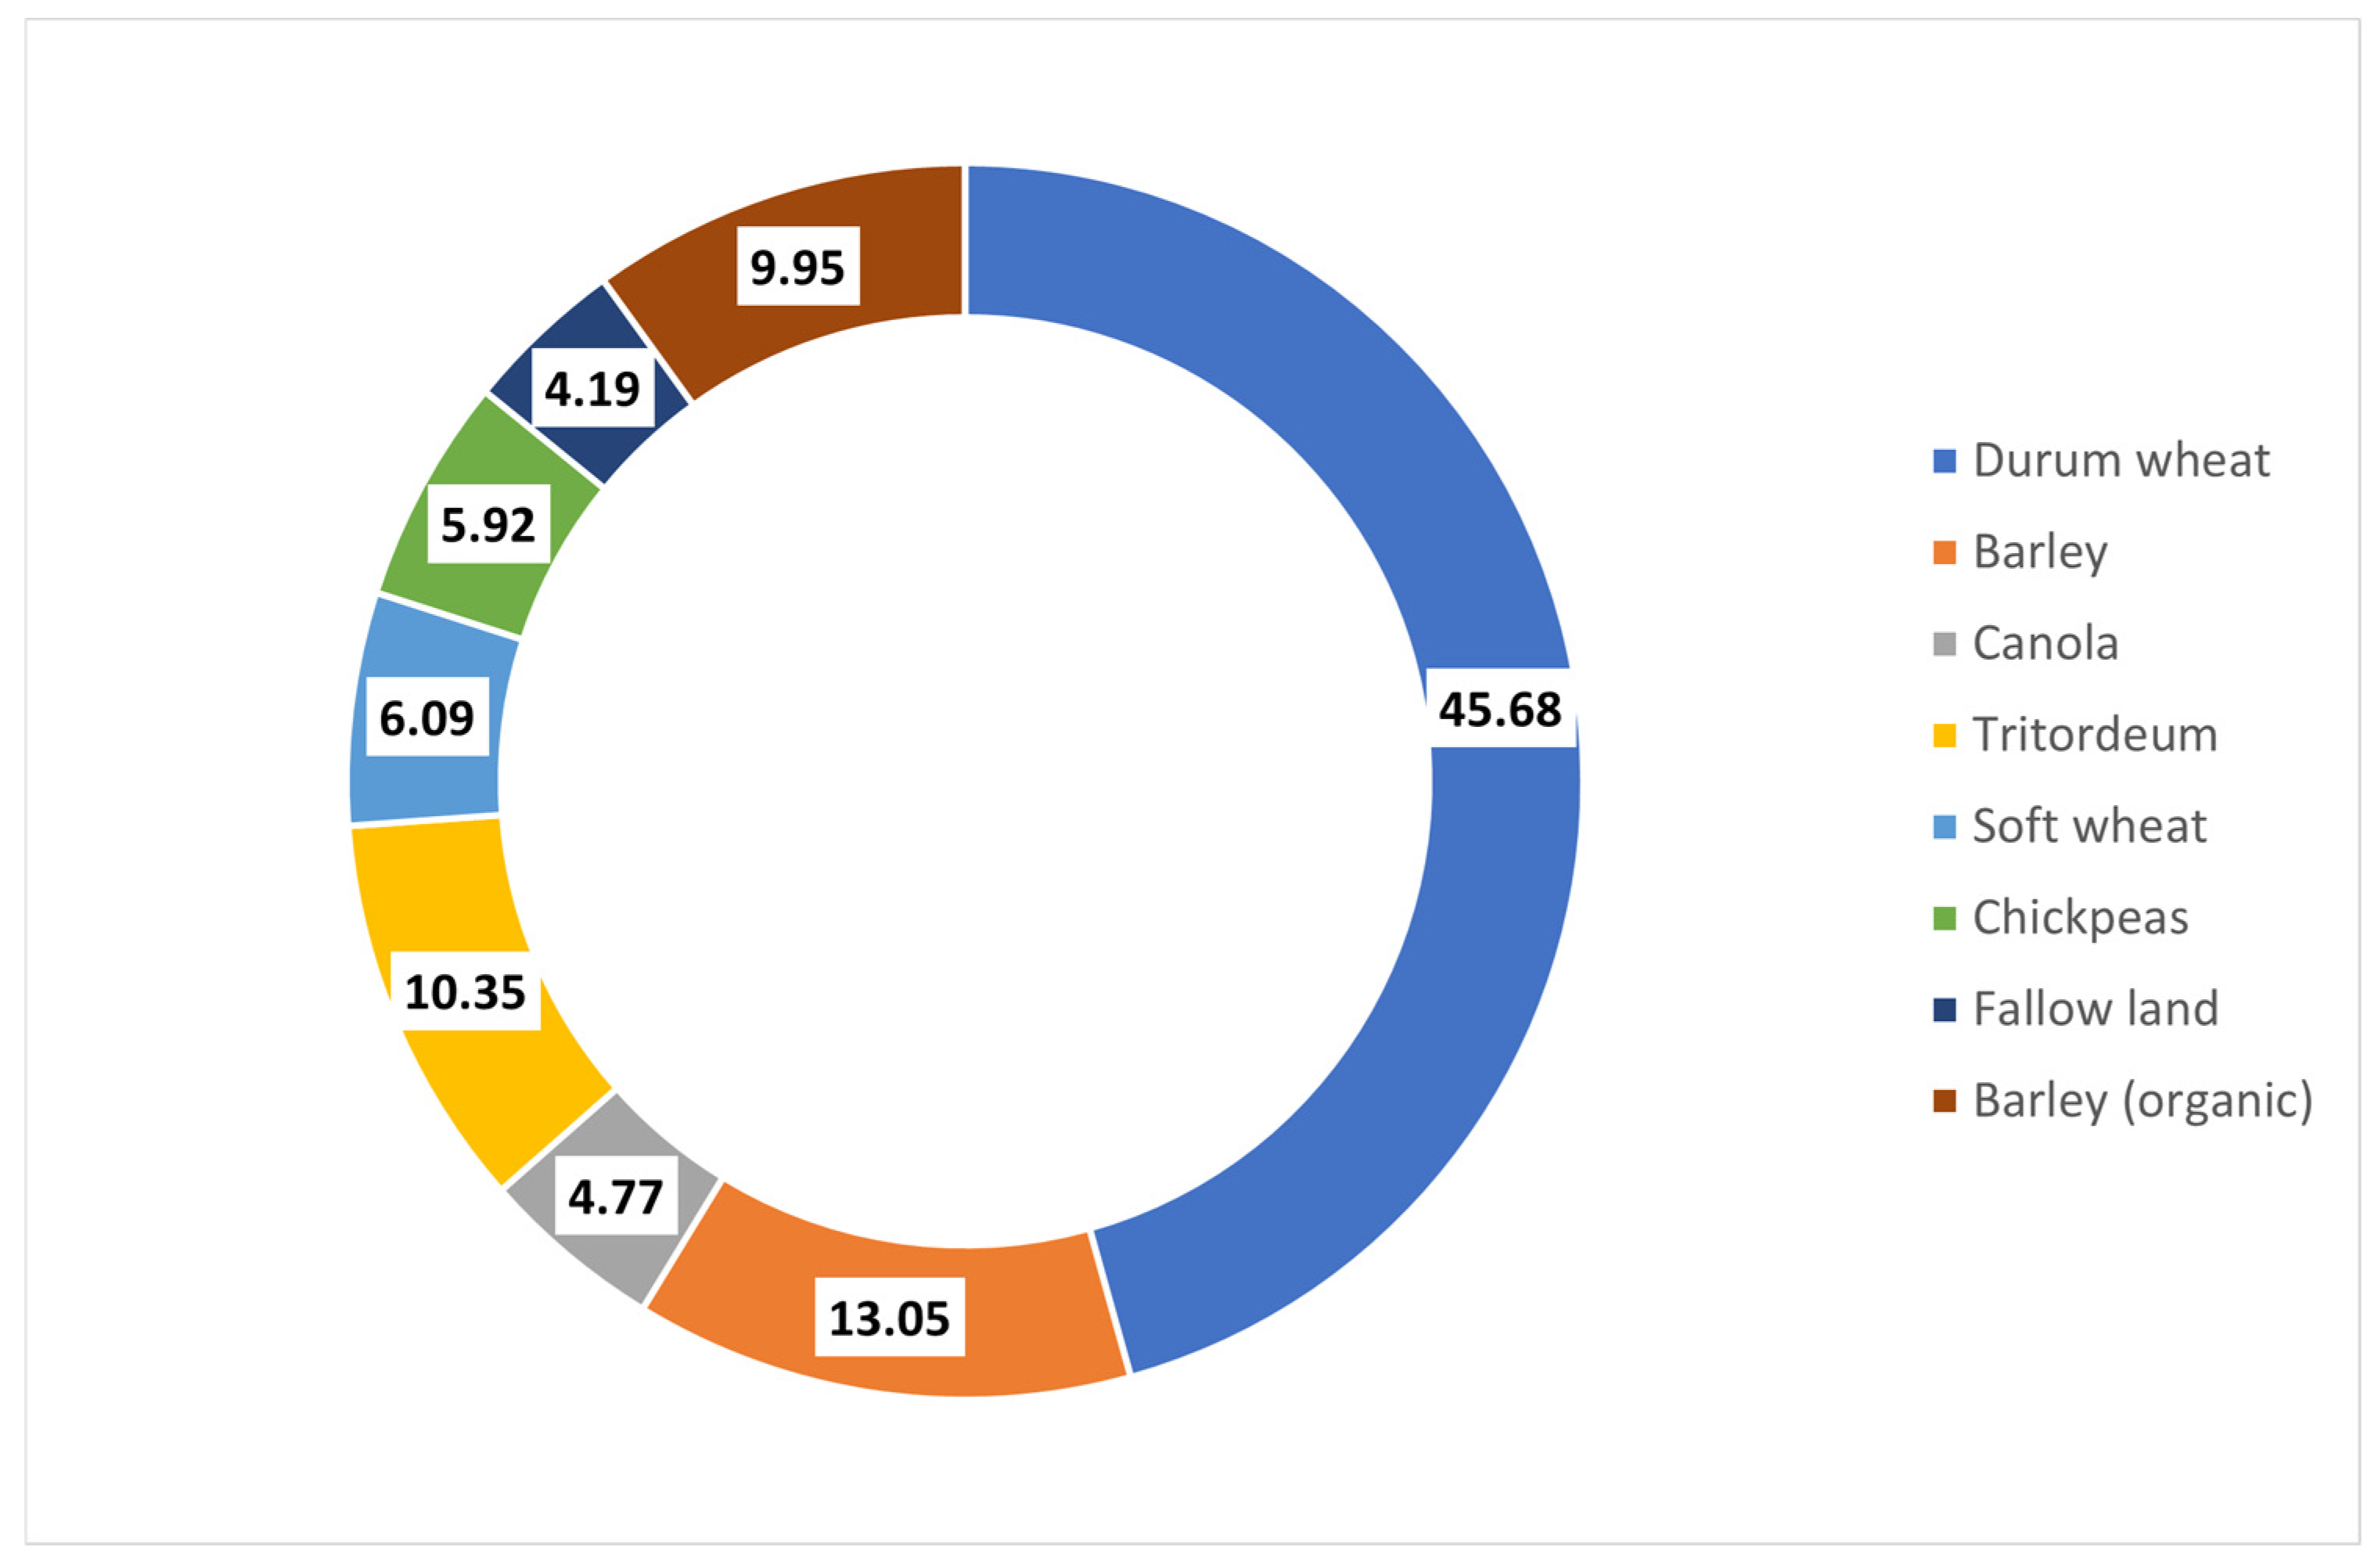
The MCDA model proposes adjustments to the agricultural land use of the Agia Paraskevi farmer group through an optimized crop plan tailored to improve overall farm performance. Specifically, it recommends increasing the cultivation of durum wheat by 6.48%, barley by 18.6%, and fallow land by 26.96%. These changes aim to enhance profitability, reduce production costs, minimize labor input, and lower water consumption. Additionally, modest increases are suggested for organic barley (1.50%) and chickpeas (2.06%). In contrast, the model advises reducing the areas allocated to soft wheat (−46.57%), tritordeum (−5.13%), and canola (−2.80%) to support the same objectives (Table 3).
Following the implementation of the adjustments, the optimal crop configuration is as depicted below (Figure 8).
Figure 9 illustrates the differences between the existing and optimized crop plans.

3.2.2. Objective Analysis of the Agia Paraskevi Farmer Group

In the context of the MCDA model, Table 4 presents a comparative analysis of key economic and agronomic indicators, including gross margin, variable costs, labor input, and fertilizer use. In the baseline (existing) crop plan, the gross margin amounts to EUR 5378, whereas in the optimized plan derived from the MCDA model, it increases to EUR 6202, reflecting a 15.33% improvement. Variable costs decrease slightly from EUR 8867 to EUR 8825. Labor requirements are reduced from 203 to 201 h, indicating a 0.94% reduction, while fertilizer use declines from 3360 kg to 3315 kg (a decrease of 1.33%). It should be noted that water use was not included in the analysis for this group of farmers, as they do not cultivate irrigated crops and thus the water use objective was not applicable.
The disparities between the current and the proposed optimal crop plans are highlighted in Figure 10.

3.3. The Ryakio Farmer Group—Current Crop Plan

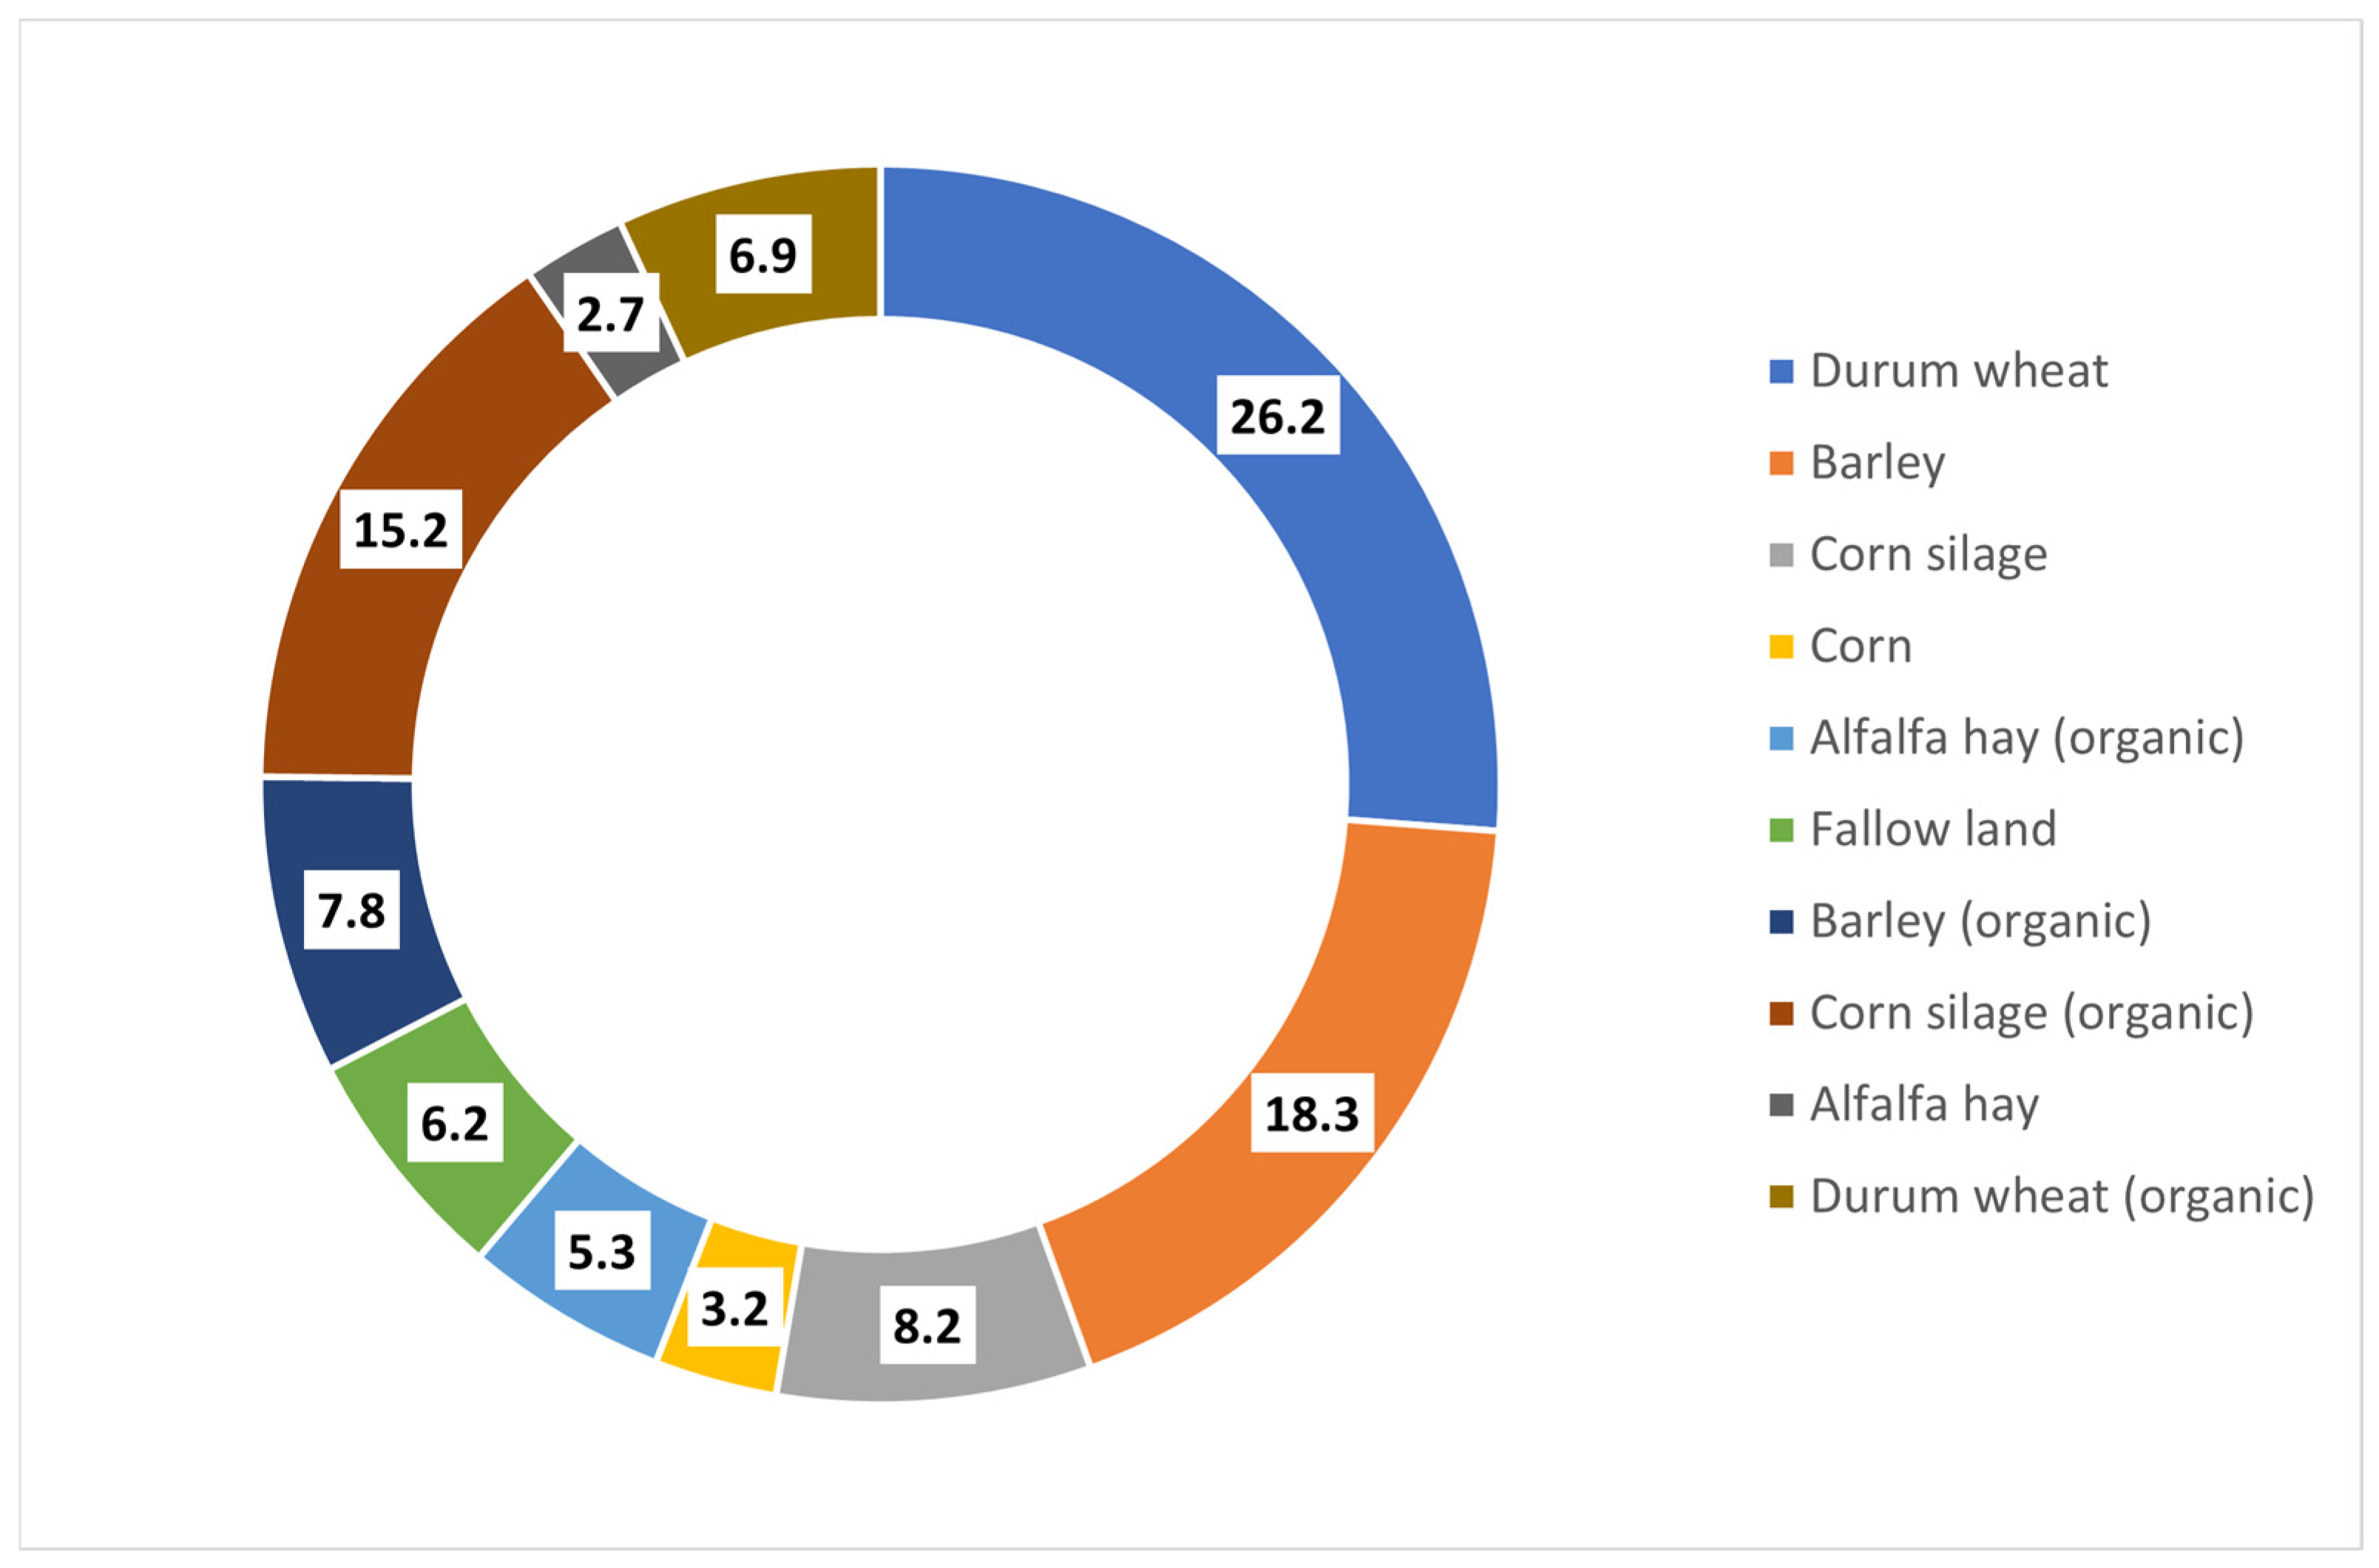
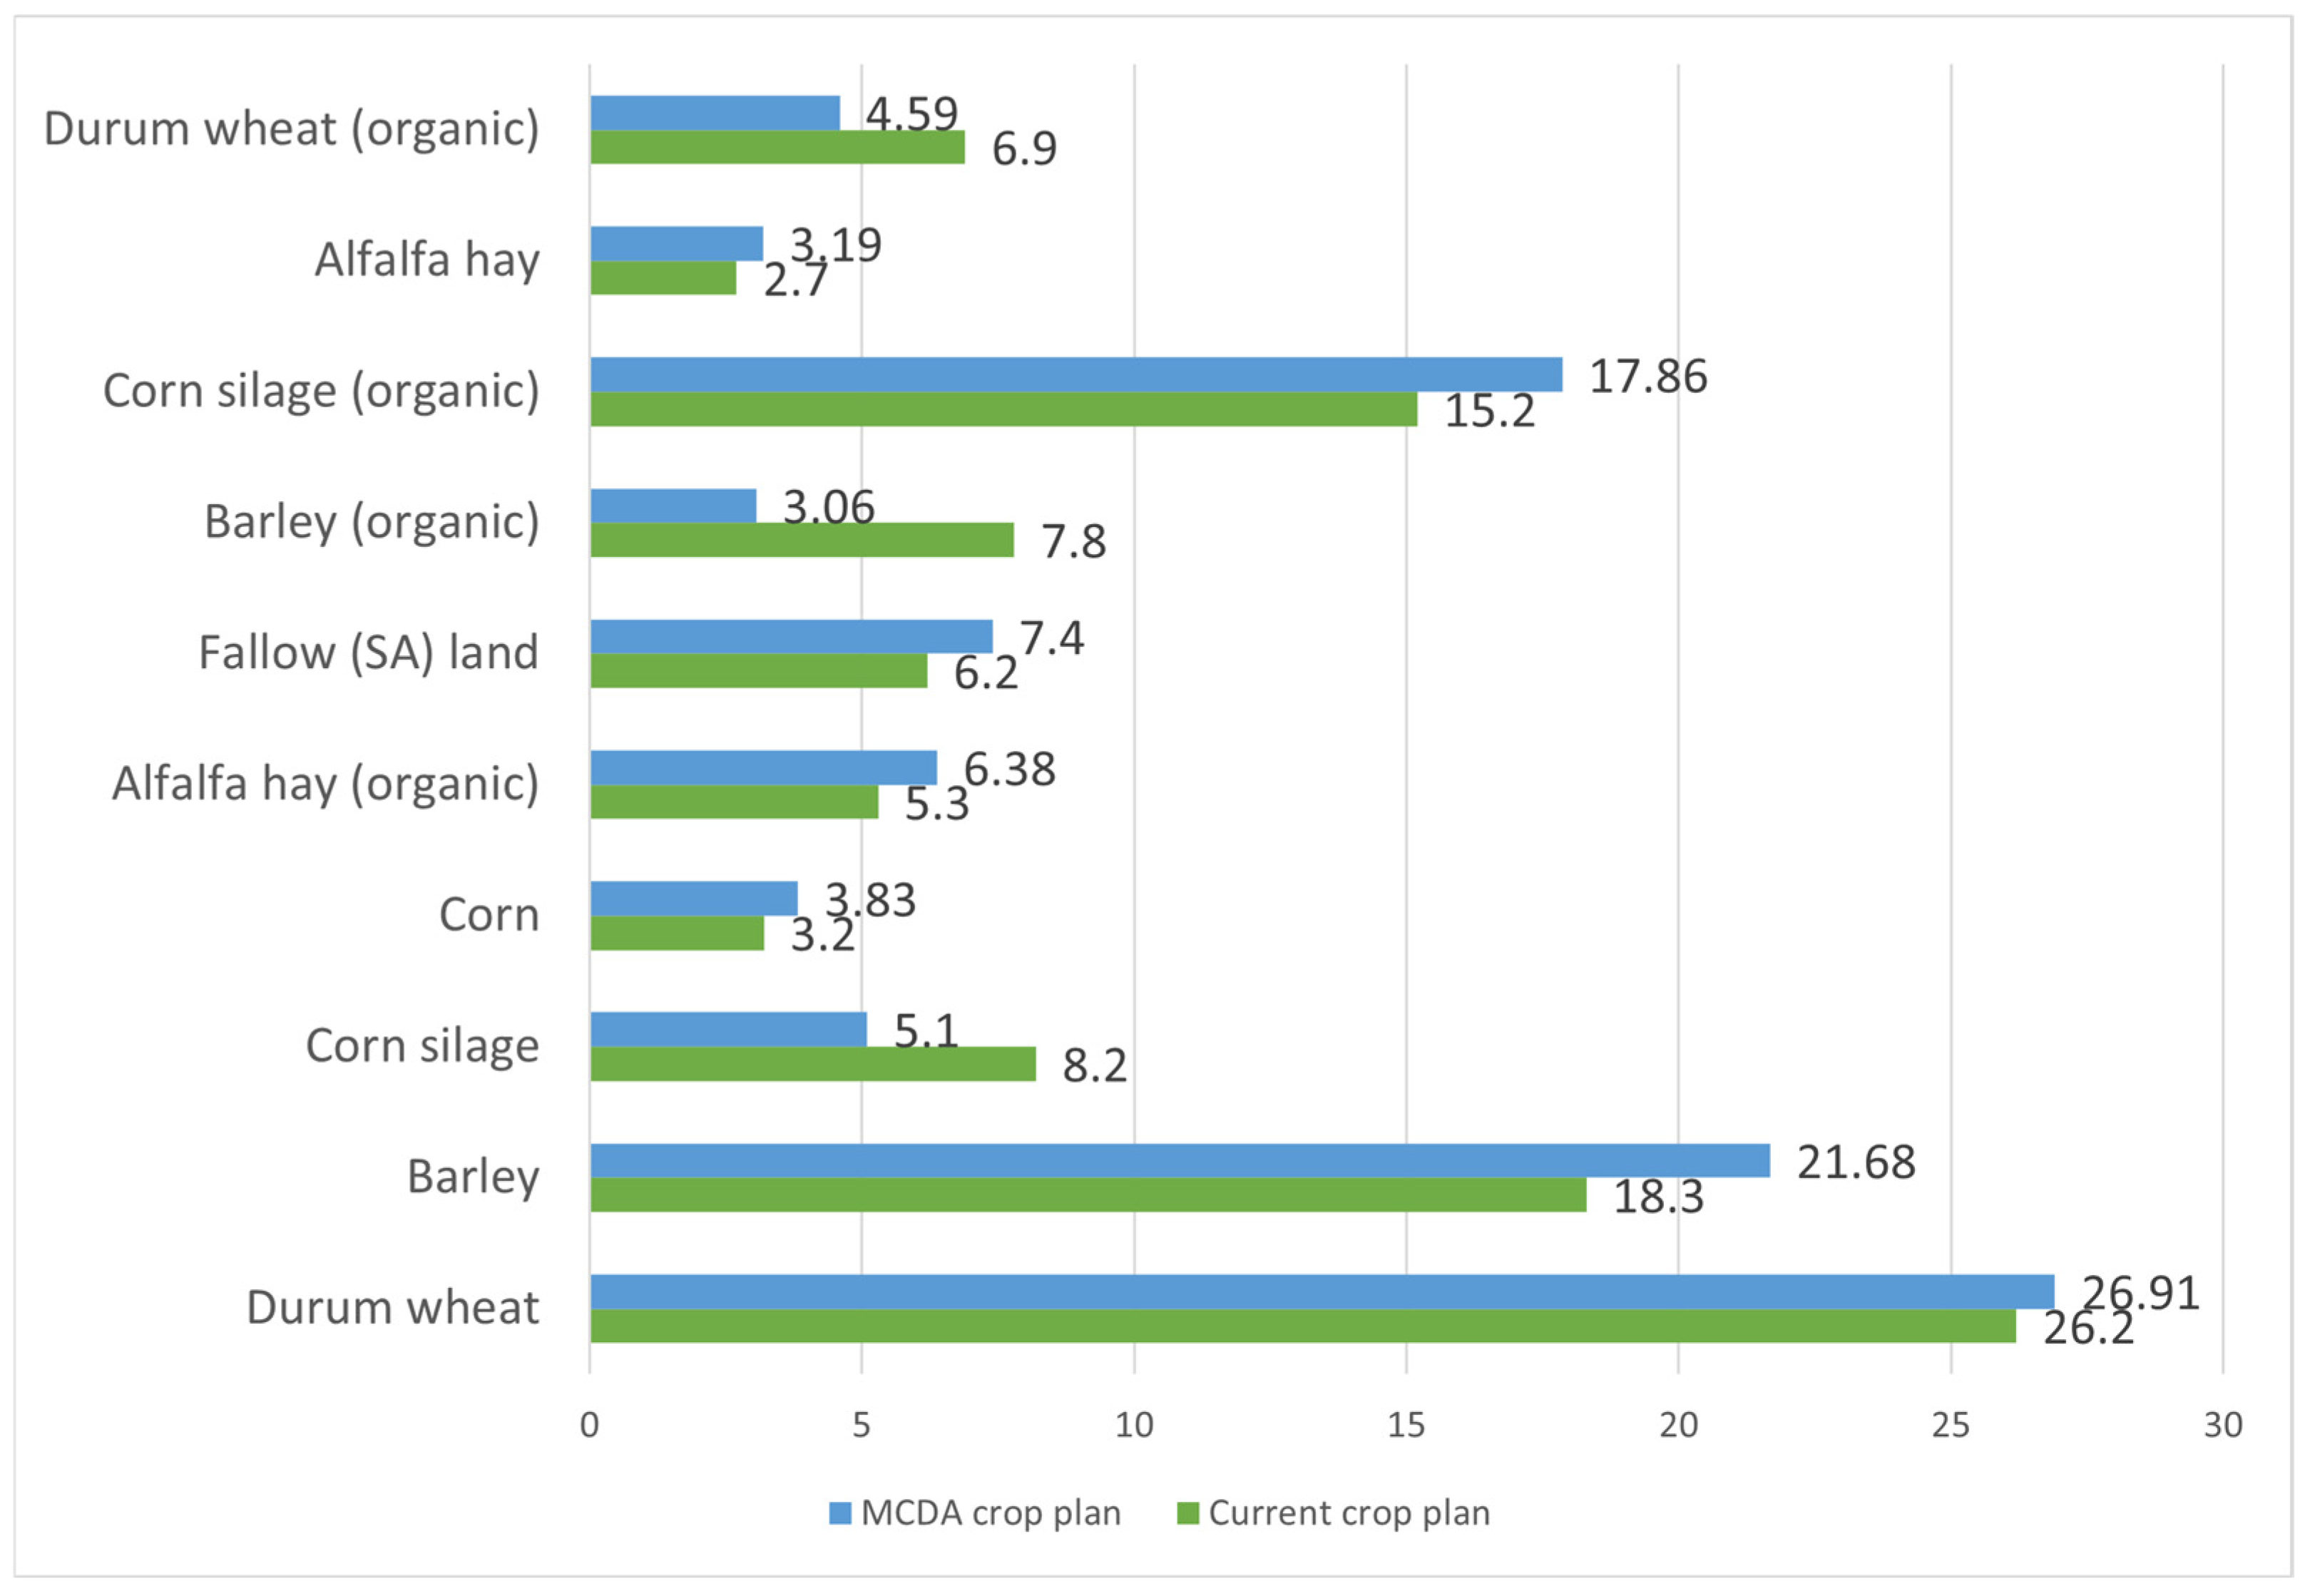
For the farmer group located in Ryakio, which forms part of the second case study, the existing crop plan encompasses a total cultivated area of 78.4 hectares. The majority of this area is allocated to durum wheat (26.2%), followed by barley (18.3%), organic corn silage (15.2%), and conventional corn silage (8.2%). Smaller proportions are dedicated to organic barley (7.8%), organic durum wheat (6.9%), fallow land (6.2%), organic alfalfa hay (5.3%), corn (3.2%), and conventional alfalfa hay (2.7%) (Figure 11).

3.3.1. Optimal Land Change of the Ryakio Farmer Group

The application of the MCDA model to the Ryakio farmer group leads to an optimized crop plan through strategic adjustments in land allocation. Specifically, the model recommends increasing the cultivation of corn by 19.68%, barley by 18.46%, organic corn silage by 17.5%, fallow land by 19.35%, organic alfalfa hay by 20.37%, and conventional alfalfa hay by 18.14%. These proposed shifts aim to enhance overall profitability, reduce production costs, lower labor requirements, and decrease water usage. Additionally, a marginal increase in durum wheat cultivation by 2.7% is suggested. In contrast, the model advises a substantial reduction in the areas allocated to organic barley (–60.79%), conventional corn silage (–37.8%), and organic durum wheat (–33.47%) to support the same optimization objectives (Table 5).
Following the implementation of the adjustments, the optimal crop configuration is as depicted below (Figure 12).
Figure 13 shows the changes introduced by the optimization model compared to the original crop plan.

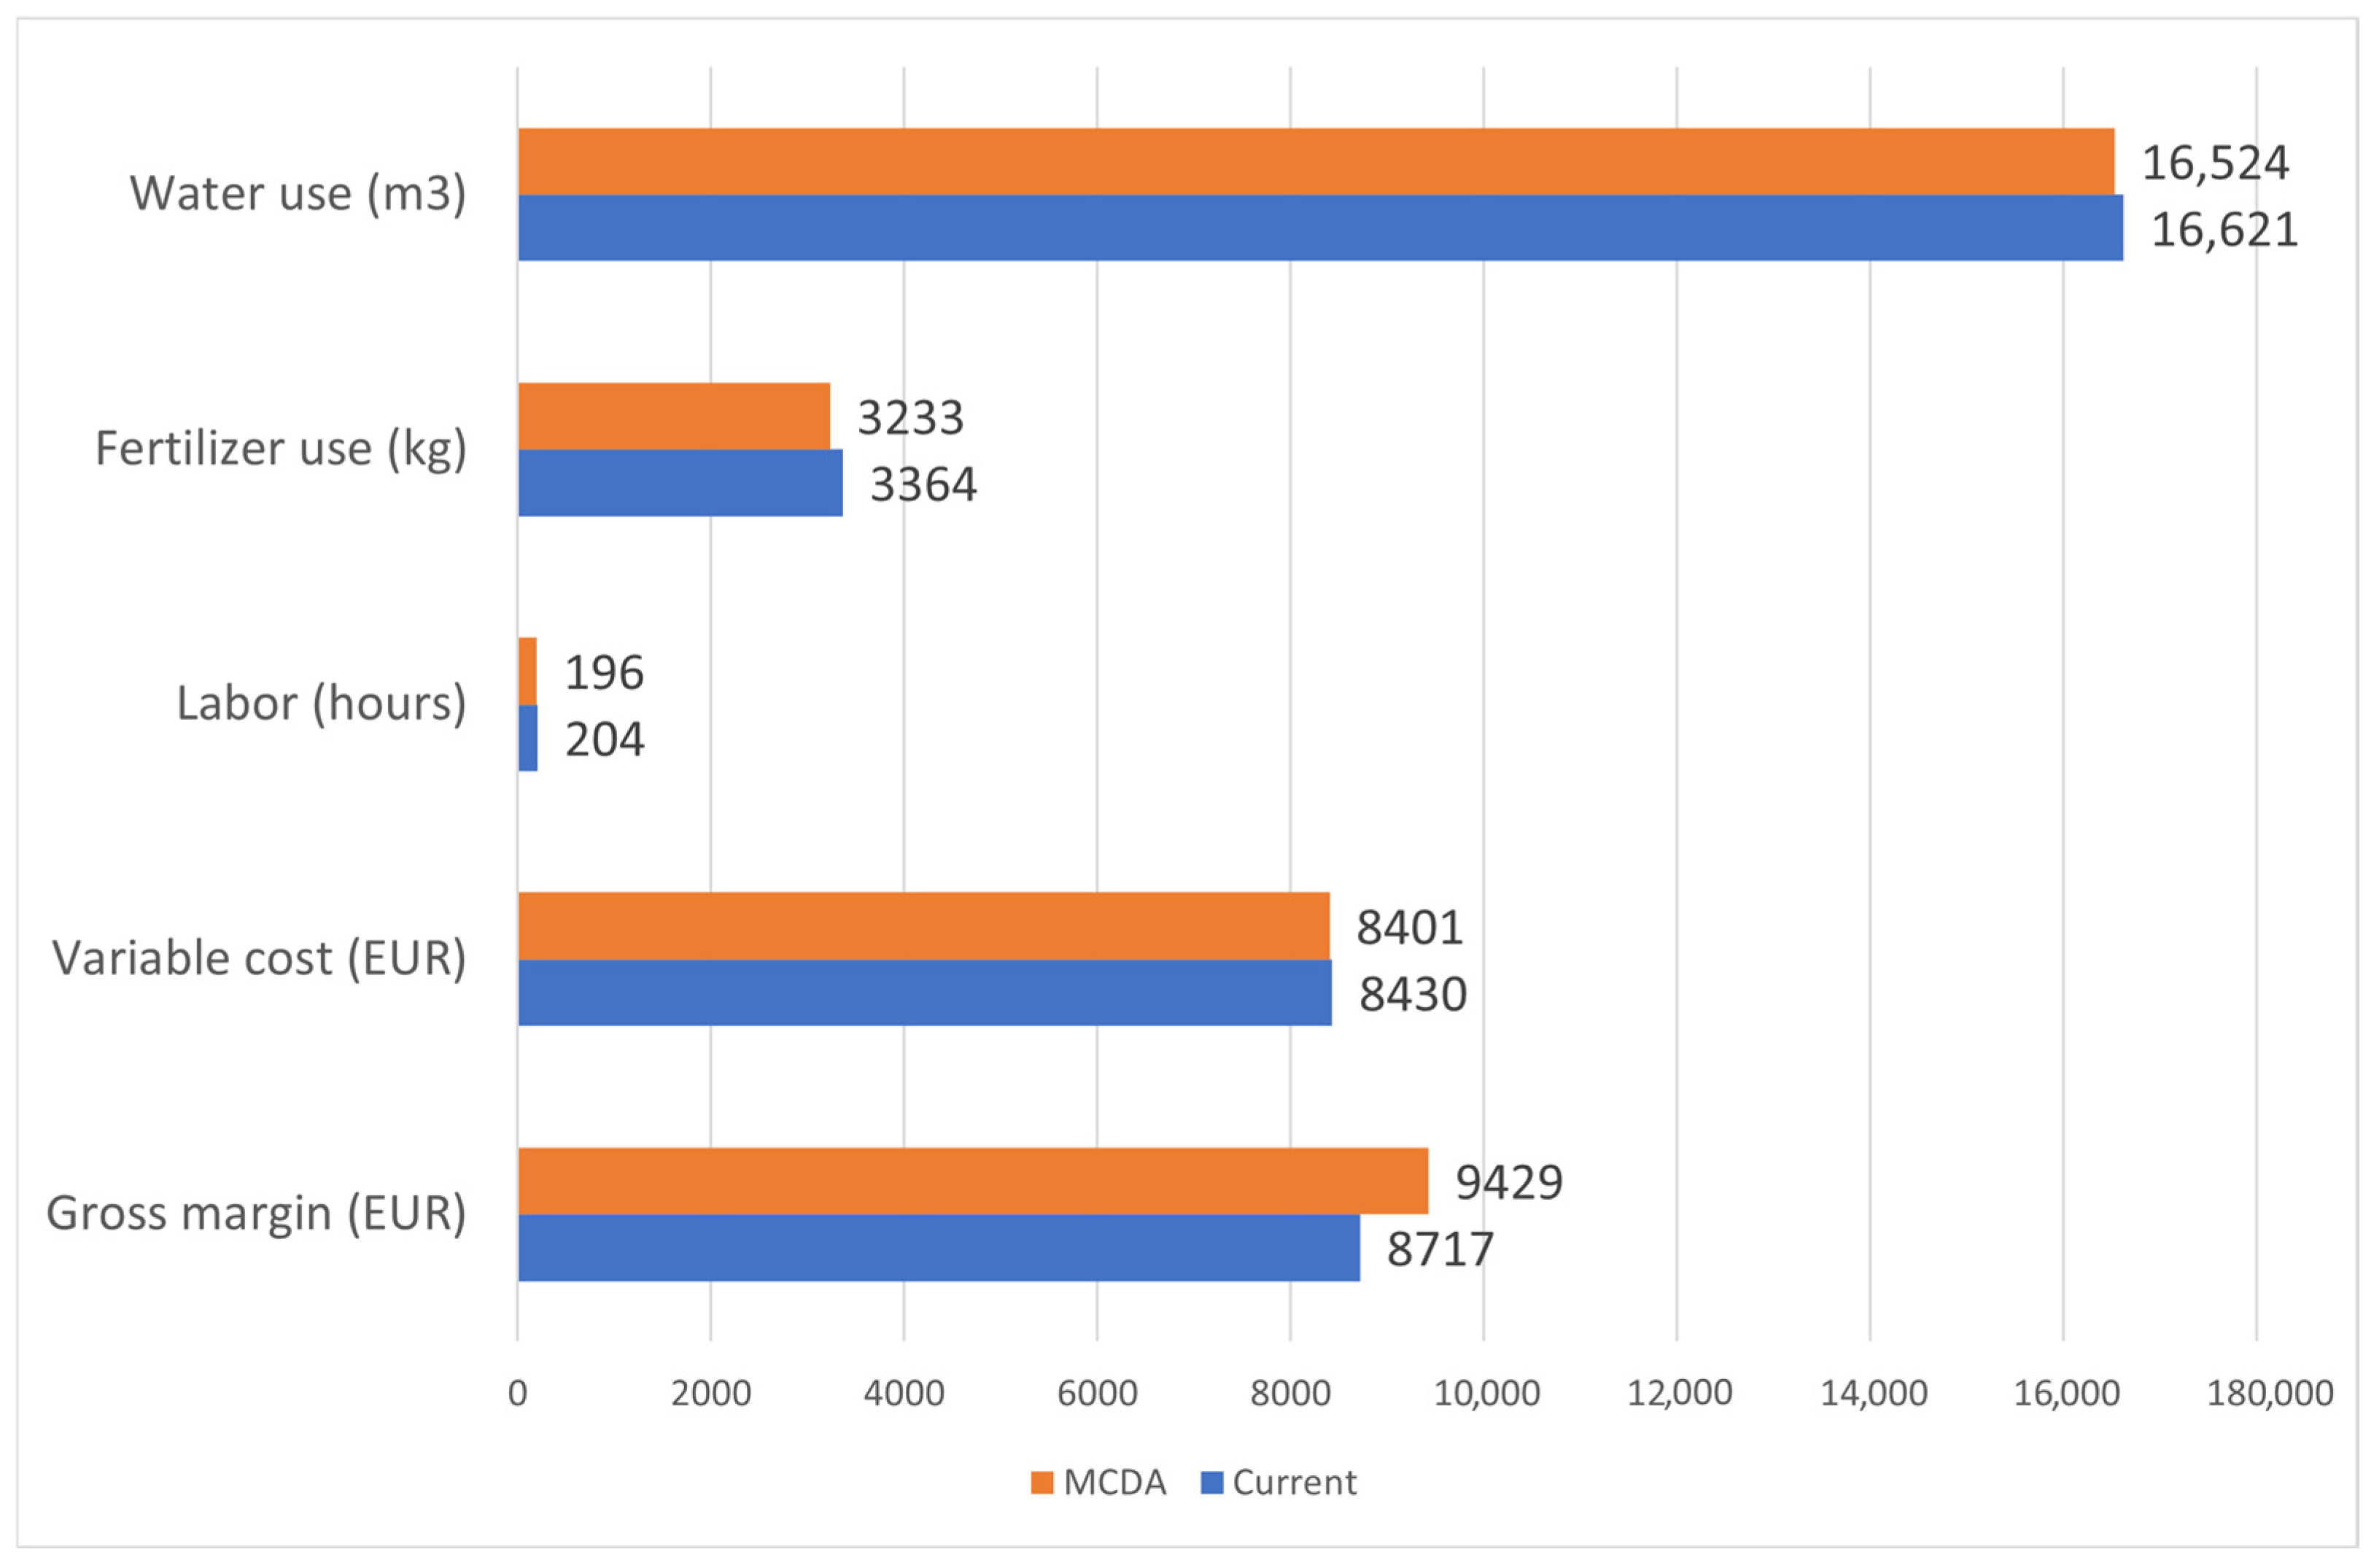
3.3.2. Objective Analysis of the Ryakio Farmer Group

Table 6 presents a comparative analysis of the existing and optimized values for key indicators integrated into the MCDA model, including gross margin, variable costs, labor input, fertilizer use, and water consumption. Under the existing crop plan, the gross margin is EUR 8717, whereas the optimized plan developed through the MCDA model yields a gross margin of EUR 9429—an increase of 8.18%. Variable costs slightly decreased from EUR 8430 to EUR 8401. Labor requirements are reduced from 204 to 196 h (–3.63%), and fertilizer use declines from 3364 to 3233 kg. Additionally, water use decreases marginally from 16,621 to 16,524 cubic meters, indicating a small but positive shift toward more efficient resource utilization.
The disparities between the current and the proposed optimal crop plans are highlighted in Figure 14.

4. Discussion

With the goal to optimize land use within the Common Agricultural Policy framework [17,37,38], which aids in complying with cross-compliance rules, a multi-criteria decision analysis model was developed in significant agricultural regions of Greece, including Central and Western Macedonia. The model was implemented within the framework of the ‘Measure 16: Cooperation’ of the Greek RDP to support the agricultural sector’s development by minimizing agricultural inputs. This model incorporates key objectives such as maximizing profits and minimizing differential inputs, leading to a rational use of land through changes in land use [17].
Regarding the first case study of the farmer group of Loudias, the developed multi-criteria analysis model recommends an increase in cotton cultivation, emphasizing the crop’s economic viability, especially since it already occupies 68.1% of agricultural land. This increase is counterbalanced by reductions in rice and maize cultivation, by 9.56% and 2.06%, respectively, reflecting a strategic effort to reduce fertilizer usage. These outcomes are consistent with findings reported in related studies. Additionally, the model indicates a decrease in the cultivation of both soft and durum wheat, which is also in line with previous research [27]. Overall, the model successfully meets its objectives by increasing the farm’s gross margin, lowering variable costs, and minimizing fertilizer use, while the labor input remains unchanged. Regarding the marginal gross margin increase of only 0.09% for the Loudias farmer group, it is important to clarify the model’s added value beyond direct profitability. The primary success in this scenario lies in the model’s ability to optimize to achieve multiple objectives simultaneously, aligning with the new CAP framework. Nevertheless, the model achieved measurable reductions in variable costs (−0.21%) and water use (−1.45%), suggesting improved input efficiency. However, the advantages of alternative scenarios are not always immediately reflected in the economic output. Climate and market risk reduction, long-term income stability improvements, and facilitated access to CAP-related support schemes are also critical for the sustainability and resilience of farming systems. These benefits are not fully captured by changes in gross margin [39,40].
In Western Macedonia, the model adopted a holistic approach, incorporating all predefined objectives. For the Agia Paraskevi farmer group, the model proposes an 18.6% increase in barley cultivation and a 6.48% increase in durum wheat—both of which are considered regionally significant crops. The shift in land use, particularly the 26.96% reduction in fallow land, is intended to improve soil fertility while simultaneously decreasing input use [25,41], aligning with the study’s objectives. The significant reduction in soft wheat by 46.57% was driven by the model’s optimization logic, which favored the slightly higher gross margin of barley and durum wheat based on the input data. This discrepancy is highlighted in another study in which soft wheat was eliminated in a corresponding model. The economic benefits of these land use changes are evident in the significant 15.33% increase in gross margins, consistent with the findings from another study on arable crops [17]. Additionally, while the objectives of reducing labor and fertilizer use were met, the reductions were modest at 0.94% and 1.34%, respectively [27].
The holistic model featuring a revised land use framework was also applied for the Ryakio farmer group and led to an 8.18% increase in profitability by reducing variable costs and labor requirements. Notably, there was a 20.37% increase in the cultivation of organic alfalfa hay and a 17.5% rise in organic corn silage, reflecting a strategic alignment with economic incentives and a commitment to sustainable agricultural practices. These increases in organic crop production are justified by the absence of fertilizer inputs and the optimization of variable costs [42]. Additionally, the model advocates for a 19.68% increase in corn cultivation and an 18.46% increase in barley cultivation, like another model discussed by Moulogianni (2022) [27], while the specific economic/environmental trade-offs we identified, such as the reduction in organic crops, echo the challenges of sustainable transitions explored by Acs et al. [42] and Bonnet et al. [39]. Increasing fallow and organic alfalfa hay areas reflects a strategy to conserve soil and water resources, as observed in the Agia Paraskevi group (a 19.35% reduction). The model’s recommendation to also significantly reduce organic barley (–60.79%) is explained by its core function of finding the best trade-off among its multiple objectives. The model found that reallocating land from organic barley to other crops—such as organic corn silage (+17.5%) and organic alfalfa hay (+20.37%)—resulted in a more balanced and profitable crop mix for the farm. This new crop plan yielded a higher total profit (+8.18%) while still meeting the goals for reducing labor and other inputs. In essence, the model removed a crop that was underperforming and replaced it with a combination of crops that provided a superior outcome for the farm. This result highlights a potential policy challenge. Optimization models based solely on current economic data might deprioritize certain environmentally desirable crops if their profitability is not sufficiently supported. It suggests that for the Green Deal objectives to be met, the economic incentives for specific organic crops may need to be re-evaluated in the CAP Strategic Plans.
The modest decline in water use underscores the group’s commitment to environmental stewardship [25]. Additionally, the objective of reducing fertilizer use in this study appears to have been achieved. This research builds upon our previous work on applying MCDA models in the region under the new CAP framework [17]. This constitutes a limitation of the specific research, as organic crops, which typically have low variable costs, were omitted from the MCDA model’s proposals. While this might seem contradictory to the CAP’s sustainability objectives, it can be explained by the model’s structure: organic crops were not assigned any environmental advantage in the optimization process. As a result, conventional alternatives with slightly higher margins were favored. The gross margin of organic farming was found to be low compared to conventional values in other studies. This can be attributed to the fact that organic farming is more physically demanding and has higher costs, leading to a lower gross margin [43]. This highlights a current limitation of the model, which focuses primarily on economic optimization under input constraints. Future iterations should consider incorporating environmental scoring systems or market premiums to better capture the broader value of organic and sustainable practices.
Overall, the study’s key objectives were successfully met. The reduction in water use highlights the group’s commitment to environmental stewardship, while the goals of reducing fertilizer and labor use and increasing profit were also achieved [17].

5. Conclusions

This study was conducted within the framework of ‘Measure 16: Cooperation,’ aiming to identify production plans that can adapt to the requirements set forth in the Common Agricultural Policy for the period of 2023–2027 while complying with multiple regulatory standards. For this purpose, a multi-criteria decision analysis model and optimization are employed to facilitate weighted target planning for optimizing agricultural management in Northern Greece. The analysis incorporates data from three farmer groups across various regions of Central and Western Macedonia. The MCDA model developed in this research prioritizes the optimization of agricultural sustainability by promoting crop choices that necessitate a more rational utilization of inputs and yield higher economic returns. It guides farmer groups across Central and Western Macedonia to adapt their practices for enhanced environmental sustainability and profitability. Additionally, the MCDA model functions as an essential decision support tool, delineating the potential profitability and labor intensity associated with diverse cropping strategies. Moreover, the significant impact of the Common Agricultural Policy on land use decisions is apparent through this study, which underscores how CAP subsidies directly influence farmers’ choices regarding crop selection and land management strategies.
Specifically, in the first case study focusing on Central Macedonia, the objectives included the maximization of gross margin, minimization of variable costs, and reduction in fertilizer use. This case study did not include the objective of minimizing water use. Conversely, the second and third farmer groups adopted a more comprehensive approach to farm management based on multiple cropping rules, incorporating the objective of minimizing water use and enforcing a mandate that 10% of arable land remains fallow under the new CAP (2023–2027).
The case studies facilitated a systematic evaluation of different farming plans. They offered solutions that maximize profitability while minimizing input costs and environmental impacts. The results also demonstrated that implementing MCDA can lead to significant improvements in farm management practices. This approach enhances both sustainability and efficiency.
However, it is important to acknowledge the study’s limitations. The model represents a simplification, as its single-period optimization does not fully capture multi-year obligations, such as the mandatory crop rotation (GAEC 7) required by the new CAP. While some financial incentives from eco-schemes were included, the model’s structure does not capture the full strategic complexity of their adoption. Consequently, the environmental insight offered by the optimization outputs is limited to the predefined objectives (e.g., fertilizer and water use) and does not constitute a full environmental impact assessment.
The application of the model resulted in notable improvements, increasing the gross margin by up to 15.33% in the Agia Paraskevi group and 8.18% in the Ryakio group, while simultaneously reducing fertilizer use by up to 3.87%. The novelty of this research lies in its timely application of a quantitative optimization tool to real-world farms across a broad, previously unstudied Greek region, empirically linking MCDA with the new CAP’s cross-compliance rules. The study’s significance lies in its provision of a practical decision support tool that guides farmers towards more resilient and environmentally friendly practices without economic losses. To ensure the tool’s full applicability under CAP 2023–2027, further model constraints and enhanced alignment with policy requirements are necessary. To enhance the model’s robustness and relevance, future improvements could integrate dynamic constraints for CAP compliance, subsidy mechanisms, eco-scheme eligibility, and environmental scoring. Furthermore, adding spatial or climate zone parameters could improve the model’s localization.
As a policy recommendation, regional authorities should consider promoting MCDA tools to help farmers navigate the complexities of the CAP, facilitating the adoption of efficient crop plans that align national agricultural productivity with EU sustainability targets.
This pioneering research has been applied for the first time over a broad geographical scope in the regional units of Thessaloniki and Kozani, with the potential to be further extended to neighboring areas. It integrates unique data on local crops, facilitating comprehensive farmland management. It is anticipated that this process will encourage farmers to adopt profitable and efficient crop varieties while preserving the existing ones, aligning with new cross-compliance requirements. Future studies will evaluate the model’s long-term impact on sustainable land use.

Author Contributions

Methodology, T.B.; software, A.T.; validation, C.M., C.K., A.K. and E.D.; formal analysis, A.K. and C.M.; data curation, A.P.; writing—original draft preparation, A.P. and E.L.; writing—review and editing, T.B.; visualization, A.T.; supervision, T.B.; project administration, T.B. All authors have read and agreed to the published version of the manuscript.

Funding

This research was funded by the Rural Development Program (RDP) and is co-financed by the European Agricultural Fund for Rural Development (EAFRD) and Greece, grant numbers M16ΣΥN2-00056 and M16ΣΥN2-00059.

Data Availability Statement

The original contributions presented in this study are included in the article material. Further inquiries can be directed to the corresponding author.

Acknowledgments

We would like to thank K. Tafidou for her valuable assistance in editing the figures.

Conflicts of Interest

The authors declare no conflicts of interest.

Abbreviations

The following abbreviations are used in this manuscript:
VCVariable Cost
GMGross Margin
LABLabor Use
FERFertilizer Use
WATWater Use

References

  1. Aznar-Sánchez, J.A.; Velasco-Muñoz, J.F.; López-Felices, B.; Román-Sánchez, I.M. An Analysis of Global Research Trends on Greenhouse Technology: Towards a Sustainable Agriculture. Int. J. Environ. Res. Public Health 2020, 17, 664. [Google Scholar] [CrossRef]
  2. Nelson, G.C.; Rosegrant, M.W.; Palazzo, A.; Gray, I.; Ingersoll, C.; Robertson, R. Food Security, Farming, and Climate Change to 2050: Scenarios, Results, Policy Options; International Food Policy Research Institute: Washington, DC, USA, 2010. [Google Scholar]
  3. Velasco-Muñoz, J.F.; Mendoza, J.M.F.; Aznar-Sánchez, J.A.; Gallego-Schmid, A. Circular Economy Implementation in the Agricultural Sector: Definition, Strategies and Indicators. Resour. Conserv. Recycl. 2021, 170, 105618. [Google Scholar] [CrossRef]
  4. Mohamad, R.S.; Verrastro, V.; Cardone, G.; Bteich, M.R.; Favia, M.; Moretti, M.; Roma, R. Optimization of Organic and Conventional Olive Agricultural Practices from a Life Cycle Assessment and Life Cycle Costing Perspectives. J. Clean. Prod. 2014, 70, 78–89. [Google Scholar] [CrossRef]
  5. Esposito, B.; Sessa, M.R.; Sica, D.; Malandrino, O. Towards Circular Economy in the Agri-Food Sector. A Systematic Literature Review. Sustainability 2020, 12, 7401. [Google Scholar] [CrossRef]
  6. Sanchi, I.D.; Alhassan, Y.J.; Sabo, A.Y. Rising Costs of Farm Inputs and Its Implication on 2022 Wet Season Farming in Northwest Sub Region of Nigeria. Off. Publ. Direct Res. J. Agric. Food Sci. 2022, 10, 144–150. [Google Scholar] [CrossRef]
  7. Geissdoerfer, M.; Savaget, P.; Bocken, N.M.P.; Hultink, E.J. The Circular Economy—A New Sustainability Paradigm? J. Clean. Prod. 2017, 143, 757–768. [Google Scholar] [CrossRef]
  8. Common Agricultural Policy 2023–2027. Available online: https://www.consilium.europa.eu/en/policies/cap-funding-rules-2023-2027/ (accessed on 22 March 2025).
  9. Jongeneel, R.; Gonzalez-Martinez, A. Implementing the EU Eco-Scheme in the Netherlands: A Results-Based Points System Approach. EuroChoices 2023, 22, 20–27. [Google Scholar] [CrossRef]
  10. Zieliński, M.; Józwiak, W.; Żak, A.; Rokicki, T. Development of Eco-Schemes as an Important Environmental Measure in Areas Facing Natural or Other Specific Constraints Under the Common Agriculture Policy 2023–2027: Evidence from Poland. Sustainability 2025, 17, 2781. [Google Scholar] [CrossRef]
  11. Galioto, F.; Nino, P. Investigating the Reasons behind the Choice to Promote Crop Diversification Practices through the New CAP Reform in Europe. Land Use Policy 2023, 133, 106861. [Google Scholar] [CrossRef]
  12. European Commission. Approved 28 CAP Strategic Plans (2023–2027): Summary Overview for 27 Member States; European Union: Brussels, Belgium, 2023. [Google Scholar]
  13. da S. Alves, S.A.F.; Coelho, V.H.R.; Tsuyuguchi, B.B.; de O. Galvão, C.; Rêgo, J.C.; Almeida, C.D.N.; Abels, A.; Pinnekamp, J.; Rufino, I.A.A. Spatial Multicriteria Approach to Support Water Resources Management with Multiple Sources in Semi-Arid Areas in Brazil. J. Environ. Manag. 2021, 297, 113399. [Google Scholar] [CrossRef]
  14. Radmehr, A.; Bozorg-Haddad, O.; Loáiciga, H.A. Developing Strategies for Agricultural Water Management of Large Irrigation and Drainage Networks with Fuzzy MCDM. Water Resour. Manag. 2022, 36, 4885–4912. [Google Scholar] [CrossRef]
  15. Hayashi, K. Multicriteria Analysis for Agricultural Resource Management: A Critical Survey and Future Perspectives. Eur. J. Oper. Res. 2000, 122, 486–500. [Google Scholar] [CrossRef]
  16. Lombardi, P.; Todella, E. Multi-Criteria Decision Analysis to Evaluate Sustainability and Circularity in Agricultural Waste Management. Sustainability 2023, 15, 14878. [Google Scholar] [CrossRef]
  17. Kouriati, A.; Tafidou, A.; Lialia, E.; Prentzas, A.; Moulogianni, C.; Dimitriadou, E.; Bournaris, T. A Multicriteria Decision Analysis Model for Optimal Land Uses: Guiding Farmers under the New European Union’s Common Agricultural Policy (2023–2027). Land 2024, 13, 788. [Google Scholar] [CrossRef]
  18. Vogdrup-Schmidt, M.; Olsen, S.B.; Dubgaard, A.; Kristensen, I.T.; Jørgensen, L.B.; Normander, B.; Ege, C.; Dalgaard, T. Using Spatial Multi-Criteria Decision Analysis to Develop New and Sustainable Directions for the Future Use of Agricultural Land in Denmark. Ecol. Indic. 2019, 103, 34–42. [Google Scholar] [CrossRef]
  19. Chatzinikolaou, P.; Viaggi, D.; Raggi, M. Review of Multicriteria Methodologies and Tools for the Evaluation of the Provision of Ecosystem Services. Multicriteria Anal. Agric. 2018, 43–68. [Google Scholar] [CrossRef]
  20. Bartolini, F.; Gallerani, V.; Raggi, M.; Viaggi, D. Water Management and Irrigated Agriculture in Italy: Multicriteria Analysis of Alternative Policy Scenarios. Water Policy 2009, 12, 135–147. [Google Scholar] [CrossRef]
  21. Neto, J.; Cunha, M. Agricultural Sustainability Assessment Using Multicriteria Indicators and Hierarchical Tools—A Review. Int. J. Sustain. Agric. Manag. Inform. 2020, 6, 381–400. [Google Scholar] [CrossRef]
  22. Arriaza, M.; Gomez-Limon, J.A.; Upton, M. Local Water Markets for Irrigation in Southern Spain: A Multicriteria Approach. Aust. J. Agric. Resour. Econ. 2002, 46, 21–43. [Google Scholar] [CrossRef]
  23. Bruzzese, S.; Blanc, S.; Novelli, S.; Brun, F. A Multicriteria Analysis to Support Natural Resource Governance: The Case of Chestnut Forests. Resources 2023, 12, 40. [Google Scholar] [CrossRef]
  24. Cohen, B.; Blanco, H.; Dubash, N.K.; Dukkipati, S.; Khosla, R.; Scrieciu, S.; Stewart, T.; Torres-Gunfaus, M. Multi-Criteria Decision Analysis in Policy-Making for Climate Mitigation and Development. Clim. Dev. 2019, 11, 212–222. [Google Scholar] [CrossRef]
  25. Riesgo, L.; Gómez-Limón, J.A. Multi-Criteria Policy Scenario Analysis for Public Regulation of Irrigated Agriculture. Agric. Syst. 2006, 91, 1–28. [Google Scholar] [CrossRef]
  26. CAP Strategic Plan of Greece 2023–2027. Available online: https://www.minagric.gr/2013-04-05-10-13-09/ministry-example/diavoylefsi-i-kap-meta-to-2020-list/12311-kap2023-2027-130122 (accessed on 2 February 2024).
  27. Moulogianni, C. Comparison of Selected Mathematical Programming Models Used for Sustainable Land and Farm Management. Land 2022, 11, 1293. [Google Scholar] [CrossRef]
  28. Prentzas, A.; Nastis, S.A.; Moulogianni, C.; Kouriati, A. Technical and Economic Analysis of Farms Cultivating Cereals and Legumes: A Greek Case Study. Int. J. Sustain. Agric. Manag. Inform. 2022, 8, 446. [Google Scholar] [CrossRef]
  29. Moulogianni, C.; Bournaris, T. Assessing the Impacts of Rural Development Plan Measures on the Sustainability of Agricultural Holdings Using a PMP Model. Land 2021, 10, 446. [Google Scholar] [CrossRef]
  30. Romero, C.; Amador, F.; Barco, A. Multiple Objectives in Agricultural Planning: A Compromise Programming Application. Am. J. Agric. Econ. 1987, 69, 78–86. [Google Scholar] [CrossRef]
  31. Gómez-Limón, J.A.; Berbel, J. Multicriteria Analysis of Derived Water Demand Functions: A Spanish Case Study. Agric. Syst. 2000, 63, 49–72. [Google Scholar] [CrossRef]
  32. Amador, F.; Sumpsi, J.M.; Romero, C. A Non-Interactive Methodology to Assess Farmers’ Utility Functions: An Application to Large Farms in Andalusia, Spain. Eur. Rev. Agric. Econ. 1998, 25, 92–102. [Google Scholar] [CrossRef]
  33. Sumpsi, J.M.; Amador, F.; Romero, C. On Farmers’ Objectives: A Multi-Criteria Approach. Eur. J. Oper. Res. 1997, 96, 64–71. [Google Scholar] [CrossRef]
  34. Romero, C. Handbook of Critical Issues in Goal Programming; Pergamon Press: Oxford, UK, 1991; ISBN 9780080406619. [Google Scholar]
  35. Romero, C.; Rehman, T. Natural Resource Management and the Use of Multiple Criteria Decision-Making Techniques: A Review. Eur. Rev. Agric. Econ. 1987, 14, 61–89. [Google Scholar] [CrossRef]
  36. Dinar, A. Challenges to Water Resource Management: The Role of Economic and Modeling Approaches. Water 2024, 16, 610. [Google Scholar] [CrossRef]
  37. Rosato, P.; Stellin, G. Fourth Minnesota Padova Conference on Food, Agriculture, and the Environment SESSION V: AGRICULTURAL AND ENVIRONMENTAL HAZARDS PAPER 4: MULTI CRITERIA ANALYSIS IN FARM MANAGEMENT FOLLOWING THE COMMON AGRICULTURAL POLICY REFORM: AN APPLICATION OF MULTI-OBJECTIVE INTEGER LINEAR PROGRAMMING. University of Minnesota, Center for International Food and Agricultural Policy. 1995. Available online: https://ideas.repec.org/p/ags/umciwp/14414.html (accessed on 12 August 2025).
  38. López-Baldovin, M.J.; Gutiérrez-Martin, C.; Berbel, J. Multicriteria and Multiperiod Programming for Scenario Analysis in Guadalquivir River Irrigated Farming. J. Oper. Res. Soc. 2006, 57, 499–509. [Google Scholar] [CrossRef]
  39. Pret, V.; Falconnier, G.N.; Affholder, F.; Corbeels, M.; Chikowo, R.; Descheemaeker, K. Farm Resilience to Climatic Risk. A Review. Agron. Sustain. Dev. 2025, 45, 10. [Google Scholar] [CrossRef]
  40. Zheng, H.; Ma, W.; He, Q. Climate-Smart Agricultural Practices for Enhanced Farm Productivity, Income, Resilience, and Greenhouse Gas Mitigation: A Comprehensive Review. Mitig. Adapt. Strateg. Glob. Chang. 2024, 29, 28. [Google Scholar] [CrossRef]
  41. Bonnet, C.; Gaudio, N.; Alletto, L.; Raffaillac, D.; Bergez, J.E.; Debaeke, P.; Gavaland, A.; Willaume, M.; Bedoussac, L.; Justes, E. Design and Multicriteria Assessment of Low-Input Cropping Systems Based on Plant Diversification in Southwestern France. Agron. Sustain. Dev. 2021, 41, 65. [Google Scholar] [CrossRef]
  42. Acs, S.; Berentsen, P.B.M.; Huirne, R.B.M. Conversion to Organic Arable Farming in The Netherlands: A Dynamic Linear Programming Analysis. Agric. Syst. 2007, 94, 405–415. [Google Scholar] [CrossRef]
  43. Rahmat, S.R.; Khan, H.H.; Radin, R.F.B.; Mohamad, M.F.; Samsurijan, M.S. A Review of Organic Agriculture Industry in Malaysia and Gross Margin between Organic and Conventional Plantation. J. Contemp. Issues Bus. Gov. 2021, 27. [Google Scholar] [CrossRef]
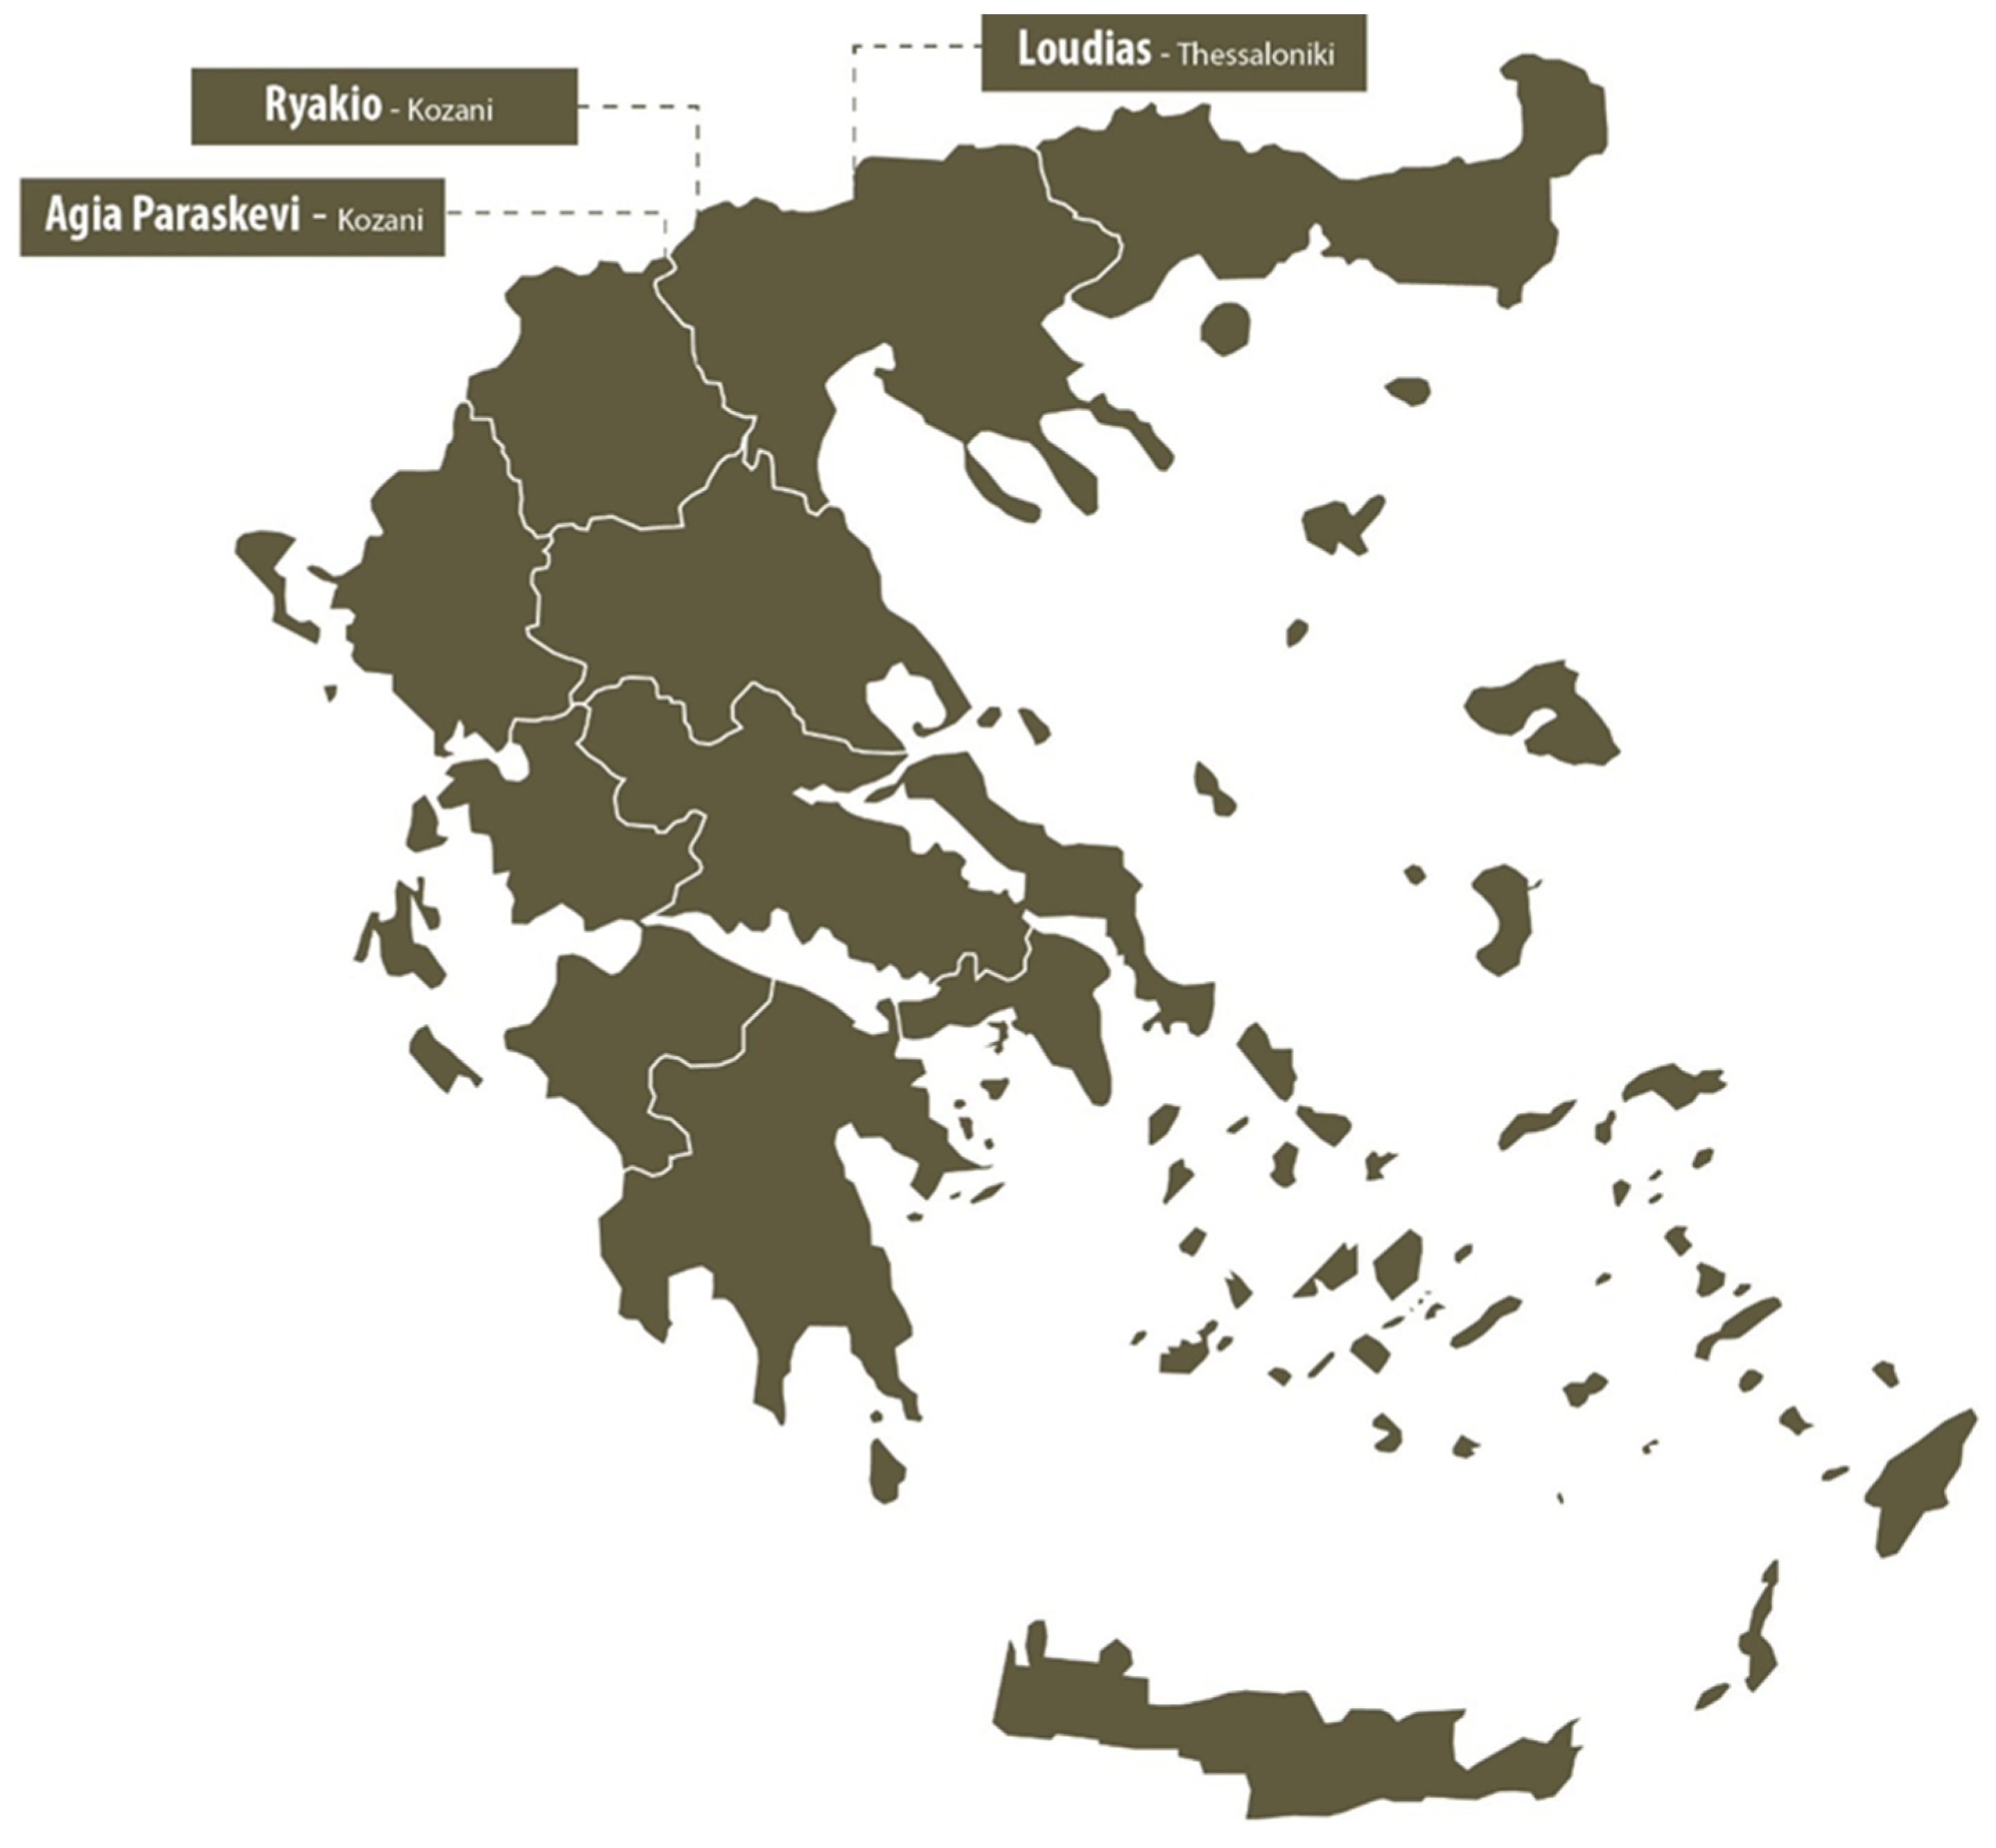
Figure 1. Geographic representation of the location of the three farmer groups. The study area.
Land 14 01658 g001
Figure 2. Graphical representation of the MCDA model structure.
Land 14 01658 g002
Figure 3. Crop distribution in the Loudias farmer group based on the current crop plan.
Land 14 01658 g003
Figure 4. Crop configuration for the Loudias farmer group based on MCDA model results.
Land 14 01658 g004
Figure 5. Comparative visualization of current and MCDA crop plans for Loudias farmer group.
Land 14 01658 g005
Figure 6. Changes in gross margin, labor, and input use between current and MCDA crop plans for Loudias farmer group.
Land 14 01658 g006
Figure 7. Crop distribution in the Agia Paraskevi farmer group based on current crops.
Land 14 01658 g007
Figure 8. Crop configuration for the Agia Paraskevi farmer group based on MCDA model results.
Land 14 01658 g008
Figure 9. Comparative visualization of current and MCDA crop plans for Agia Paraskevi farmer group.
Land 14 01658 g009
Figure 10. Changes in gross margin, labor, and input use between current and MCDA crop plans for Agia Paraskevi farmer group.
Land 14 01658 g010
Figure 11. Crop distribution in the Ryakio farmer group based on the current crop plan.
Land 14 01658 g011
Figure 12. Crop configuration for the Ryakio farmer group based on MCDA model results.
Land 14 01658 g012
Figure 13. Comparative visualization of current and MCDA crop plans for Ryakio farmer group.
Land 14 01658 g013
Figure 14. Changes in gross margin, labor, and input use between current and MCDA crop plans for Ryakio farmer group.
Land 14 01658 g014
Table 1. Comparative allocation of cultivated land (%) for the Loudias farmer group under current and MCDA production plans.
CropHectaresCurrent Crop Plan
%
MCDA Crop Plan
%
Deviation
%
Cotton145.268.1070.92+4.14
Rice38.318.0016.28−9.56
Maize20.89.709.50−2.06
Fallow land4.01.901.48−22.11
Soft wheat3.01.401.02−27.14
Durum wheat2.00.900.80−11.11
Total213.3100.00100.00
Table 2. Comparison of objectives attained by the Loudias farmer group under current and MCDA crop plans.
CurrentMCDADeviation
%
Gross margin (EUR)22,58322,603+0.09
Variable cost (EUR)16,71516,679−0.21
Labor (hours)2022020
Fertilizer use (kg)64946400−1.45
Table 3. Comparative allocation of cultivated land (%) for the Agia Paraskevi farmer group under current and MCDA production plans.
CropHectaresCurrent Crop Plan
%
MCDA Crop Plan
%
Deviation
%
Durum wheat107.942.9045.686.48
Barley27.611.0013.0518.60
Canola12.24.904.77−2.80
Tritordeum27.310.9010.35−5.13
Soft wheat28.711.406.09−46.57
Chickpeas14.65.805.922.06
Fallow land8.43.304.1926.96
Barley (organic)24.69.809.951.50
Total251.3100.00100.00
Table 4. Comparison of objectives attained by the Agia Paraskevi farmer group under current and MCDA crop plans.
CurrentMCDADeviation
%
Gross margin (EUR)53786202+15.33
Variable cost (EUR)88678825−0.47
Labor (hours)203201−0.94
Fertilizer use (kg)33693315−1.33
Table 5. Comparative allocation of cultivated land (%) for the Ryakio farmer group under current and MCDA production plans.
CropHectaresCurrent Crop Plan
%
MCDA Crop Plan
%
Deviation
%
Durum wheat20.626.2026.912.70
Barley14.318.3021.6818.46
Corn silage6.58.205.10−37.80
Corn2.53.203.8319.68
Alfalfa hay (organic)4.25.306.3820.37
Fallow land4.86.207.4019.35
Barley (organic)6.17.803.06−60.79
Corn silage (organic)11.915.2017.8617.50
Alfalfa hay2.12.703.1918.14
Durum wheat (organic)5.46.904.59−33.47
Total78.4100.00100.00-
Table 6. Comparison of objectives attained by the Ryakio farmer group under current and MCDA crop plans.
CurrentMCDADeviation
%
Gross margin (EUR)87179429+8.18
Variable cost (EUR)84308401−0.34
Labor (hours)204196−3.58
Fertilizer use (kg)33643233−3.87
Water use (m3)16,62116,524−0.58
Disclaimer/Publisher’s Note: The statements, opinions and data contained in all publications are solely those of the individual author(s) and contributor(s) and not of MDPI and/or the editor(s). MDPI and/or the editor(s) disclaim responsibility for any injury to people or property resulting from any ideas, methods, instructions or products referred to in the content.