Article

Blue–Green Infrastructure Network Planning in Urban Small Watersheds Based on Water Balance

Department of Landscape Architecture, School of Architecture, Southeast University, Nanjing 210000, China
*
Author to whom correspondence should be addressed.
Land 2025, 14(8), 1652; https://doi.org/10.3390/land14081652
Submission received: 24 June 2025 / Revised: 29 July 2025 / Accepted: 7 August 2025 / Published: 15 August 2025
(This article belongs to the Section Urban Contexts and Urban-Rural Interactions)

Abstract

The rapid expansion of urbanization and inadequate planning have triggered a water balance crisis in many cities, manifesting as both the need for artificial lake supplementation and frequent urban flooding. Using the Xuanwu Lake watershed in Nanjing as a case study, this research aims to optimize the Blue–Green Infrastructure (BGI) network to maximize rainfall utilization within the watershed. The ultimate goal is to restore natural water balance processes and reduce reliance on artificial supplementation while mitigating urban flood risks. First, the Soil Conservation Service Curve Number (SCS–CN) model is employed to estimate the maximum potential of natural convergent flow within the watershed. Second, drawing on landscape connectivity theory, a multi-level BGI network optimization model is developed by integrating the Minimum Cumulative Resistance (MCR) model and the gravity model, incorporating both hydrological connectivity and flood safety considerations. Third, a water balance model based on the Storm Water Management Model (SWMM) framework and empirical formulas is constructed and coupled with the network optimization model to simulate and evaluate water budget performance under optimized scenarios. The results indicate that the optimized scheme can reduce artificial supplementation to Xuanwu Lake by 62.2% in June, while also ensuring effective supplementation throughout the year. Annual runoff entering the lake reaches 13.25 million cubic meters, meeting approximately 13% of the current annual supplementation demand. Moreover, under a 100-year return period flood scenario, the optimized network reduces total watershed flood volume by 35% compared to pre-optimization conditions, with flood-prone units experiencing reductions exceeding 50%. These findings underscore the optimized BGI network scheme’s capacity to reallocate rainwater resources efficiently, promoting a transition in urban water governance from an “engineering-dominated” approach to an “ecology-oriented and self-regulating” paradigm.

1. Introduction

Sustainable water resource management is a core component of the 17 United Nations Sustainable Development Goals. Water security and the health of aquatic ecosystems have become critical factors influencing urban well-being and ecological stability [1,2,3,4,5]. However, rapid urbanization and inadequate planning have led to multiple water-related challenges, including water quality deterioration, urban flooding, and water shortages in lakes and rivers [6,7,8]. Urban river–lake systems are experiencing severe hydrological imbalances. On one hand, polluted river runoff is intercepted and diverted to wastewater treatment plants, resulting in declining water levels in natural water bodies [9]. On the other hand, in efforts to mitigate flood risks, large volumes of stormwater are rapidly discharged out of the watershed via drainage pipelines, preventing the effective utilization of rainwater resources [10]. To maintain the water quality and quantity of urban lakes, many Chinese cities have implemented inter-watershed water diversion projects. However, these engineering-based measures are not only costly and temporary in their effectiveness, but also carry potential ecological risks [11]. To address these interrelated hydrological challenges, this study introduces the concept of Blue–Green Infrastructure (BGI) as a strategic planning framework.
BGI is an overarching planning term closely associated with the concept of Green Infrastructure (GI) [12], and its usage has grown significantly in recent years [13]. According to the European Commission (EC), BGI refers to a strategically planned network of natural and semi-natural areas composed of blue and green spaces, designed to provide a wide range of ecosystem services [14]. This concept emphasizes both the composite structure and the networked characteristics of BGI. It comprises various landscape elements [15] and can be classified geometrically into linear and areal forms [16]. Linear infrastructure primarily serves as corridors that connect ecological patches, while areal infrastructure consists of diverse land use types. At the regional scale, linear components generally include green corridors and rivers [17], whereas typical areal components include urban green spaces such as forests, farmlands, shrubs, and grasslands, as well as lakes, ponds, and wetlands [18]. At the local scale, green infiltration trenches and green streets often function as connecting elements [19]. Areal facilities exhibit high diversity, including green roofs, rain gardens, storage ponds, bioswales, and green walls, among others [20]. Given that one of the primary objectives of this study is to improve hydrological connectivity within small urban watersheds, particular attention is given to the spatial layout and configuration of linear infrastructures such as rivers, riparian green corridors, and green infiltration trenches.
The imbalance of water quantity in urban small watersheds, reflected in phenomena such as river and lake water shortages and urban pluvial flooding, can be mitigated by restoring the natural convergence of stormwater flows [21]. To effectively harness stormwater as a resource, a well-structured surface drainage system is essential for channeling rainfall into natural water bodies [22]. The development of an integrated Blue–Green Infrastructure (BGI) network offers a promising solution [23], as it enhances surface drainage and improves hydrological connectivity along runoff pathways within the catchment [24]. Previous studies have shown that restoring hydrological connectivity directly facilitates the natural recharge of rivers and lakes [25]. For instance, the addition of five connecting channels to the urban water system was found to increase lake inflow by 33% [26], and both lake storage and water quality have been observed to respond sensitively to variations in surface hydrological connectivity [27]. It has been reported that reduced lake inflow can lead to the shrinkage of lake areas and disrupt the overall water balance of the basin [28].. Increasing lake inflow is considered a key strategy to address such imbalances [29]. Based on this context, this study proposes a central hypothesis: a well-planned BGI network has the potential to restore the natural convergence of rainfall toward lakes by reshaping hydrological connectivity within the watershed. This process may ultimately promote water balance in lake watersheds and support the ecological and hydrological sustainability of urban watershed systems. Nevertheless, directly relevant research remains limited in the Web of Science database, indicating an urgent need for further in-depth exploration. To gain a comprehensive understanding of recent developments in this field, this study conducts a focused literature review around two core themes: (1) optimization methods for stormwater management networks based on Blue–Green Infrastructure (BGI), and (2) water balance modeling of urban artificial lakes.
In the optimization of BGI networks for urban stormwater management, the theory of landscape connectivity provides a critical theoretical foundation for spatial layout strategies [30]. Methods for constructing ecological networks, such as the Minimum Cumulative Resistance (MCR) model [31] and circuit theory-based models [32], have been widely applied in the spatial optimization of BGI networks. By integrating factors such as slope, elevation, and land use types [33], researchers have developed various landscape resistance surfaces. The functional objectives of BGI networks have expanded from ecological conservation to encompass flood safety and efficient water resource utilization [34,35]. Existing studies suggest that improving BGI network connectivity not only supports ecological system integrity but also substantially strengthens regional stormwater management capacity [36]. However, existing optimization efforts remain confined to spatial structural design, lacking quantitative evaluations of optimization benefits [37]. Moreover, they often fail to integrate effectively with water balance processes, making it difficult to accurately reflect the regulatory impact of BGI network optimization on hydrological dynamics.
In addition, several critical considerations must be addressed in the optimization of BGI networks. While enhancing the connectivity of “blue” infrastructure can promote natural water recharge, it may also introduce additional flood risks [38], particularly in urban areas where artificial lakes and water systems are responsible for both water storage and drainage. Excessive inflows may lead to overflow hazards in such contexts [39]. Therefore, optimizing the BGI network requires a careful balance between improving hydrological connectivity and ensuring regional flood safety. Efforts should aim to increase inflows to urban lakes while maintaining flood resilience. Moreover, a multi-scalar BGI network should be established to ensure cross-scale connectivity and to achieve multiple optimization objectives simultaneously [30]. At the watershed scale, connecting large, continuous natural BGI components can maximize stormwater regulation functions [40]. However, in densely built-up areas, the detention potential of small, decentralized BGI elements remains underexplored [41]. Some of these facilities are located within flood-prone hotspots, where improved connectivity can significantly mitigate local flooding [42]. To address this gap, BGI elements within these hotspots were identified and mapped, then interconnected and integrated into the broader watershed-scale BGI network. This integration not only increases the volume of natural inflows to urban lakes but also alleviates localized pluvial flooding.
Overall, the optimization of BGI networks can alter watershed runoff pathways and inflow patterns to rivers and lakes, thereby significantly changing key input parameters of lake water balance models. However, most existing models have not fully incorporated runoff variations induced by BGI spatial optimization, limiting their ability to dynamically reflect the natural water supply benefits of optimized networks [43,44,45,46,47,48,49]. Currently, there is a substantial body of research on the water balance processes of urban lakes, particularly with regard to water supplementation strategies and water volume accounting methods [43]. Existing water balance models often account for multiple factors, including regional climate conditions [44], economic capacity [45], ecological water demand [46], and hydrodynamic characteristics of river networks [47], all of which offer valuable references for the present study. In practice, some studies treat current runoff inflow as a fixed input to the water balance equation, overlooking the potential of BGI optimization to enhance natural inflows [48]. Others estimate total runoff using runoff coefficients and assume that the entire volume contributes directly to lake inflow, resulting in significant discrepancies from actual hydrological conditions [49]. Therefore, accurately quantifying the incremental contribution of BGI optimization to natural water supply remains a pressing scientific challenge. This requires integrating BGI network optimization with a water balance model to establish a system capable of dynamically responding to variations in water volume, thereby supporting evidence-based urban water resource management.
To bridge the identified research gap and address the practical challenges, this study proposes a methodological framework for optimizing BGI networks in urban small watersheds, with a primary focus on achieving water balance. The framework comprises three interconnected components: (1) A multi-level optimization model of the BGI network was developed, integrating considerations of hydrological connectivity and flood safety to systematically identify connectivity corridors at various levels and corresponding spatial configuration strategies. (2) A water balance model for urban artificial lakes is developed by integrating the Storm Water Management Model (SWMM) with empirically calibrated equations to quantify dynamic changes in lake inflows and outflows. (3) The Xuanwu Lake small watershed in Nanjing is selected as the case study area, wherein the spatial BGI optimization model is coupled with the water balance model. The regulatory potential of the BGI network in maintaining water balance is systematically assessed, with a particular focus on its effectiveness in reducing artificial water supplementation and enhancing system resilience. Based on the findings, this study proposes practical strategies to provide technical pathways and informed decision-making support for complex urban hydrological systems.

2. Case Study

2.1. Overview of the Study Area

Nanjing is located in Jiangsu Province (Figure 1a,b), China, between 31°14′–32°37′ N and 118°22′–119°14′ E. The city experiences a typical northern subtropical monsoon climate, characterized by four distinct seasons and abundant precipitation. The Comprehensive Drainage and Flood Control Planning for the Central Urban Area of Nanjing City provides essential meteorological data, including rainfall and evaporation. Long-term meteorological records indicate that the average annual rainfall is approximately 1059.8 mm, with nearly 70% falling during the flood season from May to September. Frequent occurrences of intense short-duration rainstorms further exacerbate the region’s hydrological challenges. The historical maximum annual rainfall reaches 1713.9 mm, while the long-term average annual evaporation is about 1500 mm, and the average annual water surface evaporation is around 884.3 mm. In Nanjing, the rational utilization and management of rainwater resources has become a major challenge for urban development, particularly against the backdrop of frequent flooding and increasing local water scarcity.
Urban small watersheds are hydrological units formed by the closed drainage boundaries within a certain geographical space, with urban small watershed divides as the framework. The hydrological processes within the units are relatively independent, and the water balance process is relatively complete. Within the city’s broader hydrological context, selecting a representative small watershed as the study area enables appropriately scaled analysis and allows for an in-depth exploration of the causes of urban hydrological issues and the identification of effective solutions. This can inform the formulation of future urban development policies in Nanjing. The Xuanwu Lake watershed covers an area of approximately 33 km2, including about 3.54 km2 of lake surface, making it the largest artificial lake in the city (Figure 1c). The surrounding terrain forms a distinct landscape structure, with Mount Zijin to the south, Mount Hongshan in the center, and Mount Mufu to the north. The topography gently slopes southwestward, forming a small watershed around the lake. Due to its specific geographical context and the disturbances caused by intensive human interventions, the watershed is simultaneously exposed to the risk of urban flooding and the challenge of insufficient lake water resources.

2.2. Current Challenges

2.2.1. Water Balance Issues in the Watershed

To systematically investigate the water volume regulation mechanism of the Xuanwu Lake watershed, this study constructs a source–sink conceptual model. In this framework, Xuanwu Lake functions as the “sink,” serving as the terminal zone where stormwater accumulates, while the surrounding high-density built-up areas are defined as the “source,” representing the primary contributors of runoff generation.
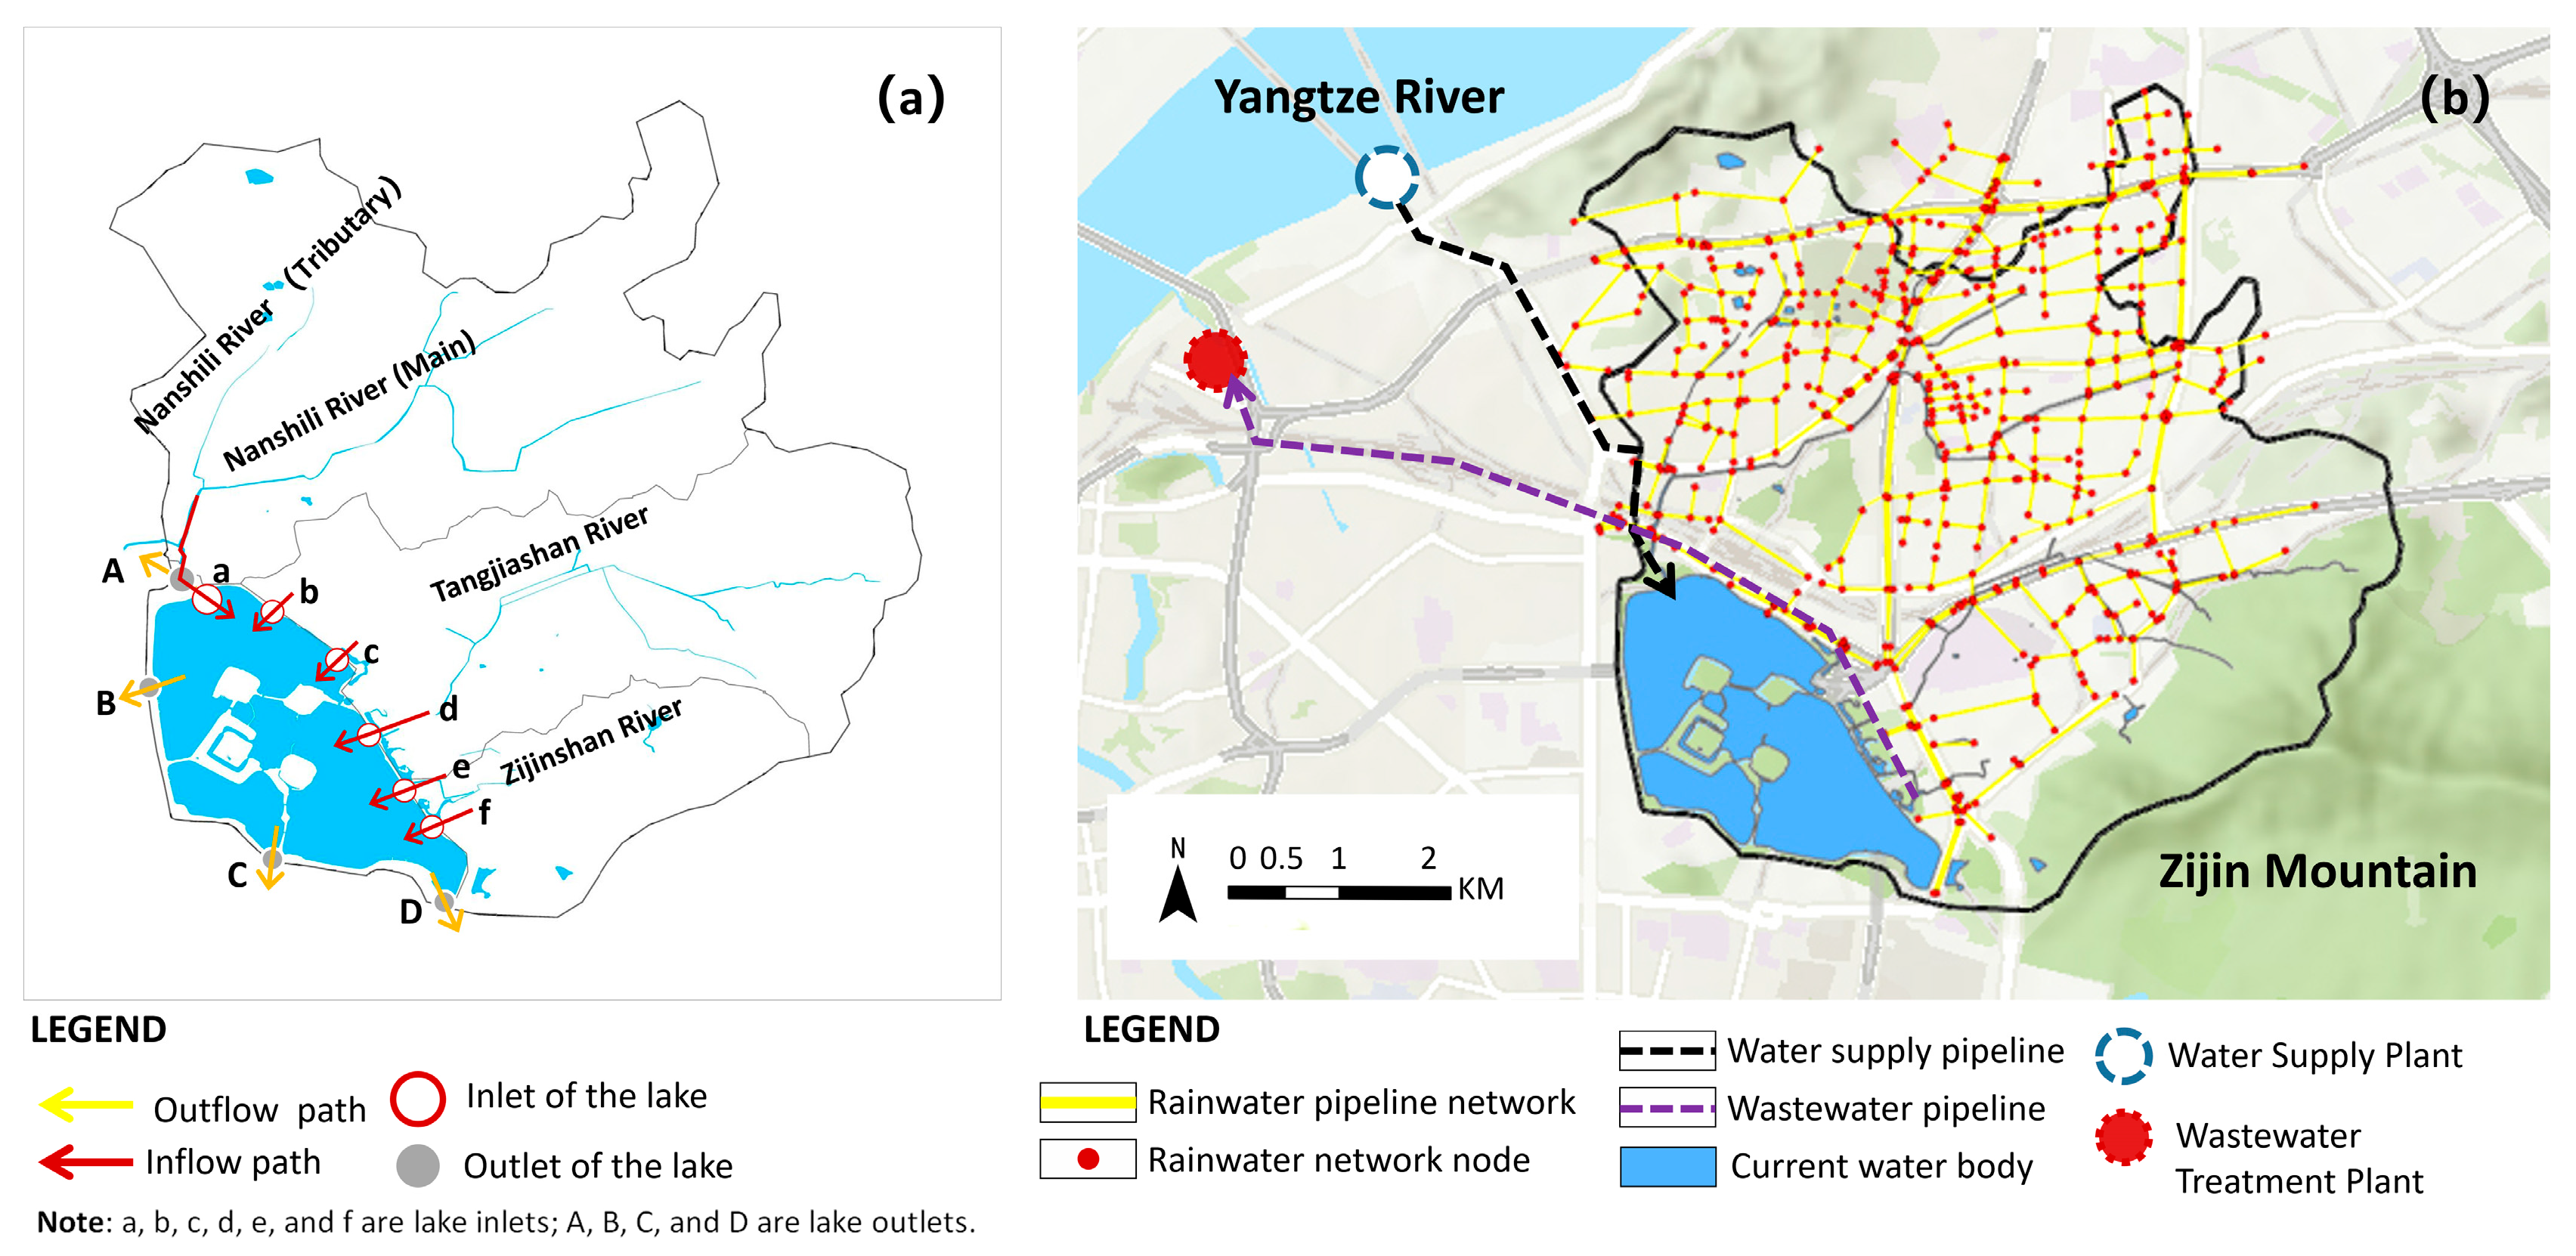
As the main receiving area within the small watershed (Figure 2a), Xuanwu Lake’s capacity for water retention and regulation has been weakened by multiple factors [39]. Firstly, although approximately 30% of green spaces and water systems remain in the areas surrounding the lake, ongoing high-intensity urban development has disrupted the natural connectivity of blue–green corridors. For example, surface runoff pathways from ecological zones such as Zijin Mountain and Mufu Mountain have been blocked, preventing effective drainage into the lake. As a result, urban flooding has become significantly more frequent in the built-up areas. Second, the inflow of runoff into the lake is restricted. There are five main inflow channels to Xuanwu Lake: Laojiting Ditch (b), Xiangliaochang Ditch (c), Tangjiashan River (d), Zijinshan River (e), and Gangzicun Ditch (f). However, to control non-point source pollution, a sewage interception system has been constructed on the eastern side of the lake (Figure 2b). As a result, most river runoff is diverted by pumping stations and pipelines to wastewater treatment plants outside the watershed, significantly reducing the lake’s natural watershed inflow. Third, changes in the flow direction of rivers within the watershed have altered hydrological connectivity. A typical example is the Nanshili River (a), which no longer supplies water to Xuanwu Lake and instead discharges directly into the northern section of the city moat. Currently, the lake primarily relies on artificial water supplementation to maintain its water level and quality, which involves engineering measures to divert water from external sources. The artificial supplementation of Xuanwu Lake mainly comes from the mainstream of the Yangtze River, delivered to the lake area via underground pipelines, with a daily transfer volume of up to 280,000 m3. The water diversion route is illustrated in Figure 2b.
Secondly, Xuanwu Lake functions not only as a watershed for rainwater runoff but also as a critical component of the urban drainage system. Excess supplementation water is discharged through the lake, serving as a key water source for downstream urban river networks. The main outflow routes from the lake include (1) through the western He’ping Gate and Dashugen Gate into Moat A and Jinchuan River B, eventually flowing into the Yangtze River; and (2) through the southeastern Wumiao Gate C and Taipingmen Gate D into the Pearl River and Yudai River, which discharge into the Qinhuai River. The outflow plays a crucial role in maintaining the dynamic balance of water quantity and quality within the urban area. Based on these conditions, the water balance of Xuanwu Lake involves two aspects. First, within any return period and time interval, the lake’s storage should be regulated between its verified maximum and minimum control levels. Second, when expanded to a broader hydrological system, the lake’s water exchange must ensure adequate downstream flow to support hydraulic stability and maintain water quality throughout the river network.

2.2.2. Limitations of High-Density Development on BGI Network

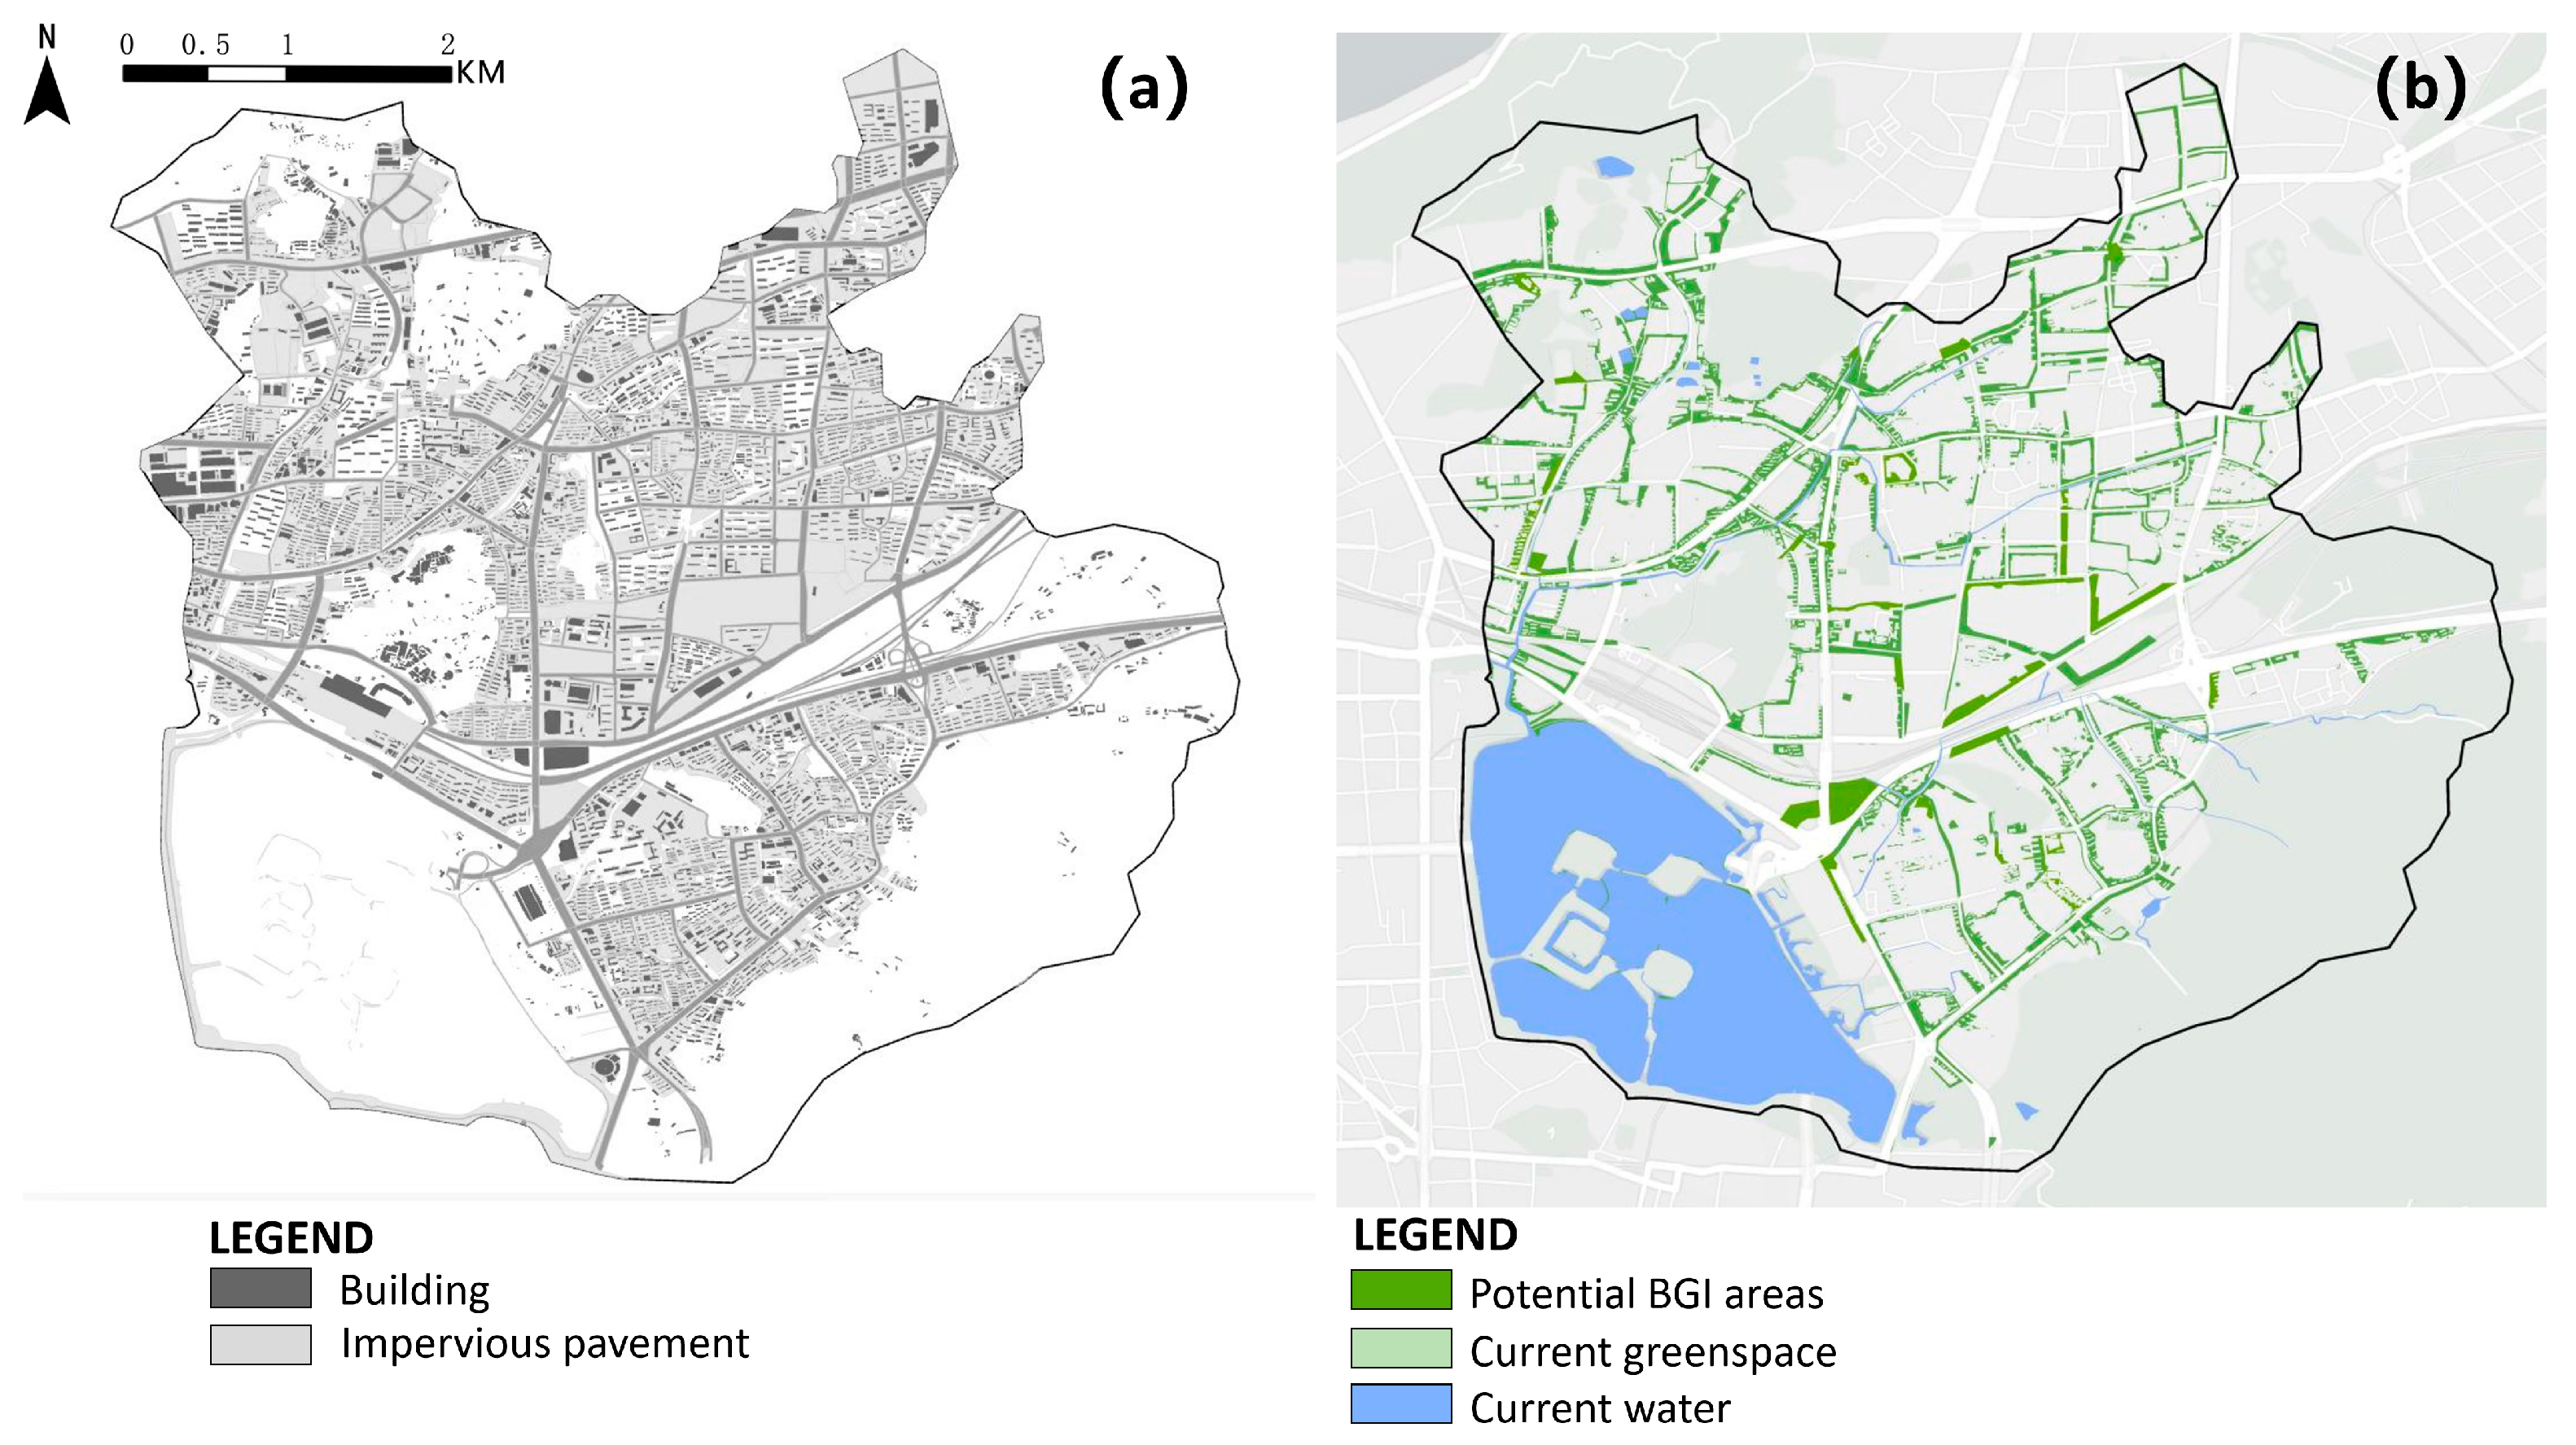
Excluding the natural forest areas of Zijinshan, the impervious rate within the built-up source region is approximately 77%. It is characterized by dense buildings and impervious surfaces, resulting in a highly compact urban form (Figure 3a). Moreover, most of the currently undeveloped plots are planned for future residential or commercial use, which is expected to further increase building density and reduce the available space for BGI deployment. This high-density pattern poses significant challenges to the planning of BGI corridors. Therefore, the construction of a BGI network must not only respond to ecological and hydrological challenges but also fully consider the practical constraints imposed by spatial conditions and development intensity.
Guided by urban regeneration theory, the embedded deployment of BGI networks within high-density built-up areas is considered a feasible strategy [50]. Although restoring BGI networks in such contexts is challenging, it is not unattainable. An assessment of existing spatial resources (Figure 3b) indicates that certain green spaces have strong potential for transformation and can accommodate the construction of new river corridors. Additionally, many street-adjacent spaces exhibit high levels of accessibility and spatial continuity, making them suitable for the development of small- to medium-scale BGI corridors to enhance the connectivity and functionality of the urban BGI network. In summary, reconstructing a multi-level BGI network at the small watershed scale presents both challenges and opportunities. This study explores feasible approaches and practical strategies for BGI network construction based on the spatial characteristics of high-density urban environments.

2.3. Data Sources

The data sources utilized in this study are summarized in Table 1. Site-related information includes the digital elevation model (DEM), electronic maps, soil data, and land cover data. Hydrological data consist of stormwater drainage network information, measured river flow records, precipitation data, lake water levels, artificial water supplementation data, lakebed seepage coefficients, and urban waterlogging point locations. Hourly rainfall data for the year 2023 were obtained from the National Meteorological Science Data Center (https://data.cma.cn/site/index.html; accessed on 15 May 2024), which is publicly accessible. The referenced meteorological station in Nanjing reports an altitude of 34.4 m (from barometric pressure), while the actual ground elevation is 33.2 m. Rainfall events on 12–13 July and 16–17 September 2024 were recorded by a small automatic weather station situated at Southeast University, with the sensor mounted 1.8 m above ground level. Relevant planning documents include the Comprehensive Drainage and Flood Control Planning for the Central Urban Area of Nanjing City, the Sponge City Construction Plan of Nanjing City, and other associated policy texts.

3. Methods

This study adopts a multi-step framework to support the research argument:
  • The Soil Conservation Service Curve Number (SCS–CN) model was used to estimate the maximum potential of natural recharge from a small watershed, thereby demonstrating the hydrological value of natural runoff.
  • A network optimization model was constructed. First, the new river layout was determined using landscape connectivity indices, the Cumulative Resistance (MCR) model, and a gravity model. Second, a set of optimization constraints was analyzed, including (i) limitations on the water surface ratio; (ii) ensuring that newly added rivers do not cause flooding under a 20-year return period rainfall event; (iii) restricting the inflow velocity at lake inlets to not exceed the outflow velocity at the drainage outlet of Xuanwu Lake; and (iv) reducing flood risks in identified hotspot areas. To meet these constraints, the scale and spatial configuration of green spaces should be aligned with the blue network, ultimately forming a primary blue–green corridor system. Additionally, efforts are made to establish secondary green infiltration corridors that link decentralized Blue–Green Infrastructure (BGI) elements. This optimization process achieves a balance between enhanced hydrological connectivity and regional flood resilience.
  • A water balance model was developed by integrating empirical formulas with the Storm Water Management Model (SWMM) and was coupled with the network optimization model. The net water budget of the lake was calculated to evaluate the reduction in artificial water supplementation. The flood mitigation benefits of the BGI network were quantified based on runoff reduction within the watershed and its sub-catchments.
  • Based on insights drawn from past practices, this study proposes future blue–green spatial development strategies for urban planning.

3.1. SCS-CN Model

3.1.1. SCS-CN Model Formula

The surface runoff from source areas was estimated using the Soil Conservation Service Curve Number (SCS-CN) model (Equations (1)–(5)). The SCS-CN model was developed in the early 1950s by the U.S. Department of Agriculture’s Soil Conservation Service, based on the climatic characteristics and agricultural zoning of the United States, and is widely applied as a design flood model for small watersheds. The computational formulas and operational procedures adopted in this section are derived from Reference [51]. In the SCS-CN model, infiltration is treated in an indirect and aggregated manner. Rather than simulating infiltration as a physical process with explicit infiltration rates, the model incorporates it empirically as a component affecting runoff generation. This is reflected in the parameters of initial abstraction and potential maximum retention. The SCS-CN empirical model features a simple structure and requires only a single composite parameter—the runoff Curve Number (CN)—to estimate runoff volumes in a watershed. The CN is a dimensionless parameter ranging from 0 to 100. It reflects the characteristics of the watershed’s land surface prior to a rainfall event and is influenced by factors such as antecedent moisture condition (AMC), soil type, land use, and slope. These four factors have a significant impact on the runoff estimation results and will be analyzed in detail in the following sections.
The SCS-CN model [51] is based on the water balance equation and two fundamental assumptions. The water balance equation is given as:
P = I a + Q + F
The first assumption is that the ratio of actual runoff to the potential maximum runoff is equal to the ratio of infiltration to the potential maximum retention, expressed as:
Q P I a = F S
The second assumption states that surface runoff occurs only when the total precipitation ( P , mm) exceeds the initial abstraction ( I a , mm). It further assumes that the initial abstraction is proportional to the potential maximum retention ( S , mm), and their relationship is defined as:
I a = λ S ( 0.095 λ 0.38 )
Q is obtained based on the first three formulas.
Q = P λ S 2 P + 1 λ S P > λ S 0 P λ S
In the standard SCS-CN model, λ = 0.2. Substituting this value into Formulas (1)–(4) yields the typical SCS-CN calculation formula:
S = 25,400 C N 254
Q , runoff depth (mm); P , total precipitation (mm); S , the potential maximum retention (mm), respectively; F , the actual retention (mm); Ia, the initial abstraction (mm);   λ , the initial abstraction ratio; Curve Number (CN), a dimensionless parameter.

3.1.2. Hydrologic Soil Groups and Land Use Types

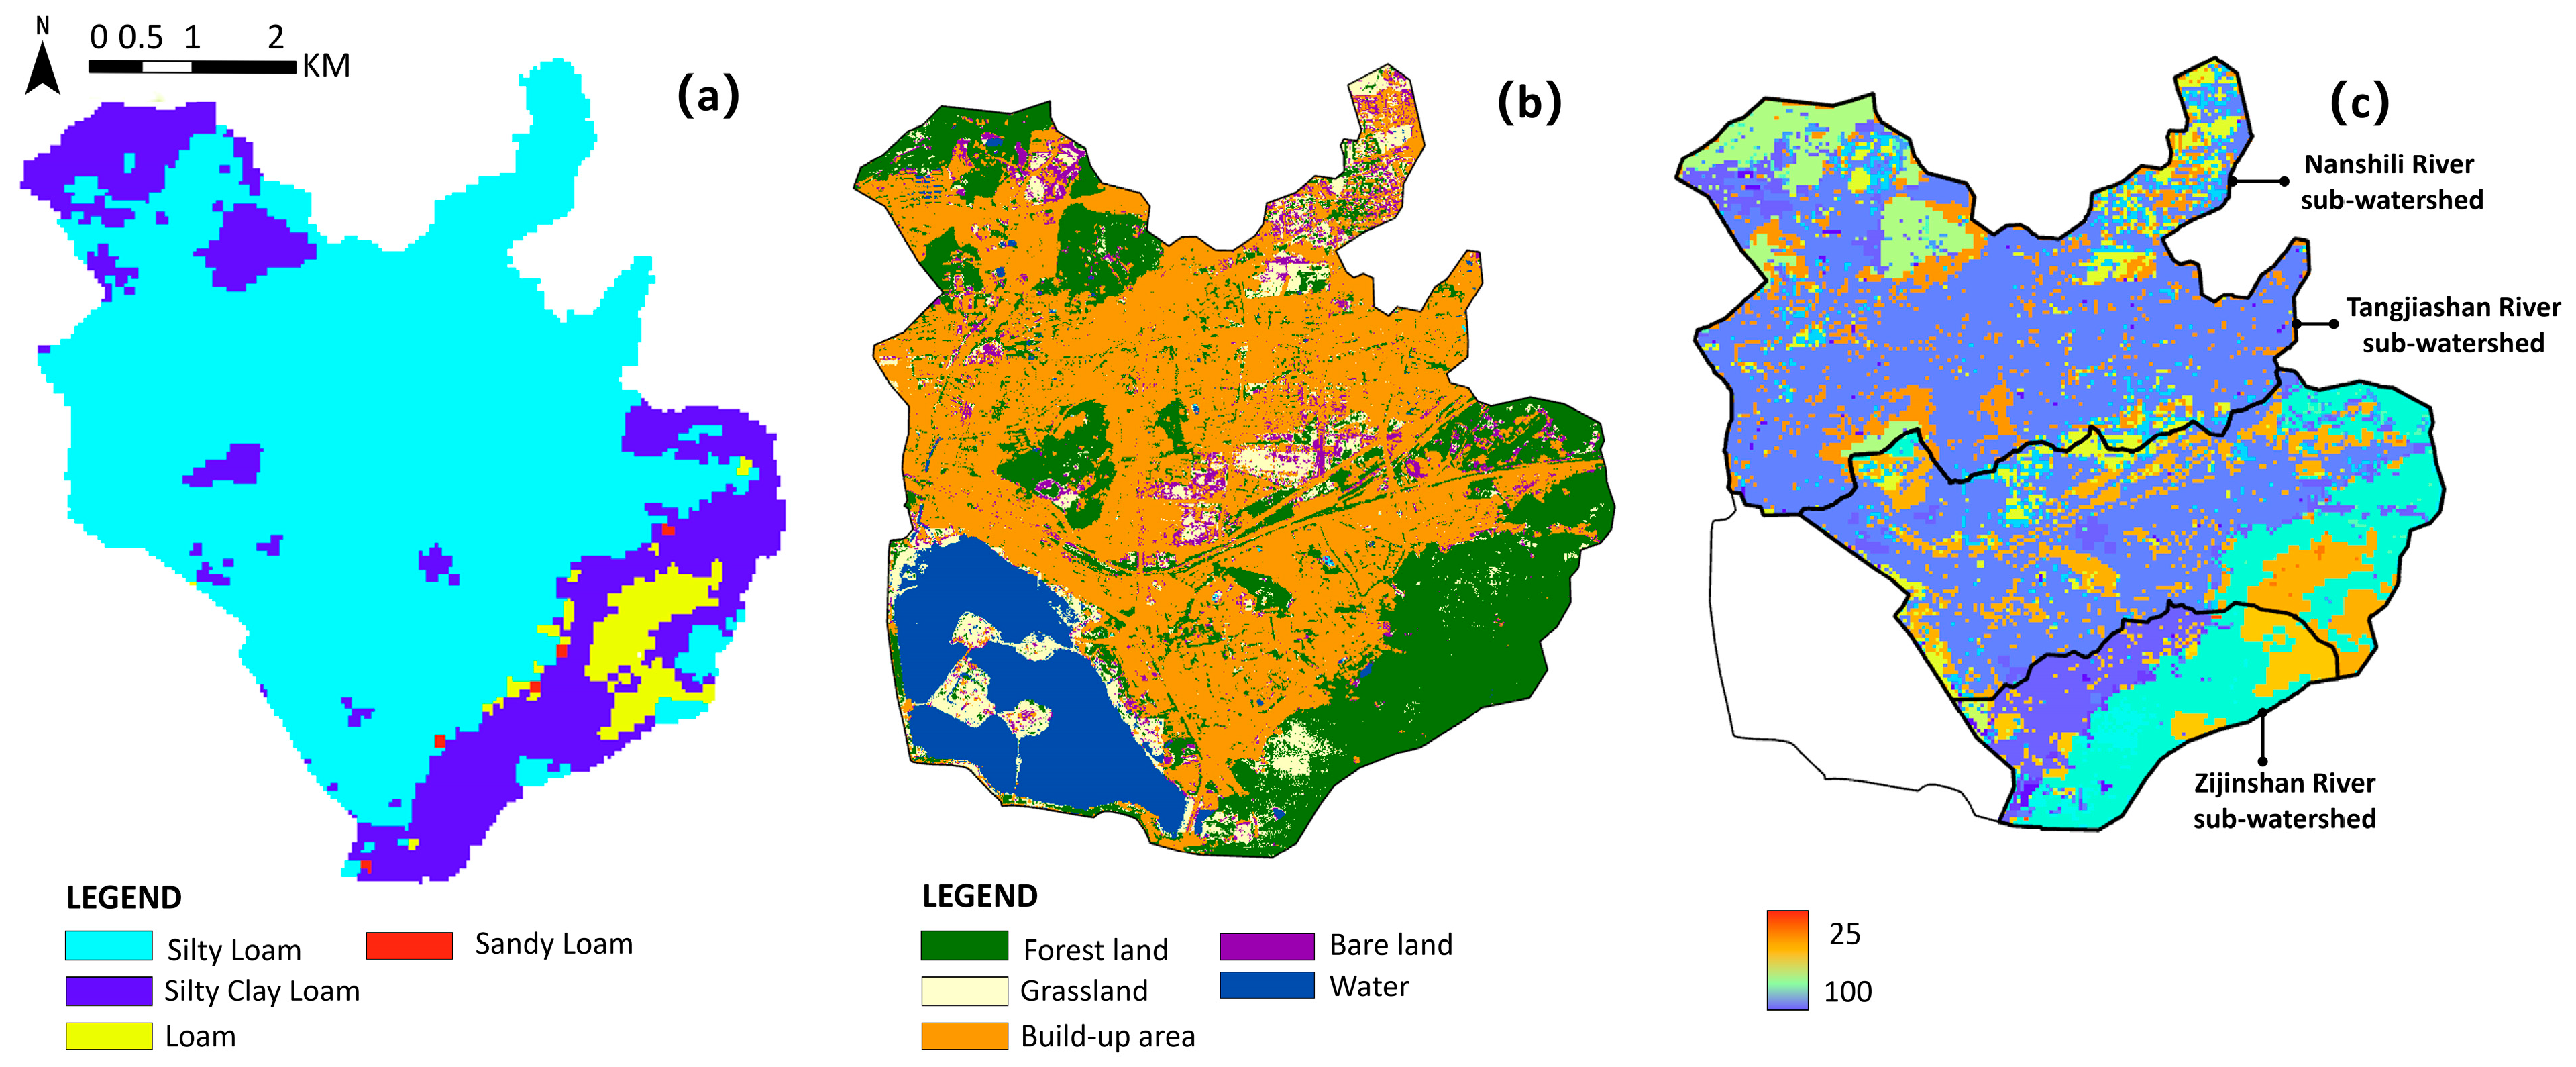
According to the classification system developed by the U.S. Department of Agriculture Soil Conservation Service, soils with similar runoff-producing characteristics are grouped into Hydrologic Soil Groups (HSGs). Based on minimum infiltration rates and soil texture, soils are categorized into four hydrologic groups: Group A (high infiltration), Group B (moderate infiltration), Group C (low infiltration), and Group D (very low or nearly impervious) [51]. Details are shown in Table 2. The 90 m resolution soil texture data (Figure 4a) for China were obtained from the Institute of Soil Science, Chinese Academy of Sciences. The dataset used is the High-resolution National Soil Information Grid Basic Attribute Dataset of China (https://soil.geodata.cn; accessed on 3 June 2025). The dominant soil textures in the study watershed are Silty clay loam and Silt loam, corresponding to Hydrologic Soil Groups D and B, respectively.
The land use data were obtained from SinoLC–1, the first nationwide land cover map of China with a spatial resolution of 1 m (http://www.ncdc.ac.cn; accessed on 16 May 2024). The land cover data were further reclassified into five categories: forest, grassland, bare land, water bodies, and built-up areas (Figure 4b).

3.1.3. Antecedent Moisture Condition (AMC) and Slope Adjustment

The Antecedent Moisture Condition (AMC) reflects the soil’s moisture content prior to a rainfall event. In the SCS-CN model, AMC is classified into three levels based on the total rainfall in the five days preceding the event: dry (AMC I), average (AMC II), and wet (AMC III) conditions. Since soil moisture significantly affects the runoff potential, the CN value must be adjusted accordingly. In this study, the estimation of surface runoff assumes that all soils within the study area are under average antecedent moisture conditions (AMC II).
Accounting for slope effects can significantly improve model accuracy, particularly in regions with pronounced topographic variability. Traditional Curve Number (CN) values were originally developed based on the assumption of gently sloping terrain. While the average slopes in the Nanshili River and Tangjiashan River sub-watersheds conform to this assumption, the Zijinshan River sub-watershed features a considerably steeper average slope of 15%. Therefore, this study applies the slope adjustment equation [52] to modify the CN values for the Zijinshan River sub-watershed. The equation is as follows:
C N I I s = C N I I × 322.79 + 15.63 s l p s l p + 323.52
C N I I , the original Curve Number under AMC II conditions; C N I I s , the slope adjusted Curve Number; s l p , the average land slope, expressed as a percentage (%).

3.1.4. Determination of CN Values

The CN values used in this study were set based on average antecedent moisture conditions (AMC II) and were referenced from the CN–China table [53], a revised Curve Number dataset specifically adapted to regional conditions in China and thus more suitable for the watershed environment of this study. In addition, several case studies from other Chinese cities were consulted [54,55] to verify the reasonableness and applicability of the selected values. The specific CN values are listed in Table 3. The spatial distribution of CN values across the watershed is shown in Figure 4c, reflecting the runoff potential of the three sub-catchments. The composite CN values for the Nanshili River, Tangjiashan River, and Zijinshan River sub-watersheds are 86.52, 81.45, and 81.52, respectively.

3.1.5. Calculation of Surface Runoff Volume

This study utilized daily rainfall data for Nanjing in 2023, obtained from the National Meteorological Science Data Center. A total of 30 rainfall events were recorded in 2023. The combined runoff from the three sub-catchments reached 16.43 million cubic meters (Mm3). These runoff volumes have the potential to serve as a natural source of inflow for the lake.

3.2. BGI Network Optimization Model

3.2.1. Overall Framework of Network Optimization

This study proposes a BGI network optimization strategy aimed at achieving two key objectives. On the one hand, it seeks to enhance stormwater retention capacity and runoff discharge efficiency in the source areas, thereby increasing inflow to the lake and meeting ecological and hydrological demands. On the other hand, it aims to maintain flood safety throughout the watershed by preventing any adverse impacts of network optimization on the city’s flood control and drainage systems. While these goals may involve trade-offs, they also present potential synergies. To support this process, the model incorporates the following four key constraints:
  • Constraints on Newly Added Water Bodies: According to urban water surface ratio control requirements, the total area of newly added water bodies should be limited to no more than 150,000 m2.
  • Urban Drainage Standards for River Channels: River channels in the main urban area must be designed to withstand a storm event with a 20-year return period (with a duration of 120 min). Additionally, water levels should quickly return to operational levels after rainfall ceases to avoid surface flooding caused by river overtopping. All newly designed river channels must strictly adhere to this standard. This study employed the Chicago rainfall pattern generator to produce a 2 h rainfall hyetograph corresponding to a 20-year return period, based on the storm intensity formula officially released by the Nanjing Water Authority in 2024. The formula and detailed rainfall data are provided in Appendix A.1. The selection of a 120 min, 20-year return period rainfall event is in accordance with the requirements outlined in the Comprehensive Drainage and Flood Control Planning for the Central Urban Area of Nanjing City.
  • Balance of Lake Carrying Capacity: Under a storm event with a 100-year return period, the inflow rate into Xuanwu Lake from newly introduced runoff must match the lake’s existing outflow capacity. Excessively rapid inflow could raise the lake’s water level, expand inundation areas, and increase flood risks.
  • Localized Flood Mitigation in Source Areas: Driven by urban spatial safety policies, current planning encourages the installation of small- and medium-scale water retention facilities in flood-prone areas within high-density built-up zones. Although limited in size, such facilities play a critical role in alleviating local pluvial flooding. In this study, a secondary corridor system composed of green belts and infiltration trenches is developed to improve connectivity between dispersed retention facilities and the main river corridors, thereby enhancing flood resilience in source areas.

3.2.2. Optimization of Primary Corridors

  • Landscape Connectivity Index Analysis
This study employs the ArcGIS platform to integrate landscape connectivity analysis with the Minimum Cumulative Resistance (MCR) model and the gravity model. This integrated framework is used to identify optimal pathways for primary corridors, focusing on river-centered spatial structures.
The existing blue–green space network was analyzed to evaluate the coverage, spatial distribution, and connectivity of BGI. Based on 1 m resolution land cover data, existing blue–green spaces were identified, and network nodes and links were defined to evaluate the connectivity of the watershed’s BGI. The analysis employed landscape connectivity indices using Conefor 2.6, including the Integral Index of Connectivity (IIC) and Delta Integral Index of Connectivity ( d I I C ) [56,57] to detect critical nodes and corridors (Equations (7) and (8)).
I I C = i = 1 n j = 1 n a i a j 1 + n l i j A L 2
a i and a j , the areas of patches i and j, respectively; n, the total number of patches;   n l i j , the number of links in the shortest path between nodes i and j;   A L , maximum landscape attribute.
d I I C ( % ) = 100 I I C I I C remove I I C
I I C remove , the overall index value after the removal of that single node from the landscape; k , individual node analyzed.
  • Construction of the MCR Model
A resistance surface was constructed based on four indicators: elevation, land cover, slope, and distance to rivers. The relative weights of these indicators were determined using the Analytic Hierarchy Process (AHP), incorporating expert judgment, domain knowledge, and field observations. A structured questionnaire was distributed to seven experts, including two government officials and five academic researchers. The consistency ratio (CR) [58,59] of the pairwise comparisons was calculated to be 0.012, which is considered acceptable, indicating that the derived weights are suitable for further analysis and decision-making (Equations (9) and (10)). The AHP calculation procedure is detailed in Appendix A.2. The final indicator weights were: elevation (0.34), land cover (0.21), slope (0.31), and distance to rivers (0.14).
CR = C I / R I
C I , the Consistency Index; R I , the Random Index.
C I = λ n / n 1
λ , Principal Eigenvalue; n, number of variables.
The Minimum Cumulative Resistance (MCR) model [60] was constructed using the Weighted Overlay tool in ArcGIS (Equation (11)), resulting in the generation of minimum-cost corridors.
M C R = m i n ( D i j × R i )
D i j , the spatial distance from the source unit i to the sink unit j R i , the resistance coefficient encountered during the transition from the source unit i to the sink unit j ; R i , the diffusion resistance coefficient of source patch i in a specific spatial direction.
  • Gravity model
The initially selected corridors were evaluated using the gravity model to assess their hydrological significance, and redundant or overlapping corridors were eliminated to determine the final optimized configuration (Equations (12)–(14)) [33]. The goal of introducing new blue corridors is to restore natural drainage pathways. Hence, the objective is not to maximize corridor quantity but to ensure hydrological functionality and ecological integrity.
G i j = N i N j / D i j 2
Gij, the level of interaction between node i and node j and i,j = 1, 2, 3…, n; N i and N j , the corresponding weight values; D i j 2 , the cumulative impedance value between node 1 and node 2. To calculate Ni and D i j 2 , the following formula is used:
N i = S i / P i
P i , the node weight; S i , the area of node i ;
D i j = L i j / L m a x
L i j , the cumulative impedance value of the corridor between nodes i and j; L m a x , the maximum impedance value of all L i j .

3.2.3. Synergistic Planning of Waterfront Green Spaces

At the elemental level, urban blue–green space refers to the combined system of green space and blue space in cities. However, it is not merely the sum of these two components, but rather a closely interconnected system characterized by mutual influence and functional integration [61]. Compared with separate governance of blue and green infrastructure, recognizing the systemic nature of blue–green space and enhancing the synergy between spatial distribution, hydrological processes, and stormwater management functions can effectively improve performance [62]. Therefore, following river network optimization, it is essential to fully consider the spatial synergy between blue and green infrastructure [63]. Such synergy ensures the effective integration of rivers and adjacent green areas [64].
For instance, green spaces should be preferentially arranged along both sides of rivers and near the outfalls in source areas to create a spatial configuration that supports “proximal storage and rapid response.” Moreover, under extreme rainfall conditions, newly added river corridors may overflow, necessitating the inclusion of adjacent green space floodplains to facilitate proper stormwater drainage. To meet these requirements, the scale of green spaces must be quantified in coordination with the capacity of blue infrastructure. This study assumes that the stormwater storage capacity of green spaces should be equivalent to the projected overflow volume of the river. The green space’s storage capacity is estimated using a volumetric method, and the corresponding calculation formula is provided in Equation (15). The volumetric method used in this study is based on the guidelines issued by the Ministry of Housing and Urban-Rural Development of China in 2014, titled Technical Guide for Sponge City Construction—Low Impact Development Stormwater System.
  V = 10 H ϕ A F
V, the designed storage capacity, m3; H , the designed rainfall, mm; ϕ , the comprehensive rainfall-runoff coefficient, which is taken as 0.15 for green space here; A F , the catchment area, hm2.
Secondly, river network optimization may increase the peak flow velocity at lake inlets, thereby elevating the risk of localized flooding. To mitigate this, incorporating buffer green spaces at the downstream ends of river channels becomes a necessary measure. By simulating flow velocities at lake inlets using hydrological modeling software, the area of downstream green spaces is iteratively adjusted until a balance between inflow and outflow velocities is achieved.

3.2.4. Optimization of Secondary Corridors

A secondary BGI corridor system, centered on green infiltration ditches and distributed water storage facilities, was constructed to complement the primary corridors and form a multi-level BGI network. First, flood-prone hotspot areas were identified based on topographic data and historical records of urban waterlogging points. Second, suitable BGI elements were selected for each hotspot. Third, the dispersed BGI elements were connected. By analyzing available space, terrain, and slope conditions, the precise locations and appropriate scales of the secondary corridors were determined. These secondary corridors linked localized BGI components with the river network, thereby enhancing the overall connectivity and effectiveness of the watershed system.

3.3. Calculation Model of Water Balance

3.3.1. SWMM

The Storm Water Management Model (SWMM) is a semi-distributed hydrological model primarily designed for event-based simulations and is widely used to evaluate the impacts of BGI scenarios on surface runoff [65]. It also supports long-term simulations on monthly or annual scales, making it a suitable tool for this study. In scenario modeling, blue space interventions were represented as newly introduced open channels, integrated with existing grey stormwater infrastructure and river systems.
In the SWMM, the green coverage ratio can be adjusted using the “%Perv” (percent pervious) field in the sub-catchment property editor to simulate the impact of newly added green areas on surface runoff. In addition, this study incorporates several typical Low Impact Development (LID) practices, including green infiltration trenches, rain gardens, and bioswales. These facilities are defined through the LID control editor within the model, where parameters such as the surface layer, storage layer, and drain layer are specified. Detailed parameter values are provided in Appendix A.3. In each sub-catchment, the area and control method of LID facilities can be defined, including the percentage of impervious area treated, the percentage of pervious area treated, and the designated outlet node for discharge.
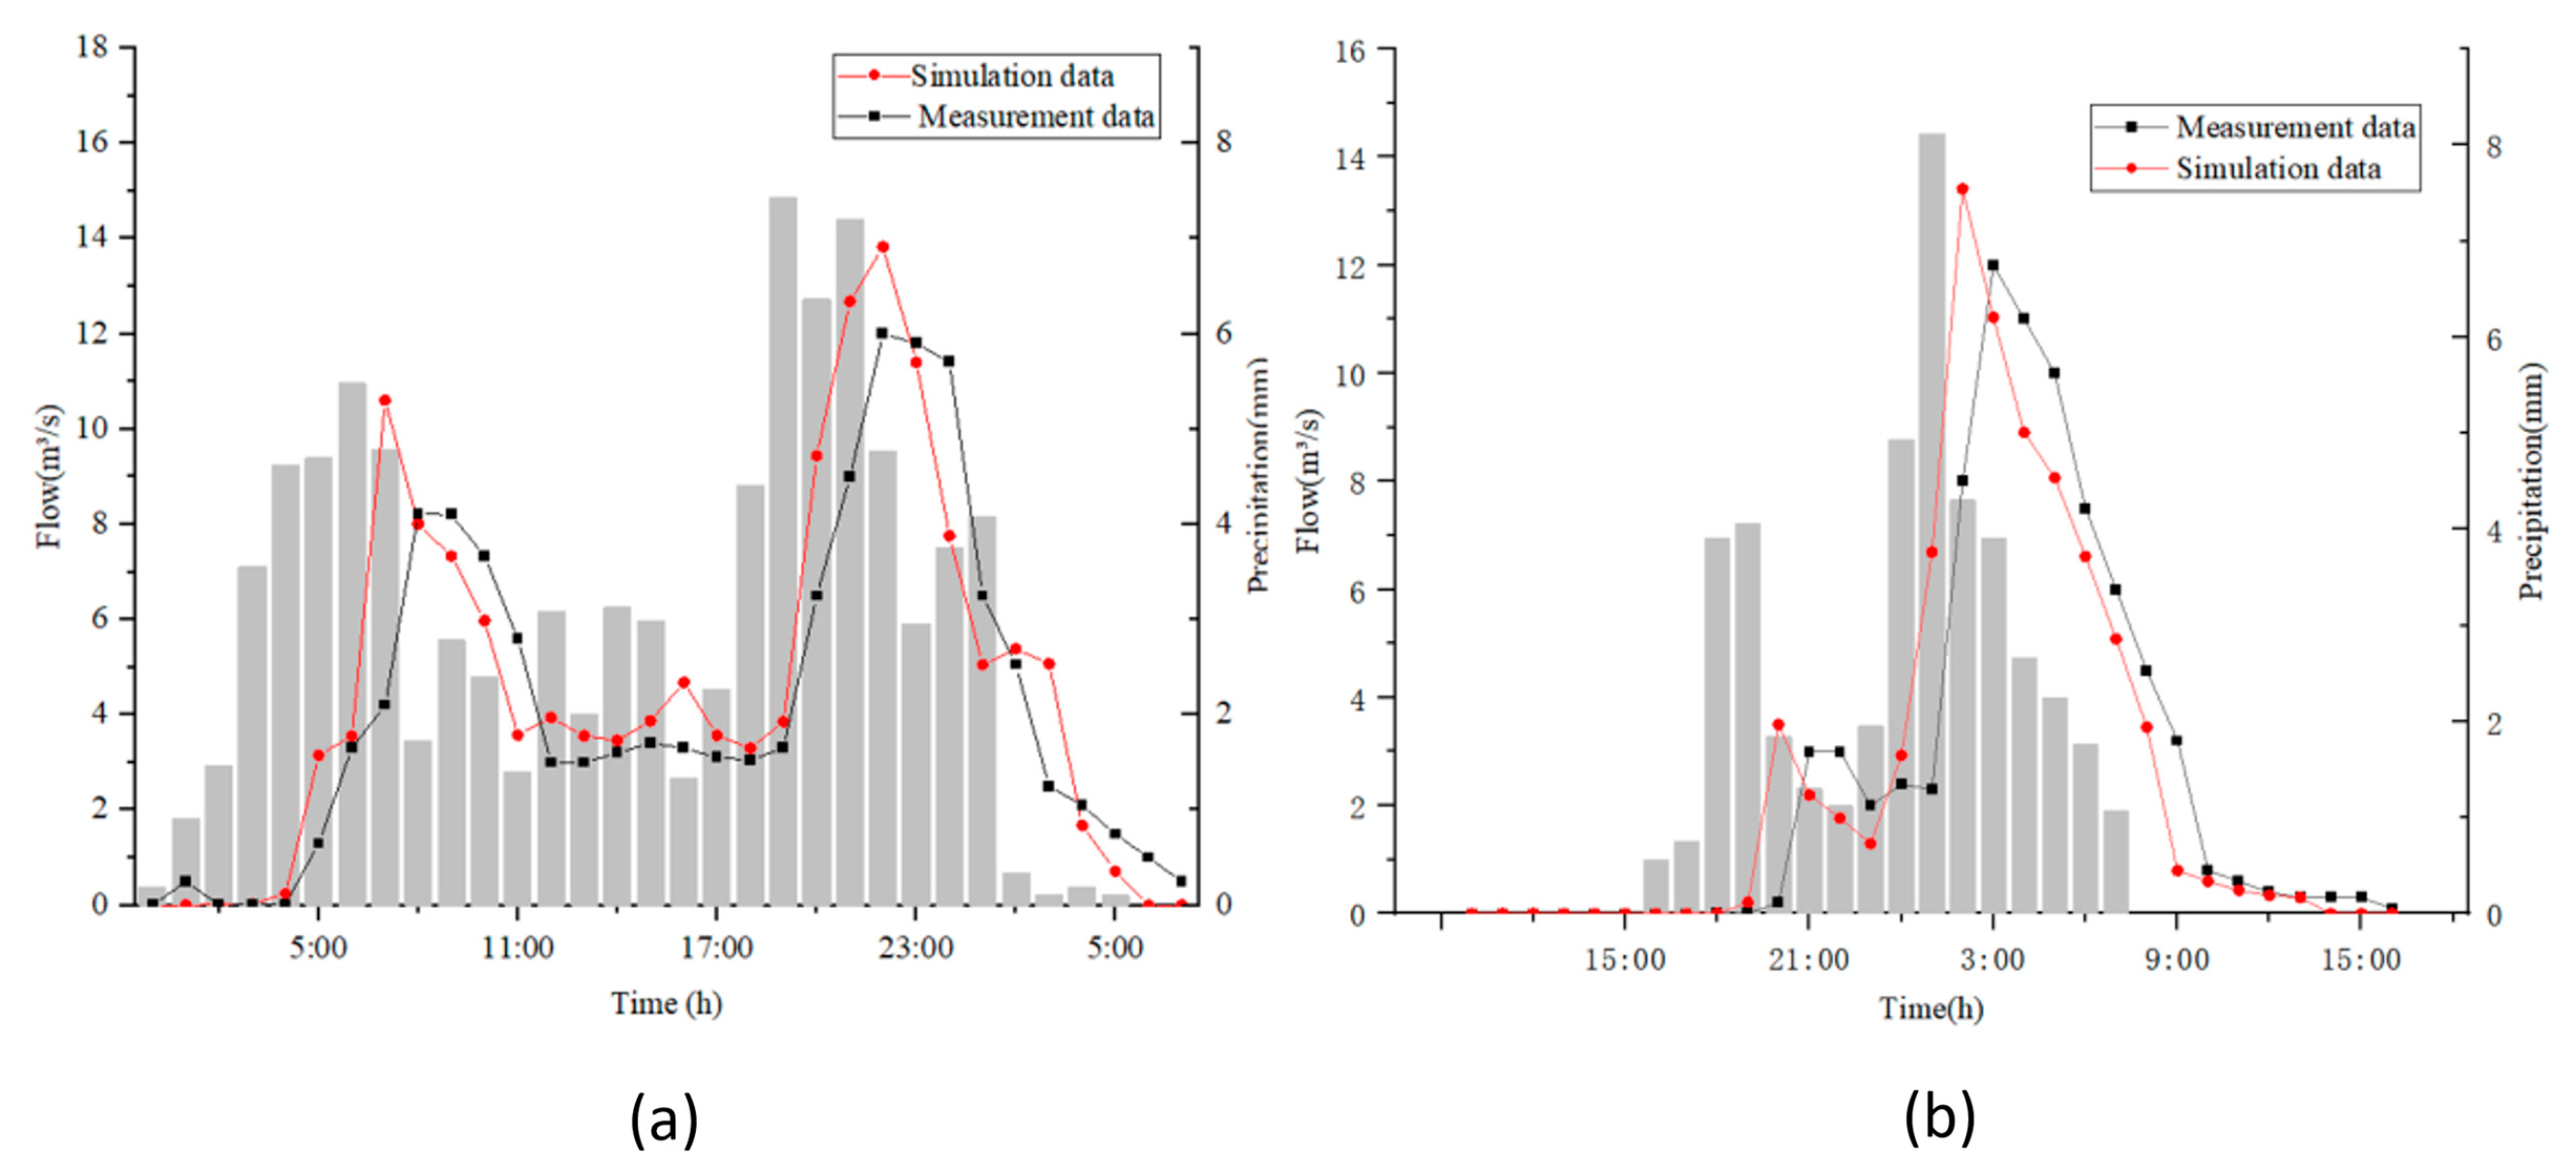
Following model construction, a two-step procedure of calibration and validation was undertaken to ensure its reliability. River flow data were collected during rainfall events using handheld flow meters at designated monitoring points along the Nanshili River. Concurrently, real-time rainfall data were collected via a small weather station. The rainfall event on 12–13 July 2024 was used for model calibration (Figure 5a). Model validation was performed using the rainfall event on 16–17 September 2024, by comparing simulated and observed streamflow at monitoring points (Figure 5b).
N S E = 1 i = 1 n Q s i m , i Q o b s , i 2 i = 1 n Q o b s , i Q o b s 2
n, sample size; Q s i m , i , the simulated value of the i simulated sample point; Q o b s , i , the observed value of the i observed sample point;
The Nash–Sutcliffe Efficiency (NSE) coefficient [66] was used to evaluate model performance (Equation (16)). The NSE quantitatively reflects the agreement between simulated and observed runoff time series, with values above 0.65 generally considered satisfactory.
During the validation phase, the model achieved NSE values of 0.78 and 0.76, both exceeding the acceptable threshold for simulation accuracy. Based on these results, it is assumed that the model adequately captures the rainfall–runoff characteristics of the watershed and can be reliably used for scenario simulations. The conceptual model structure is shown in Figure 6, and the final calibrated parameters are listed in Table 4. The reference value ranges were obtained from the official guidelines provided by the SWMM.
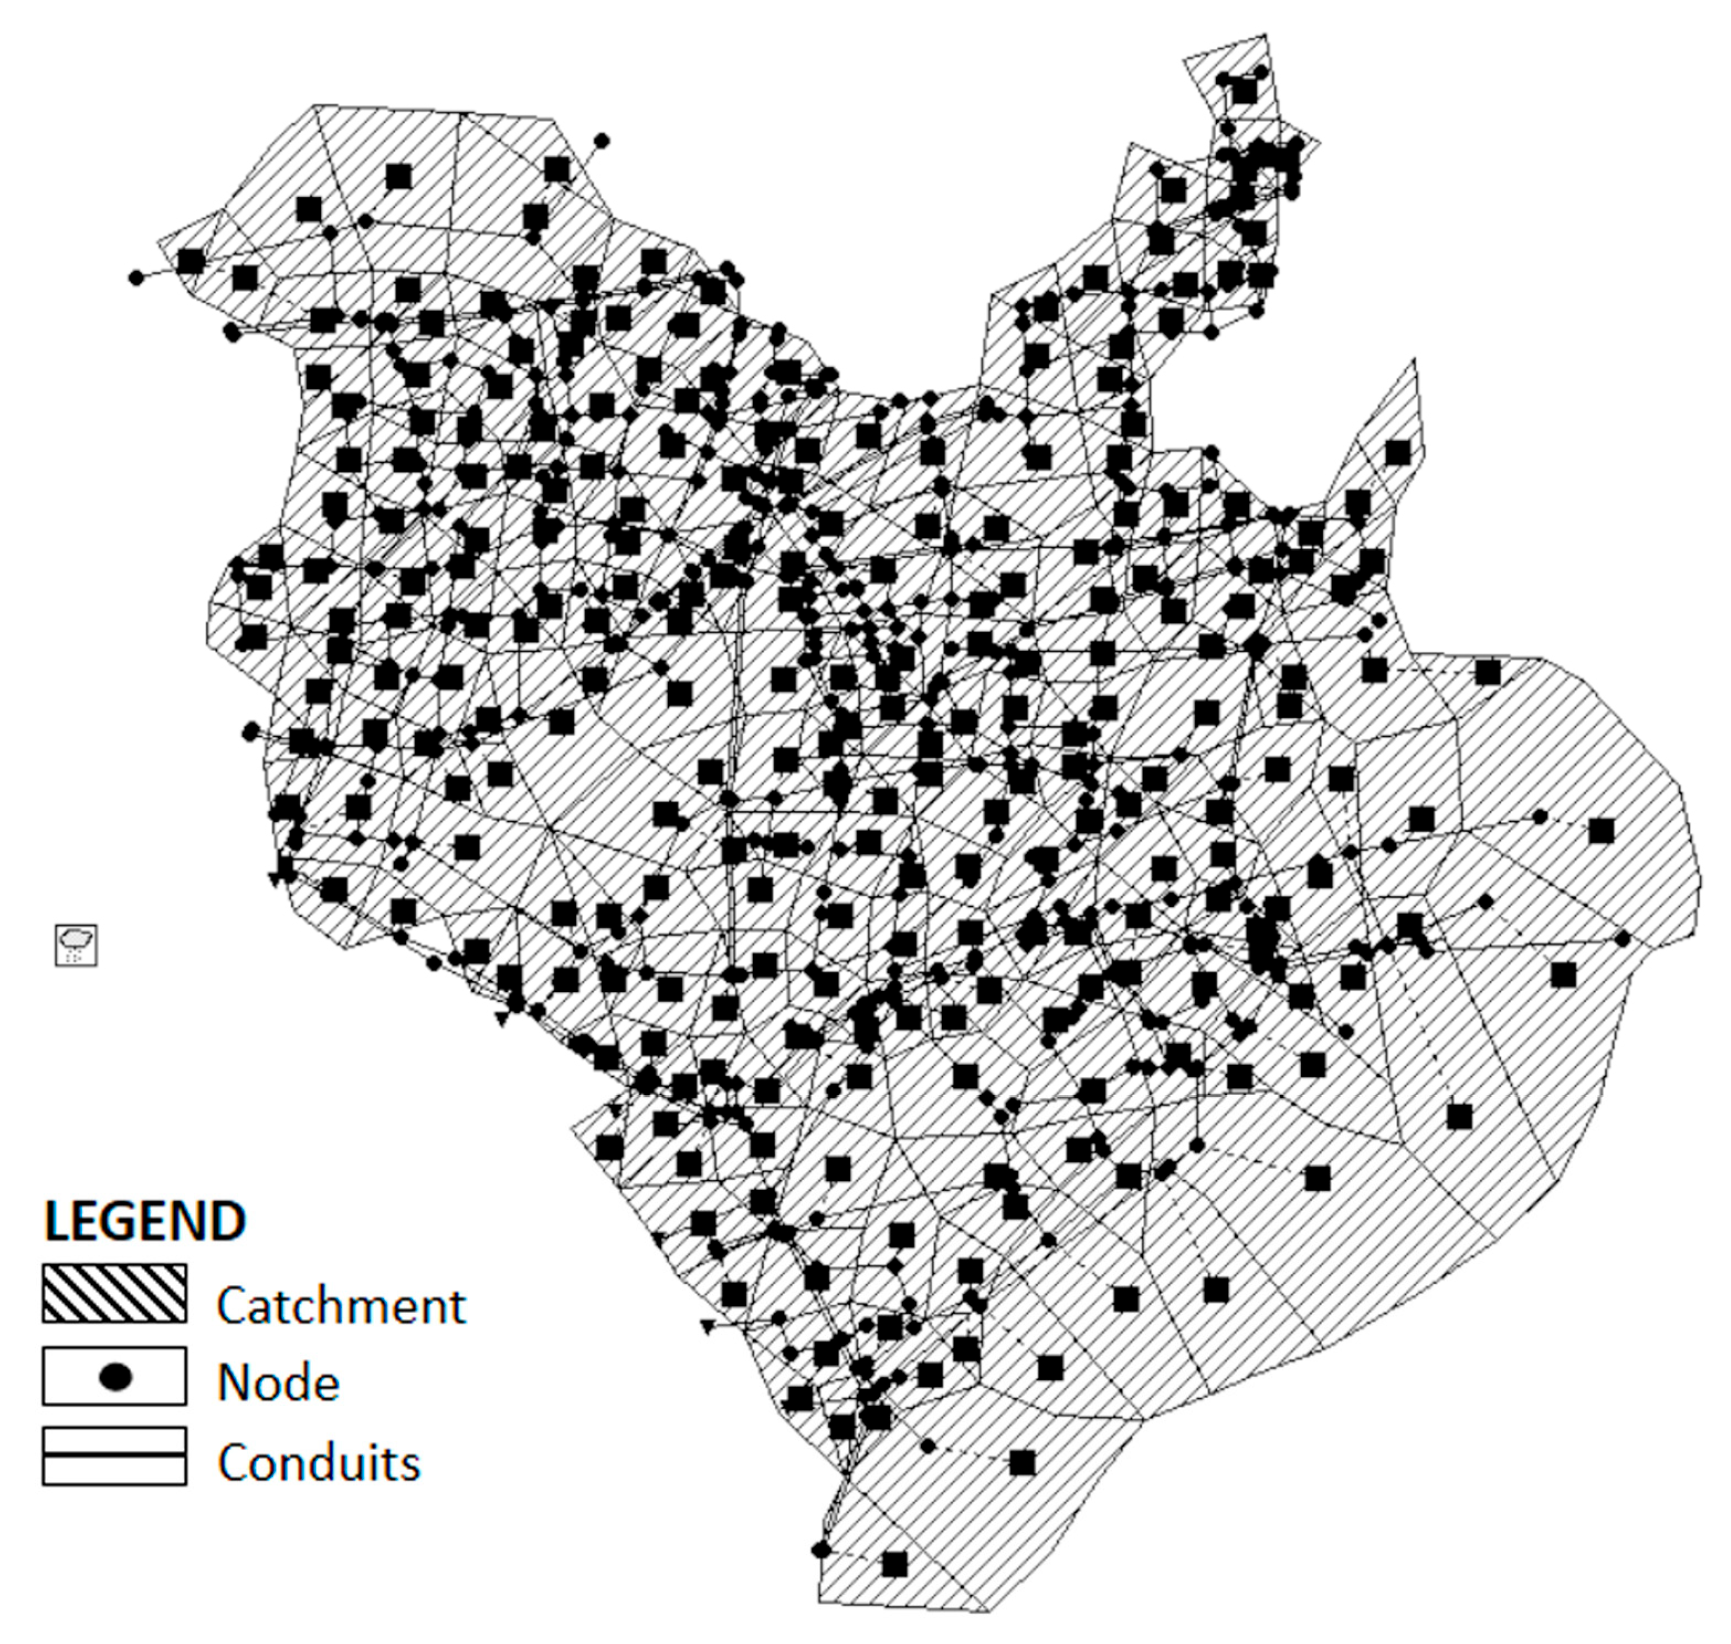
The simulation results of SWMM provided a wide range of hydrological parameters. The key data required for this study included ① monthly and annual inflow volumes into the lake under various BGI network scenarios, directly obtained from the model output reports; ② a comparison of peak inflow rates at each lake inlet during storm events with the designed drainage capacity of the lake’s outflow channels; ③ calculation of the overflow volume from the newly added river network; and ④ analysis of changes in flood discharge across the entire watershed and within representative flood-prone catchments.

3.3.2. Empirical Formula for Water Balance

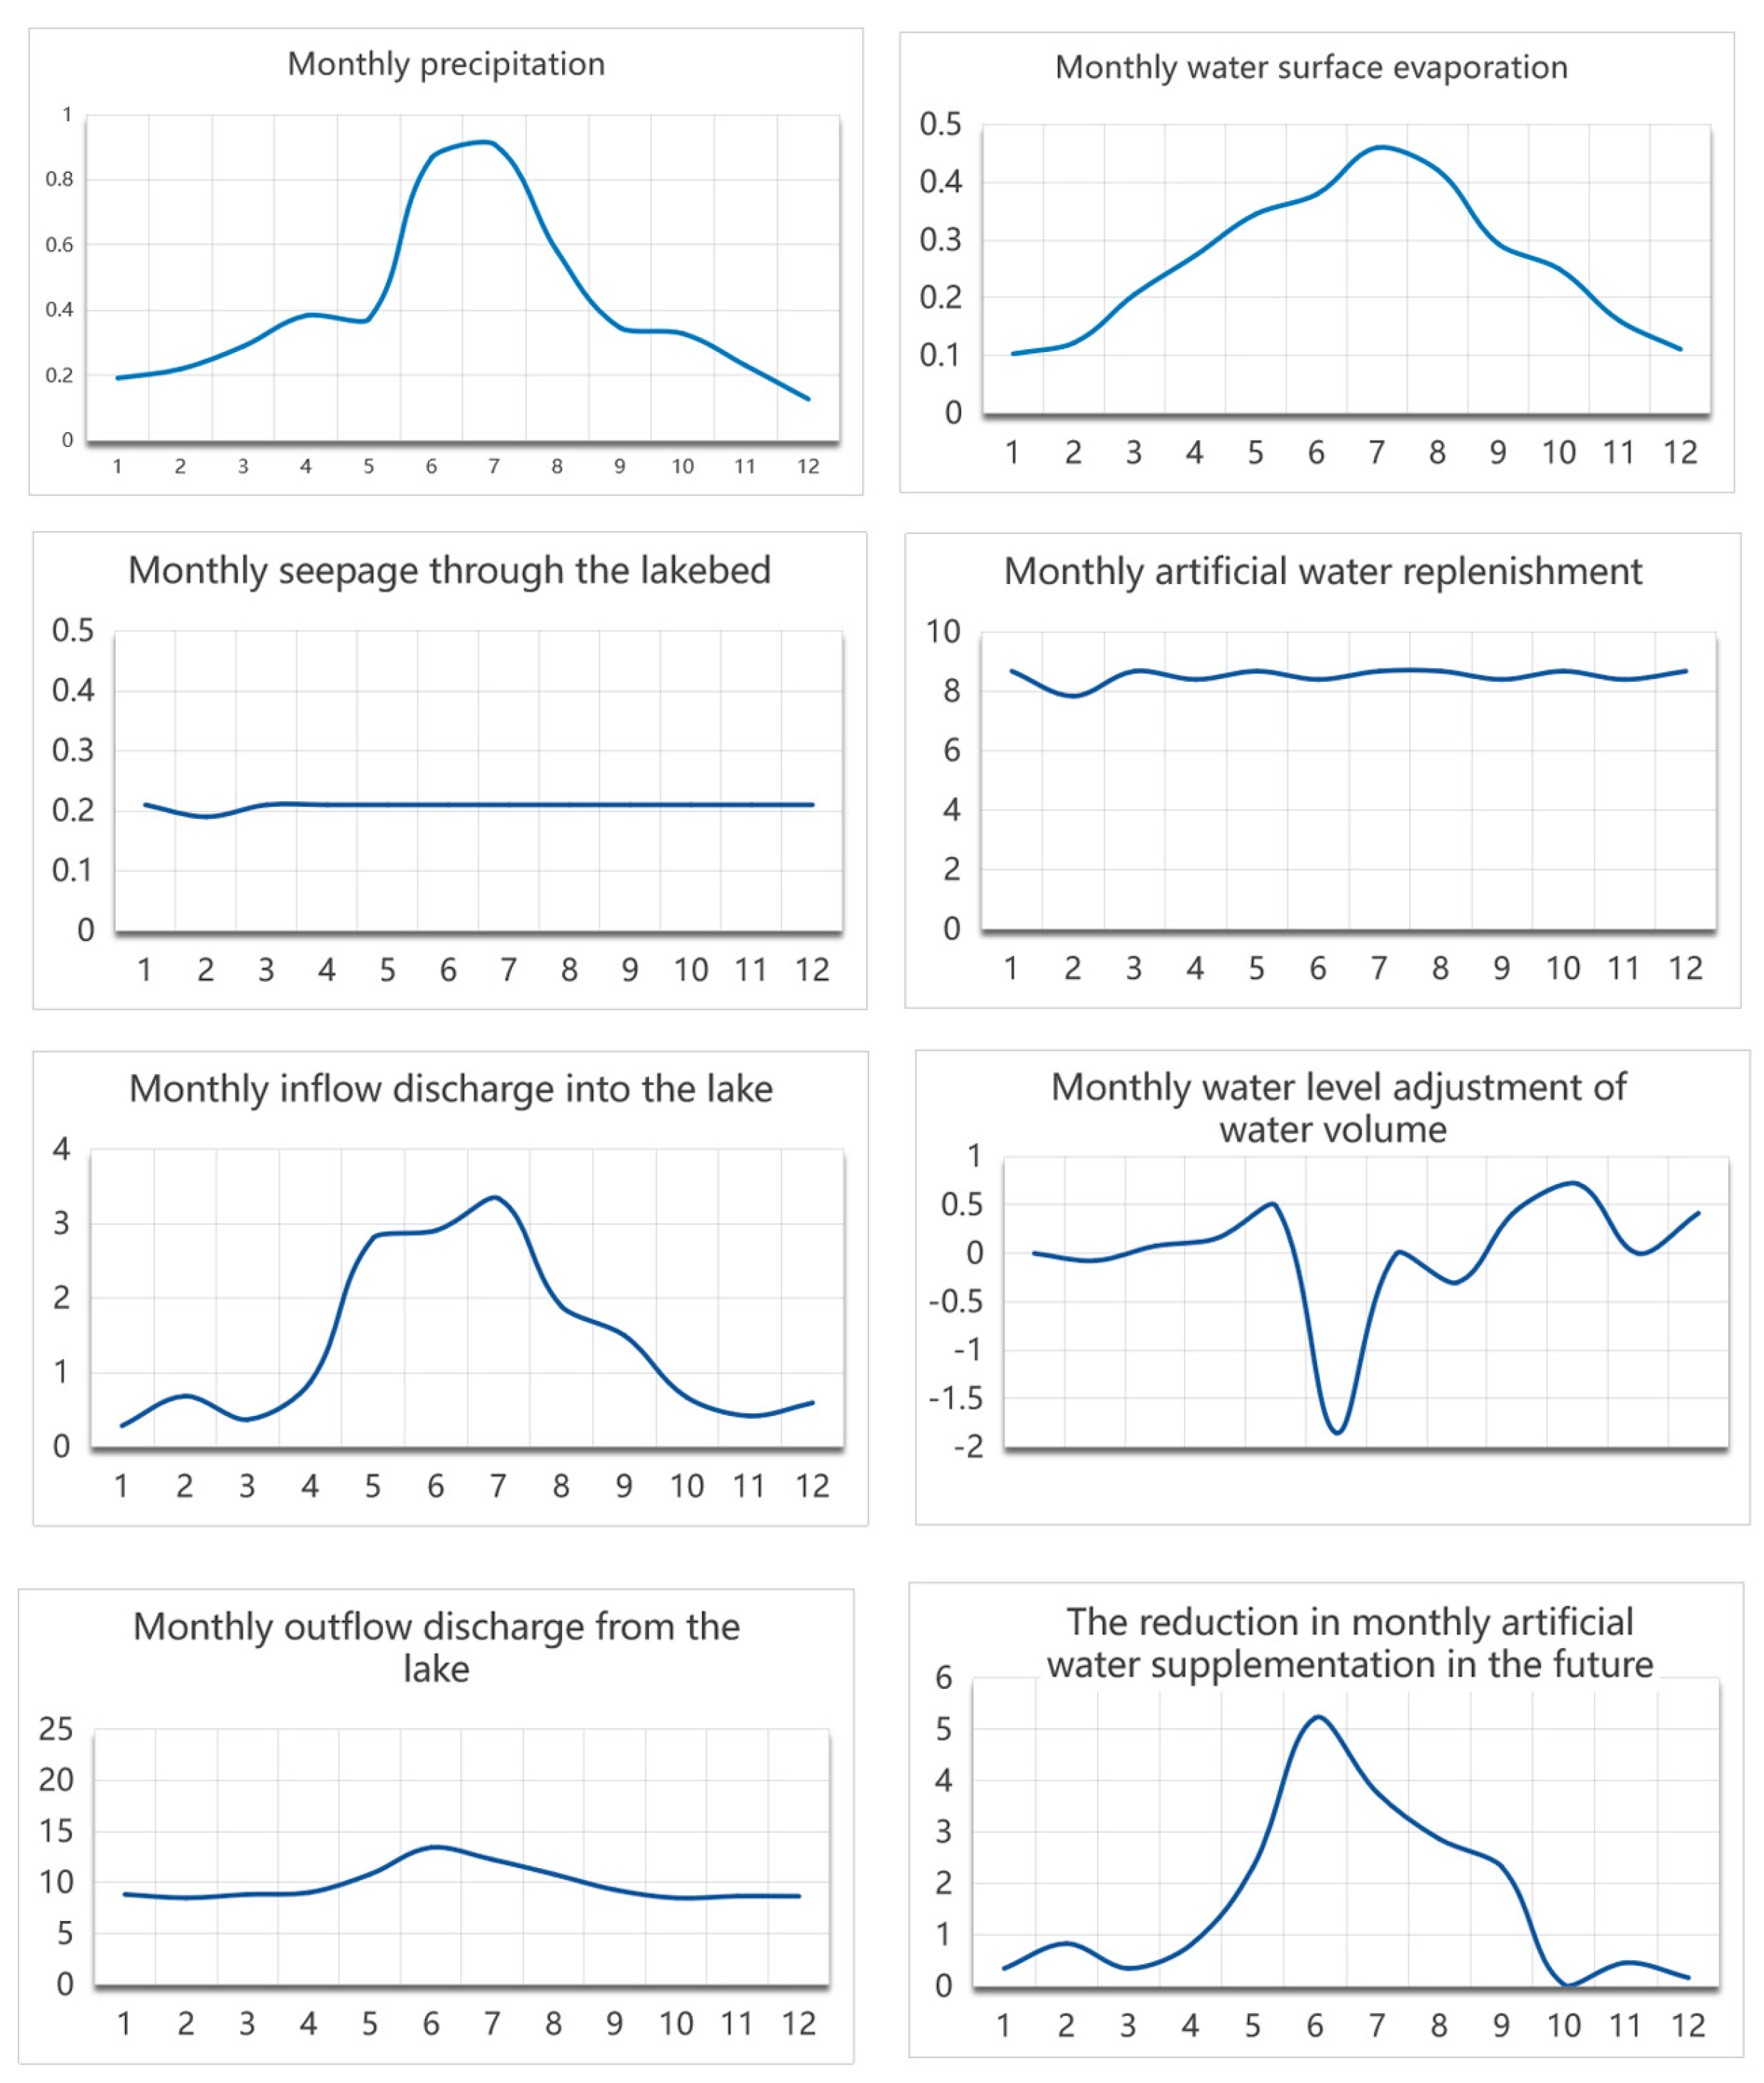
A monthly water balance model for the Xuanwu Lake watershed was constructed (Figure 7). The primary factors influencing the lake’s water balance include monthly precipitation, surface evaporation, seepage through the lakebed, artificial water supplementation, water level adjustment, inflow discharge into the lake, and outflow discharge from the lake (Equations (17)–(23)). Based on these data, the reduction in monthly artificial water supplementation in the future can be calculated (Equation (24)).
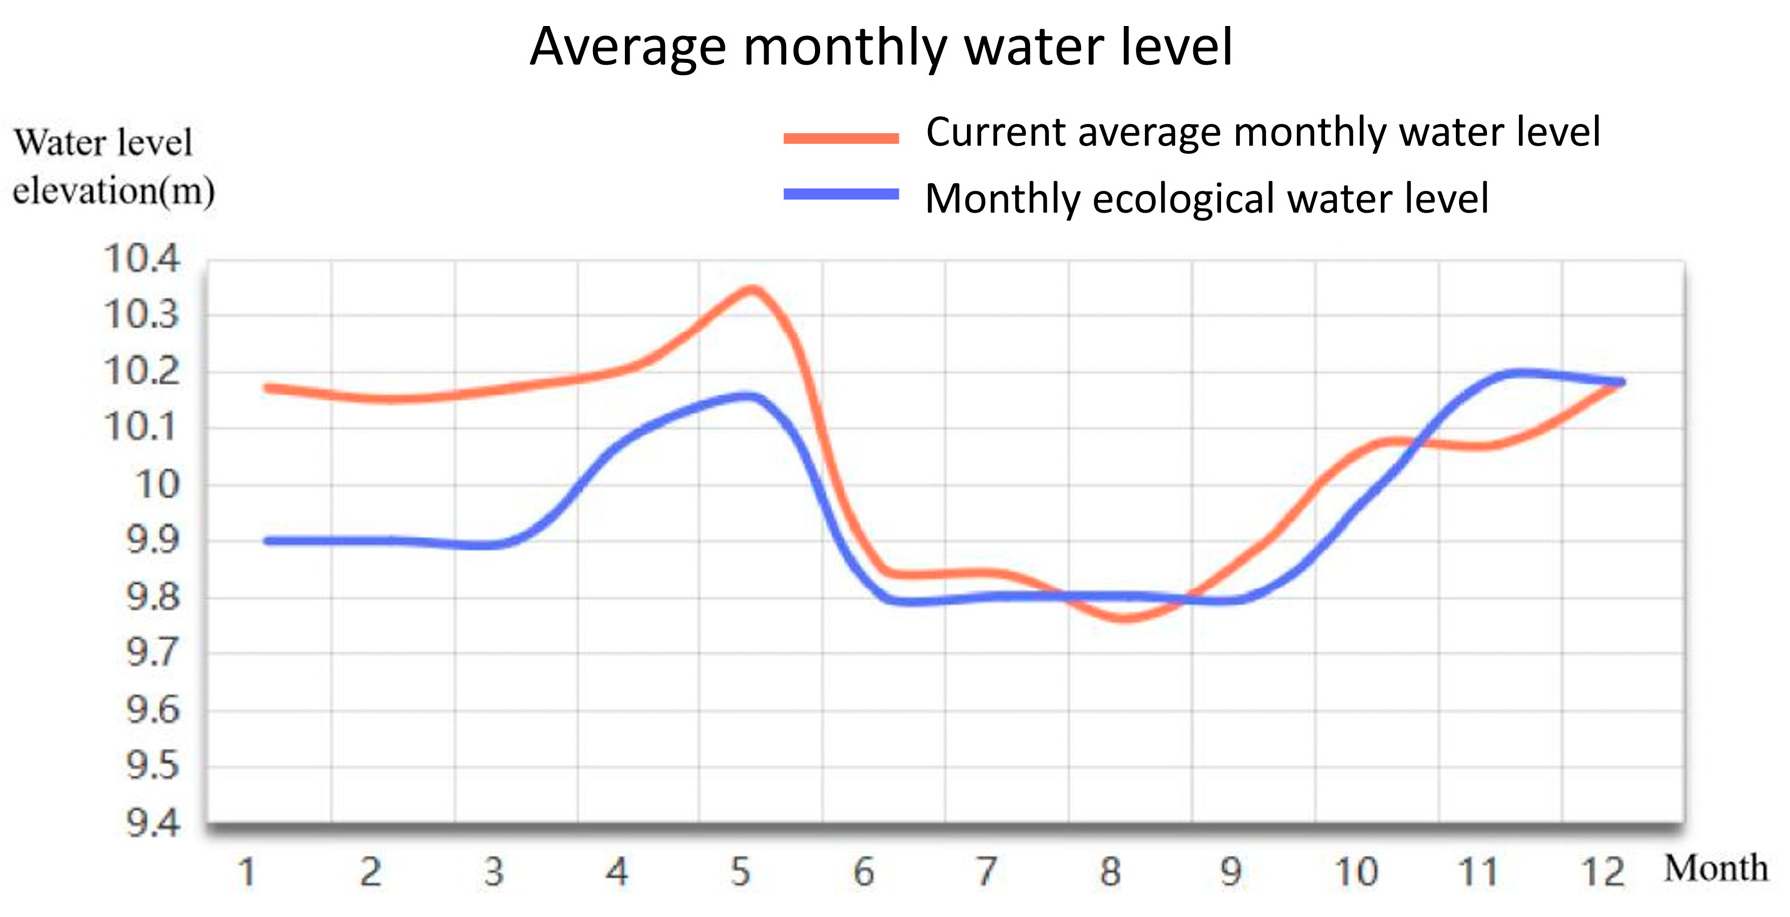
Rainfall data for 2023 were obtained from the hourly precipitation dataset provided by the National Meteorological Science Data Center. Evapotranspiration data were sourced from Comprehensive Drainage and Flood Control Planning for the Central Urban Area of Nanjing City and the ERA5 hourly evaporation dataset. The lakebed seepage coefficient [67] was determined based on values reported by Chen et al. Monthly inflow discharge into the lake was derived from the SWMM simulation outputs, while lake level regulation data were taken from Sun and Jiang [68]. The average monthly water level of Xuanwu Lake ranged from 9.76 m to 10.34 m, as illustrated in Figure 8. During the flood season (June to September), the water level is lowered from its normal level of approximately 10.2 m to about 9.8 m to reserve capacity for flood discharge from the Mount Zijin area. In other months, the level generally remains near 10.2 m.
According to [68], two key conclusions were drawn. First, based on field surveys of aquatic vegetation and lake morphology analysis, the minimum ecological water level of Xuanwu Lake was determined to be 9.6 m. Second, suitable ecological water levels were identified for different growth stages of aquatic vegetation, with recommended levels ranging from 9.8 m to 10.2 m throughout the year. The current variation in the lake’s actual water level essentially meets both flood control and ecological needs and is therefore adopted in the water balance calculations (Figure 8).
Finally, prior to the network optimization, the monthly outflow from Xuanwu Lake remained relatively stable, maintaining continuous hydrological exchange between the urban river system and the Yangtze River. The lake primarily connects to the Jinchuan River via the Dashugen Sluice (0.50 m3/s) and to the Inner Qinhuai River via two channels: the Wumiao Sluice (1.5 m3/s) and the Taipingmen Sluice (1.00 m3/s). The daily outflow volume is approximately 0.260 million cubic meters (Mm3). After network optimization, the monthly outflow may exhibit greater variability. If the total outflow in a given month exceeds a certain threshold (calculated as the number of days in that month multiplied by 0.26), the required volume of artificial water supplementation can be reduced. Conversely, if the monthly outflow falls below this threshold, additional artificial supplementation will be necessary to maintain the desired lake water balance (Equation (24)).
  • W 1 Monthly precipitation:
W 1 = A h 1000
  A , Xuanwu Lake water surface area, m2; h , monthly average rainfall, mm.
  • W 2 Monthly water surface evaporation:
W 2 = A e 1000
A , Xuanwu Lake water surface area, m2; e , monthly evaporation, mm.
  • W 3 Monthly seepage through the lakebed [67]:
W 3 = A 1 k D
A 1 , the area of the lake bottom of Xuanwu Lake, m2; k , the seepage coefficient, m3/(m2*d), with a value of 0.002; D , the number of days in each month.
  • W 4 Monthly artificial water supplementation:
W 4 = B D
B , the average daily water supplementation volume, m3; D , the number of days in each month, d.
  • W 5 Monthly water level adjustment:
W 5 = w l 1 w l 2 A 1000
w l 1 , target water level, mm; w l 2 , current water level, mm; A , surface area of Xuanwu Lake, m2. The water demand for raising the water level comes from W 4 and W 6 ; the excess water from lowering the water level is discharged from the lake outlet to the outside of the watershed.
  • W 6 Monthly inflow discharge into the lake:
W 6 = S 1 S 2 S 3 S 4 S 5
W 6 includes the discharge from the source area rivers and the discharge from the stormwater network. S 1 , monthly precipitation, m3; S 2 , monthly infiltration, m3; S 3 , monthly evaporation, m3; S 4 , monthly surface overflow, m3; S 5 , monthly change in water storage, m3. All of the above data are calculated by the SWMM.
  • W 7 Monthly outflow discharge from the lake:
W 7 = W 1 W 2 W 3 + W 4 W 5 + W 6
  • W 8 The reduction in monthly artificial water supplementation in the future:
W 8 = W 7 260,000 D
D, the number of days in each month, d. A, positive result indicates a reduction in water supplementation for the future month, while a negative result indicates an increase in water supplementation for the future month.

4. Results

4.1. Simulation of Network Optimization Scheme

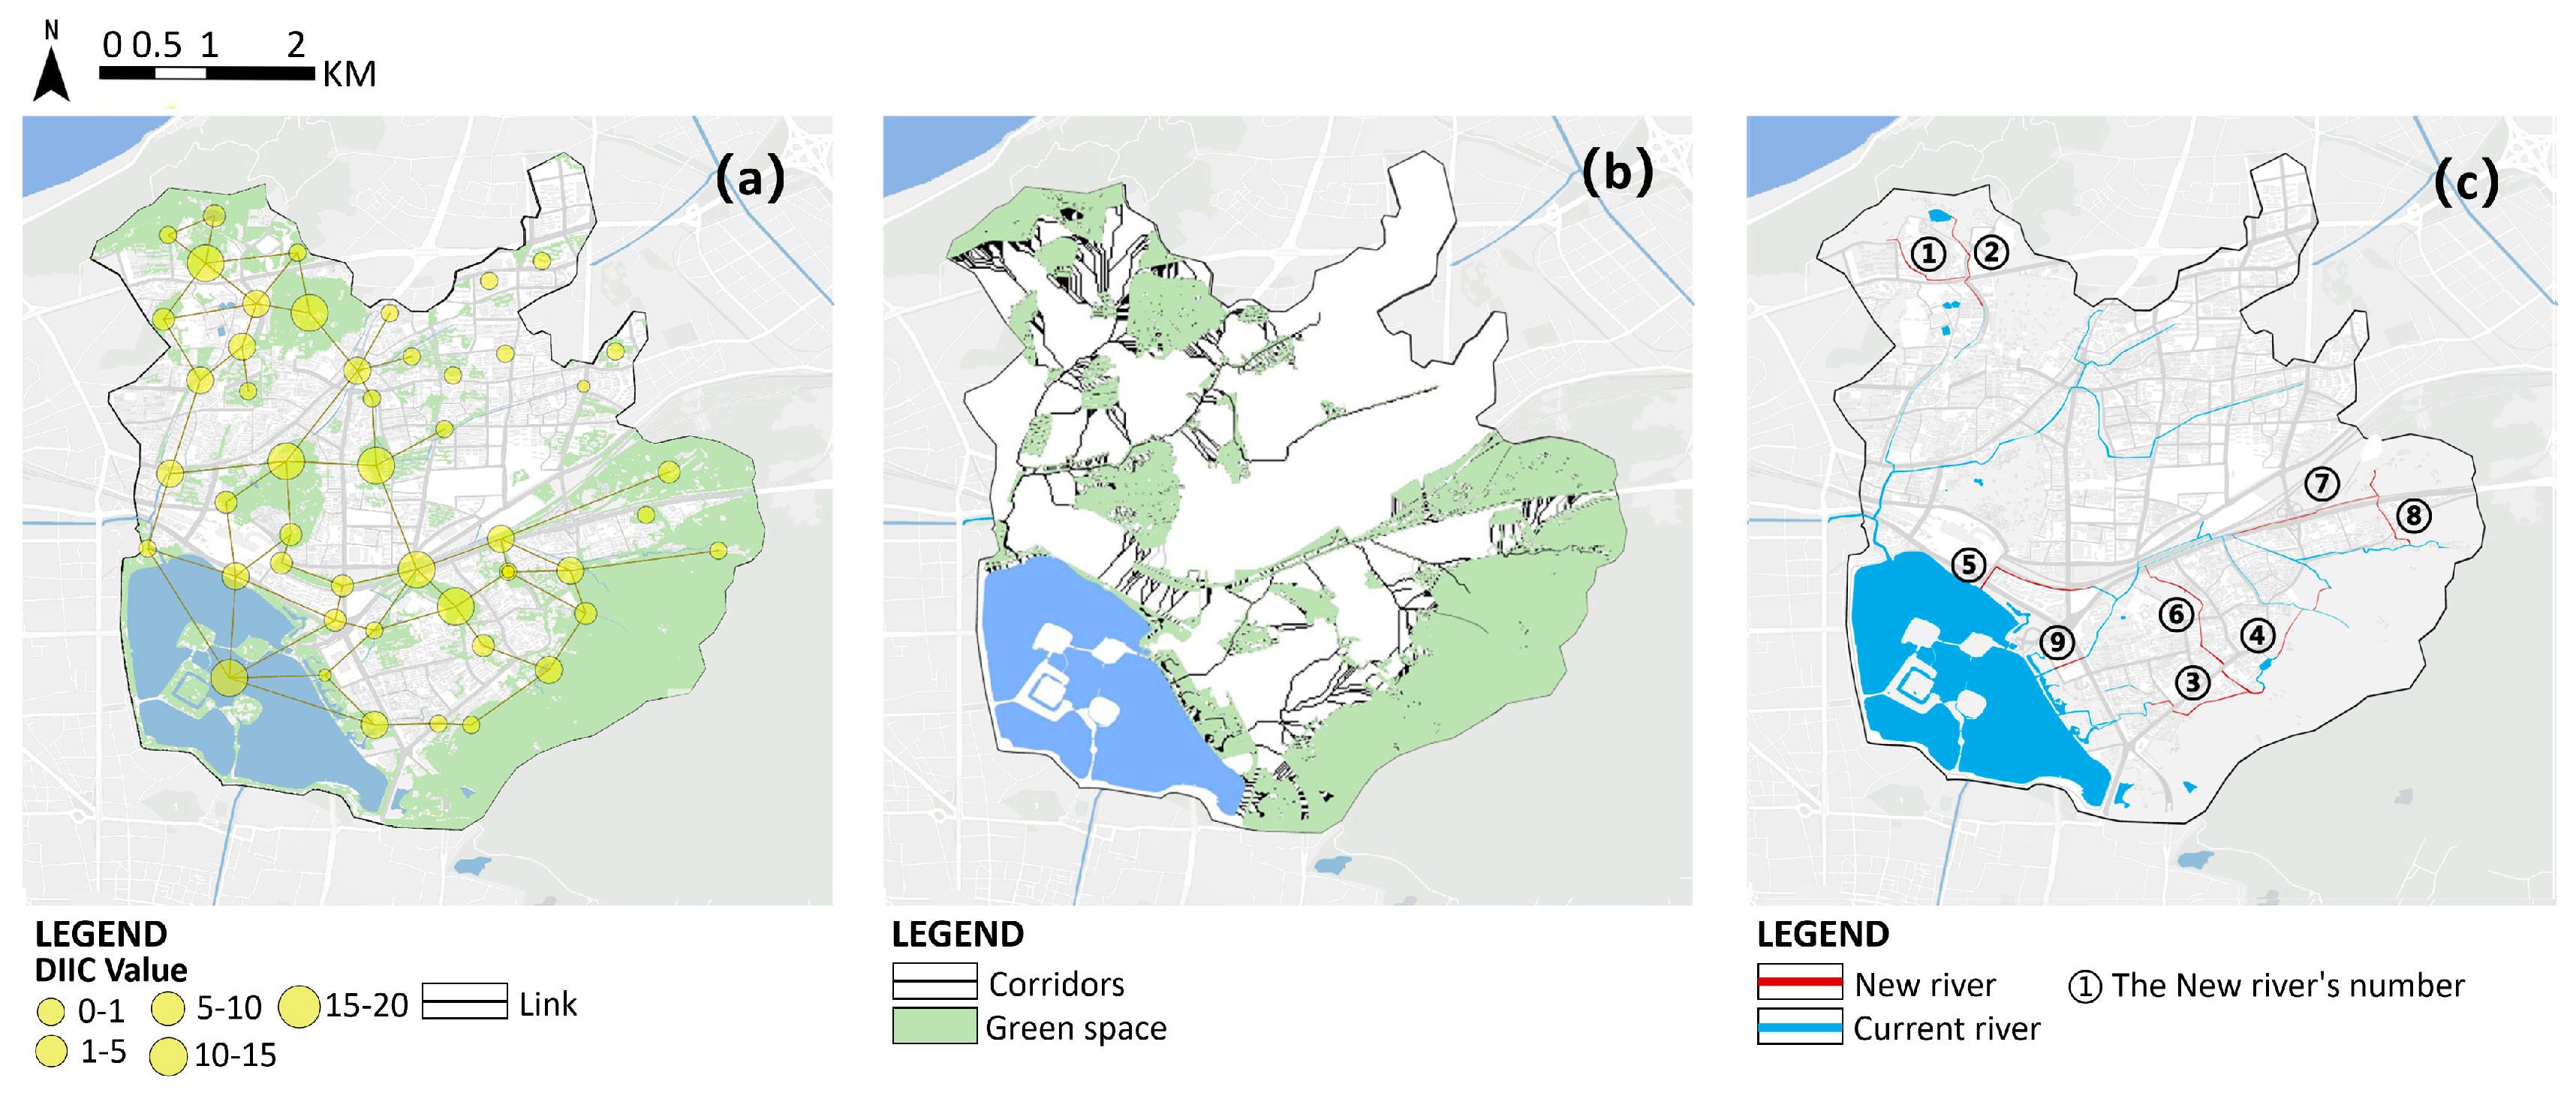
The Conefor 2.6 identified key source areas and critical river corridors, as shown in Figure 9a. The values within the circles represent the results of the dIIC calculation, which quantifies the relative importance of each node within the hydrological connectivity network. Higher values indicate that the corresponding nodes play a more significant role in maintaining the integrity of connectivity pathways. The MCR model identified a total of 16 corridors (Figure 9b), while the gravity model ultimately selected 9 new river corridors (Figure 9c).
Remote sensing imagery was employed to identify feasible restoration sites for the proposed river corridors (Figure 10), with detailed information provided in Table 5. Most corridors (①, ③, ④, ⑤, ⑦, and ⑧) can be constructed at relatively low cost within existing green spaces. Corridor ⑨ may occupy open plaza areas, resulting in moderate construction costs. In contrast, corridors ② and ⑥ require routing through roads and paved surfaces, which would incur higher implementation costs. In terms of catchment area per unit river length, corridors ③ and ④ exhibit the highest values, indicating greater hydrological efficiency. Based on both cost and functional performance, corridors ③ and ④ are recommended as priority candidates for near-term implementation.
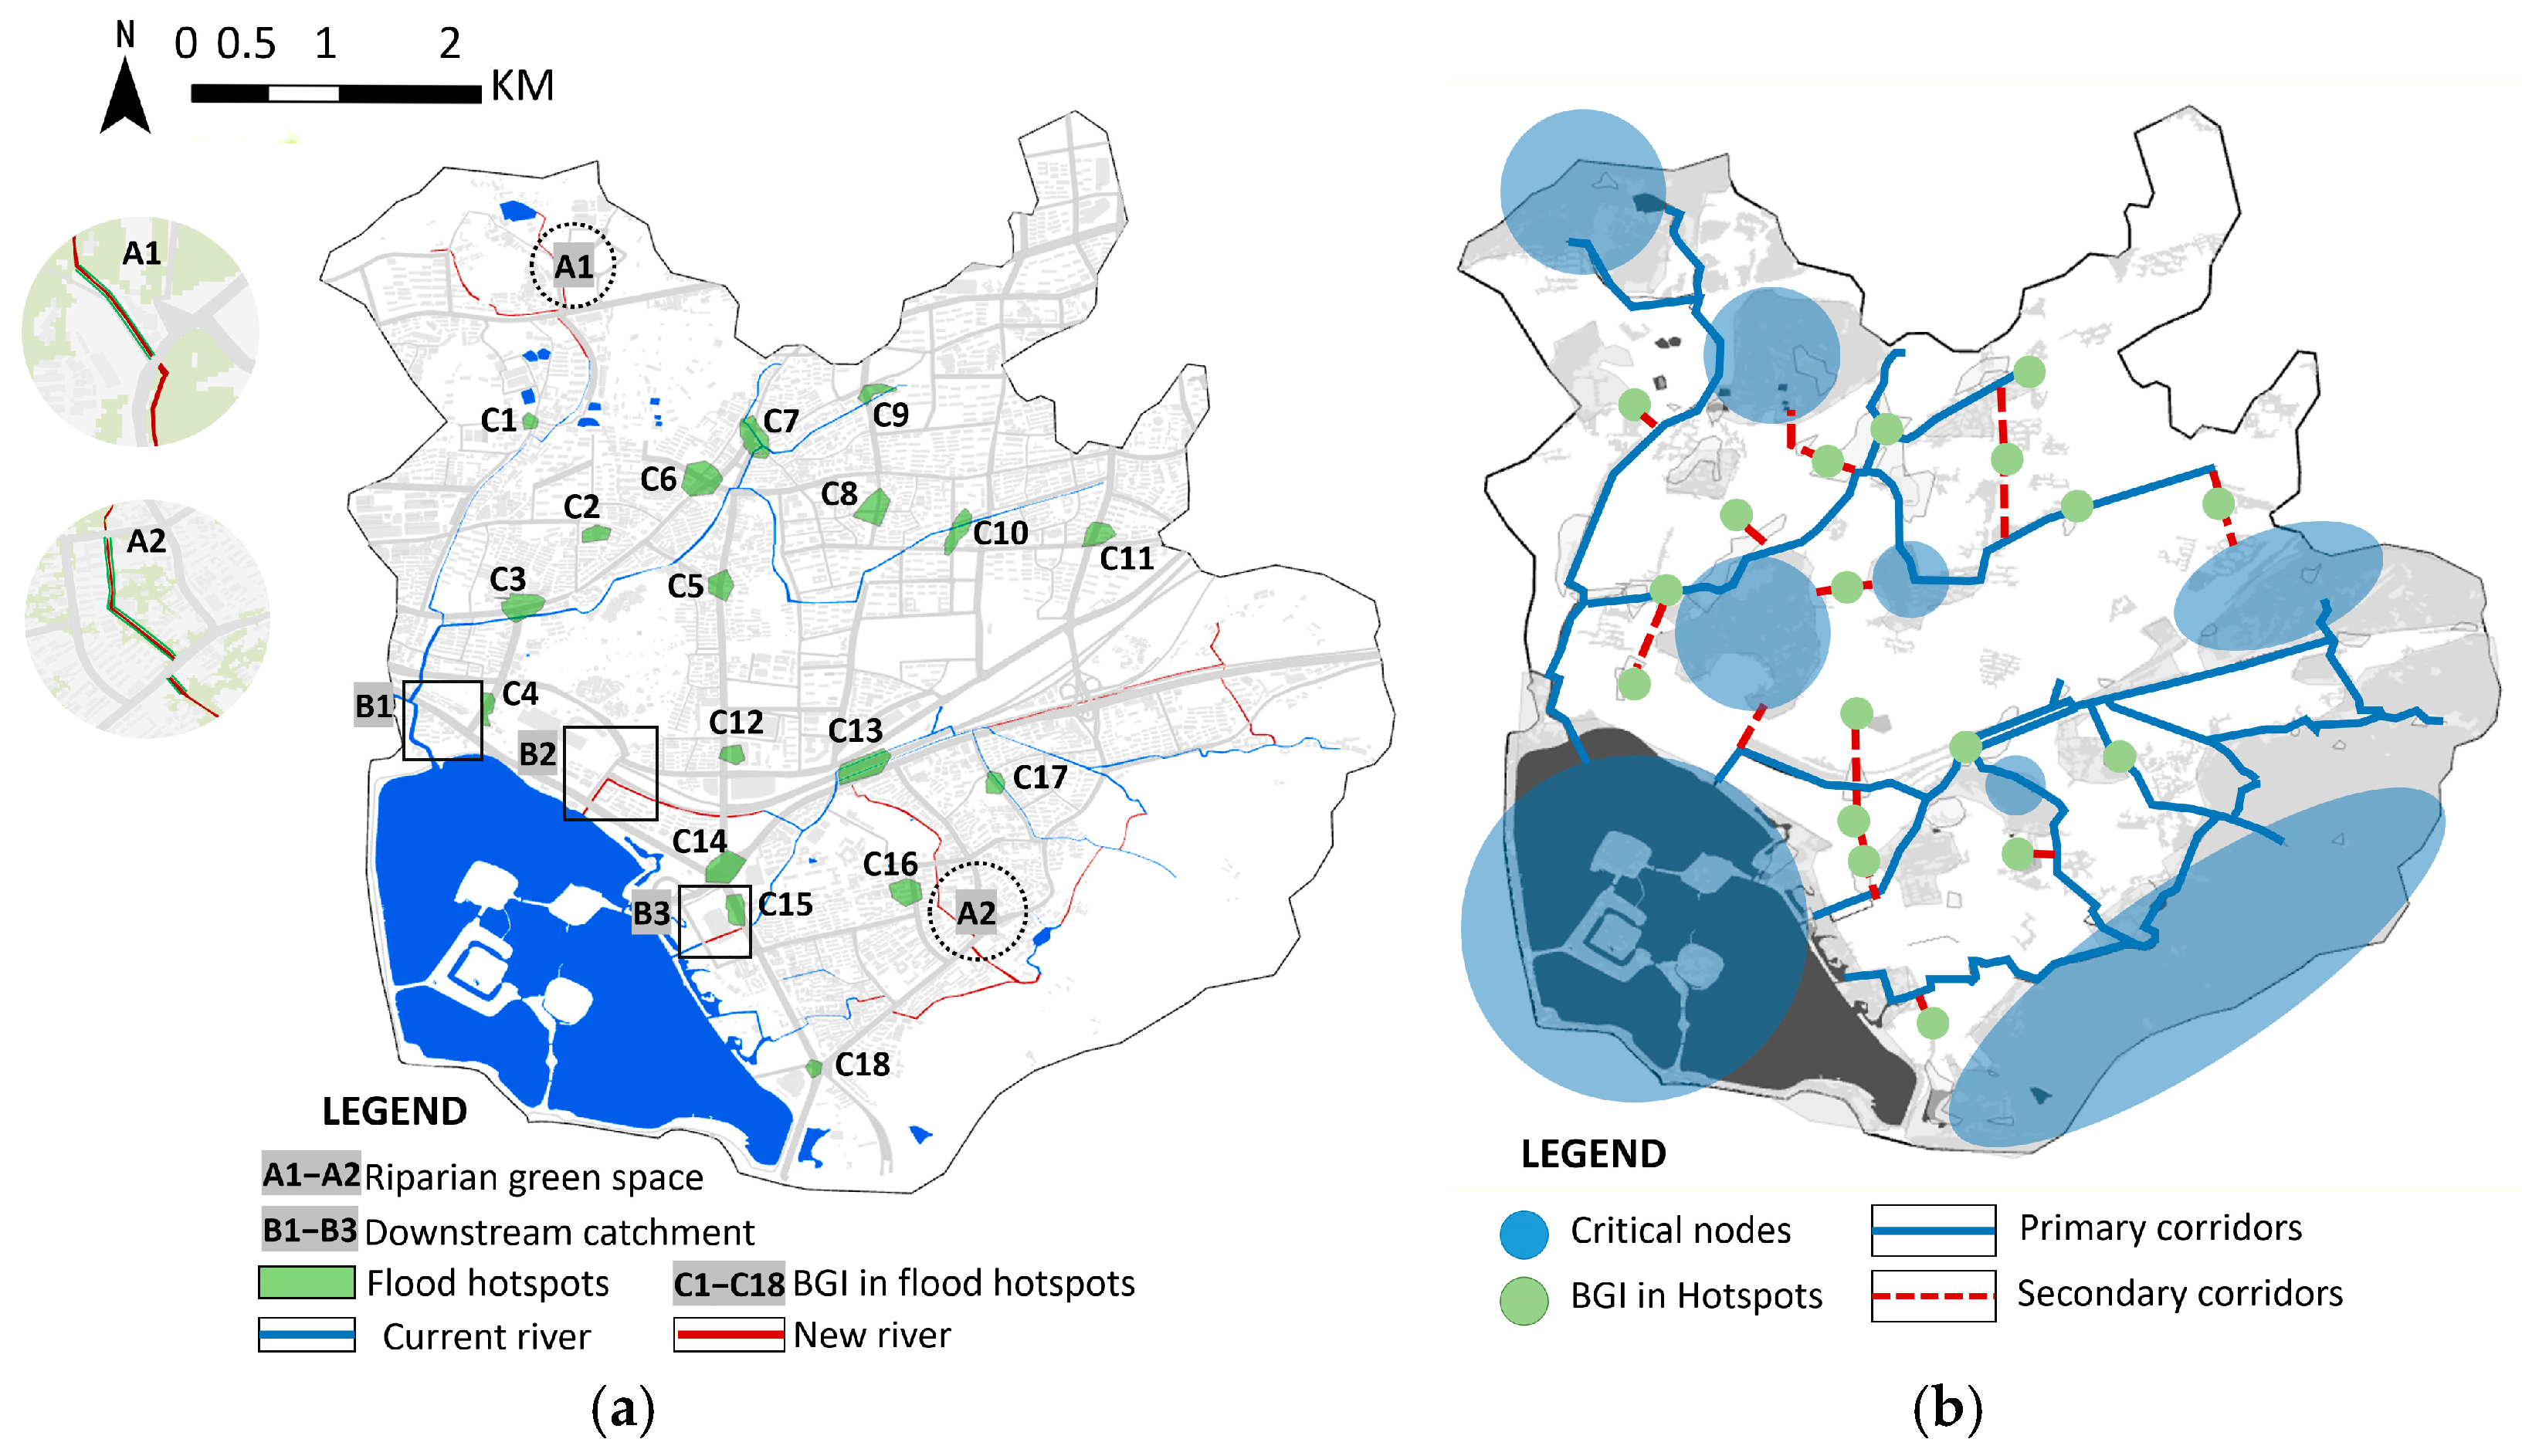
Establishing green infrastructure along river corridors can effectively mitigate overflow events. Specifically, River Corridor ② requires an additional green belt measuring 300 m in length and 1.8 m in width, while River Corridor ⑥ requires a green belt of 400 m in length and 4 m in width. In addition to protecting existing estuarine wetlands, green infrastructure was also introduced into the catchment units near the lake outlet. In particular, the green coverage ratios of downstream sub-catchments B1, B2, and B3 (Figure 11a) were increased by 10–15%.
Under a 100-year return period rainfall event, the inflow rates at the six river mouths were as follows: (a) 60.6 m3/s, (b) 21.1 m3/s, (c) 6.0 m3/s, (d) 31.5 m3/s, (e) 23.7 m3/s, and (f) 14.1 m3/s, yielding a total inflow of 142.9 m3/s. The designed discharge capacity of the four outflow rivers is 192.04 m3/s, comprising River A (100.0 m3/s), River B (59.7 m3/s), River C (8.82 m3/s), and River D (23.52 m3/s). Therefore, the inflow and outflow volumes are approximately balanced.
The newly added green infrastructure is illustrated in Figure 11a. A1 and A2 represent newly established riparian greenbelts, while green spaces with an additional 10–15% coverage were introduced in sub-catchments B1, B2, and B3. A total of 18 flood-prone hotspot areas (C1–C18) were identified within the study area. BGI was implemented in these hotspots to varying degrees, with coverage rates ranging from 10.60% to 38.20% (mean: 20.1%). Bioswales were the most frequently applied type, followed by rain gardens and retention ponds. The highest coverage (38.20%) occurred in C9 (bioswale), while the lowest (10.60%) was observed in C6 (retention pond). The green infiltration trench corridors shown in Figure 11b also constitute part of the newly added green infrastructure.
The main river corridors not only connect key green nodes but also pass through 6 of the 18 hotspot areas. The remaining 12 hotspots are connected to the river network via secondary corridors (Figure 11b). Representative catchments containing hotspot areas were selected for quantitative analysis.Under the design storm condition (1 h duration, 100-year return period), flood volumes in hotspot areas C7, C9, C15, and C16 were reduced by 56%, 80%, 52%, and 62%, respectively, following BGI optimization. These results indicate that the integration of BGI networks into flood-prone areas can significantly reduce flood risks. Furthermore, under a 100-year return period flood scenario, the optimized network reduced the total watershed flood volume by 35% compared to the pre-optimization condition.

4.2. Water Balance of Lake

Monthly water volumes are presented in Figure 12, with all values expressed in million cubic meters (Mm3). Precipitation peaked in June and July (0.909 Mm3 and 0.868 Mm3, respectively), reflecting strong seasonal variability. Lake surface evaporation exhibited a similar trend, reaching 0.737 Mm3 and 0.838 Mm3 in the same months. Annually, total precipitation over the lake water surface was 1.55 times the total evaporation. Monthly seepage beneath the lakebed (0.198–0.219 Mm3) and artificial water supplementation (7.84–8.68 Mm3) remained relatively stable. Water level adjustments showed a significant negative value in June (−1.852 Mm3) and notable positive values in May and October, corresponding to seasonal regulatory operations. Monthly inflow from the source area gradually increased in the early part of the year, peaking between May and July (2.810–3.340 Mm3), and then declined to its lowest level in November (0.416 Mm3). Lake outflow steadily increased from January to June, peaking in June (13.620 Mm3), followed by a decline to a minimum in October (8.683 Mm3), and a slight rebound in November and December.
Monthly reductions in artificial supplementation were positive for all months, indicating that water supplementation could be reduced year-round. These reductions ranged from 0.0035 Mm3 to 5.7 Mm3. The monthly reduction rate was calculated as the ratio of the projected reduction to the original supplementation volume (Table 6). The highest reduction occurred in June (62.2%), followed by July (43.4%). From May to August, all reduction rates exceeded 25%, while those in other months were comparatively lower. In addition, the SWMM was used to simulate inflows from the source area under an extended-duration scenario for 2023. The total annual inflow reached 13.25 Mm3, accounting for 13.0% of the total annual artificial supplementation.

5. Discussion

5.1. Management and Implementation

Build a Water Balance Regulation System

Past water environment issues should be re-evaluated from a holistic watershed perspective, aiming to construct a more systematic BGI network. Moving forward, emphasis should be placed on dynamic scheduling and seasonal management [69]. In responding to varying rainfall recurrence intervals and extreme climate events, water diversion measures should be dynamically adjusted based on fluctuations in natural inflows to the lake. For instance, artificial water supplementation can be significantly reduced between May and August, while moderate adjustments may be required during other periods. When natural inflows fall short of meeting ecological water demands, timely artificial supplementation remains essential. While the total annual volume of stormwater entering the lake under the optimized network accounts for approximately 13% of the previous artificial input, the high spatial and temporal variability of rainfall highlights the need for a hybrid regulation system that integrates both natural and artificial sources [70]. Rainwater should be efficiently collected and stored during wet seasons and scientifically allocated during dry periods to enhance water resource utilization efficiency.

5.2. Differences from Existing BGI Network Optimization Studies

This study differs significantly from previous works in the same field. In terms of research content, it adopts classic approaches to BGI network construction, such as identifying critical source areas using the landscape connectivity index [60], followed by determining key corridors through the MCR model and the gravity model [71]. However, this study extends beyond the common focus on identifying important corridors [72,73] and suitable areas [74] by further analyzing the performance and benefits of network optimization in greater depth.
The objectives of network optimization vary across studies. Most existing research focuses on reducing flood volumes as the primary optimization goal [50,75,76,77,78]. However, water-related challenges in urban environments do not exist in isolation; they are inherently interconnected. For example, mitigating urban flooding and alleviating water shortages in rivers and lakes are closely linked. This study adopts water balance as its core objective, aiming to address multiple water-related issues through an integrated and coordinated approach.
The perspective of constructing blue–green networks at the small watershed scale remains underexplored, with existing studies focusing on large-scale [79] or medium-scale urban systems [33]. As relatively independent geographical units with relatively complete hydrological cycles [50], small watersheds represent a suitable scale for achieving water balance and serve as an ideal unit for urban hydrological management [79]. Addressing this gap offers critical evidence for evaluating the effectiveness of BGI networks at the watershed level.
In addition, the corridors constructed in those studies [50,74,75,76,78] mainly connect large and continuous blue–green spaces in urban areas, without considering the integration of small and scattered BGI elements located in densely populated zones [41]. Nevertheless, although limited in scale, these decentralized BGI components are important for ensuring flood resilience in built-up urban areas [78]. Neglecting their value may result in a BGI network that is incomplete and insufficient for managing localized hydrological risks [41].
Different studies often select specific types of BGI according to their respective objectives [12,80,81,82]. For instance, green roof-centered networks tend to focus on providing habitat and connectivity for highly mobile species such as birds [80], while blue–green networks composed of parks, lakes, and waterways are commonly employed for stormwater management across urban areas spanning several hundred square kilometers [12]. This study focuses on maximizing hydrological connectivity within small urban watersheds and therefore prioritizes representative BGI types with direct stormwater conveyance functions, including rivers, riparian green spaces, and green infiltration trenches, as the main components of the corridor system. This combination is capable of meeting the dual requirements of detention and stormwater conveyance efficiency [79,82].
In this study, the scenario design incorporates not only conventional constraints such as spatial scale and flood control requirements but also an attempt to coordinate blue and green infrastructure, which is explicitly integrated into the optimization framework. The results demonstrate that through coordinated planning with blue infrastructure, green infrastructure can also contribute meaningfully to enhancing hydrological connectivity and improving regional flood resilience. The primary corridors are composed of a hybrid system combining rivers and riparian greenbelts. As a key element of green infrastructure, the greenbelt is deployed along the blue infrastructure network, serving to expand the floodplain area, reduce the risk of overflow, and strengthen regional flood protection capacity [17]. For example, the installation of riparian greenbelts allows the river system to retain floodwaters during a 1-in-20-year storm event without overtopping. The secondary corridors consist of a system of green infiltration trenches, which are composite structures integrating linear green space, infiltration components, and drainage layers [19]. These corridors serve as connectors between decentralized BGI elements and the main river system. By improving the hydrological linkage of surface runoff pathways, green infiltration trenches facilitate the conveyance of local stormwater to receiving rivers and alleviate flooding at the site scale [81].
Overall, although green infrastructure cannot match the large-scale drainage capacity of blue infrastructure, it plays a vital role within the BGI network by reinforcing connectivity, filling structural gaps, and mitigating localized pluvial flooding [15]. The integration of both systems leads to the formation of a complete and multi-level blue–green network. In contrast, most existing studies have not advanced to this level of integration [71,72,73,74,75,76,77]. A few have explored spatial layout scenarios individually, such as allocating large green spaces downstream [78], constructing tertiary drainage ditches [50], or expanding river networks [82,83]. While these studies provide valuable references, further development is needed in scenario designs that incorporate coordinated blue–green integration.
Finally, in terms of conclusions, the ability of BGI network optimization to enhance flood control capacity has been acknowledged in part of the existing literature [12,33,76,78]. However, there remains a lack of direct evidence supporting its effectiveness in improving water balance. This study provides support for the latter. In summary, this research differs from comparable studies in several key aspects, including research content, objectives, spatial scale, and scenario design. These distinctions have enabled the proposed network configuration to more effectively address small watershed-scale water balance issues, thereby opening a more targeted and innovative pathway for BGI network optimization.

5.3. Research Value

This study is situated within the broader context of global urban stormwater management and demonstrates a degree of transferability, which is reflected in the following four aspects. First, the typicality of the problem. The selected study area exhibits typical geographical features of small urban watersheds and faithfully reflects the interactional imbalance among population, water bodies, and land use in high-density urban environments [79]. The study conducts an in-depth analysis of common environmental problems in such watersheds, such as water shortages in rivers and lakes and urban flooding, and provides referential solutions. Second, the novelty of the research perspective. This study verifies that optimizing BGI networks can maximize the use of rainfall resources, significantly improve water balance in small urban watersheds, and enhance system resilience. These findings offer a new perspective for future BGI network planning.
Third, the referential value of certain methods. Due to the specific characteristics of the study area, the specific operation procedures of the research cannot be completely replicated in another environment. However, the research concepts and some methods can be extended to other similar urban backgrounds, especially in lakeside areas. For example, a preliminary potential analysis conducted before hydrological experiments is essential for assessing the feasibility of subsequent work. Reconstructing the network using the connectivity index, the MCR model, and the gravity model, in conjunction with the synergy between green and blue spaces, can facilitate the development of a rational and efficient spatial network. Combining the water balance model with the SWMM can achieve dynamic quantification of the inflow and outflow processes of the lake. These operations need to adjust parameters and schemes according to specific fields, but their overall ideas have good transferability.
Fourth, the scalability of the research framework. The framework developed in this study comprises two components: scientific simulation models and planning–design applications grounded in real urban contexts. By integrating theory with practice, it establishes the applied value of corridor optimization in real-world settings. Compared with existing studies that focus solely on theoretical network structures and lack consideration of real-world constraints [33,75,76], this study identifies balanced solutions under multiple constraints, providing a foundation for assessing the applicability and scalability of BGI networks in complex urban governance contexts.

5.4. Limitations and Future Research Directions

Given the widespread limitations on urban spatial resources, a successful BGI network strategy must possess sufficient flexibility to adapt to evolving spatial conditions. One of the key challenges at present lies in bridging the gap between model-based optimization and the realities of policy execution [84]. Although the optimization model developed in this study is scientifically sound, it does not yet incorporate policy-related variables in an explicit manner. Future research should focus on evaluating the performance and applicability of BGI networks under multiple policy scenarios, in order to enhance their adaptability, resilience, and scalability within complex urban governance contexts [85]. For example, incorporating the spatiotemporal dynamics of network structures, such as those informed by projected land use change [86] or anticipated patterns of economic growth [87], could support the development of more dynamically adaptive BGI networks.
Furthermore, as this study is based on model assumptions, future work should focus on enhancing model accuracy by integrating multi-source datasets. Such improvements will allow for more detailed representations of how the spatial configuration of BGI influences hydrological processes, thereby improving the realism and practical applicability of the simulation results. Meanwhile, this study tested a specific BGI network optimization scheme to validate the hypothesis that optimizing the BGI network can significantly improve water imbalance issues at the watershed scale. However, the mechanisms through which different spatial configurations of BGI networks affect their performance remain unexplored. In addition, incorporating multi-objective optimization algorithms will allow for the simultaneous consideration of performance metrics such as retention efficiency [88], construction cost [89], and landscape value [90], thereby supporting the development of a more integrated and balanced BGI network.

6. Conclusions

Firstly, based on data on topography, land use, soil conditions, and precipitation, this study delineated the main catchment areas within the watershed and estimated that the total runoff volume in 2023 could reach 16.43 Mm3. This finding highlights the watershed’s great potential for natural water recharge and provides a critical foundation for the strategic utilization of rainwater resources.
Secondly, to optimize the spatial configuration of the BGI network, this study incorporated two key factors, hydrological connectivity and flood safety, into the design of an integrated BGI scenario. Using landscape connectivity analysis, the Minimum Cumulative Resistance (MCR) model and the gravity model, the study identified key river corridors and strategically allocated adjacent waterfront green spaces. The green infiltration trench corridors are spatially aligned with the distribution of decentralized BGI elements to ensure the effective collection, conveyance, and storage of runoff. The resulting network forms a multi-scale system characterized by spatial coherence, strong retention capacity, and enhanced resilience to rainfall variability.
In terms of performance verification, the results indicate that the BGI network can achieve a 62.2% reduction in artificial water supplementation in June and effectively supplement lake water throughout the year. The total volume of natural runoff entering the lake over the year reached 13.25 Mm3, accounting for 13% of the annual water supplementation demand. In addition, under the optimized scenario, urban flood risk was significantly reduced, with a 35% decrease in total watershed flood volume and an average flood volume reduction of over 50% in typical inundation-prone units. These results highlight the dual benefits of the BGI network solution in enhancing water resource utilization while simultaneously mitigating flood risk. The study validates the hypothesis that optimizing the BGI network can maximize the utilization of watershed rainfall resources, significantly improve lake water balance, and enhance system resilience.

Author Contributions

Conceptualization, X.C. and X.W.; methodology, X.C.; software, X.C.; validation, X.C. and X.W.; formal analysis, X.C.; investigation, X.C.; resources, X.C. and X.W.; data curation, X.C.; writing—original draft preparation, X.C.; writing—review and editing, X.W.; visualization, X.C.; supervision, X.C.; project administration, X.C.; funding acquisition, X.W. All authors have read and agreed to the published version of the manuscript.

Funding

This research was funded by the National Natural Science Foundation of China, grant numbers 50978054 and 51878144, and the Postgraduate Research and Postgraduate Research & Practice Innovation Program of Jiangsu Province, grant number SJCX25_0108.

Data Availability Statement

The raw data supporting the conclusions of this article will be made available by the authors on request.

Acknowledgments

The authors gratefully acknowledge the Nanjing Water Authority and the Nanjing Municipal Bureau of Planning and Natural Resources for providing the datasets used in this study. Special thanks are extended to Zhigao Wu for his assistance during field data collection and to Mengjun Hu, Zhigao Wu and Xuntong Zhuang for their valuable review of the applied methodology.

Conflicts of Interest

The authors declare no conflicts of interest.

Appendix A

Appendix A.1

The intensity formula of rainstorm in Nanjing is shown below, and the 20-year return period 2 h precipitation time series is shown in Figure A1.
i = 16.696 ( 1 + 0.954 l o g P ) ( t + 18.825 ) 0.751
In the equation, i is the design rainfall intensity, in units of mm/min; t is the rainfall duration, in minutes; and P is the return period, in years. Based on Equation (A1), the Chicago Rainfall Pattern Generator is used to generate the design rainfall intensity–time curve for a rainfall duration of 120 min, with a peak factor r = 0.393.
Figure A1. Temporal distribution of rainfall intensity (Source: Drawn by the authors).
Land 14 01652 g0a1

Appendix A.2

The four evaluation criteria—elevation, land cover, slope, and distance to rivers—were used to derive the weights through the Analytic Hierarchy Process (AHP). Table A1 presents the pairwise comparison matrix constructed for these indicators and the resulting weights.
Table A1. The result of the AHP analysis. (Source: Drawn by the authors).
ElevationSlopeLand CoverDistance to RiversWeight (Value)
Elevation112334%
Slope112231%
Land cover1/21/21221%
Distance to rivers1/31/21/2114%

Appendix A.3

The LID facility parameters of the infiltration trench, bioswales, and rain garden are shown in Table A2(a–c). These parameters were determined with reference to the guidelines provided by the SWMM.
Table A2. (a) Parameter settings for infiltration trench (Source: Drawn by the authors). (b) Parameter settings for bioswales (Source: Drawn by the authors). (c) Parameter settings for rain garden (Source: Drawn by the authors).
(a)
ParameterIndicatorsParameters
Surface Layer Properties Berm Height (or Storage Depth)200
Vegetative Volume Fraction0.15
Surface Roughness0.1
Surface Slope2
Storage Layer PropertiesThickness600
Void Ratio0.45
Seepage Rate 7
Clogging Factor0
Drainage Layer PropertiesDrain Coefficient 25
Drain Exponent0.5
Drain Offset Height50
(b)
ParameterIndicatorsParameters
Surface Layer Properties Berm Height (or Storage Depth)200
Vegetative Volume Fraction0.15
Surface Roughness0.1
Surface Slope2
Swale Side Slope4
(c)
ParameterIndicatorsParameters
Surface Layer Properties Berm Height (or Storage Depth)100
Vegetative Volume Fraction0.2
Surface Roughness0.2
Surface Slope2
Storage Layer PropertiesThickness250
Void Ratio0.35
Seepage Rate 10
Clogging Factor0.1
Soil PropertiesThickness 450
Porosity0.5
Field Capacity0.2
Wilting Point0.1
Conductivity20
Conductivity Slope3.5

References

  1. Adhikari, U.; Broekhuizen, I.; Pons, V.; Sun, Z.; Sjöman, J.D.; Randrup, T.B.; Viklander, M.; Blecken, G.-T. Comparing the hydrological performance of blue green infrastructure design strategies in urban/semi-urban catchments for stormwater management. Water Sci. Technol. 2024, 90, 2696–2712. [Google Scholar] [CrossRef]
  2. Alamdari, N.; Hogue, T.S. Assessing the effects of climate change on urban watersheds: A review and call for future research. Environ. Rev. 2022, 30, 61–71. [Google Scholar] [CrossRef]
  3. Battemarco, B.P.; Tardin-Coelho, R.; Veról, A.P.; de Sousa, M.M.; da Fontoura, C.V.T.; Figueiredo-Cunha, J.; Barbedo, J.M.R.; Miguez, M.G. Water dynamics and blue-green infrastructure (BGI): Towards risk management and strategic spatial planning guidelines. J. Clean. Prod. 2022, 333, 129993. [Google Scholar] [CrossRef]
  4. UN Water (Ed.) The United Nations World Water Development Report: Valuing Water; UNESCO: Paris, France, 2021. [Google Scholar]
  5. Cavadini, G.B.; Rodriguez, M.; Cook, L.M. Connecting blue-green infrastructure elements to reduce combined sewer overflows. J. Environ. Manag. 2024, 365, 121465. [Google Scholar] [CrossRef]
  6. Chen, J.; Ji, J.; Wang, H.; Deng, M.; Yu, C. Risk Assessment of Urban Rainstorm Disaster Based on Multi-Layer Weighted Principal Component Analysis: A Case Study of Nanjing, China. Int. J. Environ. Res. Public Health 2020, 17, 5523. [Google Scholar] [CrossRef]
  7. Brody, S.D.; Highfield, W.E.; Blessing, R.; Makino, T.; Shepard, C.C. Evaluating the effects of open space configurations in reducing flood damage along the Gulf of Mexico coast. Landsc. Urban Plan. 2017, 167, 225–231. [Google Scholar] [CrossRef]
  8. Christenson, E.; Elliott, M.; Banerjee, O.; Hamrick, L.; Bartram, J. Climate-Related Hazards: A Method for Global Assessment of Urban and Rural Population Exposure to Cyclones, Droughts, and Floods. Int. J. Environ. Res. Public Health 2014, 11, 2169–2192. [Google Scholar] [CrossRef]
  9. Cavadini, G.B.; Rodriguez, M.; Nguyen, T.; Cook, L.M. Can blue–green infrastructure counteract the effects of climate change on combined sewer overflows? Study of a swiss catchment. Environ. Res. Lett. 2024, 19, 094025. [Google Scholar] [CrossRef]
  10. Chen, W.; Wang, W.; Huang, G.; Wang, Z.; Lai, C.; Yang, Z. The capacity of grey infrastructure in urban flood management: A comprehensive analysis of grey infrastructure and the green-grey approach. Int. J. Disaster Risk Reduct. 2021, 54, 102045. [Google Scholar] [CrossRef]
  11. Wang, Z.; Li, Z.; Liu, C.; Li, Y.; Liu, X.; Hao, X. Discussion on Water Cycle Mechanism of Interconnected River System Network. J. Nat. Resour. 2011, 26, 523–529. [Google Scholar]
  12. Ahmed, S.; Meenar, M.; Alam, A. Designing a Blue-Green Infrastructure (BGI) Network: Toward Water-Sensitive Urban Growth Planning in Dhaka, Bangladesh. Land 2019, 8, 138. [Google Scholar] [CrossRef]
  13. Almaaitah, T.; Appleby, M.; Rosenblat, H.; Drake, J.; Joksimovic, D. The potential of Blue-Green infrastructure as a climate change adaptation strategy: A systematic literature review. Blue-Green Syst. 2021, 3, 223–248. [Google Scholar] [CrossRef]
  14. European Commission. Green Infrastructure (GI)—Enhancing Europe’s Natural Capital; European Commission: Brussels, Belgium, 2013. [Google Scholar]
  15. Hamel, P.; Tan, L. Blue–Green Infrastructure for Flood and Water Quality Management in Southeast Asia: Evidence and Knowledge Gaps. Environ. Manag. 2022, 69, 699–718. [Google Scholar] [CrossRef]
  16. Zannat, E.U.; Dedekorkut-Howes, A.; Morgan, E.A. A review of nature-based infrastructures and their effectiveness for urban flood risk mitigation. WIREs Clim. Change 2024, 15, e889. [Google Scholar] [CrossRef]
  17. Gu, J.; Lyu, X.; Fang, B.; Hui, Q.; Cao, Y. Study on Planning and Design of Blue-Green-Gray Transformation of Lakeside Cities to Deal with the Complex Urban Waterlogging Caused by Extreme Rainstorm. Land 2023, 12, 289. [Google Scholar] [CrossRef]
  18. Luo, Z.; Tian, J.; Zeng, J.; Pilla, F. Resilient landscape pattern for reducing coastal flood susceptibility. Sci. Total Environ. 2023, 856, 159087. [Google Scholar] [CrossRef]
  19. Mugume, S.N.; Kibibi, H.; Sorensen, J.; Butler, D. Can Blue-Green Infrastructure enhance resilience in urban drainage systems during failure conditions? Water Sci. Technol. 2024, 89, 915–944. [Google Scholar] [CrossRef]
  20. Tansar, H.; Duan, H.F.; Mark, O. Catchment-scale and local-scale based evaluation of LID effectiveness on urban drainage system performance. Water Resour. Manag. 2022, 36, 507–526. [Google Scholar] [CrossRef]
  21. Meng, L.Y.; Tian, Z.; Fan, D.L.; van de Ven, F.H.M.; Sun, L.; Ye, Q.H.; Sun, S.X.; Liu, J.G.; Nougues, L.; Rooze, D. A multi-objective optimization approach for harnessing rainwater in changing climate. Adv. Clim. Change Res. 2024, 15, 976–987. [Google Scholar] [CrossRef]
  22. Zhou, Q. A Review of Sustainable Urban Drainage Systems Considering the Climate Change and Urbanization Impacts. Water 2014, 6, 976–992. [Google Scholar] [CrossRef]
  23. Wang, D.; Liu, C.; Guo, Y.; Tang, P.; Jiao, J.; Kong, W.; Zhang, L.; Liu, Y.; Kong, D. Research strategy for constructing a green infrastructure network based on spatial prioritization. Ecosyst. Health Sustain. 2022, 8, 2088403. [Google Scholar] [CrossRef]
  24. Hysa, A. Introducing Transversal Connectivity Index (TCI) as a method to evaluate the effectiveness of the blue-green infrastructure at metropolitan scale. Ecol. Indic. 2021, 124, 107432. [Google Scholar] [CrossRef]
  25. Yang, Z.; Feng, M.Q. Research on the Water System Connectivity Scheme of Urban Artificial Shallow Lake Groups. Yangtze River 2020, 51, 49–58. [Google Scholar]
  26. Geng, J.Y. Research on the Restoration of the Xuanwu Lake Watershed Water System Combined with Green Space Layout; Southeast University: Nangjing, China, 2020. [Google Scholar]
  27. Liu, Y.; Zhai, Y.; Cui, B. Hydrological connectivity for synergism between environmental flow and water quality in urban river-lake system. J. Environ. Manag. 2025, 381, 125300. [Google Scholar] [CrossRef]
  28. Li, Y.; Zhang, Q.; Yao, J.; Tan, Z.; Liu, X. Assessment of water storage response to surface hydrological connectivity in a large floodplain system (Poyang Lake, China) using hydrodynamic and geostatistical analysis. Stoch. Environ. Res. Risk Assess. 2019, 33, 2071–2088. [Google Scholar] [CrossRef]
  29. Zhang, Z.; Huang, Y.; Xu, C.-Y.; Chen, X.; Moss, E.M.; Jin, Q.; Bailey, A.M. Analysis of Poyang Lake water balance and its indication of river–lake interaction. SpringerPlus 2016, 5, 1555. [Google Scholar] [CrossRef] [PubMed]
  30. Zhao, W.; Yang, R.; Wang, Q. Multi-Scale Collaborative Planning Path and Methods of Blue-Green Space for Hilly Cities: Taking Ziyang City as an Example. J. Hum. Settl. West China 2023, 38, 31–39. [Google Scholar]
  31. Zhu, Y.; Chen, Y.; Ma, Y.; Xu, E.; Zhang, S.; Zhang, Y.; Tian, G.H. Construction of blue-green infrastructure network in Dengfeng City under flooding risk stress. J. China Agric. Univ. 2023, 28, 175–188. [Google Scholar]
  32. Molné, F.; Donati, G.F.; Bolliger, J.; Fischer, M.; Maurer, M.; Bach, P.M. Supporting the planning of urban blue-green infrastructure for biodiversity: A multi-scale prioritisation framework. J. Environ. Manag. 2023, 342, 118069. [Google Scholar] [CrossRef]
  33. Kaur, R.; Gupta, K. Blue-Green Infrastructure (BGI) network in urban areas for sustainable storm water management: A geospatial approach. City Environ. Interact. 2022, 16, 100087. [Google Scholar] [CrossRef]
  34. Herath, P.; Bai, X. Benefits and co-benefits of urban green infrastructure for sustainable cities: Six current and emerging themes. Sustain. Sci. 2024, 19, 1039–1063. [Google Scholar] [CrossRef]
  35. Dai, W.; Liu, B.X. Research on the Application of NbS in Urban Rainstorm Flood Resilience Planning. Chin. Landsc. Archit 2023, 39, 53–58. [Google Scholar] [CrossRef]
  36. Sehrawat, S.; Shekhar, S. Potential sites for blue-green infrastructure in Gurugram, India; a multicriteria analysis. GeoJournal 2024, 89, 36. [Google Scholar] [CrossRef]
  37. Harlis, T.A.; Seo, S.B. Land suitability analysis for blue-green infrastructure implementation in an urban stormwater management system in Surabaya, Indonesia. Water Sci. Technol. 2024, 90, 1501–1519. [Google Scholar] [CrossRef]
  38. Xing, W.; Xu, W.; Wang, K.; Yan, X. Risk analysis of hydrological failures of levees in external Qinhuai River. J. Hohai Univ. Nat. Sci. 2006, 34, 262–266. [Google Scholar]
  39. Ye, C.; Xu, Z.; Lei, X.; Zhang, R.; Chu, Q.; Li, P.; Ban, C. Assessment of the impact of urban water system scheduling on urban flooding by using coupled hydrological and hydrodynamic model in Fuzhou City, China. J. Environ. Manag. 2022, 321, 115935. [Google Scholar] [CrossRef] [PubMed]
  40. Zhu, L.; Gao, C.; Wu, M.; Zhu, R. Integrating Blue–Green Infrastructure with Gray Infrastructure for Climate-Resilient Surface Water Flood Management in the Plain River Networks. Land 2025, 14, 634. [Google Scholar] [CrossRef]
  41. Zhou, M.; He, Y.; Qiu, Z. Construction of a Multi-level Blue-Green Infrastructure Network in a Riverside City: A Case Study of Shaoxing. Ecosyst. Health Sustain. 2025, 11, 0287. [Google Scholar] [CrossRef]
  42. Azis, S.S.A.; Zulkifli, N.A.A. Green roof for sustainable urban flash flood control via cost benefit approach for local authority. Urban For. Urban Green. 2021, 57, 126876. [Google Scholar] [CrossRef]
  43. Zhai, J.; Kong, H.; Xiao, H.; Yu, Q. Water Quantity Design of Urban Artificial Landscape Lake. China Water Wastewater 2012, 28, 55–56,58. [Google Scholar]
  44. Wu, J.; Lin, H.; Ji, H.; Wu, Z.; Jin, S. Calculation of water quantity entering the Taihu Lake from the Huxi sub-basin during flood season under the background of urbanization. Adv. Water Sci. 2021, 32, 577–586. [Google Scholar]
  45. Yu, M.; Zhang, H. Suitable water level for landscape function of lakes in southern plains of China based on optimization of comprehensive benefits. J. Hohai Univ. Nat. Sci. 2015, 43, 222–229. [Google Scholar]
  46. Xu, W.; Cao, S. Calculation method of eco-environmental water demand of urban lake with an example of Dongchang lake in Liaocheng city of China. J. Hydroelectr. Eng. 2009, 28, 102–107. [Google Scholar]
  47. Li, X.N.; Zhang, S.Y.; Zhu, G.E. Research and Practice on the Technology of Urban River-Lake Connectivity and Water Environment Remediation: A Case Study of Jinji Lake and Its Surrounding River Network. Yangtze River 2021, 52, 31–37. [Google Scholar]
  48. Wang, Z.J.; Li, C.Y.; Li, W.P.; Zhang, S. Calculation and Analysis of Water Balance of Hulun Lake in Inner Mongolia. Lake Sci. 2012, 24, 273–281. [Google Scholar]
  49. Zhang, S.H.; Chen, Z.Q. Research on the Design of Water Replenishment Scheme for an Artificial Lake in a Certain City. Water Supply Drain. 2023, 59, 605–609. [Google Scholar]
  50. Granados Aragonez, R.A.; Martinez Duran, A.; Martin, X. Green Infrastructure for Reintegrating Fragmented Urban Fabrics: Multiscale Methodology Using Space Syntax and Hydrologic Modeling. Urban Sci. 2025, 9, 208. [Google Scholar] [CrossRef]
  51. Sinder, D. Chapter 16 Hydrographs. In National Engineering Handbook; United States Department of Agriculture Soil Conservation Service: Washington, DC, USA, 1972; Section 4: Hydrology; pp. 16.1–16.24. [Google Scholar]
  52. Huang, M.; Gallichand, J.; Wang, Z.; Goulet, M. A modification to the Soil Conservation Service curve number method for steep slopes in the Loess Plateau of China. Hydrol. Process. 2006, 20, 579–589. [Google Scholar] [CrossRef]
  53. Lian, H.; Yen, H.; Huang, J.-C.; Feng, Q.; Qin, L.; Bashir, M.A.; Wu, S.; Zhu, A.-X.; Luo, J.; Di, H.; et al. CN-China: Revised runoff curve number by using rainfall-runoff events data in China. Water Res. 2020, 177, 115767. [Google Scholar] [CrossRef] [PubMed]
  54. Ma, L.; Wang, C.; Wang, W.; Zhang, L.; Huang, H.; Zhang, S. Regional Runoff Characteristics in Zhengzhou City Based on SCS-CN Model. Bull. Soil Water Conserv. 2022, 42, 203–209. [Google Scholar]
  55. Wang, M.; Zhao, Y.; Shi, W.; Yu, J.; Chen, T.; Bao, J.; Song, W.; Chen, H. A modified curve number method for runoff prediction of different soil types in China. CATENA 2025, 254, 108957. [Google Scholar] [CrossRef]
  56. Saura, S.; Pascual-Hortal, L. A new habitat availability index to integrate connectivity in landscape conservation planning: Comparison with existing indices and application to a case study. Landsc. Urban Plan. 2007, 83, 91–103. [Google Scholar] [CrossRef]
  57. Saura, S.; Rubio, L. A common currency for the different ways in which patches and links can contribute to habitat availability and connectivity in the landscape. Ecography 2010, 33, 523–537. [Google Scholar] [CrossRef]
  58. Saaty, T.L. A scaling method for priorities in hierarchical structures. J. Math. Psychol. 1977, 15, 234–281. [Google Scholar] [CrossRef]
  59. Wedley, W.C. Consistency prediction for incomplete AHP matrices. Math. Comput. Model. 1993, 17, 151–161. [Google Scholar] [CrossRef]
  60. Chen, H.; Liu, Y.; Hu, L.; Zhang, Z.; Chen, Y.; Tan, Y.; Han, Y. Constructing a Flood-Adaptive Ecological Security Pattern from the Perspective of Ecological Resilience: A Case Study of the Main Urban Area in Wuhan. Int. J. Environ. Res. Public Health 2023, 20, 385. [Google Scholar] [CrossRef]
  61. Cheng, Y.; Wang, X. Ecological Logic of Urban Blue-green Space Integration Planning. Chin. Landsc. Archit. 2023, 39, 39–43. [Google Scholar]
  62. Jiao, X.; Zhang, Y.; Liu, X.; Lu, X.; Zhao, Z. Construction and Integration Evaluation of Blue-green Space Index System of Typical Rivers and Lakes in Shanghai. Resour. Environ. Yangtze Basin 2023, 32, 995–1004. [Google Scholar]
  63. Jiao, X.; Zhao, Z.; Li, X.; Wang, Z.; Zhang, Y. Advances in the blue-green space evaluation index system. Ecohydrology 2023, 16. [Google Scholar] [CrossRef]
  64. Wang, X.-J.; Wei, X.; Chen, X. Morphological Suitability Analysis of Urban Greenspaces with Rivers: A Case Study of the Lixiahe Riverine Area. Sustainability 2022, 14, 13266. [Google Scholar] [CrossRef]
  65. Khatooni, K.; Hooshyaripor, F.; MalekMohammadi, B.; Noori, R. A new approach for urban flood risk assessment using coupled SWMM–HEC-RAS-2D model. J. Environ. Manag. 2025, 374, 123849. [Google Scholar] [CrossRef]
  66. Pushpalatha, R.; Perrin, C.; Le Moine, N.; Andréassian, V. A review of efficiency criteria suitable for evaluating low-flow simulations. J. Hydrol. 2012, 420, 171–182. [Google Scholar] [CrossRef]
  67. Chen, F.R.; Yan, C.T. Discussion on the Waterproofing System of Xuanwu Lake Tunnel in Nanjing. Tunn. Constr. 2005, 5, 4–5. [Google Scholar]
  68. Sun, Z.Y.; Jiang, C.L. Research on the Ecological Water Level of Xuanwu Lake Based on Aquatic Plant Restoration. Adv. Sci. Technol. Water Resour. 2023, 43, 49–54+76. [Google Scholar]
  69. Chiew, F.H.S.; Zhou, S.L.; McMahon, T.A. Use of seasonal streamflow forecasts in water resources management. J. Hydrol. 2003, 270, 135–144. [Google Scholar] [CrossRef]
  70. Raimondi, A.; Quinn, R.; Abhijith, G.R.; Becciu, G.; Ostfeld, A. Rainwater Harvesting and Treatment: State of the Art and Perspectives. Water 2023, 15, 1518. [Google Scholar] [CrossRef]
  71. Chen, X.; Xu, L.; Zhu, R.; Ma, Q.; Shi, Y.; Lu, Z. Changes and Characteristics of Green Infrastructure Network Based on Spatio-Temporal Priority. Land 2022, 11, 901. [Google Scholar] [CrossRef]
  72. Liu, Y.; Huang, T.-T.; Zheng, X. A method of linking functional and structural connectivity analysis in urban green infrastructure network construction. Urban Ecosyst. 2022, 25, 909–925. [Google Scholar] [CrossRef]
  73. Wang, S.; Wu, M.; Hu, M.; Fan, C.; Wang, T.; Xia, B. Promoting landscape connectivity of highly urbanized area: An ecological network approach. Ecol. Indic. 2021, 125, 107487. [Google Scholar] [CrossRef]
  74. Geng, J.; Yu, K.; Sun, M.; Xie, Z.; Huang, R.; Wang, Y.; Zhao, Q.; Liu, J. Construction and Optimisation of Ecological Networks in High-Density Central Urban Areas: The Case of Fuzhou City, China. Remote Sens. 2023, 15, 5666. [Google Scholar] [CrossRef]
  75. Shi, X.; Qin, M.; Li, B.; Zhang, D. A Framework for Optimizing Green Infrastructure Networks Based on Landscape Connectivity and Ecosystem Services. Sustainability 2021, 13, 10053. [Google Scholar] [CrossRef]
  76. Chen, X.; Davitt-Liu, I.; Erickson, A.J.; Feng, X. Integrating the Spatial Configurations of Green and Gray Infrastructure in Urban Stormwater Networks. Water Resour. Res. 2023, 59, e2023WR034796. [Google Scholar] [CrossRef]
  77. Lim, T.C.; Welty, C. Effects of spatial configuration of imperviousness and green infrastructure networks on hydrologic response in a residential sewershed. Water Resour. Res. 2017, 53, 8084–8104. [Google Scholar] [CrossRef]
  78. Hu, G.; Zhang, Y.; Chen, C.; Shen, Z.; Hu, Y.; Yin, H.; Shao, Z.; Zheng, H.; Chen, F. Exploring the decentralized blue-green infrastructure network layouts for urban flood risk management. Landsc. Ecol. Eng. 2025, 1–15. [Google Scholar] [CrossRef]
  79. Golden, H.E.; Hoghooghi, N. Green infrastructure and its catchment-scale effects: An emerging science. WIREs Water 2018, 5, 1254. [Google Scholar] [CrossRef]
  80. Dong, J.; Guo, F.; Lin, M.; Zhang, H.; Zhu, P. Optimization of green infrastructure networks based on potential green roof integration in a high-density urban area—A case study of Beijing, China. Sci. Total Environ. 2022, 834, 155307. [Google Scholar] [CrossRef]
  81. Çırağ, B.; Karagöz, R.; Özer, A.E.; Aydın, A.Ö.; Fırat, M. Modelling the dynamic performance of stormwater drainage systems integrated with infiltration trenches. Urban Water J. 2025, 22, 244–257. [Google Scholar] [CrossRef]
  82. He, P.; Chen, K. Analysis of Blue Infrastructure Network Pattern in the Hanjiang Ecological Economic Zone in China. Water 2022, 14, 1234. [Google Scholar] [CrossRef]
  83. Hermoso, V.; Salgado-Rojas, J.; Lanzas, M.; Morcillo, F.; Casals, F.; Oñorbe, M.; Hidalgo, R.; Magdaleno, G.; Sánchez-González, J.R. Identifying River Corridors for the Implementation of the Network of Green Infrastructure in Spain. Freshw. Biol. 2025, 70, e70048. [Google Scholar] [CrossRef]
  84. Asibey, M.O.; Mintah, F.; Adutwum, I.O.; Wireko-Gyebi, R.S.; Tagnan, J.N.; Yevugah, L.L.; Agyeman, K.O.; Abdul-Salam, A.J. Beyond rhetoric: Urban planning-climate change resilience conundrum in Accra, Ghana. Cities 2022, 131, 103950. [Google Scholar] [CrossRef]
  85. Willems, J.J.; Kenyon, A.V.; Sharp, L.; Molenveld, A. How actors are (dis)integrating policy agendas for multi-functional blue and green infrastructure projects on the ground. J. Environ. Policy Plan. 2021, 23, 84–96. [Google Scholar] [CrossRef]
  86. Zhang, D.; Cai, Y.; Lv, J.; Ma, S.; Cheng, H.; Zhao, Y.; Zhang, X.; Wu, L. Re-identifying green infrastructure network towards sustainable urban futures: A dynamic temporal trade-off simulation. Cities 2025, 162, 105994. [Google Scholar] [CrossRef]
  87. Song, S.; Wang, S.-H.; Shi, M.-X.; Hu, S.-S.; Xu, D.-W. Multiple scenario simulation and optimization of an urban green infrastructure network based on complex network theory: A case study in Harbin City, China. Ecol. Process. 2022, 11, 33. [Google Scholar] [CrossRef]
  88. Ambily, P.; Chithra, N.; Mohammed Firoz, C. A novel framework for prioritization and spatial suitability assessment of Blue-Green infrastructure for urban pluvial flood resilience. J. Hydrol. 2025, 655, 132976. [Google Scholar] [CrossRef]
  89. Rehman, A.U.; Glenis, V.; Lewis, E.; Kilsby, C. Multi-objective optimisation framework for Blue-Green Infrastructure placement using detailed flood model. J. Hydrol. 2024, 638, 131571. [Google Scholar] [CrossRef]
  90. Kimic, K.; Ostrysz, K. Assessment of Blue and Green Infrastructure Solutions in Shaping Urban Public Spaces—Spatial and Functional, Environmental, and Social Aspects. Sustainability 2021, 13, 11041. [Google Scholar] [CrossRef]
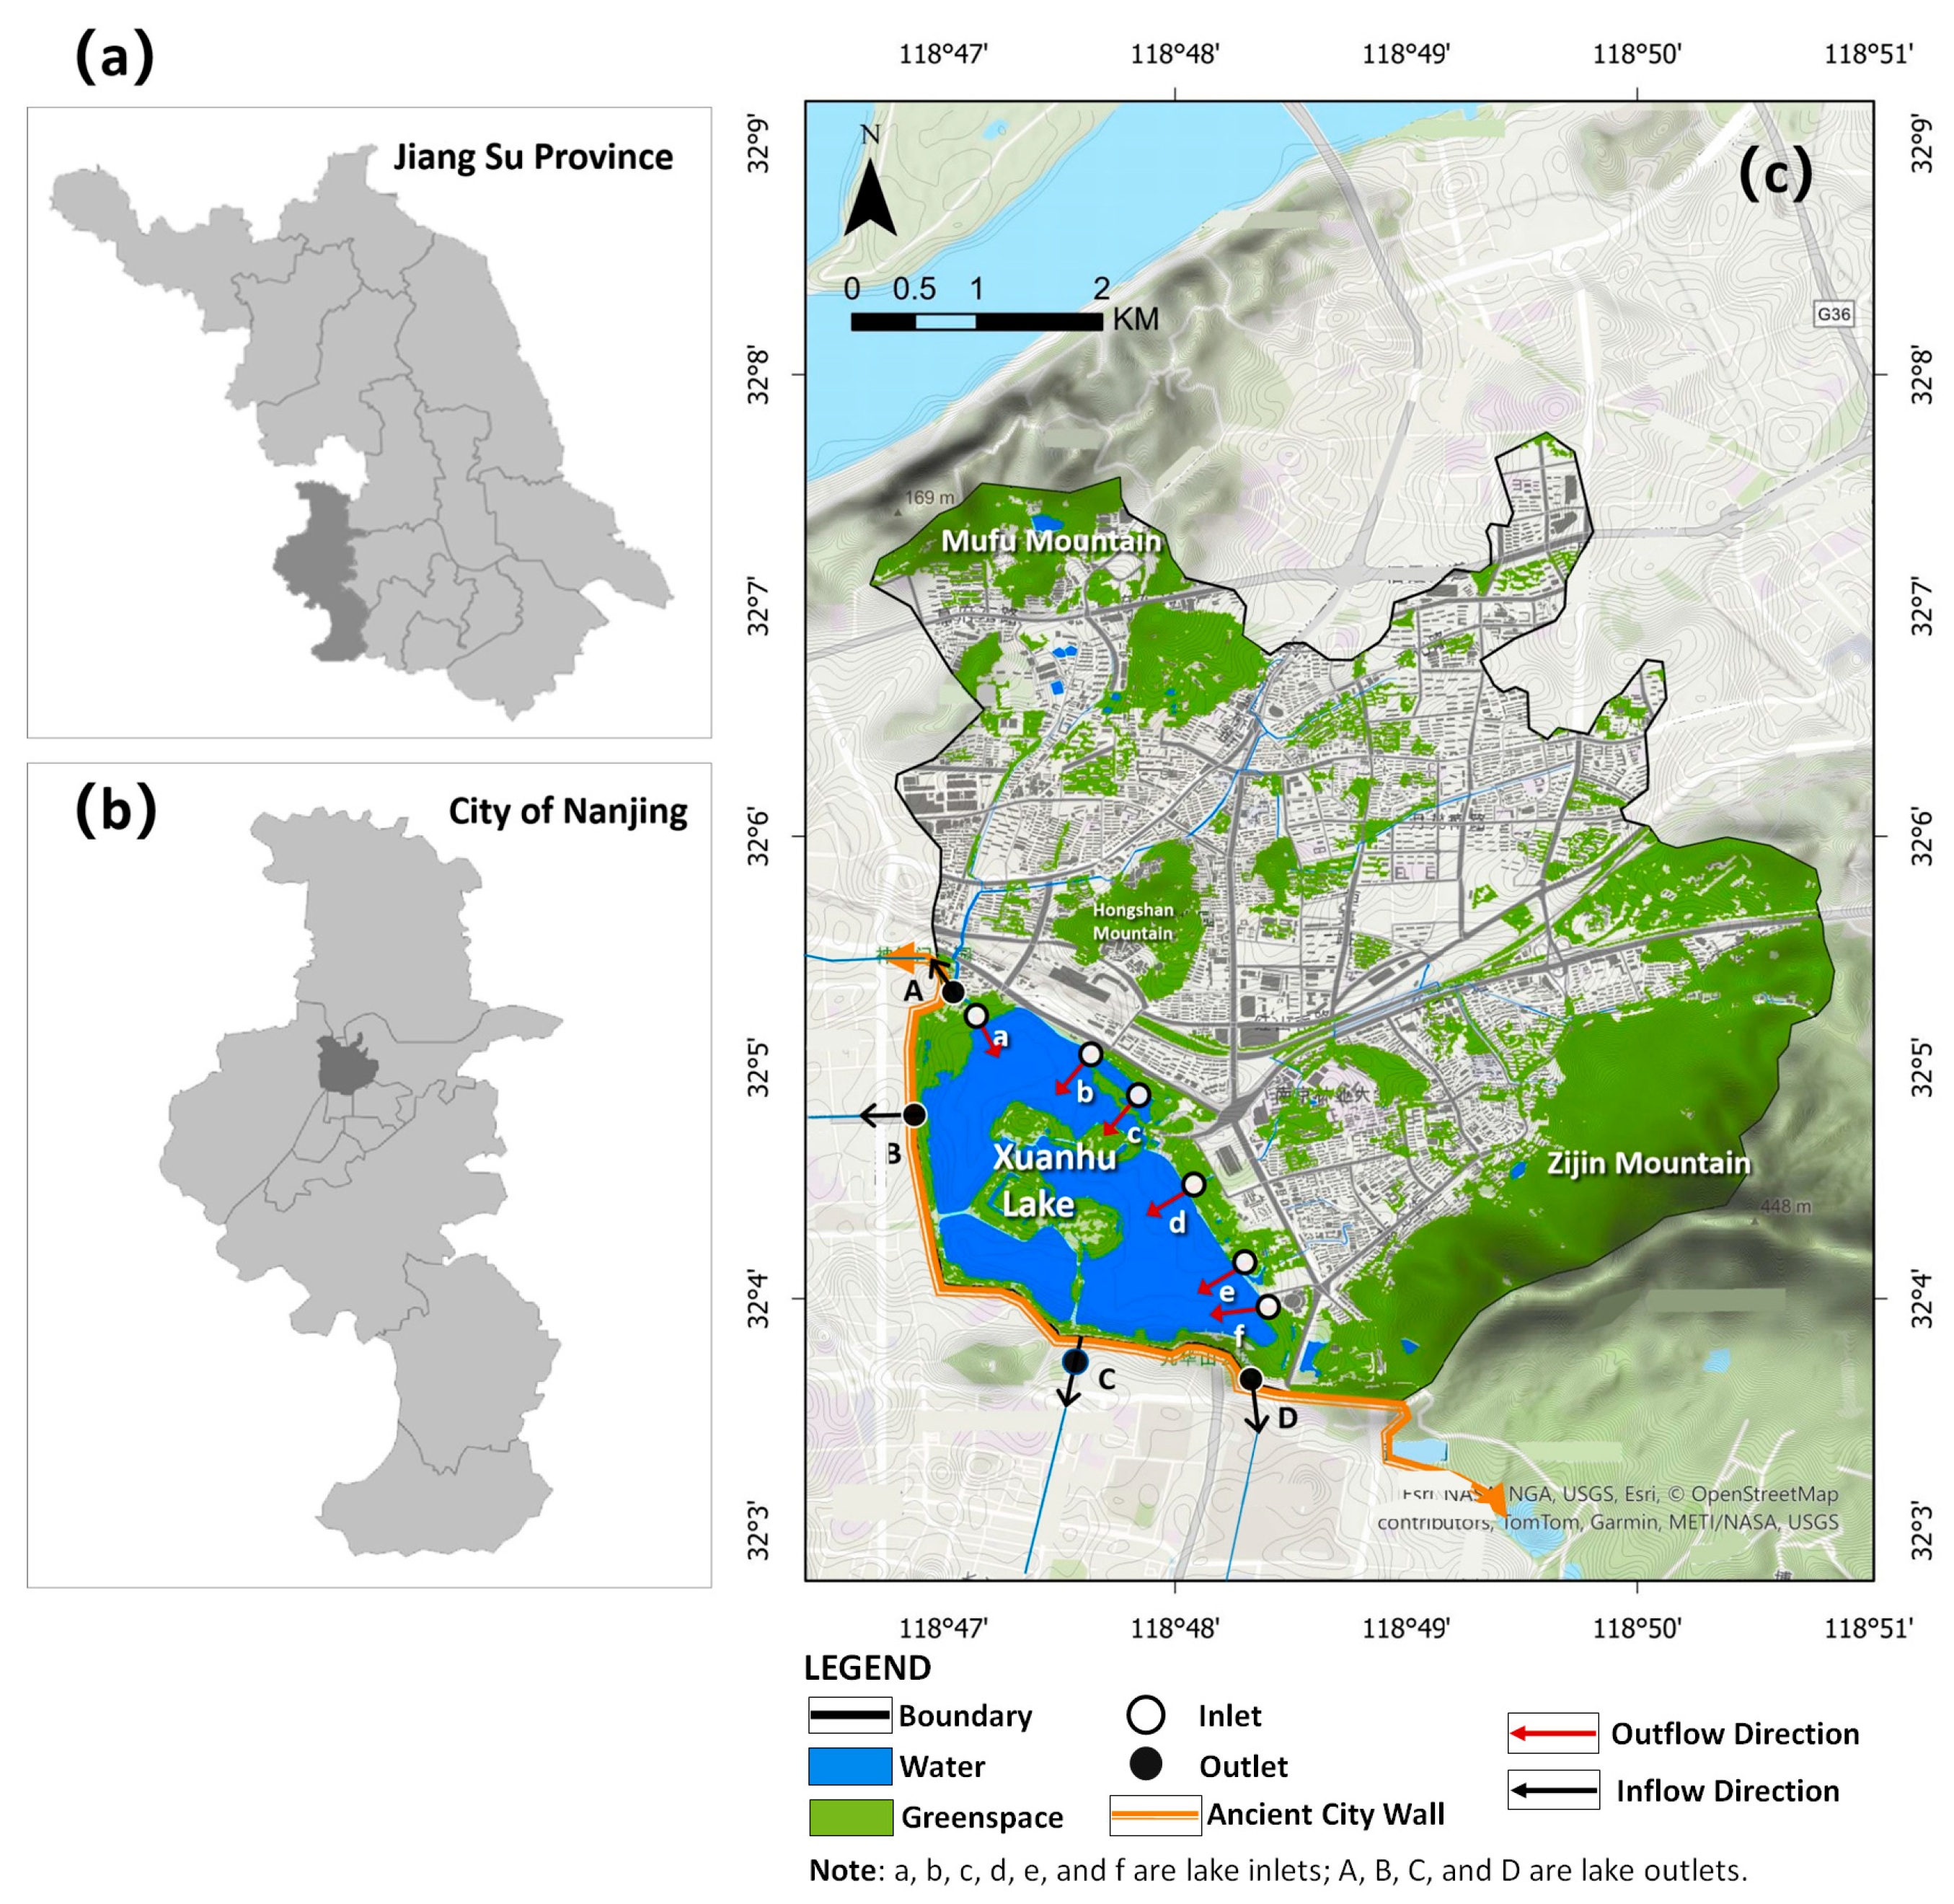
Figure 1. Basic information about the study area. (a) Location of Nanjing in Jiangsu Province, China; (b) Location of the Xuanwu Lake small watershed in Nanjing; (c) Distribution of major green spaces and water bodies, including lake inlets and outlets. (Source: Drawn by the authors; Base map from open street map, 2024).
Land 14 01652 g001
Figure 2. Infrastructure systems of Xuanwu Lake watershed. (a) Main water systems, including inlets and outlets of Xuanwu Lake; (b) Major water supply, sewerage, and stormwater drainage systems. (Source: Drawn by the authors).
Land 14 01652 g002
Figure 3. Potential site analysis. (a) Urban morphology of built-up areas in the source region; (b) Analysis of available space for BGI deployment. (Source: Drawn by the authors).
Land 14 01652 g003
Figure 4. (a) Soil texture classification of the Xuanwu Lake small watershed. (Source: High–resolution National Soil Information Grid Basic Attribute Dataset of China). (b) Land use classification. (Source: SinoLC–1). (c) Spatial distribution of CN values across the three sub-watersheds. (Source: Drawn by the authors).
Land 14 01652 g004
Figure 5. Comparison of measured and simulated data: (a) 12–13 July 2024; (b) 16–17 September 2024. (Source: Drawn by the authors).
Land 14 01652 g005
Figure 6. SWMM setup (Source: Drawn by the authors).
Land 14 01652 g006
Figure 7. Monthly water balance model (Source: Drawn by the authors).
Land 14 01652 g007
Figure 8. Current average monthly water level and monthly ecological water level (Source: Reference [68]).
Land 14 01652 g008
Figure 9. (a) Identification of key corridors and nodes using Conefor 2.6. (b) Generation of minimum–cost corridors. (c) Selection of nine new river corridors based on the gravity model. (Source: Drawn by the authors).
Land 14 01652 g009
Figure 10. Location selection for newly added river channels; ①–⑨ New river location selection (Source: Drawn by the authors).
Land 14 01652 g010
Figure 11. (a) Distribution of newly added BGI; (b) Primary corridors and secondary corridors. (Source: Drawn by the authors).
Land 14 01652 g011
Figure 12. Monthly water volume variation (Mm3). (Source: Drawn by the authors).
Land 14 01652 g012
Table 1. Data description and sources (Source: Drawn by the authors).
Data TypeScale/FormatSource
Digital elevation model12.5 m resolutionALOS satellite
Green space, water system, roads, buildingsElectronic map, vector dataGoogle Maps (2023)
Hourly rainfall dataSpreadsheetNational meteorological science data center; Meteorological station data (2023)
https://data.cma.cn/site/index.html (accessed on 15 May 2024)
Small weather station (12–13 July 2024; 16–17 September 2024).
Evaporation volumeSpreadsheetERA5 evaporation dataset
Lake water level data; artificial water supplementation data; lakebed seepage coefficient dataTextLiterature review
Land use data1 m resolutionSinoLC–1 (2023), Zenodo
http://www.ncdc.ac.cn (accessed on 16 May 2024)
Soil texture data 90 m High-resolution national soil information grid basic attribute dataset of China https://soil.geodata.cn (accessed on 3 June 2025).
Rainwater drainage network dataVector dataNanjing water bureau
Comprehensive Drainage and Flood Control Planning for the Central Urban Area of Nanjing City;
The Sponge City Construction Plan of Nanjing City
TextNanjing natural resources and planning bureau
River flow dataMeasurement dataField Measurements (2024)
Local waterlogging pointsVector dataDepressions extracted from DEM using ArcGIS, webcrawler data, planning and literature data
Table 2. Soil hydrology group classification. (Source: Reference [51]).
Soil Hydrology GroupSoil TextureMinimum Permeability (nm/h)
ASand, loamy sand, or sandy loam7.26–11.43
BSilt loam or loam3.81–7.26
CSandy clay loam1.27–3.81
DClay loam, silty clay loam, sandy clay, silty clay, or clay0–1.27
Table 3. Curve Number (CN) values by land use type (Source: Drawn by the authors).
RegionLand UseABCD
Nanshili and Tangjiashan River sub-watershedsForest land25497077
Grassland39617480
Bare land72828890
Water100100100100
Built-up area89919496
Zijinshan River sub-watershedForest land27517279
Grassland41637682
Bare land74849092
Water100100100100
Built-up area91939698
Table 4. Calibrated parameters of the SWMM (Source: Drawn by the authors).
ParameterDescriptionReference RangeCalibrated Value
N–ImpervManning’s n for overland flow over the impervious portion of the sub-catchment0.011–0.0240.015
N–PervManning’s n for overland flow over the pervious portion of the sub-catchment 0.06–0.80.09
S–ImpervDepression storage for impervious areas0.2–102.5
S–PervDepression storage for pervious areas2–206.5
MaxRateMaximum infiltration rate 20–10065.2
MinRateMinimum infiltration rate 1–201.1
Table 5. Detailed information on the newly added channels (Source: Drawn by the authors).
Channel IDStrategyChannel Length (km)Catchment Area (km2)Catchment Area per Unit Length (km2/km)
1Utilize existing green space1.336 0.8410.63
2300 m long, 1.8 m wide green belt1.0741.1921.17
3Utilize existing green space1.2992.0031.49
4Utilize existing green space1.2162.0761.46
5Utilize existing green space1.2900.6880.52
6400 m long, 4 m wide green belte2.1960.600.31
7Utilize existing green space1.5111.7411.15
8Utilize existing green space0.9350.7670.76
9Utilize existing green space0.3270.3631.13
Table 6. Future monthly artificial water supplementation reduction rate (Source: Drawn by the authors).
Month123456789101112
Reduction Rate (%)4.010.64.09.626.762.243.433.027.70.045.54.0
Disclaimer/Publisher’s Note: The statements, opinions and data contained in all publications are solely those of the individual author(s) and contributor(s) and not of MDPI and/or the editor(s). MDPI and/or the editor(s) disclaim responsibility for any injury to people or property resulting from any ideas, methods, instructions or products referred to in the content.