1. Introduction
As a key contributor to urban growth and competitiveness [
1], urban industries are often spatially concentrated and exhibit pronounced patterns of agglomeration [
2], particularly due to their critical role in facilitating knowledge spillovers, reducing transaction costs, and enhancing production efficiency [
3]. In this context, urban industries maintain intricate linkages with the built environment (BE) through multiple channels, including labor market interactions, industrial chain coordination, technological innovation networks, and shared infrastructure. These multifaceted connections have not only intensified scholarly interest in exploring the relationship between the BE and industrial agglomeration [
4], but have also sparked ongoing debates due to the complexity of spatial mechanisms—especially across different spatial scales of analysis [
5].
Theoretical frameworks have long linked urban industrial agglomeration to macroeconomic factors and local industrial development dynamics [
6]. Neoclassical and institutionalist perspectives emphasize external conditions, positing that a city’s economic development level, human capital endowment, locational advantages, innovation capacity, institutional environment, and overall location quality are key determinants of industrial clustering [
7,
8]. However, industries vary in their sensitivity to these factors, and the attractiveness of macroeconomic drivers is not uniformly applicable across sectors. For instance, scholars have highlighted notable distinctions between high-tech and traditional firms in their intra-urban location choices. High-tech enterprises often exhibit heightened sensitivity to local innovation ecosystems and demand a superior innovation environment [
9]. Moreover, knowledge workers and the creative class show strong preferences for favorable living environments, encompassing natural amenities, public service infrastructure, and convenient lifestyles [
10]. These preferences contribute to pronounced spatial heterogeneity in intra-urban firm distribution. Nevertheless, despite the acknowledged significance of macroeconomic conditions in fostering urban industrial agglomeration, the spatial logic underpinning intra-urban industrial clustering remains poorly understood and fragmented [
11].
The effects of macroeconomic factors on industrial agglomeration also vary across spatial scales. Both neoclassical and institutionalist theories are sensitive to scale transformation, particularly the former, whose assumptions of spatial homogeneity often break down when confronted with intra-urban spatial heterogeneity. For instance, while traditional location theories perform well in explaining industrial layouts at the urban agglomeration level, they are less effective when applied to firm location decisions at the neighborhood scale [
12]. As scholars debate the applicability of these theories across different spatial scales, limited information from traditional data sources often leads to inconsistent findings and a lack of understanding regarding the relationship between industrial agglomeration and micro-level perceptual features. For example, the relationship between high-tech industry clustering and spatial compactness may be positively linear, negatively linear, or nonlinear in nature [
13,
14].
As a result, research on the spatial distribution of innovation has gradually shifted from macro- to micro-scale perspectives. Nevertheless, studies focusing on fine-grained intra-urban spatial characteristics remain relatively scarce. Given that industry constitutes a critical component of urban space, analyzing its complex distribution patterns at the micro scale offers deeper insights into the dynamics and evolution of urban spatial structures [
15]. For example, Li et al. analyzed patent data in Shanghai from 2000 to 2015 and identified a strong spatial concentration of innovation activities at the micro scale, which evolved into a polycentric pattern over time, providing crucial evidence for understanding intra-urban industrial spatial restructuring [
16]. Furthermore, studies on accessibility and spatial compactness have shown that these factors significantly enhance the development of innovative firms and the regional capacity for innovation [
17].
However, in micro-scale research on industrial agglomeration, beyond the traditionally emphasized BE factors, perceptual characteristics at the street level also play a crucial role in influencing firm location choices and patterns of industrial clustering [
18].
As the micro-scale spatial carriers of urban industrial activities, streets—captured through street view image (SVI)—play a crucial role in shaping the spatial quality and functional layout that directly affect the efficiency of factor agglomeration and the spatial pattern of urban economic vitality [
19]. Street-level built environment (SBE) characteristics have been shown to significantly influence various economic indicators, including real estate prices [
20], the intensity of commercial activities [
8], customer satisfaction among firms [
21], and investment attractiveness [
22]. As the basic units of urban industries, the spatial distribution and agglomeration processes of firms are not only central topics in industrial geography but also serve as vital entry points for understanding the spatial configuration of urban economic dynamism. Previous empirical studies have examined the relationship between firm location choices and SBE characteristics through regression analysis, identifying the direction and significance levels of SBE impacts on firm agglomeration [
23]. These studies demonstrate that BE quality plays a crucial role in high-tech firms’ spatial location decisions [
10]. However, existing research suffers from two critical limitations: first, SBE characteristics have been predominantly treated as independent variables, neglecting their complex interdependencies and interaction effects with other environmental factors; second, there is a lack of effective distinction between direct effects of physical infrastructure and perception-mediated indirect effects, leading to insufficient understanding of SBE influence mechanisms [
24].
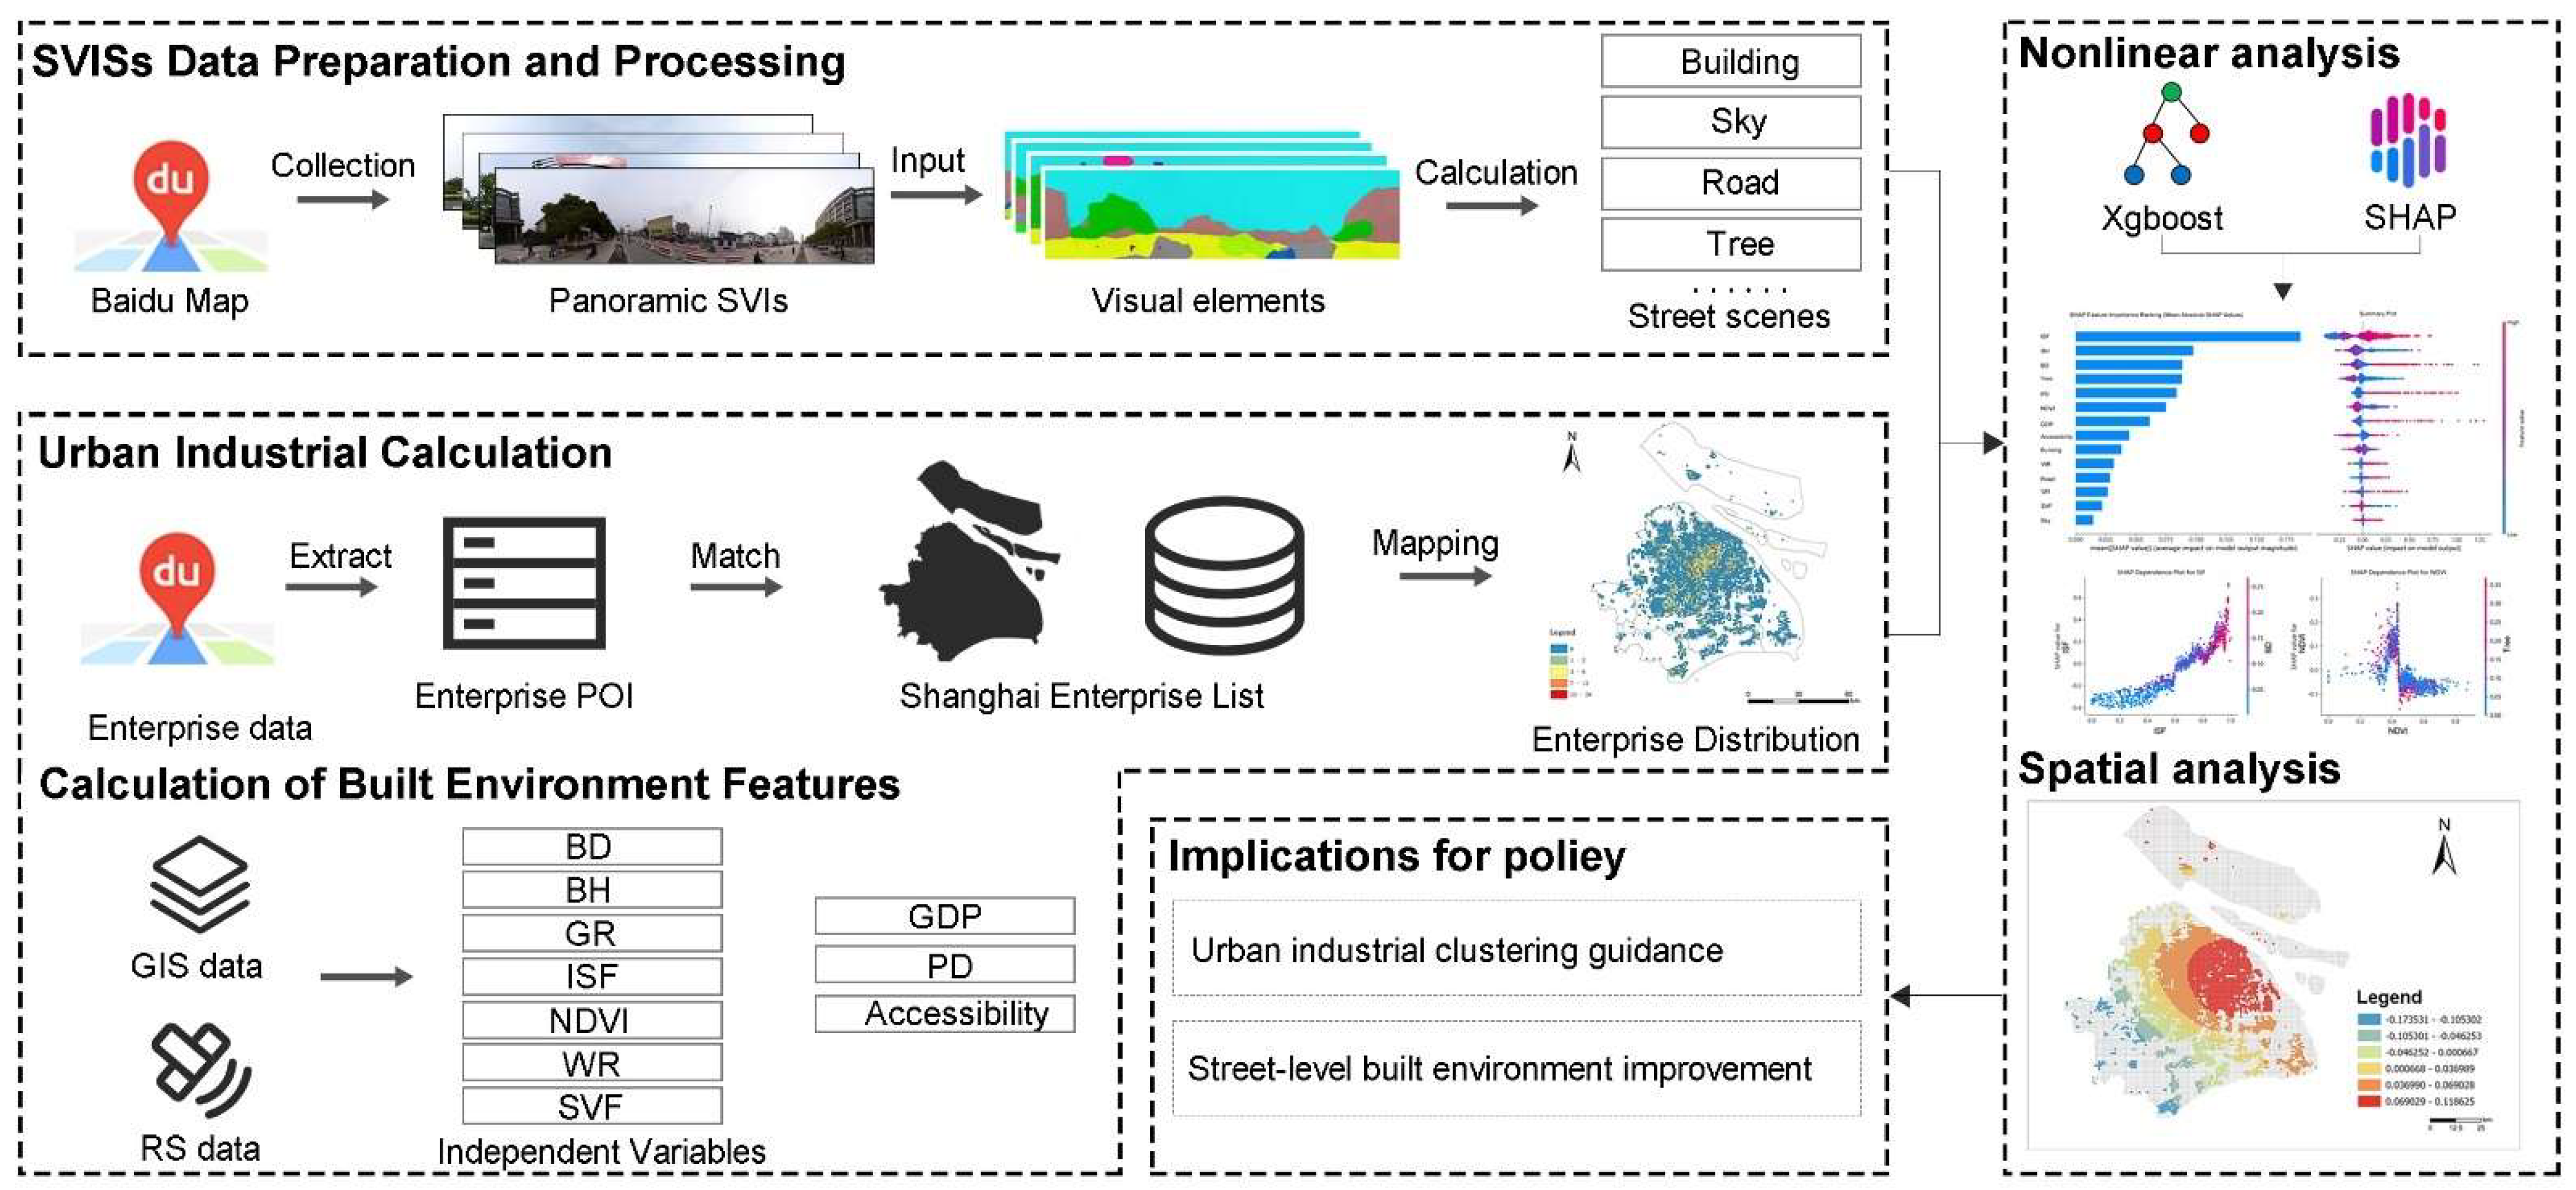
To address the limitations of existing research, this study proposes an integrated framework that combines multi-source urban big data with advanced machine learning methods to systematically investigate the multi-dimensional, nonlinear, and interaction effects of SBE characteristics on industrial agglomeration. Conceptually, this research deepens the understanding of urban industrial agglomeration, particularly within the context of megacities in developing countries, by incorporating streetscape-based visual perception indicators and BE features, thus enriching the perceptual and remote sensing dimensions within the urban industrial research domain.
The specific contributions of this study are as follows:
- (1)
It systematically collects and integrates diverse multi-source urban data. Different dimensions of firm agglomeration at the street level—including perceptual, natural, and economic aspects—are used as dependent variables. This approach comprehensively captures neighborhood-level agglomeration patterns and their driving mechanisms;
- (2)
It employs eXtreme Gradient Boosting (XGBoost) combined with SHapley Additive exPlanations (SHAP) to reveal the complex nonlinear and interaction effects among natural elements, socio-economic indicators, and BE factors;
- (2)
It further integrates Multi-Scale Geographically Weighted Regression (MGWR) to identify the spatial heterogeneity of firm clustering, providing planners with insights into the local effects of multi-source environmental factors to support targeted spatial governance and differentiated street renewal strategies.
4. Results
As shown in
Figure 4 (left), various types of innovative and high-growth firms in Shanghai exhibit a clear core–periphery spatial pattern. High-density clusters are mainly concentrated in the city center, major business districts, and industrial parks, while secondary clusters extend in a belt-like form along major transportation corridors. In contrast, peripheral areas show a scattered, low-density distribution, indicating that innovation-driven economic activities are highly concentrated in the urban core, with surrounding areas providing space for spillover and industrial upgrading. Meanwhile, as shown in
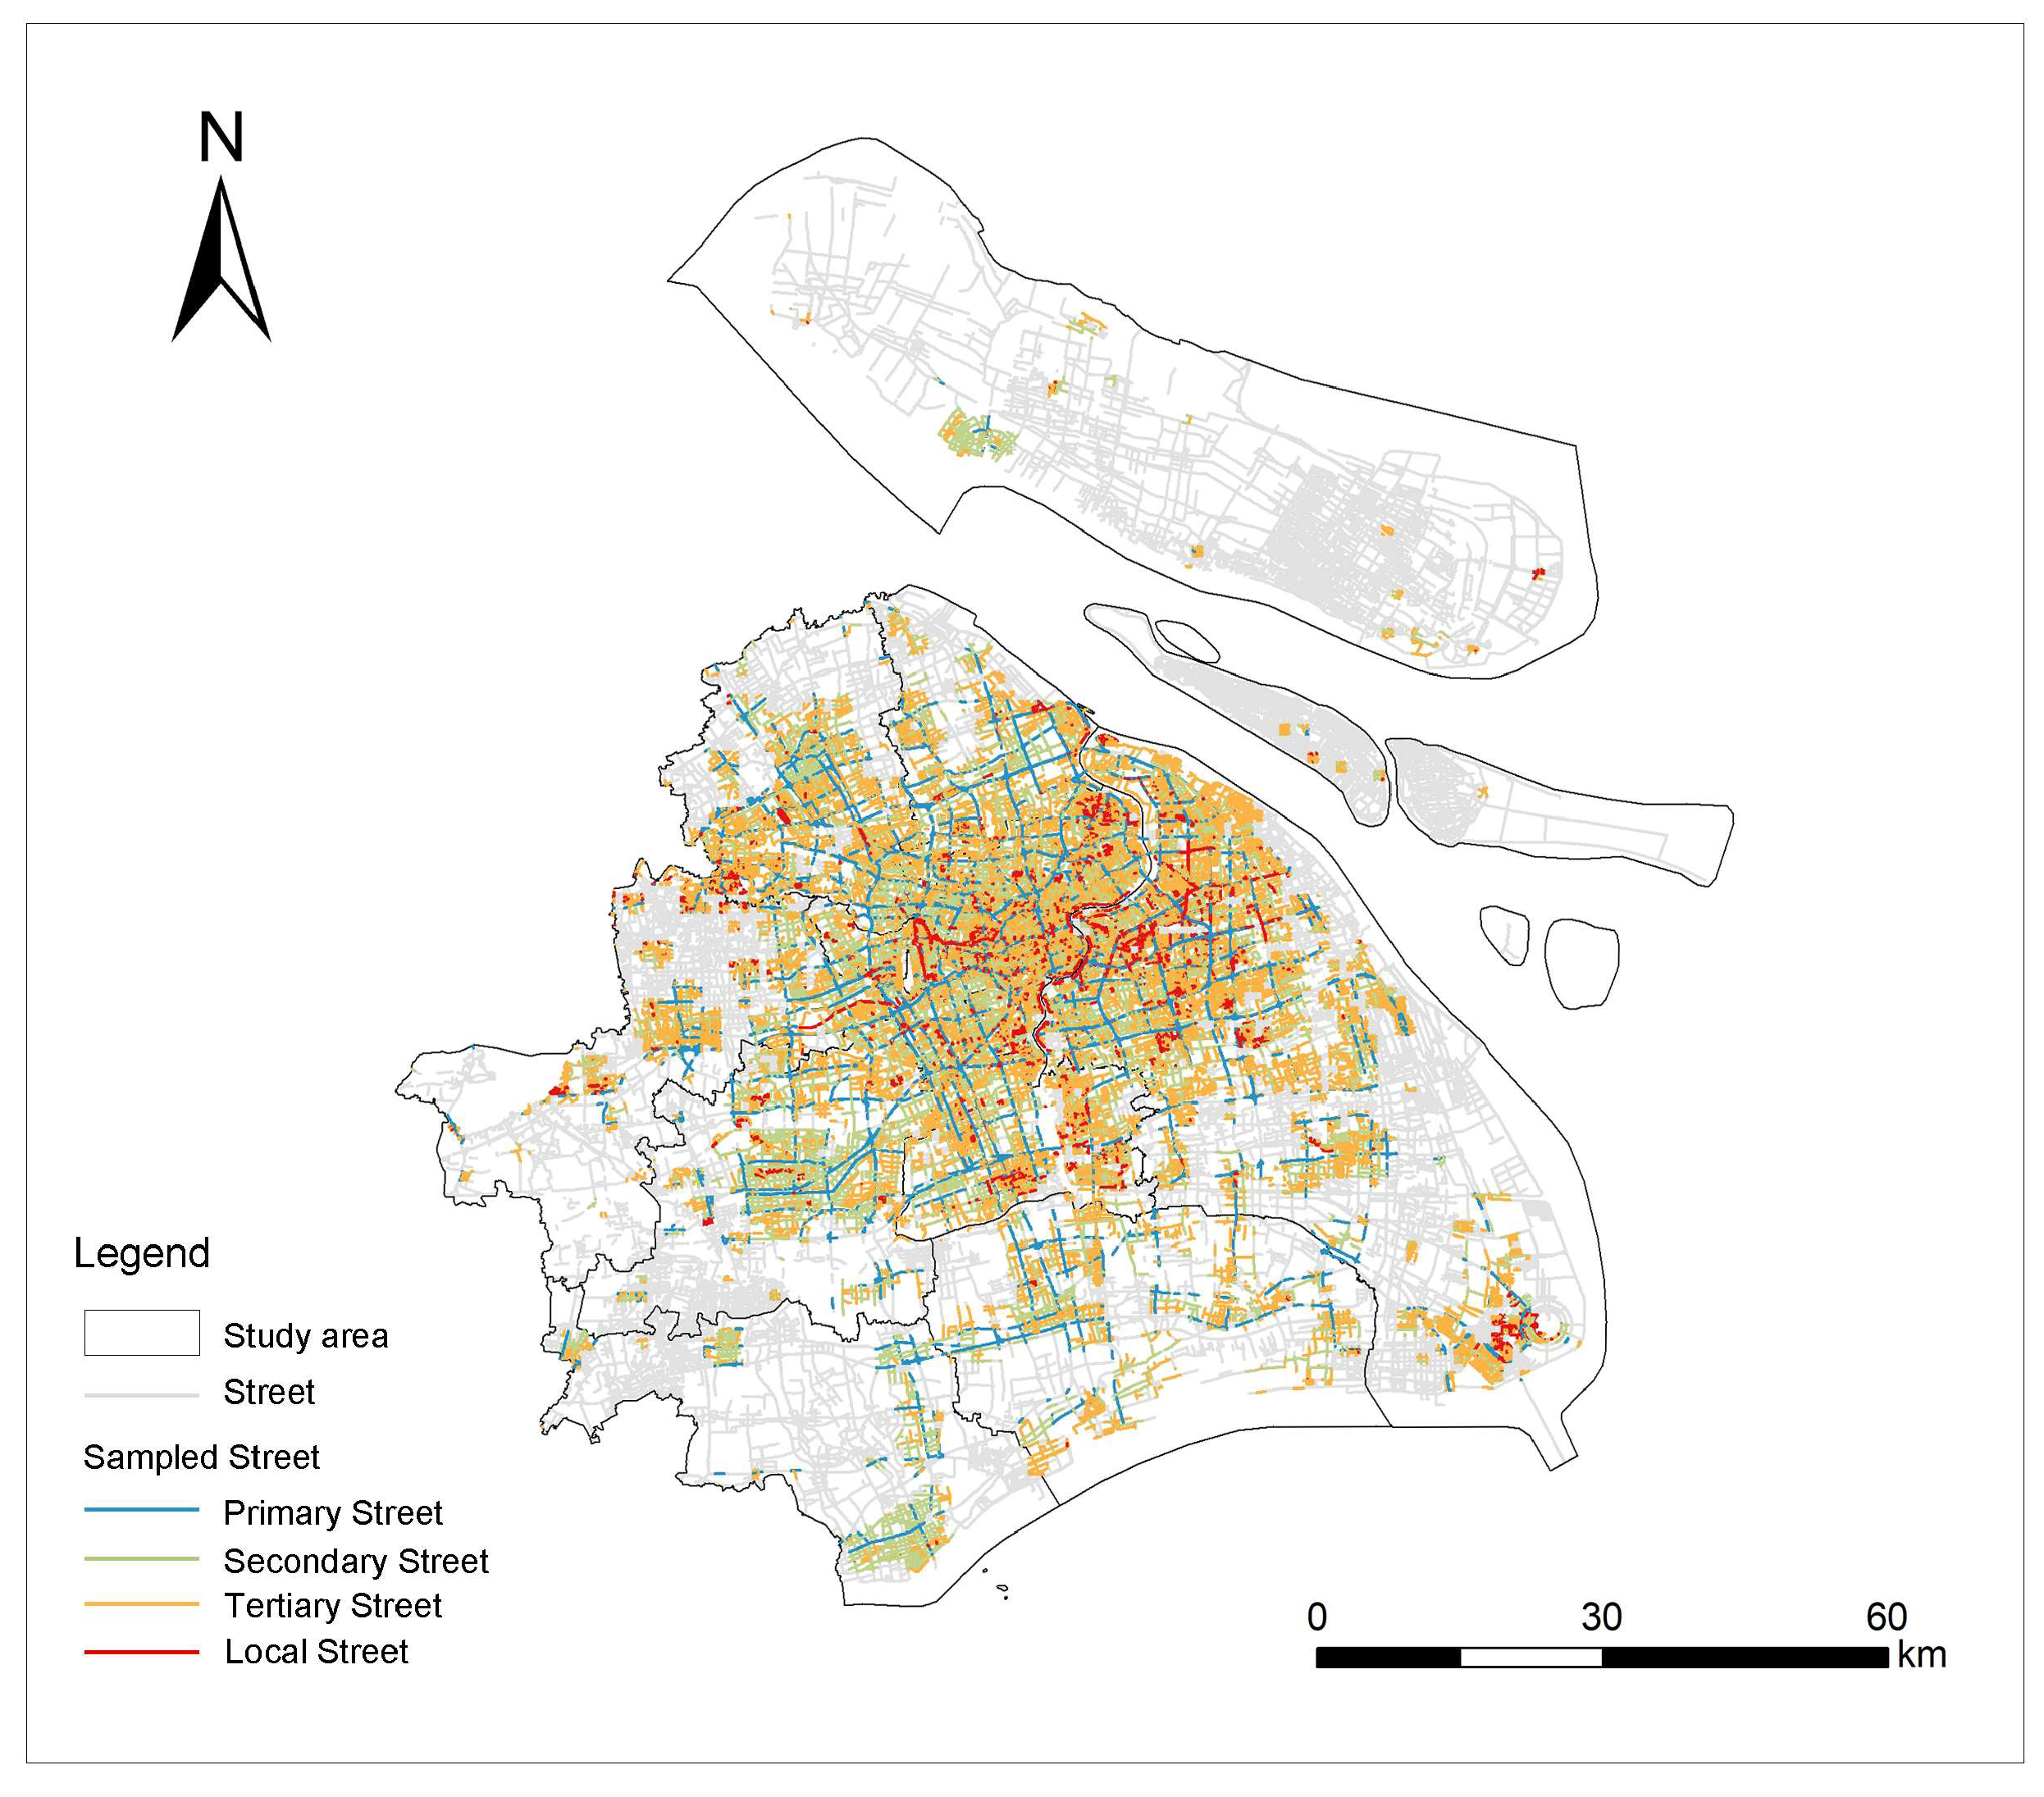
Figure 4 (right), the distribution of street view images demonstrates a similar pattern, with higher coverage density in the core areas, major roads, and commercial centers. In suburban and rural areas, however, sparse road networks and weaker infrastructure result in limited street view data, which constrains fine-grained spatial analysis. Therefore, this study focuses on areas with complete and consistent coverage of street view images and BE data, while excluding peripheral zones with substantial data gaps. This approach helps ensure spatial comparability and reliability of results, providing a more robust understanding of how street-level BE features relate to industrial clustering.
Prior to constructing the XGBoost model, a Pearson correlation analysis was conducted to eliminate variables with excessively high correlation coefficients (
Figure 5). The results indicate that most variables exhibit low to moderate correlations, with no pairwise correlation coefficients exceeding 0.7, suggesting that there is no severe multicollinearity. A relatively strong positive correlation was observed between BD and ISF (r = 0.68), while a notable negative correlation was found between ISF and NDVI (r = −0.62).
4.1. Nonlinear Contributions and Interaction Effects
The XGBoost model hyperparameters were systematically optimized using a Bayesian optimization framework implemented through the Optuna library. We employed a Tree-structured Parzen Estimator (TPE) sampler to efficiently explore the hyperparameter search space, which included eight critical parameters: n_estimators (100–1000), max_depth (3–10), learning_rate (0.01–0.3, log-distributed), subsample (0.6–1.0), colsample_bytree (0.6–1.0), reg_alpha (1 × 10⁻⁴ to 1.0, log-distributed), reg_lambda (1 × 10⁻³ to 5.0, log-distributed), and min_child_weight (0.5–10). The optimization process was conducted over 50 trials with 5-fold cross-validation, using the coefficient of determination (R2) as the objective function to maximize. To ensure robust parameter estimation and prevent overfitting, we implemented stratified cross-validation with consistent random seeds (random_state = 2021) across all experimental procedures.
The model’s predictive performance was evaluated using root mean square error (RMSE), mean absolute error (MAE), and R-squared (R
2), as summarized in
Table 5.
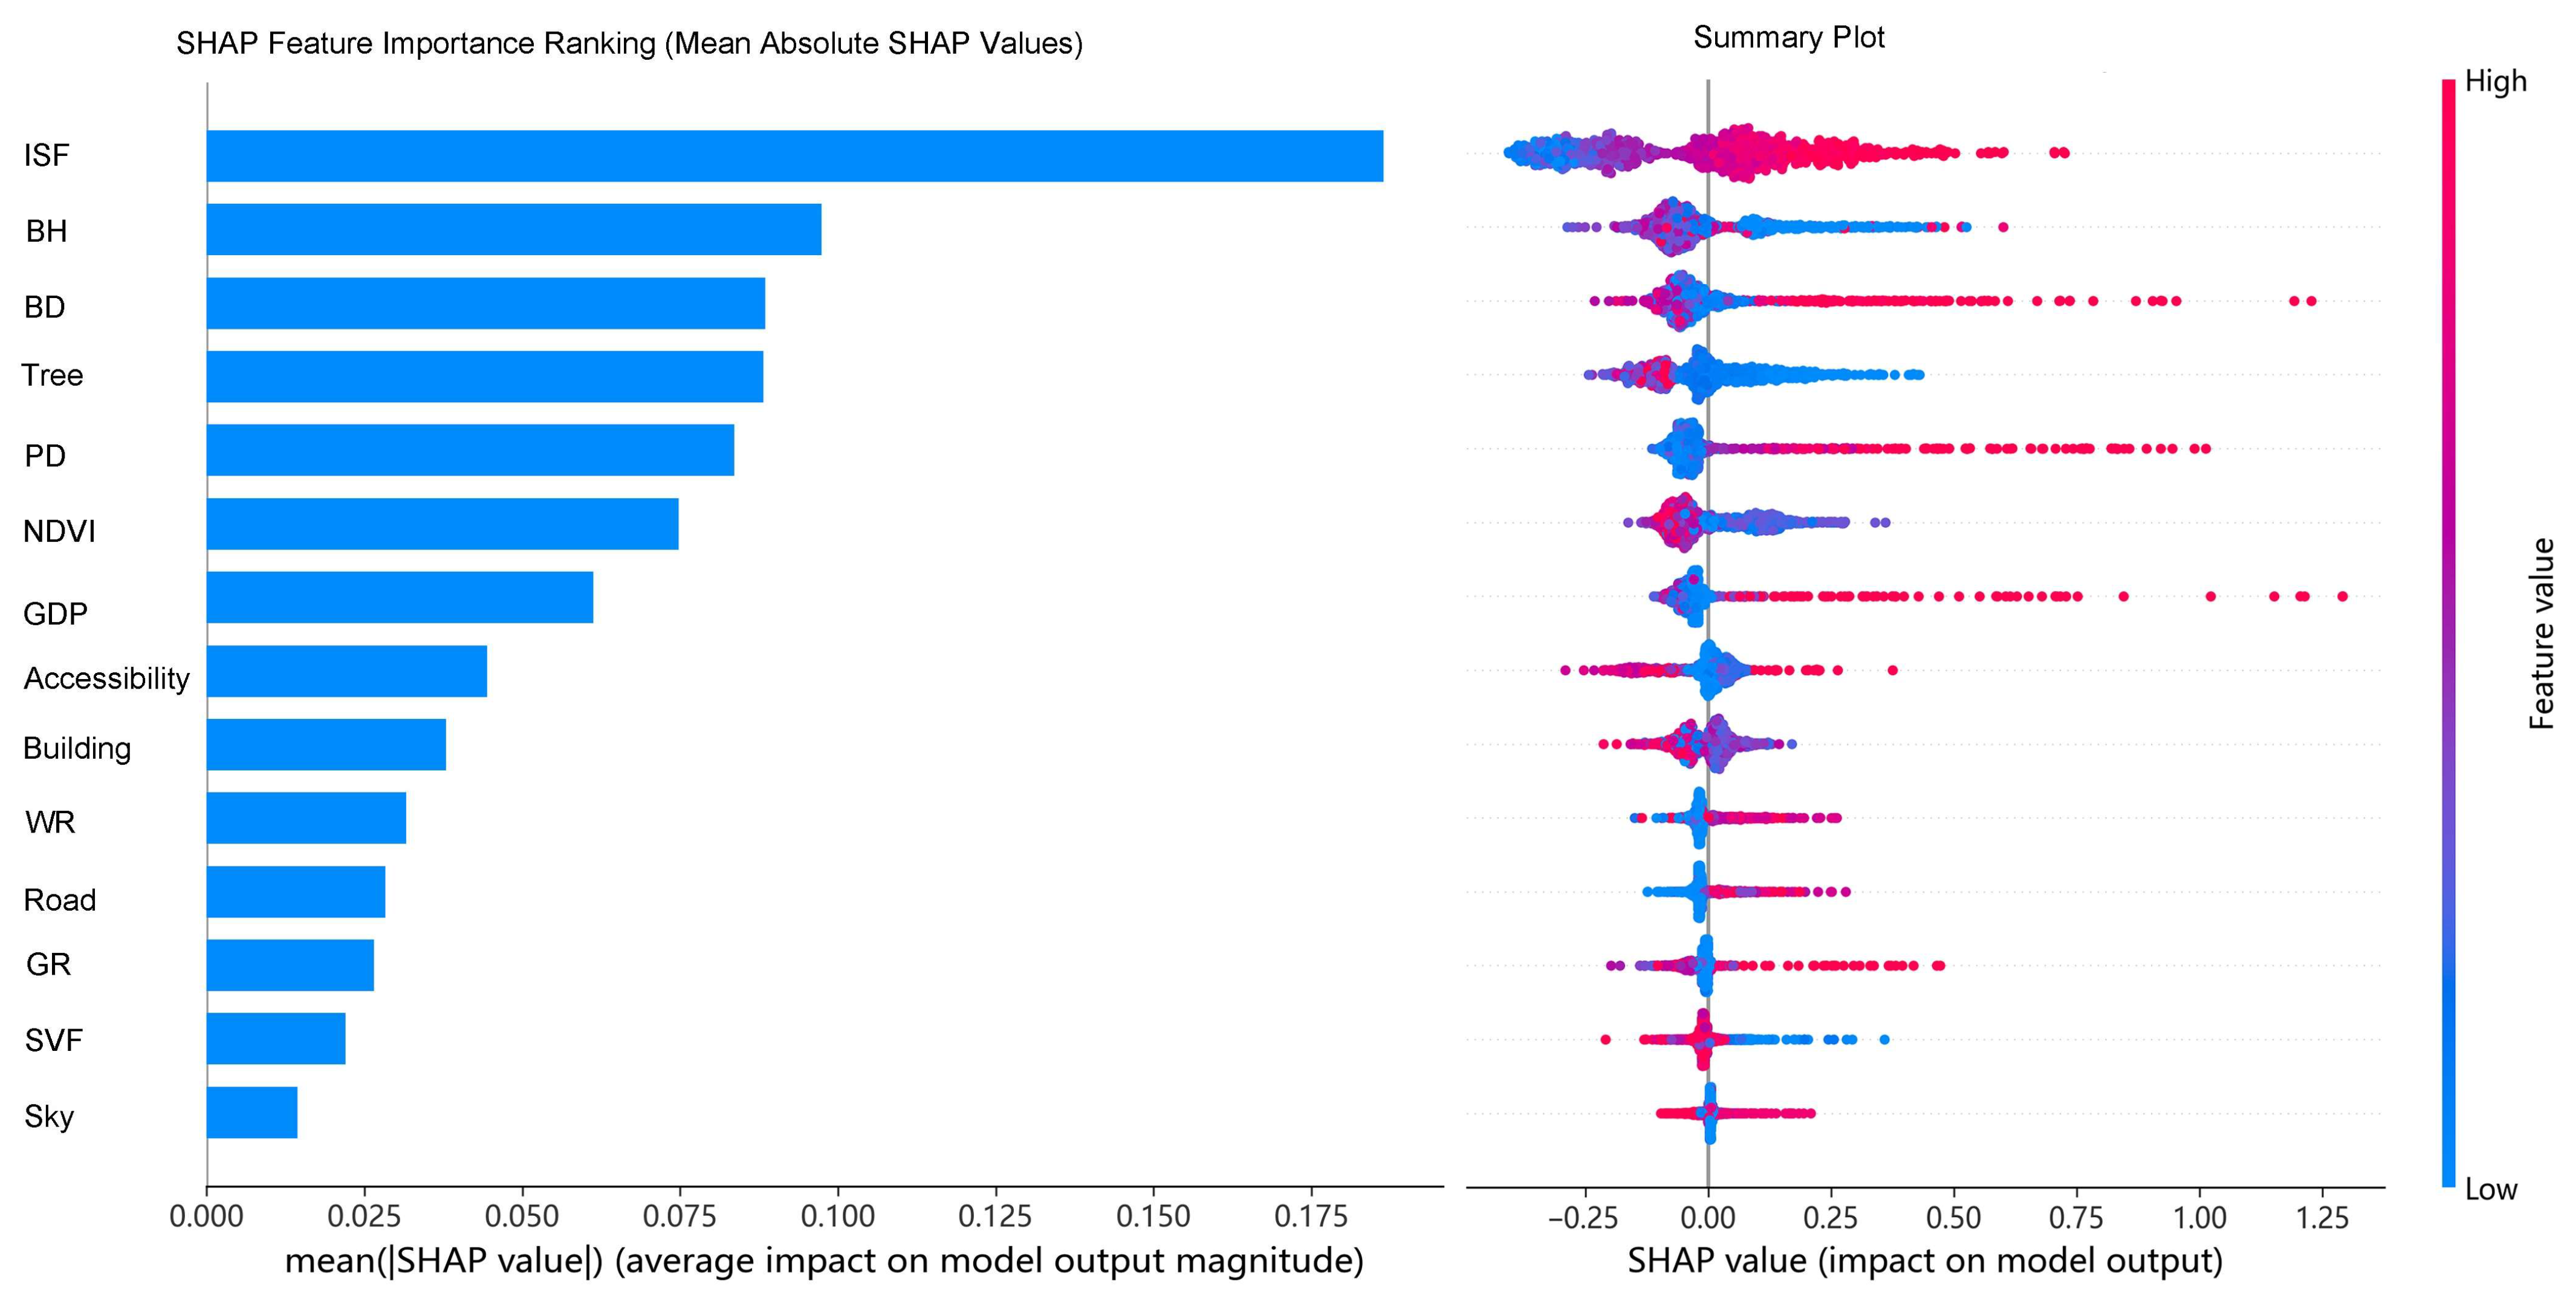
Figure 6 illustrates the feature importance ranking generated by XGBoost, with BD, Building, and ISF emerging as the top three influential variables, followed by BH, WR, SVF, Tree, Sky, NDVI, GR, and Road. To interpret the contribution and directionality of each predictor, SHAP values were further employed, providing robust insights into the nonlinear effects of the BE on industrial clustering.
To identify the key features influencing firm agglomeration, this study used SHAP to rank the relative importance of the contributing factors (
Figure 6). The left side of the figure shows the importance of various BE factors along with their specific relative contributions, which are ranked in descending order of importance. On the right, the contribution of each factor to urban firm agglomeration is highlighted, with the color gradient ranging from red to blue to reflect high to low feature values. The SHAP values along the horizontal axis indicate the negative or positive impacts on firm agglomeration.
Among the BE and urban fundamental variables, ISF exhibits the most significant positive effect on firm agglomeration, ranking first in overall importance. Morphological attributes of the BE, particularly BH and BD, rank second and third, respectively, highlighting the critical roles of vertical scale and spatial compactness in shaping firm clustering patterns. Tree and Building, derived from street-level imagery, rank in the middle tier of all evaluated variables, indicating a moderate level of importance in shaping firm agglomeration outcomes. PD, GDP, accessibility, and WR also appear within the upper half of the importance ranking, reflecting their relatively stronger relevance compared to other factors. In contrast, vegetation-related indicators such as NDVI and GR are ranked lower, suggesting a more limited contribution to the model’s predictive performance. Variables including Sky, SVF, and Road are positioned at the bottom of the ranking, indicating minimal overall influence on firm agglomeration in this context.
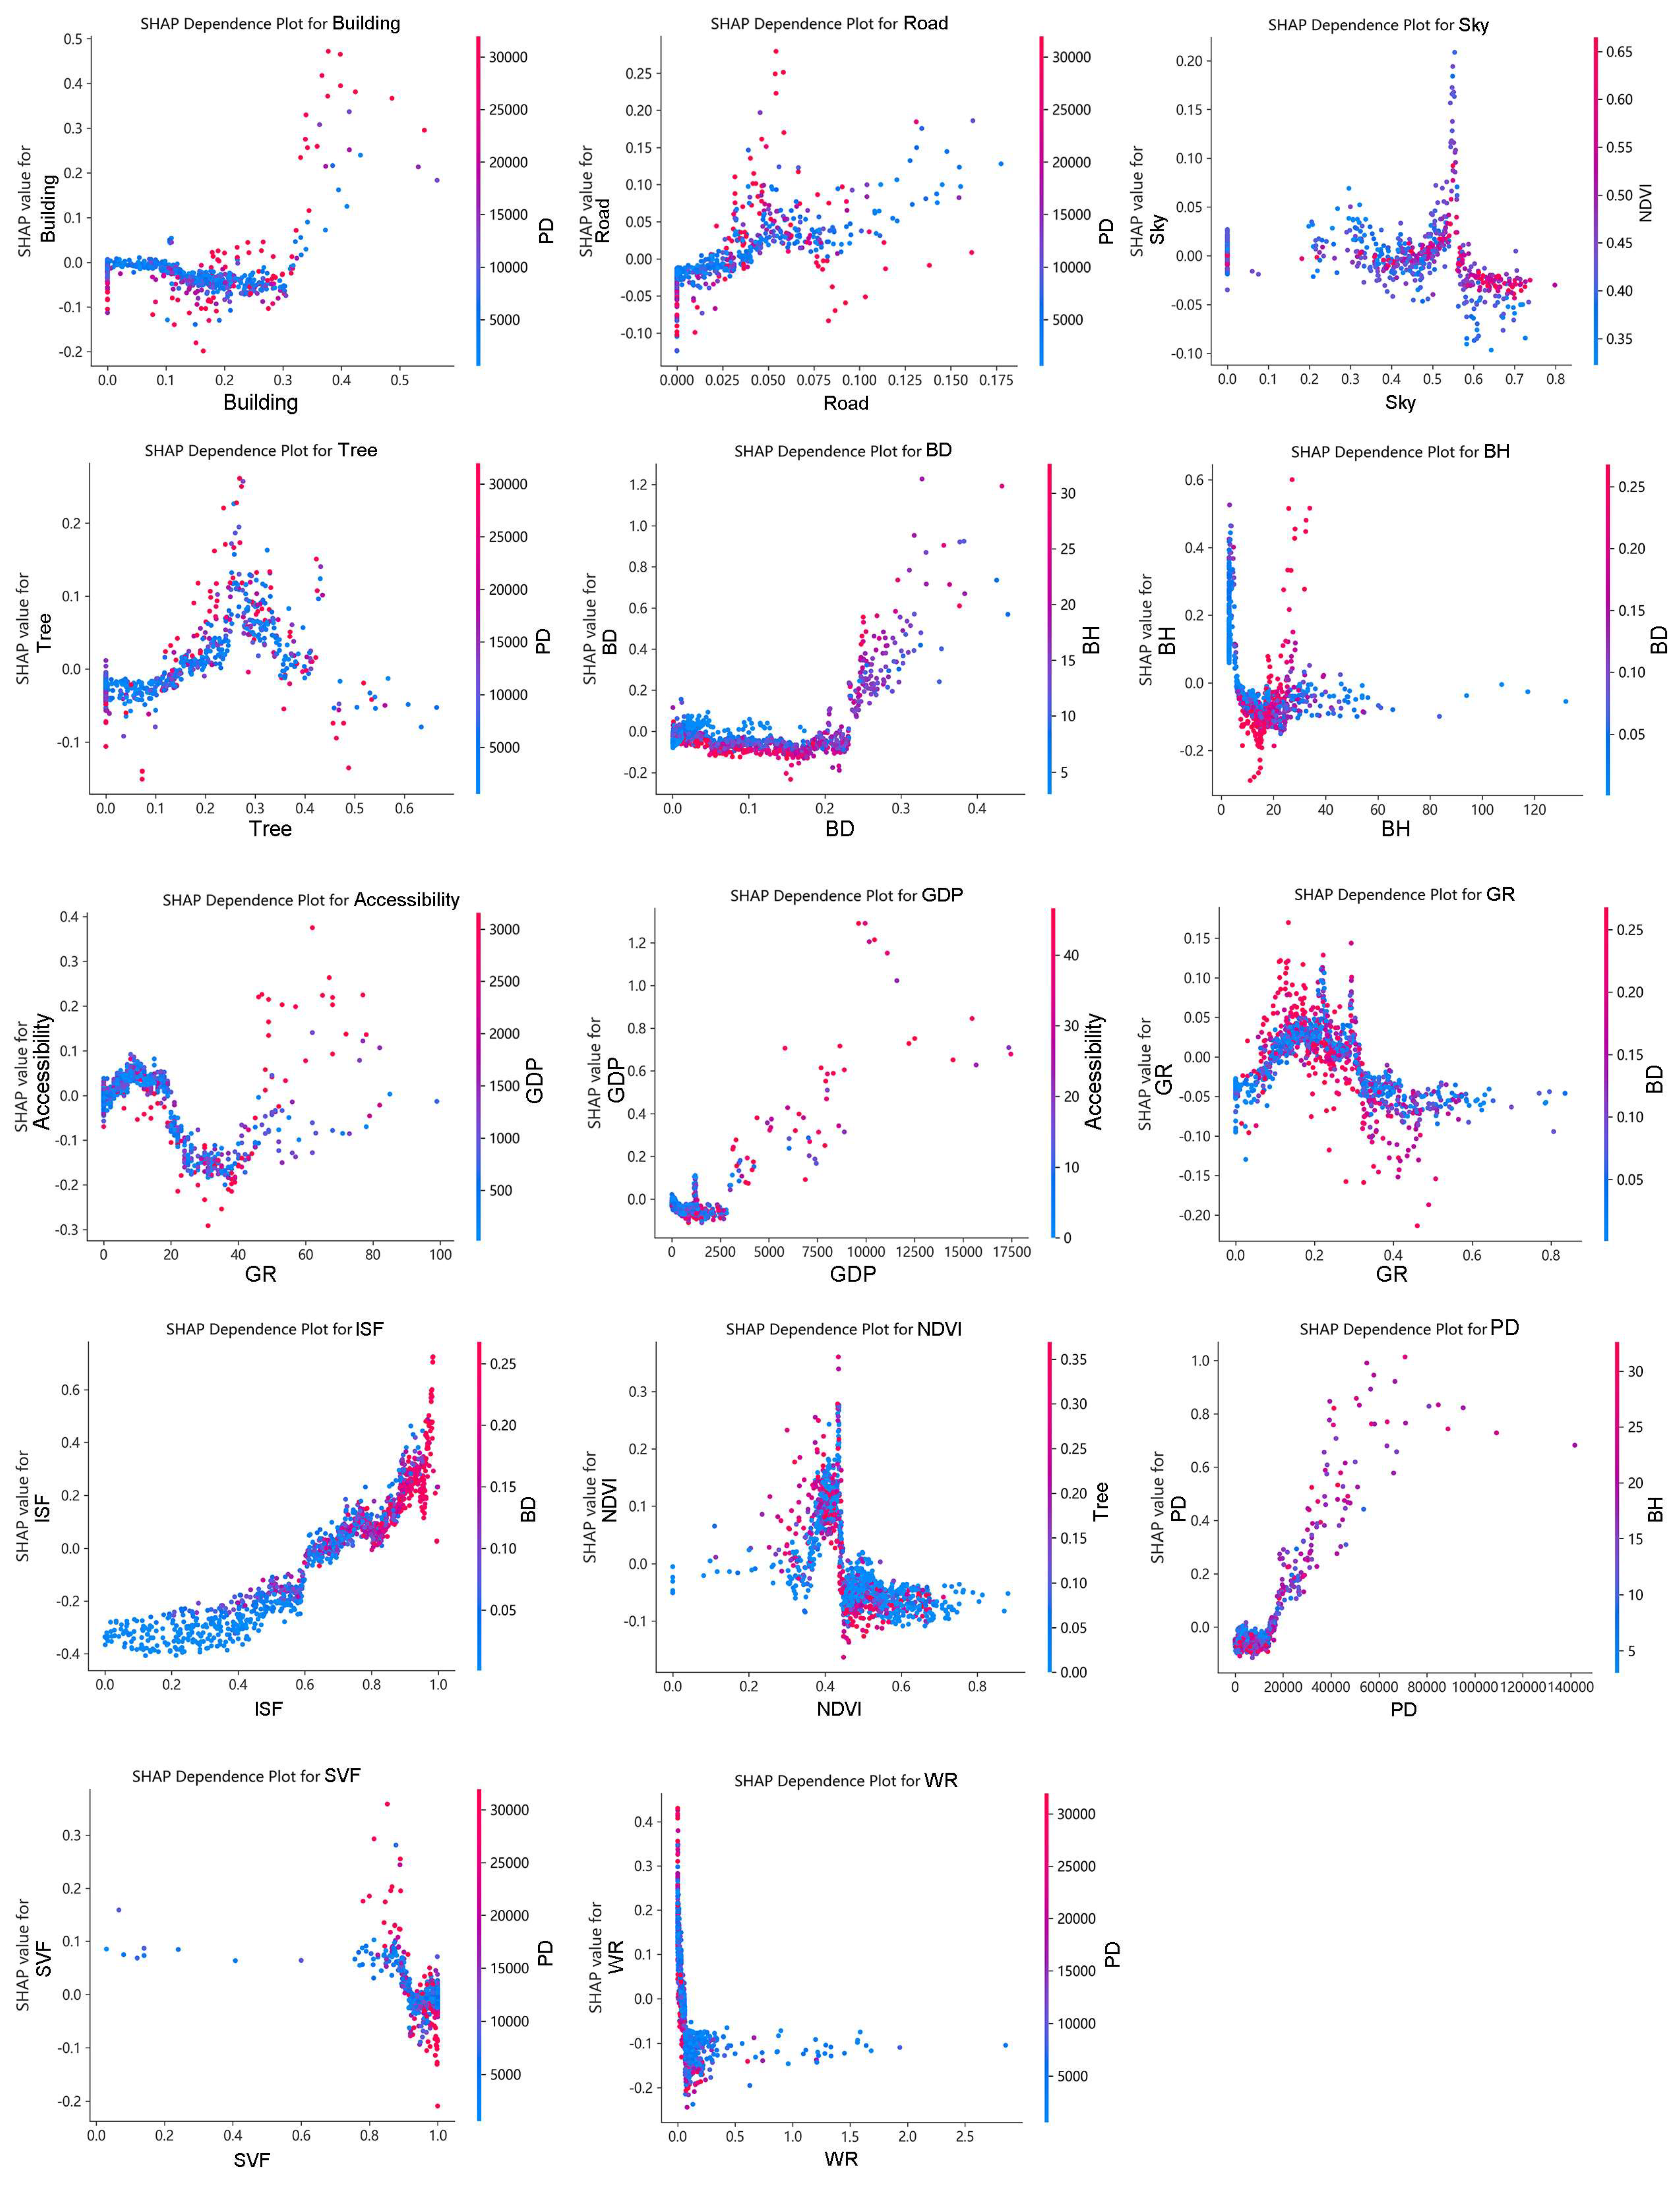
Figure 7 represents the SHAP dependence plots for each built environment variable, aiming to reveal the nonlinear patterns of their marginal contributions to firm agglomeration across different value ranges. The x-axis represents the actual values of each variable, while the y-axis shows the corresponding SHAP values. The color gradient indicates changes in another potential interacting variable, facilitating the identification of possible interaction effects and joint mechanisms.
Among the top-ranked variables, Tree and PD exhibit pronounced nonlinear influence patterns. Tree coverage displays a U-shaped relationship: its contribution to firm agglomeration is limited—or even negative—at lower levels but increases sharply once it exceeds a threshold of approximately 0.2. This suggests that green infrastructure becomes a positive driver of agglomeration only when reaching a certain scale, particularly when combined with compact urban morphology. The color gradient further reveals an interaction with BD, indicating a synergistic effect between greening and spatial compactness in shaping firm location preferences. Similarly, the SHAP dependence plot for PD reveals a clear threshold effect. At low to moderate levels, PD exerts minimal impact on agglomeration. However, once population density surpasses approximately 40,000, the SHAP values increase markedly. This pattern reflects the benefits of economies of scale and market accessibility in high-density environments, although the steep rise may also imply potential spatial saturation, warranting further investigation. In addition, both BH and BD exhibit distinct nonlinear patterns with abrupt shifts. For instance, the SHAP value for BH increases significantly once building height exceeds roughly 60 m, aligning with the vertical clustering tendency of central business districts. BD shows negligible influence at lower levels but becomes a strong positive contributor once surpassing 0.2, reaffirming the positive role of spatial compactness in facilitating firm agglomeration.
4.2. Spatial Mechanisms of SBE Effects on Firm Agglomeration
4.2.1. Spatial Autocorrelation Results
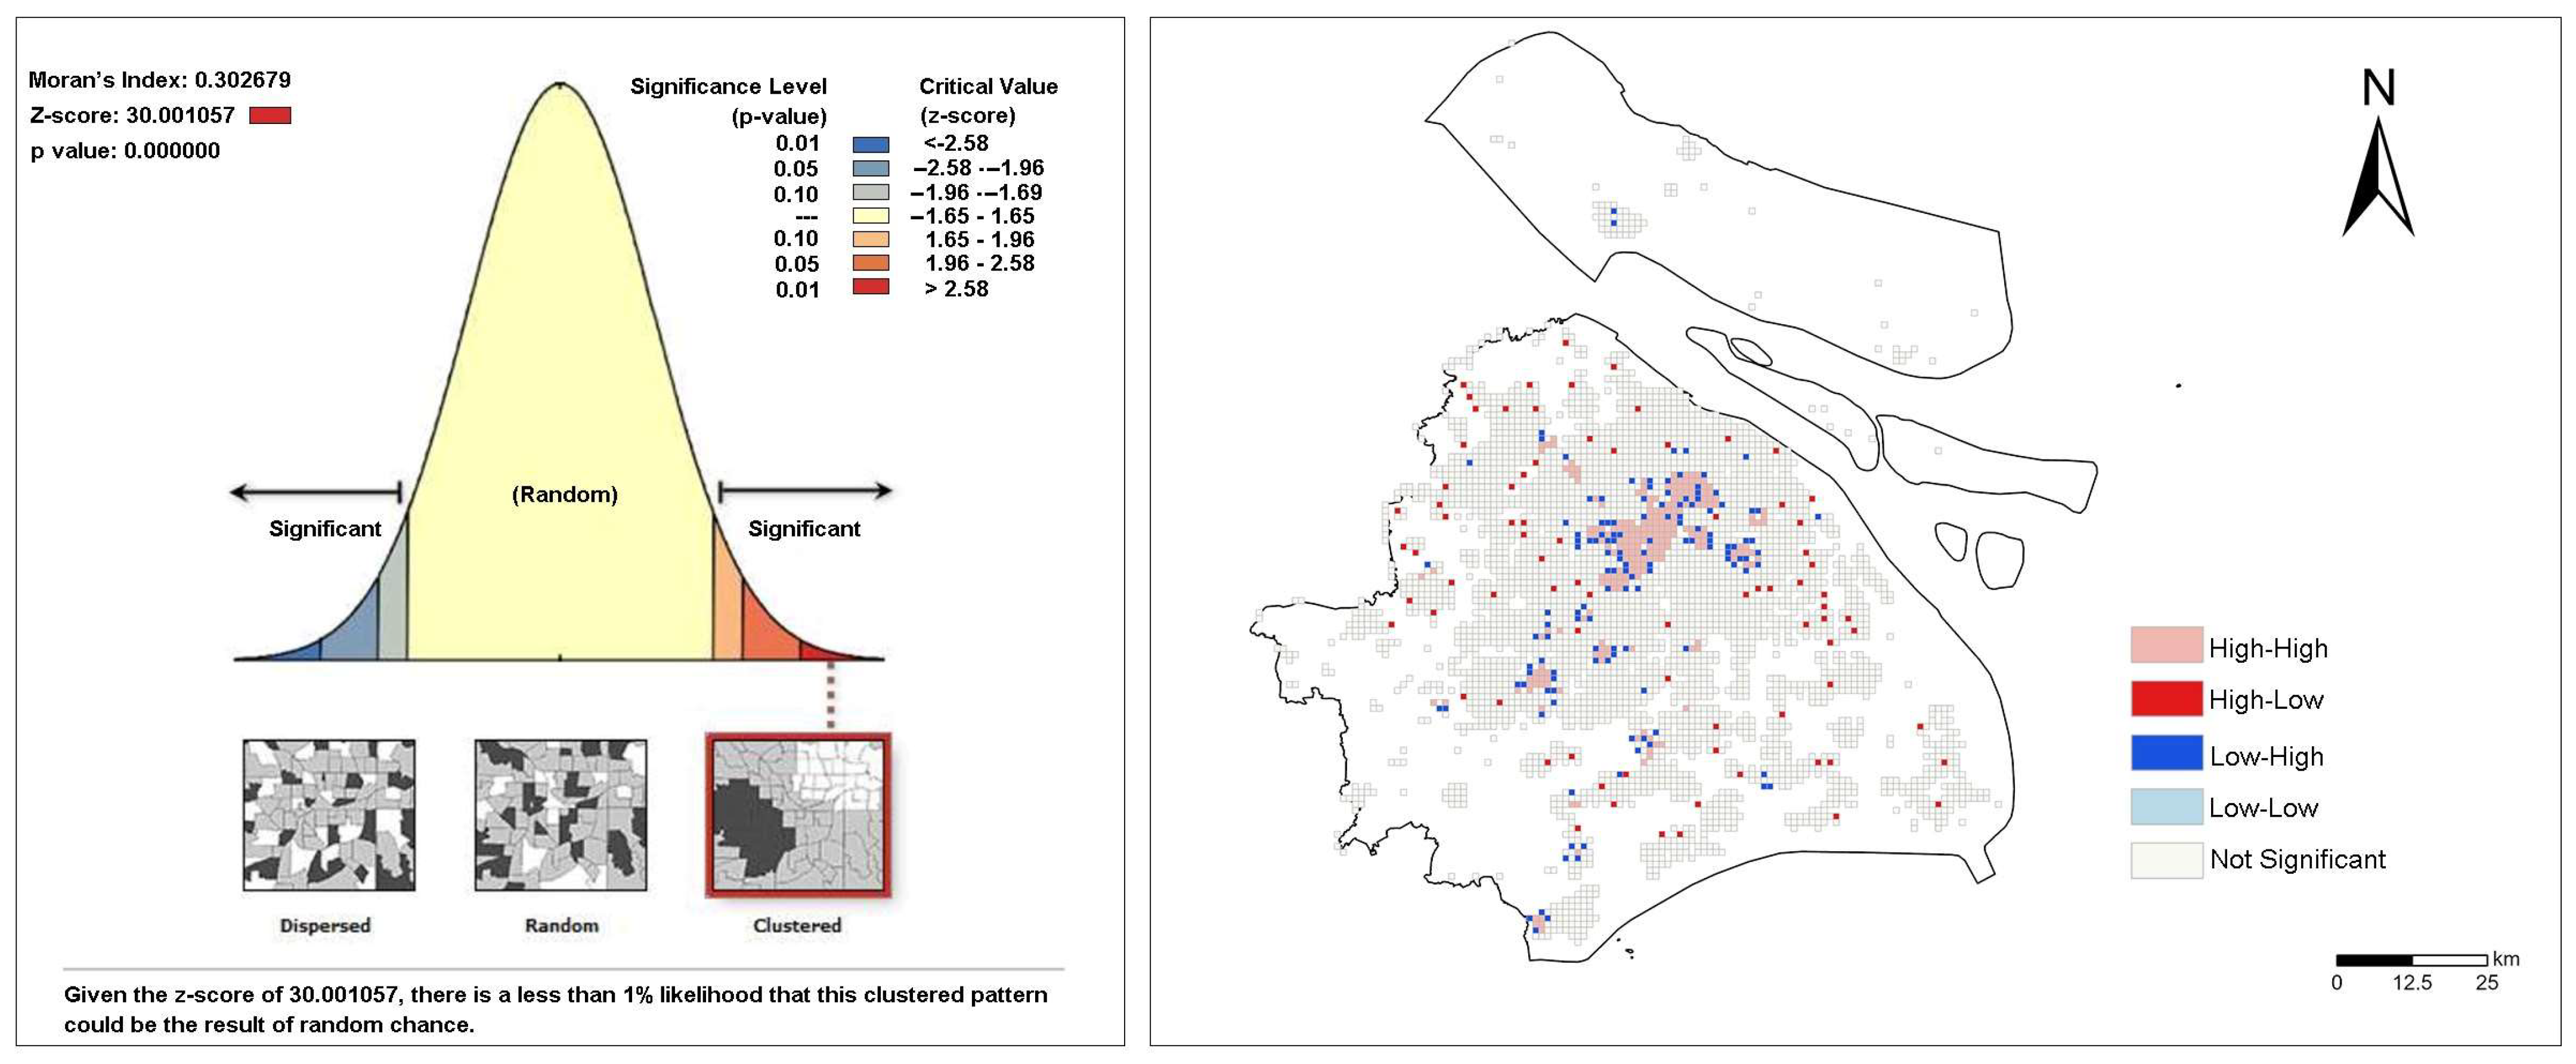
We first confirmed the presence of significant spatial autocorrelation in firm agglomeration using the Global Moran’s I and Local Moran’s I (LISA) tests (
Figure 8). The Global Moran’s I value was 0.3027 with a Z-score of 30.0011 (
p < 0.01), indicating a highly significant clustered pattern rather than a random distribution. The LISA results further reveal high-high clusters in core urban areas and low-low clusters, along with a few spatial outliers, in peripheral areas. Subsequently, an OLS regression model was established as the baseline, and prior to the regression, multicollinearity among explanatory variables was assessed using the Variance Inflation Factor (VIF) test (
Appendix A), with all VIF values found to be below the threshold of 5 (maximum = 3.918), indicating no serious multicollinearity. Therefore, no variables were removed on this ground.
Table 5 shows that MGWR regression results are more accurate than those from OLS and GWR.
In the subsequent MGWR model analysis, we retained all 14 explanatory variables. This decision was based not only on the absence of multicollinearity among variables, but also on the consideration that some variables with relatively low global feature importance may exhibit spatially heterogeneous effects that are not readily captured by global analyses.
4.2.2. MGWR Results
Table 6 presents a comparative assessment of the OLS, GWR, and MGWR models, demonstrating that MGWR delivers superior overall performance by explicitly capturing spatially varying relationships between predictors and firm agglomeration. The detailed results of MGWR are reported in
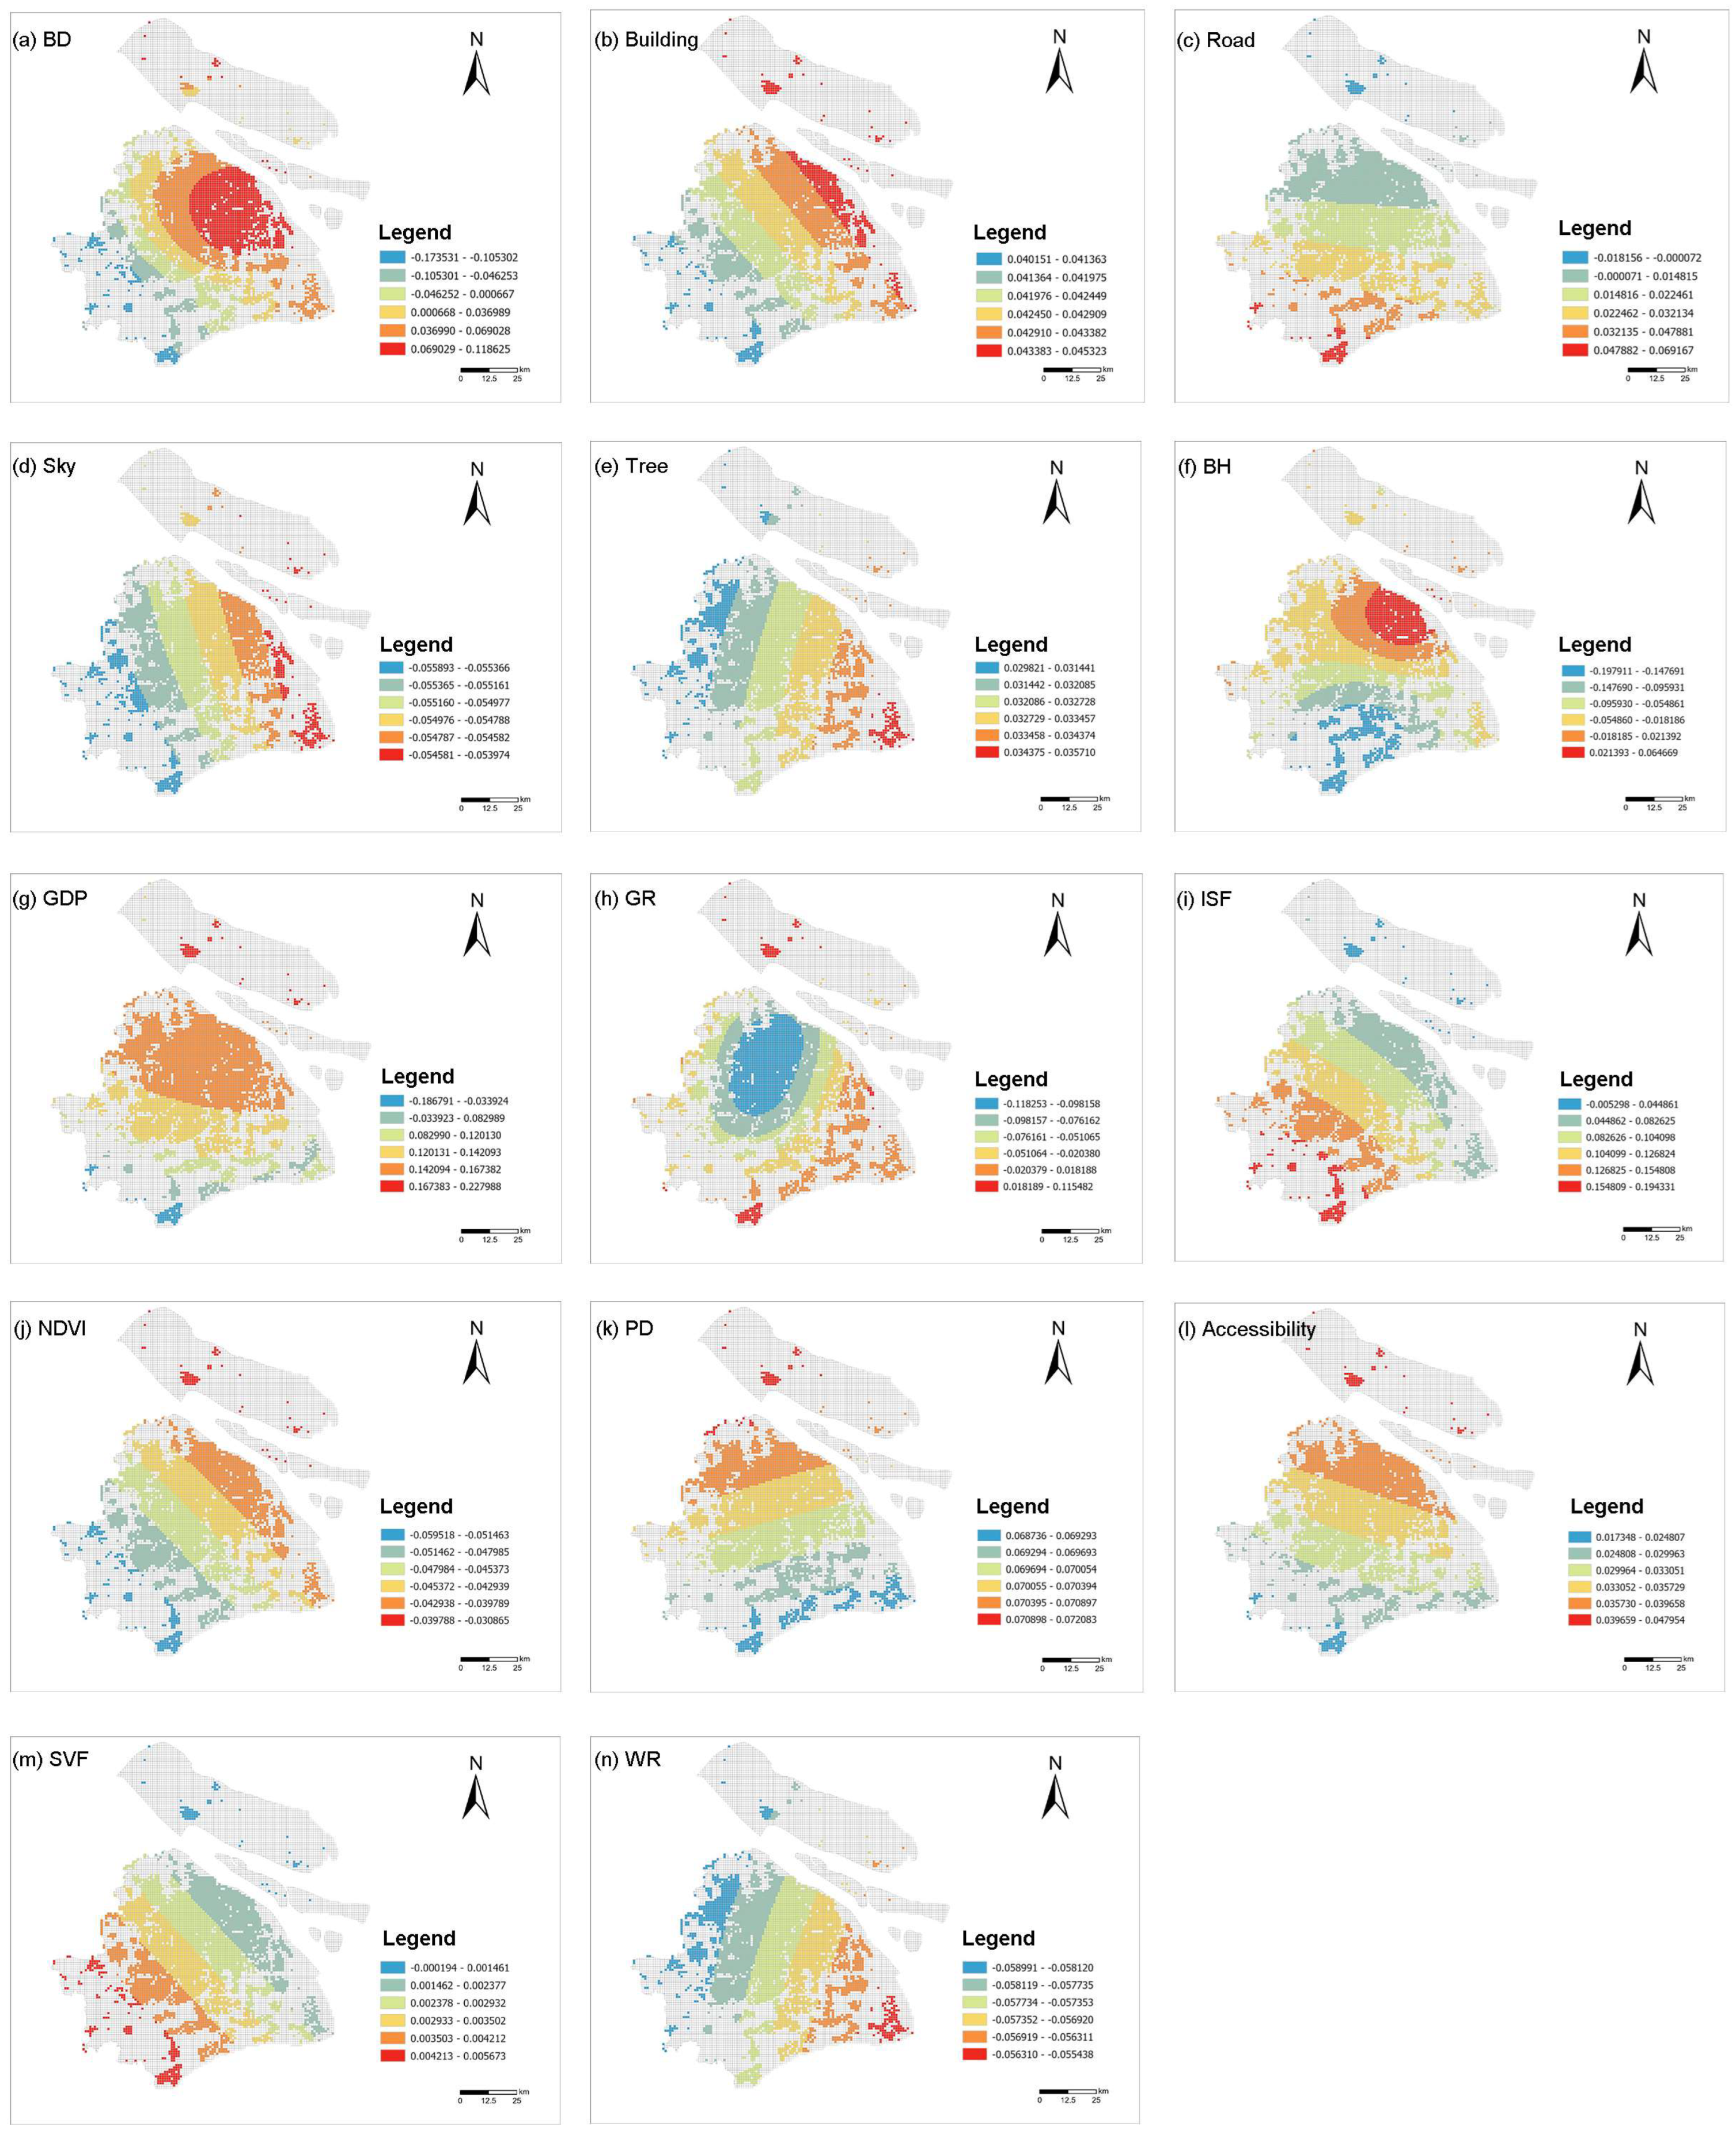
Table 7 and illustrated in
Figure 9. As can be seen, the variable bandwidth provides a more precise and comprehensive perspective for exploring the relationships of spatial data. The optimal bandwidths for MGWR were determined using a Golden Section Search procedure to minimize AICc values [
58]. Based on a comparative assessment (
Appendix A,
Table A2), the bisquare kernel outperformed the Gaussian kernel in terms of AICc and R
2 values, and was therefore adopted for the final MGWR estimations. All spatial analyses and data processing were conducted using ArcGIS 10.8.1 and ArcGIS Pro 3.5.
Table 7 summarizes the local regression coefficient distributions of the MGWR model, highlighting the spatial heterogeneity and threshold effects of different explanatory variables on firm agglomeration. Among all predictors, GDP (mean coefficient = 0.1323, bandwidth = 31.38%) emerges as one of the strongest and most spatially varying drivers. Its positive influence is pronounced in core urban areas (maximum 0.228), indicating that robust economic fundamentals substantially enhance firm clustering, while some peripheral zones show weakly negative effects, possibly due to structural mismatches between economic activity and industrial land availability.
ISF (mean = 0.1053, bandwidth = 32.42%) is another key factor, displaying strong positive effects in high-intensity built-up zones (max 0.1943), suggesting that developed hard surfaces are closely associated with agglomeration economies. Similarly, BD (mean = 0.0267, bandwidth = 20.88%) shows predominantly positive contributions (max 0.1186) in central areas, but its effect reverses to negative in some peripheral grids (min −0.1735), implying congestion thresholds beyond which additional density suppresses clustering. BH (mean = −0.0517, bandwidth = 20.88%), while significant in many locations, generally exhibits negative coefficients, reflecting potential diseconomies of excessive vertical development at the micro-scale.
Accessibility-related variables also play a major role. Accessibility (mean = 0.0336, bandwidth = 51.10%) has stable positive effects across the region (max 0.048), especially along major transport corridors, reinforcing its importance in supporting firm location choices. Road (mean = 0.0204, bandwidth = 39.56%) contributes positively in most core areas (max 0.0692), but negative local effects in some suburban zones (min −0.0182) suggest that over-fragmented road networks may undermine clustering benefits.
Ecological variables exhibit mixed effects. GR (mean = −0.064) and NDVI (mean = −0.0455) both reveal inverted U-shaped patterns: moderate greenery enhances spatial attractiveness (GR max = 0.1155), while excessive ecological coverage can displace developable land and dampen clustering. Tree coverage (mean = 0.0325) shows a small but consistently positive effect, while WR (mean = −0.0575) has a weak negative influence throughout the study area.
Other built environment perceptual features exert relatively minor effects. Building facade visibility (mean = 0.0426) has a stable positive association, whereas SVF (SVF, mean = 0.0029) and Sky (mean = −0.055) contribute little explanatory power, indicating that visual openness plays a negligible role in firm location decisions compared to economic, density, and accessibility factors. PD remains globally positive (mean = 0.07, bandwidth = 100%), reflecting stable labor market effects without spatial heterogeneity.
Figure 9 further visualizes the local regression coefficient distributions of the above variables, intuitively illustrating their spatial heterogeneity and the geographic patterns of effect intensity.
5. Discussion
5.1. Nonlinear Effects of Street-Level Built Environment on Urban Industrial Agglomeration
This study comprehensively examines the influence of macroeconomic factors, streetscape perceptual features, and built environment characteristics on urban industrial agglomeration, revealing pronounced nonlinear effects and spatial heterogeneity. The observed nonlinear relationships indicate that the formation of urban industrial spatial patterns is not solely determined by the overall levels of built environment variables, but rather by whether these variables exceed specific threshold values. This finding contrasts sharply with the simplified assumptions commonly made in previous linear studies [
23].
5.1.1. Relative Importance of Environmental Variables for Urban Firm Agglomeration
Among all micro-scale built environment variables, ISF, BH, and BD exhibit the strongest explanatory power, highlighting the critical role of spatial intensity and compactness in fostering the agglomeration of strategic emerging industries. Notably, BH demonstrates a negative association with firm clustering, while ISF and BD show positive correlations. This suggests that firms favor spatial intensity primarily characterized by high ground-level development density and compact horizontal configurations, rather than vertical expansion alone. This finding contrasts with the assertion by Li et al. that “vertical urbanism promotes innovation-driven agglomeration” [
59], indicating that strategic emerging industries may prefer flexible and open spatial arrangements over purely high-rise environments.
Notably, although both the street-level Tree variable and the remotely sensed NDVI are conventionally perceived as enhancing urban environmental attractiveness, the present study finds that their overall effects on firm agglomeration are negative. This result challenges the traditional assumption that “urban greening is always a positive externality” [
28], suggesting that areas with high vegetation coverage may be associated with lower development intensity or spatial conflicts that hinder firms’ access to transportation, clientele, and supporting services—factors critical for the growth of strategic emerging industries. Furthermore, the negative effect of Tree may reflect its obstructive role at the street level, reducing visual exposure, signage visibility, and spatial efficiency.
Additionally, macroeconomic variables such as PD and GDP exhibit greater explanatory power than accessibility. This may be attributed to the high spatial coupling between economic activity and population distribution in megacities such as Shanghai, which collectively underpin the foundations for industrial development [
60]. In contrast, accessibility exerts a relatively weaker influence in such infrastructure-rich contexts, likely due to its spatially homogeneous distribution [
61].
5.1.2. Nonlinear Effects of Environmental Variables on Urban Firm Agglomeration
The SHAP analysis conducted in this study reveals pronounced nonlinear effects, most notably an inverted U-shaped relationship between Tree coverage and NDVI and their influence on firm agglomeration. Specifically, the SHAP value for Tree peaks at 0.11 when the perceived tree coverage rate reaches approximately 0.25. Beyond this threshold, further increases in greenery are associated with a declining probability of firm clustering. This finding partially supports the “optimal greenness” hypothesis proposed by Karusisi, yet the post-threshold negative effect is more pronounced in our study [
62], indicating that strategic emerging industries may be less tolerant of excessive greening than previously suggested in resident-based preference studies. Moreover, SHAP interaction effects reveal a negative interaction between Tree and NDVI, suggesting that micro-scale greening strategies (e.g., green walls, rooftop vegetation) may better align with the spatial and operational needs of strategic emerging industries than broad-scale vegetation coverage captured by NDVI. This scale mismatch may reflect underlying spatial conflicts and competitive dynamics in land use planning for industrial zones. Accessibility also demonstrates an inverted U-shaped pattern, with the marginal contribution to firm agglomeration peaking at approximately 50 transit stops per square kilometer. Beyond this threshold, the marginal effect declines rapidly, possibly due to the emergence of negative externalities such as environmental stress and congestion, as observed in prior studies [
38].
5.2. Spatial Heterogeneity of Industrial Agglomeration in Shanghai
The MGWR analysis reveals pronounced spatial heterogeneity in the effects of built environment and socio-economic variables on firm agglomeration. Notably, most streetscape perception variables—such as Tree, Sky, and Building—exhibit relatively stable spatial effects, with optimal bandwidths approaching the global level. This contrasts with earlier studies emphasizing strong spatial variation in streetscape variables [
34]. Such consistency suggests a form of “visual consensus”, wherein these perceptual features exert relatively uniform influences in industry-oriented contexts, regardless of spatial location.
In contrast, variables such as GR, NDVI, GDP, ISF, and accessibility exhibit marked spatial non-stationarity. In particular, NDVI and GR display significantly negative effects on firm agglomeration in central districts (e.g., Huangpu District, Jing’an District), while showing neutral or even positive associations in peripheral areas (e.g., Zhangjiang High-tech Park in Pudong New Area and Zizhu High-tech Zone in Minhang District). This divergence implies that the impact of green resources is context-dependent, varying with development intensity and functional orientation: in high-density urban cores, excessive greenery may constrain land use efficiency and development potential, whereas in peripheral zones, green infrastructure enhances environmental attractiveness and supports the growth of green manufacturing and biopharmaceutical industries.
These spatial patterns align with Shanghai’s current spatial development strategy of “multi-nodal agglomeration and differentiated growth” [
11]. The urban core prioritizes land use optimization to accommodate high-density knowledge-intensive sectors such as AI and fintech, while peripheral zones leverage ecological advantages to attract green and emerging industries. This finding contributes to a more nuanced understanding of the trade-offs between firm siting and green space planning, offering actionable insights for place-based industrial policy and sustainable spatial planning.
5.3. Significance of This Study
Currently, both the academic community and urban policymakers face the pressing challenge of balancing high-density development with sustained industrial agglomeration in megacities. “High-quality spatial environments” and “innovation-driven development” are widely recognized as critical levers for enhancing urban competitiveness and promoting long-term sustainability. By integrating multi-source BE data with street view imagery (SVI)-derived perceptual features, this study employs interpretable spatial analysis techniques to systematically uncover the multi-dimensional effects of environmental variables across scales on urban firm clustering, as well as their spatial heterogeneity. This offers new theoretical insights and empirical evidence for addressing a key academic and policy concern.
For high-density metropolises such as Shanghai, optimizing the industrial spatial layout should not rely solely on intensive construction. Instead, it is essential to consider the threshold effects of building morphology, the appropriateness of local-scale greenery, and the synergistic roles of open space systems. In terms of policy design, particular attention should be paid to achieving a balance between building intensity and greenery in core urban areas to prevent environmental degradation caused by excessive compactness. In emerging functional zones, improving streetscape quality and enhancing multi-dimensional accessibility are key to stimulating the clustering potential of innovation-oriented firms. In peripheral low-density areas, it is crucial to guide industrial spillover while maintaining ecological integrity, thereby mitigating the risk of spatial “hollowing out.”
In sum, this study advocates for the coordinated optimization of physical environmental conditions, transportation accessibility, and perceptual landscape elements, aiming to construct a more resilient and adaptive innovation-oriented spatial network. Such a network can support urban economic transformation and provide a strategic foundation for sustainable regional development.
6. Conclusions
This study constructs an interpretable spatial machine learning framework based on multi-source urban data to systematically investigate the nonlinear effects and spatial heterogeneity of street-level BE features on firm agglomeration in Shanghai. By integrating XGBoost, SHAP, and MGWR methods, we effectively modeled complex variable interactions, identified critical threshold effects, and revealed significant spatial non-stationarity. The key findings are as follows: (1) Built morphology indicators such as ISF and BD significantly promote industrial agglomeration and exhibit clear threshold effects, while excessive BH may suppress clustering, suggesting that vertical development must align with local spatial adaptability. (2) Streetscape perception features such as Tree and Sky show relatively consistent “visual consensus” effects across space, whereas greenness indicators like NDVI and GR demonstrate context-dependent heterogeneity—suppressing agglomeration in high-density core areas but facilitating it in peripheral zones. (3) Both accessibility and greenness show inverted U-shaped relationships with firm clustering, indicating that while moderate levels are beneficial, exceeding certain thresholds may generate negative externalities such as congestion or inefficient resource allocation.
Theoretically, this study contributes to the urban economic geography and spatial planning literature by deepening our understanding of how micro-scale built environment factors shape industrial spatial structures. The integrated use of interpretable machine learning and geographically weighted regression validates the existence of variable interactions, threshold mechanisms, and spatial non-stationarity, enriching the analytical paradigm of industrial agglomeration research. Furthermore, it provides empirical grounding for an emerging urban spatial theory that integrates perception, morphology, and functionality.
Practically, the findings offer place-sensitive guidance for optimizing the built environment to promote the orderly development of high-tech industries in Shanghai. In central urban areas, policies should aim to control excessive building height, enhance ground-level development density and accessibility, and avoid over-greening that may hinder spatial efficiency. In emerging functional zones, emphasis should be placed on improving streetscape legibility and environmental perception to enable threshold-oriented spatial strategies. In low-density peripheral districts, ecological advantages should be leveraged to foster green industrial clusters, with enhanced connectivity and policy coordination strengthening spatial synergy with the urban core. Additionally, we advocate for the establishment of street-level built environment monitoring and dynamic evaluation systems to enable data-driven, precision-based industrial spatial planning and governance. These insights collectively provide robust scientific support for building a more resilient and adaptive urban innovation network.
