Article

From Diversity to Homogenisation: Assessing Two Decades of Temperate Native Forest Replaced by Exotic Plantations in the Nahuelbuta Mountain Range

by
Rebeca Martínez-Retureta
1,2,*,
Rosa Reyes-Riveros
1,2,3,*,
Iongel Duran-Llacer
4,5,
Lien Rodríguez-López
6,
Clara Margarita Tinoco-Navarro
7 and
Norberto J. Abreu
8,9
1
Departamento de Ciencias Ambientales, Facultad de Recursos Naturales, Universidad Católica de Temuco, Rudecindo Ortega 02950, Temuco 4780000, Chile
2
Laboratorio de Planificación Territorial, Facultad de Recursos Naturales, Departamento de Ciencias Ambientales, Universidad Católica de Temuco, Temuco 4780000, Chile
3
Laboratorio de Ecología del Paisaje y Conservación, Universidad de La Frontera, Temuco 4780000, Chile
4
Escuela de Ingeniería en Medio Ambiente y Sustentabilidad y Escuela de Ingeniería Forestal, Facultad de Ciencias, Ingeniería y Tecnología, Universidad Mayor, Camino La Pirámide 5750, Santiago 8580745, Chile
5
Hémera Centro de Observación de la Tierra, Facultad de Ciencias, Ingeniería y Tecnología, Universidad Mayor, Camino La Pirámide 5750, Santiago 8580745, Chile
6
Facultad de Ingeniería, Universidad San Sebastián, Lientur 1457, Concepcion 4030000, Chile
7
Centro Transdisciplinario de Incidencia Socioambiental, Facultad de Ciencias Naturales, Universidad Autónoma de Querétaro, Queretaro 76230, Mexico
8
Departamento de Ingeniería Química, Facultad de Ingeniería y Ciencias, Universidad de la Frontera, Francisco Salazar 01145, Temuco 4780000, Chile
9
Centro de Manejo de Residuos y Bioenergía, BIOREN, Universidad de la Frontera, Francisco Salazar 01145, Temuco 4780000, Chile
*
Authors to whom correspondence should be addressed.
Land 2025, 14(8), 1648; https://doi.org/10.3390/land14081648
Submission received: 13 July 2025 / Revised: 11 August 2025 / Accepted: 12 August 2025 / Published: 15 August 2025
(This article belongs to the Section Land – Observation and Monitoring)

Abstract

The Nahuelbuta Mountain Range in the south-central zone of Chile is a biodiversity hotspot that has undergone intense land use/cover transformation. This study analyses two decades of land use change (1999–2018) in the watersheds of the Lebu and Leiva rivers. The magnitude and spatial configuration of these changes were assessed using detailed spatial information, transition matrices, and landscape metrics. The results show that between 1999 and 2018, temperate native forest decreased by 30.3% in Lebu and 22.8% in Leiva, being replaced mainly by exotic forest plantations, which increased by 20.2% and 13.5%, respectively. The spatiotemporal analysis revealed losses concentrated in the lowland and middle zones of both watersheds, with persistence of temperate native forest in higher elevations. Landscape metrics showed an increase in diversity (SIDI: Lebu 0.41–0.65; Leiva 0.29–0.57) and a decrease in aggregation (AI: 92–86%; 95–90%). At the class level, the temperate native forest presented greater fragmentation, with a reduction in size and proximity, an increase in density, and more irregular shapes. In contrast, exotic forest plantations increased in size and proximity, with a slight decrease in density and greater complexity of form, consolidating their expansion and spatial continuity in both watersheds. These findings emphasise the need to implement territorial planning and conservation strategies adapted to the Nahuelbuta context, through native forest management plans that promote ecological conservation, the recovery of degraded landscapes, and the strengthening of ecosystem services, thus contributing to the well-being of local communities and long-term environmental sustainability.

1. Introduction

The study of the structure and dynamics of the landscape has gained relevance in recent decades as a key tool for understanding the ecological, hydrological, and climatic effects of land use/cover change (LUCC) at different spatial and temporal scales [1,2,3]. These analyses are essential for understanding how landscape dynamics and patterns affect environmental management [4]. In regions with high ecological value, such as the south-central zone of Chile, the intensification of productive activities, specifically the forestry model based on the monoculture of species like Pinus radiata and Eucalyptus spp., has led to severe territorial transformations, evidenced by fragmentation processes, loss of native cover, and functional homogenisation of the landscape [5,6,7,8]. These processes have been particularly evident in sectors of high ecological transition, where the replacement of native forests by exotic forest monocultures has caused intense alterations in the spatial configuration, ecological connectivity, and the provision of ecosystem services [7,9,10,11]. In addition, accelerated deforestation [12], habitat loss [13], and a decrease in the area of native forest [14] have also been documented, with direct consequences for the quality of life of local communities and their livelihoods. These transformations respond not only to local productive pressures, but also to a territorial structure promoted by state incentives and transnational assets [15,16].
The Nahuelbuta Mountain Range, located on the border between the Biobio and Araucanía regions of Chile, is a unique geographical unit within the Coastal Mountain Range, as it represents the transition between the coastal ecosystem and the intermediate depression. Its strategic biogeographic position and its rich flora, with a high proportion of endemic and relict species such as Araucaria araucana and Nothofagus spp., make it a critical area for biodiversity conservation [17]. However, this mountain range has a low degree of protection (~10.4%), being subject to intense anthropic pressure, derived from the expansion of the forestry industry, the replacement of natural cover, and unplanned productive development, with a loss of 33% of native forest from 1986 to 2011, associated with the replacement by non-native forest plantations [17,18]. Despite its relevance, there are still gaps in knowledge about the spatial evolution of the landscape and its ecological implications in coastal watersheds located in this mountain system. Specifically, the understanding of the ecological and functional consequences of the disconnection between native forest remnants and protected areas is still limited [18,19].
Landscape metrics are a valuable tool for quantitatively characterising spatial patterns and assessing the effects of land transformation on ecological processes such as connectivity, fragmentation, and diversity [20,21,22]. These metrics allow for comparing changes over time and between different cover classes, generating valuable information for sustainable land management and environmental planning for the mitigation of environmental impacts in areas of high ecological sensitivity [4,23]. In the context of the expansion of exotic species, the use of these metrics facilitates the evaluation of the magnitude, direction, and spatial configuration of these transformations [24,25].
This study aims to analyse the LUCC that took place between 1999 and 2018 in the coastal watersheds of the Lebu and Leiva rivers, located on the western slope of the Nahuelbuta Mountain Range. We seek to identify the main patterns of territorial transformation, evaluate the processes of fragmentation and loss of connectivity, and discuss their implications for ecological conservation and territorial planning in the context of increasing productive pressure by analysing patterns in spatial metrics at the landscape and class levels.

2. Materials and Methods

2.1. Physical and Geographical Characteristics of the Study Area

The Nahuelbuta Mountain Range is a semi-elliptical formation that runs north–south between the Biobio and Imperial Rivers, dividing the provinces of Arauco (Biobio Region) and Malleco (Araucanía Region). This Range is approximately 150 km long and 100 km wide, reaching its highest point at Piedra del Águila, at over 1500 m a.s.l. It is recognised as a strategic system for its ecological and socio-environmental value, characterised by its remarkable biodiversity and endemism, but also by its high fragmentation degree [18,26].
From a climatic point of view, the area is located in the transition zone between the humid influence of the Pacific and the South Pacific anticyclone, which determines a temperate Mediterranean climate (Köppen Csb), with precipitation concentrated in the southern winter months (May to August), which represent about 70% of the yearly total [27,28]. Annual rainfall ranges from 1100 mm on the eastern slopes to up to 1700 mm on the western slopes, while average yearly temperatures vary between 12.2 °C and 14.1 °C, influenced by altitude and slope orientation. Snowfall is unusual and limited to the highest elevations of the massif [18,26].
The study area comprises the Lebu and Leiva river watersheds, located on the western slope of the Nahuelbuta Mountain Range, south of the Biobio River, within the administrative boundaries of the Biobio Region, Chile. These watersheds are part of the hydrographic systems of the Lebu and Leiva rivers, respectively, and are embedded in a mountainous landscape that descends abruptly toward the Pacific Ocean. This terrain is characterised by a complex and rugged relief shaped by tectonic and erosive processes typical of the Coastal Mountain Range (Figure 1).
Both river watersheds exhibit a pluvial drainage regime with marked seasonality, driven by a predominantly winter precipitation pattern. The Lebu River watershed covers an area of 656 km2 and is located between 117.19 km E and 5835.38 km N, while the Leiva River watershed spans 389 km2 between 135.01 km E and 5808.58 km N. These coordinates correspond to the projected coordinate system WGS 1984/UTM Zone 19S in ArcGIS Pro 3.5.0. Elevations range from 17 to 1309 m above sea level in the Lebu watershed and from 28 to 1528 m in the Leiva watershed. The pronounced altitudinal gradients in both watersheds contribute to high topographic and ecological heterogeneity. Notably, significant remnants of native forests are still preserved in the higher eastern sectors.
From an ecological perspective, the vegetation cover of the mountain range includes five distinct vegetation belts, as defined by Luebert and Pliscoff [29], based on floristic and bioclimatic criteria. These correspond to temperate or Mediterranean—temperate forest ecosystems, comprising deciduous, laurifolious, and resinous formations: (i) temperate coastal laurifolious forest of Aextoxicon punctatum–Laurelia sempervirens; (ii) temperate coastal deciduous forest of Nothofagus alpina–Persea lingue; (iii) Mediterranean–temperate coastal mixed forest of Nothofagus dombeyi and Nothofagus obliqua; (iv) Mediterranean coastal deciduous forest of Nothofagus obliqua–Gomortega keule; and (v) temperate coastal resinous forest of Araucaria araucana, a relict species commonly found in the Andes but also occurring in the coastal range. This structural and floristic diversity has motivated the creation of protected areas such as the Nahuelbuta National Park and the Contulmo Natural Monument, in addition to the identification of priority sites for biodiversity conservation [19,30,31].
Politically, both watersheds are located in the province of Arauco, one of the most historically disadvantaged areas in Chile. This context is manifested in conditions of structural rurality, gaps in basic infrastructure, and unequal access to natural resources, especially water [32]. The expansion of the forestry industry, the loss of native forest cover, and the conflicts over access to water resources, which primarily affect indigenous communities and small farmers, create a critical socio-environmental scenario that demands integrated and sustainable territorial management strategies.

2.2. Land Use and Cover Scenarios

To analyse landscape changes, the CLDynamicLandCover v3 dataset was used [33] comprising land use/cover (LULC) maps with 30 m resolution for Central Chile, from 1990 to 2018, at five-year intervals as raster files. This database was developed through supervised classification, using Landsat images, topographic data (SRTM), and auxiliary cartographic information. The model was trained with photo-interpreted and georeferenced points from 2018, which defined spectral signatures for 15 land cover classes. The selection of predictor variables was based on machine learning and expert criteria. The final classification for previous years was generated using the Jeffries–Matusita distance and a Random Forest supervised classification model, which allowed for robust identification of land cover changes [33].
For this study, the years 1999, 2009, and 2018 were selected to assess landscape evolution at decadal scales. Although the CLDynamicLandCover dataset provides information at five-year intervals, these years were chosen to capture decadal trends that reflect cumulative and structural territorial transformation processes to identify meaningful patterns of change for medium- and long-term planning and conservation. Time trajectories were corrected considering plausible ecological transitions and cost/economic criteria, including a reclassification for harvested forest plantations. The CLDynamicLandCover product showed high precision levels, with overall accuracies between 0.894 and 0.950 and Kappa coefficients between 0.877 and 0.943, supporting its applicability in regional landscape dynamics studies [33].

2.3. Analysis of Land Use and Land Cover Transitions

To assess the LUCC in the Lebu and Leiva watersheds, an analysis of the transitions between land cover classes was carried out for the selected years, based on maps obtained from the CLDynamicLandCover database [33]. The transitions were estimated by constructing categorical change matrices for each pair of consecutive decades (1999–2009 and 2009–2018), which allowed for identifying the destination and origin of each land cover class over time. From these matrices, Sankey diagrams were generated, allowing for the proportional visualisation of the change flows between the primary cover classes [34]. This approach eased the identification of replacement patterns between natural land cover (such as native forest) and anthropogenic land cover (such as forest plantations), as well as the occurrence or expansion of secondary land covers. The analysis focused on the dominant land cover classes in both watersheds, considering their ecological and territorial relevance. All change statistics were expressed as relative proportions (%) to allow for comparison between watersheds of different sizes. This analysis allowed for a comprehensive interpretation of landscape trajectories and revealed the processes of land substitution, degradation, or intensification in each period.

2.4. Spatial Analysis of Land Use and Land Cover Dynamics

The spatial characterisation of LUCC was performed by preparing thematic maps for the years 1999, 2009, and 2018, using the CLDynamicLandCover v3 dataset as the primary input. The maps were cropped to the boundaries of the Lebu and Leiva watersheds, previously delimited using digital elevation models (ALOS PALSA) and cartographic verification, to ensure the spatial coherence of the analysis.
Land cover classes with ecological and territorial relevance were selected for the study area. From this data, comparable cartographic series were generated using spatial analysis techniques in ArcGIS Pro 3.5.0. Reclassification tools and standardised symbology were used to facilitate the visualisation of changes and maintain consistency between years. This representation made it possible to identify patterns of land cover replacement, expansion, or reduction, as well as fragmentation or spatial continuity of natural units.
The spatial analysis was complemented by a visual interpretation of landscape trajectories, highlighting the areas of greatest change intensity, areas of relative conservation, and regions where productive coverage had been consolidated. This approach made it possible to reveal diverse dynamics between watersheds and to establish spatial relationships between the observed changes and territorial variables such as altitude, slope, and accessibility. In this way, this study addressed not only the quantification of changes but also their spatial and ecological dimensions, considering their potential impact on landscape structure and ecosystem functions.

2.5. Changes in Coverage and Replacement

An analysis of the changes that occurred among all the covers present in each watershed was performed between 1999 and 2018 using the Land Change Modeller (LCM) tool included in the IDRISI 17.0 Selva Edition software package. This procedure first included a quantitative analysis and, subsequently, a spatial analysis aimed at identifying the location of the transitions. For the quantitative analysis, a transition matrix was generated to calculate the change areas [km2] corresponding to each land cover class, differentiated by watershed (Lebu and Leiva). This analysis yielded the total area gained, lost, and persisted, along with the net change and the area by change contributor (source classes responsible for the gains and losses observed in each class). Raster maps of the spatial distribution of changes were subsequently produced, representing the areas where the main transitions occurred. Although all land cover classes were analysed, special emphasis was placed on reporting the results corresponding to the land covers with the most significant changes.
To calculate the landscape indices for each watershed, land cover patches were defined following the methodology proposed by Aplin and Smith [35]. Patch delimitation was performed by grouping contiguous pixels belonging to the same land cover or land use class [36].
Commonly used indices were selected to assess the spatial landscape structure [37,38]. At the landscape level, the Simpson Diversity Index (SIDI) and the Aggregation Index (AI) were calculated, which integrate all the classes present in each watershed. At the class level, patch density (PD), average patch size (AREA_MN), and the mean proximity index (PROX_MN) were evaluated and calculated separately for each land cover class.
The SIDI index ranges from 0 to 1; it takes a value of 0 when the landscape is composed of a single land cover type and approaches 1 as the diversity of land cover types increases and the proportions between them become more uniform. On the other hand, the AI ranges from 0% when patches are completely disaggregated to 100% when the entire landscape is composed of a single contiguous patch of one land cover class [37].
Additionally, the indices calculated at the class level are widely used to assess the effects of habitat loss on spatial patterns [1,37]. The PD is defined as the number of patches in a class divided by the total area of the class (number of patches per 100 hectares). The AREA_MN corresponds to the total area of all patches in a class divided by the total number of patches in that class (hectares). The PROX_MN measures the relationship between the size and proximity of all patches whose edges are within a given search radius of the focal patch; in this study, a radius of 300 m was used. Finally, the SHAPE_MN is the average shape index of all patches in a class. It reflects the complexity of patch contours compared to a more compact and regular shape. SHAPE_MN varies between 1 and infinity; it takes a value of 1 when the patch has a regular shape and increases as the shape becomes irregular [37].

3. Results

3.1. Land Use/Land Cover Change in the Study Watersheds

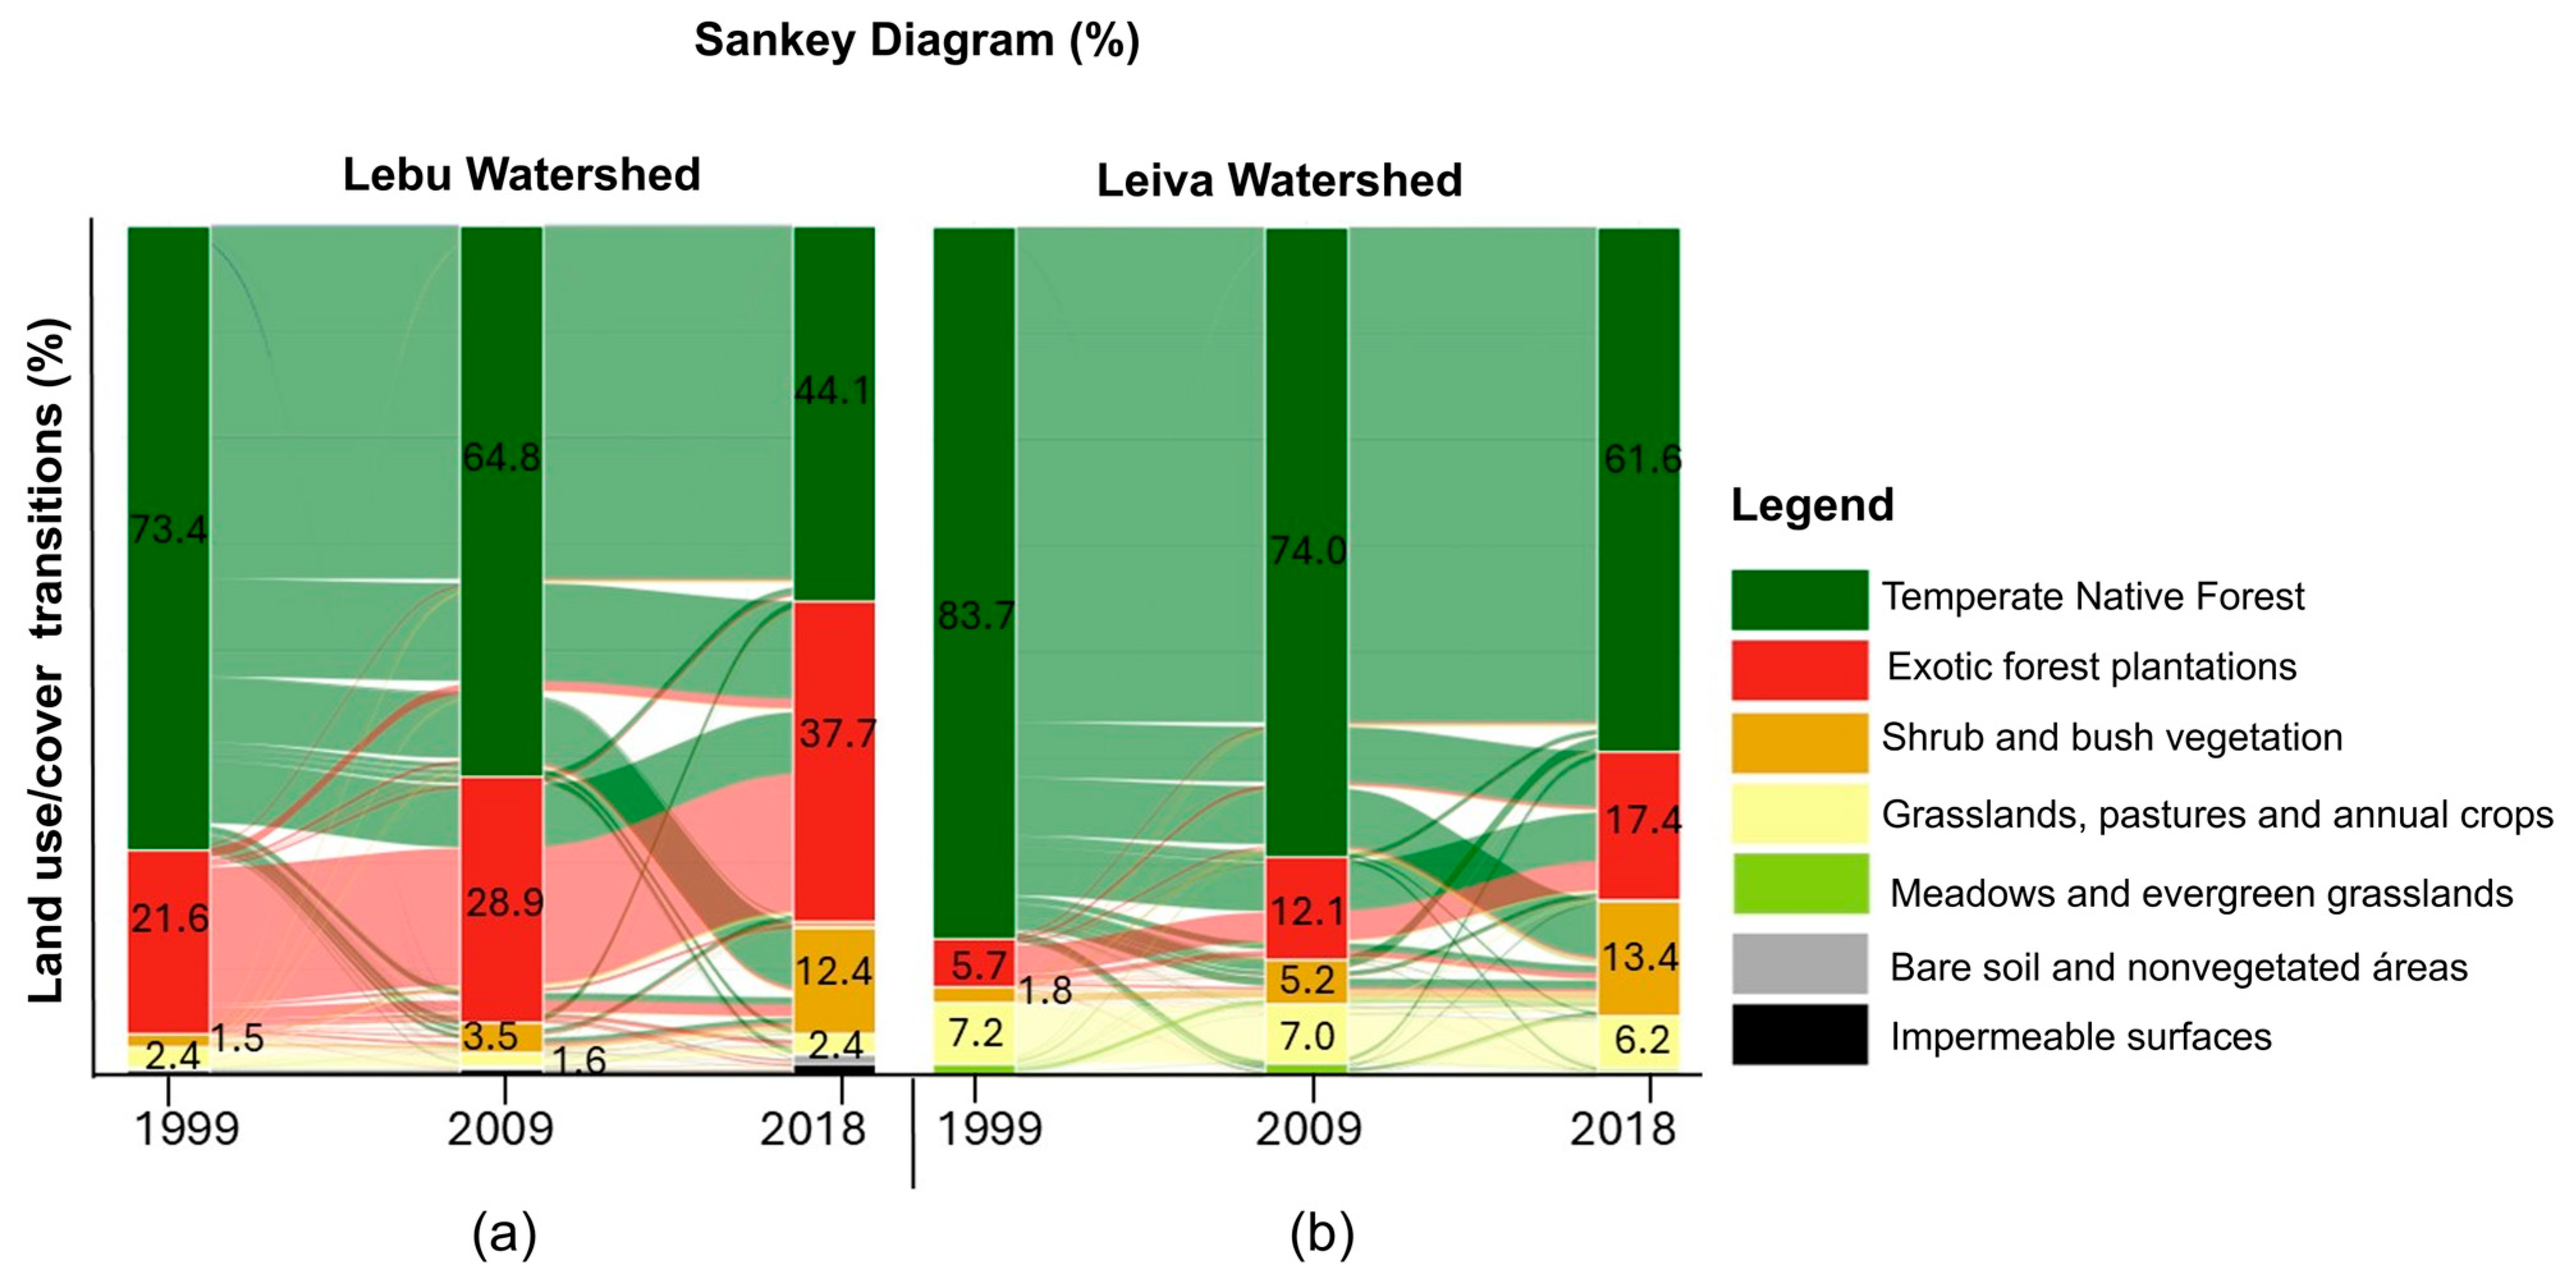
The changes in LULC that occurred between 1999, 2009, and 2018 for the Lebu (2a) and Leiva (2b) watersheds are displayed in Figure 2, using a Sankey diagram to visualise the percentage transitions between land cover classes (raw data in Appendix A, Table A1). In both cases, there is a clear trend toward a decrease in temperate native forest and its progressive replacement by exotic forest plantations, reflecting an intensification of the productive forestry model in the study area.
In the watershed of the Lebu River, native forest represented 73.4% in 1999 and decreased to 64.8% in 2009, further reducing to 44.1% in 2018. In contrast, exotic plantations increased from 21.6% in 1999 to 28.9% in 2009 and reached 37.7% in 2018. A reduction in other land covers such as scrub and bare soils accompanied this transformation.
Additionally, in the Leiva watershed, the native forest also suffered a significant loss, diminishing from 83.7% in 1999 to 74.0% in 2009 and 61.6% in 2018. Exotic plantations, meanwhile, increased from 5.7% to 12.1% between 1999 and 2009, reaching 17.4% in 2018. Likewise, a progressive growth of secondary covers such as scrub vegetation and grasslands is observed, indicative of degradation processes or extensive agricultural use.
These results reveal accelerated land use change processes that directly affect the ecological and functional structure of the landscape in both watersheds, with implications for native forest connectivity, the hydrological regime, and the provision of ecosystem services.
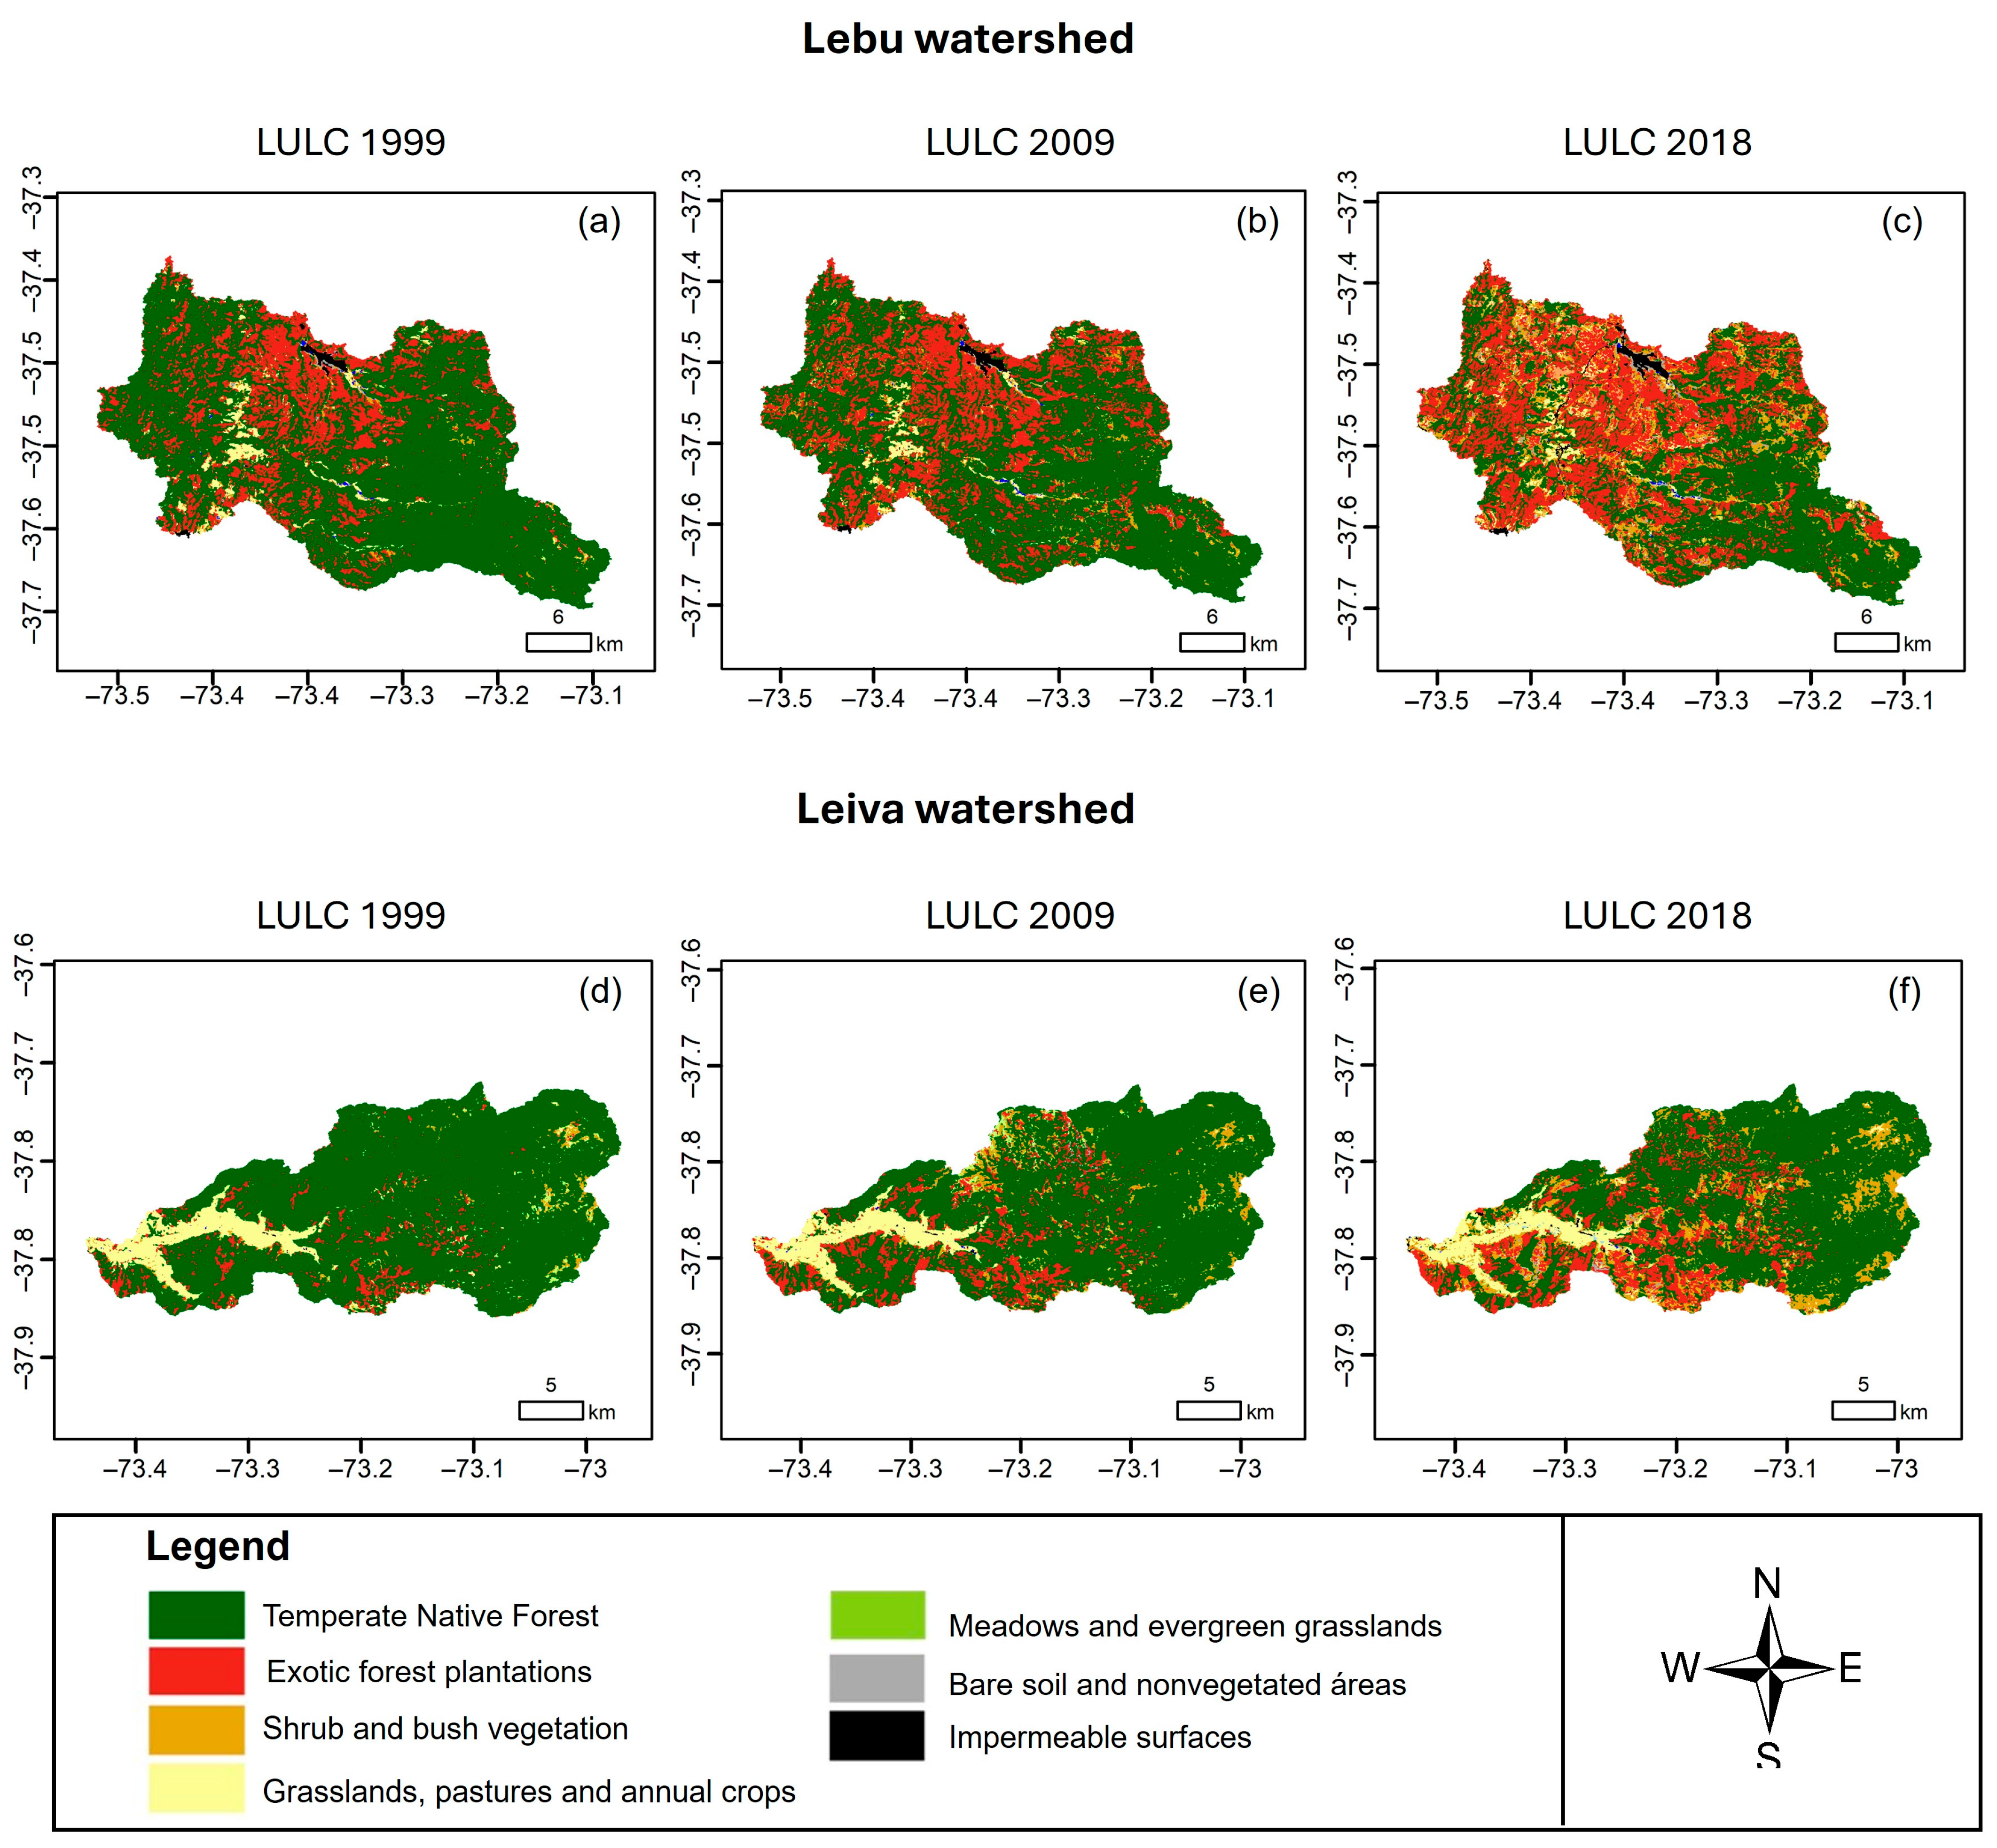
To illustrate these changes, Figure 3 shows the spatiotemporal evolution of land use and cover in the Lebu and Leiva watersheds through a series of thematic maps corresponding to the years 1999, 2009, and 2018. Each of the panels reflects the distribution of different classes of native forest cover, exotic forest plantations, scrubland, grasslands, bare soils, and impermeable surfaces, allowing for the identification of landscape transformation patterns and land use substitution processes in both hydrographic units.
In the Lebu Watershed, the 1999 map (Figure 3a) shows a landscape dominated by temperate native forest, mainly in the northern, central, and southern parts of the territory, while exotic forest plantations appear in a scattered and localised manner. By 2009 (Figure 3b), a clear expansion of exotic plantations was observed, with a notable loss of native cover in the central and eastern sectors of the watershed. This process intensified towards 2018 (Figure 3c), when plantations consolidated themselves as the dominant cover in the centre and south of the watershed, generating a fragmented spatial structure, with isolated remnants of native forest in the areas of highest altitude and slope.
Additionally, in the watershed of the Leiva river, the map from 1999 (Figure 3d) reveals greater continuity of native forest, especially in the eastern sector, while agricultural and grassland cover is concentrated in the southwest. Exotic plantations were only emerging. By 2009 (Figure 3e), an expansion of these plantations can be noticed, especially in areas previously occupied by secondary vegetation and grasslands, as well as native forest, evidenced by a partial loss of connectivity. In 2018 (Figure 3f), the pressure on the lower-lying areas in the southwest of the watershed intensified, and exotic plantations were established on former agricultural and livestock uses, consolidating a more homogeneous occupation pattern. However, they still coexist with significant patches of native forest in the middle functional zones of the watershed.
Both watersheds display transformation trajectories marked by the expansion of the industrial forestry model, with a clear trend toward landscape homogenisation at the expense of natural and semi-natural cover. The transitions occur primarily in the lower and middle functional zones of the watershed, in areas with intermediate accessibility, moderate slopes, and low altitudes. This suggests a progressive pattern of intervention from agricultural areas to regions of greater ecological value, moving toward the upper functional zone of the watershed. The fragmentation of native forests and the loss of intermediate cover, such as scrubland and grasslands, may have critical implications for ecological connectivity, the hydrological cycle, and landscape resilience to climate disturbances.

3.2. Changes in Coverage and Replacement

During the period from 1999 to 2018, the cover of temperate native forests and exotic species plantations showed the most significant changes in both the Lebu and Leiva watersheds. Consequently, quantitative and spatial analysis focuses on these two types, whose contrasting dynamics shaped a pattern of structural replacement that helps explain the transformation of the forest landscape in the study area.
Native forests showed significant losses in both watersheds, with a decrease of 192 km2 in Lebu and 85.6 km2 in Leiva. Gains were marginal in both cases (Table 1). Most of the loss in temperate native forest area was due to conversion to forest plantations (123.1 km2 in Lebu and 49 km2 in Leiva) and replacement by scrubland (57.8 km2 in Lebu and 34.1 km2 in Leiva).
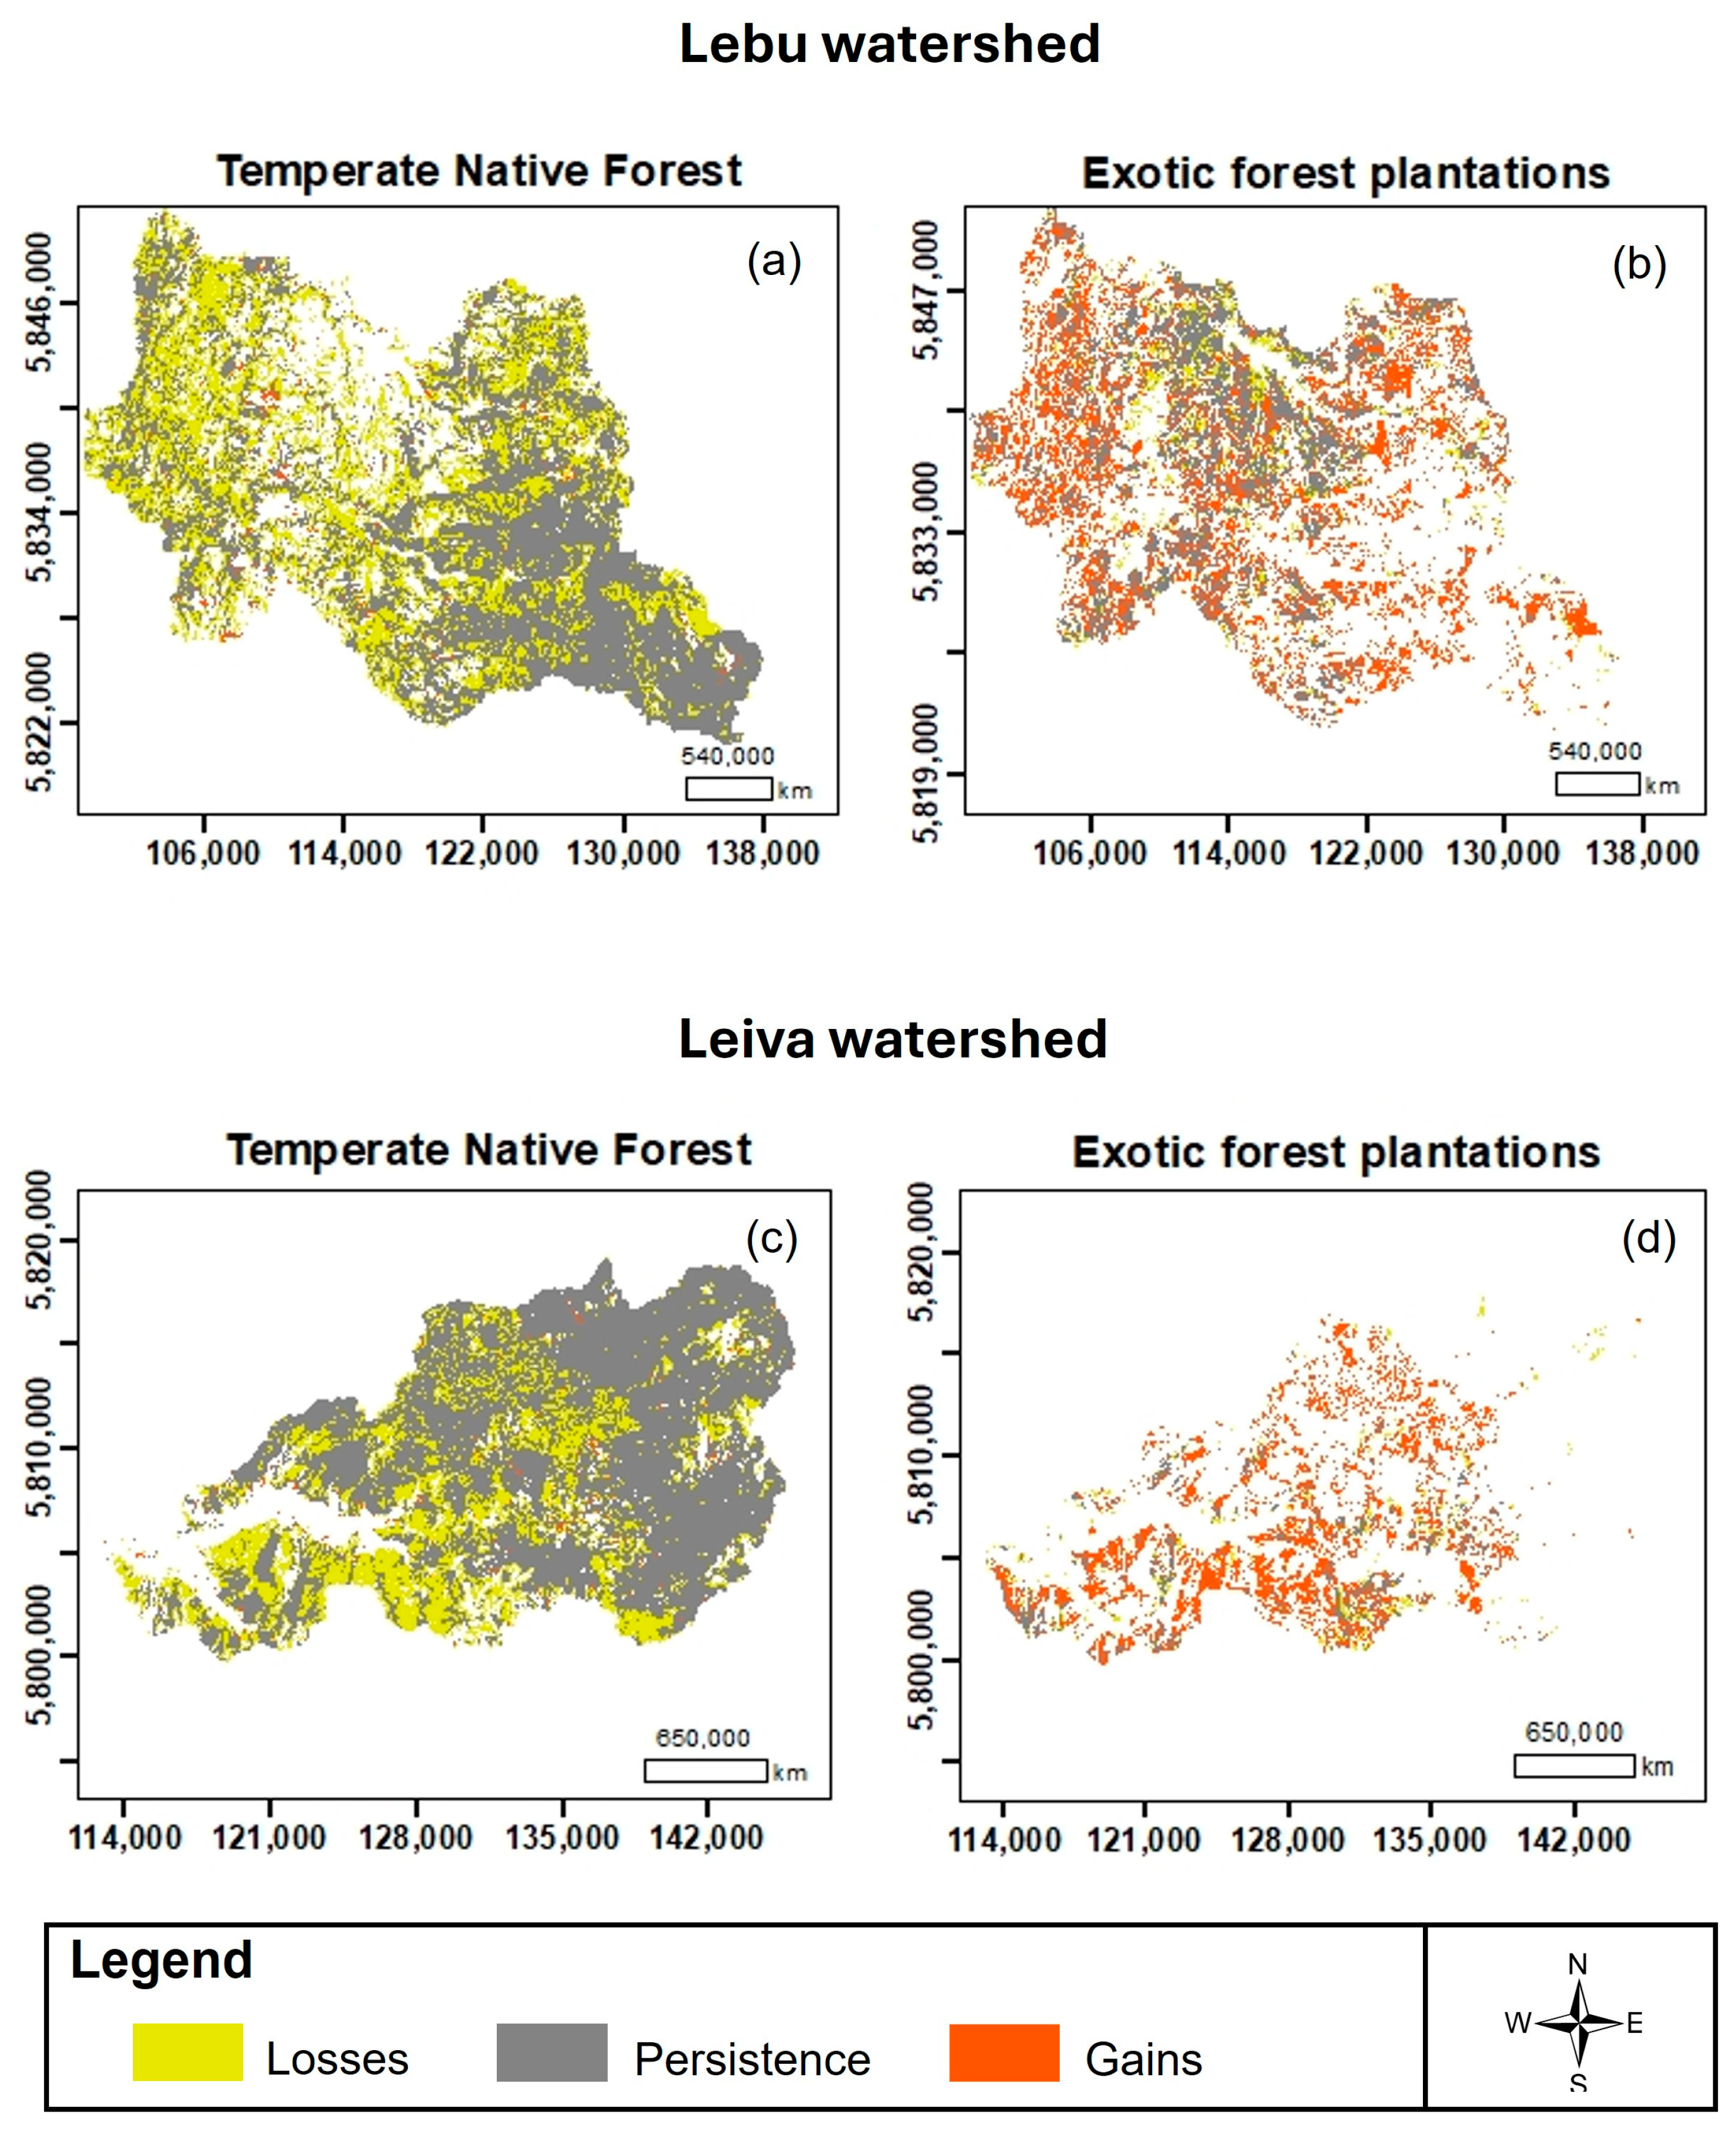
According to the maps of gain, loss, and persistence (Figure 4a,c), temperate native forest losses are widely and densely distributed, with a similar pattern in both watersheds: they predominate in the western, southwestern, and south-central zones, while larger areas of persistence are preserved in the northeast, especially in sectors bordering the Nahuelbuta Mountain Range. The areas of gain are very scarce and occur as isolated events, without forming coherent spatial patterns or exhibiting evident connectivity.
On the other hand, forest plantations underwent a net growth of 105.3 km2 in Lebu and 45.8 km2 in Leiva. Gains in both watersheds far exceeded losses (Table 1). The main transitions to plantations came from temperate native forest (123.1 km2 in Lebu and 49 km2 in Leiva) and, to a lesser extent, from scrubland (10.9 km2 in Lebu and 4.4 km2 in Leiva) and other cover, confirming direct substitution as the dominant expansion mechanism (Table 1).
In the maps of gain, loss, and persistence of exotic forest plantations (Figure 4b,d), the areas of gain in this cover are widely distributed and without a clearly defined spatial pattern. In Lebu, the persistence of large blocks in the central zone is notable, while losses appear mainly in the north-central zone, adjacent to these areas of persistence. In Leiva, the cover is dominated by the gain of plantations, which extends widely throughout the watershed; persistence is concentrated in the southwest, and losses are almost imperceptible, except for a minor concentration in the southern sector. Overall, these patterns reflect a process of spatial consolidation of plantations, with local variations in the continuity and magnitude of the transitions.
Although both watersheds exhibit a similar pattern characterised by the loss of temperate native forest and the expansion of exotic forest plantations, the magnitude, speed, and spatial location of these processes differ significantly. The experimented changes are displayed in Table 2. In absolute terms, the Lebu watershed (656 km2) exhibited larger areas of change than Leiva (389 km2). However, this difference is partially related to its larger territorial extension, since, when considering the proportion of transformed area about the size of each watershed, the figures are comparable and show a relatively similar intensity of change between both units.
Specifically, from the Lebu watershed, 30.3% lost temperate native forest area and 20.2% gained forest plantations, while on the Leiva watershed, 22.8% of the watershed lost temperate native forest and 13.5% gained plantations.
Despite the similarities, the Lebu watershed presented a more continuous and concentrated process, with transformations predominating in lower-altitude sectors located in the western, central, and southern portions of the watershed, where areas of plantation gain and persistence are interspersed with native forest remnants. Conversely, in Leiva, the modifications display a more widely distributed pattern with less spatial continuity, characterised by a generalised expansion of plantations, small areas of persistence concentrated mainly in the southwest, and isolated losses of small magnitude. This divergence in the spatial and altitudinal configuration of the transitions evidenced different transformation dynamics, whose structural and functional implications are analysed in detail using landscape metrics in the following section.

3.3. Landscape Metrics

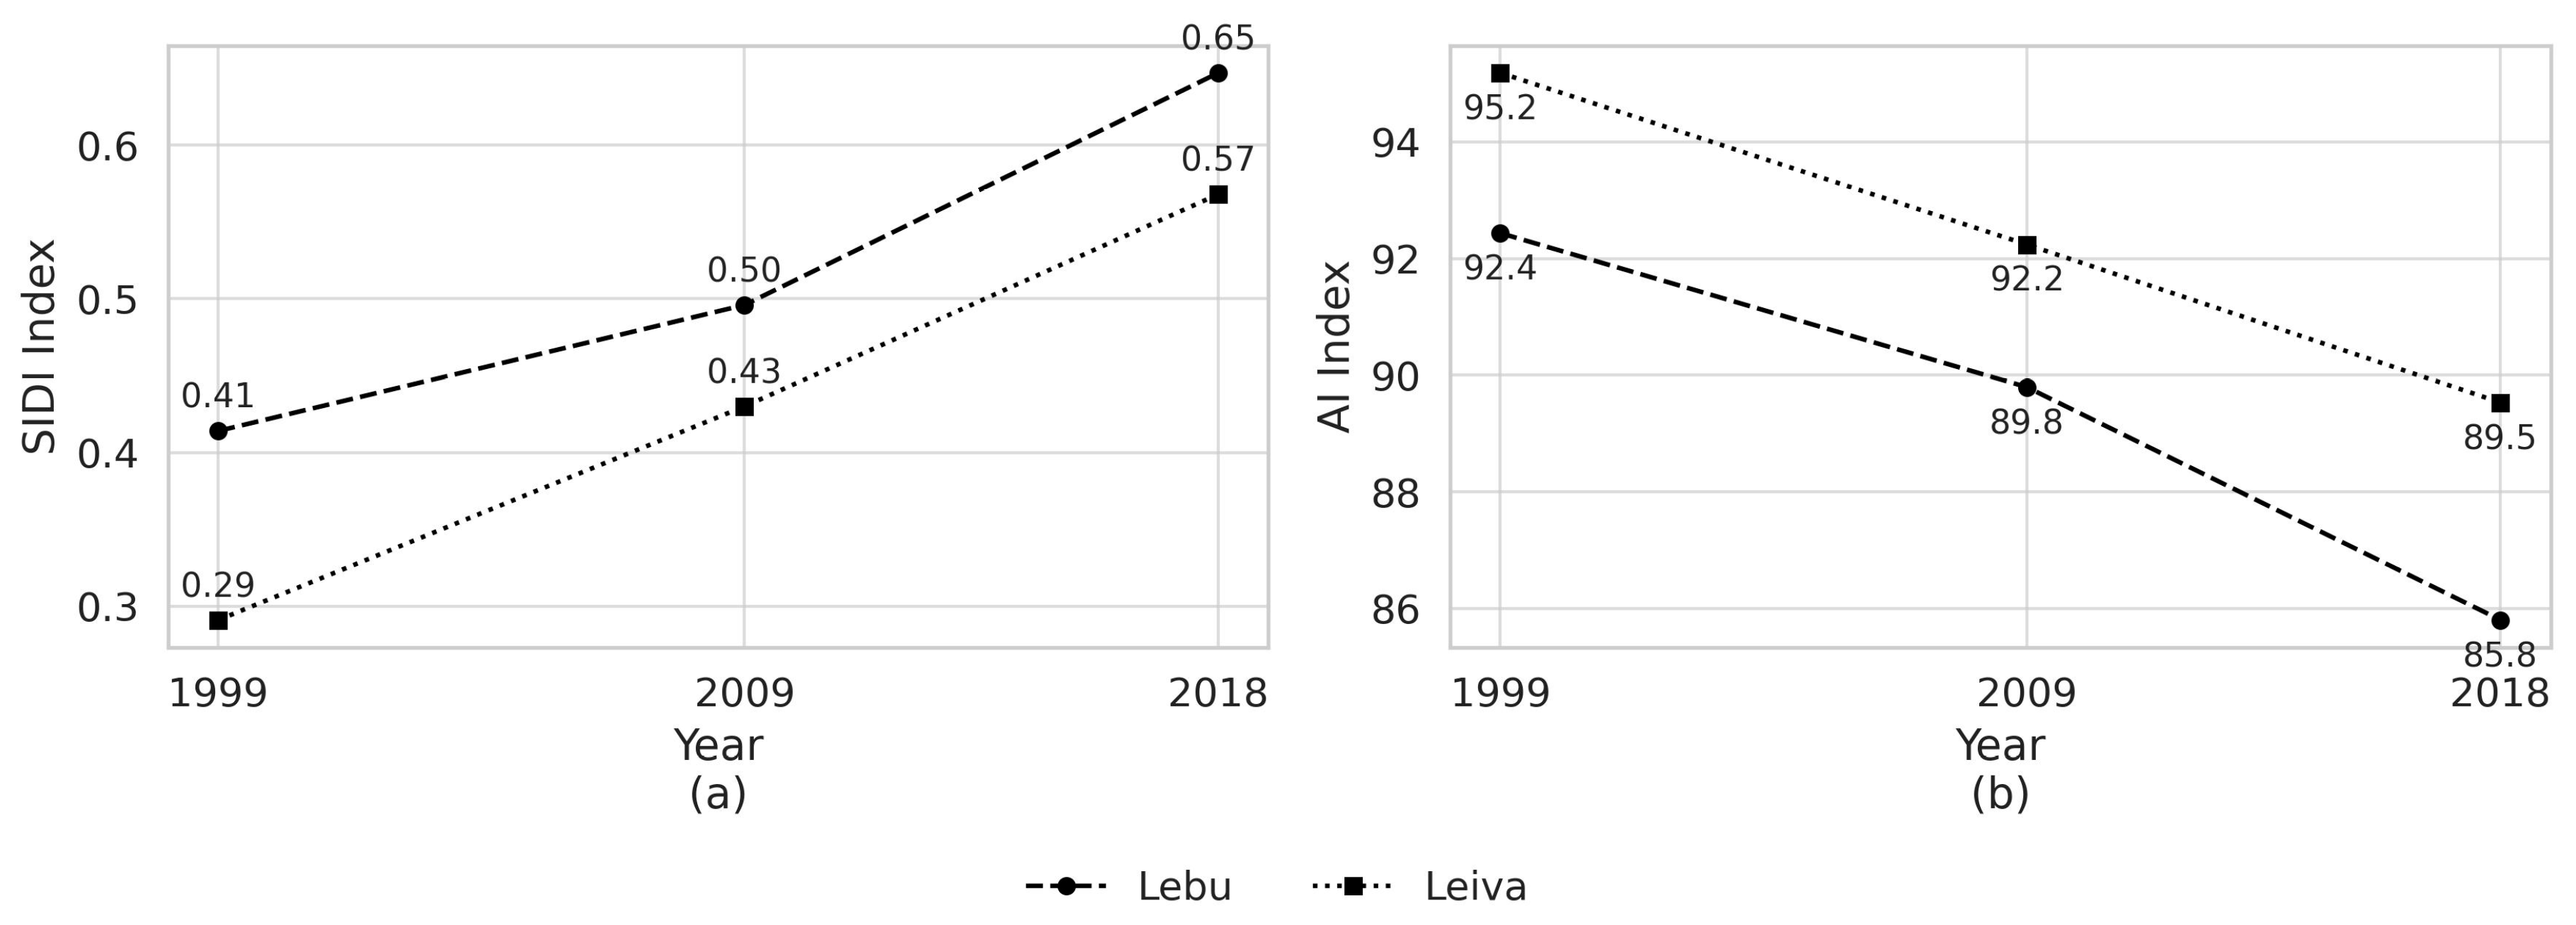
The results of the landscape-level metrics evaluated indicate an increase in structural heterogeneity and a loss of spatial cohesion in the Lebu and Leiva watersheds during the period 1999–2018. In Lebu, the SIDI increased from 0.41 in 1999 to 0.50 in 2009 and to 0.65 in 2018. In parallel, the AI decreased from 92% to 90% and then to 86%. In Leiva, SIDI increased from 0.29 to 0.43 and then to 0.57, while the AI decreased from 95% to 92% and finally to 90% (Figure 5).
The joint analysis of these metrics (SIDI and AI) shows increasing landscape heterogeneity in both watersheds. The increase in SIDI reflects that the progressive conversion of temperate native forest to exotic forest plantations, reviewed in the previous section, increased cover diversity and fragmented the original temperate native forest matrix. In addition, the decrease in AI indicates that the spatial arrangement became less compact and more fragmented. Together, these changes not only entailed a replacement of cover but also a substantial modification of the structural configuration of the landscape in both watersheds.
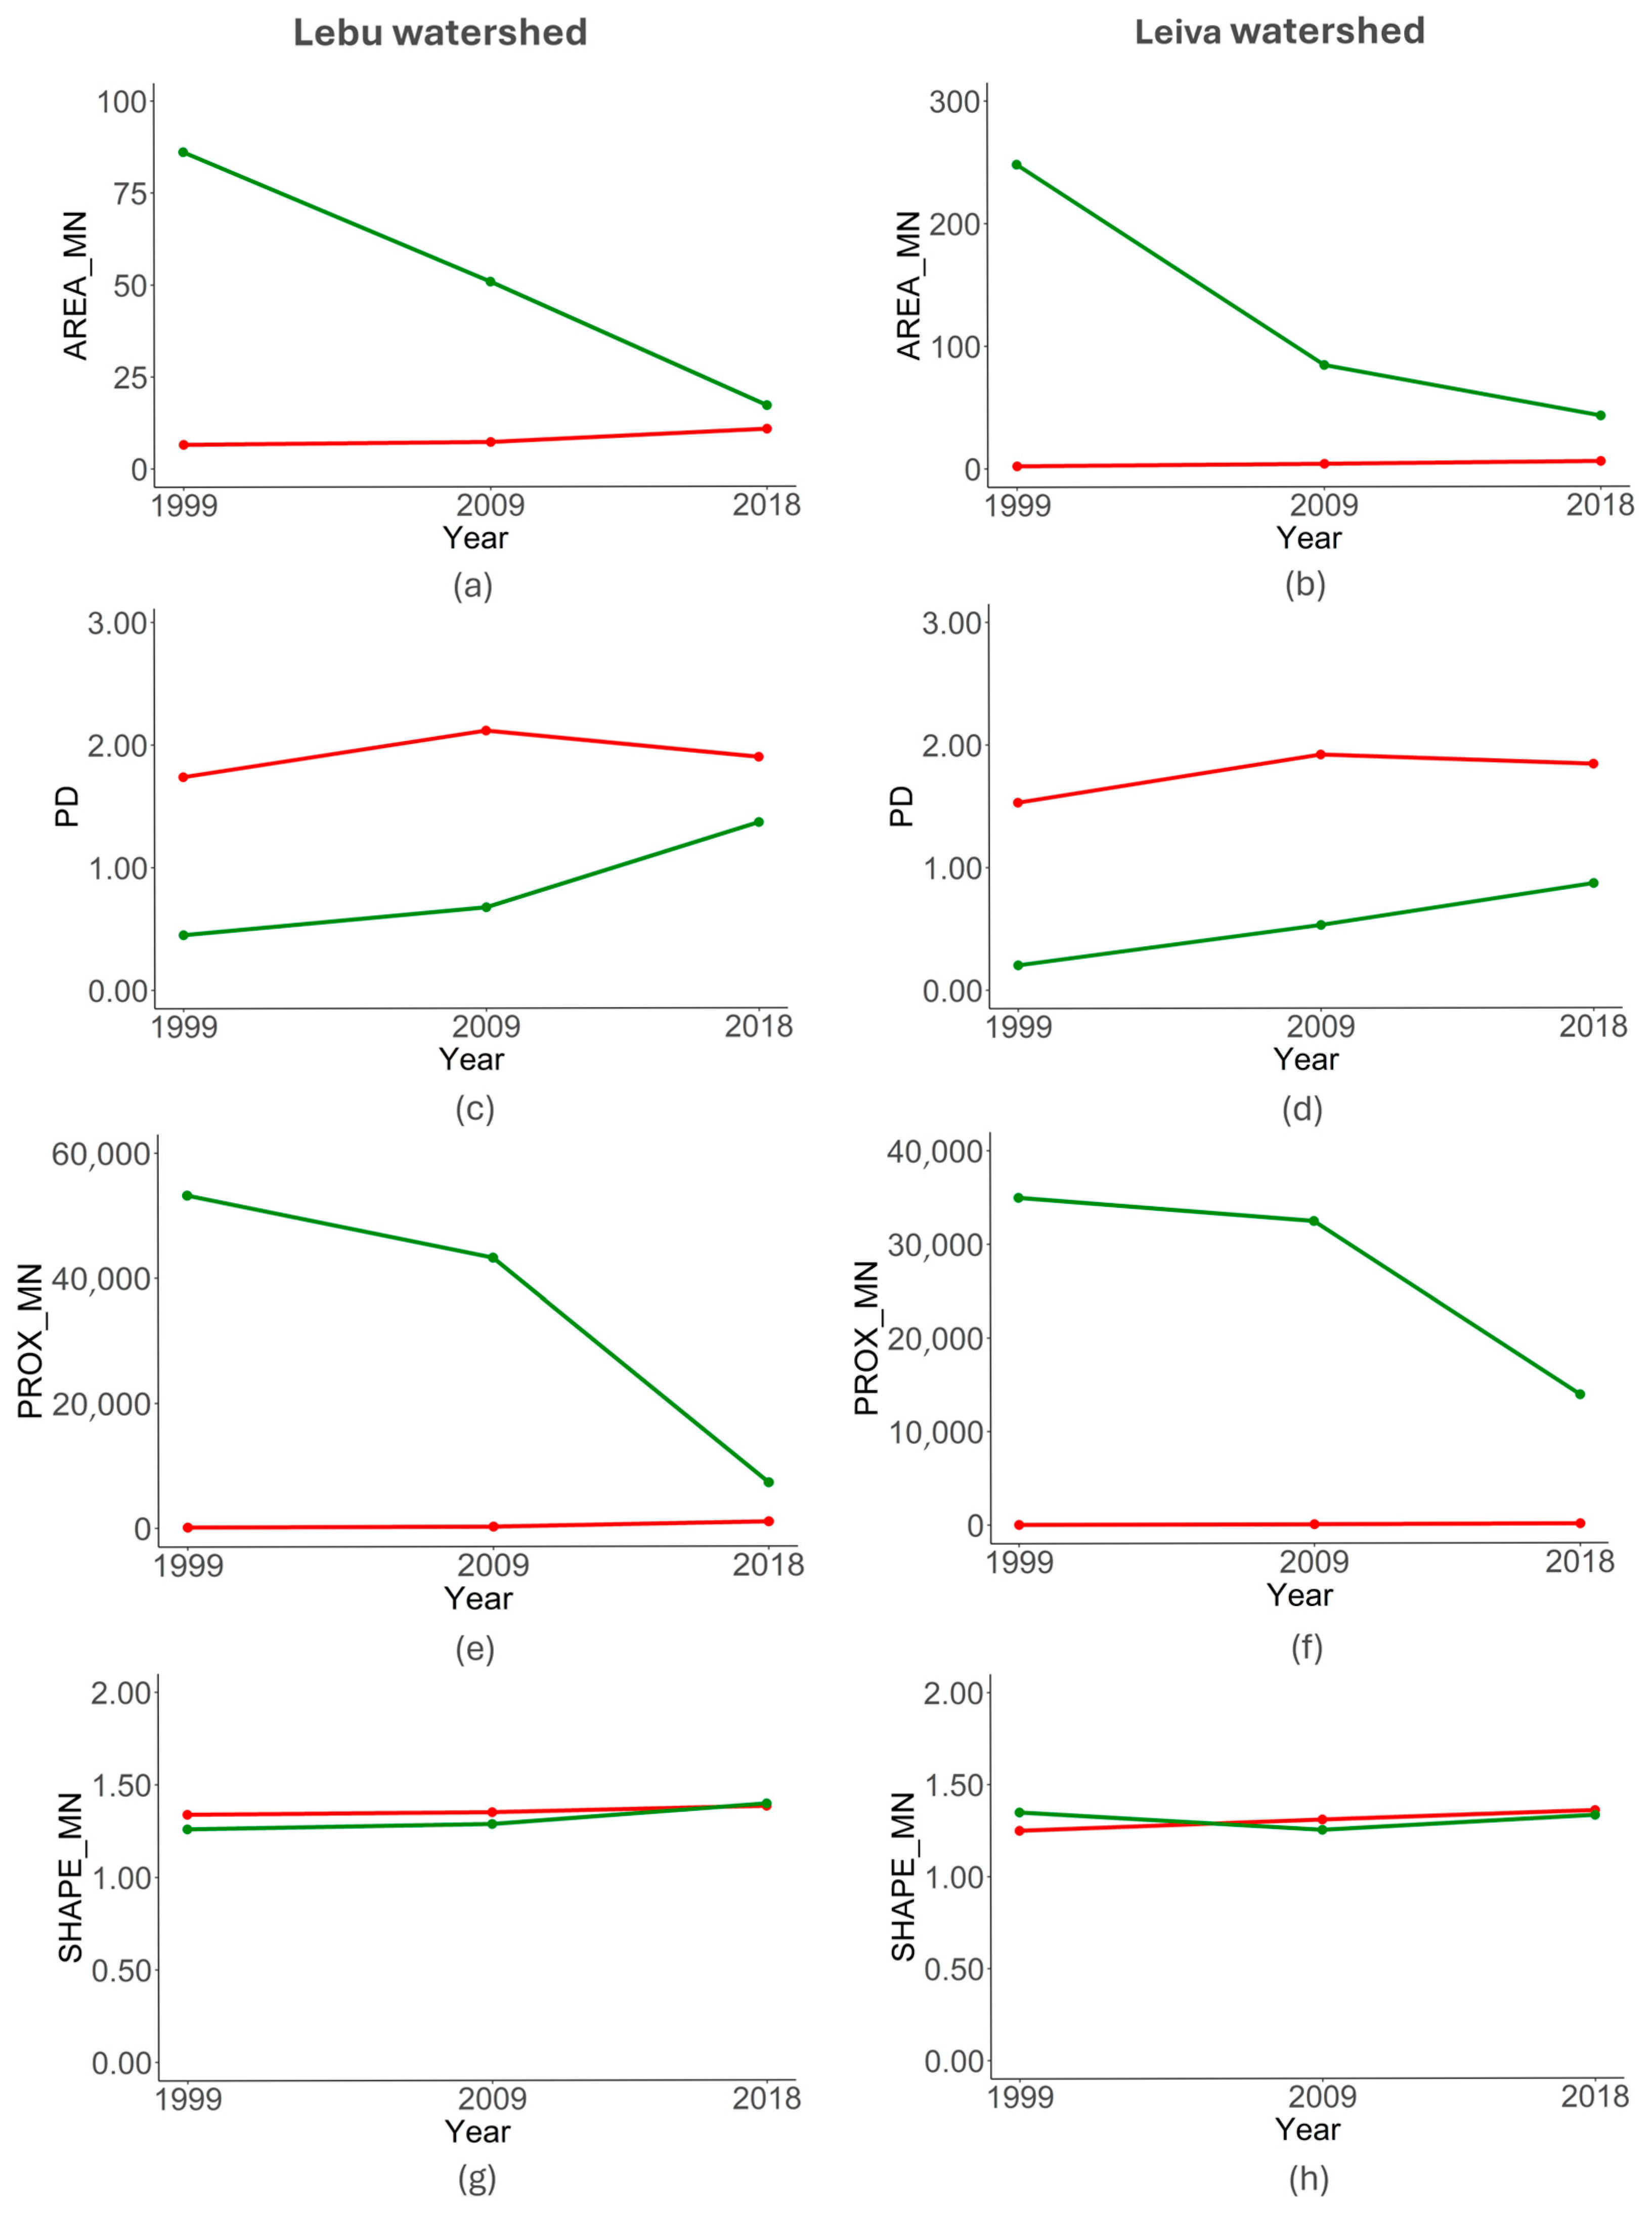
Regarding the class-level metrics, the temperate native forest exhibited a clear and progressive fragmentation trend in both watersheds, though with differing intensity (Figure 6). In Lebu, AREA_MN declined sharply from 86.1 ha in 1999 to 17.1 ha in 2018 (−80%), while PD increased from 0.5 to 1.4, and PROX_MN was considerably reduced from 53,215 to 7218 (−86%). These metrics reflect the emergence of a more fragmented landscape, with numerous small and isolated remnants. Additionally, the increase in SHAPE_MN from 1.3 to 1.4 suggests that patch boundaries became more irregular over time.
In Leiva, although a similar trajectory was observed, the process was less abrupt. AREA_MN decreased from 248.2 ha to 42.8 ha (−83%), PD rose from 0.2 to 0.9, and PROX_MN declined from 34,968 to 13,875 (−60%). In contrast to Lebu, the SHAPE_MN remained constant at 1.3, indicating that fragmentation affected size and connectivity but not shape complexity. These results confirm that native forest cover in both watersheds has undergone structural degradation; however, fragmentation was more spatially concentrated and intense in Lebu, while in Leiva it followed a more dispersed and gradual pattern.
In contrast, exotic forest plantations showed a consistent trend of expansion and spatial consolidation. In Lebu, AREA_MN increased from 6.6 ha to 10.7 ha (+62%), and PROX_MN increased sharply from 136 to 980 (+621%), indicating the formation of larger, spatially connected plantation blocks. Additionally, PD remained relatively stable (1.7–2.1–1.9), and the SHAPE_MN rose slightly, reflecting the adaptation of plantation geometry to the terrain.
In Leiva, AREA_MN increased from 2.2 ha to 5.7 ha (+159%), and PROX_MN from 16 to 92 (+475%), confirming the consolidation trend, although at a more incipient stage than in Lebu. Here, PD exhibited minor variation, and SHAPE_MN followed a similar gradual increase (1.2 to 1.4), indicating increased contour complexity over time. This pattern suggests that while both watersheds experienced similar plantation expansion, Lebu shows a more advanced and cohesive consolidation. At the same time, Leiva reflects an earlier or more fragmented phase of the same process.
Taken together, these class-level metrics show a dual dynamic of landscape change: a process of intensified fragmentation and isolation of temperate native forest, especially in Lebu, and a simultaneous consolidation of exotic forest plantations, more developed in Lebu and emerging in Leiva. These contrasting trends have reshaped the spatial configuration of both watersheds in structurally and functionally divergent ways.

4. Discussion

Considering the high ecological value of regions such as the south-central zone of Chile, it is essential to critically analyse the observed patterns of landscape fragmentation and transformation, as well as their ecological implications.
Based on the results obtained, the main trends in the spatial configuration of the territory, the factors driving land cover changes, and the consequences these processes generate for ecological connectivity and the provision of ecosystem services are discussed, particularly in ecological transition zones subject to intensive anthropogenic pressures. This discussion seeks to contribute to a more integrated understanding of landscape dynamics, aiming to guide more sustainable conservation and territorial management strategies. In this context, the continued reduction of native vegetation represents a direct threat to biodiversity, causing habitat loss for key species such as pollinators and altering the ecological balance at the local and regional levels [10]. Consequently, several ecosystem services could also be affected by the native forest substitution, such as water cycle regulation [39], soil erosion control [40], pollination [41], natural pest control [42], nutrient cycling [43], and cultural and recreational values [44], among others.
The results obtained reveal a sustained process of transformation of the forest landscape in the Lebu and Leiva watersheds, characterised by the progressive replacement of the temperate native forest by exotic forest plantations, in a pattern that coincides with that documented by various studies in the south-central zone of Chile [31,36,45]. As described by Miranda et al. [14], this dynamic has intensified since the 1990s, when plantation expansion began to dominate large areas of the landscape, contributing not only to the loss of native cover but also to increasing structural and functional homogenisation. Studies such as that by Uribe et al. [31], indicate that land use change is related to the offer of subsidies and economic incentives and the lack of appreciation of native forests and their ecosystem services in the social perception of some sectors, so these analyses regain importance for improving evidence-based environmental management and planning.
The magnitude and speed of change identified in this study, with losses of temperate native forest reaching 30% of the surface area in Lebu and 23% in Leiva, are within the ranges reported by Altamirano et al. [46], who estimated average annual losses rounding 13,000 ha in the Nahuelbuta hotspot, associated with both conversion to scrubland and direct replacement by tree monocultures. This reduction is of particular concern considering that the temperate forests of southern Chile represent relict ecosystems with high levels of endemism and critical ecosystem functions [47]. In addition to anthropogenic pressures, the impacts of climate change, particularly rising temperatures and altered precipitation regimes, have further intensified the vulnerability of temperate forest ecosystems in southern Chile. The south-central zone of Chile has experienced a consistent decreasing precipitation trend since the late 1970s, with a notable megadrought from 2010 to 2021 [48]. These changes threaten forest resilience, alter hydrological cycles, and increase the frequency of extreme climatic events such as droughts and wildfires, which may amplify the degradation processes already in motion [2,9,48]. The evidence is consistent with the model described by Miranda et al. [45], where the landscapes of the Coastal Mountain Range are experiencing a transition from heterogeneous matrices of native forest and agricultural use to landscapes dominated by homogeneous plantations of Pinus radiata and Eucalyptus spp., a phenomenon observed in the gain and persistence maps presented in Figure 4.
From an ecological perspective, the detected fragmentation patterns (decreasing average patch size, increasing density, and reducing proximity) reinforce the interpretation that these processes contribute to the weakening of structural connectivity and the loss of key ecosystem functions, as warned by Fahrig [1,49] and Salvatierra et al. [50]. This scenario is consistent with the notion of “functional homogenization” described by Riva et al. [51], where the replacement of native mosaics by simplified productive matrices entails risks for the persistence of biodiversity and the resilience of the landscape to disturbances, in addition to intensifying erosion processes related to harvesting and management of forest plantations, which generate biophysical changes and sedimentation of water bodies [18]. Therefore, it is necessary to influence planning policies aimed at the recovery of native forests and habitat restoration, connectivity of native forest fragments, updating of priority sites for biodiversity conservation, and new protected areas to prevent future loss of species [31].
However, while some authors suggest that fragmented landscapes may retain some conservation value when they include small connected remnants [49], in this case, the spatial metrics, particularly the sharp decline in PROX_MN and the decrease in the AI, point to a scenario where fragmentation and cohesion loss have exceeded critical thresholds in large areas. The critical threshold was identified based on a sharp decline in landscape connectivity metrics, particularly PROX_MN, which dropped by 86% in Lebu and 60% in Leiva, accompanied by increased PD and reduced AI. These values represent a structural inflexion point in landscape configuration, associated with a substantial loss of ecological connectivity. This interpretation is consistent with studies conducted in Chile and Brazil, where similar fragmentation processes have resulted in smaller, more isolated native forest remnants and reduced ecological functionality [49,52].
This pattern is particularly relevant in Nahuelbuta, one of the areas globally prioritised as a biodiversity hotspot [17,47], where the replacement of native forests with plantations is recognised as a driver of deforestation and ecosystem degradation [36,45]. This reduction in native forest and its fragmentation affects the availability and use of habitat for various native species of carnivores (need for large areas and specialist habitats), amphibians (which depend on the connectivity between native forest, riparian vegetation, and water bodies), and birds, thus influencing impacts such as low genetic diversity and a high level of isolation, increasing sensitivity and risk of extinction [18].
The loss of temperate native forest observed in both watersheds, particularly in Lebu, reflects a broader pattern of structural landscape replacement driven by the expansion of exotic tree plantations, a phenomenon widely documented in southern Chile [14,18,46,53]. This process has promoted the fragmentation and spatial isolation of native forest remnants, especially in areas with high ecological sensitivity. Moreover, public afforestation subsidies such as Chile’s Decree Law 701 (DL701) have played a significant role in facilitating plantation expansion into native forests and shrublands, with negative consequences for biodiversity and carbon sequestration [53]. In line with recent findings [54,55], we propose that conservation strategies should focus on halting further fragmentation, ecologically restoring degraded buffer zones, and actively protecting the remaining fragments with the highest ecological value.
Although the increase in SIDI might be interpreted as a sign of greater structural diversity, its ecological meaning requires cautious interpretation. This index measures the probability that two randomly selected cells belong to different land cover classes; thus, it reflects both the number and relative proportion of classes in the landscape [37]. In this case, the increase in SIDI suggests a shift from a landscape dominated by native forest to a more heterogeneous matrix composed of native fragments, exotic plantations, and transitional land uses. However, this structural heterogeneity does not necessarily imply ecological improvement. Fragmentation processes and land cover transitions may increase apparent diversity metrics without enhancing ecological function, especially when monoculture plantations replace native ecosystems with limited biodiversity support [56,57,58]. Therefore, it is essential to interpret these results within a broader ecological framework that considers landscape functionality and long-term conservation priorities.
It is important to highlight that the expansion of exotic species is contributing to the decline of the araucaria tree. The Pewen (Araucaria araucana) is a relict conifer from the ancient Araucariaceae family, considered an actual living fossil. It inhabits the temperate forests of Chile and Argentina, a Global Biodiversity Hotspot, reaching up to 30 m in height and exceeding 1500 years of lifespan. It forms part of the upper canopy alongside Nothofagus spp. species, coexisting with human populations for at least 4000 years, who even facilitated its expansion during the Holocene [59]. Currently, the Pewen is classified as an endangered species due to climate change, fires, overgrazing, exotic species, and lack of regeneration. In addition to its ecological and botanical value, it holds profound cultural significance for the Mapuche-Pewenche community (people of the Pewen), who have historically inhabited the forests of this species [59,60].
The results obtained in this work corroborate the hypothesis of a territorial advance of plantations towards areas with lower altitude and intermediate accessibility, as described in the dynamics of land use saturation and migration towards new areas pointed out by Miranda et al. [14], as well as in studies by Uribe et al. [31], which indicate that the likelihood of land conversion to pine plantations was influenced by factors such as slope and native forest degradation leading to transformation into forest plantations, and with increased pressure towards southern Chile.
This process has generated a pattern of structural replacement that tends to replicate in Leiva the transformations previously recorded in Lebu and other areas of the coastal range [50,59]. This transformation pattern has been closely tied to land tenure and state incentive instruments. Forest plantations in the Nahuelbuta Mountain Range have been predominantly established on private lands, both by smallholders and large forestry companies, often supported by subsidies under DL701 [53,57,61]. Although the law formally excluded native forest conversion, weak enforcement enabled the replacement of native vegetation in several areas [62], thus facilitating the territorial expansion of monoculture plantations and driving rural land concentration.
It is worth noting that recent evidence confirms that the degradation trends identified in our analysis between 1999 and 2018 have persisted beyond that period. For example, Varela [63] assessed the Nahuelbuta landscape using land cover data updated through 2017 and concluded that the actual provision of key ecosystem services, including hydrological regulation, erosion control, and microclimate regulation, is currently severely constrained. These findings reinforce the ecological consequences associated with long-term forest loss and fragmentation in the region. Complementary data from Global Forest Watch [64] further indicate that between 2018 and 2024, 484 hectares of tree cover were lost in the Biobío Region and 356 hectares in the Araucanía Region, specifically within key biodiversity areas that overlap with the Nahuelbuta Mountain Range. Although these studies do not differentiate between forest types, the concentration of loss in ecologically sensitive zones supports the conclusion that land transformation processes remain active. This is further supported by recent land use studies [65], which document an ongoing decline of native forest in the Arauco–Malleco macrozone, driven by the expansion of forest plantations. Thus, evidence confirms that the landscape dynamics identified in our study represent not only a historical trend but also an ongoing threat to the ecological integrity of the Nahuelbuta biodiversity hotspot.
Together, these results underscore the urgency of designing territorial planning and conservation strategies tailored to the specific dynamics of each watershed and the context of the Nahuelbuta Mountain Range, to maintain the ecological resilience of the temperate forest remnants and their role as unique biodiversity refuges at the regional and global levels.

5. Conclusions

This study provides spatially explicit evidence of the magnitude and configuration of land use and cover change in the Lebu and Leiva watersheds of the Nahuelbuta Mountain Range between 1999 and 2018. The findings reveal a convergent process of temperate native forest loss and exotic forest plantation expansion, with distinct spatial patterns in each watershed. Fragmentation and homogenisation of native forest landscapes have intensified, particularly in the lower and middle zones, while the upper zones retain key native remnants.
These results contribute novel insights into the territorial dynamics of a geographically and ecologically unique area within the Chilean coastal range, highlighting critical transformations in a region characterised by high ecological value and floral endemism. The increasing vulnerability of native forest remnants underscores the urgency of implementing conservation strategies and territorial planning frameworks that prioritise ecological restoration, landscape connectivity, and ecosystem service preservation in the face of ongoing productive intensification and climate change.

Author Contributions

Conceptualisation, R.M.-R. and R.R.-R.; methodology, R.M.-R.; software, R.M.-R., R.R.-R. and I.D.-L.; validation, R.M.-R., R.R.-R. and N.J.A.; formal analysis, R.M.-R. and R.R.-R.; investigation, R.M.-R., R.R.-R., I.D.-L., N.J.A. and C.M.T.-N.; resources, R.M.-R.; data curation, R.M.-R., R.R.-R. and I.D.-L.; writing—original draft preparation, R.M.-R., R.R.-R. and N.J.A.; writing—review and editing, R.R.-R., I.D.-L., L.R.-L., N.J.A. and C.M.T.-N.; visualisation, R.M.-R., R.R.-R. and N.J.A.; supervision, L.R.-L. and N.J.A.; project administration, R.M.-R.; funding acquisition, R.M.-R. All authors have read and agreed to the published version of the manuscript.

Funding

This research was funded by Project ANID/Postdoctoral FONDECYT/3220382.

Institutional Review Board Statement

Not applicable.

Informed Consent Statement

Not applicable.

Data Availability Statement

The original contributions presented in this study are included in the article; further inquiries can be directed to the corresponding authors.

Acknowledgments

The authors sincerely thank the EULA Centre at the University of Concepción for hosting and supporting the development of the first year of the project in its facilities. We also express our gratitude to the Water Resources Observatory of La Araucanía (Kimün-Ko) at the Universidad de La Frontera for hosting the second year of the project. Authors also acknowledge the National Agency of Research and Development of Chile (ANID), especially Postdoctoral FONDECYT/3220382 and FONDEF/ID25I10570 projects.

Conflicts of Interest

The authors declare no conflicts of interest.

Appendix A

Table A1. Land use/cover and relative change in the Lebu and Leiva watersheds for the years 1990, 2009, and 2018.
Lebu Watershed
ClassLand Use/CoverRelative Changes (%)
1999200920181999–20092009–20181999–2018
(km2)(%)(km2)(%)(km2)(%)
Water bodies and channels0.890.140.790.120.930.14−0.010.020.01
Temperate native forest481.3273.38424.7464.75289.3444.11−8.63−20.64−29.27
Exotic forest plantations141.7321.61189.5128.89246.9837.657.288.7616.05
Fruit trees0.090.010.100.014.570.700.000.680.68
Riparian vegetation and wetlands0.150.020.260.040.520.080.020.040.06
Shrub and bush vegetation9.851.5022.923.4981.3812.411.998.9110.91
Grasslands, pastures and annual crops16.012.4410.601.6215.482.36−0.820.74−0.08
Meadows and evergreen grasslands1.020.160.950.150.830.13−0.01−0.02−0.03
Bare soil and non-vegetated areas1.160.181.280.207.281.110.020.910.93
Impermeable surfaces3.730.574.770.738.581.310.160.580.74
Leiva Watershed
ClassLand Use/CoverRelative Changes (%)
1999200920181999–20092009–20181999–2018
(km2)(%)(km2)(%)(km2)(%)
Water bodies and channels0.050.010.130.030.100.030.02−0.010.01
Temperate native forest325.1183.68287.5674.01239.5261.65−9.67−12.37−22.03
Exotic forest plantations21.985.6646.9012.0767.7917.456.415.3811.79
Fruit trees0.020.010.010.000.140.040.000.030.03
Riparian vegetation and wetlands0.030.010.110.030.520.130.020.110.13
Shrub and bush vegetation7.131.8320.175.1952.2913.463.368.2711.62
Grasslands, pastures and annual crops28.097.2327.227.0024.186.22−0.23−0.78−1.01
Meadows and evergreen grasslands5.931.535.401.391.330.34−0.14−1.05−1.18
Bare soil and non-vegetated areas0.050.010.690.181.870.480.160.300.47
Impermeable surfaces0.130.030.320.080.760.200.050.110.16

References

  1. Fahrig, L. Effects of Habitat Fragmentation on Biodiversity. Annu. Rev. Ecol. Evol. Syst. 2003, 34, 487–515. [Google Scholar] [CrossRef]
  2. Martínez-Retureta, R.; Aguayo, M.; Abreu, N.J.; Stehr, A.; Duran-Llacer, I.; Rodríguez-López, L.; Sauvage, S.; Sánchez-Pérez, J.M. Estimation of the Climate Change Impact on the Hydrological Balance in Basins of South-Central Chile. Water 2021, 13, 794. [Google Scholar] [CrossRef]
  3. Hernández-Sosa, M.; Aguayo, M.; Hurtado, J.; Llompart, O. The Response of the Water Cycle to Landscape Configuration and Composition in Two Chilean Basins. Environ. Sustain. Indic. 2025, 26, 100629. [Google Scholar] [CrossRef]
  4. Pineda, A.C. Caracterización y Análisis Multitemporal de La Dinámica Territorial de Transformación de La Estructura Ecológica Principal En La Región de La Laguna de Fúquene y Su Relación Con Los Instrumentos de Ordenamiento Territorial; Pontificia Universidad Javeriana: Colombia, CO, USA, 2021. [Google Scholar]
  5. Lisón, F.; Matus-Olivares, C.; Troncoso, E.; Catalán, G.; Jiménez-Franco, M.V. Effect of Forest Landscapes Composition and Configuration on Bird Community and Its Functional Traits in a Hotspot of Biodiversity of Chile. J. Nat. Conserv. 2022, 68, 126227. [Google Scholar] [CrossRef]
  6. Martínez-Retureta, R.; Aguayo, M.; Stehr, A.; Sauvage, S.; Echeverría, C.; Sánchez-Pérez, J.M. Effect of Land Use/Cover Change on the Hydrological Response of a Southern Center Basin of Chile. Water 2020, 12, 302. [Google Scholar] [CrossRef]
  7. Rodríguez-López, L.; Fuentes-Aguilera, P.; Bravo Alvarez, L.; Martínez-Retureta, R.; Duran-Llacer, I.; Bourrel, L.; Frappart, F.; Urrutia, R. Spatio-Temporal Dynamics of the Lanalhue Lake Basin in South-Central Chile. Water 2025, 17, 1114. [Google Scholar] [CrossRef]
  8. Hansen, M.C.; Potapov, P.V.; Moore, R.; Hancher, M.; Turubanova, S.A.; Tyukavina, A.; Thau, D.; Stehman, S.V.; Goetz, S.J.; Loveland, T.R.; et al. High-Resolution Global Maps of 21st-Century Forest Cover Change. Science 2013, 342, 850–853. [Google Scholar] [CrossRef]
  9. Martínez-Retureta, R.; Aguayo, M.; Abreu, N.J.; Urrutia, R.; Echeverría, C.; Lagos, O.; Rodríguez-López, L.; Duran-Llacer, I.; Barra, R.O. Influence of Climate and Land Cover/Use Change on Water Balance: An Approach to Individual and Combined Effects. Water 2022, 14, 2304. [Google Scholar] [CrossRef]
  10. Duran-Llacer, I.; Salazar, A.A.; Mondaca, P.; Rodríguez-López, L.; Martínez-Retureta, R.; Zambrano, F.; Llanos, F.; Frappart, F. Influence of Avocado Plantations as Driver of Land Use and Land Cover Change in Chile’s Aconcagua Basin. Land 2025, 14, 750. [Google Scholar] [CrossRef]
  11. Gutiérrez, J.; Altamirano, A.; Pauchard, A.; Meli, P. Proximity to Forest Plantations Is Associated with Presence and Abundance of Invasive Plants in Landscapes of South-Central Chile. NeoBiota 2024, 92, 129–153. [Google Scholar] [CrossRef]
  12. Altamirano, A.; Lara, A. Deforestación En Ecosistemas Templados de La Precordillera Andina Del Centro-Sur de Chile Deforestation in Temperate Ecosystems of Pre-Andean Range of South-Central Chile. Bosque 2010, 31, 53–64. [Google Scholar] [CrossRef]
  13. McFadden, T.N.; Dirzo, R. Opening the Silvicultural Toolbox: A New Framework for Conserving Biodiversity in Chilean Timber Plantations. For. Ecol. Manag. 2018, 425, 75–84. [Google Scholar] [CrossRef]
  14. Miranda, A.; Altamirano, A.; Cayuela, L.; Lara, A.; González, M. Native Forest Loss in the Chilean Biodiversity Hotspot: Revealing the Evidence. Reg. Environ. Change 2017, 17, 285–297. [Google Scholar] [CrossRef]
  15. Kjær, E.D.; Lobo, A.; Myking, T. The Role of Exotic Tree Species in Nordic Forestry. Scand. J. Res. 2014, 29, 323–332. [Google Scholar] [CrossRef]
  16. Lara, A.; Veblen, T.T. Forest Plantations in Chile: A successful model? In Afforestation: Policies, Planning and Progress; Mather, A., Ed.; Belhaber Press: London, UK, 1993; pp. 118–139. [Google Scholar]
  17. Wolodarsky-Franke, A.; Díaz Herrera, S. Cordillera de Nahuelbuta; Reserva Mundial de Biodiversidad WWF Chile: Valdivia, Chile, 2011. [Google Scholar]
  18. Otavo, S.; Echeverría, C. Progressive Fragmentation and Loss of Natural Forest Habitat in One of the World’s Biodiversity Hotspots. Sustain. For. 2021, 4, 25. [Google Scholar] [CrossRef]
  19. Castillo, E.J.; Ojeda, C.G.; Robles, R.F. Landscape Fragmentation at Arauco Province in the Chilean Forestry Model Context (1976–2016). Land 2022, 11, 1992. [Google Scholar] [CrossRef]
  20. el Jeitany, J.; Nussbaum, M.; Pacetti, T.; Schröder, B.; Caporali, E. Landscape Metrics as Predictors of Water-Related Ecosystem Services: Insights from Hydrological Modeling and Data-Based Approaches Applied on the Arno River Basin, Italy. Sci. Total Environ. 2024, 954, 176567. [Google Scholar] [CrossRef]
  21. Zabihi, M.; Mostafazadeh, R.; Sedaghati, I. Analyzing the Spatial Patterns and Changes in Urban Green Spaces of an under Rapid Urbanization Area through Landscape Metrics. Adv. Space Res. 2025, 76, 2779–2794. [Google Scholar] [CrossRef]
  22. Li, S.H.; Lin, W. A Hybrid Landscape Metric-Enhanced Cellular Automata Model (LE-CA) for Land Use/Land Cover Change Simulation: An Application to Coastal Wetlands. Ecol. Modell. 2025, 508, 111209. [Google Scholar] [CrossRef]
  23. Pereira, C.O.; Escanilla-Minchel, R.; González, A.C.; Alcayaga, H.; Aguayo, M.; Arias, M.A.; Flores, A.N. Assessment of Future Land Use/Land Cover Scenarios on the Hydrology of a Coastal Basin in South-Central Chile. Sustainability 2022, 14, 16363. [Google Scholar] [CrossRef]
  24. Kupfer, J.A. Landscape Ecology and Biogeography: Rethinking Landscape Metrics in a Post-FRAGSTATS Landscape. Prog. Phys. Geogr. 2012, 36, 400–420. [Google Scholar] [CrossRef]
  25. Matte, A.L.L.; Müller, S.C.; Becker, F.G. Forest Expansion or Fragmentation? Discriminating Forest Fragments from Natural Forest Patches through Patch Structure and Spatial Context Metrics. Austral Ecol. 2015, 40, 21–31. [Google Scholar] [CrossRef]
  26. Massmann, A.K.; Minder, J.R.; Garreaud, R.D.; Kingsmill, D.E.; Valenzuela, R.A.; Montecinos, A.; Fults, S.L.; Snider, J.R. The Chilean Coastal Orographic Precipitation Experiment: Observing the Influence of Microphysical Rain Regimes on Coastal Orographic Precipitation. J. Hydrometeorol. 2017, 18, 2723–2743. [Google Scholar] [CrossRef]
  27. Garreaud, R.; Falvey, M.; Montecinos, A. Orographic Precipitation in Coastal Southern Chile: Mean Distribution, Temporal Variability, and Linear Contribution. J. Hydrometeorol. 2016, 17, 1185–1202. [Google Scholar] [CrossRef]
  28. Peel, M.C.; Finlayson, B.L.; McMahon, T.A. Updated World Map of the Köppen-Geiger Climate Classification. Hydrol. Earth Syst. Sci. 2007, 11, 1633–1644. [Google Scholar] [CrossRef]
  29. Luebert, F.; Pliscoff, P. Sinopsis Bioclimática y Vegetacional de Chile; Editorial Universitaria, S.A.: Santiago, Chile, 2017; ISBN 9789561125759. [Google Scholar]
  30. Pliscoff Varas, P. Aplicación de Los Criterios de La Unión Internacional Para La de La Naturaleza (IUCN) Para La Evaluación de Riesgo de Los Ecosistemas Terrestres de Chile; Informe Técnico Elaborado Por Patricio Pliscoff Para El Ministerio Del Medio Ambiente: Santiago, Chile, 2015. [Google Scholar]
  31. Uribe, S.V.; Estades, C.F.; Radeloff, V.C. Pine Plantations and Five Decades of Land Use Change in Central Chile. PLoS ONE 2020, 15, e0230193. [Google Scholar] [CrossRef]
  32. Figueroa-Silva, E.; León-Aravena, J. Vocación Productiva y Realidad Productiva Territorial: El Caso de La Provincia de Arauco, Chile, 2021. Población Desarro. 2023, 29, 31–44. [Google Scholar] [CrossRef]
  33. Galleguillos, M.; Ceballos-Comisso, A.; Gimeno, F.; Zambrano-Bigiarini, M. CLDynamicLandCover; Zenodo: Geneva, Switzerland, 2024. [Google Scholar] [CrossRef]
  34. Schmidt, M. The Sankey Diagram in Energy and Material Flow Management-Part II: Methodology and Current Applications. J. Ind. Ecol. 2008, 12, 173–185. [Google Scholar] [CrossRef]
  35. Aplin, P.; Smith, G. Introduction to Object-Based Landscape Analysis. Int. J. Geogr. Inf. Sci. 2011, 25, 869–875. [Google Scholar] [CrossRef]
  36. Altamirano, A.; Aplin, P.; Miranda, A.; Cayuela, L.; Algar, A.C.; Field, R. High Rates of Forest Loss and Turnover Obscured by Classical Landscape Measures. Appl. Geogr. 2013, 40, 199–211. [Google Scholar] [CrossRef]
  37. Ning, F.; Wang, H.; Chien, Y.C.; Pan, H.; Ou, S.J. A Study on the Spatial and Temporal Dynamics of Landscape Spatial Patterns of Different Types of Rural Communities in Taiwan. Ecol. Indic. 2023, 157, 111227. [Google Scholar] [CrossRef]
  38. Polo-Akpisso, A.; Wala, K.; Soulemane, O.; Folega, F.; Akpagana, K.; Tano, Y. Assessment of Habitat Change Processes within the Oti-Keran-Mandouri Network of Protected Areas in Togo (West Africa) from 1987 to 2013 Using Decision Tree Analysis. Sci 2020, 2, 1. [Google Scholar] [CrossRef]
  39. Alvarez-Garreton, C.; Lara, A.; Boisier, J.P.; Galleguillos, M. The Impacts of Native Forests and Forest Plantations on Water Supply in Chile. Forests 2019, 10, 473. [Google Scholar] [CrossRef]
  40. Contreras, A.; Álvarez-Amado, F.; Aguilar-Gomez, M.; Campos-Quiroz, D.; Castillo, P.; Tardani, D.; Poblete-González, C.; Cortés-Aranda, J.; Godfrey, L.; Orellana-Silva, N. Land-Use Impacts on Soil Erosion: Geochemical Insights from an Urban Drinking Catchment, South-Central Chile. Water 2024, 16, 3246. [Google Scholar] [CrossRef]
  41. Ulyshen, M.D.; Ballare, K.M.; Fettig, C.J.; Rivers, J.W.; Runyon, J.B. The Value of Forests to Pollinating Insects Varies with Forest Structure, Composition, and Age. Curr. For. Rep. 2024, 10, 322–336. [Google Scholar] [CrossRef]
  42. Gazzea, E.; Battisti, A.; Marini, L. Strategies and Barriers to Reconcile Pest Management with Insect Conservation in Temperate and Boreal Forests. Curr. For. Rep. 2024, 10, 103–118. [Google Scholar] [CrossRef]
  43. Aburto, F.; Crovo, O.; Albornoz, M.F.; Southard, R. Effects of Native Forest Replacement to Exotic Plantations on Forest C, N, and P Pools and Dynamics in South-Central Chile. In Proceedings of the EGU General Assembly 2021, Online, 19–30 April 2021. [Google Scholar]
  44. Carte, L.; Hofflinger, Á.; Polk, M.H. Expanding Exotic Forest Plantations and Declining Rural Populations in La Araucanía, Chile. Land 2021, 10, 283. [Google Scholar] [CrossRef]
  45. Miranda, A.; Altamirano, A.; Cayuela, L.; Pincheira, F.; Lara, A. Different Times, Same Story: Native Forest Loss and Landscape Homogenization in Three Physiographical Areas of South-Central of Chile. Appl. Geogr. 2015, 60, 20–28. [Google Scholar] [CrossRef]
  46. Altamirano, A.; Miranda, A.; Aplin, P.; Carrasco, J.; Catalán, G.; Cayuela, L.; Fuentes-Castillo, T.; Hernández, A.; Martínez-Harms, M.J.; Peluso, F.; et al. Natural Forests Loss and Tree Plantations: Large-Scale Tree Cover Loss Differentiation in a Threatened Biodiversity Hotspot. Environ. Res. Lett. 2020, 15, 124055. [Google Scholar] [CrossRef]
  47. Armesto, J.J.; Rozzi, R.; Caspersen, J. Temperate Forests of North and South America. In Global Biodiversity in a Changing Environment: Scenarios for the 21st Century; Chapin, F.S., Sala, O.E., Huber-Sannwald, E., Eds.; Springer: New York, NY, USA, 2001; pp. 223–249. ISBN 978-1-4613-0157-8. [Google Scholar]
  48. Carrasco-Escaff, T.; Garreaud, R.; Bozkurt, D.; Jacques-Coper, M.; Pauchard, A. The Key Role of Extreme Weather and Climate Change in the Occurrence of Exceptional Fire Seasons in South-Central Chile. Weather. Clim. Extremes 2024, 45, 100716. [Google Scholar] [CrossRef]
  49. Fahrig, L. Patch-Scale Edge Effects Do Not Indicate Landscape-Scale Fragmentation Effects. Conserv. Lett. 2024, 17, e12992. [Google Scholar] [CrossRef]
  50. Salvatierra, D.; González, M.P.; Blasco, J.; Krull, M.; Araújo, C.V.M. Habitat Loss and Discontinuity as Drivers of Habitat Fragmentation: The Role of Contamination and Connectivity of Habitats. Environ. Res. 2025, 266, 120609. [Google Scholar] [CrossRef]
  51. Riva, F.; Koper, N.; Fahrig, L. Overcoming Confusion and Stigma in Habitat Fragmentation Research. Biol. Rev. 2024, 99, 1411–1424. [Google Scholar] [CrossRef]
  52. Rosa, M.R.; Brancalion, P.H.S.; Crouzeilles, R.; Tambosi, L.R.; Piffer, P.R.; Lenti, F.E.B.; Hirota, M.; Santiami, E.; Metzger, J.P. Hidden Destruction of Older Forests Threatens Brazil’s Atlantic Forest and Challenges Restoration Programs. Sci. Adv. 2021, 7, eabc4547. [Google Scholar] [CrossRef]
  53. Heilmayr, R.; Echeverría, C.; Lambin, E.F. Impacts of Chilean Forest Subsidies on Forest Cover, Carbon and Biodiversity. Nat. Sustain. 2020, 3, 701–709. [Google Scholar] [CrossRef]
  54. Roco, L.; Grebe, J.; Rosales, P.; Bravo, C. Identifying the Determinants of the Increase in Native Forests in Southern Chile. Forests 2023, 14, 1926. [Google Scholar] [CrossRef]
  55. Manuschevich, D.; Sarricolea, P.; Galleguillos, M. Integrating Socio-Ecological Dynamics into Land Use Policy Outcomes: A Spatial Scenario Approach for Native Forest Conservation in South-Central Chile. Land Use Policy 2019, 84, 31–42. [Google Scholar] [CrossRef]
  56. Nagendra, H. Opposite Trends in Response for the Shannon and Simpson Indices of Landscape Diversity. Appl. Geogr. 2002, 22, 175–186. [Google Scholar] [CrossRef]
  57. Fuentealba, A.; Duran, L.; Morales, N.S. The Impact of Forest Science in Chile: History, Contribution, and Challenges. Can. J. For. Res. 2021, 51, 753–765. [Google Scholar] [CrossRef]
  58. Bremer, L.L.; Farley, K.A. Does Plantation Forestry Restore Biodiversity or Create Green Deserts? A Synthesis of the Effects of Land-Use Transitions on Plant Species Richness. Biodivers Conserv. 2010, 19, 3893–3915. [Google Scholar] [CrossRef]
  59. Tomás Ibarra, J.; Cortés, J.; Petitpas, R.; Barreau, A.; Caviedes, J.; Orrego, G.; Riquelme-Maulén, W.; Altamirano, T.A. Volverse Árbol, Reconstruir La Memoria: Redes Bioculturales En Los Bosques de Pewen (Araucaria Araucana) Del Sur de Los Andes Becoming Tree, Reconstructing Memory: Biocultural Networks in Pewen (Araucaria Araucana) Landscapes of the Southern Andes. Rev. Geogr. Norte Gd. 2024, 88, 1–88. [Google Scholar] [CrossRef]
  60. Donoso, S.; Peña-Rojas, K.; Espinoza, C.; Badaracco, C.; Santelices-Moya, R.; Cabrera-Ariza, A. Reproductive Patterns in Araucaria Araucana Forests in the Andean Range, Chile. Ecol. Process. 2024, 13, 19. [Google Scholar] [CrossRef]
  61. Fabiola, B. Modernización Forestal y Percepción Medio Ambiental: Nacimiento y La Empresa INFORSA 1975-2005. Ph.D. Thesis, Universidad de Chile, Santiago, Chile, 2007. [Google Scholar]
  62. Echeverría, C.; Newton, A.C.; Lara, A.; Benayas, J.M.R.; Coomes, D.A. Impacts of Forest Fragmentation on Species Composition and Forest Structure in the Temperate Landscape of Southern Chile. Global Ecol. Biogeogr. 2007, 16, 426–439. [Google Scholar] [CrossRef]
  63. Varela, C. Evaluación Integrada de Servicios Ecosistémicos En La Cordillera de Nahuelbuta. Identificación de Oportunidades de Restauración. Master’s Thesis, Universidad de Concepción, Concepción, Chile, 2024. [Google Scholar]
  64. Institute World Resources Global Forest Watch. Available online: https://www.globalforestwatch.org/ (accessed on 11 August 2025).
  65. Fuenzalida, M.; Portales, F. Evolución Del Modelo de Producción Forestal de Monocultivo En Arauco-Malleco Para El Periodo 2001–2021. Anu. Del Confl. Soc. 2024. [Google Scholar] [CrossRef]
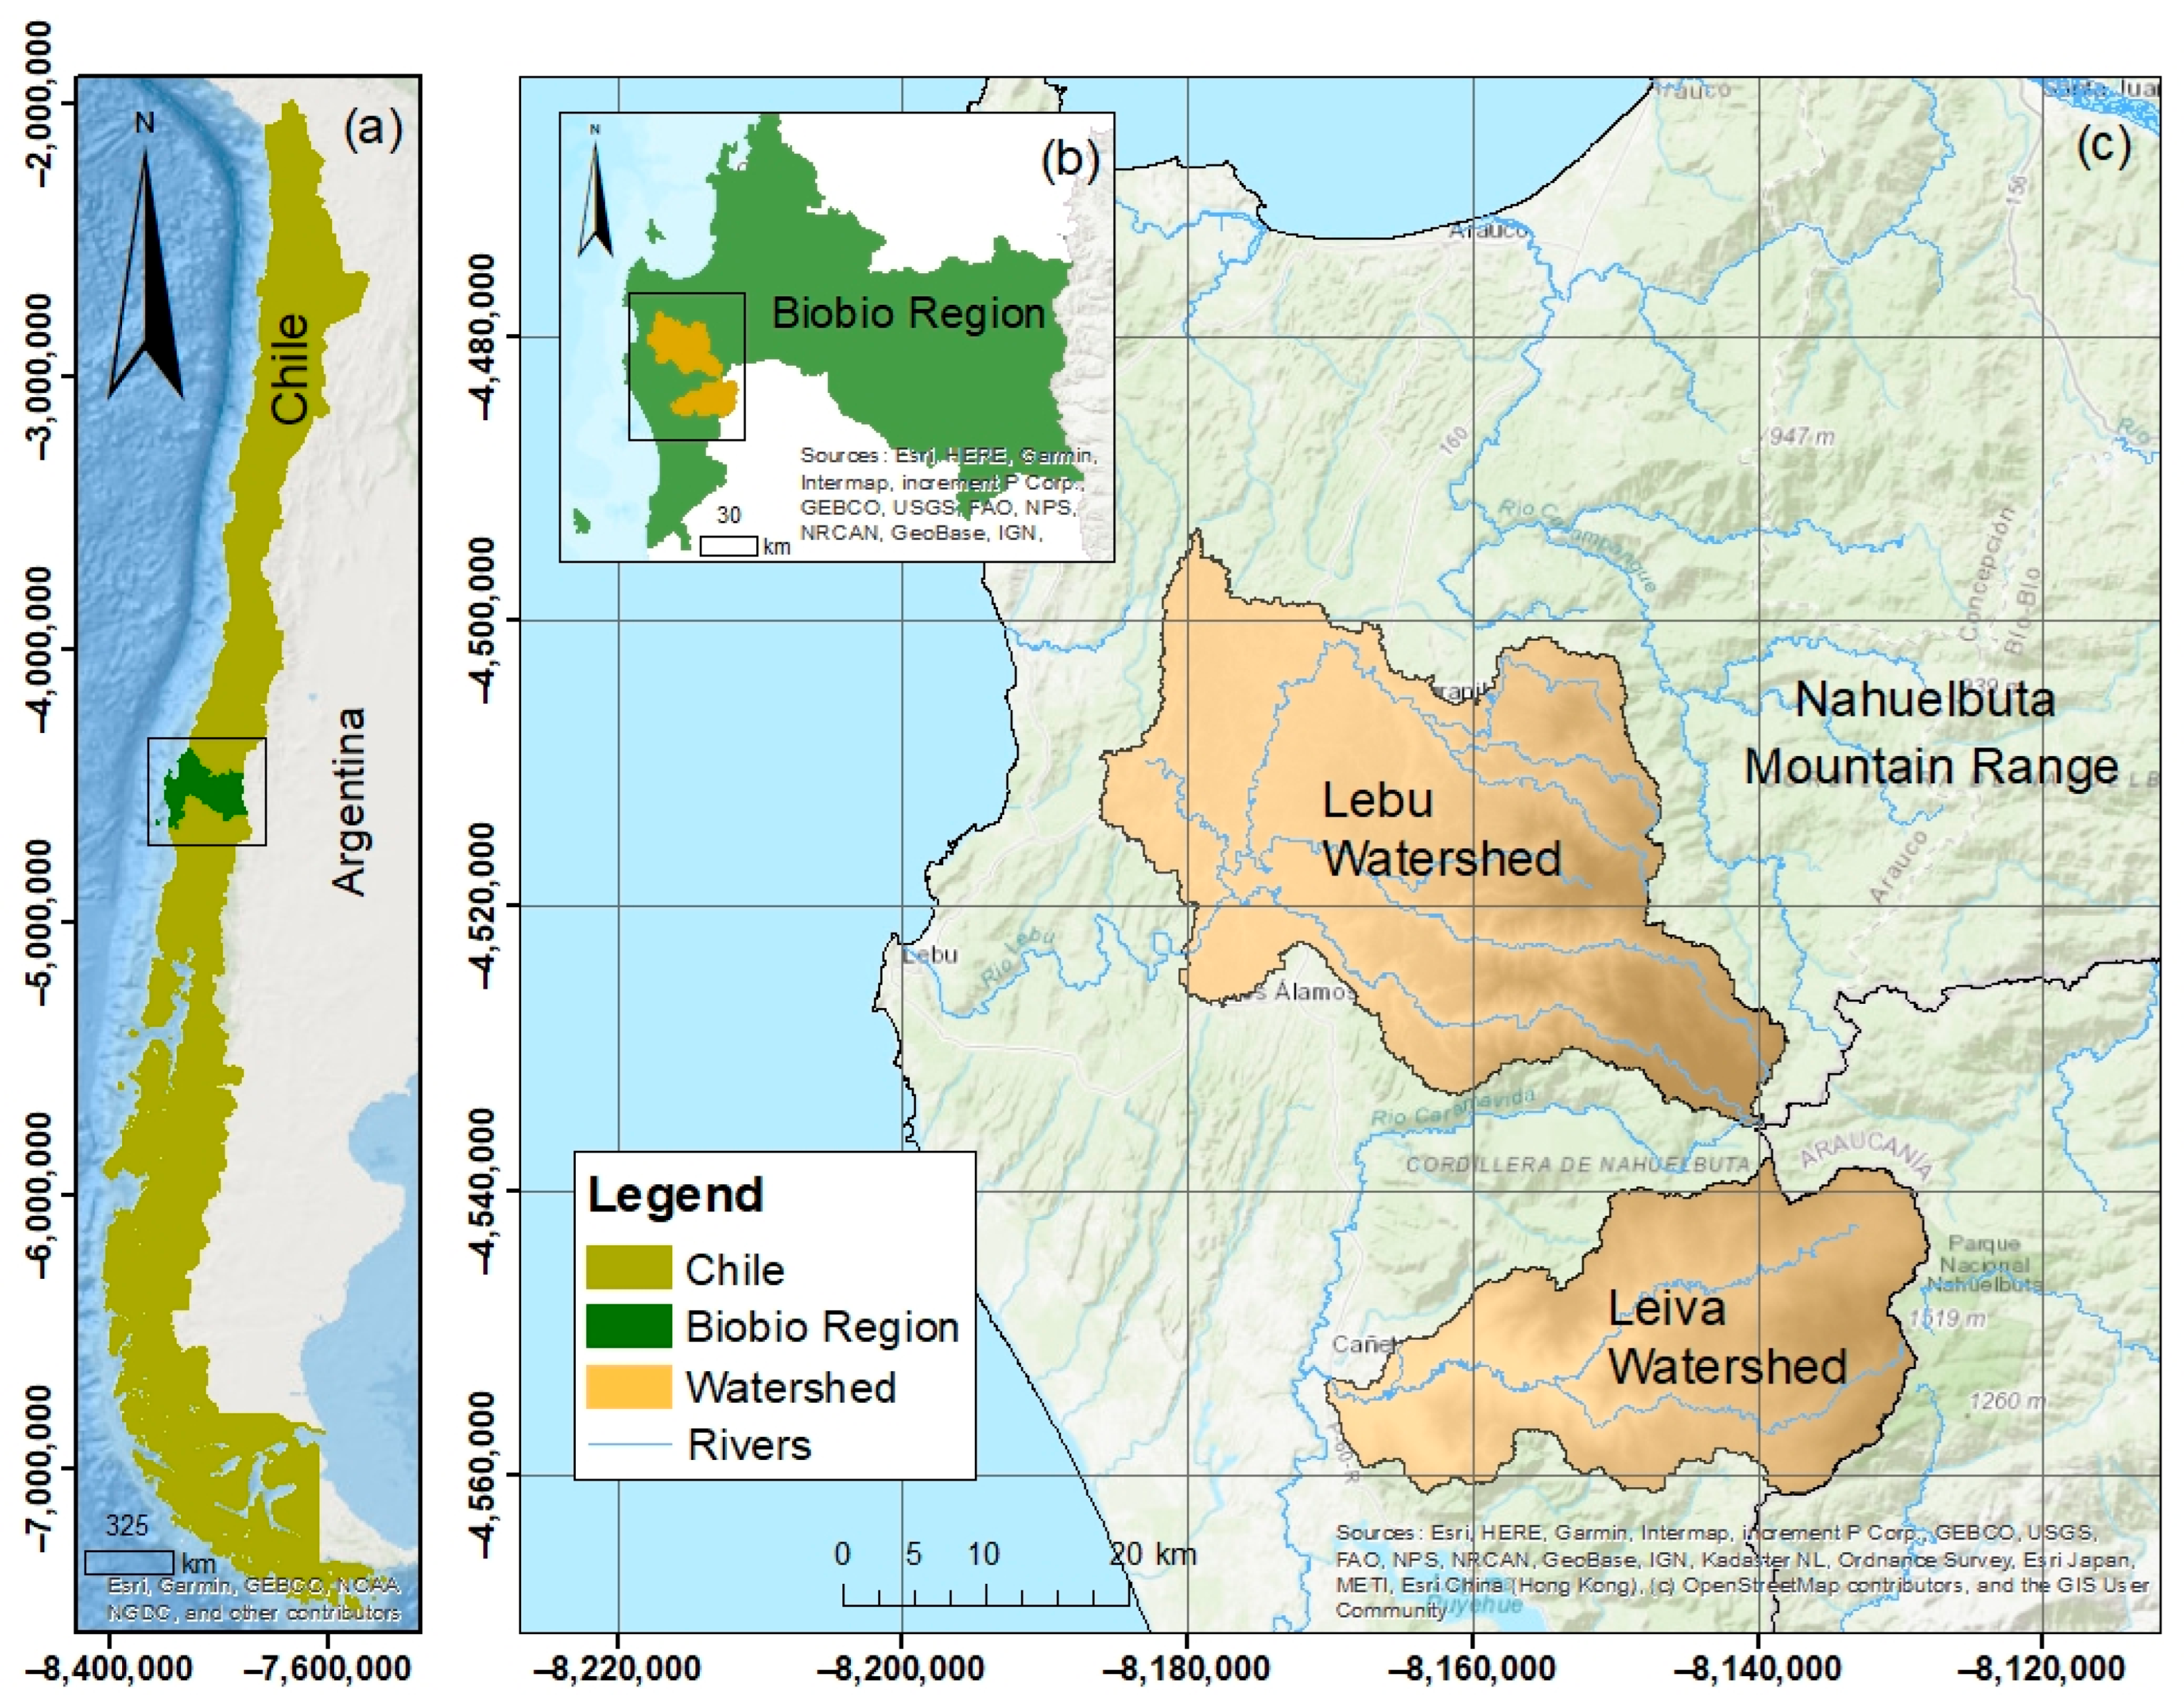
Figure 1. Geographic location map of the study area: (a) continental Chile, (b) Biobio Region, (c) Lebu and Leiva river watersheds.
Land 14 01648 g001
Figure 2. Sankey diagram representing the land use/cover transition in (a) the Lebu and (b) Leiva river watersheds between 1999, 2009, and 2018.
Land 14 01648 g002
Figure 3. Spatial evolution of land use/cover in the Lebu (upper) and Leiva (lower) coastal watersheds for the years: (a,d) 1999, (b,e) 2009, and (c,f) 2018.
Land 14 01648 g003
Figure 4. Spatial distribution of gains, losses, and persistence in temperate native forest and exotic plantations between 1999 and 2018 in (a,b) the Lebu watershed and (c,d) the Leiva watershed.
Land 14 01648 g004
Figure 5. Landscape-level metrics for the Lebu and Leiva river watersheds in the years 1999, 2009, and 2018. (a) Simpson Diversity Index and (b) Aggregation Index.
Land 14 01648 g005
Figure 6. Landscape metrics at the class level: (a,b) average patch size, (c,d) patch density, (e,f) mean proximity index, and (g,h) average shape index for the Lebu (left) and Leiva (right) watersheds in the years 1999, 2009, and 2018. Native forest (green) and exotic forest plantations (red).
Land 14 01648 g006
Table 1. Contributions * to net land cover change (1999–2018) by class in the Lebu and Leiva watersheds.
Temperate Native ForestForest Plantations of Exotic Species
ClassLebu
(km2)
Leiva
(km2)
Lebu
(km2)
Leiva
(km2)
Water bodies and channels−0.110−0.040
Beaches dunes and sandbanks0000
Mediterranean sclerophyll native forest0−0.0200
Temperate native forest00123.1248.99
Forest plantations of exotic species−123.12−48.9900
Fruit trees−1.55−0.02−2.39−0.01
Riparian vegetation and wetlands−0.08−0.01−0.06−0.01
Shrub and bush vegetation−57.76−34.09−10.92−4.41
Grasslands, pastures, and annual crops−3.67−0.97−1.150.91
Meadows and evergreen grasslands−0.470.090.150.57
Bare soil and non-vegetated areas−4.41−1.56−1.59−0.19
Impermeable surfaces−0.81−0.03−1.85−0.05
Net change−191.98−85.60105.2745.80
* Negative values indicate losses from a given class; positive values indicate gains or contributions to that class. Net changes are the sum of the contributions.
Table 2. Losses, gains, and net change * in land cover area (1999–2018) by class in the Lebu and Leiva watersheds.
Lebu WatershedLeiva Watershed
ClassLosses (km2)Gains (km2)Net Change (km2)Losses (km2)Gains (km2)Net Change
(km2)
Water bodies and channels−0.550.590.04−0.040.090.05
Beaches, dunes, and sandbanks−0.010.070.060.000.030.03
Temperate native forest−198.726.74−191.98−88.883.29−85.60
Forest plantations of exotic species−27.22132.47105.26−6.8352.6445.81
Fruit trees−0.084.564.48−0.020.140.11
Riparian vegetation and wetlands−0.120.490.37−0.030.520.49
Shrub and bush vegetation−5.8877.4271.53−2.0447.2045.16
Grasslands, pastures, and annual crops−9.929.39−0.53−6.312.40−3.91
Meadows and evergreen grasslands−0.940.74−0.20−5.400.80−4.60
Bare soil and non-vegetated areas−0.616.746.13−0.041.861.82
Impermeable surfaces−0.024.864.840.000.630.63
* Calculated by comparing land cover at the start and end of the study period. Positive net values indicate overall expansion; negative values indicate contraction of that land cover type.
Disclaimer/Publisher’s Note: The statements, opinions and data contained in all publications are solely those of the individual author(s) and contributor(s) and not of MDPI and/or the editor(s). MDPI and/or the editor(s) disclaim responsibility for any injury to people or property resulting from any ideas, methods, instructions or products referred to in the content.