Article

Socio-Ecological Outcomes of Forest Landscape Mutations in the Congo Basin: Learning from Cameroon

by
Pontien Kuma Nyongo
1,2 and
Jude Ndzifon Kimengsi
2,3,*
1
Centre for International Postgraduate Studies of Environmental Management (CIPSEM), Technische Universität Dresden, Zellescher Weg 41c, 01217 Dresden, Germany
2
Forest Institutions and International Development Research Group, Technische Universität Dresden, Cotta-Bau, Pienner Str. 7, 01737 Tharandt, Germany
3
Department of Geography, The University of Bamenda, Bambili P.O. Box 39, Cameroon
*
Author to whom correspondence should be addressed.
Land 2025, 14(8), 1644; https://doi.org/10.3390/land14081644
Submission received: 8 July 2025 / Revised: 11 August 2025 / Accepted: 12 August 2025 / Published: 14 August 2025
(This article belongs to the Special Issue Ecology of the Landscape Capital and Urban Capital)

Abstract

Globally, the mutations around forest landscapes continue to draw significant scientific interest, despite fragmented evidence on the socio-ecological outcomes linked to this process. This knowledge gap is evident in the Congo Basin—one of the world’s major ecosystems. To contribute towards addressing the knowledge gap, this study analyzed two decades of forest landscape mutations and the socio-ecological transformation-cum-outcomes linked to the process in Cameroon. A mixed-methods approach was employed, combining remote sensing-based land use/land cover (LULC) analysis (using multi-date Landsat imagery at 30 m resolution) with household surveys involving 100 randomly selected forest-dependent households across three forest blocks: Ebo, Ndokbou, and Makombé for ground truthing. Survey data were analyzed using descriptive statistics and combined spatial analysis to reveal the following. Firstly, forest cover has significantly increased within the 20-year period; this involved a 104.01% increase between 2004 and 2014, and an additional 47.27% between 2014 and 2024. In that vein, agricultural land declined by more than 20%, whereas settlement and water bodies increased by 226.4% and 376.2%, respectively. Secondly, forest landscape mutations in the Yabassi Forest Area were primarily driven by a convergence of social (notably population growth at 57% and livelihood diversification), economic (agricultural expansion and timber exploitation), political (tenure ambiguity and development-driven land conversion), and environmental (climate variability at 36% and ecological restoration efforts) forces. These interwoven drivers shaped the land use change process, revealing how the human-environment feedback defines landscape trajectories in complex and non-linear ways. Thirdly, while the ecological outcomes of forest mutations were largely positive—with significant gains in forest cover, the social outcomes were skewed towards the negative. Communities experienced both improvements in livelihoods and infrastructure (66%), but also faced land conflicts (67%), the loss of traditional access (69%), and resource-based insecurity. By applying the socio-ecological systems (SES) framework, this study provides novel insights on how governance, ecological processes, and human behavior co-evolve in forest landscapes. The findings do not only edify the SES framework but also challenge the mainstream position about forest decline by highlighting areas of recovery. The evidence informs adaptive forest governance processes in the Congo Basin and similar contexts. Further research should investigate the institutional and adaptive mechanisms that influence these dynamics across the Congo Basin.

1. Introduction

Forest ecosystems worldwide are undergoing profound transformations driven by a complex interplay of anthropogenic pressures and environmental changes. At the heart of these transformations are forest management institutions (FMIs), which play a pivotal role in mediating the access, use and conservation of forest resources. The functionality, design, and enforcement capacities of these institutions remain central themes in academic discourse as scholars seek to unravel the dynamics that underpin compliance and sustainability in forest governance systems [1,2,3]. Expanding global comparative research remains vital to enhance our understanding of how FMIs are formulated and how they respond to socio-ecological challenges [4].
A key concern within this context is forest landscape mutation. This term encapsulates the long-term transformation of forested areas through substantial land use, ecological structures and land cover changes. These shifts, primarily triggered by logging, agricultural expansion, mining, infrastructural development and climate change, undermine forest integrity and ecosystem service functions [5,6,7]. Globally, forest degradation and deforestation is alarming; recent data reveals an unsettling reversal in conservation gains. In 2023, 6.37 million hectares of forest was cleared. This renders the target to halt global deforestation by 2030 quite daunting [7]. With carbon emissions from deforestation reaching 3.8 billion metric tons of CO2 equivalent and more than 62 million hectares of ecological downgraded, forest mutation now constitutes a global ecological emergency.
Agricultural expansion remains the foremost driver of forest change worldwide. In the Congo Basin, which has the second-highest forest cover after the Amazon, more than 90% of deforestation is attributed to land conversion for agricultural purposes [8]. Although similar processes occur in Latin America and Southeast Asia, Africa is considered as the region with the highest net forest loss globally, averaging 3.94 million hectares annually between 2010 and 2020 [9]. In sub-Saharan Africa (SSA), small-scale agriculture for domestic markets, along with informal logging and mining, exacerbates forest fragmentation and ecological degradation [10,11].
The outcomes of forest landscape mutations in SSA are intimately linked to structural governance deficits that affect the ecological change process and limit community adaptation. According to [9], we experienced the highest net forest loss globally between 2010 and 2020. This intensified soil erosion, leading to an increase in water insecurity and degradation of ecosystems that are crucial for livelihoods and climatic moderation. Beyond biophysical degradation, these transformations jeopardize progress towards attaining global environmental commitments. Ref. [12] argues that unchecked forest mutations across SSA derail efforts to meet climate mitigation goals and biodiversity conservation targets, particularly under frameworks such as the REDD+ and the Aichi Targets.
In another dimension, the negative socio-ecological impacts of forest landscape mutations are not uniform. A growing body of research highlights the role of local resilience and community innovations in adapting to and mitigating landscape disruptions. For instance, Ref. [13] documents how communities under secured forest tenureship engage in ecologically beneficial practices such as agroforestry, selective harvesting, and community reforestation. These adaptive responses underscore the fact that outcomes do not hinge solely on environmental issues but equally manifest through institutional arrangements. When governance systems are locally embedded, participatory, and responsive, they can act as buffers against the adverse impacts of forest degradation. Nonetheless, persistent challenges such as institutional fragmentation, overlapping jurisdictions, and elite capture continue to weaken governance capacity [13]. These obstacles dilute accountability and limit the effectiveness of community-based interventions. Therefore, understanding the interplay between governance quality and forest mutation outcomes is essential for designing regionally tailored, equity-oriented forest conservation strategies in the Congo Basin, with Cameroon being a classical example.
Cameroon exemplifies the tensions between the conservation of forest landscapes and socio-economic development, with forests covering approximately 42% of its territory [6]. Smallholder farming, illegal logging, and artisanal mining have led to an annual forest loss of 1.3% between 2010 and 2020 [6,7]. The Yabassi forest, part of the ecologically significant Ebo Forest landscape, has witnessed accelerated degradation as exemplified by is significant natural forest cover decline [14]. Cameroon’s 1994 Forestry Law introduced progressive mechanisms such as Community Forest Management (Section 37) and Logging Rights for Local Populations (Section 57), designed to align sustainable resource use with local development. Even the recent 2024 Forestry and Wildlife Law further emphasized these issues. Although these frameworks have shaped positive socio-ecological outcomes, challenges linked to weak enforcement, exclusionary regulations, and inequitable benefit sharing still exacerbate forest governance [15,16,17]. The above issues validate the need for context-specific evidence to uncover governance questions in the context of forest landscape mutations, with the Yabassi Forest Area being a valid case.
Questions on forest landscape mutations in the Yabassi Forest Area remain less understood with emphasis on its spatiotemporal dynamics and the socio-ecological transformation-cum-outcomes linked to the process. The evidence is useful in providing insights to edify the SES framework and challenges the mainstream position on forest decline by highlighting areas of recovery. The evidence also informs forest management policy with emphasis on adaptive forest governance processes in the Congo Basin and similar contexts.

2. Research Methods

2.1. Analytical Framework

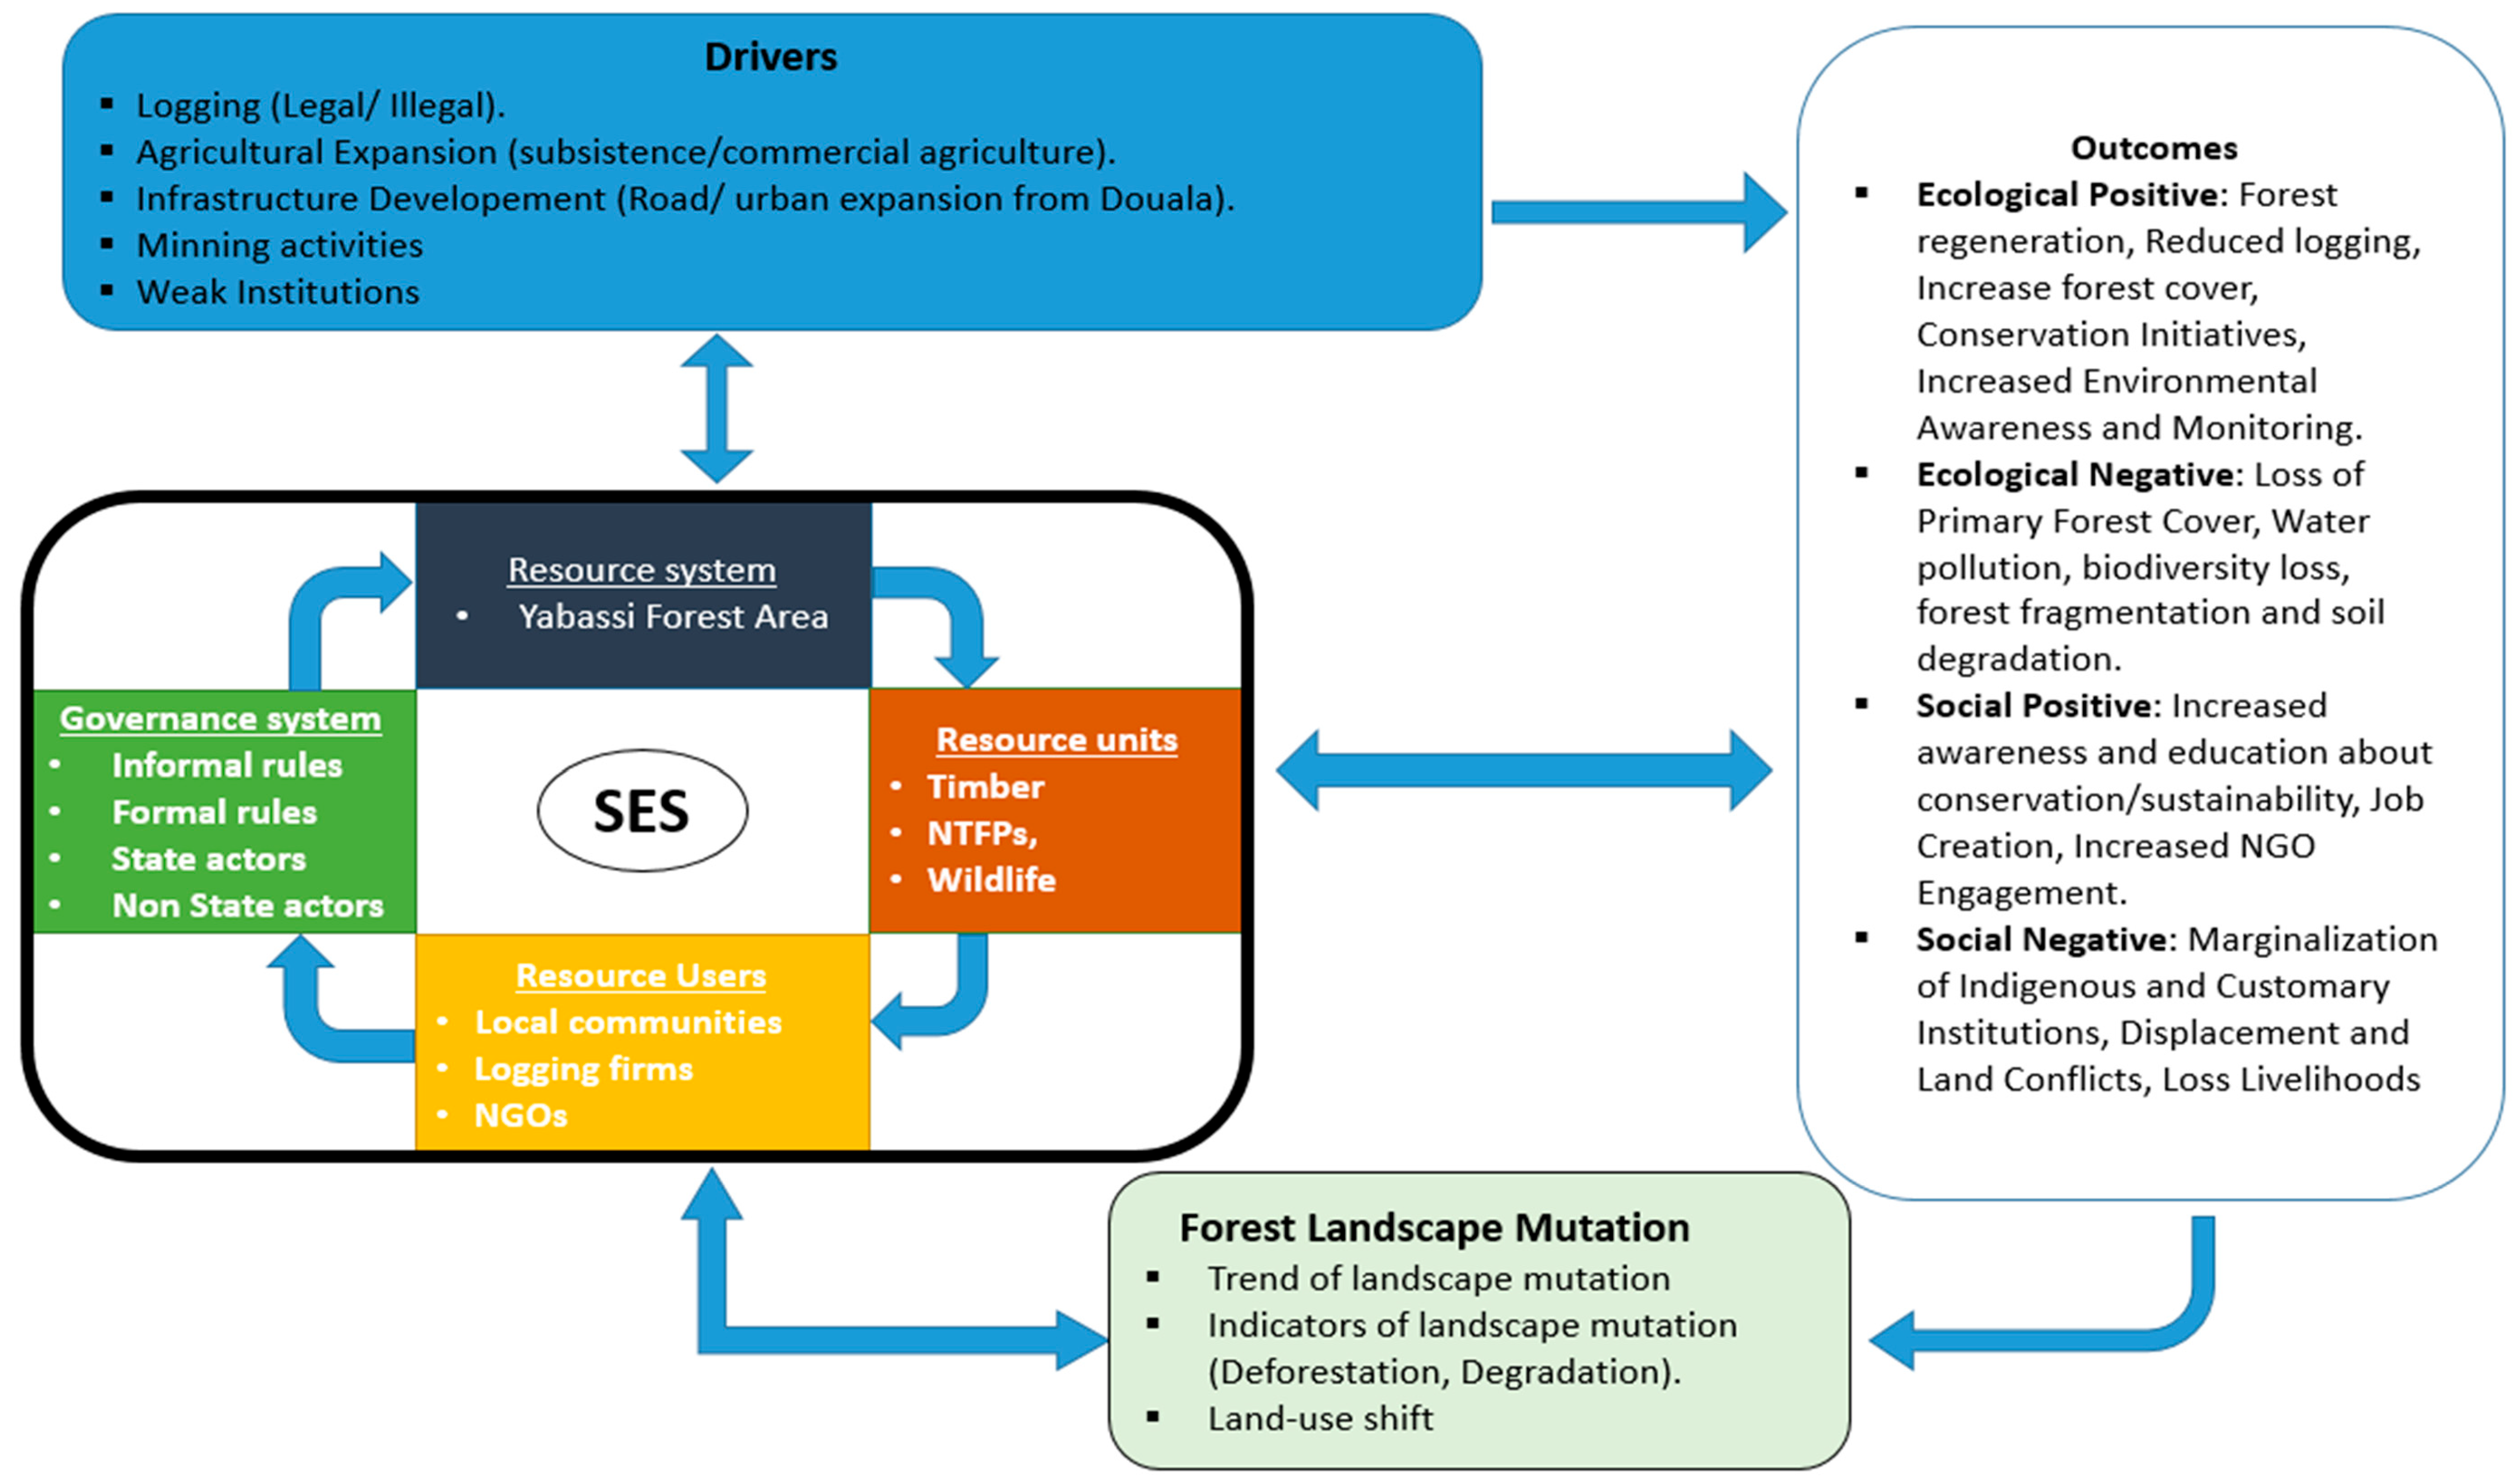
This study is grounded in the socio-ecological systems (SES) framework, which provides a holistic lens for analyzing the dynamic interactions between human and ecological subsystems [18]. The SES framework integrates ecological processes, resource use patterns, governance structures, and social behaviors into a single analytical structure. By adapting the SES framework to the context of the Yabassi Forest Area, the study conceptualizes forest landscape mutation not merely as physical land cover change but as a multi-scalar and multidimensional transformation shaped by interlinked ecological, socio-economic, institutional, and governance drivers.
The analytical model employed (Figure 1) maps the interplay between core components of the SES resource systems (forests), resource units (timber, NTFPs, biodiversity), actors (local communities, loggers, state agencies), and governance systems (formal forestry laws, customary norms, NGOs). This also captures both proximate and underlying drivers of landscape mutations. The drivers interact with biophysical feedback and institutional responses, resulting in distinct socio-ecological outcomes—both negative and positive.
The Yabassi Forest Area has experienced significant structural and functional shifts in land cover due to logging, agricultural encroachment, mining, and infrastructural development [19]. Forest cover declined by more than 30% between 1990 and 2020, with an estimated annual deforestation rate of 1.3% between 2010 and 2020, primarily in the southern and eastern zones adjacent to the Douala–Yabassi corridor [20,21,22]. These zones are marked by expanding road networks, illegal logging routes, and encroaching settlement frontiers.
The SES framework allows for a nuanced exploration of the drivers of forest landscape mutations, including:
  • Logging (legal and illegal): More than 60% of the residents perceive illegal logging as the dominant threat, driven by enforcement failures and corruption [23,24].
  • Agricultural expansion: Both subsistence and commercial farming (cassava, cocoa, oil palm) have led to a 45% increase in cultivated area, replacing vital forest cover in high-pressure zones [23].
  • Infrastructural development: Logging firms and urban sprawl from Douala have tripled the regional road network since 2000, facilitating deeper forest penetration [24].
  • Mining: Informal gold and gravel extraction led to river sedimentation, ecological fragmentation, and biodiversity loss, particularly affecting freshwater ecosystems [22].
  • Governance fragmentation: Weak institutional capacity, overlapping mandates, and elite capture reduce policy effectiveness and allow unsustainable land use practices to flourish [25].
The interactions yield varied socio-ecological outcomes. Some of the ecological outcomes include deforestation, biodiversity loss (e.g., Kupeantha yabassi, Louisea yabassi), soil erosion, and hydrological disruption [22,25,26]. However, secondary forest regeneration and increased conservation awareness are championed by NGO campaigns to counter these threats in zones with reduced disturbance. The social outcomes include livelihood disruption, cultural erosion (especially loss of access to sacred groves), gendered inequalities in resource access, and land use conflicts among stakeholders. The influx of labor migrants linked to extractive industries led to an increase in social fragmentation. However, some communities have benefited from short-term employment in logging and agriculture and have engaged in participatory governance through village forest management committees (VFMCs) and NGO partnerships (e.g., AJESH).
By embedding these dynamics within the SES framework, the study captures the non-linear, feedback-driven nature of forest landscape mutation in Yabassi. It emphasizes that the outcomes are not simply a product of environmental pressures but are fundamentally shaped by governance quality, actor interactions, and institutional adaptability. Thus, the framework provides an integrated platform for evaluating the resilience or vulnerability of forest landscapes, offering insights that can inform policy reform and community-led conservation strategies in the Congo Basin and similar contexts.

2.2. Study Area

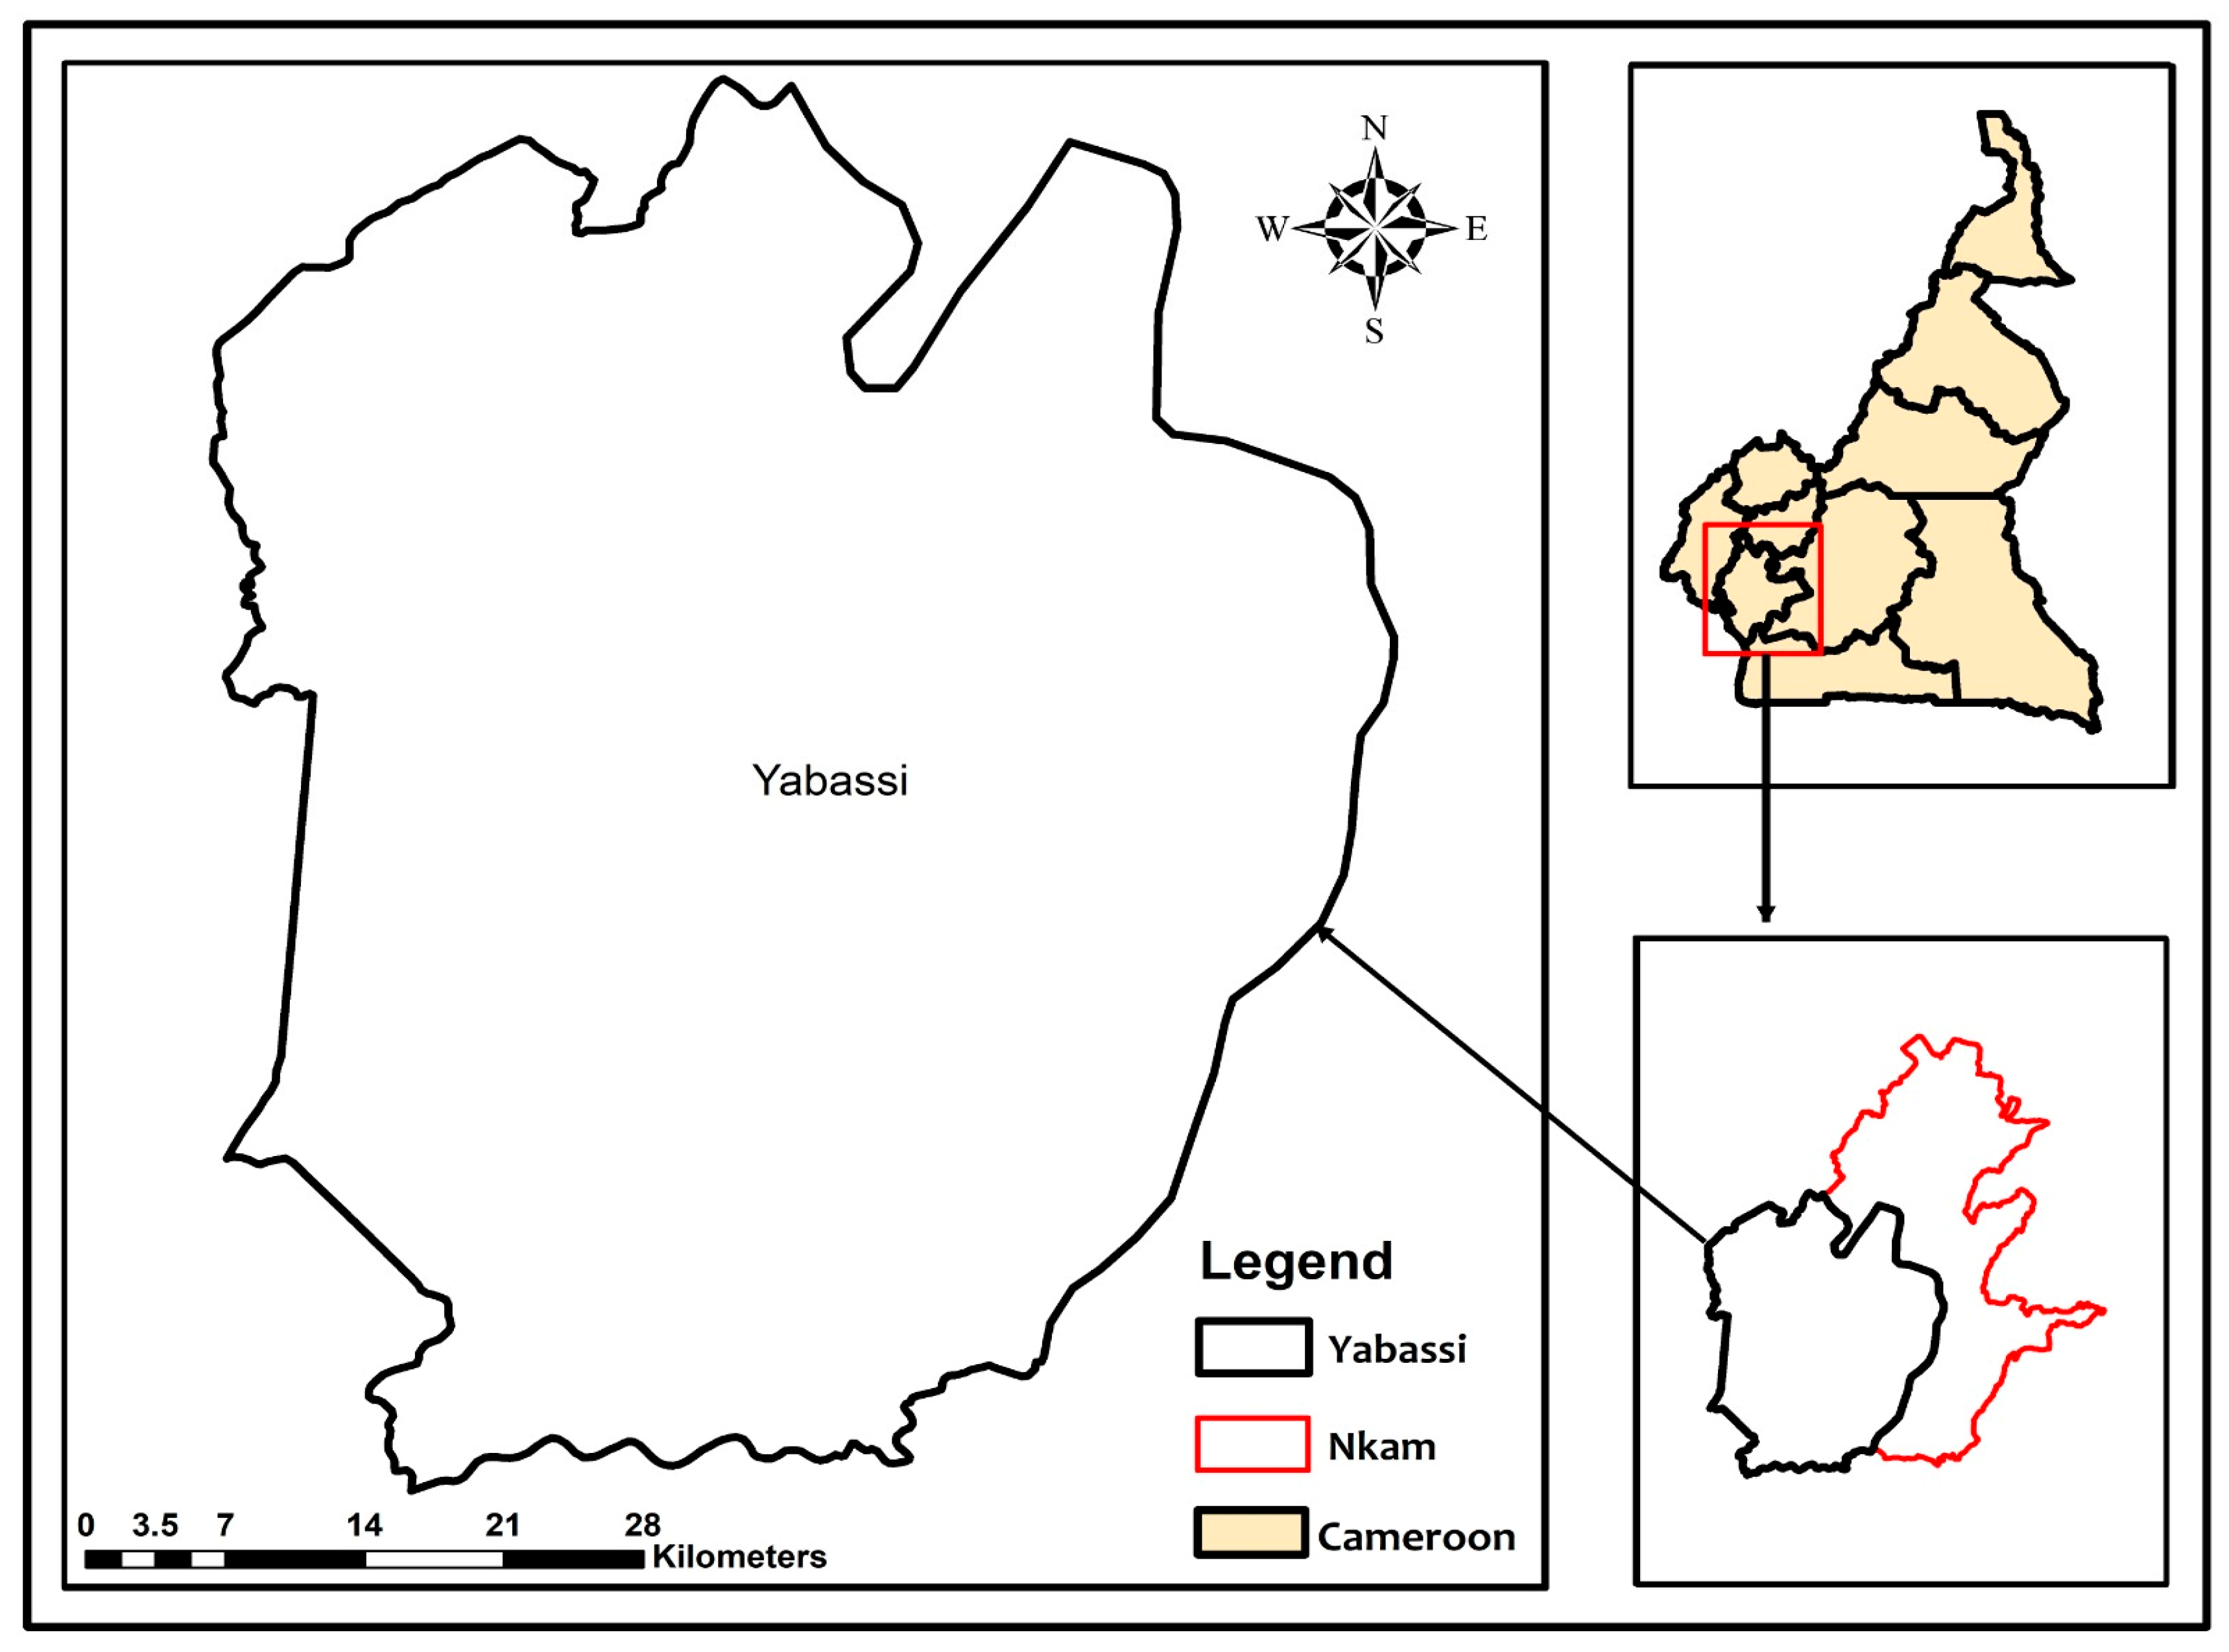
This study was conducted in the Yabassi Forest Area, a 300,000-hectare landscape located in Cameroon’s Littoral and Central Regions, specifically in the Nkam and Mbam Divisions (Figure 2). The area comprises three ecologically significant forest blocks: the Ebo Forest (141,700 ha), the Ndokbou Forest (100,000 ha), and the Makombe Forest (60,000 ha) [23]. As part of the Guineo–Congolian rainforest belt, the region is recognized as a Key Biodiversity Area, home to more than 310 bird species and several endangered mammals, including the western gorilla (Gorilla gorilla), chimpanzee (Pan troglodytes), drill monkey (Mandrillus leucophaeus), and forest elephant (Loxodonta africana) [22,25]. The forests span an altitudinal gradient of 9 to 1304 m and are characterized by high rainfall and a mosaic of microhabitats. Despite its ecological value, the region faces growing development pressure, though conservation victories such as suspending a proposed logging concession in Ebo Forest in 2020 have highlighted its strategic importance [27]. The forest landscape is bordered by more than 40 communities, including indigenous Banen populations, whose livelihoods are based primarily on subsistence agriculture. As of 2018, the area had a population of 17,127. Poor infrastructure and limited road access have contributed to the area’s conservation value and governance challenges in the forest [28].
The study area covers approximately 300,000 hectares, representing the generalized boundary of the target landscape. However, the total area analyzed varies slightly across different components of the study due to the application of specific data masks and inclusion criteria. During land use/land cover (LULC) classification, all valid pixels within the defined study boundary were included, resulting in a total classified area of approximately 308,765 hectares. This slightly exceeds the nominal study area due to pixel-level inclusion along boundaries and within an irregular geographic extent. In contrast, the transition matrix analysis includes only pixels with valid classification in both time periods. As a result, unclassified, cloud-covered, or masked pixels—due to sensor limitations or quality filtering—were excluded, reducing the total analyzed area to approximately 268,701 hectares. Such variation is common in remote sensing-based landscape analysis, where differing pixel availability and data quality across time periods necessitate conservative inclusion criteria to ensure reliable change detection. All area-based calculations and percentage changes reported are internally consistent within each analysis.

2.3. Research Design and Data Collection

The study adopts a mixed-methods design guided by an explanatory sequential model to examine the patterns and impacts of forest landscape mutations. The research began with a spatial analysis to quantify forest change over 20 years (2004–2024), followed by household surveys to assess local perceptions and socio-ecological outcomes. This integration allowed for triangulation between observed land use dynamics and community experiences, providing a more robust and policy-relevant understanding of the phenomena under study.
Spatial data were derived from Landsat satellite imagery (Landsat 7 ETM+ for 2004, Landsat 8 OLI for 2014, and Landsat 9 OLI-2 for 2024), sourced from the USGS Earth Explorer. Supervised image classification was conducted using ArcGIS 10.8 to categorize land cover into five classes: dense forest, degraded forest, agricultural land, settlements, and water bodies. Google Earth Pro was used to extract geographic control points (GCPs) for classification support. The land use and land cover analysis was conducted using Landsat imagery obtained from the United States Geological Survey (USGS). Each image had a spatial resolution of 30 m, which is suitable for detecting medium-scale landscape changes in forested environments. The selected images corresponded to the dry season months, thus reducing cloud interference and cover for 2004 (Landsat 5 TM), 2014 (Landsat 8 OLI), and 2024 (Landsat 9 OLI-2). At the same time, field verification was carried out between March and May 2024 across selected communities in the three forest blocks. These observations, combined with historical land use narratives, improved classification reliability. Ground truthing was employed to enhance accuracy in mapping complex land cover transitions, as recommended by Foody [29], while change detection analysis was subsequently applied to quantify forest loss and gains, and to identify the spatial patterns of landscape mutation.
To complement the geospatial analysis, a structured household survey was implemented to assess community-level socio-ecological outcomes. The survey instrument contained 18 closed-ended questions across four domains: demographics, environmental changes, ecological impacts, and social impacts. The survey targeted residents of the Yabassi Forest Area who are actively engaged in forest-dependent activities such as farming, hunting, and NTFP collection.
The sample was selected using a stratified random sampling approach to improve representativeness. Eight villages were selected across the three forest blocks—Ebo (Iboti, Bekob, Logdeng), Ndokbou (Ndokbou I, Ndokbou II), and Makombe (Milombe, Balam, Moya)—based on their proximity to the forest and active reliance on forest resources (Table 1). Within each village, households were randomly selected using a raffle-draw method adapted to linear settlement patterns. The number of households surveyed in each village was proportional to its estimated population and settlement density, helping to ensure equitable spatial coverage. A total of 100 households were surveyed, representing approximately 0.6% of the estimated population. While this proportion may appear low, the sampling fraction of 5–10% was assured for each community.
Data collection occurred in two phases. In March 2024, preliminary visits and interviews with two traditional leaders were carried out to identify key forest governance structures and validate the survey design. From March to May 2025, the second phase involved the full deployment of surveys by two research assistants who could communicate in English and French. Before administering the questionnaire, community sensitization sessions were held to explain the study’s purpose and ensure informed consent. Participation was voluntary, and confidentiality was maintained throughout the process.
To ensure contextual relevance and adaptation to logistical constraints, the survey design process included a pre-testing phase conducted in December 2024. During this period, the research team visited selected communities within the Yabassi Forest Area to pre-test survey instruments, engage with local leaders, and assess the feasibility of various distribution methods. This process informed the refinement of the data collection instrument and the choice of the online survey approach. The online survey was conducted with the support of community focal points and civil society organizations who helped circulate the survey and assist less digitally literate participants. To reduce sampling bias, the study targeted forest-dependent households with known engagement in farming, hunting, and/or non-timber forest products (NTFPs) collection. While some remote households may have been underrepresented due to digital access limitations, outreach was broadened through local mobilization and the involvement of trained field assistants who provided guidance where needed. Survey results were triangulated with spatial analysis and key informant interviews, strengthening the validity of the findings.

2.4. Data Analysis

This study adopted a mixed-methods approach combining spatial analysis and household survey data. Land use and land cover (LULC) classifications were derived from multi-temporal satellite imagery using supervised classification techniques. Accuracy assessment was performed using the ENVI 4.5 software, with standard metrics such as overall accuracy and Cohen’s kappa coefficient applied to evaluate classification performance across 2004, 2014, and 2024. For the household survey, responses were coded and analyzed using Microsoft Excel. Descriptive statistics (frequencies and percentages) were used to summarize trends related to forest changes, socio-ecological impacts, and governance perceptions. Graphs and charts were used to visualize patterns, while thematic analysis guided the interpretation of open-ended responses.
All results were interpreted using the socio-ecological systems (SES) framework [18], which enabled the structured analysis of four key components: resource systems (forest landscapes), resource units (timber, wildlife, NTFPs), users (households, traditional authorities, private firms), and governance systems (customary laws, state regulations, community forest committees). Through this integrative and systems-oriented approach, the study offers a grounded understanding of the ecological and social outcomes of forest landscape mutations, generating theoretical and action-oriented insights for conservation and rural development in the Congo Basin.

2.5. Accuracy Assessment of Image Classification

To assess the accuracy of land use and land cover (LULC) classifications, the classified outputs were validated using ground control points from preliminary field visits and remote validation with high-resolution satellite imagery. Accuracy assessment was conducted with the ENVI 4.5 software using standard metrics, including overall accuracy and Cohen’s kappa coefficient [30]. The results indicated moderate classification performance, with kappa values of 0.54, 0.46, and 0.65 and overall accuracies of 73.02%, 60.44%, and 73.85% for the years 2004, 2014, and 2024, respectively (Table 2). Earlier years exhibited a significant fraction of unclassified pixels—41.87% in 2004 and 32.16% in 2014. This was mainly due to cloud cover, image noise, and spectral confusion. However, improvements in image resolution and classification techniques by 2024 eliminated the unclassified category entirely, enhancing reliability. In addition to remote sensing data, the study incorporated ancillary socio-economic, demographic, and policy information sourced from government agencies, research institutions, and existing literature. These contextual datasets provided insights on the drivers of land use and land cover change such as governance reforms, evolving livelihood practices, and infrastructural growth in the Yabassi Forest Area, in line with the recommendations of [31].

3. Results

3.1. Forest Landscape Mutations

Forest landscape mutations were analyzed using land use/land cover maps for the periods between 2004 and 2024 as follows:

3.1.1. Land Use Land Cover Situation in 2004

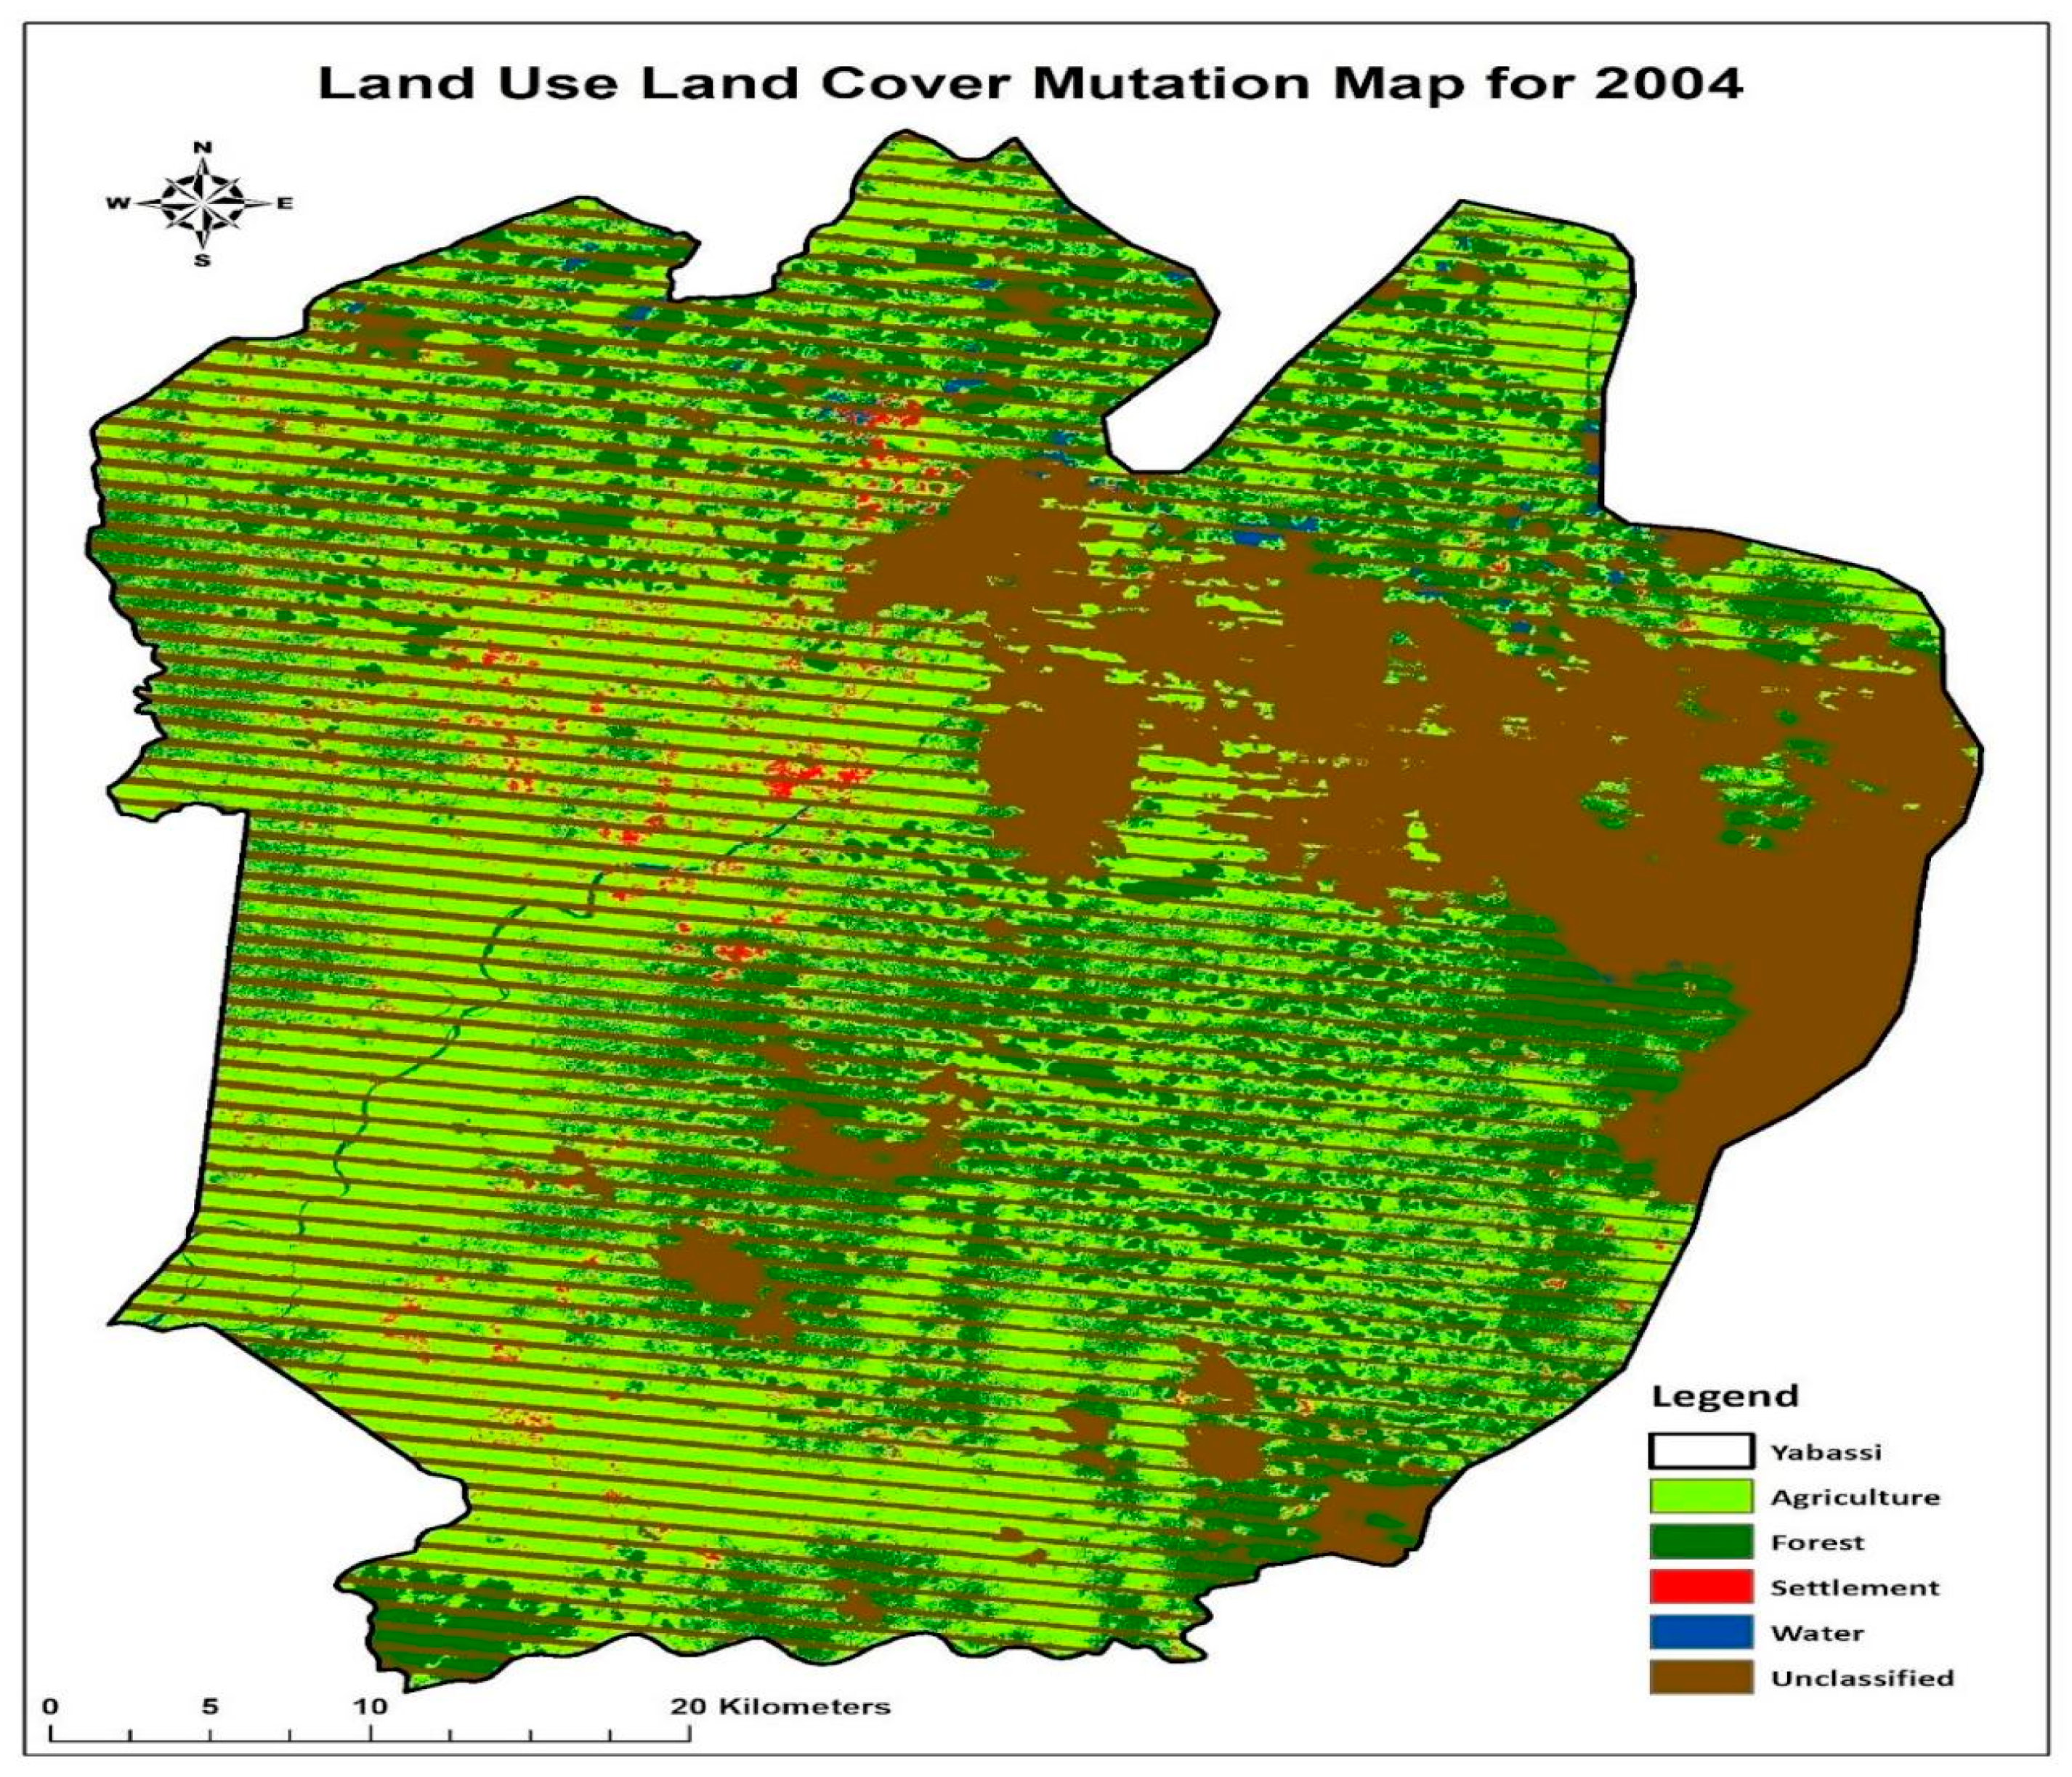
The period 2004 recorded unclassified areas as the most dominant in terms of land use (41.87%) followed by agricultural land (33.84%), with the least being water bodies (0.50%). The dominance of unclassified areas is largely due to the inability to accurately recognize land use, coupled with cloud cover, which rendered classification very difficult. In recognition of this, agriculture dominated the land use classes, signifying the encroachment of farmland into forest areas (Table 2 and Figure 3). This may partly explain the limited coverage of forest areas (22.85%). Settlements in 2004 were not significant, as the population was limited at the time. This probably caused the few inhabitants to construct buildings for shelter (0.94%), as seen in (Table 3). It is also important to note that the image had scan lines that could be attributed to how satellite captures the area within the analysis period, as Landsat 7 is affected by scan line corrector (SLC) failure.

3.1.2. Land Use Land Cover Situation in 2014

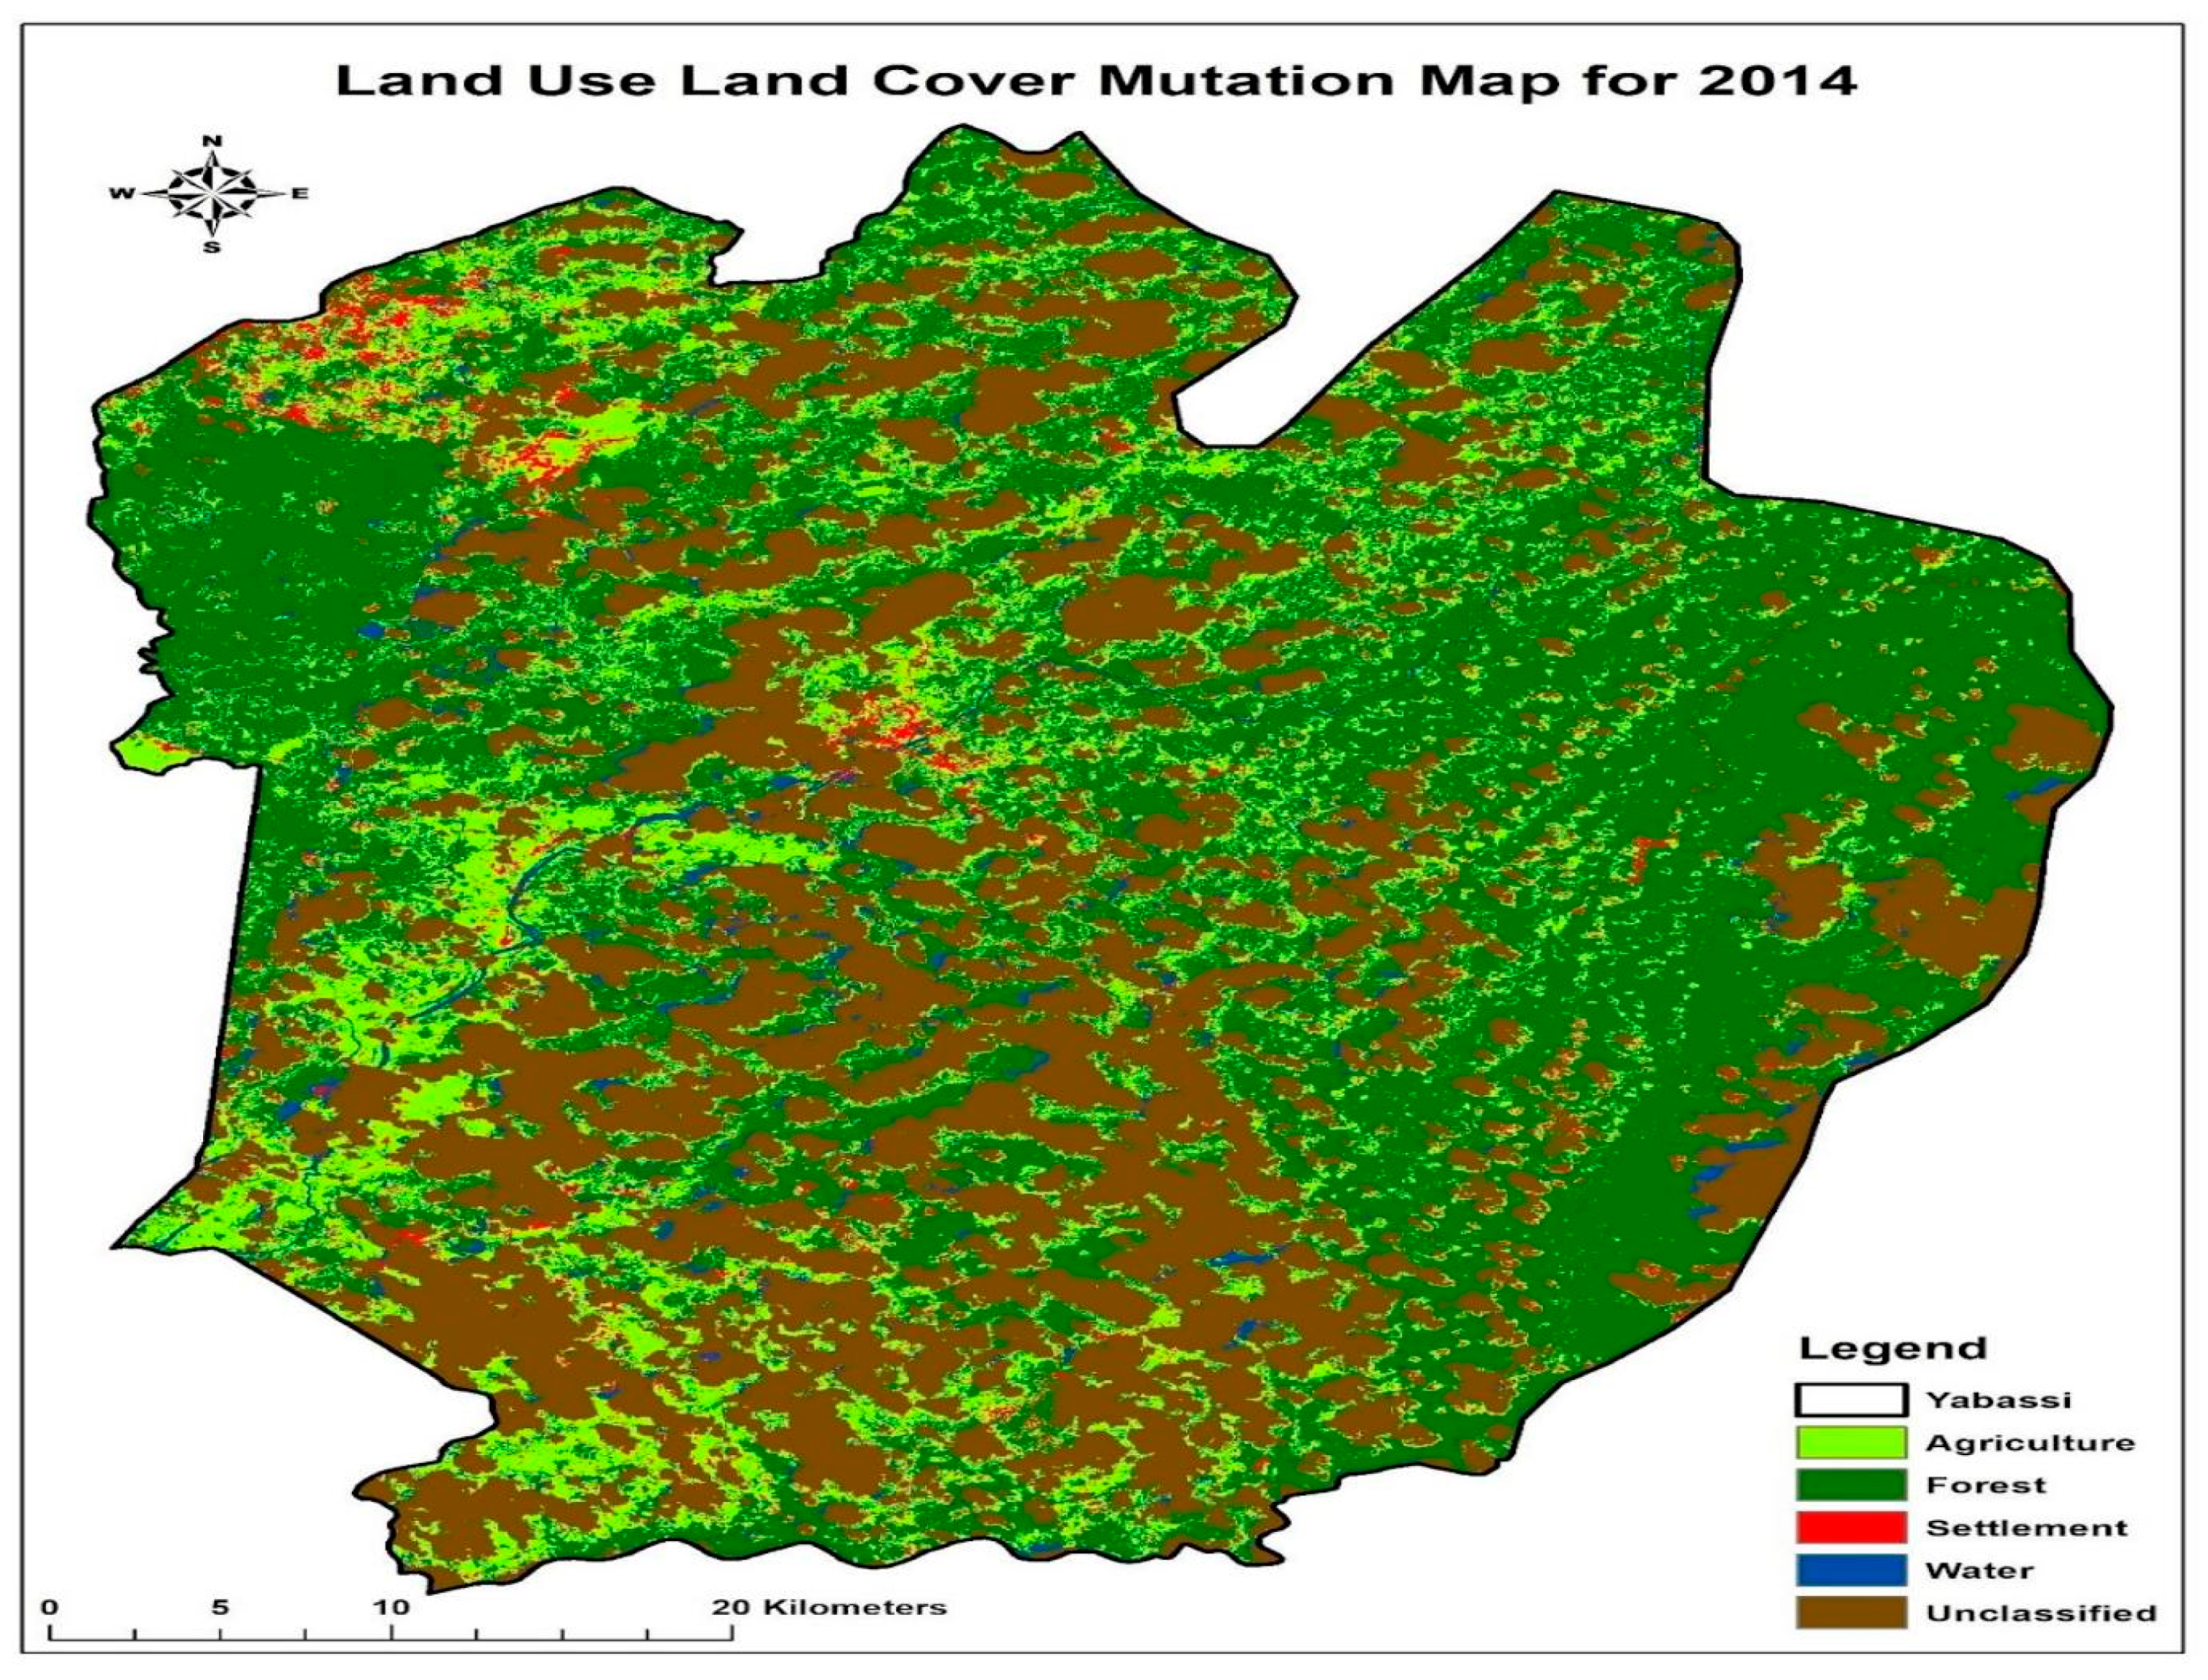
As of 2014, forest cover increased substantially by 46.63%, representing the most dominant land cover classes in the landscape. Although a similar pattern of unclassified land cover class exists in the 2014 images, covering a significant area (32.16%), it highlights the difficulty during the classification process in identifying this land cover class. Water bodies and settlements recorded the least land cover classes, with 2.48% and 2.06%, respectively, representing the fourth and fifth land cover classes. It was expected that with population growth, more land would be exploited for agricultural purposes (Table 4 and Figure 4). However, by 2014, agricultural land declined from 33.84% in 2004 to 16.69%, revealing a probable mismatch in the classification. Areas classified as unclassified may be productive for agriculture; however, since there were difficulties identifying and classifying these areas as potentially productive agricultural lands, the land cover for agriculture decreased drastically.

3.1.3. Land Use Land Cover Situation in 2024

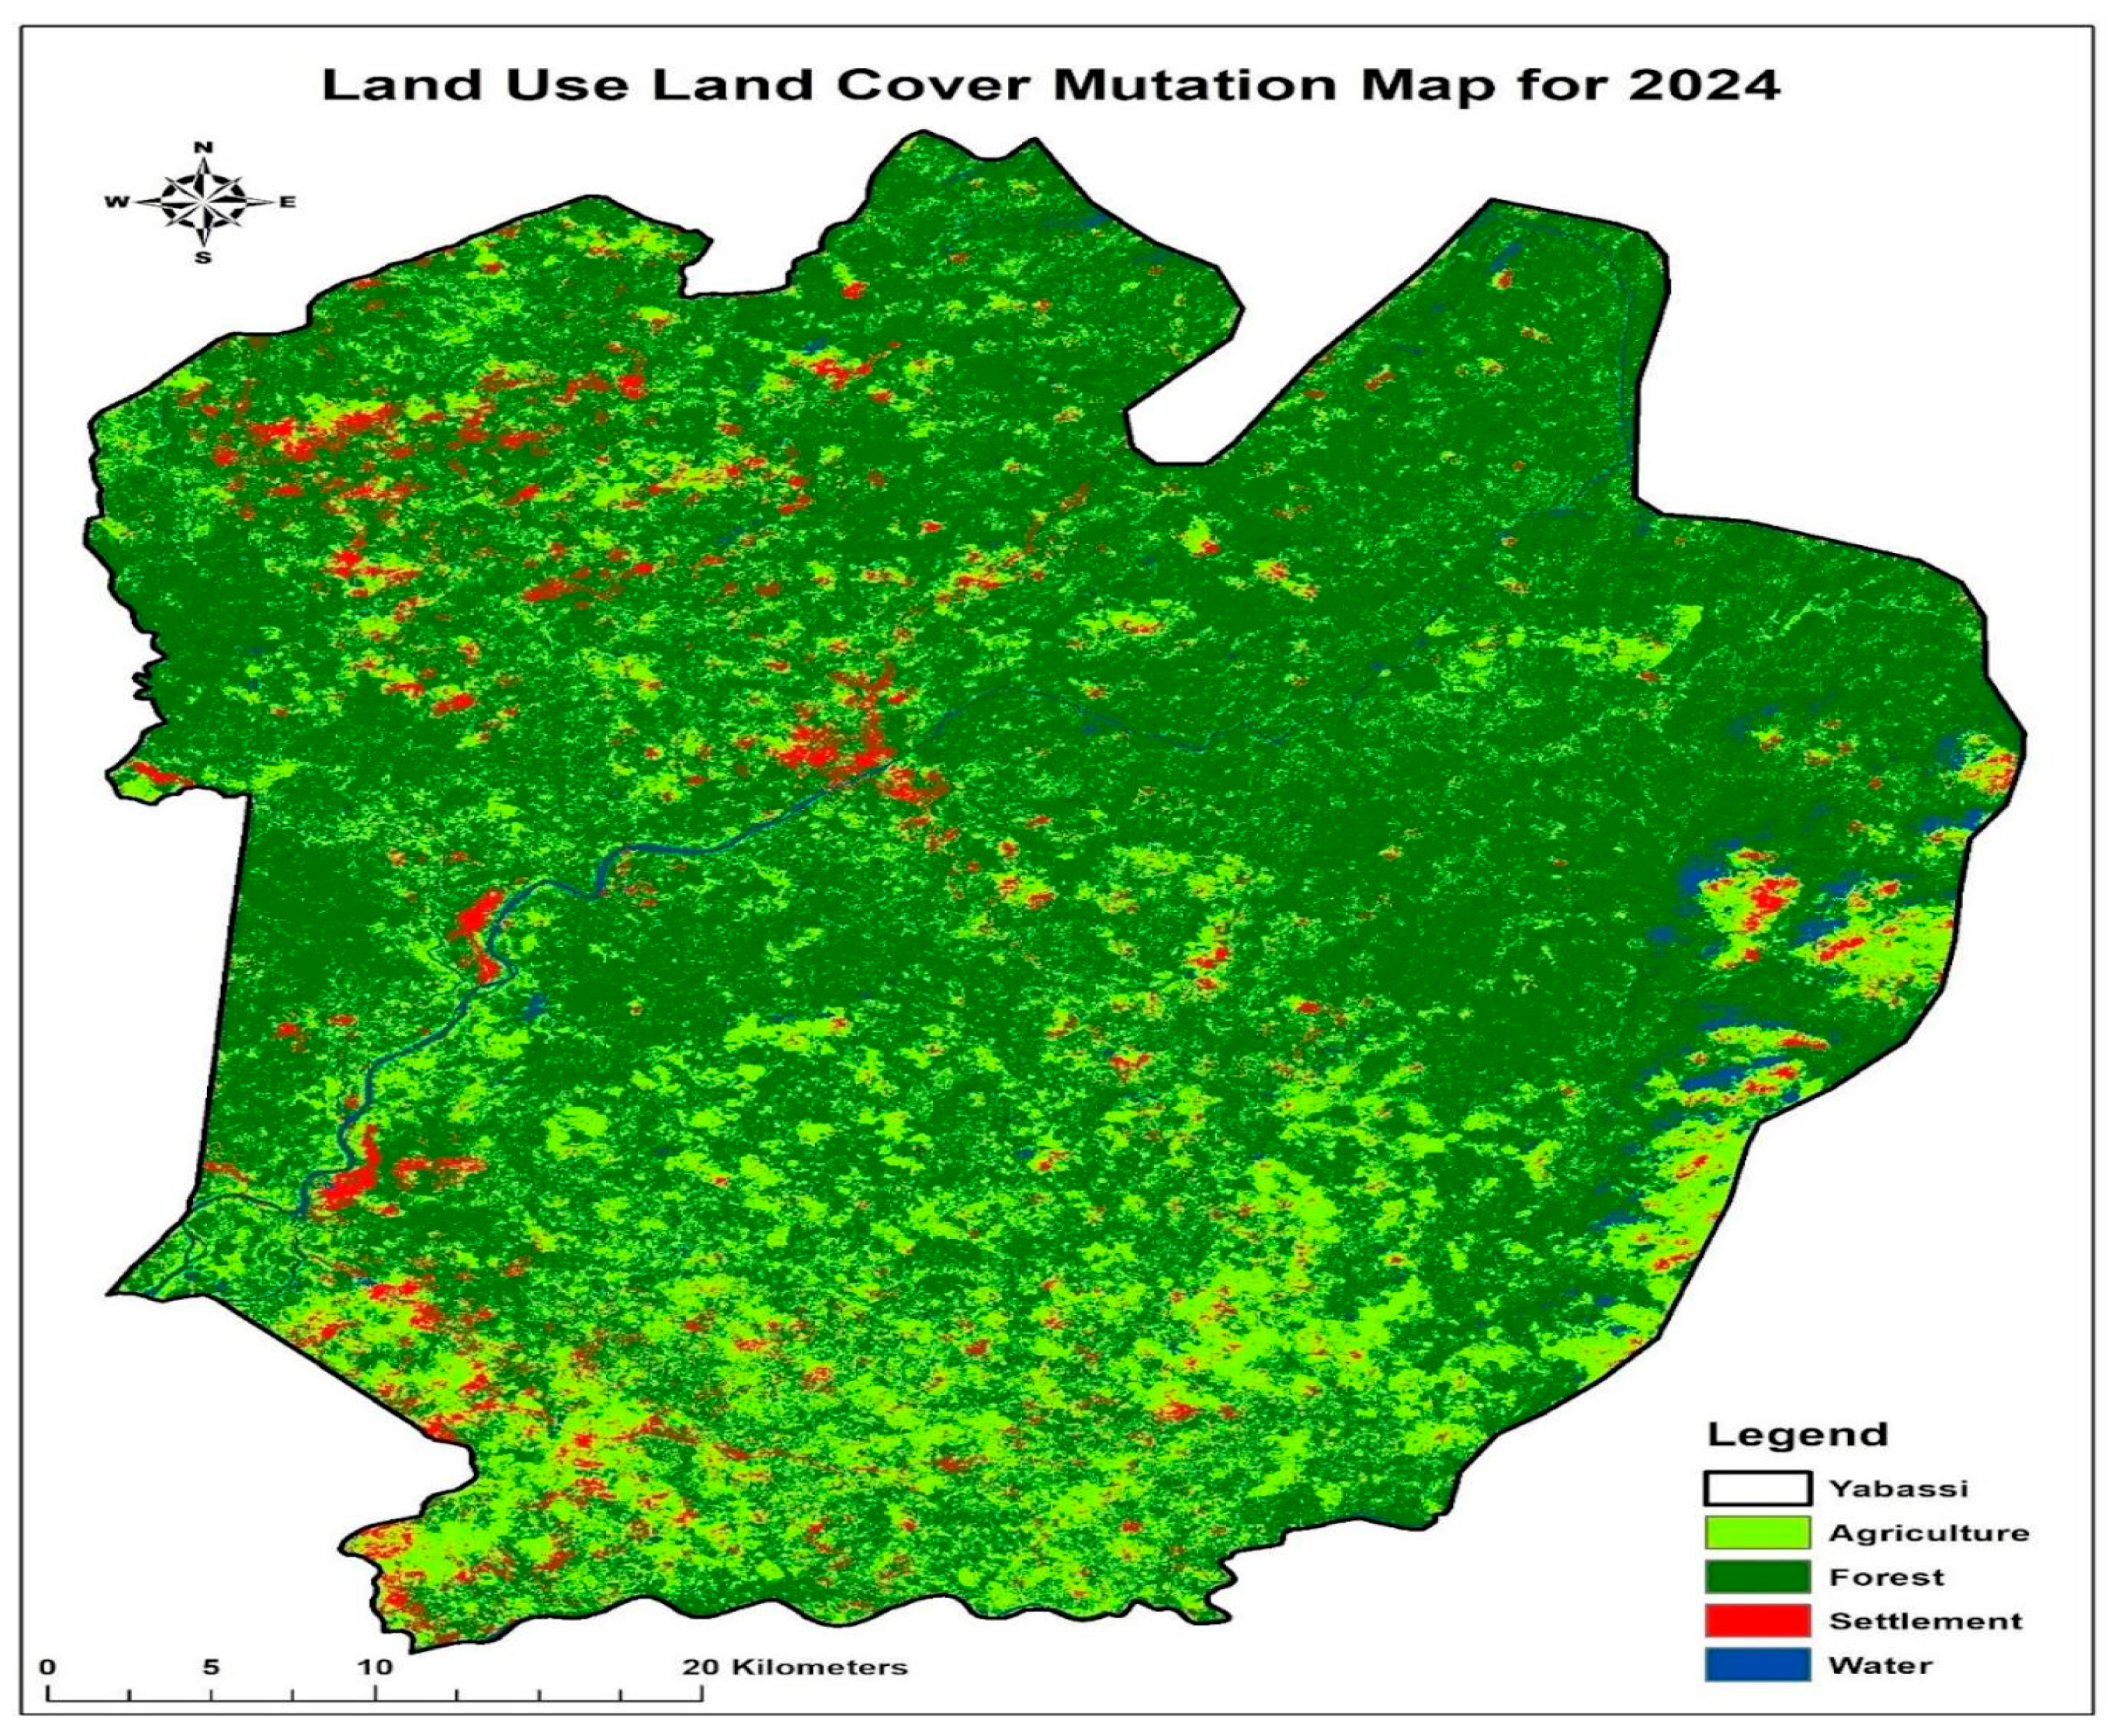
The 2024 land cover map places forest as the most dominant land cover class, with a total area of 211,982.271101 ha, representing 68.65% of the total landscape. This increase may be attributed to several interventions in the region, including but not limited to enrichment planting, agroforestry systems, and farmer-managed natural regeneration. These activities were implemented by government agencies such as the Delegation of Forestry and Wildlife and some environmental conservation NGOs. In 2024, images were clear enough to facilitate the distinction between the various land cover classes. This eliminated the unclassified category due to improved image quality. Agriculture became the second most dominant land cover class, with a total area of 80,120.52 ha, representing 25.91% of the total landscape. Population increase along with its attendant demand for resources led to the expansion of agricultural land (Table 5 and Figure 5). Although settlement and water bodies increased by 3.05% and 2.39% in the landscape, they remain the least recorded land cover classes within the landscape. The increase in population has forced people to convert land classes, such as forests or agricultural areas, to pave the way for other land uses.
Between 2004 and 2014, the landscape underwent significant transformations (Table 6). A substantial 40.9% of the land originally under agriculture in 2004, equivalent to 41,743.73 hectares, transitioned into forest by 2014, suggesting either widespread reforestation or potential reclassification due to improved spectral resolution and classification techniques. However, this greening was offset by 9156.90 hectares of forest converted to agriculture, representing 12.9% of the forest area in 2004. These shifts underscore a pattern of land use flux driven by both environmental management interventions and ongoing agricultural expansion. Additionally, 38,675.50 hectares (or 41.9%) of previously unclassified areas contributed to forest cover in 2014. While this indicates improved image clarity, it could also underscore the challenge of cloud cover and spectral confusion in earlier classifications. These issues are commonly reported in remote sensing in the tropics [29].
Between 2014 and 2024, further landscape transformation was observed (Table 7); 108,596.38 hectares, which is 75.5% of the 2014 forest area remained forested in 2024, reflecting relative stability and ecological continuity. In contrast, 34,087.08 hectares (approximately 66.2% of agriculture from 2014) were reclassified as forest, potentially due to successful conservation efforts such as community forest management, agroforestry, and reforestation programs supported by NGOs such as AJESH and local governance structures [32]. Despite this, deforestation persisted, with 29,299.32 hectares of forest converted to agricultural land. Around 20.4% of the forest area in 2014 was converted, highlighting continued land pressure, particularly from subsistence and commercial farming [12]. Additionally, 2634.28 hectares of forest were lost to settlements, likely due to population growth and urban expansion associated with proximity to Douala. Importantly, the total landscape area remained consistent at around 268,701 hectares, allowing for accurate inter-period comparison. A key improvement in the 2024 dataset was the elimination of unclassified land, reflecting enhanced data quality, classification accuracy, and ground validation efforts through field surveys conducted between January and April 2024.
The transition matrices illustrate a highly dynamic system, with agriculture emerging as the most volatile class, constituting both a driver and a consequence of land use change. These patterns reflect broader African forest trends, where shifting cultivation, population growth, and weak governance contribute to land use change [9]. In Yabassi, such changes are associated with socio-ecological outcomes including habitat loss and biodiversity decline to altered livelihood systems, land tenure conflicts, and shifts in resource access. Such outcomes require adaptive forest governance strategies [28].

3.1.4. Change Analysis of Land Use/Land Cover

From the data, it is observed that between 2004 and 2014, forest cover in the Yabassi Forest Area expanded significantly by 104.01%, rising from 70,536 ha to 143,927.76 ha (Table 8). This rise is the result of natural regeneration or increased conservation initiatives. This growth continued, albeit moderately, between 2014 and 2024, with a further 47.27% increase. This brings the forest area to 211,931.96 ha and marks a total increase of +151.28% over the past two decades. In contrast, agricultural land dropped by 50.72% between 2004 and 2014, declining from 104,462.40 ha to 51,495.92 ha. However, it showed a partial rebound by 55.33% in 2024, totaling 79,974.29 ha. Despite this recovery, the overall agricultural footprint recorded a net loss of −23.46%, reflecting a dynamic cycle of land use influenced by abandonment, classification limitations, and/or changing livelihood strategies.
Settlement witnessed consistent expansion in both decades, increasing from 2892.53 ha in 2004 to 6344.28 ha in 2014 (+119.47%). This reached 9437.20 ha in 2024 (+48.75%), representing an overall increase of +226.43%. Water bodies showed an initial sharp change. This was characterized by a +396.00% increase from 1546.62 ha to 7665.41 ha between 2004 and 2014, then a slight decline in 2024, indicating a net gain of +376.20% over the 20 years. Meanwhile, the unclassified land area recorded a decrease from 129,263.63 ha in 2004 to 99,274.83 ha in 2014 (−23.23%). By 2024, this class was eliminated due to advancements in image clarity and classification techniques. Overall, the results highlight a complex yet instructive pattern of landscape transformation, driven by both ecological restoration and human activities that shape the socio-ecological trajectory of the Yabassi Forest Area.

3.2. Drivers of Forest Landscape Mutations

The results reveal that forest landscape mutations in the Yabassi Forest Area are driven by a combination of socio-economic and environmental pressures, as seen in Figure 6 below. Population growth (57%) and deforestation for agriculture or farming (56%) emerged as the leading drivers, highlighting the growing demand for land amid limited alternative livelihoods. Logging activities (48%) and urban expansion (48%) further contributed to forest degradation, particularly near rapidly growing settlements such as Solle and Dimbong. These pressures were compounded by the perceived effects of climate change (36%), which affects vegetation patterns and exacerbates land vulnerability. Though less frequently cited, mining activities (20%), government projects (16%), and infrastructural development (14%), including the construction of roads and schools, also played a role in altering the landscape. These findings point to a complex interplay of local land use decisions and broader development agendas, underscoring the need for integrated forest governance approaches that address both immediate livelihood needs and long-term environmental sustainability.

3.3. Socio-Ecological Outcomes of Forest Landscape Mutations

Table 9 captures the dual nature of forest landscape mutations, which are structured under positive and negative ecological and social outcomes. The most significant positive ecological outcome was forest regeneration (30%), followed by improvements in biodiversity conservation (25%). The least reported was the emergence of ecotourism opportunities (8%). From the negative perspective, the perceived decline in biodiversity (76%) and wildlife loss (75%) were the most significant, while other aspects of ecological stress (2%) featured the least.
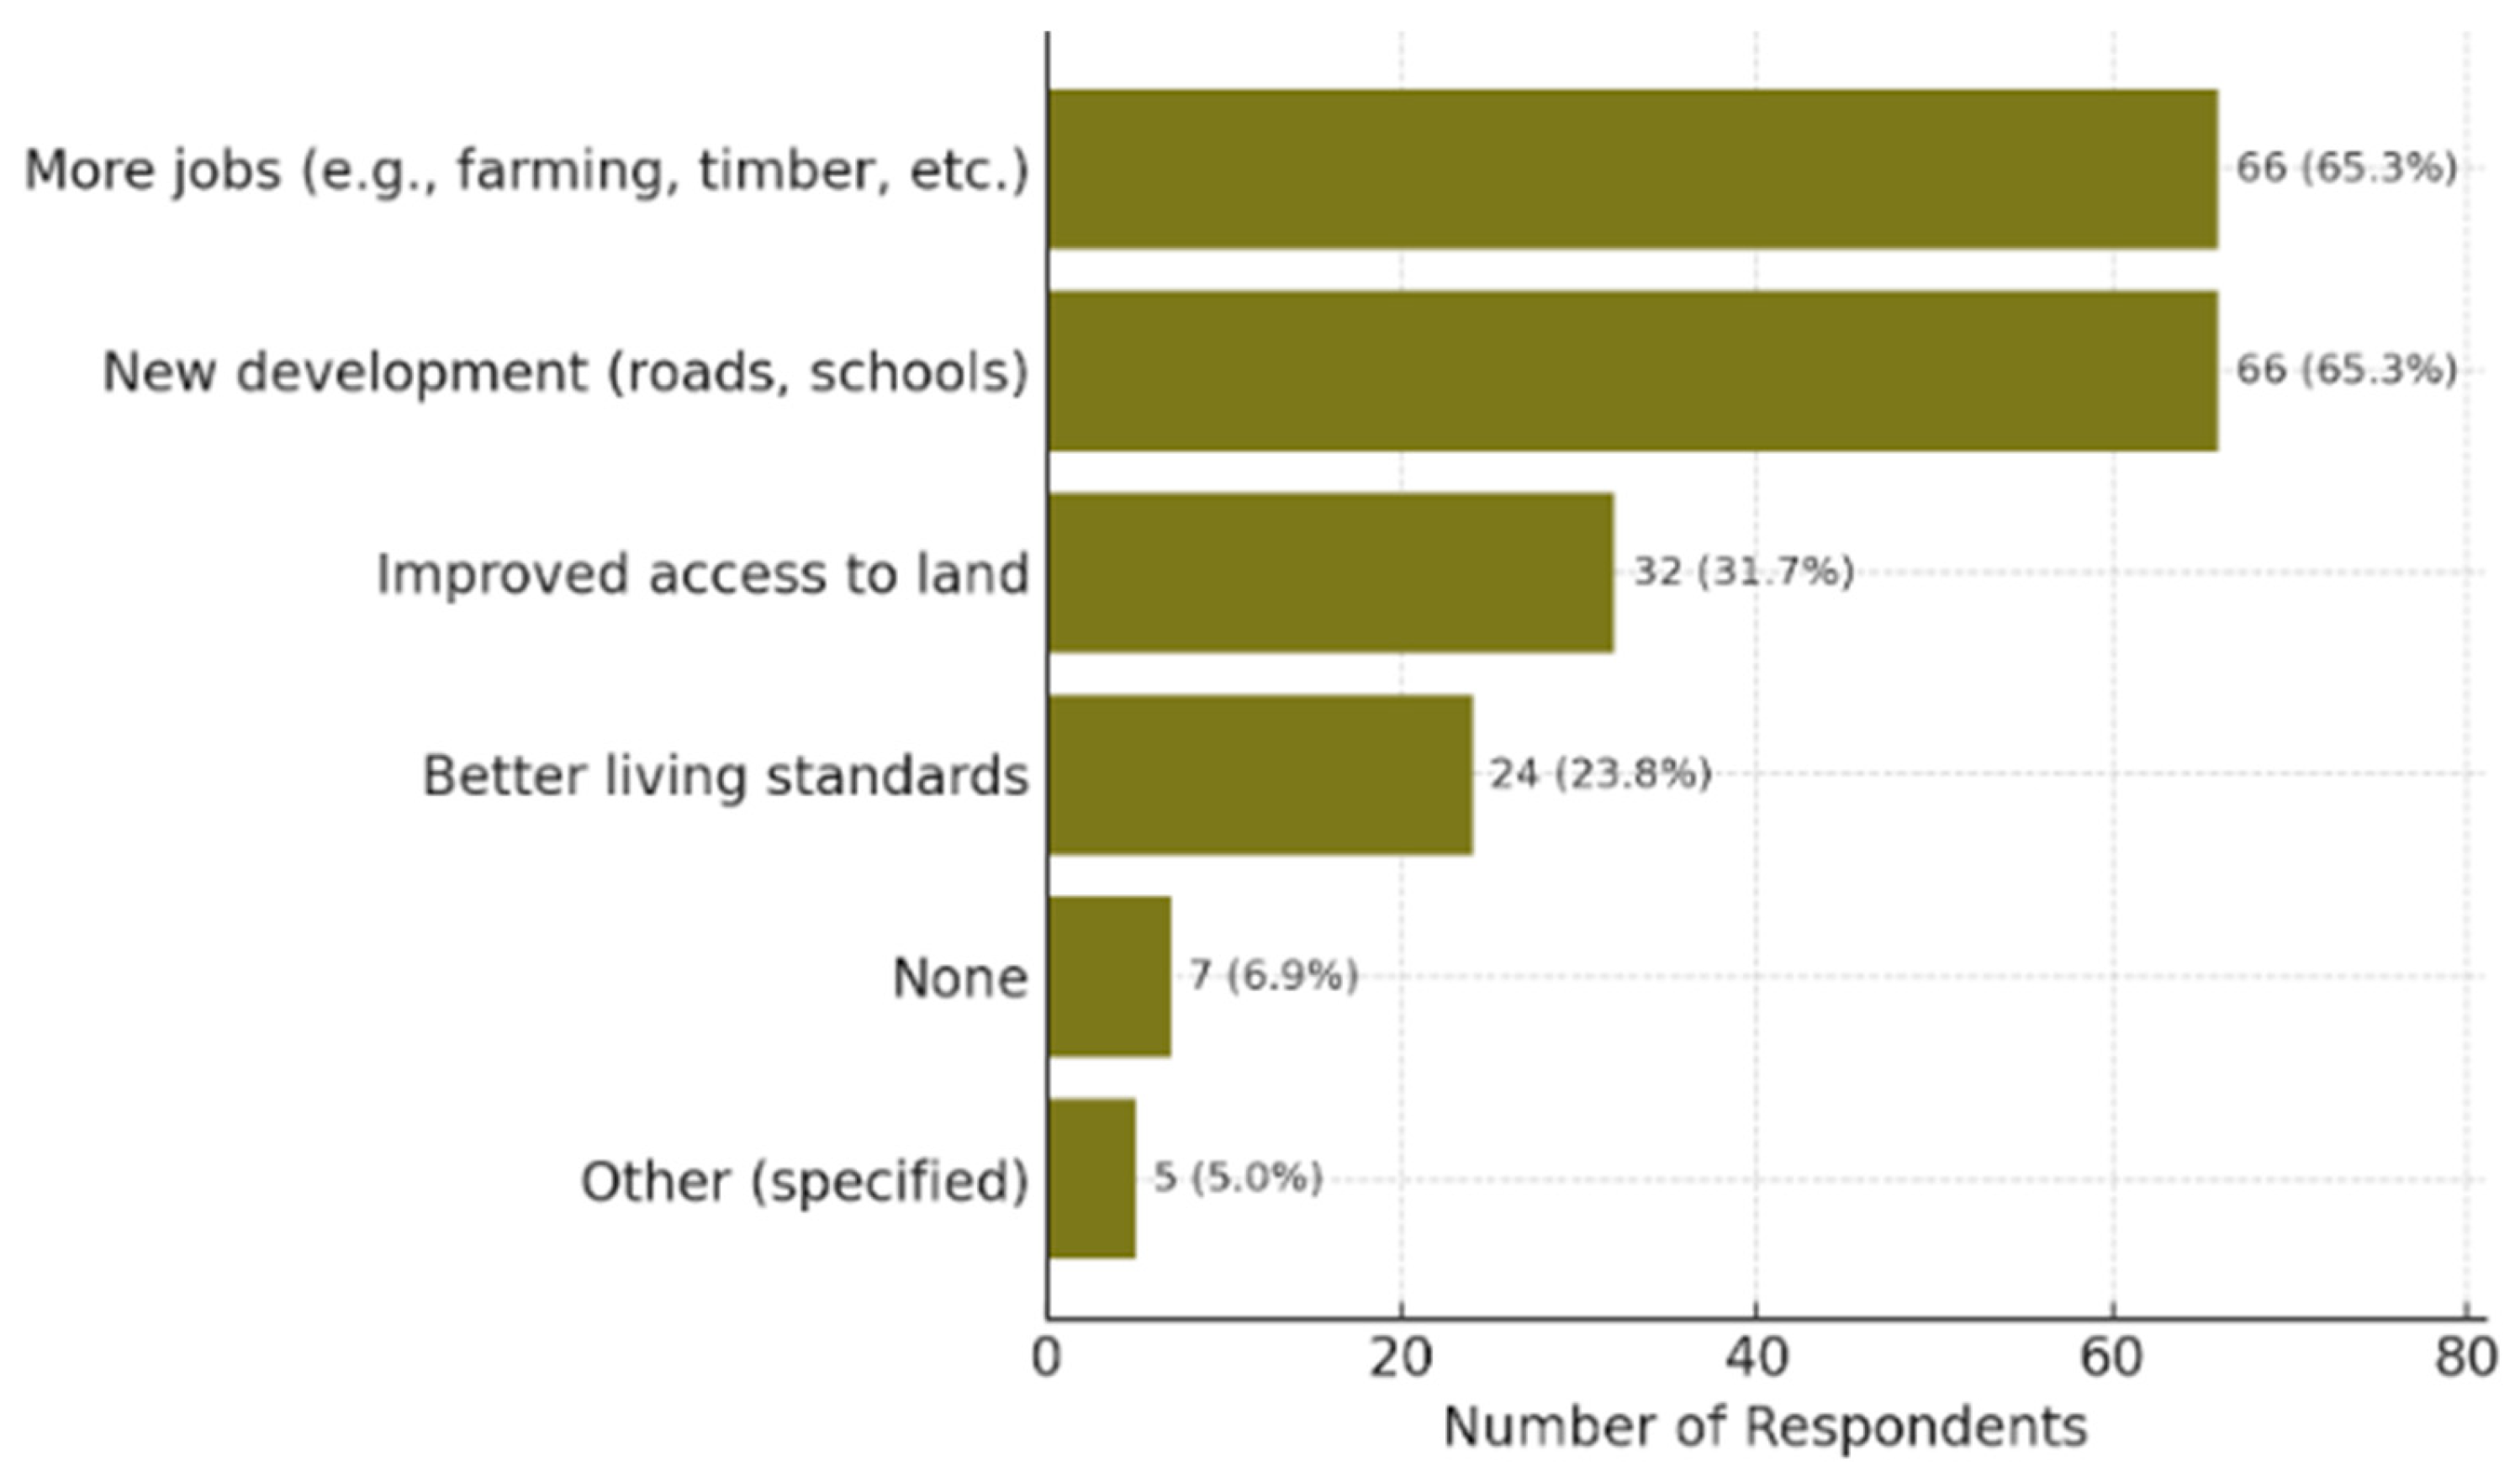
The significant positive social outcomes included the provision of job opportunities (66%) and infrastructural development (66%), while the least reported ones included access to forest products and mobility (5%). The loss of traditional forest access (69%) and land conflicts (67%) stood as the significant negative social outcomes, while the disruption of the social fabric (2%) was the least reported (Table 6).

4. Discussion

The Yabassi Forest Area, situated within the Congo Basin, offers an insightful case of socio-ecological transformations shaped by two decades of dynamic forest landscape mutations. Using the socio-ecological systems (SES) as analytical framework [18], this study illustrates how interactions between resource systems (forests), resource units (biodiversity and land cover types), governance systems (local and state institutions), and users (communities and actors such as NGOs) collectively produce a set of positive and negative socio-ecological outcomes.
To deepen the SES framework, this study anchored its findings to the core components of the SES framework. The forest landscapes of Ebo, Ndokbou, and Makombé serve as distinct resource systems (RS), each exhibiting different forest cover trends and land use pressures. Within these systems, households engage with various resource units (RU)—including timber, NTFPs, wildlife, and medicinal plants—based on livelihood needs and cultural practices. These interactions are mediated by a diverse array of actors (A) such as herbalists, hunters, and women, many of whom face limitations in access and decision-making power. The governance system (GS) encompasses both formal institutions (e.g., forestry laws and NGO interventions) and informal mechanisms (e.g., traditional rules and community bylaws). Reported participation in conservation activities (66%) alongside low perceived governance effectiveness (29%) highlight tensions within this system. Through activities like farming, hunting, and forest product collection, these actors engage in interactions (I) that lead to key outcomes (O) such as perceived forest decline (95%), biodiversity loss (90%), land conflicts (67%), and importantly local observations of forest regeneration (30%). The core contribution centers on the observed positive and negative ecological and social outcomes linked to the changes in the resource system (socio-ecological system). This enhances the understanding of how governance failures, livelihood dependencies, and ecological pressures have co-evolved in shaping the Yabassi forest landscape.
Between 2004 and 2024, Yabassi experienced a notable increase in forest cover, from 22.85% to 68.65%, representing a net gain of more than 45%. This net gain is accounted for, in part, by the sustained ecological interventions such as agroforestry, enrichment planting, and farmer-managed natural regeneration of state actors and NGOs. This affirms the SES proposition that resilient outcomes are possible when institutional arrangements (e.g., community forestry) align with local ecological knowledge and incentives. These findings align with the work of the author of [33], who observed that community-led forest governance in Cameroon enhances the success of reforestation and ecological stewardship. However, this contrasts with that in [34], which argued that conservation interventions often fail to deliver long-term environmental benefits in Central Africa due to institutional fragmentation and inconsistent policy enforcement. The Yabassi case, however, suggests that where multi-actor governance is coordinated and socio-ecological feedback is recognized, achieving significant recovery is possible.
While the study recorded a +151% increase in forest cover between 2004 and 2024, it is important to note that this finding does not align with regional and global trends, which generally report net forest loss across Cameroon and other parts of the Congo Basin. For instance, Refs. [6,9] highlight persistent deforestation in the Congo Basin due to agricultural expansion, logging, and infrastructure development. However, the results reflect localized landscape dynamics within the Yabassi Forest Area and should not be generalized as indicative of national or continental trends.
Several contextual factors help explain the observed forest gains. First, passive regeneration of formerly cultivated or abandoned farmland—particularly in areas affected by shifting livelihood strategies and population mobility—contributed to the natural recovery process of forested areas. This mirrors regeneration trends observed elsewhere in Central Africa [35]. Second, the Yabassi Forest Area partially overlaps with Key Biodiversity Areas (KBAs), where targeted community-based conservation initiatives have played a critical role. A notable example is the suspension of a proposed logging concession in the Ebo Forest (141,700 ha) in August 2020 by the government of Cameroon. This decision came in response to stiff opposition from local communities, environmental NGOs, scientists, and international partners, who highlighted the forest’s global ecological significance and its role in supporting endemic and endangered species, such as the Nigeria–Cameroon chimpanzee and forest elephants. The government issued a public statement revoking the decree to allocate the concession. This helped to avert large-scale forest clearance and reaffirmed the value of community and civil society engagement in forest governance [36]. The intervention has since enabled continued forest recovery and strengthened the foundation for biodiversity conservation and local stewardship in the region. Third, certain blocks, particularly portions of the Makombé Forest, have remained relatively inaccessible due to topographic and infrastructural constraints, limiting commercial exploitation and preserving forest integrity. Last, the apparent forest gains may be partially attributable to improved classification methods in 2024, including higher-quality satellite imagery and the elimination of the “unclassified” category, which enhanced the visibility and detection of secondary forests and regenerating woodlands previously masked by cloud cover or spectral confusion.
It is evident that there has been a net gain in forest cover within this landscape. However, the reported +151% increase in forest cover between 2004 and 2024 should be interpreted with caution, as it may partially reflect classification differences rather than the true ecological change. Classification accuracy was notably lower in the earlier years (overall accuracy: 73.02% in 2004; 60.44% in 2014) compared to 2024 (73.85%), with high proportions of unclassified pixels in 2004 (41.87%) and 2014 (32.16%), and none in 2024. These discrepancies indicate that improved image quality and classification techniques in 2024 likely contributed to the forest gain estimate, because it reduced omission errors and expanded the detectable area. While a formal error-adjusted area estimation [37] was not applied, the study now incorporates this limitation in the interpretation and recommends such methods for future research to derive more robust change estimates.
The observed mutations in forest landscapes underscore the volatility of agricultural land use, which declined sharply by 50.72% between 2004 and 2014 before witnessing a partial rebound by 2024. Agriculture has thus acted both as a driver and a recipient of land use change, confirming its role as a core feedback variable within the SES framework. This finding aligns with [28], who emphasized the bidirectional nature of agricultural pressure and forest transformation in Cameroon. It also reflects broader African trends, where shifting cultivation, market-driven farming, and tenure uncertainty destabilize landscapes [9]. These dynamics challenge [38], which projected a linear decline in forest cover under expanding agricultural fronts, underestimating the potential for forest regeneration under hybrid land use regimes.
The drivers of forest landscape mutations in Yabassi, mainly population growth (57%), agricultural expansion (56%), logging (48%), and urban development (48%), further illuminate the complex interplay of ecological and social subsystems. These pressures mirror patterns found elsewhere in the Congo Basin, where demographic trends and infrastructural development amplify land conversion. Interestingly, the perceived effects of climate change (36%) were also identified as a key driver, particularly through its effects on rainfall variability and soil productivity, which redefine local land use decisions. These findings support [39], which demonstrated that vulnerability to climate variability accelerates land transitions in rural forest communities. However, they differ from [40], which rather emphasized the dynamics of global commodity markets. In the Yabassi Forest Area, shifts in rainfall patterns, rising temperatures, and increased frequency of extreme events have altered species distribution, promoted pest outbreaks, and increased the risk of fire—ultimately degrading biodiversity and disrupting key ecosystem services such as water regulation and soil retention. Studies elsewhere support these concerns; for example, Ref. [41] observed that in Southwest China, climate change contributed to water yield reduction (84%) and to variations in soil conservation (91%), thus surpassing the impacts of land use change [42]. These changes in ecosystem service provision highlight the scale-dependent uncertainties that climate variability introduces, particularly for water-related functions. These local observations are consistent with broader regional and global patterns of climate-induced forest change. Recent studies further highlight how climate change reshapes forest landscapes and ecosystem services through linked drivers such as fires, drought, and biodiversity loss. For example, climate-induced shifts in species composition and forest structure are becoming increasingly common, as warmer and drier conditions promote more frequent and intense fires while reducing the resilience of late-successional forest ecosystems [43,44]. Drought-induced mortality alters species composition and reduces carbon storage in forest biomass; this creates potential feedback loops within the climate system [45,46]. In tropical forests like the Amazon, increased drought and fire risks may shift ecosystems toward more fire-prone and biodiversity-poor savanna states [47,48]. These findings underscore the importance of integrating climate resilience into forest management and conservation planning in Yabassi and similar forest systems worldwide. In the Yabassi context, where livelihoods depend on forest-derived ecosystem services, promoting ecosystem-based adaptation strategies, improving forest monitoring systems, and integrating climate resilience into conservation planning are essential.
The socio-ecological outcomes of forest transformations have been both enabling and exclusionary. On the ecological front, gains in forest cover were associated with forest regeneration (30%), perceived biodiversity conservation (25%), and increased opportunities for ecotourism (8%). These benefits demonstrate how landscape-level interventions can enhance ecosystem integrity and unlock new economic opportunities, particularly when combined with community engagement. Yet the legacy of earlier forest loss is still deeply felt. Wildlife decline was reported by 75% of respondents, while 76% reported a decline in biodiversity. This dissonance between quantitative forest gains and qualitative ecological degradation challenges simplistic metrics of conservation success, supporting [26], which argues that forest integrity, not just extent, is the true determinant of ecological resilience in the broader Congo Basin.
Socially, the positive outcomes of increased employment (66%), improvement in infrastructure (66%), and improved land accessibility (32%) were widely reported. These align with the SES emphasis on livelihood diversification as a component of resilience. Yet, these benefits were accompanied by deepening inequality and dispossession. Loss of traditional access (69%), rising land conflicts (67%), and migration due to deteriorating conditions (13%) highlight the social costs of forest mutations. This supports [49], which documented how conservation gains in Central Africa often coincide with social marginalization when tenure rights are weak or undefined. It also contradicts [50], which contended that forest transitions in community-managed landscapes in Cameroon are socially beneficial. In Yabassi, it is evident that without equitable governance, forest recovery can coincide with socio-spatial exclusion.
The implications of these findings for policy are profound. First, adaptive forest governance must move beyond ecological indicators to encompass social equity, livelihood security, and cultural access. Recognizing customary tenure, supporting agro-ecological transitions, and investing in inclusive monitoring systems remain crucial for success. Second, landscape management must be context-specific and flexible, integrating local knowledge and feedback into decision-making processes. Third, regional planning should anticipate and mitigate the unintended consequences of infrastructure and demographic growth factors that can undermine forest resilience.
In summary, the Yabassi case provides both caution and promise. It shows that forest recovery is possible but not inevitable, that ecological gain can coexist with social fragmentation, and that policy success lies not in technocratic fixes but in participatory, system-aware governance. As a microcosm of broader Congo Basin dynamics, Yabassi reveals the importance of aligning conservation goals with socio-ecological realities to ensure sustainable and just forest futures.
5. Conclusions

This study provides novel evidence that, contrary to prevailing regional and global trends of net forest loss, the Yabassi Forest Area experienced a significant increase in forest cover between 2004 and 2024. This gain reflects localized dynamics, driven by passive regeneration, community-based conservation, and improved classification accuracy rather than broader national or continental patterns. The findings reveal that ecological recovery can occur in socially contested forest landscapes when governance structures, local engagement, and restoration opportunities align. However, the uneven distribution of socio-ecological benefits highlights that forest gains alone do not guarantee social equity, underscoring the need for integrated governance that couples ecological objectives with livelihood security and tenure rights. These insights refine the application of the SES framework by demonstrating its utility in capturing both the drivers and trade-offs of forest landscape mutation in the Congo Basin.

Author Contributions

Conceptualization, P.K.N. and J.N.K.; methodology, P.K.N. and J.N.K.; writing—original draft, P.K.N. and J.N.K.; writing—review and editing, P.K.N. and J.N.K.; supervision, J.N.K. All authors have read and agreed to the published version of the manuscript.

Funding

This research received no external funding and was entirely self-funded by the authors.

Institutional Review Board Statement

Ethical review and approval were waived for this study because it involved non-invasive, perception-based data collection from adult community members regarding forest use, land cover change, and local governance. The research did not involve the collection of biological specimens or personal health data. All procedures were conducted in accordance with ethical research principles, and informed consent was obtained from all participants. Participation was voluntary, and respondents were assured of anonymity, confidentiality, and their right to withdraw at any time.

Data Availability Statement

The data presented in this study are available on request from the corresponding authors. The data are not publicly available due to ethical considerations and the protection of respondent confidentiality. Spatial datasets used for land use/land cover classification (Landsat imagery) are publicly available through the United States Geological Survey (USGS) Earth Explorer platform (https://earthexplorer.usgs.gov/).

Acknowledgments

We acknowledge the respondents who took time to participate in the data collection process. This paper was developed within the framework of the CIPSEM program, Dresden, Germany.

Conflicts of Interest

The authors declare no conflicts of interest.

References

  1. Ostrom, E. Governing the Commons: The Evolution of Institutions for Collective Action; Cambridge University Press: Cambridge, UK, 1990. [Google Scholar]
  2. Ameyaw, J.; Arts, B.; Wals, A. Challenges to responsible forest governance in Ghana and its implications for professional education. For. Policy Econ. 2016, 62, 78–87. [Google Scholar] [CrossRef]
  3. Kimengsi, J.N.; Abam, C.E.; Forje, G.W. Spatio-temporal analysis of the ‘last vestiges’ of endogenous cultural institutions: Implications for Cameroon’s protected areas. GeoJournal 2002, 87, 4617–4634. [Google Scholar] [CrossRef]
  4. Kimengsi, J.N.; Owusu, R.; Charmakar, S.; Manu, G.; Giessen, L. A global systematic review of forest management institutions: Towards a new research agenda. Landsc. Ecol. 2023, 38, 307–326. [Google Scholar] [CrossRef]
  5. Geist, H.J.; Lambin, E.F. Proximate Causes and Underlying Driving Forces of Tropical Deforestation. BioScience 2002, 52, 143. [Google Scholar] [CrossRef]
  6. Hansen, M.C.; Potapov, P.V.; Moore, R.; Hancher, M.; Turubanova, S.A.; Tyukavina, A.; Thau, D.; Stehman, S.V.; Goetz, S.J.; Loveland, T.R.; et al. High-Resolution Global Maps of 21st-Century Forest Cover Change. Science 2013, 342, 850–853. [Google Scholar] [CrossRef]
  7. The State of the World’s Forests 2024; FAO: Rome, Italy, 2024. [CrossRef]
  8. López-Carr, D.; Ryan, S.J.; Clark, M.L. Global Economic and Diet Transitions Drive Latin American and Caribbean Forest Change during the First Decade of the Century: A Multi-Scale Analysis of Socioeconomic, Demographic, and Environmental Drivers of Local Forest Cover Change. Land 2022, 11, 326. [Google Scholar] [CrossRef]
  9. Global Forest Resources Assessment 2020; FAO: Rome, Italy, 2020. [CrossRef]
  10. Masolele, R.N.; Marcos, D.; De Sy, V.; Abu, I.O.; Verbesselt, J.; Reiche, J.; Herold, M. Mapping the diversity of land uses following deforestation across Africa. Sci. Rep. 2024, 14, 1681. [Google Scholar] [CrossRef]
  11. Pacheco, P.; Mo, K.; Dudley, N. Deforestation Fronts Drivers and Responses in a Changing World; WWF: Gland, Switzerland, 2021. [Google Scholar]
  12. Chia, E.L.; Nsubuga, F.W.; Chirwa, P.W. Assessing the Enabling Conditions for Translating Restoration Commitments to Restoration Actions: Case of Cameroon. J. Sustain. Dev. 2022, 16, 77. [Google Scholar] [CrossRef]
  13. Piabuo, S.M. Community forest enterprises in Cameroon: Tensions, paradoxes and governance challenges. Environ. Dev. 2022, 44, 100762. [Google Scholar] [CrossRef]
  14. Mahmoud, M.I.; Campbell, M.J.; Sloan, S.; Alamgir, M.; Laurance, W.F. Land-cover change threatens tropical forests and biodiversity in the Littoral Region, Cameroon. Oryx 2020, 54, 882–891. [Google Scholar] [CrossRef]
  15. Adamson, D. The Golden Gift of Groundwater in Australia’s MDB; The University of Adelaide: Adelaide, Australia, 2021. [Google Scholar]
  16. Ewane, E.B. Forest Governance Effectiveness of Community-and Government-managed Forests in Cameroon. Int. J. Environ. Clim. Chang. 2022, 12, 83–102. [Google Scholar] [CrossRef]
  17. AJESH. AJESH Annual Report; UNO: Delhi, India, 2020. [Google Scholar]
  18. Ostrom, E. A General Framework for Analyzing Sustainability of Social-Ecological Systems. Science 2009, 325, 419–422. [Google Scholar] [CrossRef]
  19. Verhegghen, A.; Eva, H.; Desclée, B.; Achard, F. Review and Combination of Recent Remote Sensing Based Products for Forest Cover Change Assessments in Cameroon. Int. For. Rev. 2016, 18, 14–25. [Google Scholar] [CrossRef]
  20. Ojong, E.J. Local Inhabitants’ Opinion of Timber Logging on Livelihoods: The Case of Yabassi Sub-Division in Nkam Division of Cameroon. Int. J. Innov. Sci. Res. Technol. IJISRT 2024, 9, 2135–2141. [Google Scholar] [CrossRef]
  21. Stone, R.D.; Tchiengué, B.; Cheek, M. The endemic plant species of Ebo Forest, Littoral Region, Cameroon, with a new Critically Endangered cloud forest shrub, Memecylon ebo (Melastomataceae-Olisbeoideae). Kew Bull. 2024, 79, 867–879. [Google Scholar] [CrossRef]
  22. Ndongo, P.A.M.; Eyango, M.T.-T.; Tamesse, J.L.; Ewoukem, E.; Rabone, M.; Albrecht, C.; Missoup, A.D.; von Rintelen, K.; Clark, P.F.; Schubart, C.D.; et al. Discovery of two new populations of the rare endemic freshwater crab Louisea yabassi Mvogo Ndongo, von Rintelen & Cumberlidge, 2019 (Brachyura: Potamonautidae) from the Ebo Forest near Yabassi in Cameroon, Central Africa, with recommendations for conservation action. J. Threat. Taxa 2021, 13, 18551–18558. [Google Scholar] [CrossRef]
  23. Global Forest Watch; WRI: Washington, DC, USA, 2023.
  24. Owusu, R.; Kimengsi, J.N.; Giessen, L. Institutional Change and Compliance in Forest Landscape Restoration Governance: Insights from the Western Highlands of Cameroon. J. Land Use Sci. 2024, 19, 36–58. [Google Scholar] [CrossRef]
  25. Alvarez, M. Kupeantha yabassi (Coffeeae-Rubiaceae), a new Critically Endangered shrub species of the Ebo Forest area, Littoral Region, Cameroon. Kew Bull. 2021, 76, 735–743. [Google Scholar] [CrossRef]
  26. Shapiro, A.; Grantham, H.; Aguilar-Amuchastegui, N.; Murray, N.; Gond, V.; Bonfils, D.; Rickenbach, O. Forest condition in the Congo Basin for the assessment of ecosystem conservation status. Ecol. Indic. 2020, 122, 107268. [Google Scholar] [CrossRef]
  27. MINFOF. Joint Annual Report 2015; MINFOF: Limbe, Cameroon, 2015. [Google Scholar]
  28. Kimengsi, J.N.; Mukong, A.K.; Forje, G.W.; Giessen, L. Institutional change pathways and implications for forest resource use in the Bakossi landscape of Cameroon. J. Nat. Conserv. 2024, 78, 126567. [Google Scholar] [CrossRef]
  29. Foody, G.M. Status of land cover classification accuracy assessment. Remote Sens. Environ. 2002, 80, 185–201. [Google Scholar] [CrossRef]
  30. Harris, D.R.; Anthony, N.; Mir, M.; Delcher, C. geoPIPE: Geospatial Pipeline for Enhancing Open Data for Substance Use Disorders Research. AMIA Annu. Symp. Proc. 2022, 2022, 522–531. [Google Scholar] [PubMed]
  31. Lambin, E.F.; Geist, H.J.; Lepers, E. Dynamics of Land-Use and Land-Cover Change in Tropical Regions. Annu. Rev. Environ. Resour. 2003, 28, 205–241. [Google Scholar] [CrossRef]
  32. Ewane, E.B.; Deh-Nji, A.; Mfonkwet, N.Y.; Nkembi, L. Agricultural expansion and land use land cover changes in the Mount Bamboutos landscape, Western Cameroon: Implications for local land use planning and sustainable development. Int. J. Environ. Stud. 2023, 80, 186–206. [Google Scholar] [CrossRef]
  33. Ramachandra, T.V.; Negi, P.; Mondal, T.; Ahmed, S.A. Insights into the linkages of forest structure dynamics with ecosystem services. Sci. Rep. 2025, 15, 15606. [Google Scholar] [CrossRef]
  34. Nana, E.D.; Njabo, K.Y.; Tarla, F.N.; Tah, E.K.; Mavakala, K.; Iponga, D.M.; Demetrio, B.M.; Kinzonzi, L.; Embolo, L.E.; Mpouam, S. Putting conservation efforts in Central Africa on the right track for interventions that last. Conserv. Lett. 2022, 15, e12913. [Google Scholar] [CrossRef]
  35. Lambin, E.F.; Meyfroidt, P. Land use transitions: Socio-ecological feedback versus socio-economic change. Land Use Policy 2010, 27, 108–118. [Google Scholar] [CrossRef]
  36. Whytock, R.C.; Abwe, E.E.; Mfossa, D.M.; Ketchen, M.E.; Abwe, A.E.; Nguimdo, V.R.V.; Maisels, F.; Strindberg, S.; Morgan, B.J. Mammal distribution and trends in the threatened Ebo ‘intact forest landscape’, Cameroon. Glob. Ecol. Conserv. 2021, 31, e01833. [Google Scholar] [CrossRef]
  37. Olofsson, P.; Foody, G.M.; Herold, M.; Stehman, S.V.; Woodcock, C.E.; Wulder, M.A. Good practices for estimating area and assessing accuracy of land change. Remote Sens. Environ. 2014, 148, 42–57. [Google Scholar] [CrossRef]
  38. Ndoye, O.; Kaimowitz, D. Macro-economics, markets and the humid forests of Cameroon, 1967–1997. J. Mod. Afr. Stud. 2000, 38, 225–253. [Google Scholar] [CrossRef]
  39. Vermeulen, S.J.; Campbell, B.M.; Ingram, J.S.I. Climate Change and Food Systems. Annu. Rev. Environ. Resour. 2012, 37, 195–222. [Google Scholar] [CrossRef]
  40. Cerutti, E.; Hale, G.; Minoiu, C. Financial crises and the composition of cross-border lending. J. Int. Money Finance 2015, 52, 60–81. [Google Scholar] [CrossRef]
  41. Xie, X.; Peng, M.; Zhang, L.; Chen, M.; Li, J.; Tuo, Y. Assessing the Impacts of Climate and Land Use Change on Water Conservation in the Three-River Headstreams Region of China Based on the Integration of the InVEST Model and Machine Learning. Land 2024, 13, 352. [Google Scholar] [CrossRef]
  42. Cheng, S.; Zhao, Y.H.; Zhu, Y.T.; Ma, E. Optimizing the strength and ductility of fine structured 2024 Al alloy by nano-precipitation. Acta Mater. 2007, 55, 5822–5832. [Google Scholar] [CrossRef]
  43. Nitschke, C.R.; Innes, J.L. Interactions between fire, climate change and forest biodiversity. CABI Rev. 2007, 2006, 9. [Google Scholar] [CrossRef]
  44. Deb, J.C.; Phinn, S.; Butt, N.; McAlpine, C.A. Climate change impacts on tropical forests: Identifying risks for tropical Asia. J. Trop. For. Sci. 2018, 30, 182–194. [Google Scholar] [CrossRef]
  45. Gustafson, E.J.; Sturtevant, B.R. Modeling Forest Mortality Caused by Drought Stress: Implications for Climate Change. Ecosystems 2013, 16, 60–74. [Google Scholar] [CrossRef]
  46. Zhang, T.; Niinemets, Ü.; Sheffield, J.; Lichstein, J.W. Shifts in tree functional composition amplify the response of forest biomass to climate. Nature 2018, 556, 99–102. [Google Scholar] [CrossRef]
  47. Fearnside, P.M. Climate Change as a Threat to Brazil’s Amazon Forest. Int. J. Soc. Ecol. Sustain. Dev. 2013, 4, 1–12. [Google Scholar] [CrossRef]
  48. Cochrane, M.A.; Barber, C.P. Climate change, human land use and future fires in the Amazon. Glob. Change Biol. 2009, 15, 601–612. [Google Scholar] [CrossRef]
  49. Bele, M.Y.; Sonwa, D.J.; Tiani, A.-M. Adapting the Congo Basin forests management to climate change: Linkages among biodiversity, forest loss, and human well-being. For. Policy Econ. 2015, 50, 1–10. [Google Scholar] [CrossRef]
  50. Schure, J.; Ingram, V.; Sakho-Jimbira, M.S.; Levang, P.; Wiersum, K.F. Formalisation of charcoal value chains and livelihood outcomes in Central-and West Africa. Energy Sustain. Dev. 2013, 17, 95–105. [Google Scholar] [CrossRef]
Figure 1. Application of Ostrom’s social-ecological systems (SES) framework to the Yabassi Forest Area. Blue arrows indicate the interactions and feedback loops between SES components, external drivers, forest landscape mutation processes, and socio-ecological outcomes (developed based on [18]) [4].
Land 14 01644 g001
Figure 2. Study area map. Source: QGIS 3.28 (QGIS Development Team 2023).
Land 14 01644 g002
Figure 3. Supervised classification map of Yabassi 2004. Source: USGS Landsat 8; ground truthing (March–May 2024).
Land 14 01644 g003
Figure 4. Supervised classification map of Yabassi 2014. Source: USGS Landsat 8; ground truthing (March–May 2024).
Land 14 01644 g004
Figure 5. Supervised classification map of Yabassi, 2024. Source: USGS Landsat 8; ground truthing (March–May 2024).
Land 14 01644 g005
Figure 6. Drivers of FLSM. Source: field work 2025.
Land 14 01644 g006
Table 1. Community and village allocation with number of questionnaires.
CommunityVillage AllocationNumber of Questionnaires
EboIboti10
Bekob5
Logdeng18
NdokbouNdokbou I11
Ndokbou II8
MakombeMilombe11
Balam11
Moya26
Total: 100
Table 2. Accuracy assessment metrics for land cover classification in the Yabassi Forest Area for 2004, 2014, and 2024, including per-class producer and user accuracy, overall accuracy, kappa coefficient, and unclassified area percentage.
Land Cover Mutation Classes2004 Producer Accuracy (%)2004 User Accuracy (%)2014 Producer Accuracy (%)2014 User Accuracy (%)2024 Producer Accuracy (%)2024 User Accuracy (%)
Agriculture88.0073.1740.0050.0036.3672.73
Forest55.5655.5660.7158.6290.9045.45
Settlement60.0081.8275.0060.0080.0080.00
Water40.00100.0080.9573.91100.00100.00
Unclassified
Overall Accuracy (%)73.0260.4473.85
Kappa Coefficient (κ)0.540.460.65
Unclassified Area (%)41.8732.160.00
Land Cover Mutation Classes200420142024
Producer Accuracy (%)User Accuracy (%)Producer Accuracy (%)User Accuracy (%)Producer Accuracy (%)User Accuracy (%)
Agriculture88.0073.1740.0050.0036.3672.73
Forest55.5655.5660.7158.6290.9045.45
Settlement60.0081.8275.0060.0080.0080.00
Water40.00100.0080.9573.91100.00100.00
Unclassified------
Kappa Coefficient0.540.460.65
Overall Accuracy73.0260.4473.85
YearOverall Accuracy (%)Kappa Coefficient (κ)Unclassified Area (%)
200473.020.5441.87
201460.440.4632.16
202473.850.650.00
Table 3. Area (ha) and percentage coverage of LULC mutation classes for 2004.
LULC Mutation ClassesArea (ha)Percentage (%)
Agriculture104,486.68616433.84
Forest70,552.29126822.85
Settlement2892.8317750.94
Water1547.1673950.50
Unclassified129,286.1735941.87
Total308,765.15019100
Table 4. Area (ha) and percentage coverage of LULC mutation classes for 2014.
LULC Mutation ClassesArea (ha)Percentage (%)
Agriculture51,507.78654716.69
Forest143,953.317746.63
Settlement6346.5823012.06
Water7668.2686282.48
Unclassified99,287.73578832.16
Total308,763.690965100
Table 5. Area (ha) and percentage coverage of LULC mutation classes for 2024.
LULC Mutation ClassesArea (ha)Percentage (%)
Agriculture80,012.52076625.91
Forest211,982.27110168.65
Settlement9410.9356243.05
Water7369.1977452.39
Total308,774.925237100
Table 6. LULC mutation matrix of the Yabassi Forest Area showing the overall transition in land use classes from 2004 to 2014.
2014
2004LULC ClassesAgricultureForestSettlementWaterUnclassifiedTotal (ha)
Agriculture21,764.63908841,743.7328752356.4695932528.44019336,069.114439104,462.396188
Forest9156.90428835,165.752451260.3138621912.30147523,040.73183270,536.003907
Settlement547.3373631018.147443169.37973490.5979521067.0640012892.526493
Water238.13694728.11893842.16421118.90013419.3005331546.620751
Unclassified 19,789.47808465,267.656692515.9562453015.04593838,675.497044129,263.634001
Total (ha)51,496.495763103,923.4083966344.2836447665.28568899,271.707849268,701.18134
Table 7. LULC mutation matrix of the Yabassi Forest Area showing the overall transition in land use classes from 2014 to 2024.
2024
2014LULC ClassesAgricultureForestSettlementWaterUnclassifiedTotal (ha)
Agriculture14,779.65141734,087.0811912062.270619566.920719-51,495.923946
Forest29,299.318649108,596.3849532634.2782843397.778932-143,927.760818
Settlement1622.1252973833.065688749.099956139.990615-6344.281556
Water1849.3464894497.960899232.1944711085.906103-7665.407962
Unclassified 32,423.84559660,917.4679463759.3602432174.159415-99,274.8332
Total (ha)79,974.287448211,931.9606779437.2035737364.755784-268,708.207482
Table 8. Change analysis of key metrics over time.
LULC Class2004 Area (ha)2014 Area (ha)2024 Area (ha)% Change (2004–2014)% Change (2014–2024)% Change (2004–2024)
Agriculture104,462.4051,495.9279,974.29−50.72%+55.33%−23.46%
Forest70,536.00143,927.76211,931.96+104.01%+47.27%+151.28%
Settlement2892.536344.289437.20+119.47%+48.75%+226.43%
Water1546.627665.417364.76+396.00%−3.92%+376.20%
Unclassified129,263.6399,274.83N/A−23.23%N/AN/A
Table 9. Socio-ecological outcomes of forest landscape mutations in the Yabassi Forest Area (2004–2024).
DimensionPositive OutcomesNegative Outcomes
Ecological- Forest regeneration (30%)
- Biodiversity conservation (25%)
- Reforestation/afforestation interventions (18%)
- Emerging ecotourism opportunities (8%)
- Wildlife loss (75%)
- Hotter, drier local climate (52%)
- Decline in wood and medicinal plants (42%)
- Soil erosion and flooding (34%)
- Diminished water sources (14%)
- Other ecological stress (2%)
- Perceived decline in biodiversity (76%)
Social- Job opportunities (66%)
- Infrastructure development (66%)
- Improved access to land (32%)
- Better living standards (24%)
- Other social benefits, e.g., access to forest products and mobility (5%)
- Loss of traditional forest access (69%)
- Land conflicts (67%)
- Food and water shortages (23%)
- Decline in income from forest resources (14%)
- Migration due to worsening conditions (13%)
- Other social disruptions (2%)
Disclaimer/Publisher’s Note: The statements, opinions and data contained in all publications are solely those of the individual author(s) and contributor(s) and not of MDPI and/or the editor(s). MDPI and/or the editor(s) disclaim responsibility for any injury to people or property resulting from any ideas, methods, instructions or products referred to in the content.