Abstract
Developing artificial islands is considered to be an effective solution for land scarcity and economic growth in coastal regions. However, the construction and operation of artificial islands could generate significant carbon emissions, posing challenges for low-carbon transitions. In this study, Kau Yi Chau Artificial Islands are analyzed to explore low-carbon strategies tailored to artificial island development. A carbon emission accounting framework based on urban operational processes is established, and five scenarios are developed using the LEAP model: the Baseline Scenario (BAS), Low-Demand Scenario (S1), Regular Carbon Reduction Scenario (S2), Enhanced Carbon Reduction Scenario (S3), and Deepened Carbon Reduction Scenario (S4). Energy demand and carbon emissions are systematically assessed across sectors such as buildings, transportation, solid waste, and vegetation-based carbon sinks. The results indicate that, compared to the BAS, carbon emissions in the S1, S2, S3, and S4 scenarios are reduced by 19.5%, 20.8%, 41.9%, and 54.6%, respectively. S4 is identified as the optimal development pathway for the artificial islands. The carbon reduction contributions of different sectors are analyzed, and optimization measures are proposed, providing valuable insights for low-carbon planning in artificial islands development.
1. Introduction
With rapid economic development and urban expansion, many coastal regions worldwide have transformed into dense metropolitan hubs [1]. This rapid urbanization, coupled with rising population and resource demands, has intensified land scarcity [2]. In response, artificial island and land reclamation projects have emerged globally as strategic solutions to expand urban space. However, the construction and operation of such projects pose significant challenges in terms of carbon emissions, necessitating systematic planning to ensure that these new urban areas transition towards sustainable and low-carbon development models.
As one of the most densely populated regions in the world, Hong Kong has long struggled with land scarcity [3]. With a total land area of just 1114 square kilometers but home to over 7.5 million people, the city has an average population density exceeding 6900 people per square kilometer, making land availability a persistent challenge [4]. To address this challenge, the Hong Kong government proposed the development of the Kau Yi Chau Artificial Islands (KYCAI) as a flagship land reclamation project [5]. This initiative aims to implement smart, green, and low-carbon urban development strategies, serving as a demonstration of sustainable growth. However, its success depends on a comprehensive understanding of potential carbon emissions and the effectiveness of mitigation measures.
Regional carbon emissions have been widely studied across multiple sectors and spatial scales. Increasing attention is being given to how integrated energy transitions contribute to low-carbon urban development. Methodologically, bottom-up carbon accounting and scenario-based simulations are commonly used. The Long-range Energy Alternatives Planning (LEAP) model is particularly prominent [6], having been applied at national [7], provincial [8,9], municipal [10,11], and industrial park levels [12] to support regional decarbonization planning.
For carbon mitigation, existing studies focus on three main approaches. First, market-based tools such as carbon taxes [13,14], emissions trading systems [15,16], and renewable energy subsidies [17] are widely discussed. Second, technological options like CCUS [18,19], hydrogen energy [20,21], energy storage [22,23], bioenergy [24], and smart grids [25] are considered important for improving energy efficiency. Third, structural adjustments are suggested to reduce carbon intensity and support economic growth through industrial upgrading [26,27] and the expansion of the service sector [28,29].
While substantial research has addressed urban carbon emissions, low-carbon spatial planning, and emission reduction strategies in traditional urban contexts, studies focusing on artificial islands remain sparse. Most existing research related to artificial islands has concentrated on construction-stage emissions or the impacts on marine ecosystems [30,31]. Operational emissions have not been adequately addressed. The planning of infrastructure, energy systems, and transportation on artificial islands differs significantly from that of traditional urban areas. Emission interactions across sectors such as buildings, transportation, and residential activity remain insufficiently examined. Few studies have developed integrated models to simulate multi-sector emissions under different spatial planning strategies.
Given the research demand mentioned above, a carbon reduction pathway assessment is conducted for artificial islands under varying spatial development strategies. The KYCAI in Hong Kong are selected as the case study. Sectoral greenhouse gas emissions from buildings, transportation, solid waste, and vegetation-based carbon sinks are quantified during the operational phase. By comparing the emission reduction effects of each scenario, this study identifies the optimal pathway and sector-specific contributions. The findings are expected to provide a scientific basis for low-carbon planning in artificial island development.
2. Research Methodology
2.1. Model Framework
The KYCAI in Hong Kong is investigated through a bottom-up analysis of sectoral energy demand, based on 2023 activity levels. Multiple policy-driven scenarios are developed under carbon reduction constraints, integrating energy efficiency upgrades, structural adjustments in energy systems, and carbon sinks enhancement measures. Post-completion projections of energy consumption and emissions are assessed to identify optimized pathways for achieving carbon neutrality targets.
To establish the carbon emission accounting model framework, the accounting boundaries are first defined according to the specific characteristics of the study area. The KYCAI lacks traditional industrial systems and agricultural activities due to constraints from land reclamation and ecological conservation policies. Therefore, this study focuses on emissions arising from core urban operations, rather than full production-based accounting.
In alignment with IPCC (2019) guidelines and adapted to local urban conditions, emissions are classified into three operational sectors: building operations, transportation, and municipal solid waste management. The building sector includes residential and commercial building operations, primarily involving electricity, heating, and cooling demand. The transport sector comprises private vehicles, public transit, and logistics. The waste sector covers solid waste disposal, landfill, and recycling-related emissions. Additionally, vegetation-based carbon sinks are included to reflect the ecological character of the artificial islands. These are accounted for following urban ecology principles and integrated into the overall carbon balance. The framework is illustrated in Figure 1.
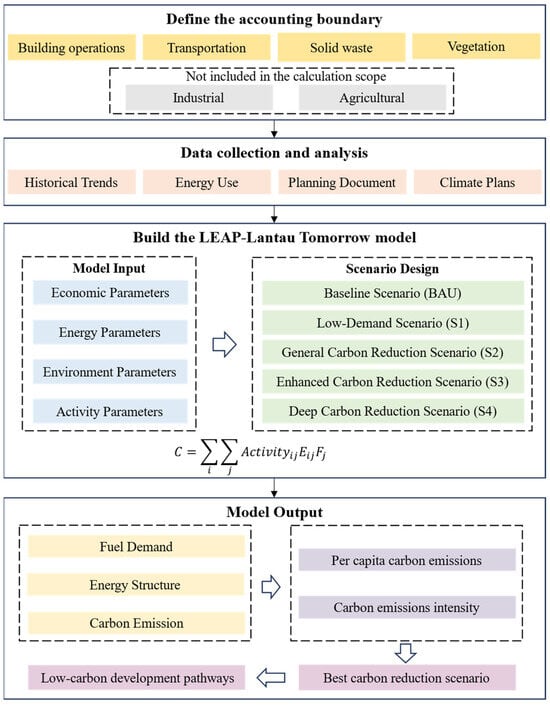
Figure 1.
Analysis framework of the research.
2.2. LEAP Model
The LEAP model, developed by the Stockholm Environment Institute, is a bottom-up modeling tool [32]. It employs scenario analysis to simulate energy demand and environmental impacts under different scenarios by adjusting parameter settings [33]. The carbon emission accounting framework using LEAP aggregates sectoral activity data with energy intensity to estimate energy demand. This estimated energy demand is subsequently used to calculate the total carbon emissions [34]. Due to its low initial data requirements and streamlined model structure, the LEAP model is widely applied in international studies on energy use and carbon emission assessments [35]. Its extensive carbon emission factor database and flexible modeling capabilities further enhance its applicability. Leveraging these advantages, the LEAP-KYCAI model is developed in this study to predict the future carbon emissions of the artificial islands.
- (1)
- Carbon Emission Calculation for the Building Sector
Carbon emissions from the building sector are typically categorized into two sectors: residential and commercial buildings. CO2 emissions from residential buildings are generally calculated based on household counts, as follows:
where represents the CO2 emissions from residential buildings; denotes the population of the artificial islands; is the average household size; is the average household energy consumption for energy type , and is the carbon emission factor for energy type .
Similarly, the CO2 emissions from commercial buildings are calculated based on building area using the following formula:
where represents the CO2 emissions from commercial buildings; is the total commercial building area; is the energy consumption per unit area for energy type ; and is the carbon emission factor for energy type .
- (2)
- Carbon Emission Calculation for the Transportation Sector
The calculation of CO2 emissions from the transportation sector is calculated by incorporating transport activity levels and fuel efficiency parameters. The emissions are quantified using the following formula:
where represents the CO2 emissions from the transportation sector; denotes the number of vehicles; is the average mileage per vehicle; represents the fuel efficiency level of the vehicle; and is the carbon emission factor for fuel type .
- (3)
- Carbon Emission Calculation for Solid Waste
CO2 emissions from waste disposal are quantified based on the total waste generation volume. In Hong Kong, landfilling dominates waste management, with greenhouse gas emissions primarily originating from methane (CH4). These emissions are converted to CO2-equivalent values using a conversion factor. The calculation is formulated as follows:
where represents the CO2 emissions from waste disposal; denotes per capita waste generation; is the waste recycling rate; is the carbon emission factor for waste treatment; and is the methane-to-CO2 conversion coefficient.
- (4)
- Carbon Sink Calculation
The estimation of carbon sink is primarily based on the vegetation coverage area. In urban areas of Hong Kong, the main types of vegetation include trees, shrubs, and grasslands. The carbon sink capacity is quantified using the following formula:
where represents the carbon sink capacity; denotes the area of vegetation type ; corresponds to the carbon sink coefficient for vegetation type .
2.3. Data Sources
This study predicts and analyzes the carbon emissions of the KYCAI upon completion, based on Hong Kong’s 2023 energy efficiency benchmarks. The research utilizes primary data from authoritative sources, including the Hong Kong Annual Digest of Statistics [36], Hong Kong Energy End-use Data [37], and the Guidelines for Greenhouse Gas Emission Accounting and Removals from Buildings in Hong Kong [38]. The fossil fuel emission factors applied in the model are sourced from the IPCC default values embedded in the LEAP framework. These data sources form the basis of the Baseline Scenario (BAS), which reflects the expected carbon performance if current technologies and behaviors continue without further intervention.
2.4. Scenario Design
In addition to the Baseline Scenario (BAS), four scenarios are proposed: the Low-Demand Scenario (S1), the Regular Carbon Reduction Scenario (S2), the Enhanced Carbon Reduction Scenario (S3), and the Deepened Carbon Reduction Scenario (S4). These scenarios evaluate potential emission outcomes under varying levels of policy ambition and technological adoption. Parameter settings for key sectors such as buildings, transportation, solid waste, and vegetation are guided by the strategic targets in the Hong Kong Clean Air Plan 2035 [39] and the Hong Kong Climate Action Plan 2050 [40]. The scenarios are constructed by translating official targets into concrete modeling parameters, considering different assumptions about policy enforcement, technological deployment, and behavioral transformation. The four scenarios represent progressively ambitious carbon reduction pathways, ranging from moderate mitigation with limited behavioral changes to rapid decarbonization driven by strong policies, advanced technologies, and widespread demand-side transformation. Scenario descriptions, parameter configurations, and implementation measures are systematically outlined in Table 1.

Table 1.
Scenario description and key parameter settings.
- (1)
- Baseline Scenario (BAS)
In this scenario, the energy consumption benchmarks for residential and commercial buildings in the study area are standardized to align with Hong Kong’s 2023 energy efficiency standards. The share of new energy vehicles (NEVs) in the total vehicle fleet is set to match the current NEVs registration rate in Hong Kong, which is approximately 8.6%. The greenery coverage within the study area is assumed to be the same as that of urban Hong Kong: around 20%. Furthermore, per capita solid waste generation is fixed at 1.51 kg/person/day, consistent with Hong Kong’s official waste management statistics from 2023.
- (2)
- Low-Demand Scenario (S1)
Building on the BAS scenario, priority is given to transforming the building and transportation sectors. The widespread adoption of ultra-low-energy buildings and near-zero-energy buildings is advocated. Ultra-low-energy buildings are regarded as a preliminary stage of near-zero-energy buildings. They maintain equivalent indoor environmental parameters but exhibit slightly lower energy efficiency. Typically, they achieve over a 50% reduction in energy consumption compared to national and industry benchmarks. Near-zero-energy buildings achieve up to a 75% reduction in energy consumption. Meanwhile, under this scenario, the deployment of charging infrastructure is accelerated to substantially increase the adoption rate of NEVs.
- (3)
- Regular Carbon Reduction Scenario (S2)
Based on the S1 scenario, a solid waste charging scheme is implemented according to the “polluter pays” principle. Fees are levied according to the weight of waste produced. This approach incentivizes waste reduction and recycling by individuals and industries. As a result, per capita solid waste disposal is effectively reduced. Additionally, greenery coverage on the artificial islands is enhanced by adopting mixed planting of trees and shrubs (MPTS). This method combines trees and shrubs into a complementary vertical structure. It optimizes light and land use while improving ecological functions and carbon sink capacity. Rooftop greening is also promoted to further enhance the urban environment.
- (4)
- Enhanced Carbon Reduction Scenario (S3)
Building on the S2 scenario, this scenario accelerates the adoption of ultra-low energy and near-zero-energy buildings. While promoting NEV adoption through expanded charging infrastructure, the scenario aims to increase market penetration. Additionally, stricter waste disposal and recycling regulations are implemented to improve compliance rates. The scenario also strengthens the islands’ carbon sink capacity through large-scale afforestation initiatives.
- (5)
- Deepened Carbon Reduction Scenario (S4)
As the most comprehensive scenario, S4 strengthens carbon reduction efforts across all sectors, including buildings, transportation, and waste management. It significantly enhances greenery coverage throughout the artificial islands, increases the proportion of mixed planting of trees and shrubs (MPTS) within green areas, and optimizes rooftop designs to widely implement green roofs.
3. Results
3.1. Analysis of Energy Demand
The projected energy demand for the KYCAI across multiple scenarios is presented in Figure 2. As energy-saving and carbon reduction measures are progressively implemented, the forecasted energy demand exhibits a downward trend. In the BAS, where no additional green/carbon reduction measures are introduced, the energy demand is estimated at 1574.1 kilotons. In the S1 scenario, the introduction of ultra-low-energy and near-zero-energy buildings, as well as the promotion of electric vehicles, results in a decrease in energy demand. The most significant reduction is observed in electricity consumption. The S2 scenario incorporates waste reduction, recycling enhancement, and carbon sequestration initiatives. However, these non-energy-sector measures yield minimal impact on energy demand levels, resulting in outcomes comparable to those of the S1 scenario. In the S3 scenario, additional energy-saving and carbon reduction measures lead to a reduction in energy demand to 1093.6 kilotons. This represents a 30.5% decrease compared to the BAS. In the S4 scenario, a comprehensive decarbonization strategy leads to a further reduction in energy demand, lowering it to 765.1 kilotons. This represents a 42.8% decrease compared to the BAS, highlighting the significant impact of deep decarbonization measures.
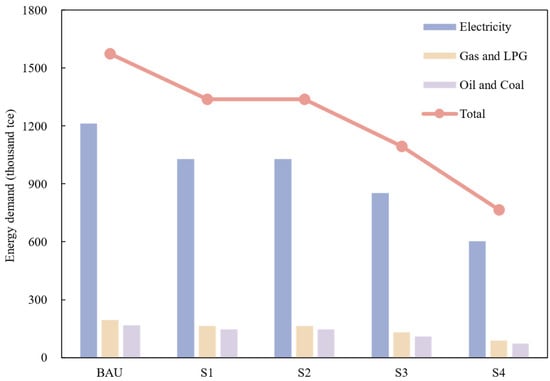
Figure 2.
Energy demand under different scenarios.
The sectoral energy demand under different scenarios is shown in Figure 3. Commercial buildings consistently account for the largest share of total energy consumption, highlighting a dominant role in the energy landscape. Specifically, the proportion of energy attributed to commercial buildings in the BAS, S1, S2, S3, and S4 scenarios is 78.1%, 77.1%, 77.1%, 76.4%, and 73.9%, respectively. This trend demonstrates that the increasing adoption of ultra-low-energy and near-zero-energy buildings in the planning of the KYCAI directly correlates with a gradual decline in commercial building energy demand. Consequently, the proportion of total energy consumption attributed to commercial buildings decreases slightly, underscoring the critical role of high-efficiency building systems and technologies in optimizing energy use patterns. Such improvements not only reduce overall energy consumption but also contribute to a more balanced and sustainable energy demand structure.
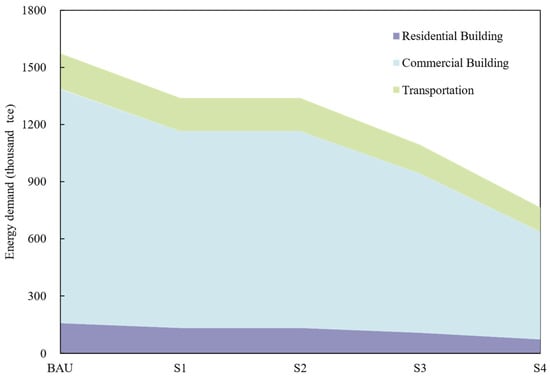
Figure 3.
Sectoral energy demand in different scenarios.
The sectoral energy demand under different scenarios is presented in Figure 4. In the BAS, transportation energy demand is dominated by petroleum and coal products, accounting for 82.7% of total sectoral consumption. However, as EV adoption progresses on the KYCAI, the dependence on fossil fuels demonstrates a steady decline, reflecting the transition towards low-carbon-mobility solutions. In the S4 scenario, this proportion drops significantly to 53.3%, underscoring the transformative impact of EV adoption on energy structural optimization. Concurrently, buildings exhibit a pronounced dependence on electricity. In residential buildings, electricity accounts for approximately 71.1% of total energy consumption, while in commercial buildings, it represents as much as 89.0%. This result is consistent with Ortiz-Peña et al. [41], indicating that electricity consumption dominates the energy usage profile during the building operational phase. This dominance highlights electricity’s central role in building energy systems, necessitating further integration of renewable energy sources to decarbonize the grid.
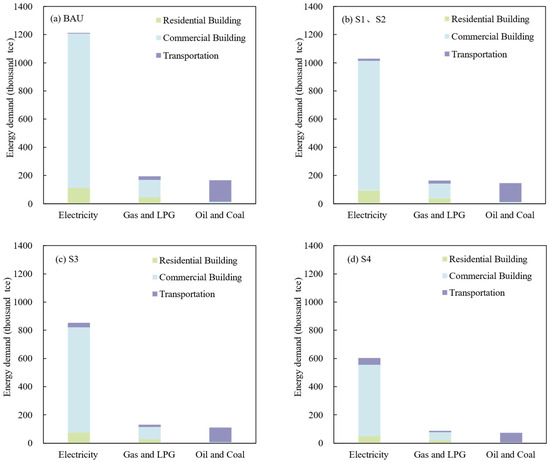
Figure 4.
Sectoral energy mix under different scenarios.
3.2. Analysis of Carbon Source
The carbon emissions under different scenarios are presented in Figure 5, showing a consistent downward trend in line with the reduction in energy demand. As energy-saving and carbon reduction measures are progressively implemented, total carbon emissions decrease from 3725.3 kilotons in the BAS to 1691.8 kilotons in the S4 scenario. While these integrated actions achieve significant emission reductions, they fall short of carbon neutrality, underscoring the necessity for enhanced cross-sector coordination and additional technological or policy innovations to fully realize net-zero emissions.
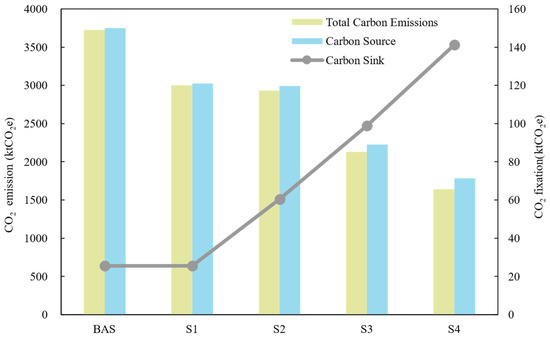
Figure 5.
Carbon emission under different scenarios.
As illustrated in Figure 6, electricity consumption remains the dominant source of emissions, accounting for 85.2% of total carbon emissions in the S4 scenario. This highlights the critical role of the power sector in achieving carbon reduction. This result aligns with Zhang and Luo [42], indicating that both independent measures on the energy consumption side and coordinated actions on the supply side are essential for achieving the zero-carbon target. To mitigate emissions from electricity generation, prioritizing grid decarbonization via renewable energy integration and carbon capture and storage becomes imperative.
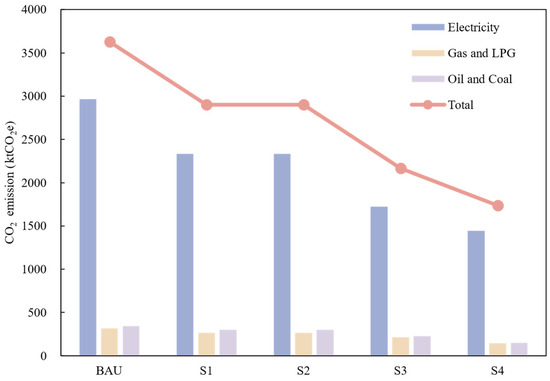
Figure 6.
Carbon emissions by energy carrier under different scenarios.
3.3. Analysis of Carbon Sink
The carbon sink levels under different scenarios are shown in Figure 7. The results indicate that MPTS exhibits a significant advantage in terms of carbon sink, with a carbon sink capacity several times higher than that of grasslands. This result echoes the findings of Warner et al. [42], which also demonstrated that mixed planting is superior to monocultures in carbon storage. This study further validates the conclusion in the context of regional carbon reduction pathways. This necessitates prioritizing mixed plantings in urban greening designs to maximize carbon sink potential. Such strategies not only enhance urban ecological resilience but also mitigate the urban heat island effect, thereby improving residents’ quality of life. The contribution of rooftop greening to urban carbon sink remains relatively limited, primarily due to two constraints. First, building load capacities and construction limitations restrict rooftop greening to low-growing, shallow-rooted plants, which exhibit significantly lower carbon sequestration efficiency per unit area compared to deep-rooted vegetation. Second, rooftop greening areas remain substantially smaller than traditional carbon sink systems, such as ground-level parks and wetland reserves, due to spatial limitations. Consequently, the overall carbon sequestration effectiveness of rooftop greening is constrained. This result contrasts with the conclusions drawn by Nadeeshani et al. [43], who reported that green roofs have significant carbon reduction potential over the entire building lifecycle. This discrepancy may be due to this study considering only the carbon sequestration effect of green roofs through plant photosynthesis, without accounting for the role in reducing heat transfer and subsequently lowering building energy demand.
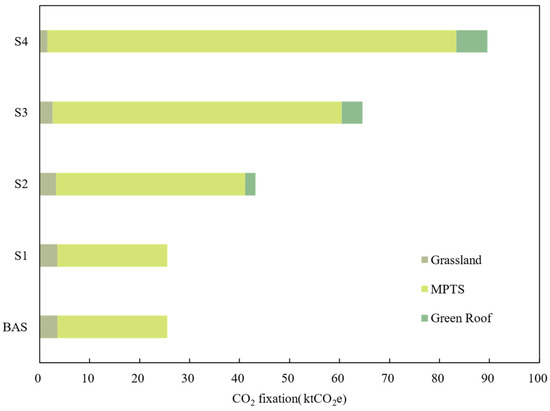
Figure 7.
Carbon sink under different scenarios.
3.4. Analysis of Emission Reduction Effects in Key Sectors
The masterplan specifies that upon full completion, the KYCAI is expected to accommodate approximately 500,000 permanent residents and generate an annual economic output of approximately HKD 200 billion [44]. With respect to environmental sustainability, Table 2 consolidates and presents both the anticipated per capita carbon emissions and the corresponding carbon emission intensity under different scenarios. To assess the islands’ carbon emissions, this study compares these indicators with the carbon intensity constraints and per capita carbon emission targets set by the Hong Kong Climate Action Plan 2030+ [45]. The results indicate that under the S4 scenario, the islands’ carbon emissions meet the baseline requirements of the policy targets. Therefore, the S4 scenario is selected as a case study to further examine the contributions of various emission reduction measures in lowering carbon emissions.
Table 2.
Emissions per capita and intensity of carbon emissions under different scenarios.
As illustrated in Figure 8, carbon mitigation measures under the S4 scenario exhibit varying degrees of effectiveness on the artificial islands. The building sector is identified as the predominant emission contributor, thereby achieving the most significant mitigation impact. A relatively low contribution rate is observed in the transportation sector, driven by two structural constraints. First, vehicle ownership is naturally restricted by the KYCAI’s geographical limitations. Second, the decarbonization of the current power grid remains incomplete, thereby diminishing the projected emission reduction advantages of electric vehicle adoption. Hong Kong’s waste management system remains predominantly dependent on landfilling practices. Within the BAS, waste decomposition emissions on the artificial islands account for merely 3.3% of total emissions, indicating minimal mitigation potential due to this low baseline. Regarding urban vegetation planning, vegetation planning priorities must be strategically balanced between biodiversity preservation and carbon sequestration efficiency under green space constraints, rather than prioritizing high-sequestration species exclusively. Consequently, even with optimized carbon sink strategies, sequestration capacity remains subject to multi-dimensional operational limitations.
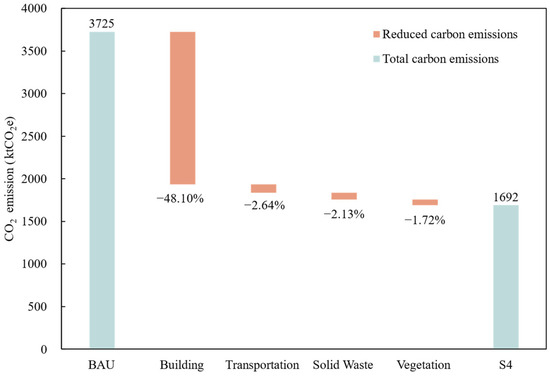
Figure 8.
Sectoral contributions to carbon reduction under the S4 scenario.
4. Discussion
4.1. Low-Carbon Development Pathways
Achieving low-carbon development on artificial islands requires coordinated efforts in energy efficiency, clean transportation, waste management, urban greening, local renewable energy, and marine carbon sinks.
- (1)
- Optimizing Energy Efficiency in Commercial Buildings.
Mitigation efforts in the building sector should prioritize commercial buildings, where energy consumption primarily relies on grid electricity, with minimal direct utilization of coal or petroleum-based fuels. Building design optimization, particularly through passive energy-saving technologies, enables significant operational energy reduction without compromising indoor environmental comfort [46]. These strategies include the application of high-performance thermal insulation materials in building envelopes, the implementation of rationally designed daylighting and ventilation systems, and the integration of rooftop photovoltaic systems [47,48]. When combined with flexible energy management mechanisms such as demand-response systems, these measures enhance operational energy efficiency, thereby establishing a technical foundation for the near-zero carbon transition in the building sector [49].
- (2)
- Advancing Low-Carbon Transition in Transportation Systems.
Enhancing the adoption rate of NEVs should be prioritized as a core strategy for establishing sustainable transportation systems. In the private vehicle sector, the transition to electric vehicles must be accelerated through purchase subsidies and usage-based incentive policies to promote fleet renewal [50]. For public service applications, hydrogen fuel cell vehicles are recommended as the primary solution to address high-frequency, long-distance operational requirements [51]. Charging and hydrogen refueling infrastructure must be expanded in parallel, enhancing accessibility to ensure proportional growth in clean vehicle utilization. This integrated approach will facilitate the transition toward a transportation framework dominated by clean energy vehicles.
- (3)
- Implementing Integrated Waste Management Solutions.
A waste management system integrating source reduction, classified recycling, and waste-to-energy conversion should be established [52]. Waste generation per capita can be effectively curbed through the implementation of a pay-as-you-throw pricing mechanism, while smart sorting facilities are recommended to enhance material recovery rates. Meanwhile, advanced treatment facilities should be constructed to minimize landfill dependency, thereby reducing carbon emissions from waste processing [53,54]. This comprehensive strategy facilitates the transition of the artificial island’s solid waste management toward a circular economy framework.
- (4)
- Developing Eco-Friendly Greening Systems.
Urban greening planning should be strategically designed to balance ecological effectiveness and implementation feasibility. MPTS should be prioritized to enhance carbon sink efficiency per unit area. In high-density construction zones, three-dimensional greening approaches such as rooftop vegetation systems must be implemented to expand green coverage, thereby improving the artificial island’s overall greening ratio [55].
- (5)
- Enhancing Local Renewable Supply and Marine Carbon Sinks
Achieving zero-carbon development requires not only demand-side reductions but also systematic transformation of the energy supply system. Despite progress under the S4 scenario, electricity demand on the islands is primarily met through externally supplied power. To enable local decarbonized supply, abundant marine, solar, and wind resources should be strategically harnessed through large-scale deployment of offshore wind turbines, rooftop photovoltaic systems, and tidal energy technologies [56]. In parallel, the marine ecological assets surrounding the artificial islands present significant potential for carbon sequestration. Marine ecological protection and biodiversity conservation should be prioritized in island planning. Additionally, mariculture systems could be integrated to enhance CO2 absorption through seawater and marine organisms [57], contributing to a blue carbon strategy that supplements traditional carbon sinks and supports the island’s carbon neutrality targets.
4.2. Policy and Cost Considerations
The S4 scenario achieves the highest emission reductions by integrating advanced technologies and comprehensive strategies, but it also requires substantial upfront investments, especially in building ultra-low-energy buildings and expanding NEV infrastructure. Constructing ultra-low-energy buildings significantly contributes to emission reductions, but also entails higher capital costs. According to Li et al. [58], each additional level of green building certification increases construction costs by approximately SGD 25.37 per square meter. These increased expenditures may pose challenges for project developers, particularly in large-scale projects like the Kau Yi Chau Artificial Islands. Similarly, expanding NEV charging infrastructure requires considerable investment in equipment, grid capacity, and long-term maintenance, which may further strain project budgets [59,60]. In comparison, improving solid waste management and increasing vegetation-based carbon sinks incur relatively low costs but, as shown in Figure 8, have limited emission reduction effects. This suggests that while basic improvements in low-cost sectors should not be neglected, the bulk of investment should be directed toward high-impact interventions. Existing policy frameworks like Hong Kong’s Climate Action Plan 2050 offer a solid foundation for this approach, but clearer cost–benefit guidelines and stronger cross-sectoral coordination are needed to guide implementation effectively.
4.3. Contribution to the Field
Compared to the majority of existing carbon mitigation studies that primarily focus on conventional terrestrial urban environments [61,62], this study specifically addresses the distinctive land use planning, energy supply challenges, and marine ecological contexts inherent to artificial islands. Unlike previous investigations that concentrate on single sectors such as building energy consumption or transportation emissions [63,64], this study integrates a comprehensive suite of mitigation strategies encompassing buildings, transportation, solid waste management, and urban greening, thereby providing a more holistic framework for carbon emission assessment.
In terms of methodology, this study develops a LEAP model tailored to the energy supply and demand characteristics of artificial islands, enabling detailed scenario analysis of energy consumption and carbon emissions. Unlike previous studies that commonly used Computable General Equilibrium (CGE) models to assess economy-wide carbon reduction impacts [65,66], this study adopts a scenario-based LEAP model tailored to the specific energy demand and supply conditions of artificial islands. While CGE models are useful for analyzing macroeconomic effects, they often lack spatial and sectoral resolution, making them less suitable for capturing the localized energy structure and spatial planning characteristics of artificial islands. In contrast, this study systematically integrates strategies across multiple domains such as buildings, transportation, and solid waste into a replicable and scalable framework. This comprehensive approach offers practical insights for future offshore urban developments and large-scale reclamation projects.
4.4. Limitations and Future Research Directions
This study has several limitations that require further refinement. First, the emission estimations are based on a set of scenario assumptions, such as the future energy mix, transportation mode shifts, and building performance levels. While these assumptions are informed by policy targets and best practices, they remain subject to future policy changes, technological uncertainties, and behavioral variations, which may influence actual carbon outcomes. Second, because the artificial island project is still in the planning stage, much of the data in areas such as building energy consumption, transportation demand, and waste generation was estimated using reference values from comparable cities and regional averages. These assumptions may lead to discrepancies when compared to the actual conditions that will emerge with regard to the KYCAI in the future. Third, the study focuses on operational-phase emissions and does not fully quantify embodied carbon in construction materials and infrastructure, which may constitute a significant portion of life cycle emissions. Although these emissions were qualitatively discussed, a full life cycle assessment (LCA) was beyond the scope of this research.
Future studies could address these limitations by incorporating dynamic scenario models that reflect a wider range of policy and behavioral trajectories, utilizing real-time data once the project progresses, and conducting full-scale LCA to capture embodied emissions. Integrating stakeholder feedback and high-resolution simulation tools would also help enhance the accuracy and robustness of carbon assessments for artificial islands in the long term.
5. Conclusions
Artificial islands present an essential solution to the challenge of coastal land scarcity and must adhere to low-carbon development principles in line with carbon neutrality goals. This study proposed a comprehensive carbon emission accounting framework and utilized the LEAP model to simulate future energy consumption and emissions during the operation phase. The results indicate that commercial buildings are the primary drivers of energy demand, with electricity being the dominant energy source. This underscores the critical role of expanding renewable energy and deploying carbon capture, utilization, and storage (CCUS) technologies. Among all sectors, the building sector contributes the most to emission reductions, emphasizing the importance of improving energy efficiency and increasing the share of clean energy within buildings. While transportation, waste management, and vegetation carbon sinks account for a smaller share of the overall emission reduction potential, they remain integral to the ecological and environmental sustainability of artificial islands. Overall, this research establishes a methodological framework for carbon emission forecasting and mitigation specific to artificial islands, with a focus on urban operational processes. It contributes to the theoretical advancement of regional carbon emission studies and offers practical guidance for low-carbon development in coastal megaprojects.
Author Contributions
Conceptualization, Z.W. and K.X.; validation, Y.T. and Y.Z.; formal analysis, X.L.; data curation, F.C.; writing—original draft preparation, X.L.; writing—review and editing, Z.W. and M.Z.; supervision, Y.L.; project administration, X.C. All authors have read and agreed to the published version of the manuscript.
Funding
The Science and technology research project of China State Construction International Holdings Limited (No. CSCI-2023-Z-1).
Data Availability Statement
The raw data supporting the conclusions of this article will be made available by the authors on request.
Acknowledgments
The authors would like to thank the anonymous reviewers for their constrictive comments.
Conflicts of Interest
Authors Ming Zhang, Foci Chen and Yunzhe Tong were employed by the company China State Construction Engineering (Hong Kong). The remaining authors declare that the research was conducted in the absence of any commercial or financial relationships that could be construed as a potential conflict of interest.
References
- Cheng, J.; Chen, M.; Tang, S. Shenzhen—A typical benchmark of Chinese rapid urbanization miracle. Cities 2023, 140, 104421. [Google Scholar] [CrossRef]
- Weber, C.; Puissant, A. Urbanization pressure and modeling of urban growth: Example of the Tunis Metropolitan Area. Remote Sens. Environ. 2003, 86, 341–352. [Google Scholar] [CrossRef]
- Zhou, Y.S.; Zheng, Z.H.; Wu, Z.F.; Guo, C.; Chen, Y.B. Construction and evaluation of ecological networks in highly urbanised regions: A case study of the Guangdong-Hong Kong-Macao greater Bay Area, China. Ecol. Indic. 2023, 152, 110336. [Google Scholar] [CrossRef]
- Hong Kong Special Administrative Region. Hong Kong Overview. Available online: https://www.gov.hk/tc/about/abouthk/facts.htm (accessed on 20 June 2024).
- Development Bureau Hong Kong Special Administrative Region. Strategic Positioning, Planning Objectives and Highlights. Available online: https://www.centralwaters.hk/en/strategic-positioning-planning-objectives-highlights/ (accessed on 17 June 2024).
- Feng, D.W.; Gao, X.Y.; Yang, Y.; Feng, S.R.; Yang, X.H.; Yan, J.Y. Pathways for carbon emission prediction and mitigation of sustainable industrial parks: A LEAP model application. Int. J. Green Energy 2024, 22, 1135–1150. [Google Scholar] [CrossRef]
- Song, T.; Zou, X.L.; Wang, N.; Zhang, D.Y.; Zhao, Y.X.; Wang, E. Prediction of China’s Carbon Peak Attainment Pathway from Both Production-Side and Consumption-Side Perspectives. Sustainability 2023, 15, 4844. [Google Scholar] [CrossRef]
- Ming, X.X.; Wang, Q.; Luo, K.; Zhang, L.J.; Fan, J.R. An integrated economic, energy, and environmental analysis to optimize evaluation of carbon reduction strategies at the regional level: A case study in Zhejiang, China. J. Environ. Manag. 2024, 351, 119742. [Google Scholar] [CrossRef]
- Miao, A.K.; Yuan, Y.; Wu, H.; Ma, X.; Shao, C.Y.; Xiang, S. Pathway for China’s provincial carbon emission peak: A case study of the Jiangsu Province. Energy 2024, 298, 131417. [Google Scholar] [CrossRef]
- Wang, J.J.; Li, Y.; Zhang, Y. Research on Carbon Emissions of Road Traffic in Chengdu City Based on a LEAP Model. Sustainability 2022, 14, 5625. [Google Scholar] [CrossRef]
- Liu, Y.Y.; Chen, S.; Jiang, K.J.; Kaghembega, W.S.H. The gaps and pathways to carbon neutrality for different type cities in China. Energy 2022, 244, 122596. [Google Scholar] [CrossRef]
- Yuan, Y.; Wang, F.F.; Sun, L.; Liu, W.C.; Du, C.L.; Wang, C.Y.; Yao, Y. Promote the decarbonization pathways of eco-industrial parks by considering their CO2 emissions structures and characters. J. Clean. Prod. 2024, 450, 141989. [Google Scholar] [CrossRef]
- Zhou, D.Q.; An, Y.F.; Zha, D.L.; Wu, F.; Wang, Q.W. Would an increasing block carbon tax be better? A comparative study within the Stackelberg Game framework. J. Environ. Manag. 2019, 235, 328–341. [Google Scholar] [CrossRef]
- Zhou, Y.X.; Fang, W.S.; Li, M.J.; Liu, W.L. Exploring the impacts of a low-carbon policy instrument: A case of carbon tax on transportation in China. Resour. Conserv. Recycl. 2018, 139, 307–314. [Google Scholar] [CrossRef]
- Zhang, Y.F.; Li, S.; Luo, T.Y.; Gao, J. The effect of emission trading policy on carbon emission reduction: Evidence from an integrated study of pilot regions in China. J. Clean. Prod. 2020, 265, 121843. [Google Scholar] [CrossRef]
- Hao, J.H.; Ye, X.L.; Yu, C.F.; Liu, J.Y.; Ruan, Y.M.; Zhang, Y.X.; Hong, F.; Zhang, D.Y. A Novel Individual Carbon Emission Evaluation and Carbon Trading Model for Low-Carbon University Campuses. Sustainability 2023, 15, 15928. [Google Scholar] [CrossRef]
- He, Y.; Guo, S.; Dong, P.X.; Huang, J.; Zhou, J.X. Hierarchical optimization of policy and design for standalone hybrid power systems considering lifecycle carbon reduction subsidy. Energy 2023, 262, 125454. [Google Scholar] [CrossRef]
- Dong, C.G.; Jiang, J.J.; Ye, B.; Xia, C.Y.; Zhang, Y.A. LCA-based cost-benefit assessment and carbon footprint accounting of CCUS technologies in China. J. Clean. Prod. 2025, 486, 144557. [Google Scholar] [CrossRef]
- Li, M.X.; He, N.P.; Xu, L.; Peng, C.H.; Chen, H.; Yu, G.R. Eco-CCUS: A cost-effective pathway towards carbon neutrality in China. Renew. Sustain. Energy Rev. 2023, 183, 113512. [Google Scholar] [CrossRef]
- Ran, L.; Mao, Y.L.; Yuan, T.J.; Li, G.F. Low-Carbon Transition Pathway Planning of Regional Power Systems with Electricity-Hydrogen Synergy. Energies 2022, 15, 8764. [Google Scholar] [CrossRef]
- Lee, H.; Ahn, J.; Choi, D.G.; Park, S.Y. Analysis of the role of hydrogen energy in achieving carbon neutrality by 2050: A case study of the Republic of Korea. Energy 2024, 304, 132023. [Google Scholar] [CrossRef]
- Li, J.Y.; Huang, X.M.; Zhao, Y.X. Research on the evolution of supervision strategy of renewable energy plus energy storage under China’s carbon peaking and carbon neutrality goal. Environ. Sci. Pollut. Res. 2023, 30, 69221–69240. [Google Scholar] [CrossRef]
- Dong, H.Y.; Fu, Y.B.; Jia, Q.Q.; Zhang, T.; Meng, D.Q. Low carbon optimization of integrated energy microgrid based on life cycle analysis method and multi time scale energy storage. Renew. Energy 2023, 206, 60–71. [Google Scholar] [CrossRef]
- Peng, L.; Zhang, Q.; He, K. Emissions Inventory of Atmospheric Pollutants from Open Burning of Crop Residues in China based on a National Questionnaire. Res. Environ. Sci. 2016, 29, 1109–1118. [Google Scholar]
- Fu, H.; Shi, Y.Y.; Zeng, Y.C. Estimating Smart Grid’s Carbon Emission Reduction Potential in China’s Manufacturing Industry Based on Decomposition Analysis. Front. Energy Res. 2021, 9, 681244. [Google Scholar] [CrossRef]
- Miao, H.H.; Quan, Q.S.; Yang, M. Study on the Regional Carbon Emissions Reduction Effect of Green Manufacturing-A Policy Experiment Based on the Construction of Green Parks in China. Sustainability 2025, 17, 1527. [Google Scholar] [CrossRef]
- Ijaz, T.; Qazalbash, A.H.R.; Razzaq, A.A.; Rafique, M.Z.; Khan, M.A.; Jamshaid, S.H. Development of green manufacturing implementation framework based on life-cycle assessment. Sustain. Environ. Res. 2024, 34, 23. [Google Scholar] [CrossRef]
- Liu, X.; Lin, J.; Hu, J.F.; Lu, H.; Cai, J.R. Economic Transition, Technology Change, and Energy Consumption in China: A Provincial-Level Analysis. Energies 2019, 12, 2581. [Google Scholar] [CrossRef]
- He, J.J.; Zhang, P.Y. Evaluating the Coordination of Industrial-Economic Development Based on Anthropogenic Carbon Emissions in Henan Province, China. Int. J. Environ. Res. Public Health 2018, 15, 1815. [Google Scholar] [CrossRef]
- Lin, M.; Wang, R.K.; Lin, W. Artificial Island Construction Using Large Steel Cylinders. Struct. Eng. Int. 2020, 30, 484–492. [Google Scholar] [CrossRef]
- Wang, N.; Yan, H.K.; Liu, Z.B.; Tong, S.Q.; Yu, T.L.; Liang, C. Effects of Different Layout Schemes on the Marine Environment of the Dalian Offshore Reclaimed Airport Island. J. Environ. Eng. 2013, 139, 438–449. [Google Scholar] [CrossRef]
- Li, M.; Zhang, Y.F.; Liu, H.C. Carbon Neutrality in Shanxi Province: Scenario Simulation Based on LEAP and CA-Markov Models. Sustainability 2022, 14, 13808. [Google Scholar] [CrossRef]
- Huang, Y.M.; Wang, Y.; Peng, J.T.; Li, F.; Zhu, L.; Zhao, H.H.; Shi, R. Can China achieve its 2030 and 2060 CO2 commitments? Scenario analysis based on the integration of LEAP model with LMDI decomposition. Sci. Total Environ. 2023, 888, 164151. [Google Scholar] [CrossRef] [PubMed]
- Li, Z.; Cai, Y.P.; Lin, G. Pathways for sustainable municipal energy systems transition: A case study of Tangshan, a resource-based city in China. J. Clean. Prod. 2022, 330, 129835. [Google Scholar] [CrossRef]
- Zhang, C.Q.; Luo, H.X. Research on carbon emission peak prediction and path of China’s public buildings: Scenario analysis based on LEAP model. Energy Build. 2023, 289, 113053. [Google Scholar] [CrossRef]
- Census and Statistics Department Hong Kong Special Administrative Region. Hong Kong Annual Digest of Statistics. Available online: https://www.censtatd.gov.hk/tc/EIndexbySubject.html?scode=460&pcode=B1010003 (accessed on 17 June 2024).
- Electrical & Mechanical Services Department Hong Kong Special Administrative Region. Hong Kong Energy End-Use Data 2023. Available online: https://www.emsd.gov.hk/filemanager/en/content_762/HKEEUD2023.pdf (accessed on 17 June 2024).
- Environmental Protection Department Hong Kong Special Administrative Region. Guidelines to Account for and Report on Greenhouse GasEmissions and Removals for Buildings (Commercial, Residential or Institutional Purposes) in Hong Kong. Available online: https://www.epd.gov.hk/epd/sites/default/files/epd/english/climate_change/files/Guidelines_English_2010.pdf (accessed on 17 June 2024).
- Environmental Protection Department Hong Kong Special Administrative Region. Clean Air Plan for Hong Kong 2035. Available online: https://www.eeb.gov.hk/sites/default/files/pdf/waste_blueprint_2035_chi.pdf (accessed on 20 June 2024).
- Hong Kong Special Administrative Region. Hong Kong Climate Action Plan 2050. Available online: https://cnsd.gov.hk/wp-content/uploads/pdf/CAP2050_booklet_tc.pdf (accessed on 20 June 2024).
- Ortiz-Peña, A.; Honrubia-Escribano, A.; Gómez-Lázaro, E. Electricity Consumption and Efficiency Measures in Public Buildings: A Comprehensive Review. Energies 2025, 18, 609. [Google Scholar] [CrossRef]
- Warner, E.; Cook-Patton, S.C.; Lewis, O.T.; Brown, N.; Koricheva, J.; Eisenhauer, N.; Ferlian, O.; Gravel, D.; Hall, J.S.; Jactel, H.; et al. Young mixed planted forests store more carbon than monocultures-a meta-analysis. Front. For. Glob. Chang. 2023, 6, 1226514. [Google Scholar] [CrossRef]
- Nadeeshani, M.; Ramachandra, T.; Gunatilake, S.; Zainudeen, N. Carbon Footprint of Green Roofing: A Case Study from Sri Lankan Construction Industry. Sustainability 2021, 13, 6745. [Google Scholar] [CrossRef]
- Development Bureau Hong Kong Special Administrative Region. Reclamation Investing in the Future—Jiaochezhou Artificial Island. Available online: https://www.devb.gov.hk/tc/home/my_blog/index_id_1521.html?y=2023&p=1 (accessed on 25 June 2024).
- Environmental Protection Department Hong Kong Special Administrative Region. HongKong Climate Action Plan 2030+. Available online: https://cnsd.gov.hk/wp-content/uploads/pdf/HK_Climate_Action_Plan_2030+_booklet_Chin.pdf (accessed on 20 June 2024).
- Fathalizadeh, A.; Sharifi, E.; Bartesaghi-Koc, C. Challenges of the transition to high-performance passive cool envelopes: A systematic literature review. Energy Build. 2025, 336, 115557. [Google Scholar] [CrossRef]
- Liu, Q.; Ren, J. Research on the building energy efficiency design strategy of Chinese universities based on green performance analysis. Energy Build. 2020, 224, 110242. [Google Scholar] [CrossRef]
- Jiang, Y.S.; Zhang, Y.J.; Yeganeh, A.; Zhao, D. Resilience of green building supply chain: Capabilities, risks and influence mechanism. J. Green Build. 2024, 19, 41–69. [Google Scholar] [CrossRef]
- He, Q.F.; Wu, Z.Z.; Chen, X.S. An integrated framework for automatic green building evaluation: A case study of China. Front. Eng. Manag. 2024, 11, 269–287. [Google Scholar] [CrossRef]
- Jenn, A.; Springel, K.; Gopal, A.R. Effectiveness of electric vehicle incentives in the United States. Energy Policy 2018, 119, 349–356. [Google Scholar] [CrossRef]
- Ju, C.; Li, K.; Xu, C.; Bao, F. Challenges and opportunities of hydrogen energy application in public transportation in the post-epidemic period. Humanit. Soc. Sci. Commun. 2025, 12, 283. [Google Scholar] [CrossRef]
- Wu, Z.Z.; Pei, T.J.; Bao, Z.K.; Ng, S.T.; Lu, G.Y.; Chen, K. Utilizing intelligent technologies in construction and demolition waste management: From a systematic review to an implementation framework. Front. Eng. Manag. 2025, 12, 1–23. [Google Scholar] [CrossRef]
- Jiang, X.; Tan, L.; Sun, Y. Comparative study on CO2 emissions under different recycling technologies for food waste in Japan. China Environ. Sci. 2021, 41, 959–966. [Google Scholar]
- Bernstad, A.; Jansen, J.L. Review of comparative LCAs of food waste management systems—Current status and potential improvements. Waste Manag. 2012, 32, 2439–2455. [Google Scholar] [CrossRef]
- Wang, C.; Ren, Z.; Zhang, P.; Guo, Y.; Hong, S.; Hong, W.; Wang, X.; Geng, R.; Meng, F. Impact of vegetation coverage and configuration on urban temperatures: A comparative study of 31 provincial capital cities in China. J. For. Res. 2024, 35, 142. [Google Scholar] [CrossRef]
- Astariz, S.; Vazquez, A.; Iglesias, G. Evaluation and comparison of the levelized cost of tidal, wave, and offshore wind energy. J. Renew. Sustain. Energy 2015, 7, 053112. [Google Scholar] [CrossRef]
- Pessarrodona, A.; Howard, J.; Pidgeon, E.; Wernberg, T.; Filbee-Dexter, K. Carbon removal and climate change mitigation by seaweed farming: A state of knowledge review. Sci. Total Environ. 2024, 918, 170525. [Google Scholar] [CrossRef]
- Li, S.P.; Lu, Y.J.; Kua, H.W.; Chang, R.D. The economics of green buildings: A life cycle cost analysis of non-residential buildings in tropic climates. J. Clean. Prod. 2020, 252, 119771. [Google Scholar] [CrossRef]
- Ma, S.C.; Fan, Y. A deployment model of EV charging piles and its impact on EV promotion. Energy Policy 2020, 146, 111777. [Google Scholar] [CrossRef]
- Deng, Z.J.; Du, J.Q.; Tian, J.; Gan, Z.N.; Wang, B.J.; Zhao, C. Toward to Hydrogen Energy of Electric Power: Characteristics and Main Case Studies in Shenzhen. Processes 2023, 11, 728. [Google Scholar] [CrossRef]
- Qin, X.H.; Xu, X.Y.; Yang, Q.K. Carbon peak prediction and emission reduction pathways of China’s low-carbon pilot cities: A case study of Wuxi city in Jiangsu province. J. Clean. Prod. 2024, 447, 141385. [Google Scholar] [CrossRef]
- Zhou, T.T.; Luo, X.; Liu, X.J.; Zhai, X.X.; Sun, Y.K.; Liu, G.C.; Liu, J.H.; Gao, Y.R.; Dang, D.F.; Li, N.; et al. The green and low-carbon development pathways in the urban and rural building sector in Shaanxi Province, China. Energy Build. 2024, 306, 113952. [Google Scholar] [CrossRef]
- Zhang, D.Y.; Sun, L.; Zhang, Y.F.; Liu, T.Y.; Gao, L.; Wang, F.F.; Qiao, X.T.; Liu, Y.Q.; Zuo, J.; Wang, Y.P. The Effect of Low-Carbon Technology on Carbon Emissions Reduction in the Building Sector: A Case Study of Xi’an, China. Buildings 2025, 15, 1989. [Google Scholar] [CrossRef]
- Lu, Y.; Guo, L.; Xiao, R.M. Study on Carbon Emissions from Road Traffic in Ningbo City Based on LEAP Modelling. Sustainability 2025, 17, 3969. [Google Scholar] [CrossRef]
- Kimuli, I.; Lubwama, M.; Sebbit, A.; Kirabira, J.B. Macroeconomic effects of a low carbon electrification of greater Kampala Metropolitan area energy policy: A computable general equilibrium analysis. Energy Strategy Rev. 2022, 43, 100909. [Google Scholar] [CrossRef]
- Thepkhun, P.; Limmeechokchai, B.; Fujimori, S.; Masui, T.; Shrestha, R.M. Thailand’s Low-Carbon Scenario 2050: The AIM/CGE analyses of CO2 mitigation measures. Energy Policy 2013, 62, 561–572. [Google Scholar] [CrossRef]
Disclaimer/Publisher’s Note: The statements, opinions and data contained in all publications are solely those of the individual author(s) and contributor(s) and not of MDPI and/or the editor(s). MDPI and/or the editor(s) disclaim responsibility for any injury to people or property resulting from any ideas, methods, instructions or products referred to in the content. |
© 2025 by the authors. Licensee MDPI, Basel, Switzerland. This article is an open access article distributed under the terms and conditions of the Creative Commons Attribution (CC BY) license (https://creativecommons.org/licenses/by/4.0/).