Article

Differentiated Climate Drivers of Carbon and Water Use Efficiencies Across Land Use Types in the Yellow River Basin, China

School of Architecture and Urban Planning, Lanzhou Jiaotong University, Lanzhou 730070, China
*
Author to whom correspondence should be addressed.
Land 2025, 14(8), 1614; https://doi.org/10.3390/land14081614
Submission received: 8 July 2025 / Revised: 1 August 2025 / Accepted: 6 August 2025 / Published: 8 August 2025

Abstract

Given the crucial role of land use in shaping coupled water–carbon processes in ecosystems, it is essential to assess carbon use efficiency (CUE) and water use efficiency (WUE) across different land use types. This study established an analytical framework incorporating trend analysis, partial correlation, and relative contribution methods to evaluate how WUE and CUE in the Yellow River Basin (YRB) responded to key climatic variables between 2001 and 2023. It also identified the dominant climatic drivers across different land use types during 2001–2022. The principal findings were as follows: (1) from 2001 to 2023, the mean WUE and CUE were 0.73 g C m−2 mm−1 and 0.60, respectively. (2) Wetlands and croplands had higher WUE, while grasslands and shrublands showed higher CUE. (3) MAT was negatively correlated with WUE and CUE across 89% and 74% of the YRB, respectively, while MAP and SR showed spatially variable effects. (4) MAT was the dominant factor driving WUE variation across all land use types (accounting for approximately 40%). Except for shrublands, CUE was mainly influenced by MAP. These results highlight differentiated climate impacts across land use types, providing important insights for ecosystem restoration and spatial governance.

1. Introduction

Amidst the complicated land use and climate change within terrestrial ecosystems, a range of ecological challenges have arisen, jeopardizing food security and human well-being. Among these, the “carbon crisis” and “water crisis” have become particularly prominent, and are highlighted in the SDGs [1,2]. To better understand the dynamics of carbon–water allocation patterns and carbon–water balance zones within terrestrial carbon–water cycling, researchers have introduced two key indicators: carbon use efficiency (CUE) and water use efficiency (WUE). These indicators support more effective management and utilization of ecosystem services and facilitate more accurate predictions of how carbon and water cycles respond to global change [3,4].
Previous studies have investigated CUE and WUE, mainly from four perspectives: (1) environmental drivers of WUE and CUE [5]; (2) field-based empirical investigations [6]; (3) the influence of drought on WUE and CUE [7]; and (4) the regional spatiotemporal patterns of WUE and CUE [8]. These studies have yielded many valuable insights [9,10,11], but most current research has overlooked the spatiotemporal changes across different land use types. The mechanisms by which climate factors affect WUE and CUE in various land use types remain insufficiently understood. It is well known that different land use types have different ecological structures, management practices, evapotranspiration rates, and carbon emissions. For example, forests with complex canopy structures and high carbon storage tend to buffer the effects of radiation and precipitation better, while croplands—heavily influenced by human management—are often more sensitive to short-term climate variability [12]. Consequently, the responses to climate factors are likely to vary under different conditions.
Additionally, the majority of studies have focused on the influence of individual climate factors on CUE and WUE across different regions, overlooking the potential interactions between climate and land use changes. This may result in a misleading understanding of the effect of key climate factors on WUE and CUE and hinder accurate assessment of their regional impacts. Although higher WUE and CUE values generally indicate greater resource use efficiency, it does not mean that higher resource use efficiency is always associated with better health status in ecosystems. Different land use types may require differentiated management of WUE and CUE. Consequently, previous findings offer limited guidance for specific policy recommendations and fail to provide effective references for management practices under different land use types.
The Yellow River Basin (YRB) faces pronounced climatic sensitivity due to its growing aridity, fragile ecosystems, and escalating competition over water resources. To gain a clearer understanding of carbon–water interactions, it is crucial to comprehensively assess the combined climatic variables and land use patterns. In this study, we established a relative contribution analysis framework and integrated both climate variables and land use patterns in the YRB. This approach aims to disentangle and quantify the respective influence of climate and land use alterations on the spatiotemporal variations of CUE and WUE. Furthermore, it seeks to clarify how major climatic drivers affect the two metrics among different land use types. The core research aims are outlined as follows:
  • Characterize the spatiotemporal variation patterns of CUE and WUE.
  • Investigate the effects of major climatic variables.
  • Perform a comparative assessment of how CUE and WUE respond to these variables under various land use types.
It is important to note that although numerous climatic factors influence WUE and CUE, this study focuses specifically on how typical climatic variables affect WUE and CUE variations across different land use types, rather than expanding the scope to identify all possible influencing factors. Therefore, mean annual temperature (MAT), solar radiation (SR), and mean annual precipitation (MAP) are selected as key climatic drivers to improve the explanatory power and applicability of climate-induced variations in WUE and CUE across different land use types.

2. Literature Review

WUE reflects how available water was efficiently used, while CUE explores the distribution and conversion processes of both water and carbon within different ecosystems [13]. Traditionally, WUE and CUE have been assessed using field observations, heat diffusion methods, and eddy covariance techniques. Advances in satellite remote sensing have allowed researchers to conduct WUE and CUE assessments at larger spatial scales, including national and regional levels [14]. For example, Marjanovic et al. demonstrated that CUE calculated from MODIS products closely matches ground-based observations [15].
These studies have identified basic climatic variables, such as MAT, MAP, and SR, as key factors shaping the spatial and temporal variations [16]. For instance, Ding et al. reported that SR has a stronger effect on global vegetation CUE and WUE than MAT and MAP [17]. Chen et al. found that CUE is positively correlated with SR and MAP, but negatively correlated with MAT in Chinese terrestrial ecosystems [18]. Shao et al. showed that rising MAT is the main factor contributing to increased WUE in the Tibetan Plateau [5]. More broadly, MAT, MAP, and SR represent key indicators of three fundamental ecological processes that govern vegetation carbon balance and water use, energy input, water availability, and thermal regulation [16,19,20]. These variables are directly affected by global climate change and constitute core components of current climate assessment and prediction models, such as those developed by the IPCC [21,22].
In addition to examining the influence of climatic factors, researchers have also investigated other drivers, including land use change [16] and ecological restoration policies [23]. For instance, Sun et al. reported that forests and shrublands exhibited relatively high WUE in China [24]. Ryan et al. found that land conversion from grasslands to croplands may reduce regional CUE [25]. Furthermore, vegetation degradation, such as the transition from high to low vegetation cover, can reduce soil water retention capacity and WUE, as observed in the conversion from forests to croplands [26]. Most published studies have revealed that land use change can significantly impact water and carbon dynamics in ecosystems [27,28].
In summary, existing research has largely addressed the spatiotemporal dynamics of WUE or CUE within single land use types, or explored how climatic factors influence them in specific land categories. However, how climate change affects WUE and CUE across diverse land use types remains underexplored, and the varying impacts of major climatic factors across these land use types are still not well understood. Furthermore, knowledge of regional water and carbon cycling under the interactions of climate and land use change is still insufficient [29].
Therefore, building on the identification of the spatiotemporal variations in WUE and CUE across different land use types, this study will investigate the impacts of key climatic factors on WUE and CUE for each land use type. The aim is to enhance the understanding of water and carbon cycling processes under different land use types and promote the development of differentiated land management and ecological restoration strategies.

3. Materials and Methods

3.1. Study Area

The YRB plays a vital role as an ecological security barrier, a key water conservation zone, and an important grain-producing region, providing water resources essential for both economic activities and the daily needs of around 15% of the Chinese population [30]. The basin exhibits a pronounced topographic gradient, ranging from the western plateau, which rises to 6300 m, to the eastern delta at the river mouth, which lies close to sea level (Figure 1). The southern midstream and downstream regions receive abundant rainfall [31]. Similarly, average temperature and evapotranspiration within the basin also display substantial spatial variation.
Similar to other major river basins worldwide, the ecological environment of the YRB has been severely degraded during the period of rapid urbanization. This degradation is evidenced by a series of problems, including deteriorating water quality, reduced runoff, increased sediment load, and intensified land desertification, all of which have significantly constrained the region’s high-quality development [32]. Moreover, the YRB features diverse land use types and has experienced dramatic land use changes, with notable urban expansion in its lower reaches. The dominant land use types in the basin were grassland (67.22%), cropland (21.61%), forest (5.49%), shrubland (0.10%), and wetland (0.12%) in 2022 (Figure 1). Therefore, the YRB offers a valuable context for analyzing variations in WUE and CUE.

3.2. Data Sources and Processing

3.2.1. Data Selection and Sources

Numerous published studies have used MODIS data products to assess ecosystem changes across various spatial scales, both in China and globally, due to their long-term coverage, consistent quality, and validated reliability [5,33,34].
Specifically, NPP data were obtained from the MOD17A3HGF, GPP from MOD17A2HGF, and ET from MOD16A2GF. All of the data have been widely adopted in ecosystem productivity studies because of their well-validated performance and suitability for large-scale temporal analyses [16,35,36]. These datasets cover the period from 2001 to 2023 (Table 1).
Land use data were derived from the MCD12Q1 product, which provides global land cover classifications based on the International Geosphere-Biosphere Programme (IGBP) scheme. With a spatial resolution of 500 m and a consistent classification system, it enables long-term monitoring of land use change. Due to availability constraints, the land use dataset covers the period from 2001 to 2022. Thus, analyses involving land use–ecosystem interactions are confined to this period (Table 1). For WUE and CUE trend analyses independent of land use, the full dataset from 2001 to 2023 was utilized.
In this study, climatic variables were sourced from ERA5 Daily Aggregates, accessed via Google Earth Engine (GEE). Created by the European Centre for Medium-Range Weather Forecasts (ECMWF), ERA5 is considered among the most trustworthy reanalysis datasets for investigating climate phenomena [37,38,39]. It provides high temporal resolution and extensive spatial coverage (Table 1). Additionally, ERA5 has demonstrated validated accuracy in estimating climatic elements [40].

3.2.2. Data Processing and Verification

GPP and ET data were originally provided at an 8-day temporal resolution. Annual composites were generated using the Maximum Value Composite (MVC) method. Daily climatic factors from the ERA5 Daily Aggregates dataset were aggregated to annual values. Specifically, MAT and MAP were averaged to obtain annual means, while SR was summed to produce annual accumulations, in accordance with the characteristics of each variable. All climatic datasets were resampled to a spatial resolution of 500 m to match the NPP, GPP, land use, and ET. Subsequently, these datasets were reprojected to the WGS-1984 coordinate system to ensure spatial consistency across layers and facilitate integrated spatial analysis.
To evaluate the representativeness and reliability of climatic variables derived from ERA5, we randomly selected 500 sampling points across the YRB. These points were spatially distributed across the whole YRB to capture the diversity of climatic zones and surface conditions (Figure A1). We compared ERA5-derived temperature and precipitation values at these locations with corresponding data from the China National Meteorological Data Center (CNMDC) for 2000–2020. Specifically, CNMDC station data were spatially interpolated, and comparative analyses were conducted between the two datasets at the 500 sampling points. The results indicated that ERA5 data exhibited high reliability for the YRB, consistent with the findings of Li et al. [40].

3.3. Methods

The methods adopted in this study were selected for their robustness and suitability in analyzing long-term environmental data. The Theil–Sen Median (TSM) method provides reliable trend estimates that are resistant to outliers, while the Mann–Kendall (MK) test effectively detects the significance of monotonic trends without assuming data normality [41,42]. Partial correlation analysis enables the isolation of individual climatic influences on ecological indicators by controlling for confounding factors, making it well-suited for complex climate-ecosystem interactions [43,44]. Additionally, the relative contribution approach, based on normalized absolute partial correlation coefficients, allows for a standardized comparison of the importance of multiple climatic drivers [16]. These methods have been widely applied in many environmental and ecological studies, which support their applicability.

3.3.1. Calculations of WUE and CUE

CUE represents the ratio between NPP and GPP, serving as an indicator of how efficiently vegetation utilizes carbon for dry matter synthesis:
CUE = NPP/GPP
WUE quantifies the balance between photosynthetic productivity and water use in vegetation systems, where elevated WUE values reflect enhanced carbon fixation efficiency relative to water expenditure [45,46]. The formula for calculating WUE is expressed below:
WUE = NPP/ET

3.3.2. Methodology for Trend Analysis

To characterize interannual variability and determine long-term trends in NPP, GPP, WUE, and CUE, we applied the Theil–Sen Median (TSM) method and calculated their trends.
β a = Median x c x d / c d ,   1   <   d   <   c   <   n
where xc and xd represent the values of the time series at years c and d, n is the total number of years in the series, and a denotes the target variable (NPP, GPP, WUE, or CUE). A negative βa indicates a decreasing trend in the variable, while a positive βa indicates an increasing trend. The larger the absolute value of βa, the greater the rate of change.
To further assess the significance of the trend, the Mann–Kendall (MK) test is employed. The test statistics S and the standardized statistic Z are calculated as follows:
S   =   i = 1 n 1 j = i + 1 n sign R j R i
Z = S 1 / var S                                           S > 0                                                                                                       S = 0 S + 1 / var S                                             S < 0
Based on the Mann–Kendall (MK) test, the trends were categorized into five types: significant decrease (SD) for Z < 0 and p < 0.05, non-significant decrease (NSD) for Z < 0 and p ≥ 0.05, no significant change (NSC) for Z = 0, non-significant increase (NSI) for Z > 0 and p ≥ 0.05, and significant increase (SI) for Z > 0 and p < 0.05. This classification is consistent with previous studies [9,47].

3.3.3. Partial Correlation Analysis

The second-order partial correlation (PC) method was employed to evaluate the relationship between climate factors and NPP, GPP, WUE, and CUE in the YRB. The formula is as follows:
R xy , z λ = R xy , z R x λ , z   ×   R y λ , z / 1 R x λ , z 2   ×   1 R y λ , z 2
where Rxy, represents the second-order PC coefficient between x and y, with the effects of factors z and λ removed; and R,z and R,z are defined similarly to Rxy,z.
The significance was tested using the t-value. A t-value greater than 0 indicates a positive effect of the climatic factor on the indicator, while a t-value less than 0 indicates a negative effect. The results were categorized into five types: significantly positive correlation (SPC), non-significant positive correlation (NSPC), no correlation (NC), non-significant negative correlation (NSNC), and significantly negative correlation (SNC).

3.3.4. Relative Contribution of MAT, MAP, and SR to NPP, GPP, WUE, and CUE

To quantify the relative contributions (RC) of MAT, MAP, and SR to NPP, GPP, WUE, and CUE, we assumed that other influences remain constant, focusing solely on the effects of these climate factors [16,48]. The formula is as follows:
RC . NPP   =   Δ MAT / Δ MAT + Δ MAP + Δ SR   ×   100 %
where ΔMAT, ΔMAP, and ΔSR represent the partial correlation coefficients of MAT, MAP, and SR with NPP, respectively. The calculation of RCs for the other variables follows the same method as that for NPP.

4. Results

4.1. Spatiotemporal Evolution Characteristics

4.1.1. Spatial Distribution Characteristics

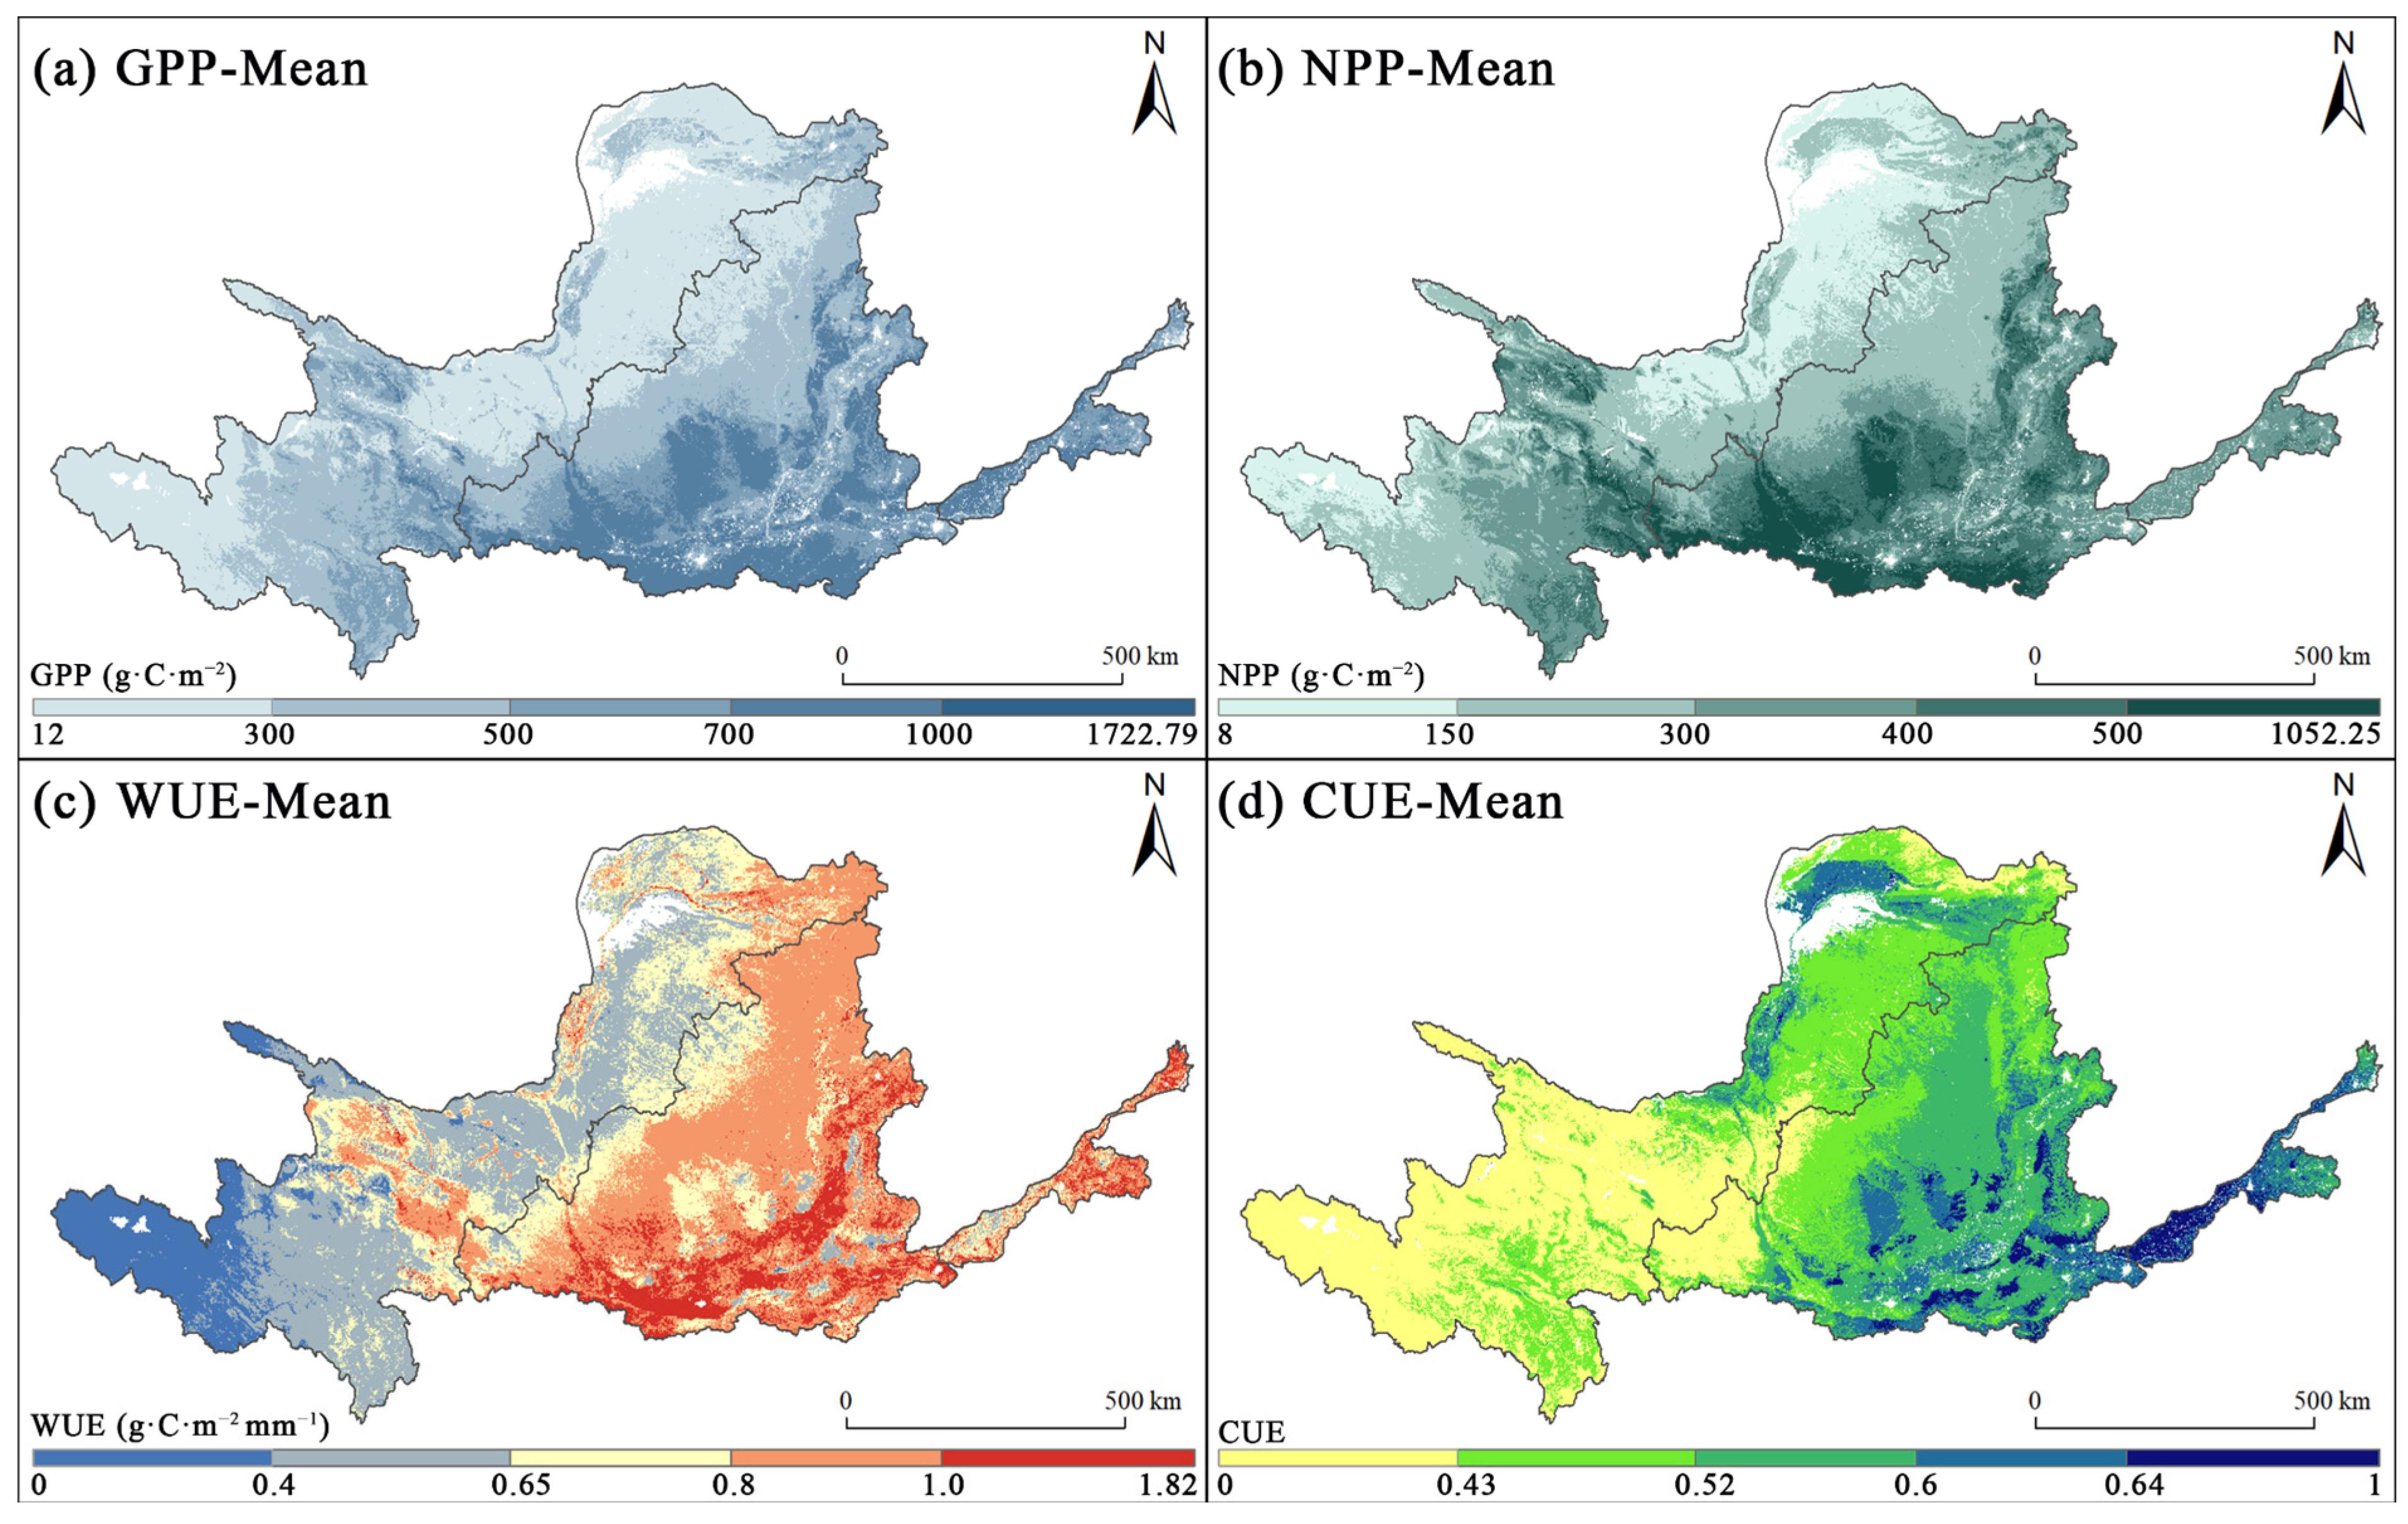
GPP and NPP share comparable spatial patterns (Figure 2a,b), in contrast to the marked regional differences observed for WUE and CUE (Figure 2c,d). For example, in the upper reaches of the basin, high WUE values are mainly observed around Lanzhou and Xining, whereas high CUE values are concentrated in the Ningxia Plain and Hetao Plain. The elevated WUE around Lanzhou and Xining may be attributed to a higher level of urbanization, with abundant urban green spaces, irrigated farmland, and horticultural vegetation, resulting in more efficient water management through artificial irrigation. In contrast, the high CUE in the Ningxia and Hetao plains is likely due to the dominance of agricultural land use, where fertilization and irrigation significantly enhance NPP, while plant respiration losses are relatively well controlled. The spatial divergence of high-value WUE and CUE areas in the upper YRB essentially reflects the varying impacts of different human activities on local ecosystems.

4.1.2. Temporal Evolution Characteristics

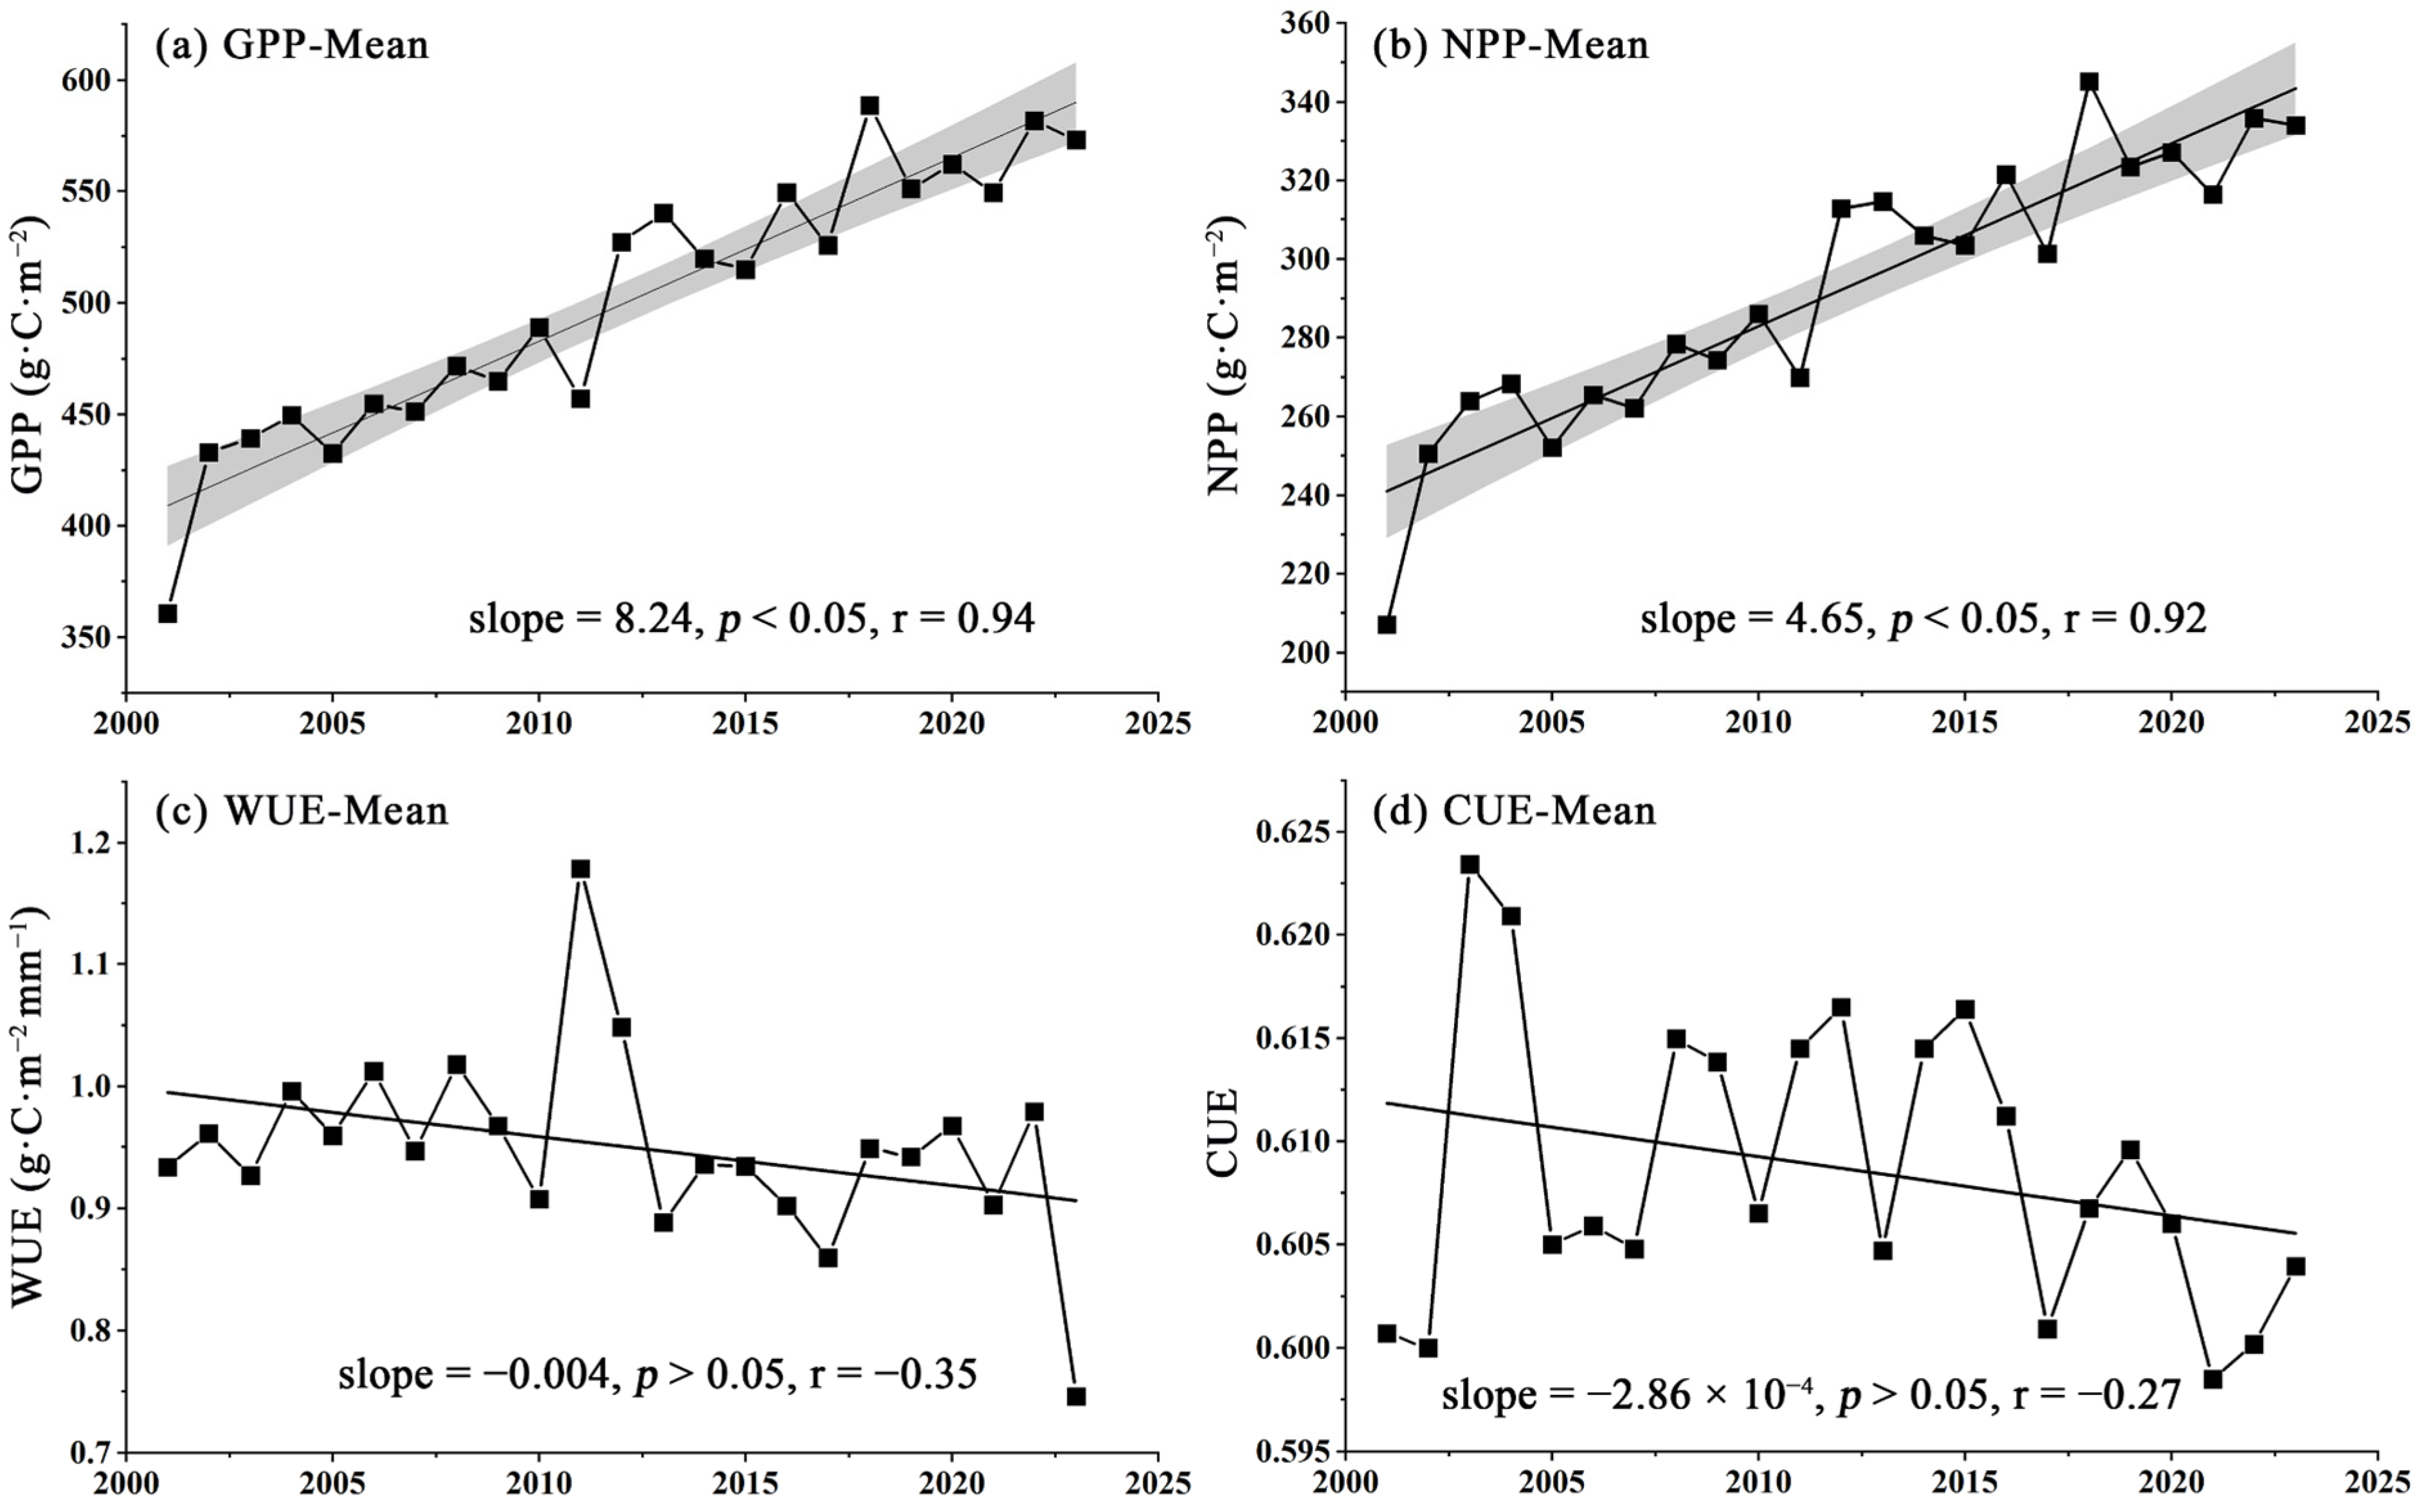
The average values were 493.14 g C m−2 for GPP, 286.71 g C m−2 for NPP, 0.73 g C m−2 mm−1 for WUE, and 0.60 for CUE (Figure 3). GPP and NPP displayed significant increasing trends (Figure 3a,b). WUE and CUE showed non-significant decreasing trends (Figure 3c,d). WUE peaked in 2011 at 1.18 g C m−2 mm−1, whereas CUE reached its maximum of 0.60 in 2006. The decline in CUE is primarily attributed to the significantly greater the increase in GPP (8.24) compared to the increase in NPP (4.65). Although ecological restoration is underway in the YRB, WUE shows a non-significant declining trend. A possible reason is that, during the restoration process, the water demand of vegetation increased in some areas, resulting in higher water consumption and a subsequent decline in WUE.
Notably, a sudden and significant decline in WUE was observed in the YRB in 2023 (Figure 1). This decline may result from the combined effects of extreme climate anomalies and ecosystem responses. Record-breaking heatwaves may intensify evapotranspiration disproportionately to carbon assimilation, leading to reduced WUE [49]. Furthermore, human-induced stressors such as irrigation constraints and land degradation could have exacerbated the decline [50,51].

4.1.3. Trends Characteristics

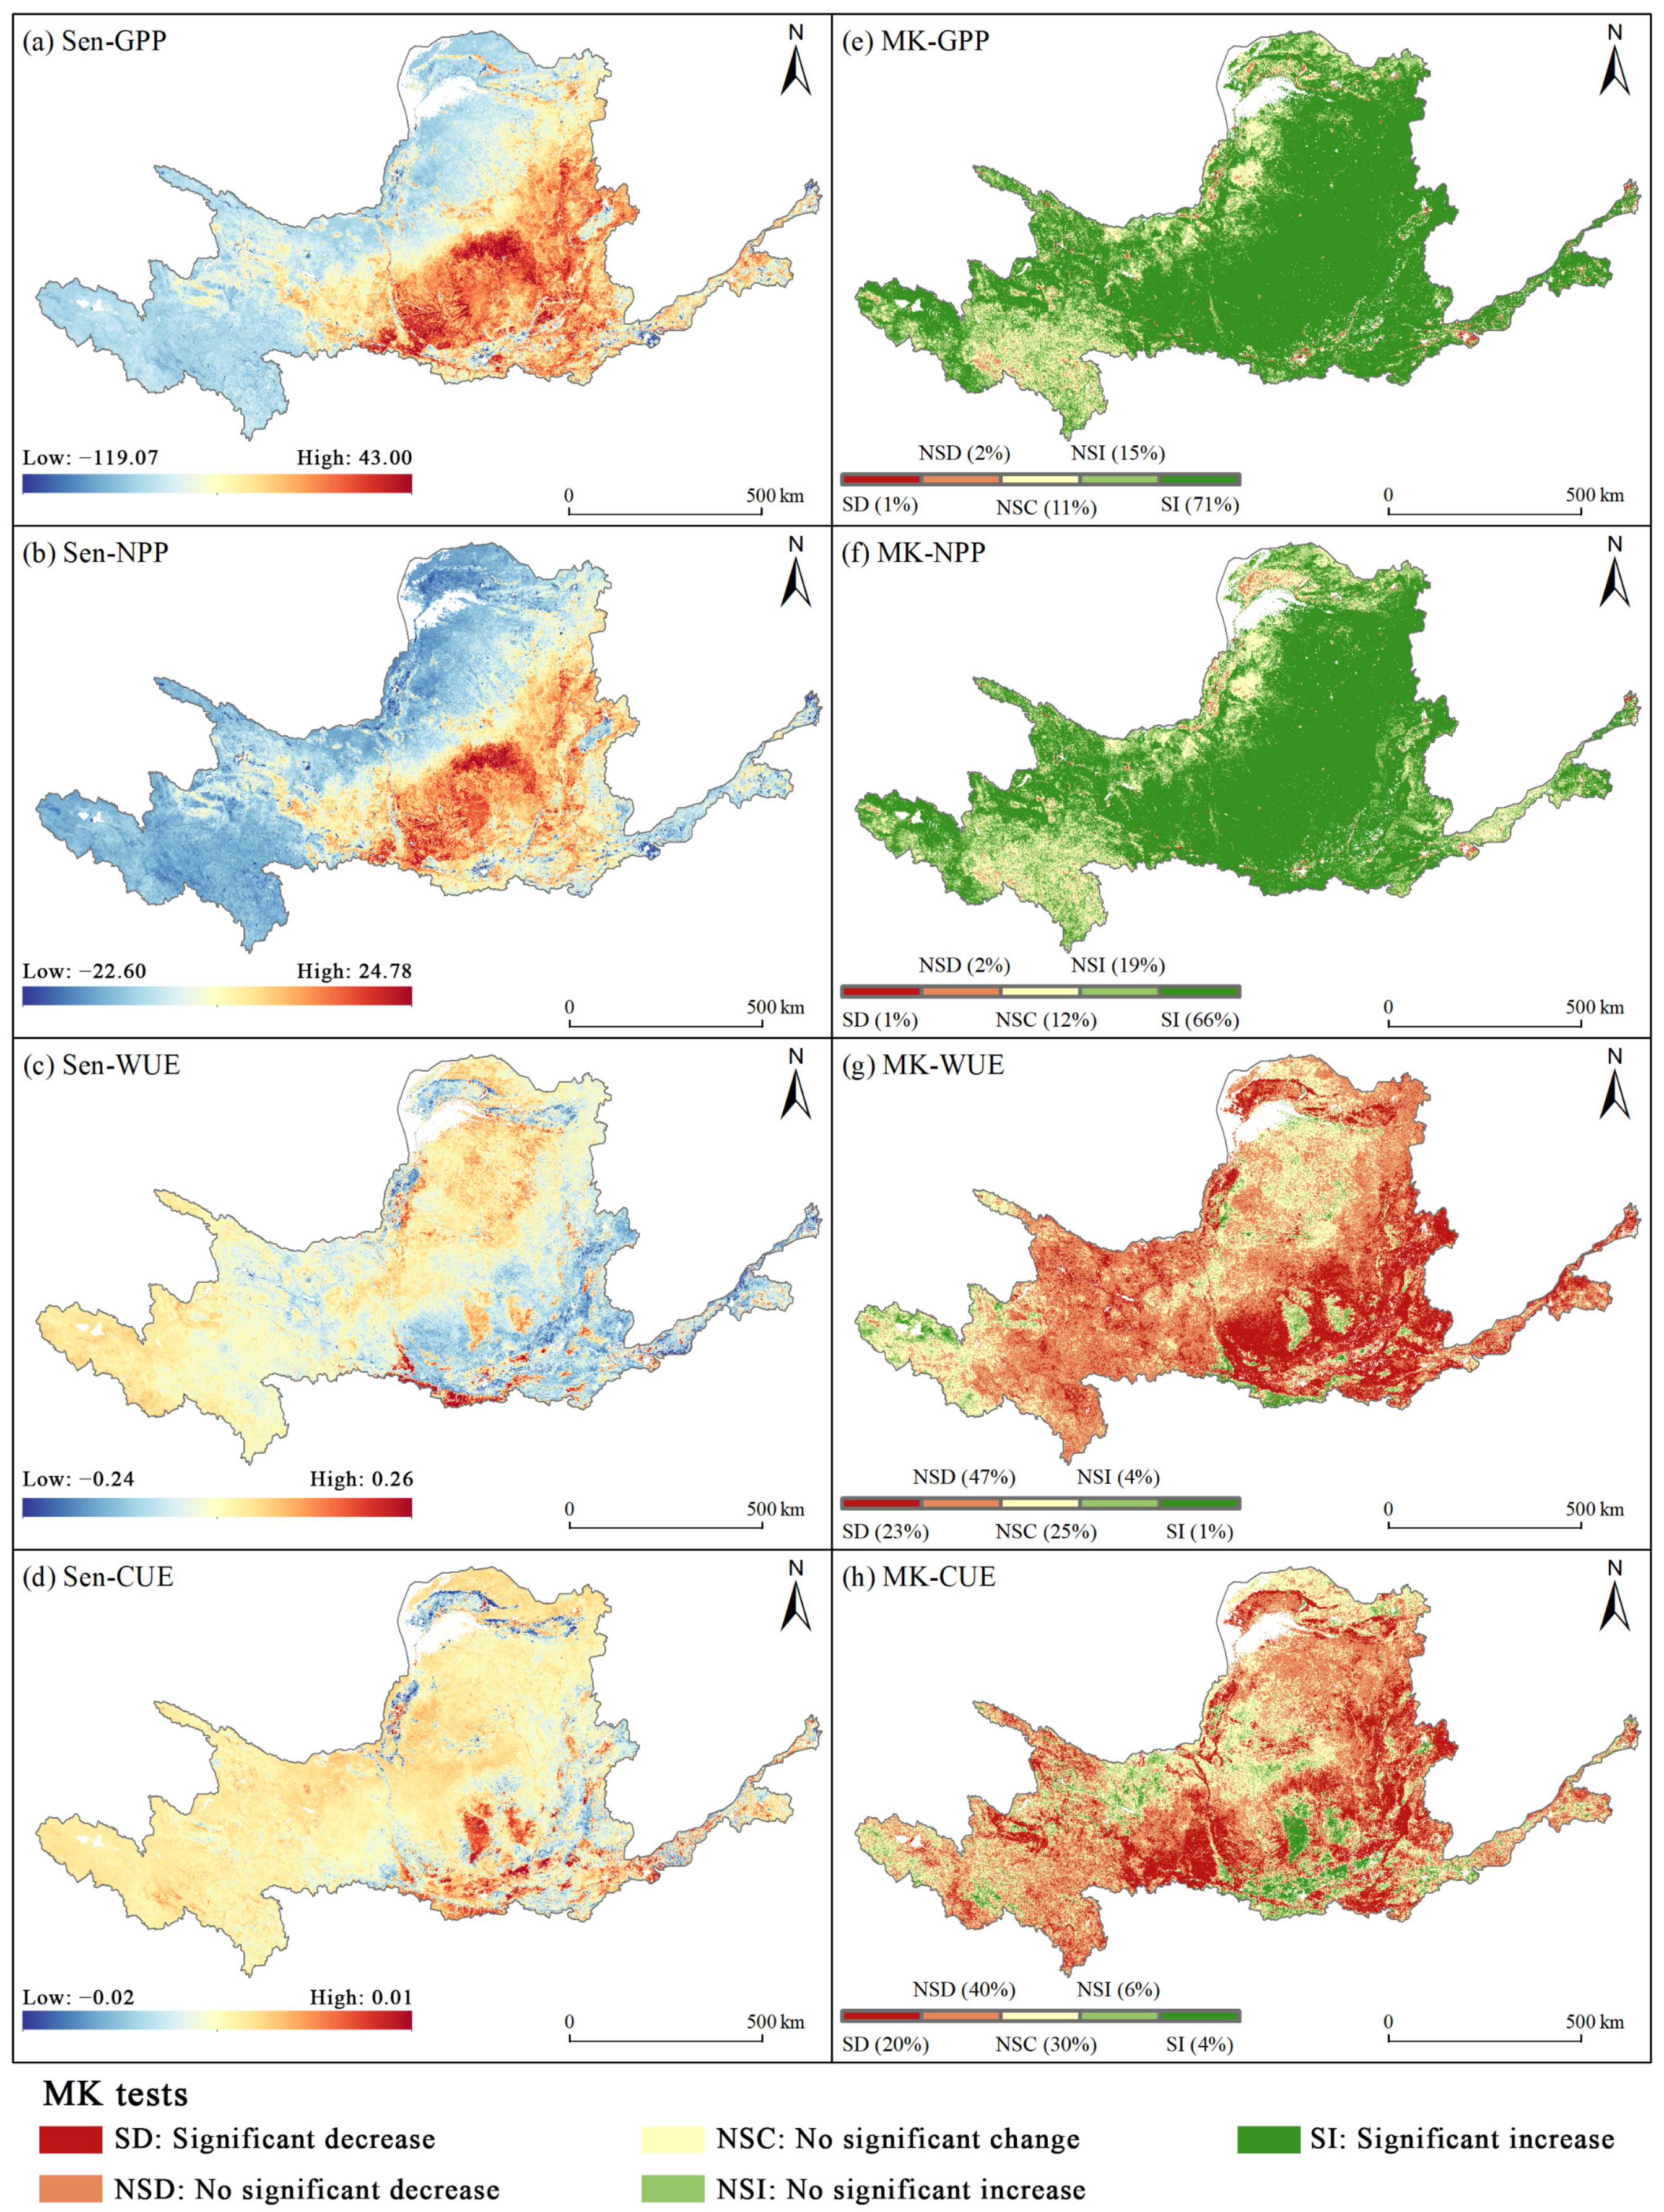
The GPP and NPP exhibited notable growth trends, with growth areas covering 86% and 85%, respectively. In contrast, areas with declining WUE and CUE accounted for more than 60% (Figure 4). Areas exhibiting an SI trend account for 71% of GPP and 66% of NPP, primarily distributed in the middle and lower reaches. Only 3% displayed decreasing trends in GPP and NPP, primarily concentrated in highly urbanized regions, including Yinchuan, Taiyuan, Xi’an, and Zhengzhou.
Regions with declining WUE (70%) and CUE (60%) far exceeded those with increasing trends (5% and 10%, respectively). Approximately 23% and 20% of the YRB exhibit an SD trend in WUE and CUE, respectively. However, areas with SI trends in WUE (1%) and CUE (4%) were minimal. Notably, the SI area in CUE was larger than in WUE. The spatial distribution of SI areas varied: SI trends in WUE were mainly concentrated in the southern Weihe River Basin, while CUE trends were detected throughout the Weihe River Basin and in the natural forest reserve of the northern YRB.

4.2. Effects of MAT, MAP, and SR on GPP, NPP, WUE, and CUE

4.2.1. Partial Correlation Coefficients of Climate Factors

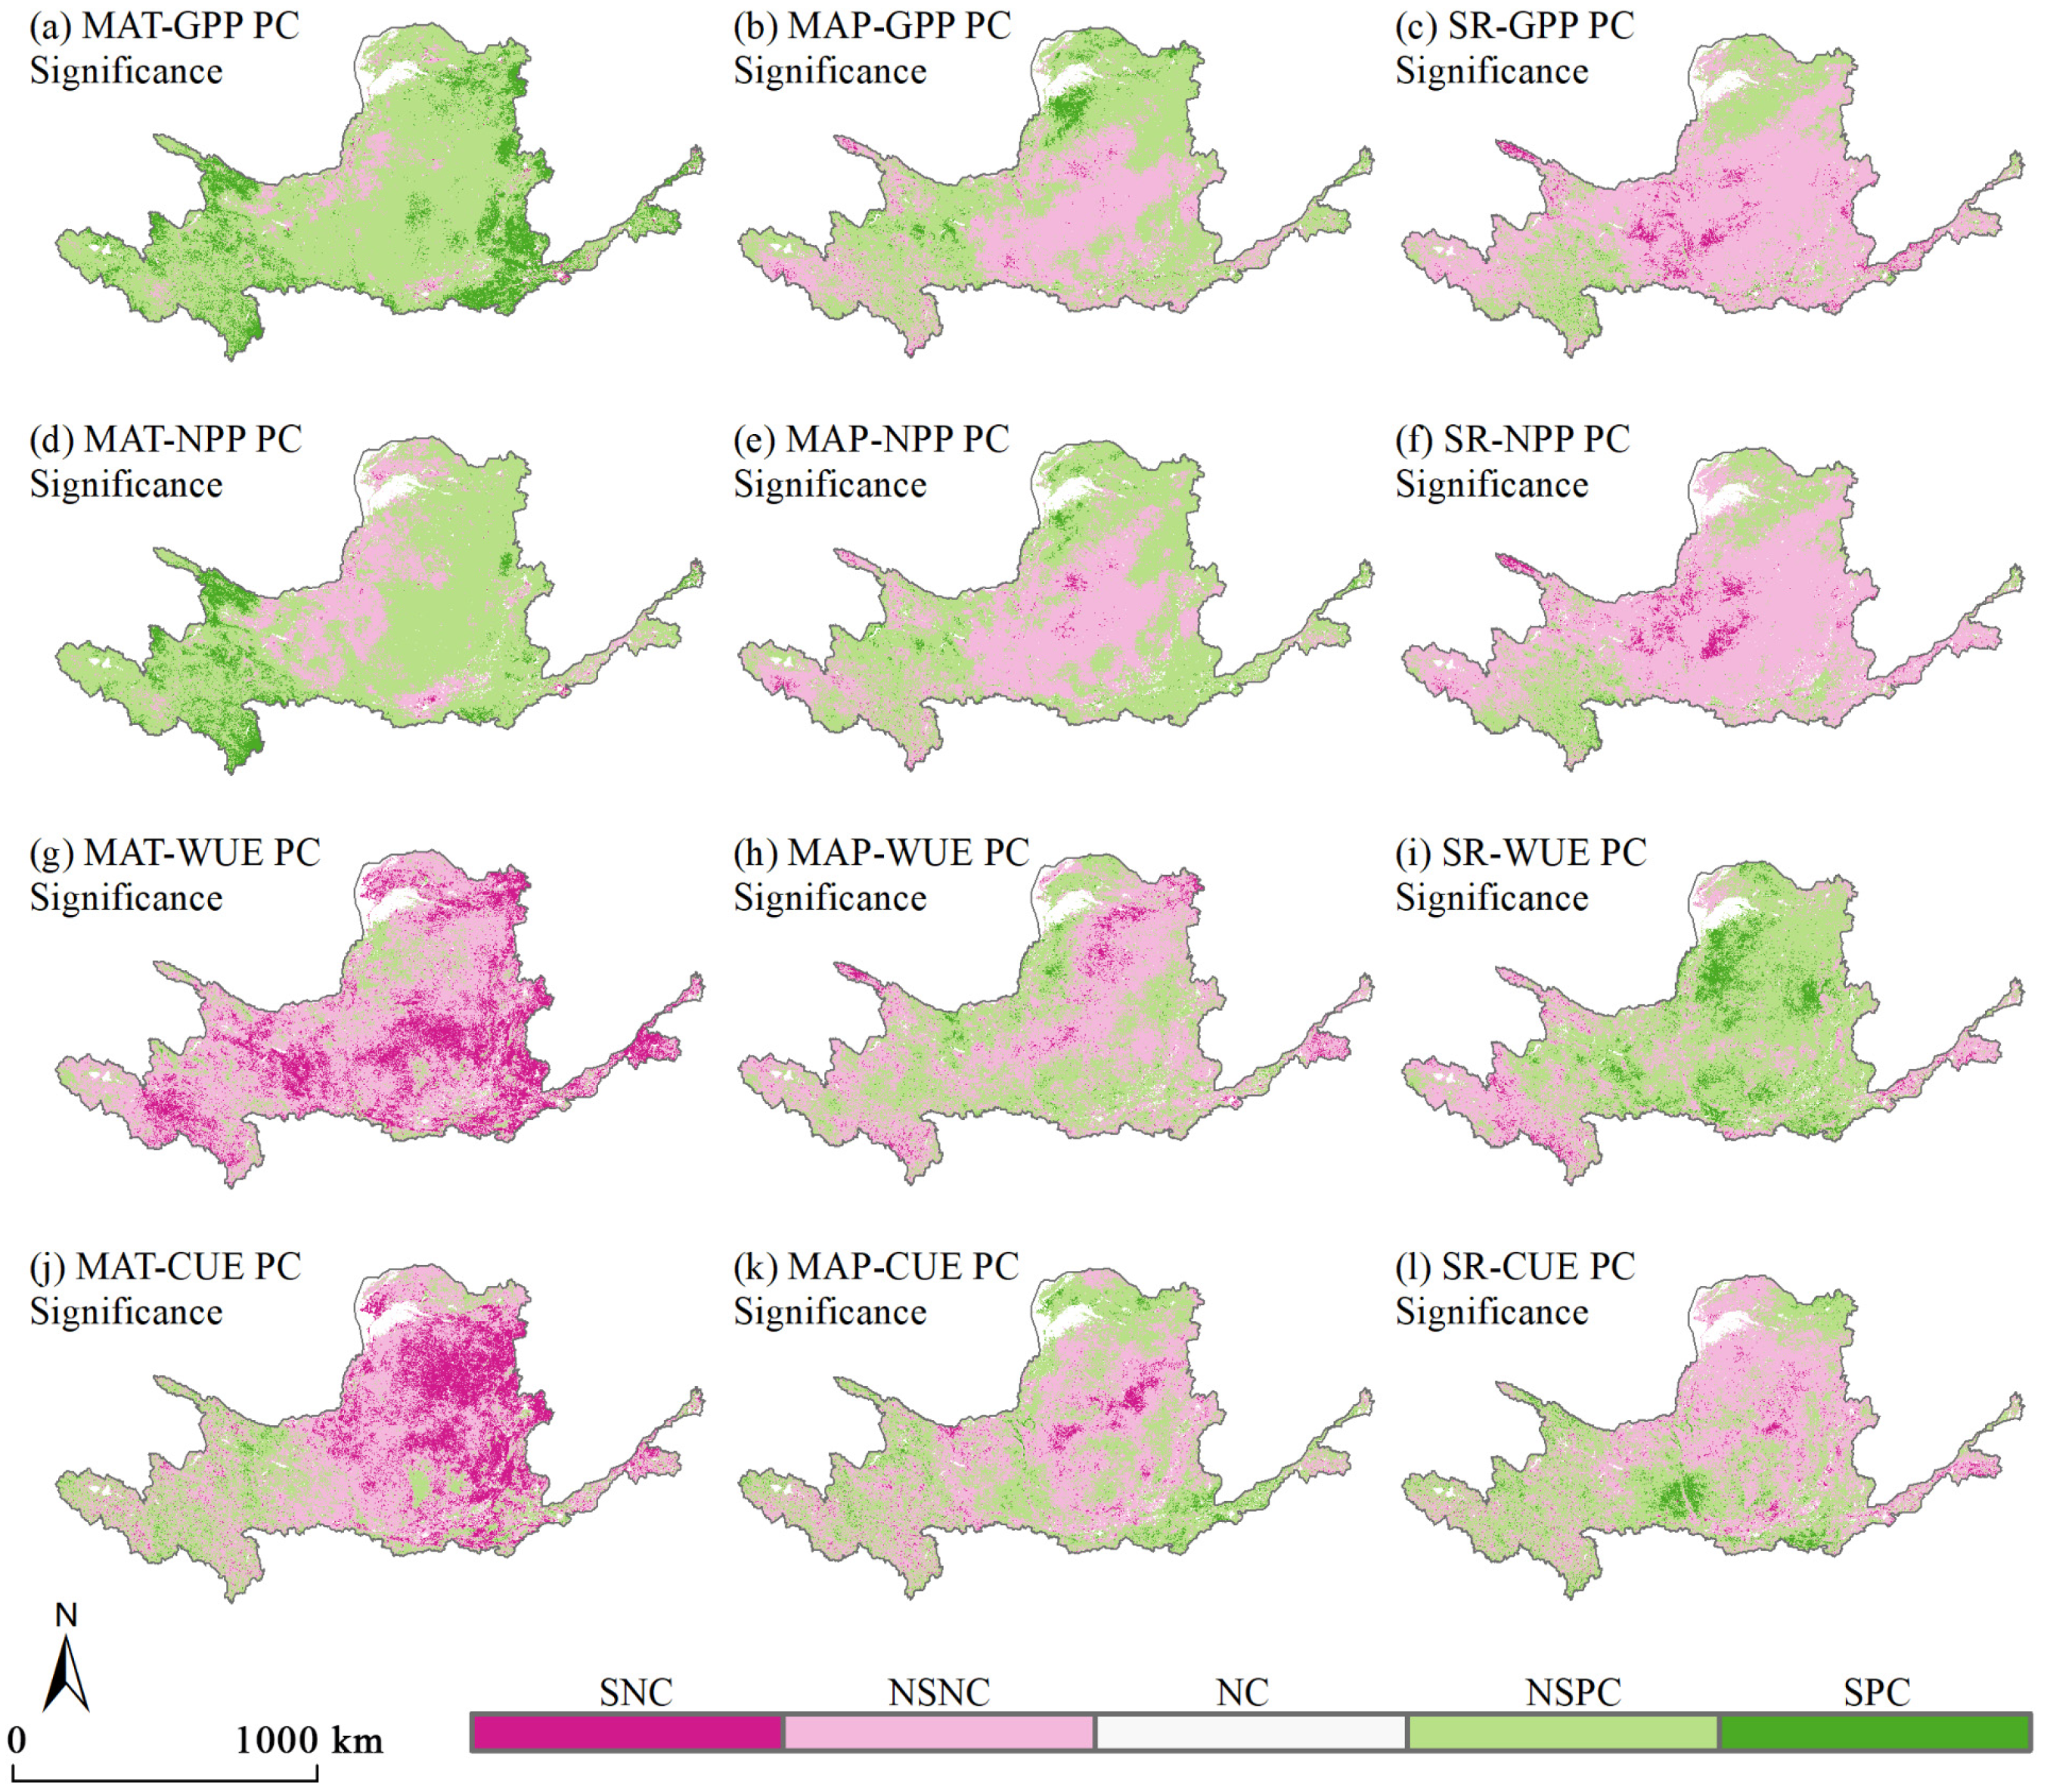
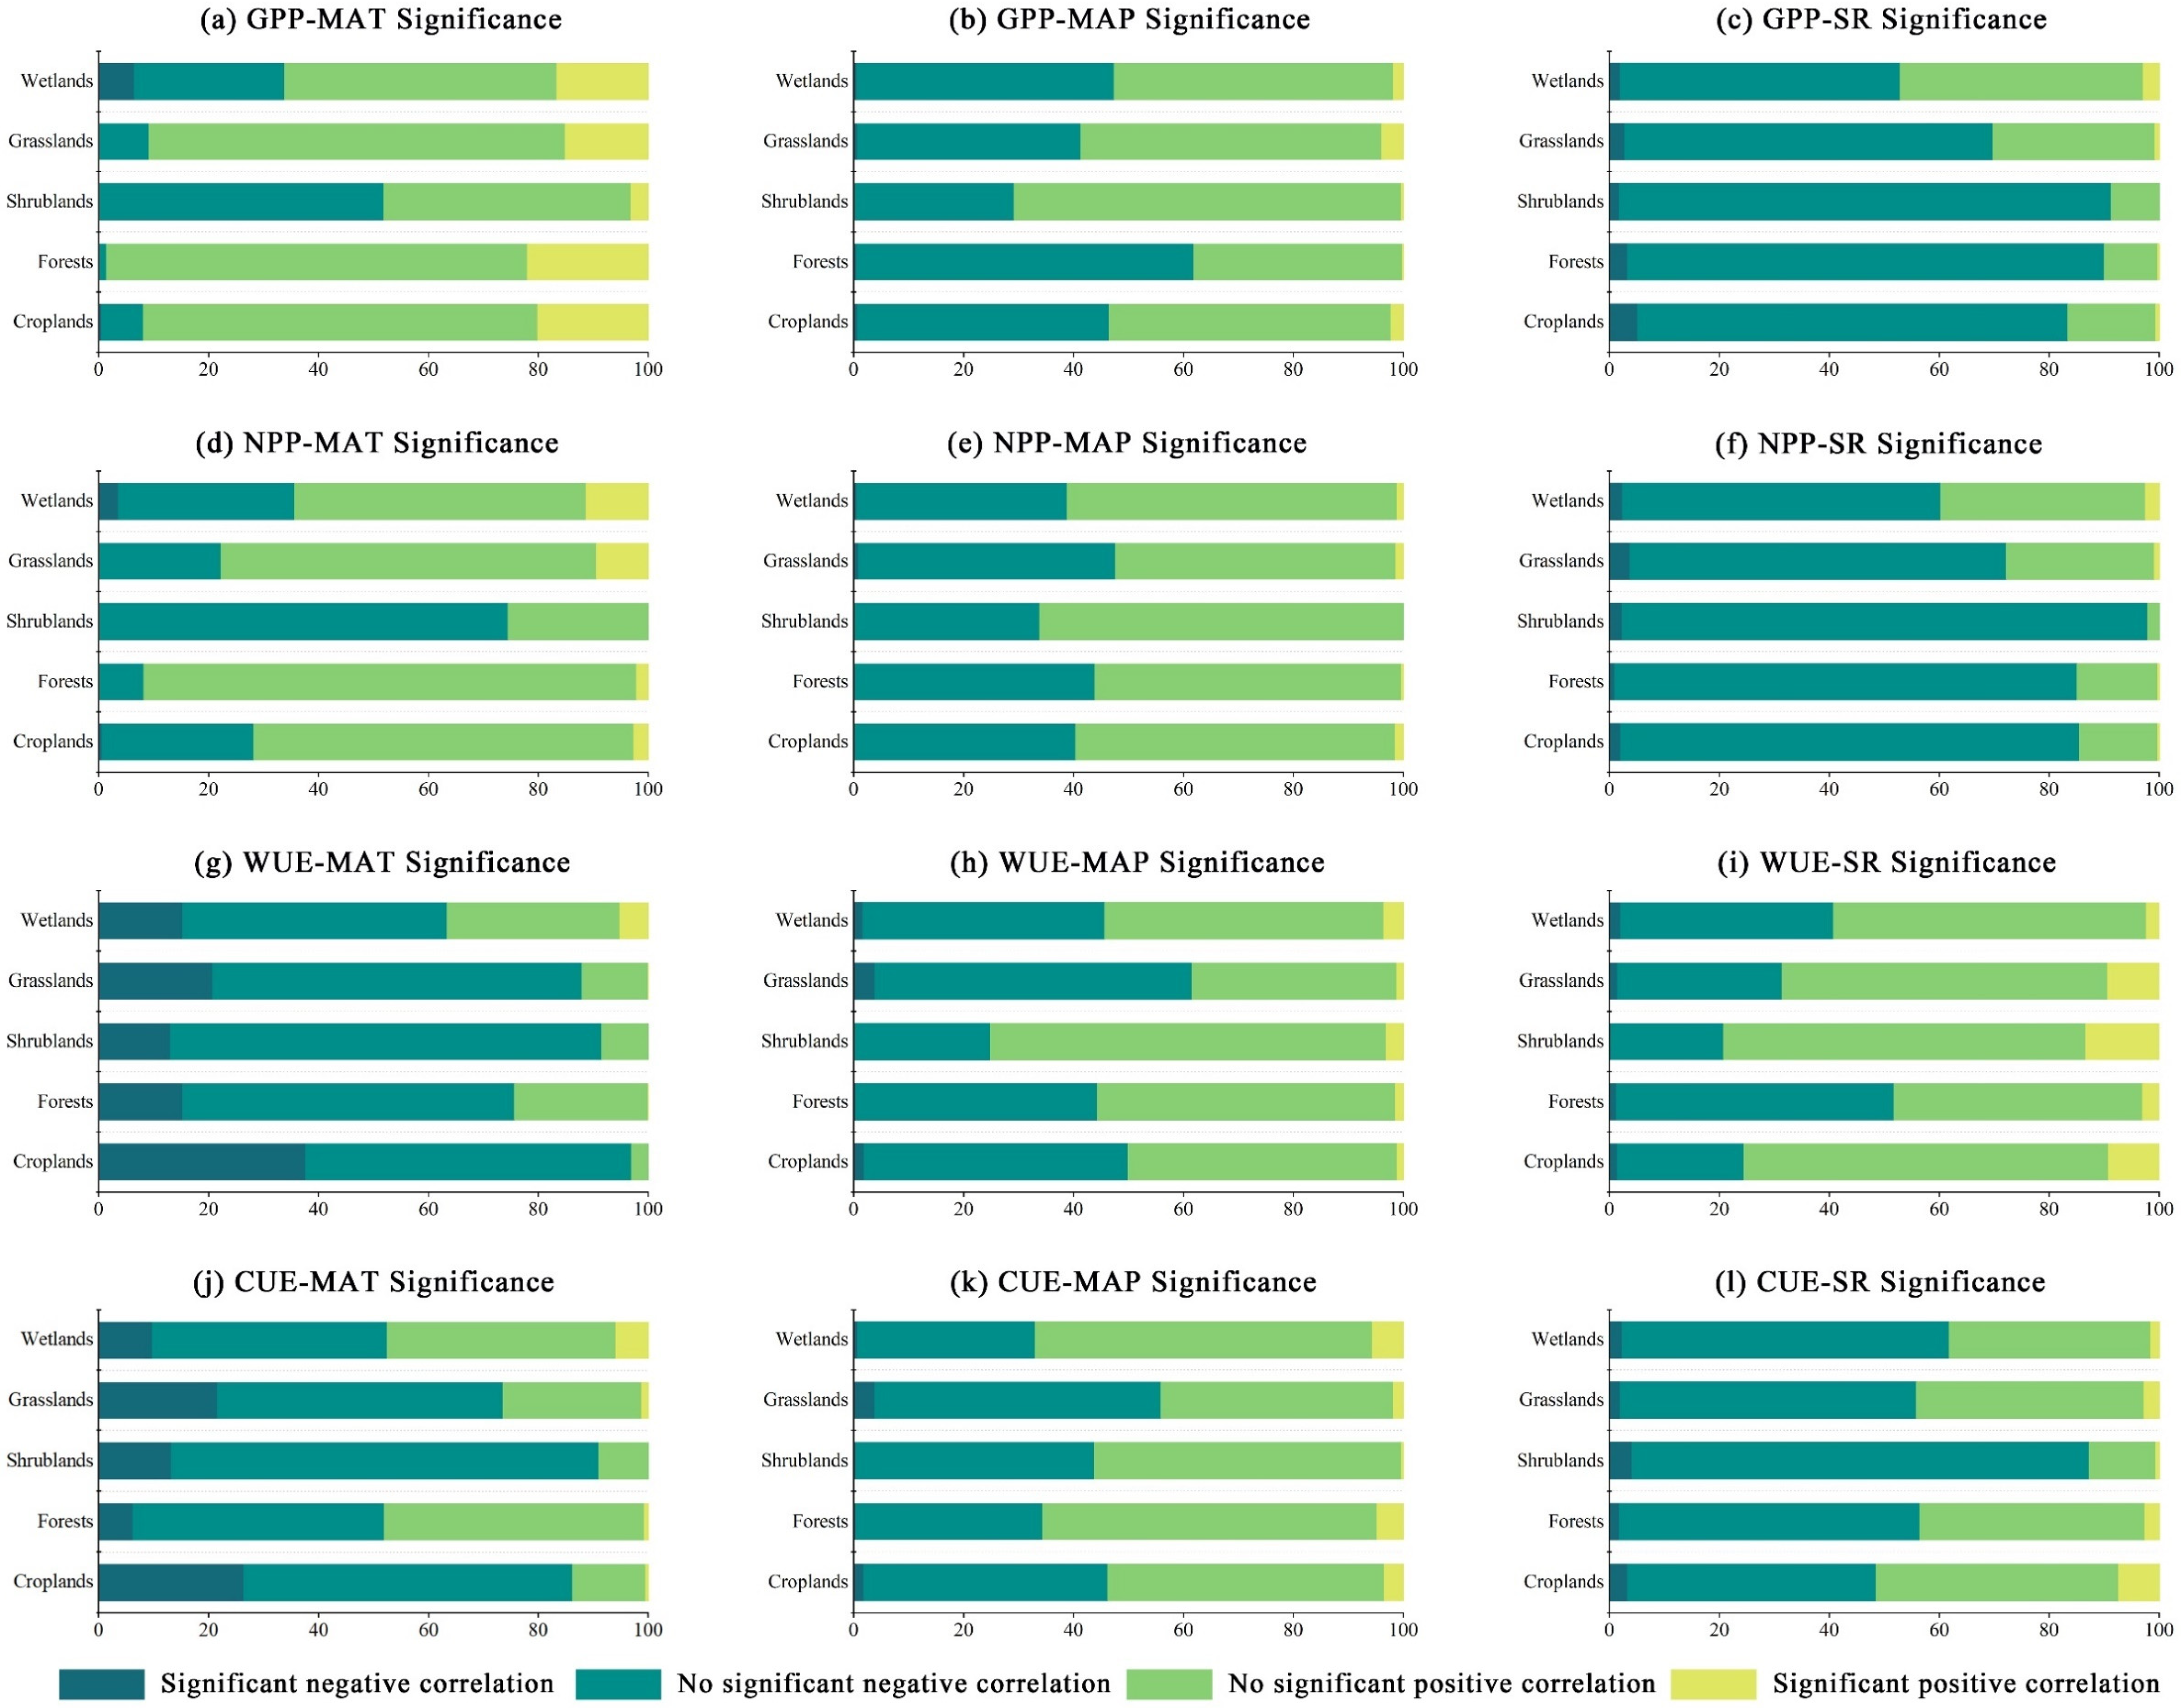
Figure 5 presents the t-test results for the PC coefficients between GPP, NPP, WUE, CUE, and typical climatic factors. Detailed results of the PC coefficients are provided in Figure A2.
GPP shows a significant positive response to MAT, with an average PC of 0.26; 91% of the regions exhibit a positive correlation, indicating that MAT is a primary limiting factor for GPP. MAP has a relatively weak effect on GPP, with an average coefficient of 0.04. SR is overall negatively correlated with GPP (average coefficient −0.12), with 74% of regions showing a significant negative correlation. Positive correlations (26%) are primarily concentrated in the Gannan Plateau, suggesting that solar radiation may enhance GPP in alpine regions. NPP is primarily influenced by MAT (average partial correlation coefficient 0.15), with 76% of regions positively correlated, mainly distributed across alpine and valley areas. The 24% of negatively correlated regions are concentrated in urbanized zones, reflecting thermal environmental disturbances. MAP and NPP exhibit positive correlations in 54% of regions, primarily in semi-arid areas, while 46% negative correlations are found mainly on the Tibetan Plateau and Loess Plateau. SR predominantly shows negative correlations with NPP (−0.12), accounting for 76% of regions.
WUE exhibits sensitivity to MAT, reflected by an average PC coefficient of −0.27. Negative correlations appear in 89% of the region, indicating temperature as the dominant climatic factor in the YRB. The correlation with MAP is weaker (−0.04), with 58% of the area showing negative correlation, primarily distributed across the Loess Plateau. SR exhibits a relatively positive effect on WUE (0.12), with 69% of the region positively correlated, mainly located in the western Loess Plateau, suggesting that moderate sunlight can enhance water use efficiency. Interestingly, CUE shows negative correlations with all typical climatic factors. Among these, MAT has the strongest negative correlation (−0.19), with 74% of the area negatively correlated. Positive and negative correlations with MAP are almost evenly split (49% vs. 51%), with positive correlations predominantly in the Fen-Wei Plain and negative correlations concentrated in the northern Loess Plateau. SR exhibits the weakest correlation with CUE (−0.01), with minor regional differences. A negative correlation is observed in 54% of the YRB, mainly in the Guanzhong Plain.

4.2.2. Relative Contributions

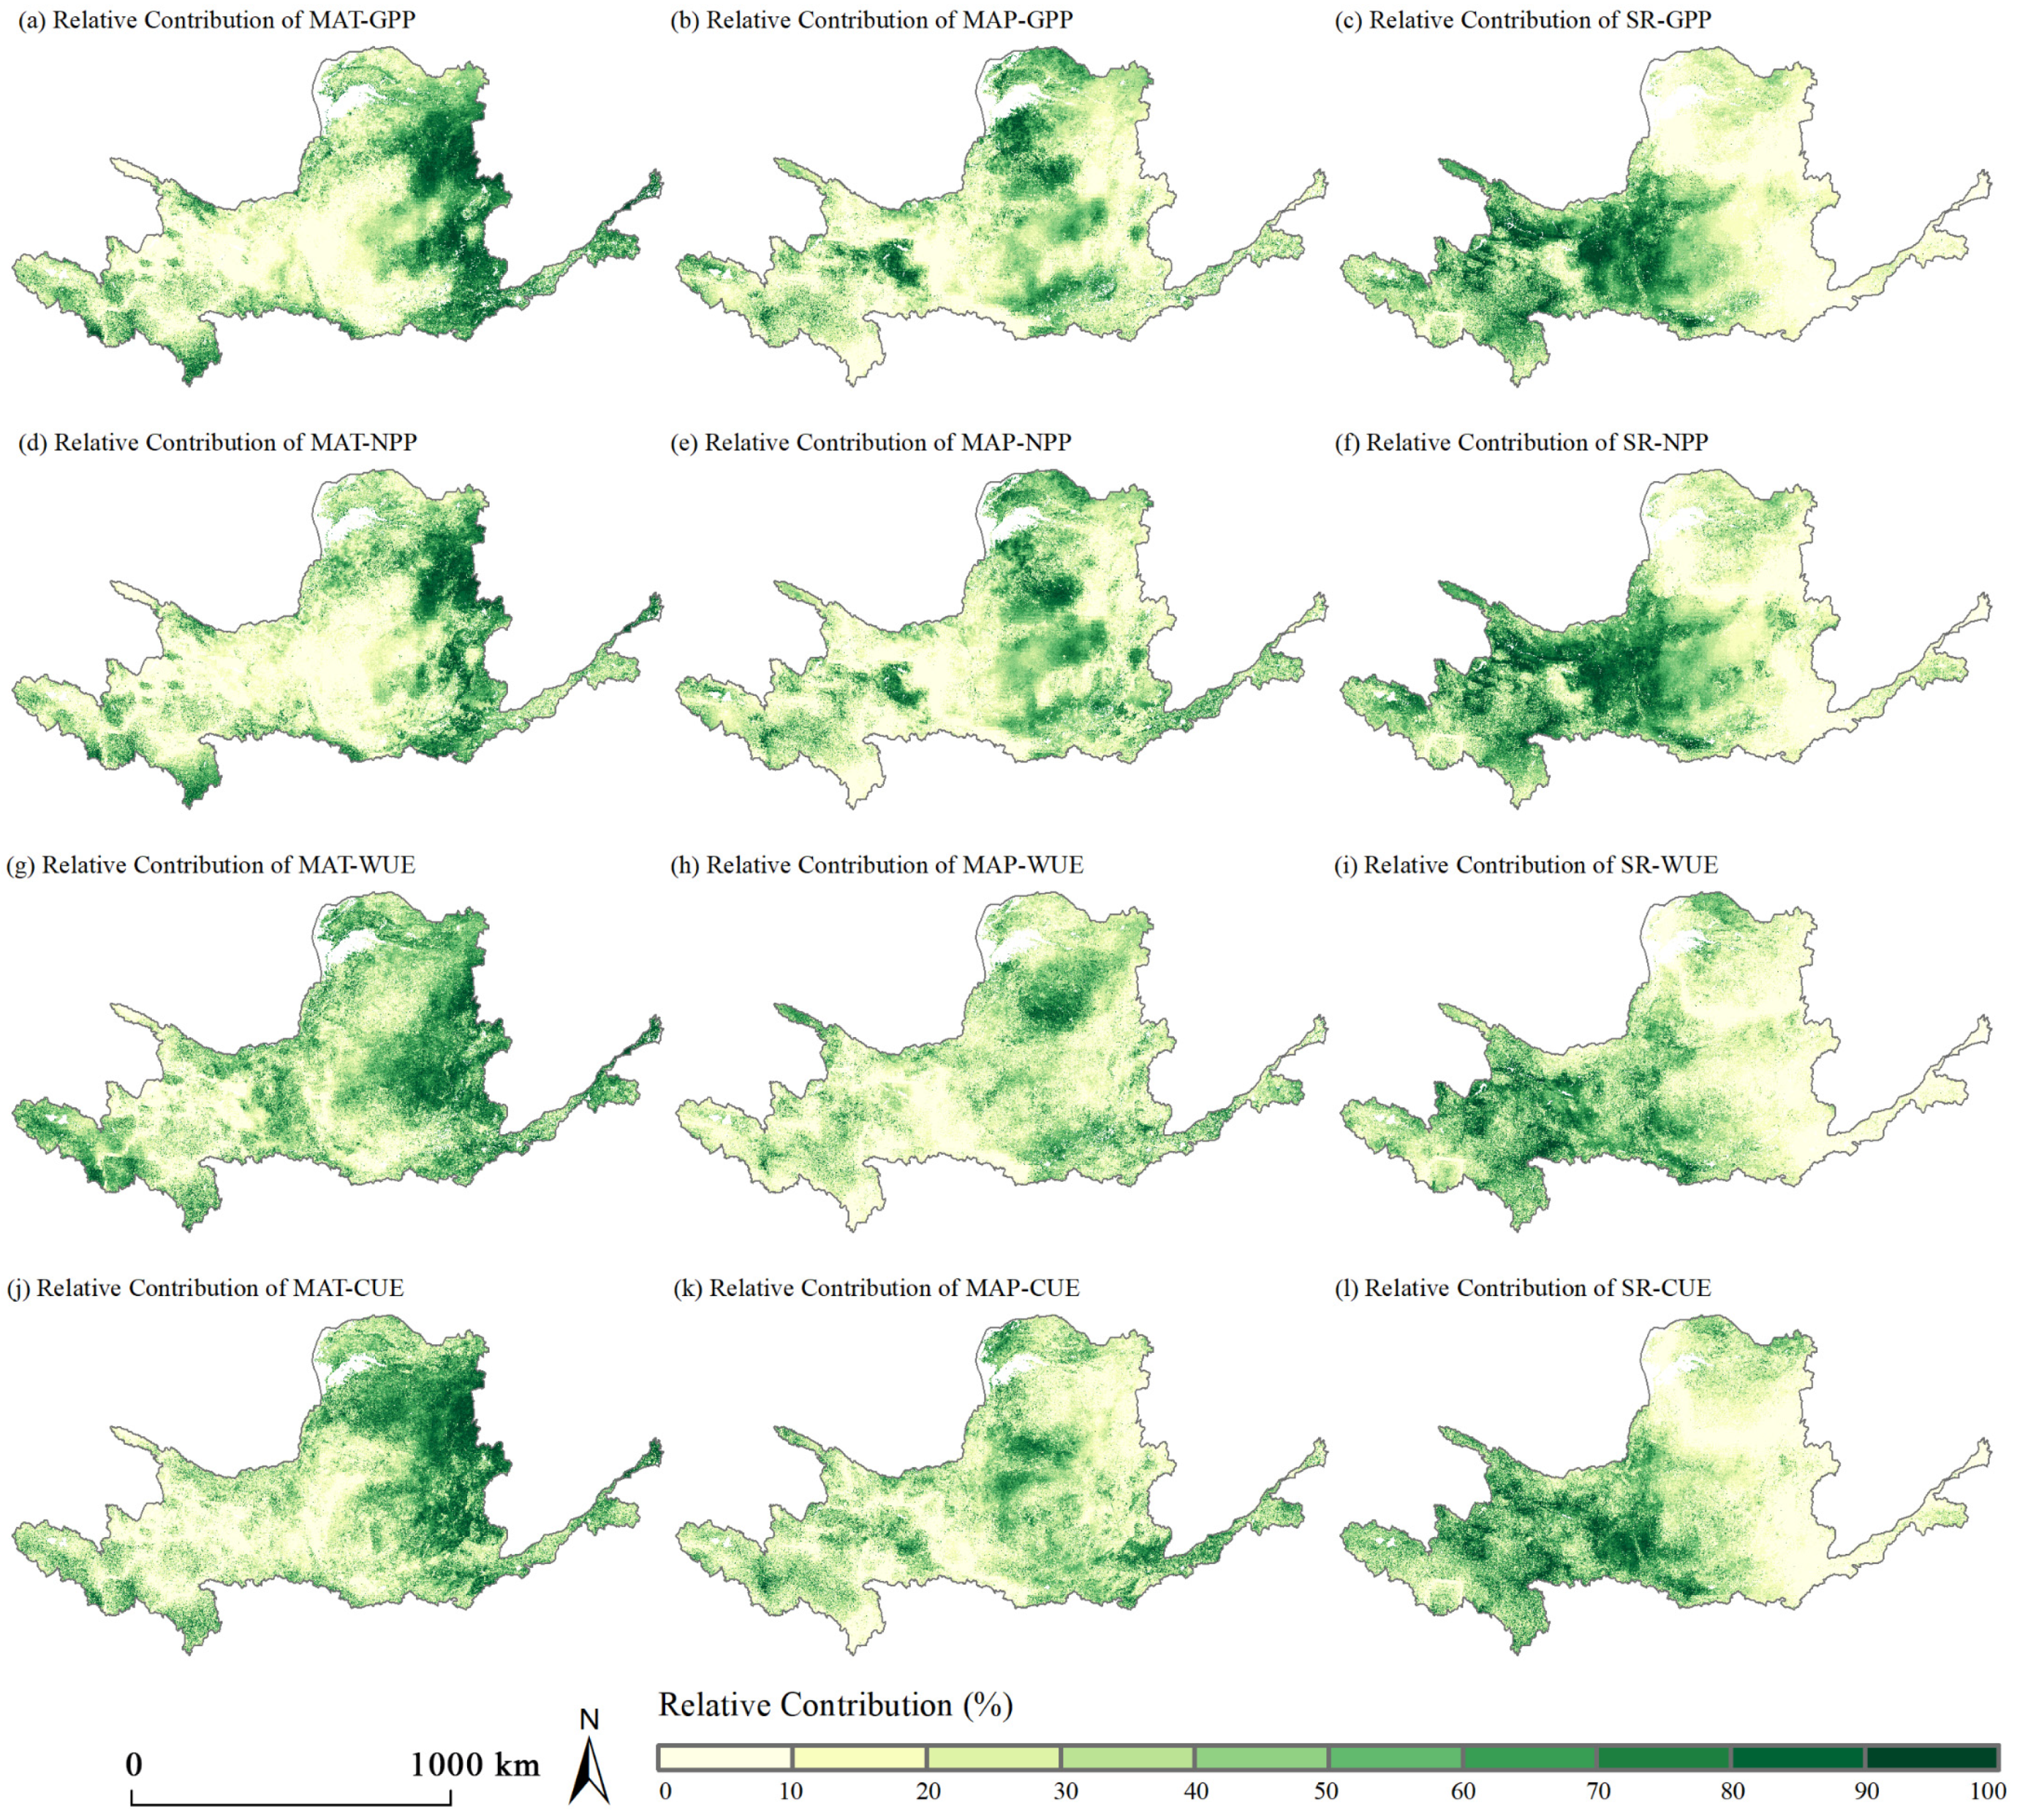
GPP and NPP exhibited similar patterns in terms of dominant influencing factors (Figure 6). MAT was the primary contributor to both, explaining 35.93% of the variation in GPP and 31.57% in NPP, with its influence concentrated in the middle and lower reaches of the YRB. MAP accounted for 30.05% of the variation in GPP and 30.83% in NPP, predominantly affecting the upper and middle reaches. SR was the dominant factor in the upper reaches, contributing 34.02% to GPP and 37.60% to NPP.
Similarly, the dominant climatic factors influencing WUE and CUE exhibit consistent spatial patterns. MAT is the primary factor, contributing 37.70% and 38.14%, respectively, with dominant regions distributed across the upper, middle, and lower reaches. MAP predominantly influences the upper reaches, accounting for an average of 31.05% and 29.41%, including the Ordos Plateau and the central Loess Plateau. SR contributes relatively evenly to WUE and CUE (31.25% and 32.45%), with dominant regions concentrated in the upper reaches, characterized by a clear high-altitude clustering pattern.
Additionally, different climatic factors exhibit dominant roles at varying topographic elevations (Figure 6). MAT predominantly drives WUE and CUE changes in low-lying areas near the Yellow River estuary and high-elevation regions, while MAP primarily affects WUE and CUE in lower elevations. SR, on the other hand, has a stronger influence on WUE and CUE changes in higher elevation areas.

4.3. GPP, NPP, WUE, and CUE of Different Land Use Types

4.3.1. Mean Changes for Different Land Use Types

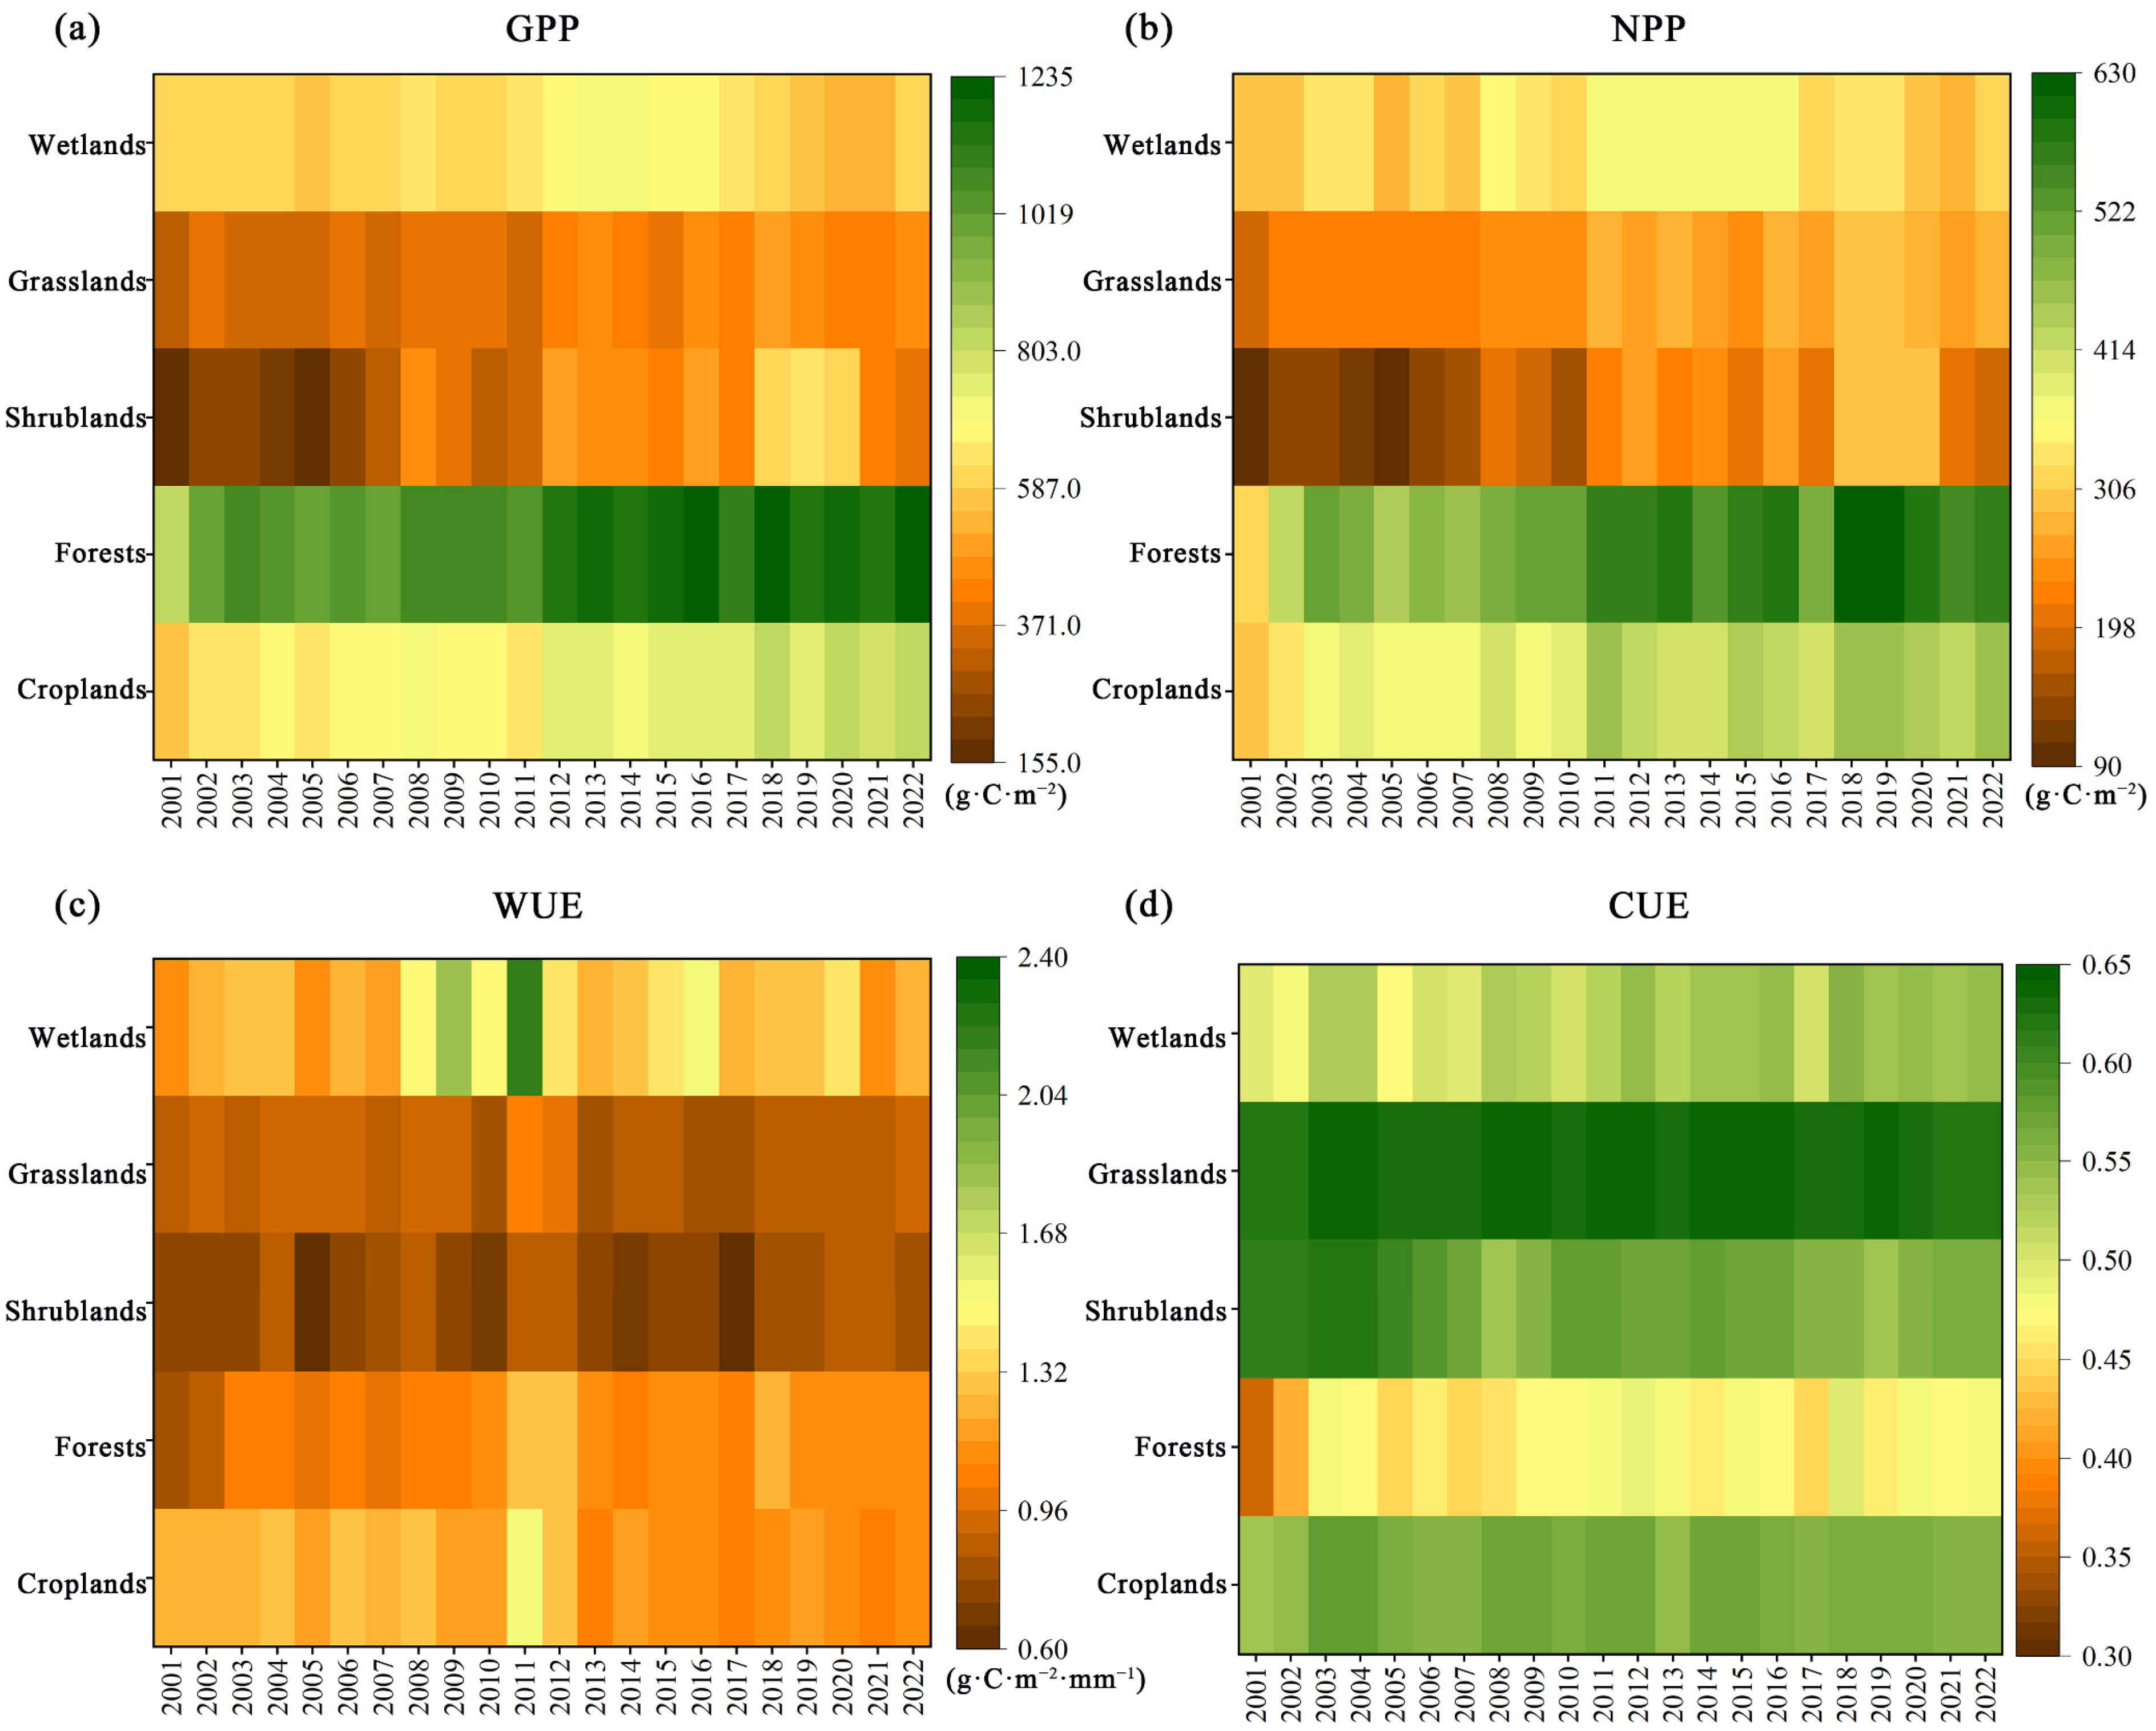
As shown in Figure 7, forests exhibited the highest GPP, with a value of 1095.54 g C m−2, followed by croplands at 710.50 g C m−2, while shrublands recorded the lowest GPP at 385.49 g C m−2. In terms of NPP, forests also had the highest value of 521.38 g C m−2, followed by croplands at 402.60 g C m−2, and shrublands again recorded the lowest at 195.68 g C m−2. WUE varied notably across land use types, with wetlands achieving the highest value of 1.36 g C m−2 mm−1, while shrublands showed the lowest value of 0.78 g C m−2 mm−1. Grasslands showed the highest CUE of 0.63, compared to forests, which had a lower value of 0.46. WUE trends for all land uses initially increased before declining; however, all land types, except shrublands, displayed an upward trend in CUE, notably rising by 0.11 in forests.

4.3.2. Partial Correlation Coefficients of MAT, MAP, and SR Under Different Land Use Types

There are considerable differences in how land use types respond to key climatic factors (Figure 8). First, GPP and NPP generally show positive correlations with MAT and MAP but tend to correlate negatively with SR, reflecting the complex regulatory effects of climate on plant productivity. Second, WUE is broadly negatively affected by MAT, particularly in croplands (37.68%) and grasslands (20.68%), indicating that rising temperatures constrain plant water use. MAP exerts a notably positive influence on croplands’ WUE, with over 75% of regions showing positive correlations, whereas grasslands exhibited an opposite pattern. The effect of SR on forest WUE is limited but shows slight positive correlations in shrublands (13.37%) and grasslands (9.36%).
Similarly, CUE is generally negatively affected by MAT, particularly in croplands (26.33%) and grasslands (21.48%). In most land use types, MAP exerts a positive influence on CUE. Notably, the effect of SR on CUE varies significantly by land type: it slightly promotes CUE in croplands (7.38%) but shows a strong negative correlation in shrublands (87.28%), forests (56.47%), and wetlands (61.87%). These differences reveal significant variation in the dominant climate drivers of WUE and CUE across land use types, underscoring the heterogeneity in ecosystem functional responses to climatic variables and their potential ecological implications.

4.3.3. Relative Contributions Under Different Land Use Types

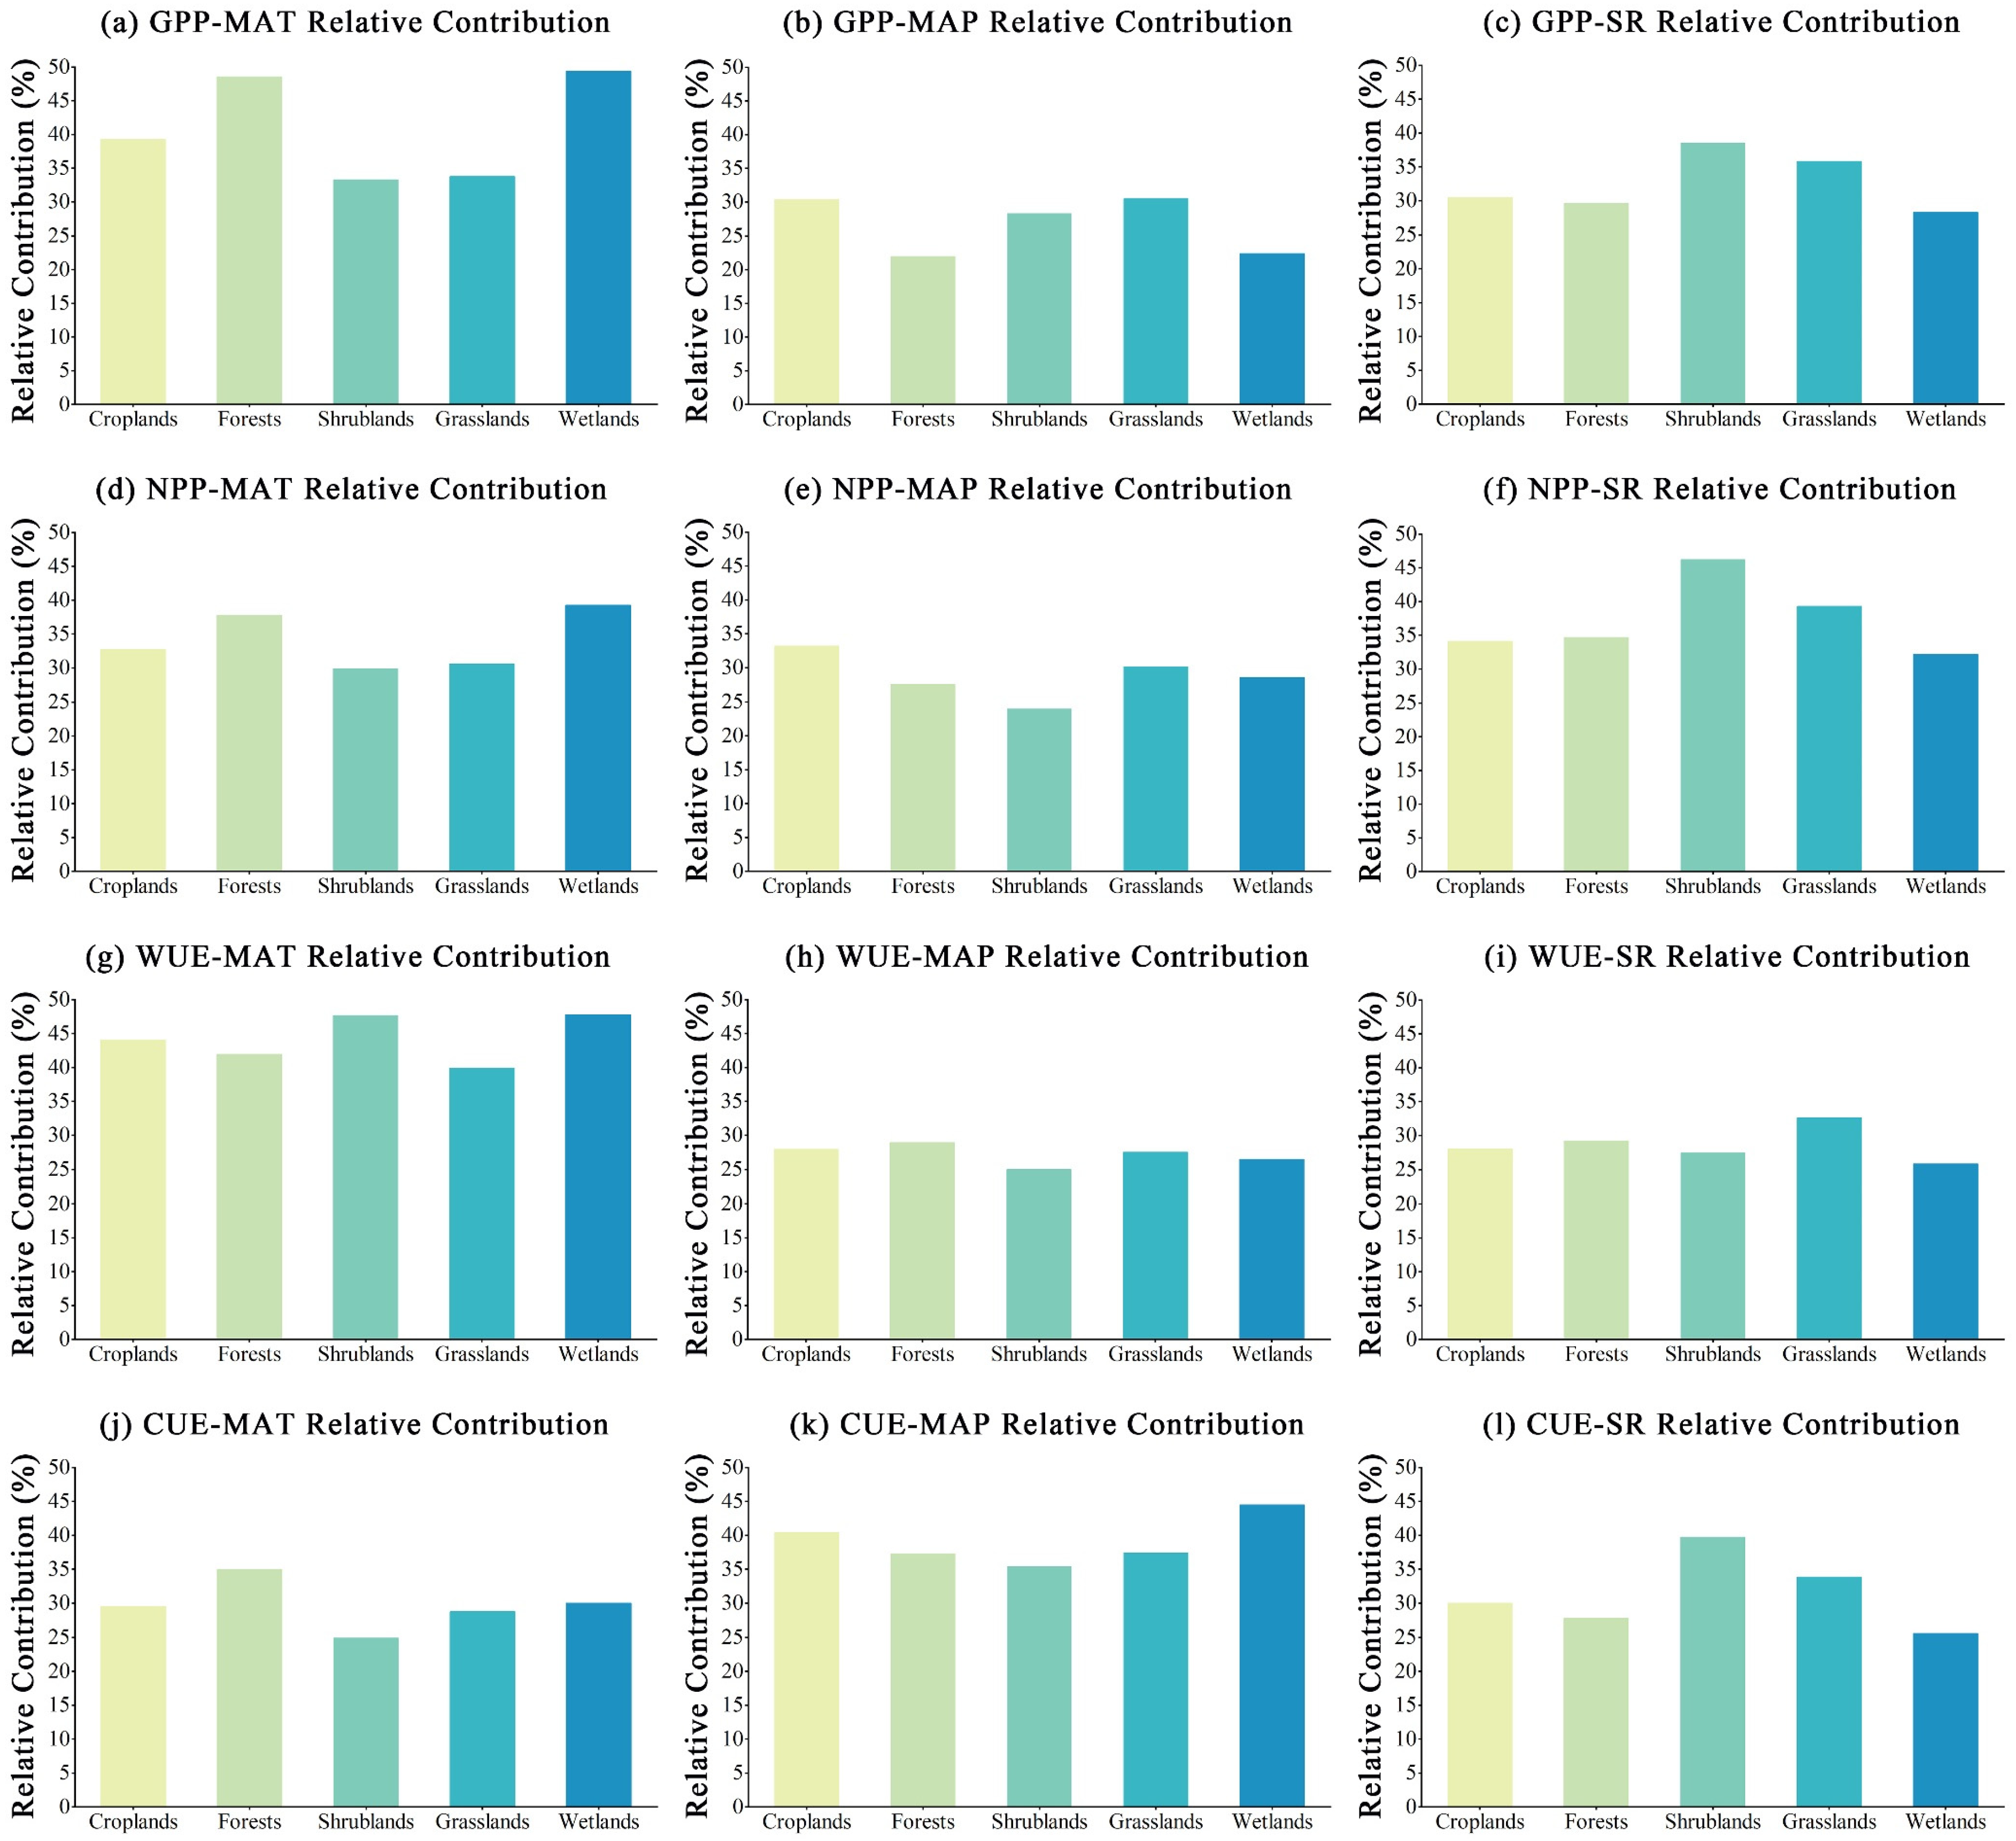
We further evaluated the RC of climatic factors to GPP, NPP, WUE, and CUE across different land use types (Figure 9). MAT contributed over 33% to GPP in croplands, forests, grasslands, and wetlands, with particularly high contributions in wetlands (49.33%) and forests (48.50%). In contrast, MAP’s contribution to GPP remained below 33.33% across all land use types. SR exhibited notable contributions to GPP in grasslands and shrublands, both exceeding 35%. For NPP, MAT’s contribution exceeded 35% in forests and wetlands, while MAP’s contribution remained below 33.33% across all land use categories. SR showed substantial contributions to NPP in shrublands (46.25%) and grasslands (39.30%). Regarding WUE, MAT had high contributions in shrublands (47.61%) and wetlands (47.73%), whereas MAP contributed less than 30% in all land use types. SR’s contribution to WUE was notably high in grasslands (32.64%). As for CUE, MAT contributed 34.93% in forests. MAP showed consistently high contributions to CUE, exceeding 35% across all land use types. SR also contributed substantially to CUE in shrublands (39.75%) and grasslands (33.86%).
To better understand land use–climate interactions, we compared the contributions of typical climatic variables to GPP, NPP, WUE, and CUE across distinct land use types. MAT had a greater influence on GPP in croplands, forests, and wetlands than MAP and SR. In contrast, GPP in grasslands and shrublands was more strongly affected by SR than by MAP or MAT. The impact of MAP on GPP was relatively low across all land use types. For NPP, MAT exerted a greater influence on forests and wetlands than MAP and SR, whereas SR had a larger effect on grasslands and shrublands compared to MAP and MAT. The differences among the three climate factors on cropland NPP were not significant. MAT consistently showed a stronger effect on WUE across all land use types compared to MAP and SR. MAP had a greater influence on CUE in croplands, forests, grasslands, and wetlands than SR and MAT, while SR had a stronger impact on shrublands CUE than MAP and MAT.

5. Discussion

5.1. Changes in the Spatiotemporal Distribution

Our findings reveal a pronounced upward trajectory in the mean GPP and NPP from 2001 to 2023, corroborating earlier studies on vegetation productivity dynamics in the region [52,53]. The mean values of WUE and CUE were found to be 0.73 g C m−2 mm−1 and 0.60. Previous global studies reported WUE variations from 0.5 to 4 g C m−2 mm−1, suggesting that the YRB has a relatively low WUE compared to other regions worldwide [54]. While initial research assumed a constant CUE of 0.5 [55], it is now well established that CUE varies significantly across land use types and regions [33]. For example, studies on Chinese ecosystems during the early 21st century reported mean WUE values of 1.47–1.62 g C m−2 mm−1 and CUE values of 0.54–0.57 [8,56]. The mean CUE observed in our study exceeded these previous values, likely due to the elevated CUE levels in cold and arid regions [57]. The lower WUE observed in this study compared to others may result from differences in its calculation. Here, WUE was defined as NPP divided by ET, inherently producing lower values than studies using GPP over ET. The WUE (0.82 g C m−2 mm−1) calculated using NPP and ET in the Huaihe River Basin (adjacent to the YRB) is similar to the results of the YRB in this study [58,59]. The arid and semi-arid conditions characteristic of the YRB reduce vegetation productivity, which contributes to the lower mean WUE. This aligns with observations from Dong et al. on WUE in the Mongolian Plateau [60].
The Loess Plateau demonstrates lower water utilization efficiency, with substantial MAP losses through runoff and soil evaporation, which minimally benefit vegetation productivity while increasing evaporative water loss [61]. Consequently, our results indicate a fluctuating but overall declining trend in WUE and CUE within the YRB. These findings are consistent with research using MODIS and GLASS data products [27,29,62]. The increase in GPP in the YRB (58.95%) outpaced the rise in NPP (52.84%), indirectly contributing to a decline in vegetation CUE. Under drought conditions, plants prioritize conserving temporary carbohydrate and nutrient reserves over new tissue growth as an adaptive response to water and nutrient scarcity. This strategy slows leaf growth, reduces photosynthesis, and ultimately lowers CUE. Since 1990, China has led large-scale ecological restoration projects in the YRB, significantly increasing vegetation cover, enhancing vegetation carbon sequestration capacity, and improving the ecological environment [63]. However, increases in NPP and ET associated with newly planted vegetation can also reduce soil moisture and exacerbate surface aridification [4,64]. Additionally, climate warming and increased humidity have been shown to elevate ET levels and reduce net ecosystem CO2 exchange (NEE), thereby decreasing terrestrial ecosystem CUE and WUE in the YRB [65,66].
The spatial distribution of WUE and CUE within the YRB revealed a pronounced concentration in the southeastern region, contrasting sharply with the significantly lower concentrations in the northwest. These results align with Liu et al. [52]. In our study, over 70% of regions exhibited mean CUE values exceeding 0.52, while more than 50% showed mean WUE values above 0.65 (Figure 2). The eastern YRB has emerged as a focal point for vegetation restoration, with recent ecological protection measures enhancing vegetation cover, thereby improving water-holding capacity and elevating WUE levels [67]. Projections for WUE in the YRB suggest that approximately 69% of the area will experience a declining trend, likely driven by the interplay of increased MAP and MAT, which elevate ET while NPP growth remains comparatively modest, leading to reduced vegetation WUE. Similarly, Tian et al. reported a decrease in WUE across East Asia from 1948 to 2000 [68].
These findings highlight the challenge of balancing productivity and resource efficiency under warming scenarios. Ecosystems in the YRB may increasingly consume water without proportional increases in carbon production, indicating that any rise in productivity or carbon sink capacity will likely demand greater water consumption. Similar trends were noted by Kim et al., who projected a slight decline in terrestrial ecosystem CUE across China under future climate scenarios, with an accelerated decrease under higher radiative forcing conditions [69].

5.2. Responses of WUE and CUE to Climatic Factors

The response of WUE to MAT, MAP, and SR exhibited marked regional variability. Specifically, WUE showed a positive correlation with both MAT and MAP near the Ningxia Plain in the northwestern YRB. This relationship may be explained by the adaptive strategies of grass plants under drought stress, which involve reducing leaf stomatal conductance as MAT increases, thereby enhancing WUE [14]. In the northwestern region of the Loess Plateau, shrubland WUE demonstrated a strong positive correlation with MAP, suggesting that MAP is a key factor influencing shrubland WUE in arid and semi-arid regions. In contrast, the observed non-significant negative correlation between WUE and MAT in this region may be linked to soil nutrient content. Enhancing soil organic matter is critical for forming soil aggregates that improve water availability for plants and regulate evapotranspiration rates [70]. Previous research has shown a negative correlation between soil organic matter and WUE, with soil organic matter also influencing soil water-holding capacity [65]. This correlation may also reflect chance bias due to the coexistence of sandy and irrigated agricultural lands in the area.
SR has been identified as another significant factor affecting plant photosynthesis, with an equally important impact on WUE [71]. In the northeastern Loess Plateau, an arid region with limited water resources, vegetation WUE exhibited a notable positive correlation with SR. Plants in such environments often adapt to early growing seasons by modifying leaf size, stomatal density, and root structure to improve WUE [72]. Although increased SR can elevate plant transpiration rates, plants in arid regions tend to adjust their transpiration mechanisms to minimize water loss. These physiological adaptations enable plants to optimize solar energy use for photosynthesis while reducing water loss, achieving higher WUE without significantly compromising photosynthetic activity.
CUE is negatively correlated with MAT across more than 70% of the YRB [73]. As MAT rises, the energy expenditure required to sustain plant tissue viability increases, particularly through enhanced autotrophic respiration, leading to a decline in vegetation CUE. This observation aligns with the findings of Luo et al. [74]. In this context, ongoing global warming exerts considerable pressure on the ecological integrity of the YRB. CUE reflects the interplay between atmospheric conditions, vegetation, soil microorganisms, and other ecological factors, making its variations inherently complex. Changes in MAT influence both photosynthesis and autotrophic respiration, which in turn affect vegetation CUE [75]. The decline in CUE with increasing MAT may also be attributed to the numerous parameters used to calculate MAT sensitivity in MODIS products [57]. Under relatively dry conditions, an increase in MAP has been shown to reduce root production and respiration rates, thereby improving vegetation CUE [56]. However, in regions where MAP exceeds 300 mm, a negative correlation between MAP and CUE is observed, which is consistent with the findings of Ye et al. [76]. This phenomenon may result from excessive water impeding oxygen diffusion in the soil, which slows soil organic matter decomposition and nutrient supply, ultimately reducing CUE. SR significantly influences CUE through its impact on plant photosynthesis. As SR intensity increases, both NPP and GPP rise; however, the increase in GPP outpaces that of NPP, leading to a decline in CUE, particularly in the central YRB.

5.3. Differences in CUE and WUE Across Land Use Types

WUE of different land use types exhibits the following order: wetlands > croplands > forests > grasslands > shrublands. Wetlands and croplands are primarily located in the downstream Huang- Huai-hai Plain, and the higher water availability in the region is the key factor influencing WUE for these land use categories [14]. The elevated WUE observed in wetlands can be attributed to their inherent ability to supply sufficient water and nutrients required for plant growth. In contrast, croplands benefit from human interventions such as irrigation and fertilization, which meet the water and nutrient demands necessary for optimal crop development. These practices enhance the water and carbon cycles, with sufficient water availability reducing evapotranspiration impacts, leading to higher WUE values for both wetlands and croplands [77]. Forests exhibit relatively high WUE due to cooperation among tree species and their efficient use of environmental resources, which results in high photosynthetic efficiency, greater organic matter accumulation, and increased biomass compared to other land use types. Additionally, forests experience low variability in ground and air temperatures and reduced wind speeds, contributing to lower surface evapotranspiration. These conditions place forest WUE in the mid-range among all land use types [78]. Grasslands and shrublands, however, show lower WUE values, with grasslands slightly outperforming shrublands. While shrubs are generally expected to have higher WUE than grasses due to their larger biomass, the arid and semi-arid regions where these land use types dominate in the YRB constrain shrub growth due to limited moisture availability. Herbaceous plants, requiring less water than shrubs, adapt more effectively to these conditions [67]. Furthermore, the small leaf size and low chlorophyll content of common shrubs in the YRB, including sea buckthorn and lemon grass, can limit the effectiveness of remote sensing in accurately capturing their spatial extent. This limitation may lead to underestimation of GPP, contributing to the observed lower WUE values in shrublands [79].
CUE of different land use types exhibited the following order: grasslands > shrublands > croplands > wetlands > forests. This pattern may be attributed to the lower net photosynthesis rates in forests and wetlands, which are influenced by greater root respiration and inter-root microbial respiration compared to land use types with lower vegetation cover [80]. These factors reduce net carbon sequestration and consequently lower CUE in these ecosystems. Interestingly, CUE exhibited a clear increasing trend across all land use types in the latter part of the study period. This suggests that ecological restoration initiatives, such as the fallow farmland reforestation project, have yielded substantial benefits. Specifically, these efforts have contributed to annual increases in both carbon sequestration capacity and carbon sequestration efficiency.
Grasslands, shrublands, and croplands were the main land use types where vegetation CUE exhibited an inverse correlation with MAT. In grasslands and shrublands, this negative correlation is likely driven by a combination of factors, including nitrogen deposition, VPD, biological activity, and soil microbial diversity [81]. However, uncertainties in this relationship may also stem from data precision limitations [82]. For croplands, CUE exhibited a positive response to MAP in this study. In the lower basin with relatively high water availability, elevated MAP contributes to the enhanced development of crop root systems. This reduces root respiration rates, thereby increasing CUE. Additionally, global field data indicate that cropland CUE increases with nutrient gradients influenced by agronomic practices such as fertilization and irrigation [83]. Therefore, variations in soil nutrient content within cropland ecosystems may represent a significant factor affecting CUE in the region. While shrubland CUE showed a notable negative correlation with SR, shrublands are predominantly located at higher elevations, where SR intensity is elevated. Increased shortwave radiation in these areas negatively affects shrubland CUE, likely due to its adverse impact on photosynthesis and related processes [74].

5.4. Policy Impact and Implications

Although large-scale ecological projects, such as the Grain-for-Green Program and the Three-North Shelter Forest Program, have significantly enhanced NPP and GPP in the YRB in the study period, both CUE and WUE have shown declining trends. This indicates that vegetation restoration has not only increased the vegetation cover but also water consumption, which could reduce WUE and CUE. In other words, the current vegetation-centered governance strategy is no longer sufficient to meet the sustainable goal of achieving synergies between carbon and water cycles.
Future ecological policies should shift toward a more integrated and synergistic approach to improve resource use efficiency and ensure that carbon sequestration benefits are not achieved at the cost of water sustainability. It is essential for governments to incorporate key ecological efficiency indicators such as WUE and CUE into the evaluation systems of ecological policies, rather than focusing solely on the expansion of vegetative cover. Moreover, the study revealed that wetlands showed high WUE but low CUE, and grasslands had the highest CUE but limited WUE. Therefore, differentiated management strategies should be developed based on the functional characteristics of various land use types. For example, in the upper reaches of the YRB, grassland and shrubland ecosystems should be prioritized for conservation to enhance their resource use efficiency and avoid indiscriminate afforestation. Croplands should strengthen irrigation control and nutrient management to optimize CUE.

5.5. Research Contributions and Limitations

We assume our study may have made two primary advances. First, it established an assessment framework for evaluating WUE and CUE across different land use types, which can advance the understanding of the relationships between land use and ecosystem functions. Additionally, from a practical perspective, the framework grounded in land use classification can help government agencies in implementing differentiated ecosystem management strategies and formulating more targeted policies.
Several uncertainties and limitations remain. Firstly, only three climate factors were considered, potentially omitting other critical variables that influence the full spectrum of climate change impacts. Additionally, because land use type data were only available for 2001–2022, the WUE and CUE of different land use types and their responses to climate factors in 2023 were not analyzed. The resolution of the MODIS data product (500 m × 500 m) poses another limitation, making it difficult to accurately identify land use types in the YRB. Moreover, the study only accounted for first-level land use classifications without further refinement into subcategories, which may have oversimplified the analysis. Furthermore, the reliance on global-scale data products introduces some degree of error, affecting the accuracy of our understanding of Spatiotemporal variation patterns of WUE and CUE and their drivers in the YRB.
Future research can address these limitations in several ways. First, utilizing datasets with longer time series and higher spatial resolution can provide a more detailed and accurate representation of the spatiotemporal variation patterns. Second, when selecting influencing factors, future studies should consider incorporating additional variables such as soil moisture, soil type, nitrogen deposition, and vapor pressure deficit to achieve a more comprehensive analysis. Lastly, the impact of land use change on WUE and CUE may exhibit nonlinear behaviors. To better capture these dynamics, deep learning techniques should be utilized to explore the relative influence of land use changes on WUE or CUE.

6. Conclusions

This study employed geospatial analysis to assess the spatiotemporal variations of WUE and CUE across different land use types in the YRB. Furthermore, it applied partial correlation and relative importance analyses to investigate the influence of representative climatic factors and identify the dominant climatic drivers for each land use type. The results indicated the following: (1) from 2001 to 2023, the mean WUE was 0.73 g C m−2 mm−1, while the mean CUE was 0.60. Approximately 70% of the YRB showed declining WUE levels, with CUE also decreasing in about 60% of the area. (2) The WUE ranking across land use types was wetlands > croplands > forests > grasslands > shrublands. For CUE, the ranking was grasslands > shrublands > croplands > wetlands > forests. (3) WUE initially increased and then declined across all land use types, whereas CUE generally increased, except in shrublands. (4) WUE was negatively correlated with MAT and MAP in 89% and 58% of the YRB, respectively. Similarly, CUE was negatively correlated with MAT (74%), MAP (51%), and SR (54%).

Author Contributions

Conceptualization, P.D. and L.C.; Data curation, L.C. and P.D.; Formal analysis, L.C.; Funding acquisition, X.T.; Methodology, X.T. and P.D.; Project administration, P.D. and X.T.; Software, L.C.; Supervision, P.D.; Validation, X.T. and P.D.; Writing—original draft, L.C.; Writing—review and editing, X.T. and P.D. All authors have read and agreed to the published version of the manuscript.

Funding

This research was funded by the National Natural Science Foundation of China (52068040, 32460258), the Natural Science Foundation of Gansu Province (23JRRA1097), and the Department of Education of Gansu Province (2025CXZX-699).

Data Availability Statement

The data presented in this study are available on request from the corresponding author.

Conflicts of Interest

The authors declare no conflicts of interest.

Appendix A

Appendix A.1. Sampling Points
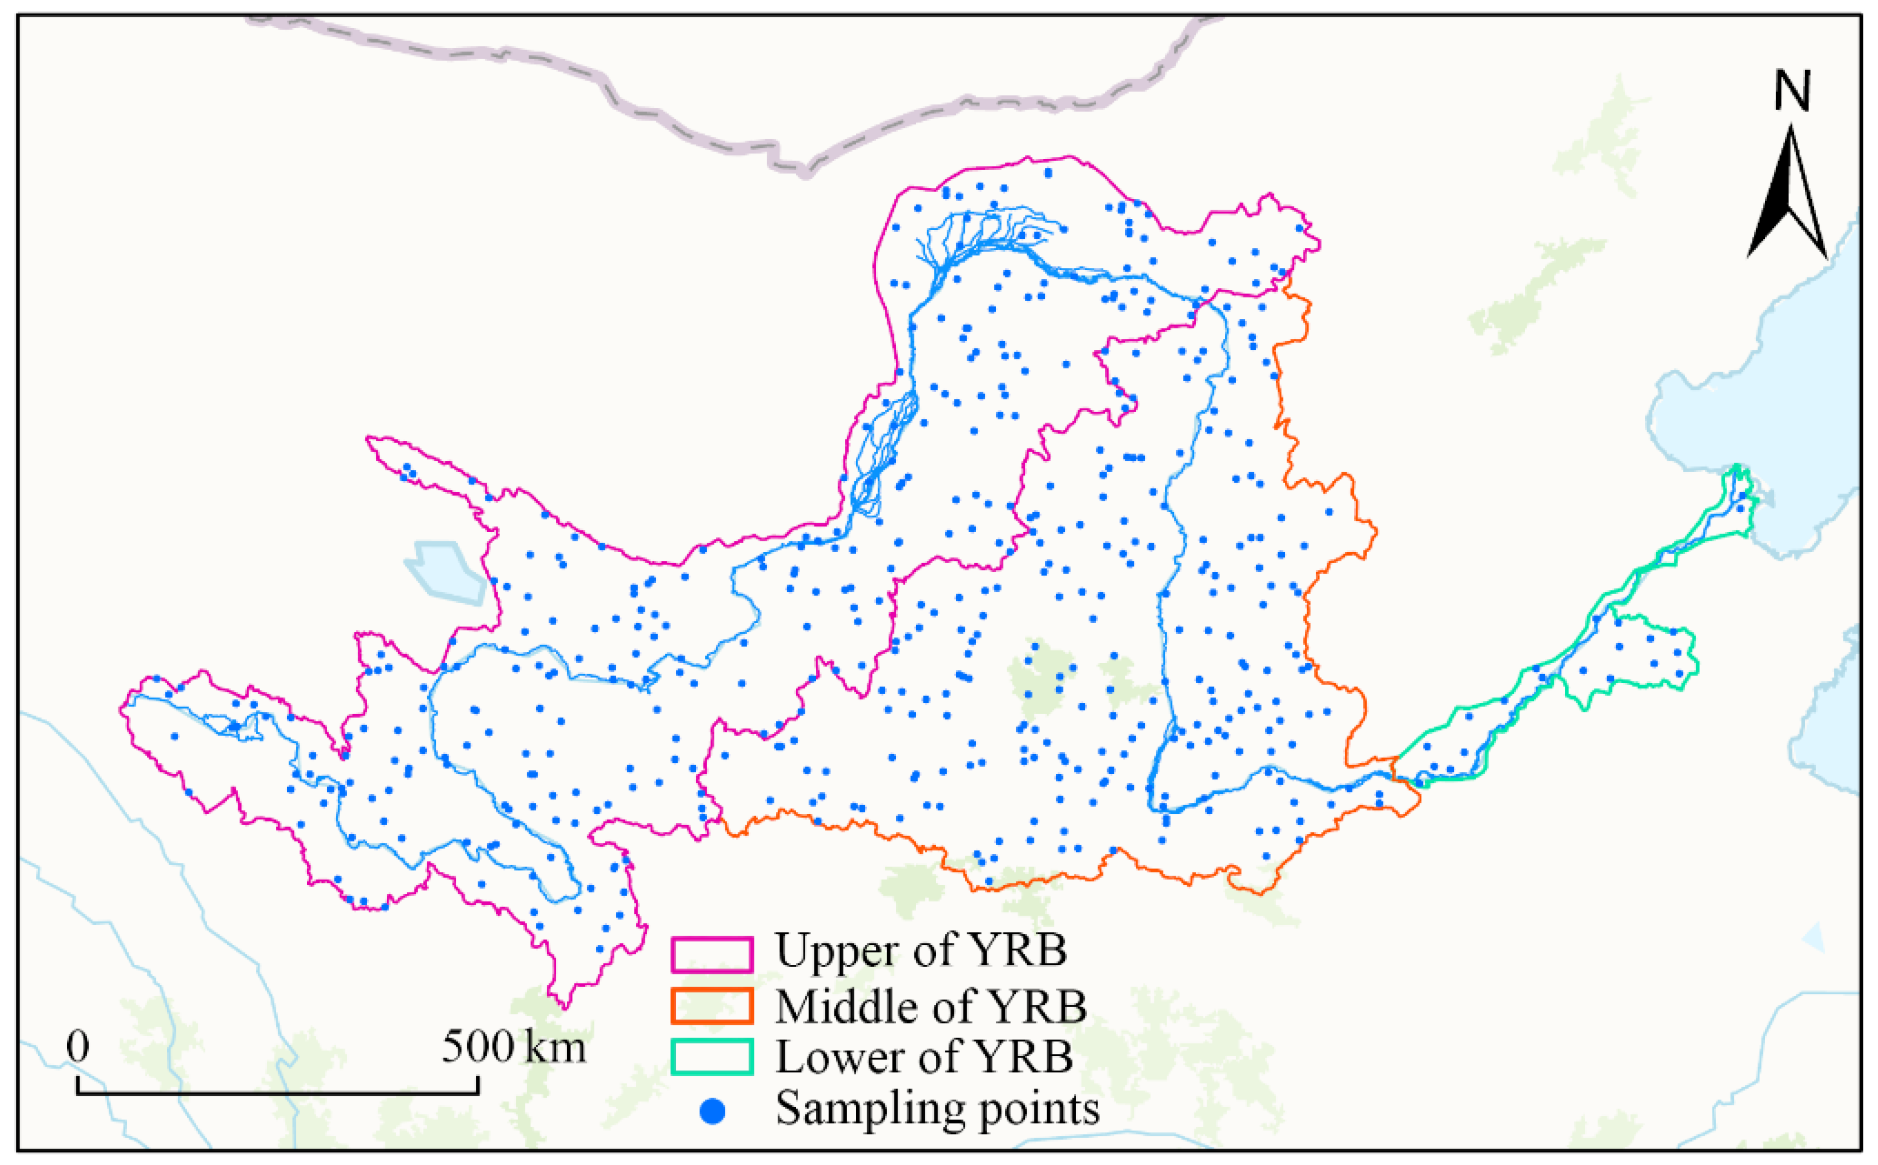
Figure A1. Sampling points.
Land 14 01614 g0a1

Appendix A.2. Results of the Partial Correlation Coefficients

Figure A2. Spatial distribution of PC coefficients. (ac) PC coefficients between GPP and MAT, MAP, and SR; (df) PC coefficients between NPP and MAT, MAP, and SR; (gi) PC coefficients between WUE and MAT, MAP, and SR; (jl) PC coefficients between CUE and MAT, MAP, and SR.
Land 14 01614 g0a2

References

  1. Gang, C.; Zhang, Y.; Guo, L.; Gao, X.; Peng, S.; Chen, M.; Wen, Z. Drought-Induced Carbon and Water Use Efficiency Responses in Dryland Vegetation of Northern China. Front. Plant Sci. 2019, 10, 224. [Google Scholar] [CrossRef]
  2. United Nations. Transforming Our World: The 2030 Agenda for Sustainable Development; United Nations: New York, NY, USA, 2015. [Google Scholar]
  3. DeLUCIA, E.H.; Drake, J.E.; Thomas, R.B.; Gonzalez-Meler, M. Forest Carbon Use Efficiency: Is Respiration a Constant Fraction of Gross Primary Production? Glob. Change Biol. 2007, 13, 1157–1167. [Google Scholar] [CrossRef]
  4. Ito, A.; Inatomi, M. Water-Use Efficiency of the Terrestrial Biosphere: A Model Analysis Focusing on Interactions between the Global Carbon and Water Cycles. J. Hydrometeorol. 2012, 13, 681–694. [Google Scholar] [CrossRef]
  5. Shao, W.; Guan, Q.; Liu, H.; Sun, W.; Sun, Y. Temporal and Spatial Dynamics of Carbon and Water Use Efficiency on the Qinghai-Tibet Plateau and Their Ecosystem Responses. J. Clean. Prod. 2024, 475, 143581. [Google Scholar] [CrossRef]
  6. Prieto, I.; León-Sánchez, L.; Nicolás, E.; Nortes, P.; Querejeta, J.I. Warming Reduces Both Photosynthetic Nutrient Use Efficiency and Water Use Efficiency in Mediterranean shrubs Warming Reduces Nutrient Use Efficiency. Environ. Exp. Bot. 2023, 210, 105331. [Google Scholar] [CrossRef]
  7. Ji, Y.; Li, Y.; Yao, N.; Biswas, A.; Zou, Y.; Meng, Q.; Liu, F. The Lagged Effect and Impact of Soil Moisture Drought on Terrestrial Ecosystem Water Use Efficiency. Ecol. Indic. 2021, 133, 108349. [Google Scholar] [CrossRef]
  8. Chen, G.; Zuo, D.; Xu, Z.; Wang, G.; Han, Y.; Peng, D.; Pang, B.; Abbaspour, K.C.; Yang, H. Changes in Water Conservation and Possible Causes in the Yellow River Basin of China during the Recent Four Decades. J. Hydrol. 2024, 637, 131314. [Google Scholar] [CrossRef]
  9. Cai, W.; Ullah, S.; Yan, L.; Lin, Y. Remote Sensing of Ecosystem Water Use Efficiency: A Review of Direct and Indirect Estimation Methods. Remote Sens. 2021, 13, 2393. [Google Scholar] [CrossRef]
  10. Chakraborty, A.; Sekhar, M.; Rao, L. The Fate of Vegetation Carbon Stocks of India: Insights from a Remote-Sensed Evaluation of Carbon Use Efficiency. Ecol. Inform. 2023, 78, 102374. [Google Scholar] [CrossRef]
  11. Wang, T.; Sun, S.; Yin, Y.; Zhao, J.; Tang, Y.; Wang, Y.; Gao, F.; Luan, X. Status of Crop Water Use Efficiency Evaluation Methods: A Review. Agric. For. Meteorol. 2024, 349, 109961. [Google Scholar] [CrossRef]
  12. Kpemoua, T.P.I.; Leclerc, S.; Barré, P.; Houot, S.; Pouteau, V.; Plessis, C.; Chenu, C. Are Carbon-Storing Soils More Sensitive to Climate Change? A Laboratory Evaluation for Agricultural Temperate Soils. Soil. Biol. Biochem. 2023, 183, 109043. [Google Scholar] [CrossRef]
  13. Campioli, M.; Vicca, S.; Luyssaert, S.; Bilcke, J.; Ceschia, E.; Chapin III, F.S.; Ciais, P.; Fernández-Martínez, M.; Malhi, Y.; Obersteiner, M.; et al. Biomass Production Efficiency Controlled by Management in Temperate and Boreal Ecosystems. Nat. Geosci. 2015, 8, 843–846. [Google Scholar] [CrossRef]
  14. Zhao, A.; Zhang, A.; Cao, S.; Feng, L.; Pei, T. Spatiotemporal Patterns of Water Use Efficiency in China and Responses to Multi-Scale Drought. Theor. Appl. Climatol. 2020, 140, 559–570. [Google Scholar] [CrossRef]
  15. Marjanovic, H.; Anic, M.; Zorana Ostrogovic Sever, M.; Kern, A. Assessing Forest Productivity (NPP/GPP) Estimates from Remote Sensing, Flux Measurement and Field Observations. In Proceedings of the EGU General Assembly Conference Abstracts, Vienna, Austria, 12–17 April 2015; p. 11678. [Google Scholar]
  16. Xiao, B.; Bai, X.; Zhao, C.; Tan, Q.; Li, Y.; Luo, G.; Wu, L.; Chen, F.; Li, C.; Ran, C.; et al. Responses of Carbon and Water Use Efficiencies to Climate and Land Use Changes in China’s Karst Areas. J. Hydrol. 2023, 617, 128968. [Google Scholar] [CrossRef]
  17. Ding, H.; Shi, X.; Yuan, Z.; Chen, X.; Zhang, D.; Chen, F. Does Vegetation Greening Have a Positive Effect on Global Vegetation Carbon and Water Use Efficiency? Sci. Total Environ. 2024, 951, 175589. [Google Scholar] [CrossRef] [PubMed]
  18. Chen, J.; Pu, J.; Li, J.; Zhang, T. Response of Carbon- and Water-Use Efficiency to Climate Change and Human Activities in China. Ecol. Indic. 2024, 160, 111829. [Google Scholar] [CrossRef]
  19. Niu, S.; Chen, W.; Liáng, L.L.; Sierra, C.A.; Xia, J.; Wang, S.; Heskel, M.; Patel, K.F.; Bond-Lamberty, B.; Wang, J.; et al. Temperature Responses of Ecosystem Respiration. Nat. Rev. Earth Environ. 2024, 5, 559–571. [Google Scholar] [CrossRef]
  20. Xiong, L.; Wang, J.; Ding, J.; Zhang, Z.; Qin, S.; Wang, R. Response of Carbon and Water Use Efficiency to Climate Change and Human Activities in Central Asia. Land 2024, 13, 2072. [Google Scholar] [CrossRef]
  21. Eyring, V.; Bony, S.; Meehl, G.A.; Senior, C.A.; Stevens, B.; Stouffer, R.J.; Taylor, K.E. Overview of the Coupled Model Intercomparison Project Phase 6 (CMIP6) Experimental Design and Organization. Geosci. Model Dev. 2016, 9, 1937–1958. [Google Scholar] [CrossRef]
  22. Hu, X.; Shi, S.; Zhou, B.; Ni, J. A 1 Km Monthly Dataset of Historical and Future Climate Changes over China. Sci. Data 2025, 12, 436. [Google Scholar] [CrossRef]
  23. Cui, Q.; Tan, L.; Ma, H.; Wei, X.; Yi, S.; Zhao, D.; Lu, H.; Lin, P. Effective or Useless? Assessing the Impact of Park Entrance Addition Policy on Green Space Services from the 15-Minute City Perspective. J. Clean. Prod. 2024, 467, 142951. [Google Scholar] [CrossRef]
  24. Sun, H.; Bai, Y.; Lu, M.; Wang, J.; Tuo, Y.; Yan, D.; Zhang, W. Drivers of the Water Use Efficiency Changes in China during 1982–2015. Sci. Total Environ. 2021, 799, 149145. [Google Scholar] [CrossRef]
  25. Ryan, M.G.; Hubbard, R.M.; Pongracic, S.; Raison, R.J.; McMurtrie, R.E. Foliage, Fine-Root, Woody-Tissue and Stand Respiration in Pinus Radiata in Relation to Nitrogen Status. Tree Physiol. 1996, 16, 333–343. [Google Scholar] [CrossRef]
  26. Mganga, K.Z.; Sietiö, O.-M.; Meyer, N.; Poeplau, C.; Adamczyk, S.; Biasi, C.; Kalu, S.; Räsänen, M.; Ambus, P.; Fritze, H.; et al. Microbial Carbon Use Efficiency along an Altitudinal Gradient. Soil Biol. Biochem. 2022, 173, 108799. [Google Scholar] [CrossRef]
  27. Feng, Y.; Wu, J.; Li, M.; Chen, B.; Tilahun, M.; Zhang, X. Carbon Use Efficiency of Alpine Grasslands Affected by Grazing Exclusion and Local Environmental Context in Tibet, China. Glob. Ecol. Conserv. 2024, 56, e03275. [Google Scholar] [CrossRef]
  28. Xia, L.; Wang, F.; Mu, X.; Jin, K.; Sun, W.; Gao, P.; Zhao, G. Water Use Efficiency of Net Primary Production in Global Terrestrial Ecosystems. J. Earth Syst. Sci. 2015, 124, 921–931. [Google Scholar] [CrossRef]
  29. Ogutu, B.O.; D’Adamo, F.; Dash, J. Impact of Vegetation Greening on Carbon and Water Cycle in the African Sahel-Sudano-Guinean Region. Glob. Planet. Change 2021, 202, 103524. [Google Scholar] [CrossRef]
  30. Chen, Y.; Fu, B.; Zhao, Y.; Wang, K.; Zhao, M.M.; Ma, J.; Wu, J.-H.; Xu, C.; Liu, W.; Wang, H. Sustainable Development in the Yellow River Basin: Issues and Strategies. J. Clean. Prod. 2020, 263, 121223. [Google Scholar] [CrossRef]
  31. Yang, Y.; Li, H. Monitoring Spatiotemporal Characteristics of Land-Use Carbon Emissions and Their Driving Mechanisms in the Yellow River Delta: A Grid-Scale Analysis. Environ. Res. 2022, 214, 114151. [Google Scholar] [CrossRef]
  32. Zhang, L.; Deng, C.; Kang, R.; Yin, H.; Xu, T.; Kaufmann, H.J. Assessing the Responses of Ecosystem Patterns, Structures and Functions to Drought under Climate Change in the Yellow River Basin, China. Sci. Total Environ. 2024, 929, 172603. [Google Scholar] [CrossRef] [PubMed]
  33. Gang, C.; Wang, Z.; Chen, Y.; Yang, Y.; Li, J.; Cheng, J.; Qi, J.; Odeh, I. Drought-Induced Dynamics of Carbon and Water Use Efficiency of Global Grasslands from 2000 to 2011. Ecol. Indic. 2016, 67, 788–797. [Google Scholar] [CrossRef]
  34. Zhang, J.; Zhang, Y.; Qin, Y.; Lu, X.; Cao, J. The Spatiotemporal Pattern of Grassland NPP in Inner Mongolia Was More Sensitive to Moisture and Human Activities than That in the Qinghai-Tibetan Plateau. Glob. Ecol. Conserv. 2023, 48, e02709. [Google Scholar] [CrossRef]
  35. Du, L.; Gong, F.; Zeng, Y.; Ma, L.; Qiao, C.; Wu, H. Carbon Use Efficiency of Terrestrial Ecosystems in Desert/Grassland Biome Transition Zone: A Case in Ningxia Province, Northwest China. Ecol. Indic. 2021, 120, 106971. [Google Scholar] [CrossRef]
  36. Yang, H.; Zhong, X.; Deng, S.; Xu, H. Assessment of the Impact of LUCC on NPP and Its Influencing Factors in the Yangtze River Basin, China. CATENA 2021, 206, 105542. [Google Scholar] [CrossRef]
  37. Hogan, D.; Schlenker, W. Non-Linear Relationships between Daily Temperature Extremes and US Agricultural Yields Uncovered by Global Gridded Meteorological Datasets. Nat. Commun. 2024, 15, 4638. [Google Scholar] [CrossRef] [PubMed]
  38. Panek-Chwastyk, E.; Ozbilge, C.N.; Dąbrowska-Zielińska, K.; Wróblewski, K. Assessment of Grassland Biomass Prediction Using AquaCrop Model: Integrating Sentinel-2 Data and Ground Measurements in Wielkopolska and Podlasie Regions, Poland. Agriculture 2024, 14, 837. [Google Scholar] [CrossRef]
  39. Cui, Q.; Huang, C.; Zhang, K.; Gao, C.; Gu, T.; Ke, E.; Lin, P. Weather Effects on Highway Travel Volume: Electric vs. Fuel Vehicles. Transp. Res. Part Transp. Environ. 2025, 145, 104805. [Google Scholar] [CrossRef]
  40. Li, Y.-J.; Wang, X.-J.; Gou, X.-H.; Wang, Q.; Ou, T.; Pang, G.-J.; Yang, M.-X.; Liu, L.-Y.; Qie, L.-Y.; Wang, T.; et al. Evaluation of the Performance of WRF9km in Simulating Climate over the Upper Yellow River Basin. Adv. Clim. Change Res. 2025, 16, 58–72. [Google Scholar] [CrossRef]
  41. Xu, Z.; Shen, X.; Ge, S.; Sun, Q.; Yang, Y.; Cao, L. An Advanced TSMK-FVC Approach Combined with Landsat 5/8 Imagery for Assessing the Long-Term Effects of Terrain and Climate on Vegetation Growth. Front. Plant Sci. 2024, 15, 1363690. [Google Scholar] [CrossRef] [PubMed]
  42. Yang, L.; Feng, Q.; Wen, X.; Barzegar, R.; Adamowski, J.F.; Zhu, M.; Yin, Z. Contributions of Climate, Elevated Atmospheric CO2 Concentration and Land Surface Changes to Variation in Water Use Efficiency in Northwest China. CATENA 2022, 213, 106220. [Google Scholar] [CrossRef]
  43. Meng, C.; Zhou, H.; Liu, X.; Zheng, J.; Wang, J.; Zeng, Q.; Hu, S. Distinguishing the Main Climatic Drivers of Terrestrial Vegetation Carbon Dynamics in Pan-Arctic Ecosystems. Ecol. Inform. 2025, 90, 103267. [Google Scholar] [CrossRef]
  44. Shijin, W.; Xiaoqing, P. Permafrost Degradation Services for Arctic Greening. CATENA 2023, 229, 107209. [Google Scholar] [CrossRef]
  45. Beer, C.; Ciais, P.; Reichstein, M.; Baldocchi, D.; Law, B.E.; Papale, D.; Soussana, J.-F.; Ammann, C.; Buchmann, N.; Frank, D.; et al. Temporal and Among-Site Variability of Inherent Water Use Efficiency at the Ecosystem Level. Glob. Biogeochem. Cycles 2009, 23, GB2018. [Google Scholar] [CrossRef]
  46. Zhang, G.; Wu, G. Factors Influencing Carbon and Water Use Efficiency in Changing Environments. Front. Environ. Sci. 2024, 12, 1481082. [Google Scholar] [CrossRef]
  47. Li, Z.; Huffman, T.; McConkey, B.; Townley-Smith, L. Monitoring and Modeling Spatial and Temporal Patterns of Grassland Dynamics Using Time-Series MODIS NDVI with Climate and Stocking Data. Remote Sens. Environ. 2013, 138, 232–244. [Google Scholar] [CrossRef]
  48. Gu, T.; Zhao, H.; Yue, L.; Guo, J.; Cui, Q.; Tang, J.; Gong, Z.; Zhao, P. Attribution Analysis of Urban Social Resilience Differences under Rainstorm Disaster Impact: Insights from Interpretable Spatial Machine Learning Framework. Sustain. Cities Soc. 2025, 118, 106029. [Google Scholar] [CrossRef]
  49. Xiao, H.; Xu, P.; Wang, L. The Unprecedented 2023 North China Heatwaves and Their S2S Predictability. Geophys. Res. Lett. 2024, 51, e2023GL107642. [Google Scholar] [CrossRef]
  50. Zhang, W.; Zhao, X.; Gao, X.; Liang, W.; Li, J.; Zhang, B. Spatially Explicit Assessment of Water Stress and Potential Mitigating Solutions in a Large Water-Limited Basin: The Yellow River Basin in China. Hydrol. Earth Syst. Sci. 2025, 29, 507–524. [Google Scholar] [CrossRef]
  51. Kang, W.; Kang, S.; Liu, S.; Han, Y. Assessing the Degree of Land Degradation and Rehabilitation in the Northeast Asia Dryland Region Using Net Primary Productivity and Water Use Efficiency. Land Degrad. Dev. 2020, 31, 816–827. [Google Scholar] [CrossRef]
  52. Liu, S.; Xue, L.; Xiao, Y.; Yang, M.; Liu, Y.; Han, Q.; Ma, J. Dynamic Process of Ecosystem Water Use Efficiency and Response to Drought in the Yellow River Basin, China. Sci. Total Environ. 2024, 934, 173339. [Google Scholar] [CrossRef]
  53. Yang, Y.; Nie, X.; Cong, Z.; Pan, X.; Gong, X.; Zhang, Z. Assessing the Carbon-Water Compound Use Efficiency in Fragile Karst Region: The Yunnan-Guizhou Plateau, China. Ecol. Indic. 2024, 166, 112320. [Google Scholar] [CrossRef]
  54. Yang, Y.; Guan, H.; Batelaan, O.; McVicar, T.R.; Long, D.; Piao, S.; Liang, W.; Liu, B.; Jin, Z.; Simmons, C.T. Contrasting Responses of Water Use Efficiency to Drought across Global Terrestrial Ecosystems. Sci. Rep. 2016, 6, 23284. [Google Scholar] [CrossRef]
  55. Ryan, M.G. Effects of Climate Change on Plant Respiration. Ecol. Appl. 1991, 1, 157–167. [Google Scholar] [CrossRef]
  56. Chuai, X.; Guo, X.; Zhang, M.; Yuan, Y.; Li, J.; Zhao, R.; Yang, W.; Li, J. Vegetation and Climate Zones Based Carbon Use Efficiency Variation and the Main Determinants Analysis in China. Ecol. Indic. 2020, 111, 105967. [Google Scholar] [CrossRef]
  57. He, Y.; Piao, S.; Li, X.; Chen, A.; Qin, D. Global Patterns of Vegetation Carbon Use Efficiency and Their Climate Drivers Deduced from MODIS Satellite Data and Process-Based Models. Agric. For. Meteorol. 2018, 256–257, 150–158. [Google Scholar] [CrossRef]
  58. Lin, S.; Wang, G.; Hu, Z.; Sun, X.; Song, C.; Huang, K.; Sun, J.; Yang, Y. Contrasting Response of Growing Season Water Use Efficiency to Precipitation Changes between Alpine Meadows and Alpine Steppes over the Tibetan Plateau. Agric. Water Manag. 2023, 289, 108571. [Google Scholar] [CrossRef]
  59. Pan, S.; Chen, G.; Ren, W.; Dangal, S.R.S.; Banger, K.; Yang, J.; Tao, B.; Tian, H. Responses of Global Terrestrial Water Use Efficiency to Climate Change and Rising Atmospheric CO2 Concentration in the Twenty-First Century. Int. J. Digit. Earth 2018, 11, 558–582. [Google Scholar] [CrossRef]
  60. Dong, G.; Zhao, F.; Chen, J.; Zhang, Y.; Qu, L.; Jiang, S.; Ochirbat, B.; Chen, J.; Xin, X.; Shao, C. Non-Climatic Component Provoked Substantial Spatiotemporal Changes of Carbon and Water Use Efficiency on the Mongolian Plateau. Environ. Res. Lett. 2020, 15, 095009. [Google Scholar] [CrossRef]
  61. Huang, X.; Luo, G.; Ma, Z.; Yao, B.; Du, Y.; Yang, Y. Modeling the Effect of Grazing on Carbon and Water Use Efficiencies in Grasslands on the Qinghai–Tibet Plateau. BMC Ecol. Evol. 2024, 24, 26. [Google Scholar] [CrossRef]
  62. Nandy, S.; Saranya, M.; Srinet, R. Spatio-Temporal Variability of Water Use Efficiency and Its Drivers in Major Forest Formations in India. Remote Sens. Environ. 2022, 269, 112791. [Google Scholar] [CrossRef]
  63. Hua, L.; Zhang, F.; Sun, R.; Yu, X.; Ma, H. Synergy of Carbon and Water Use Efficiencies in the Huai River Basin. Ecol. Indic. 2024, 160, 111874. [Google Scholar] [CrossRef]
  64. Zhao, M.; Running, S.W. Drought-Induced Reduction in Global Terrestrial Net Primary Production from 2000 through 2009. Science 2010, 329, 940–943. [Google Scholar] [CrossRef] [PubMed]
  65. Ganjurjav, H.; Hu, G.; Zhang, Y.; Gornish, E.S.; Yu, T.; Gao, Q. Warming Tends to Decrease Ecosystem Carbon and Water Use Efficiency in Dissimilar Ways in an Alpine Meadow and a Cultivated Grassland in the Tibetan Plateau. Agric. For. Meteorol. 2022, 323, 109079. [Google Scholar] [CrossRef]
  66. Huang, L.; He, B.; Han, L.; Liu, J.; Wang, H.; Chen, Z. A Global Examination of the Response of Ecosystem Water-Use Efficiency to Drought Based on MODIS Data. Sci. Total Environ. 2017, 601–602, 1097–1107. [Google Scholar] [CrossRef] [PubMed]
  67. Zhang, T.; Peng, J.; Liang, W.; Yang, Y.; Liu, Y. Spatial–Temporal Patterns of Water Use Efficiency and Climate Controls in China’s Loess Plateau during 2000–2010. Sci. Total Environ. 2016, 565, 105–122. [Google Scholar] [CrossRef]
  68. Tian, H.; Lu, C.; Chen, G.; Xu, X.; Liu, M.; Ren, W.; Tao, B.; Sun, G.; Pan, S.; Liu, J. Climate and Land Use Controls over Terrestrial Water Use Efficiency in Monsoon Asia. Ecohydrology 2011, 4, 322–340. [Google Scholar] [CrossRef]
  69. Kim, D.; Lee, M.-I.; Jeong, S.-J.; Im, J.; Cha, D.H.; Lee, S. Intercomparison of Terrestrial Carbon Fluxes and Carbon Use Efficiency Simulated by CMIP5 Earth System Models. Asia-Pac. J. Atmospheric Sci. 2018, 54, 145–163. [Google Scholar] [CrossRef]
  70. El Masri, B.; Stinchcomb, G.E.; Cetin, H.; Ferguson, B.; Kim, S.L.; Xiao, J.; Fisher, J.B. Linking Remotely Sensed Carbon and Water Use Efficiencies with In Situ Soil Properties. Remote Sens. 2021, 13, 2593. [Google Scholar] [CrossRef]
  71. Xue, B.-L.; Guo, Q.; Otto, A.; Xiao, J.; Tao, S.; Li, L. Global Patterns, Trends, and Drivers of Water Use Efficiency from 2000 to 2013. Ecosphere 2015, 6, 1–18. [Google Scholar] [CrossRef]
  72. Hou, Q.; Pei, T.; Yu, X.; Chen, Y.; Ji, Z.; Xie, B. The Seasonal Response of Vegetation Water Use Efficiency to Temperature and Precipitation in the Loess Plateau, China. Glob. Ecol. Conserv. 2022, 33, e01984. [Google Scholar] [CrossRef]
  73. Han, X.; Fang, F.; Bai, C.; Du, K.; Zhu, Y.; Liu, W. Dynamics of Carbon and Water Fluxes over Cropland and Agroforest Ecosystems on the Southern Chinese Loess Plateau. Forests 2024, 15, 774. [Google Scholar] [CrossRef]
  74. Luo, X.; Jia, B.; Lai, X. Quantitative Analysis of the Contributions of Land Use Change and CO2 Fertilization to Carbon Use Efficiency on the Tibetan Plateau. Sci. Total Environ. 2020, 728, 138607. [Google Scholar] [CrossRef] [PubMed]
  75. Gentine, P.; Green, J.K.; Guérin, M.; Humphrey, V.; Seneviratne, S.I.; Zhang, Y.; Zhou, S. Coupling between the Terrestrial Carbon and Water Cycles—A Review. Environ. Res. Lett. 2019, 14, 083003. [Google Scholar] [CrossRef]
  76. Ye, X.; Liu, F.; Zhang, Z.; Xu, C.; Liu, J. Spatio-Temporal Variations of Vegetation Carbon Use Efficiency and Potential Driving Meteorological Factors in the Yangtze River Basin. J. Mt. Sci. 2020, 17, 1959–1973. [Google Scholar] [CrossRef]
  77. Ai, Z.; Wang, Q.; Yang, Y.; Manevski, K.; Yi, S.; Zhao, X. Variation of Gross Primary Production, Evapotranspiration and Water Use Efficiency for Global Croplands. Agric. For. Meteorol. 2020, 287, 107935. [Google Scholar] [CrossRef]
  78. Tarin, T.; Nolan, R.H.; Medlyn, B.E.; Cleverly, J.; Eamus, D. Water-Use Efficiency in a Semi-Arid Woodland with High Rainfall Variability. Glob. Change Biol. 2020, 26, 496–508. [Google Scholar] [CrossRef]
  79. Zhang, L.; Tian, J.; He, H.; Ren, X.; Sun, X.; Yu, G.; Lu, Q.; Lv, L. Evaluation of Water Use Efficiency Derived from MODIS Products against Eddy Variance Measurements in China. Remote Sens. 2015, 7, 11183–11201. [Google Scholar] [CrossRef]
  80. Zhu, W.-Z. Advances in the Carbon Use Efficiency of Forest: Advances in the Carbon Use Efficiency of Forest. Chin. J. Plant Ecol. 2014, 37, 1043–1058. [Google Scholar] [CrossRef]
  81. Liu, Y.; Yang, Y.; Wang, Q.; Du, X.; Li, J.; Gang, C.; Zhou, W.; Wang, Z. Evaluating the Responses of Net Primary Productivity and Carbon Use Efficiency of Global Grassland to Climate Variability along an Aridity Gradient. Sci. Total Environ. 2019, 652, 671–682. [Google Scholar] [CrossRef]
  82. Schroeder, J.; Peplau, T.; Gregorich, E.; Tebbe, C.C.; Poeplau, C. Unexpected Microbial Metabolic Responses to Elevated Temperatures and Nitrogen Addition in Subarctic Soils under Different Land Uses. Biogeochemistry 2022, 160, 105–125. [Google Scholar] [CrossRef]
  83. Zhang, Y.; Huang, K.; Zhang, T.; Zhu, J.; Di, Y. Soil Nutrient Availability Regulated Global Carbon Use Efficiency. Glob. Planet. Change 2019, 173, 47–52. [Google Scholar] [CrossRef]
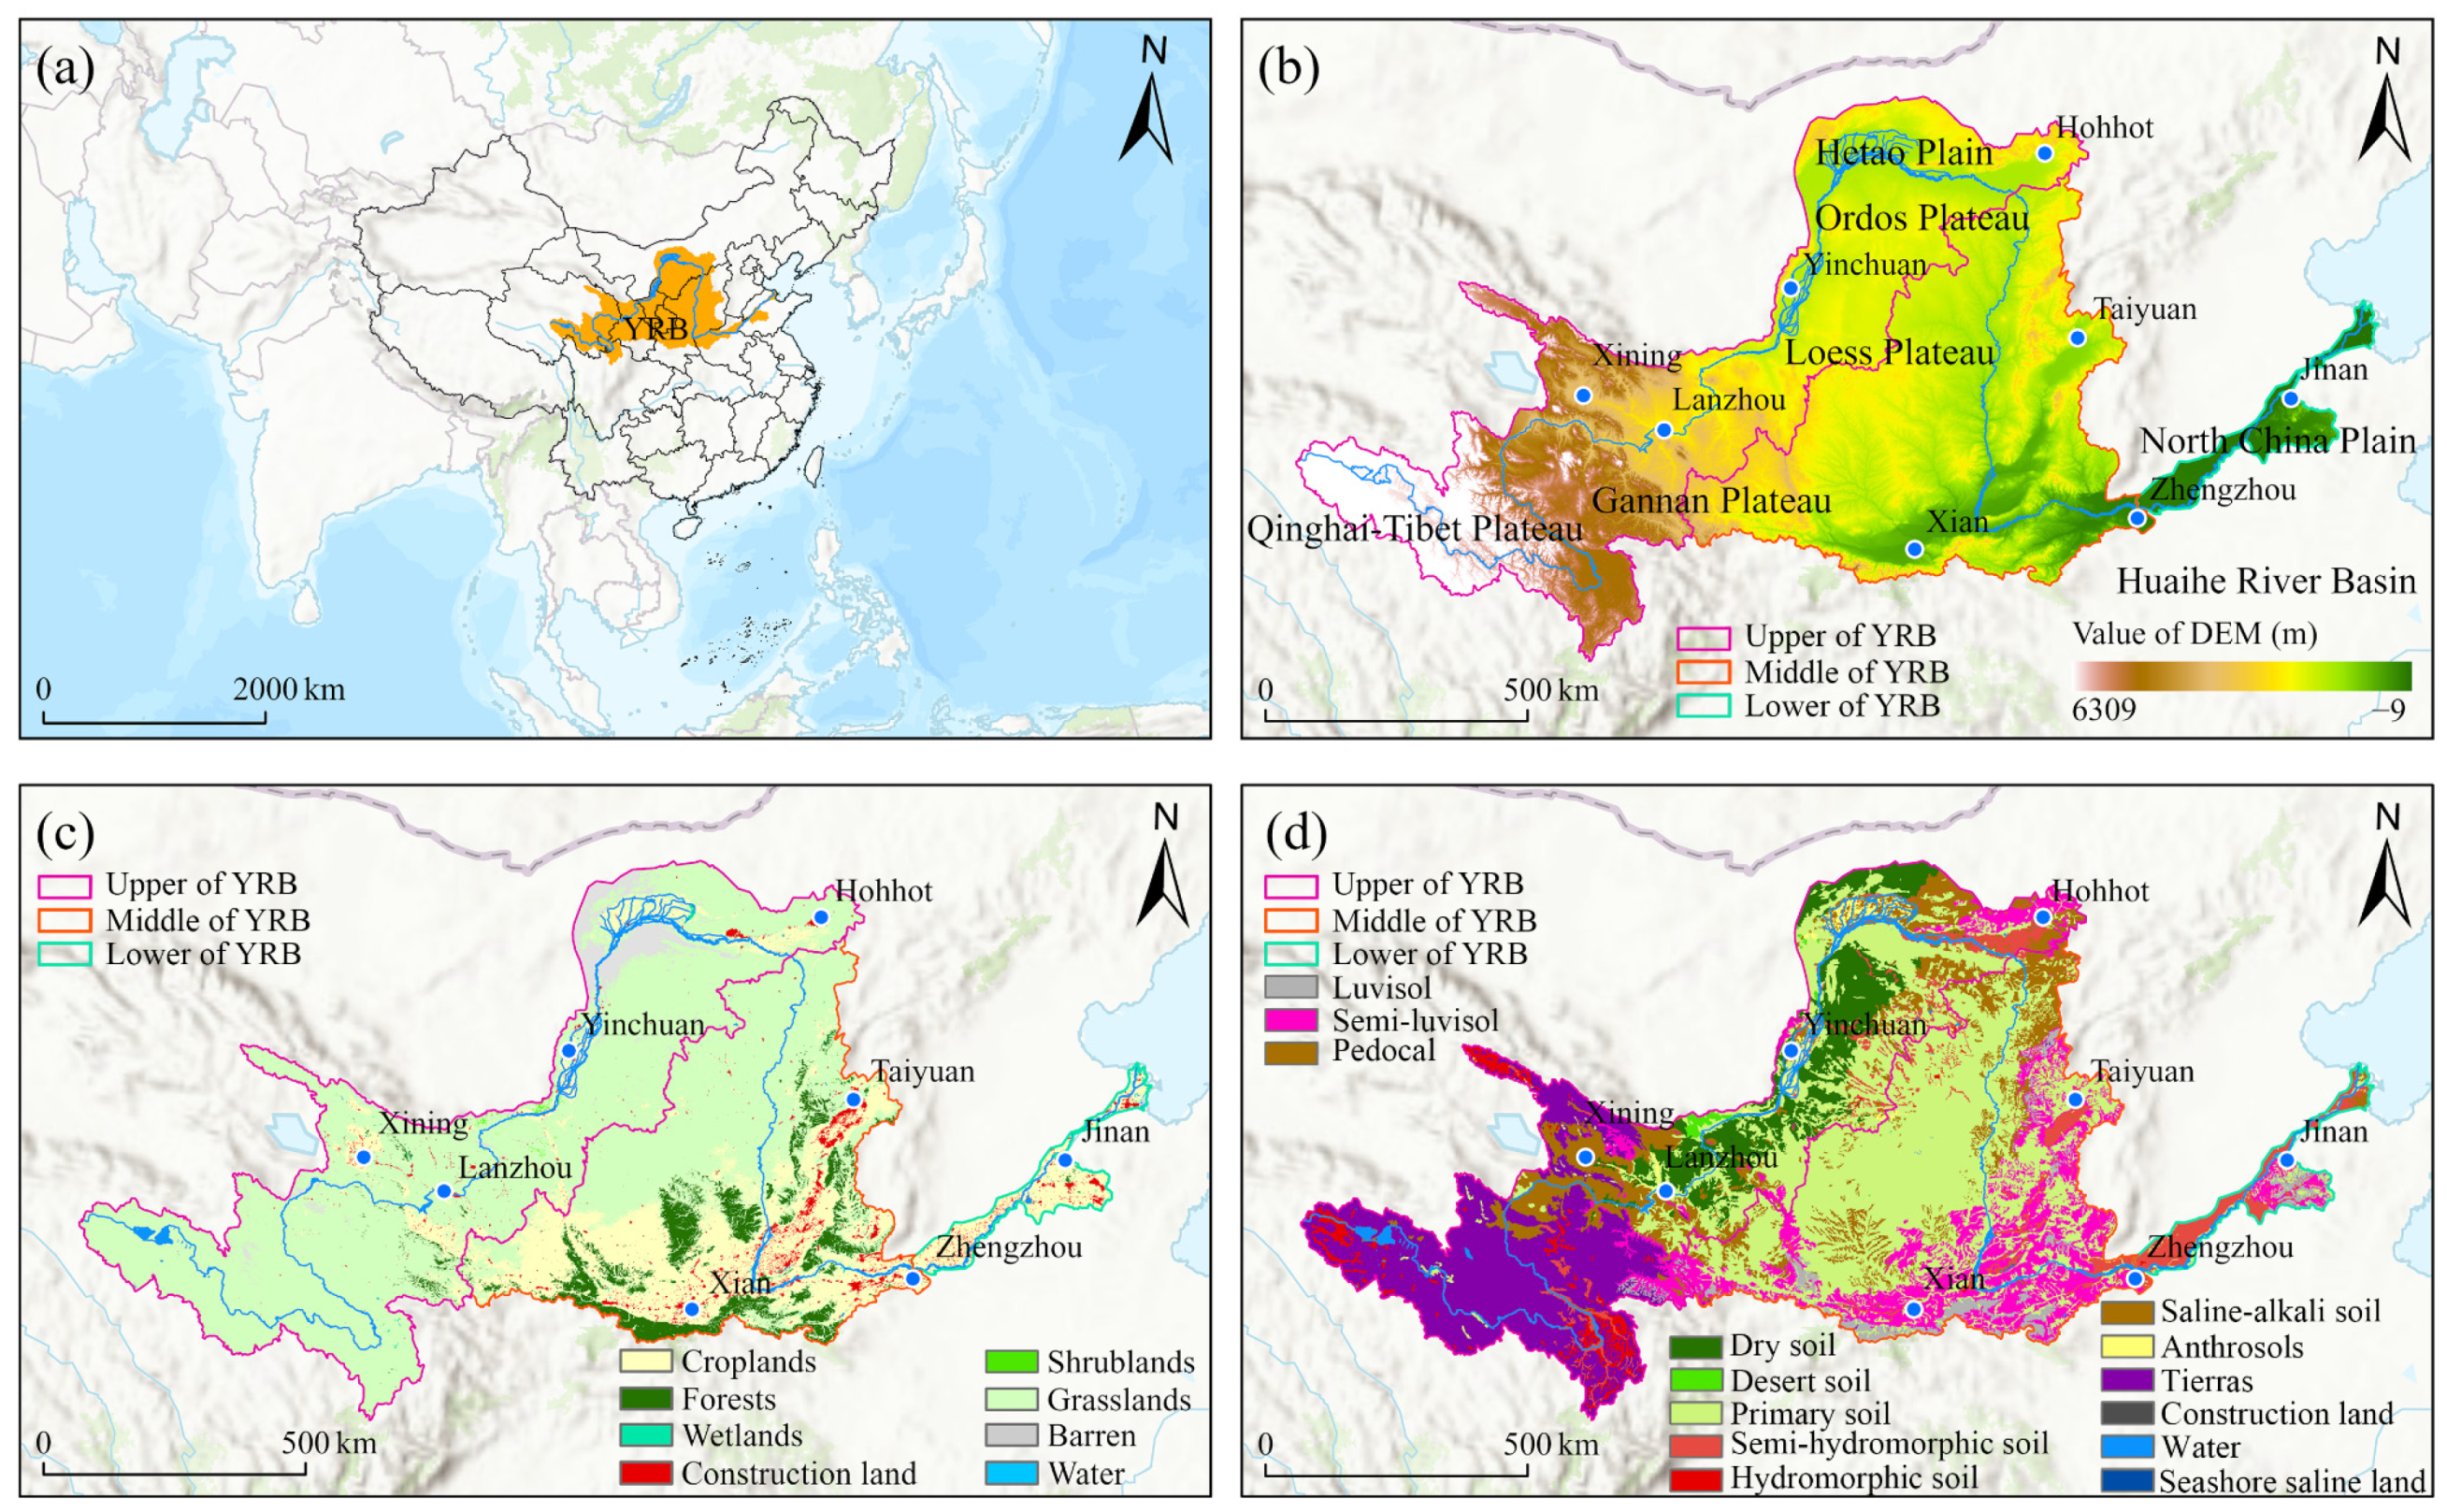
Figure 1. Description of the Yellow River Basin (YRB). (a) Location in China. (b) DEM. (c) Land use in 2022. (d) Soil types.
Land 14 01614 g001
Figure 2. Spatial distributions of the 23-year mean NPP, GPP, WUE, and CUE, 2001–2023.
Land 14 01614 g002
Figure 3. Mean NPP, GPP, WUE, and CUE, 2001–2023. (a) The mean GPP, 2001–2023; (b) the mean NPP, 2001–2023; (c) the mean WUE, 2001–2023; (d) the mean CUE, 2001–2023.
Land 14 01614 g003
Figure 4. Variation trends and MK test results for GPP, NPP, WUE, and CUE in the YRB, 2001–2023. (ad) Trends; (eh) corresponding significance test results.
Land 14 01614 g004
Figure 5. Significance test results of partial correlation coefficients. (ac) Significance tests for MAT, MAP, and SR with GPP; (df) significance tests for MAT, MAP, and SR with NPP; (gi) significance tests for MAT, MAP, and SR with WUE; (jl) significance tests for MAT, MAP, and SR with CUE.
Land 14 01614 g005
Figure 6. Relative contribution rates. (ac) Contribution to GPP; (df) contribution to NPP; (gi) contribution to WUE; (jl) contribution to CUE.
Land 14 01614 g006
Figure 7. GPP, NPP, WUE, and CUE of each land use type. (a) GPP of each land use type, 2001–2023. (b) NPP of each land use type, 2001–2023. (c) WUE of each land use type, 2001–2023. (d) CUE of each land use type, 2001–2023.
Land 14 01614 g007
Figure 8. PC coefficients of different land use types. (ac) PC coefficients between GPP of different land use types and MAT, MAP, and SR; (df) PC coefficients between NPP of different land use types and MAT, MAP, and SR; (gi) PC coefficients between WUE of different land use types and MAT, MAP, and SR; (jl) PC coefficients between CUE of different land use types and MAT, MAP, and SR.
Land 14 01614 g008
Figure 9. RC to GPP, NPP, WUE, and CUE across different land use types. (ac) RC to GPP for different land use types; (df) RC to NPP for different land use types; (gi) RC to WUE for different land use types; (jl) RC to CUE for different land use types.
Land 14 01614 g009
Table 1. Description of data.
TypesDateTime ResolutionSpatial ResolutionSourceDownload Site
NPP2001–2023Annual500 mMOD17A3HGFhttps://earthengine.google.com/ (accessed on 7 April 2025)
GPP2001–20238 days500 mMOD17A2HGF
ET2001–20238 days500 mMOD16A2GF
Land use2001–2022Annual500 mMCD12Q1
Temperature2001–2023Daily0.1° × 0.1°ERA5 Daily Aggregates
Precipitation2001–2023Daily0.1° × 0.1°ERA5 Daily Aggregates
Solar radiation2001–2023Daily0.1° × 0.1°ERA5 Daily Aggregates
Disclaimer/Publisher’s Note: The statements, opinions and data contained in all publications are solely those of the individual author(s) and contributor(s) and not of MDPI and/or the editor(s). MDPI and/or the editor(s) disclaim responsibility for any injury to people or property resulting from any ideas, methods, instructions or products referred to in the content.