Article

Effect of Landscape Architectural Characteristics on LST in Different Zones of Zhengzhou City, China

1
College of Landscape Architecture & Arts, Northwest A&F University, Xianyang 712100, China
2
School of Architecture and Fine Art, Dalian University of Technology, Dalian 116024, China
3
School of Architecture, Southeast University, Nanjing 210096, China
*
Author to whom correspondence should be addressed.
These authors contributed equally to this work.
Land 2025, 14(8), 1581; https://doi.org/10.3390/land14081581 (registering DOI)
Submission received: 12 June 2025 / Revised: 29 July 2025 / Accepted: 31 July 2025 / Published: 2 August 2025
(This article belongs to the Special Issue Climate Adaptation Planning in Urban Areas)

Abstract

The process of urbanization has intensified the urban heat environment, with the degradation of thermal conditions closely linked to the morphological characteristics of different functional zones. This study delineated urban functional areas using a multivariate dataset and investigated the seasonal and threshold effects of landscape and architectural features on land surface temperature (LST) through boosted regression tree (BRT) modeling and Spearman correlation analysis. The key findings are as follows: (1) LST exhibits significant seasonal variation, with the strongest urban heat island effect occurring in summer, particularly within industry, business, and public service zones; residence zones experience the greatest temperature fluctuations, with a seasonal difference of 24.71 °C between spring and summer and a peak temperature of 50.18 °C in summer. (2) Fractional vegetation cover (FVC) consistently demonstrates the most pronounced cooling effect across all zones and seasons. Landscape indicators generally dominate the regulation of LST, with their relative contribution exceeding 45% in green land zones. (3) Population density (PD) exerts a significant, seasonally dependent dual effect on LST, where strategic population distribution can effectively mitigate extreme heat events. (4) Mean building height (MBH) plays a vital role in temperature regulation, showing a marked cooling influence particularly in residence and business zones. Both the perimeter-to-area ratio (LSI) and frontal area index (FAI) exhibit distinct seasonal variations in their impacts on LST. (5) This study establishes specific indicator thresholds to optimize thermal comfort across five functional zones; for instance, FVC should exceed 13% in spring and 31.6% in summer in residence zones to enhance comfort, while maintaining MBH above 24 m further aids temperature regulation. These findings offer a scientific foundation for mitigating urban heat waves and advancing sustainable urban development.

1. Introduction

With the rapid urbanization of China, increased rural-to-urban migration has accelerated industrialization, leading to the expansion of impervious surfaces, which reduces green and ecological spaces and disrupts the urban surface energy balance [1,2,3]. Consequently, local surface temperatures have risen, and distinct urban microclimates have emerged, a phenomenon widely recognized as the urban heat island (UHI) effect [4]. The UHI effect exacerbates thermal discomfort [5,6] and environmental degradation, adversely affecting residents’ physical and mental well-being while diminishing overall quality of life. Additionally, the intensified UHI effect imposes economic burdens by increasing energy consumption. Previous research has highlighted that spatial constraints within cities, when compounded by intensified UHI, can heighten pollution risks [7]. Therefore, understanding the influence of urban functional zones on temperature variations and thermal comfort is essential for UHI mitigation and the promotion of sustainable urban development.
In recent years, research on UHI effect has increasingly emphasized land surface temperature (LST), a critical parameter for evaluating the interactions and energy exchanges of urban surfaces across various temporal and spatial scales [8]. Accurate measurement and prediction of LST are essential for understanding the formation and intensity of UHI. Consequently, researchers have been continuously advancing and refining LST retrieval techniques. For example, Sayyad Asghari Saraskanroud developed a window-splitting algorithm that exhibits strong consistency with observed temperatures and effectively reduces error amplitude [9]. Similarly, Dong et al. enhanced inversion accuracy by integrating the improved temperature and emissivity separation (iTES) algorithm with the multi-resolution Kalman filter (MKF) [10]. Liu et al. further advanced LST retrieval by proposing the Geo-LightGBM model, which combines machine learning approaches with geospatial data [11].
Research on LST encompasses various aspects, including urban–rural comparisons, predictive land use modeling, and cross-scale analyses of morphological effects, with particular emphasis on the relationship between LST-influencing indicators and urban thermal comfort [12,13,14]. Scenario-based studies have highlighted the sensitivity of LST to land use changes. From a macroscopic perspective, previous studies have employed the Urban Thermal Field Change Index (UTFVI) to characterize this relationship, constructed multi-scale thermal comfort simulation frameworks, and even developed multi-criteria thermal comfort assessment systems. UTFVI is an index that quantifies UHI effect by measuring thermal differences between urban and non-urban areas [1]. It is typically used to indicate varying levels of thermal discomfort and potential heat-related stress among residents [2]. Furthermore, recent studies have advanced LST research through high-resolution mapping and urban-scale thermal comfort analyses. For instance, the WRF–UCM–SOLWEIG framework improves spatial and temporal resolution, enabling the more precise quantification of urban climate drivers. This approach deepens our understanding of the impact of UHI on urban thermal comfort and local climate conditions, underscoring the necessity of establishing a robust analytical framework for LST studies [15].
To mitigate urban heat stress and create livable cities, it is essential to thoroughly investigate the impact of urban form on the UHI. Numerous studies have demonstrated that urban form significantly influences LST. Urban form refers to the spatial structure and pattern of cities and is typically characterized from three perspectives: landscape form, architectural form, and human activities [16]. Landscape form reflects the configuration of land cover, primarily including vegetation and water bodies [17]. Architectural form describes the horizontal layout and vertical structure of buildings [18]. Human activities encompass a series of actions undertaken by people for survival and development. Existing studies have shown that vegetation and water bodies within the landscape form exert a notable cooling effect, whereas built-up areas and bare land tend to elevate LST [19]. Research on architectural form is the most extensive; for example, Cao et al. applied two-dimensional and three-dimensional analyses to reveal that building density and building coverage have significant warming effects [20]. Yuan et al. found that high-rise buildings can effectively alleviate LST through shading and ventilation effects [21]. In contrast, studies specifically focusing on human activity indicators remain relatively limited and are often integrated with other form-related variables for comprehensive analyses [22].
Urban functional zones refer to clusters of human activities with specific functions, shaped during the urbanization process under the combined influence of indicators such as the natural environment, economic development, historical and cultural heritage, and social dynamics [23]. These zones operate in distinct ways due to their unique functions and population characteristics and are closely interconnected with the city’s economy, transportation systems, and ecosystems. Significant differences exist in the surface characteristics of various functional zones, and these physical attributes lead to pronounced spatial differentiation of LST, underscoring the importance of formulating heat mitigation strategies tailored to local conditions. Moreover, LST exhibits notable seasonal variations [24]. For example, Liu et al. [22] investigated the seasonal effects of urban morphology on LST across different functional zones and found that the relative contributions of urban morphology to LST remain relatively consistent in spring, autumn, and winter. This indicates that urban functional zones not only reflect the spatial organization of a city but that their morphology and seasonal temperature variations directly influence thermal comfort. It is worth noting that the optimization of the urban thermal environment depends not only on the professional expertise of planners but also on residents’ perceptions and participation, which provide valuable insights for addressing UHI issues across functional zones. For instance, studies on cities in Central Europe have emphasized the value of participatory mapping in assessing and improving urban thermal comfort [25]. This demonstrates that incorporating residents’ perceptions and experiences into urban climate research can foster the development of more adaptive and sustainable heat mitigation strategies.
Existing methods for classifying urban functional zones can be broadly categorized into two approaches: grid-based and road network-based. Grid-based methods (e.g., the approach proposed by Luo et al.) define functional zones by partitioning a space into regular grids. These methods are straightforward to implement and highly adaptable; however, their accuracy can be influenced by the choice of grid size [26]. In contrast, road network-based methods utilize OpenStreetMap (OSM) data to delineate functional zone boundaries, offering a more accurate representation of the actual urban structure. The effectiveness of this approach has been validated by Mo et al. [27]. In recent years, researchers have further enhanced functional zone identification by integrating point of interest (POI) data with road network information, thereby improving classification accuracy [28,29].
Meanwhile, analytical approaches for examining the relationship between urban morphology and LST have continued to evolve. Traditional studies often rely on regression techniques to quantify the effects of urban morphology indicators on LST. For instance, Yin et al. applied linear models such as multi-scale geographically weighted regression (MGWR) to capture spatial variability, but such approaches have inherent limitations when dealing with complex nonlinear relationships [22]. Consequently, nonlinear regression methods, including random forest (RF) and XGBoost, have gained popularity in recent years for their ability to more accurately model the nonlinear interactions between LST and urban morphology. Li et al. utilized RF to analyze the influence of three-dimensional building morphology on LST, while Mo et al. employed nonlinear models to explore the complex interaction mechanisms between urban morphology and LST. Moreover, the boosted regression tree (BRT) model has been widely applied in UHI research due to its strengths in handling nonlinear characteristics and variable interactions [30,31,32]. Given the BRT model’s notable advantages in explaining nonlinear effects and evaluating variable contributions, this study adopts the BRT model to systematically assess seasonal variations in the influence of urban morphology on LST across different functional zones, aiming to achieve a more comprehensive understanding of these interactions.
Building upon previous knowledge, this study utilizes OSM and POI data to delineate urban functional zones and applies the BRT model to quantify the complex nonlinear relationships between various urban morphology indicators and LST across different urban functional zones. The research objectives are as follows: (1) to analyze the seasonal variations in three categories of urban morphology indicators, the delineation of urban functional zones, and the spatial distribution of LST; (2) to quantify the relative importance of these three categories of urban morphology indicators on LST across different seasons and compare their significance among various urban functional zones; and (3) based on the marginal effects of key indicators, to quantify their influence on LST and, using the UTFVI to represent thermal comfort levels, identify corresponding LST intervals to analyze indicator threshold ranges under varying thermal comfort conditions. This seasonal investigation aims to inform scientific decision making for future urban planning and the development of climate-adaptive cities.

2. Materials and Methods
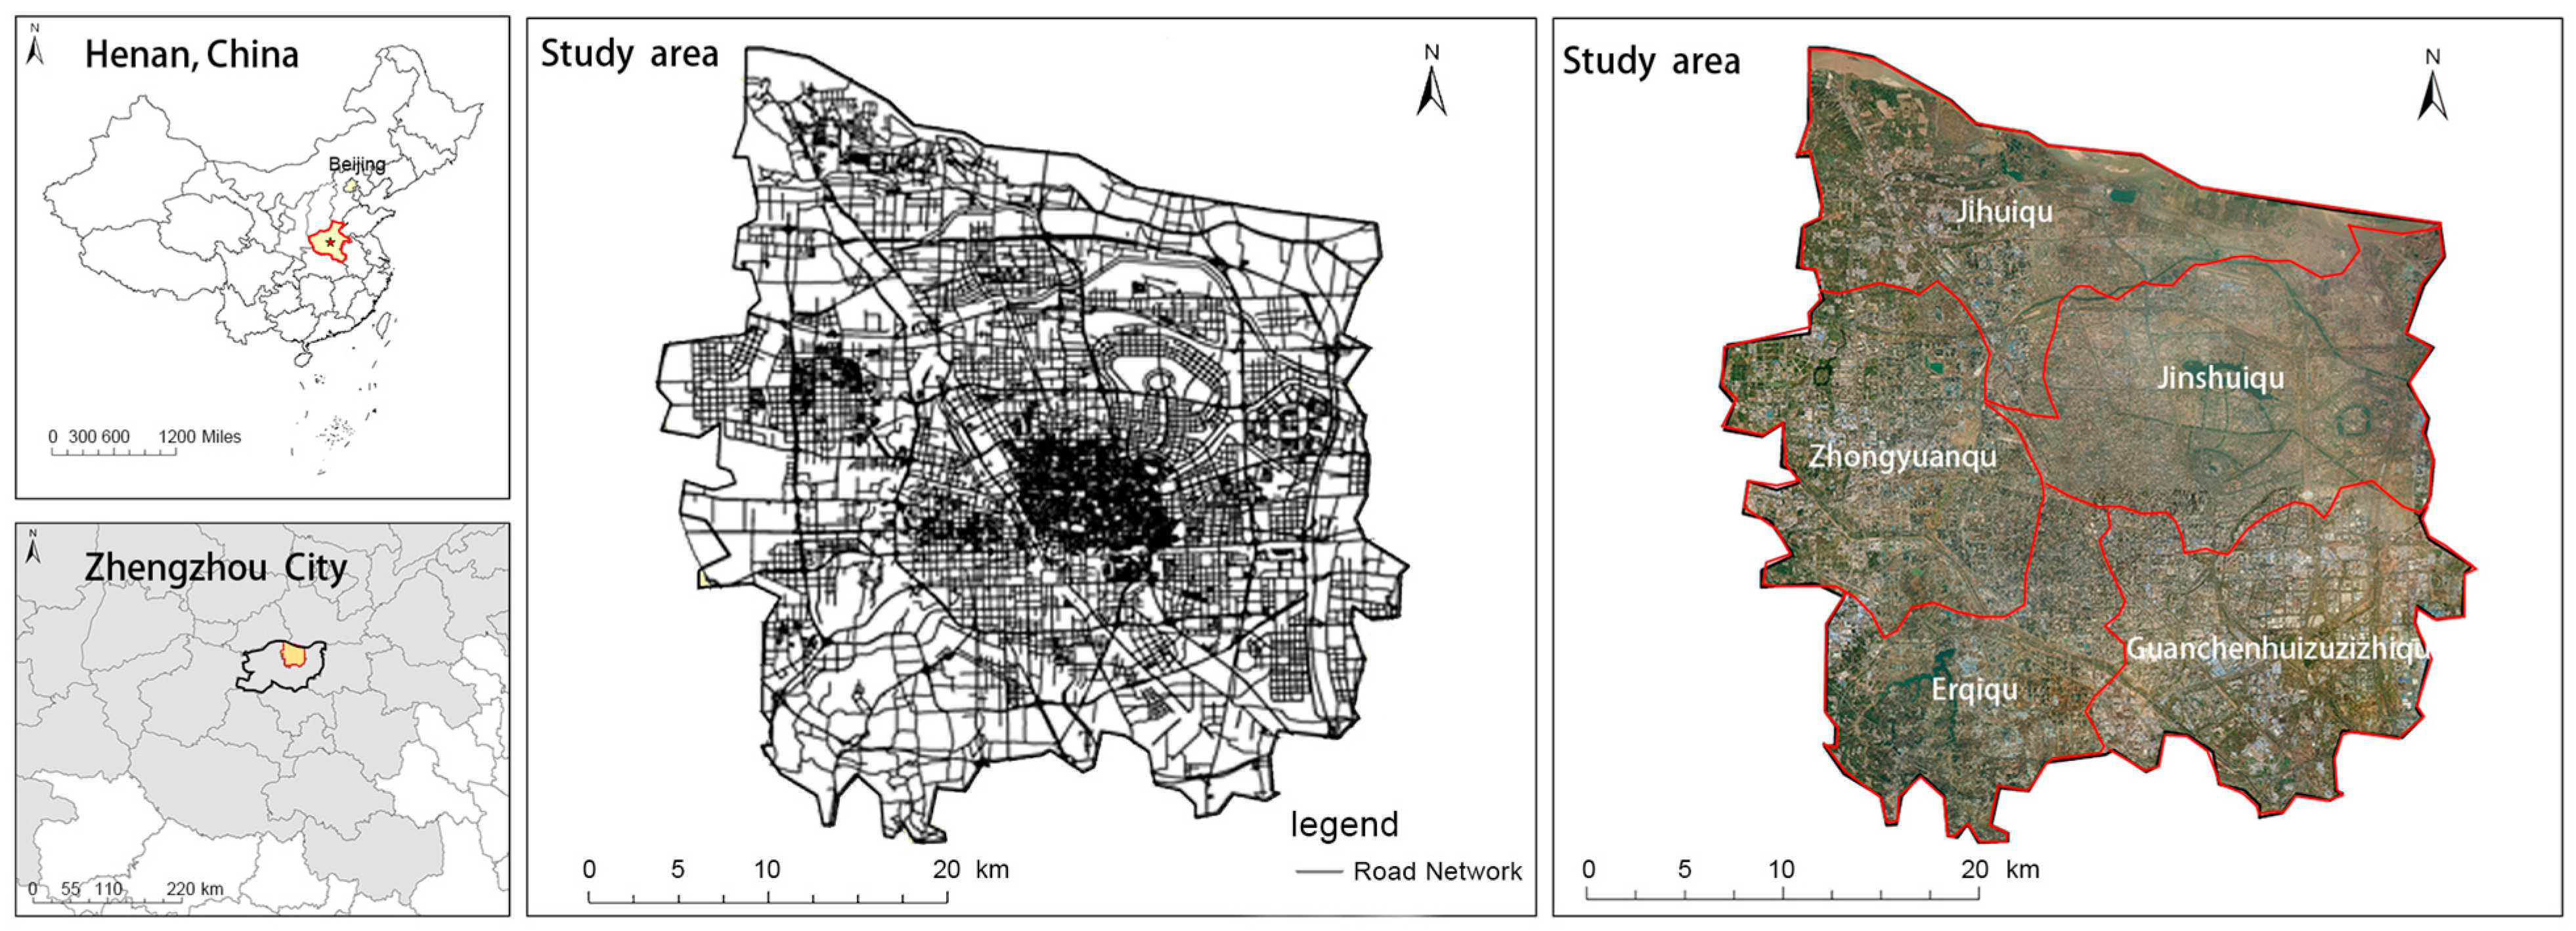
2.1. Study Area

Zhengzhou is the capital of Henan Province. As of 2023, this city covers a total area of 7567 square kilometers. By the end of 2023, the resident population of Zhengzhou reached 13.08 million, with a rate of urbanization of 80%, Zhengzhou’s density, primarily concentrated in its central urban zones such as Erqi and Jinshui districts, with an average of around 1665 people per square kilometer across the city, and with higher concentrations in these core districts due to intense urban development and infrastructure, while the western and peripheral areas of Zhengzhou remained less densely populated [30]. Geographically situated in the northern–central part of Henan Province at the juncture of the middle and lower reaches of the Yellow River, the city’s terrain generally trends from high in the southwest to low in the northeast. Zhengzhou experiences a temperate continental monsoon climate characterized by distinct seasons, with an annual average temperature of 14.7 °C. The average temperature in January is 0.5 °C, with an extreme minimum of −16.3 °C; in July, the average temperature rises to 27.1 °C, with an extreme maximum of 41.5 °C [31].
The province where Zhengzhou is located, Henan Province, is situated at the foot of the Taihang Mountains, the Wuyun Mountains, and the northern slope of the Dabie Mountains. The terrain is generally higher in the west and lower in the east. This region is affected by the El Niño phenomenon. In winter, the activity of cold air is relatively weak, and high humidity inversion often occurs. The atmospheric pollution diffusion is poor, which aggravates the UHI effect and the heat stress experienced by urban residents. Our study focuses on the central urban area of Zhengzhou, namely Jinshui, Erqi, Zhongyuan, Huijie, and Guancheng Hui Autonomous District. The overall LST is the highest, and the UHI effect is the most obvious (Figure 1).

2.2. Data Sources and Pre-Processing
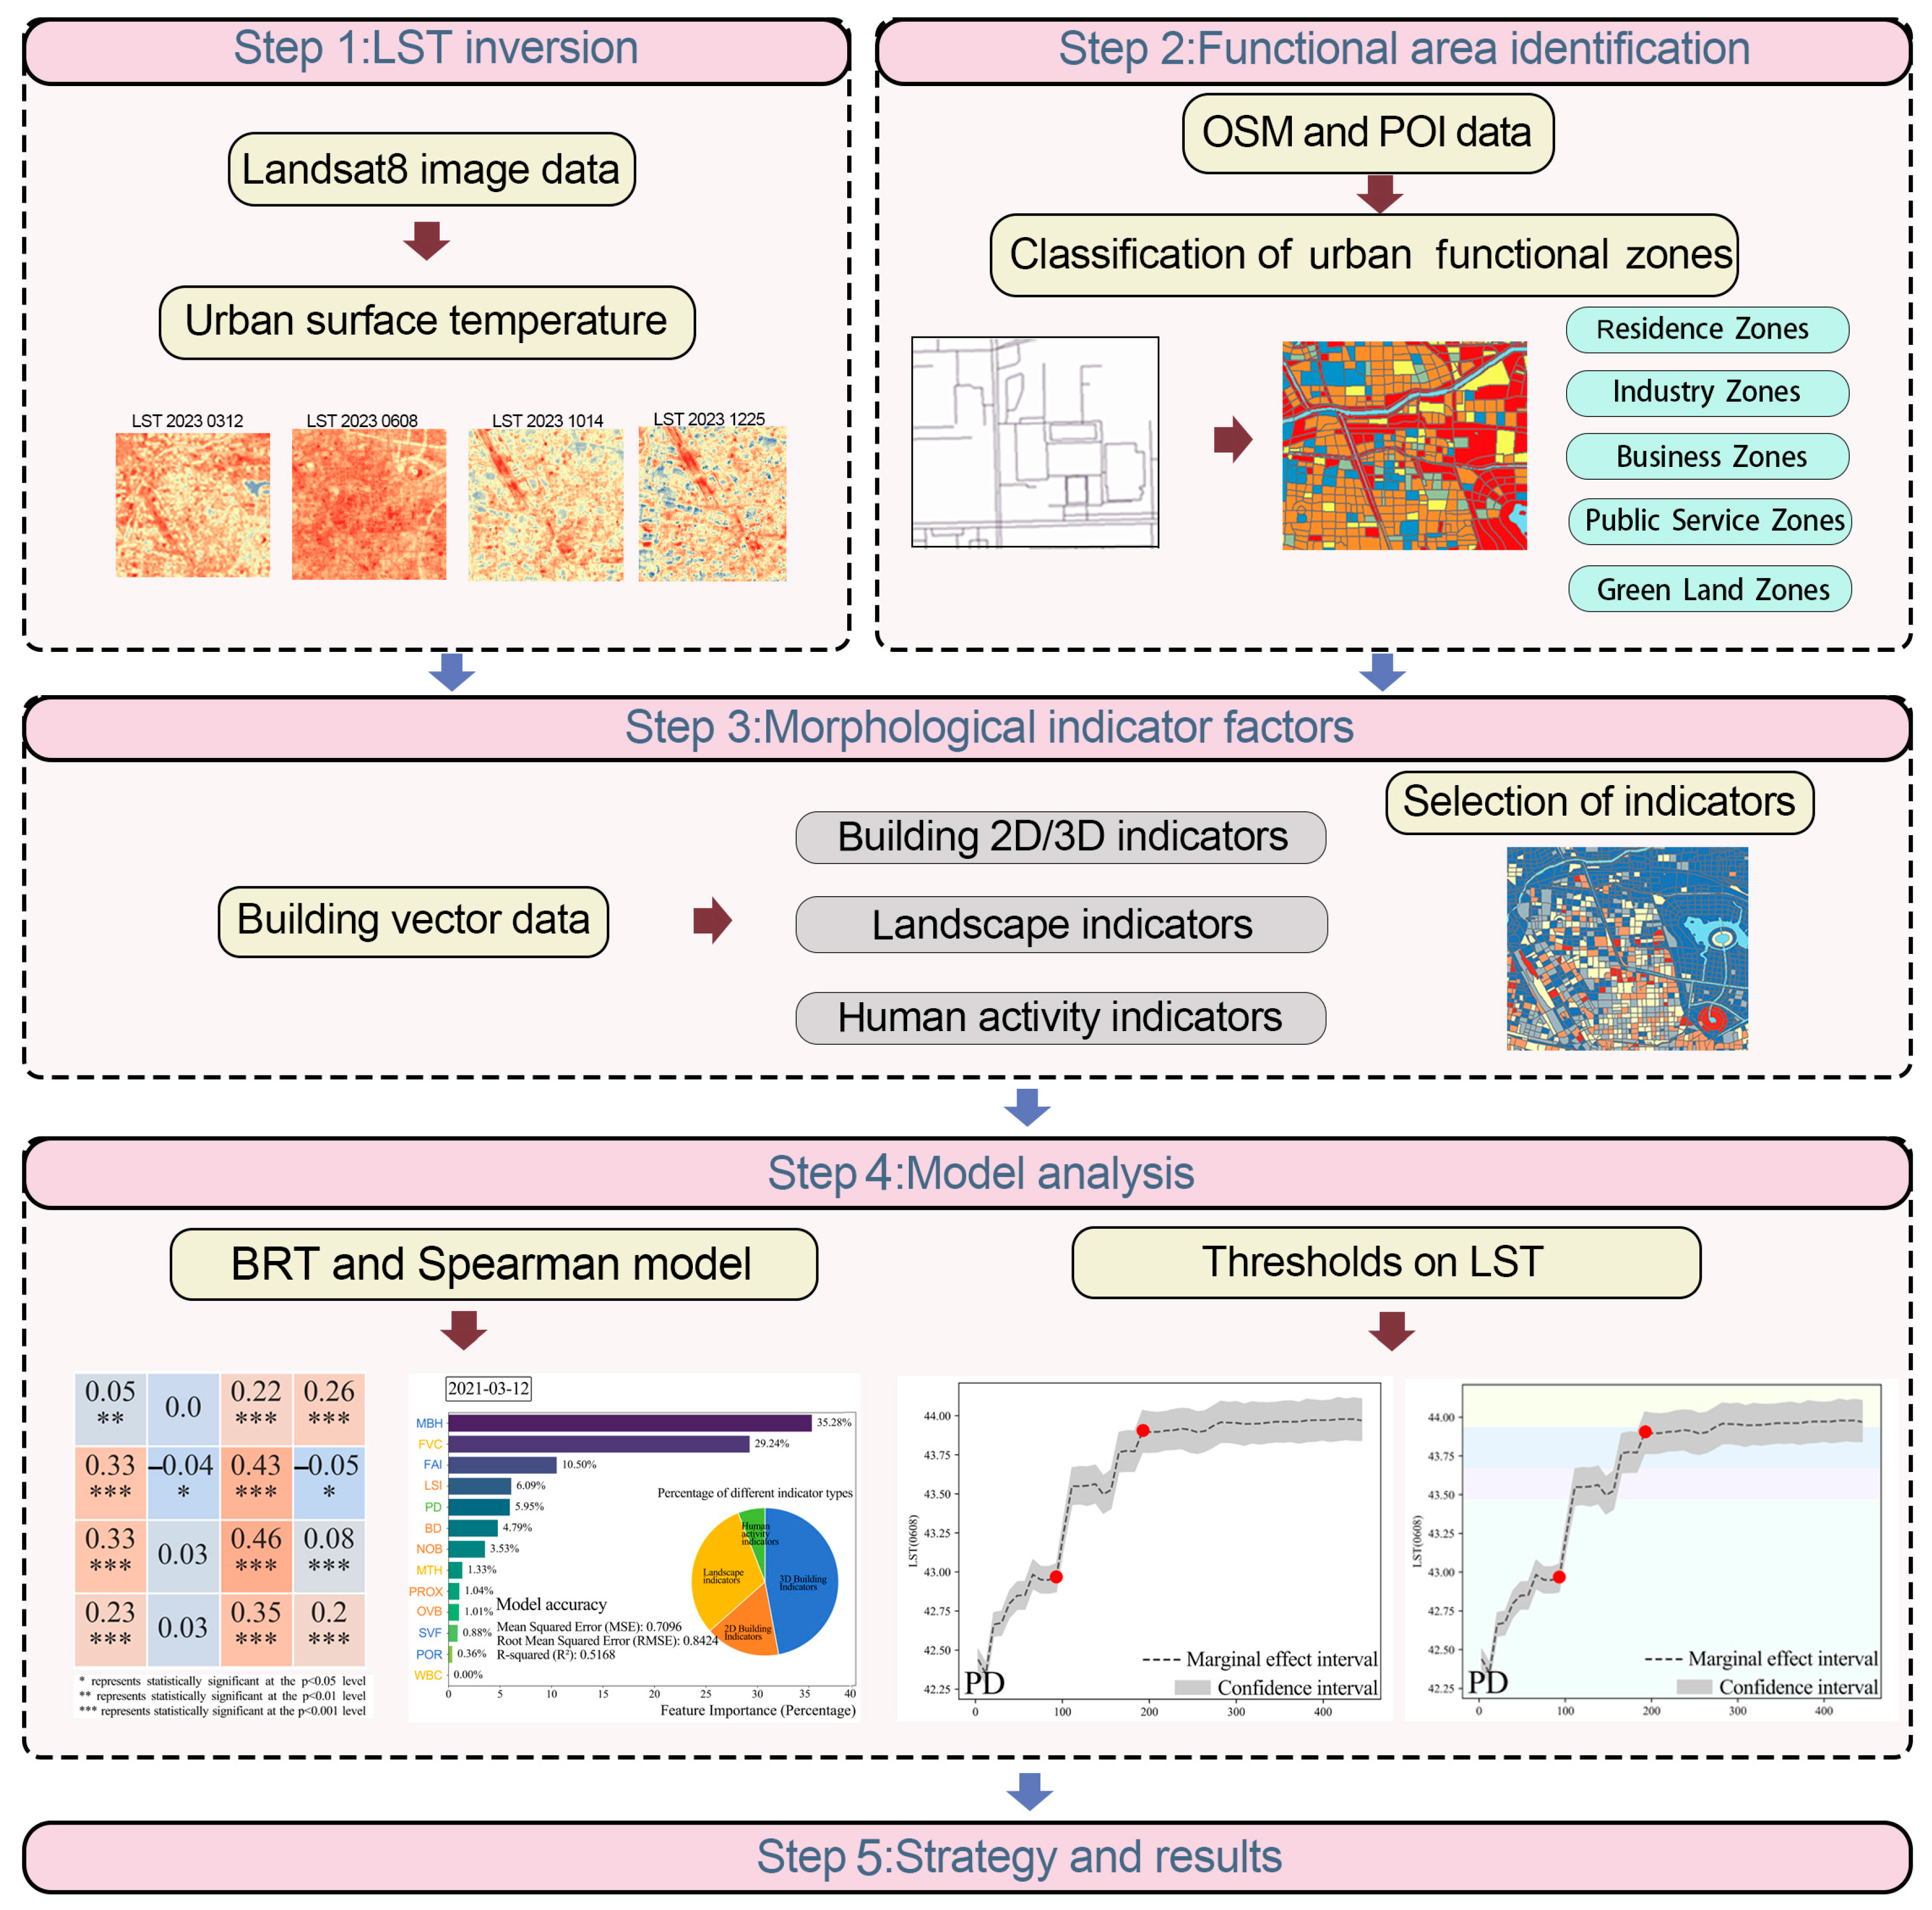
The datasets used in this study include Landsat 8 imagery, POI data, road network data, DEM, population, Global 1 m tree height, Global lake boundary vector data, and building vector data. We obtained the 2023 Landsat 8 OLI_TIRS images from the United States Geological Survey (USGS) for 12 March (spring), 18 June (summer), 14 October (autumn), and 25 December (winter) as seasonal representations to retrieve LST. Building vector data, sourced from Baidu Maps, provides information on the building footprint and number of floors, which are used to calculate building morphology indicators. The 2023 urban road network data were obtained from OSM and were used to divide the study area into different research units. Subsequently, POI data from Gaode Maps was used to classify these units into different functional zones (Table 1).

2.3. Methods

The proposed methodological framework is as follows. In this study, we investigated the seasonal effects of three different urban forms on LST in various types of functional zones during different seasons, using Zhengzhou as a case study. First, we use Landsat-8 data to retrieve LST across four seasons. Second, based on OSM and POI data, the study area is divided into different types of functional zones. Subsequently, we screen and calculate the indicators for these functional zones. Finally, using boosted regression tree (BRT) and Spearman analyses, we explore the correlation between the indicators and LST, as well as their relative contributions and marginal effects (Figure 2).

2.3.1. Selection of Indicators

Based on previous studies, this research adheres to the principles of theoretical significance, data availability, and wide applicability, and selects key indicators that can reflect the influence of architectural landscape features on LST [35]. To ensure the scientific nature of the model and avoid multicollinearity, the variance inflation indicator (VIF) is used to test the collinearity among the indicators, and variables with VIF values greater than 10 are eliminated, such as patch perimeter (PC), total building volume (TVB), and average building volume (MBV). Eventually, 13 indicators are determined, covering two-dimensional/three-dimensional architectural indicators, landscape indicators, and human activity indicators.
3D building indicators include mean building height (MBH), frontage area index (FAI), sky view indicator (SVF), and building porosity (POR). Among them, FAI is an important urban form indicator for measuring the degree of wind shielding by buildings. Due to the different windward orientations of buildings, the area of the windward face changes, thereby affecting FAI. For instance, studies have shown that MBH has a significant cooling effect as taller buildings can enhance air convection and promote heat dissipation [21]. Urban 2D building indicators include building density (BD) [36], perimeter-to-area ratio (LSI), number of buildings (NOB), orientation of buildings (OVB), and building proximity (PROX) [37]; these 2D/3D building indicators have been widely applied in UHI effect research. Studies have indicated that higher building density often leads to a significant warming effect, mainly because high-density forms increase the surface enclosure, causing heat to accumulate locally and raising LST [20]. However, apart from the influence of urban building indicators on the UHI effect, urban landscape indicators are also widely used in urban thermal environment research. Considering the significant heat absorption contributions of vegetation and water bodies, this study added urban landscape indicators such as fractional vegetation cover (FVC), water body coverage (WBC), and mean tree height (MTH). Previous research has confirmed that vegetation and water bodies have obvious cooling effects, while built-up areas and bare land tend to cause warming [19]. Additionally, due to the different functions of specific urban areas, their population size and human activities vary with time and season. Studies have shown that diverse human activities are closely related to LST because the uneven distribution of anthropogenic heat released by different human activities leads to different thermal states, thereby affecting LST [38]. Therefore, this study adopted population density (PD) as an influencing indicator. The specific calculation formulas and explanations of the indicator indicators are presented in Supplementary Table S1. The specific VIF values are shown in Supplementary Table S2.

2.3.2. LST Retrieval

This study retrieved the LST using the radiative transfer equation (RTE) method. The RTE method is a technique for retrieving LST using the thermal infrared bands of satellites. The RTE considers various indicators, including atmospheric absorption, emission, scattering, and surface reflection. It estimates and reduces errors caused by atmospheric indicators, thereby obtaining the surface radiant quantity [39]. The method is consistent with previous studies [40,41,42]. The detailed process is described in Supplementary Table S3.

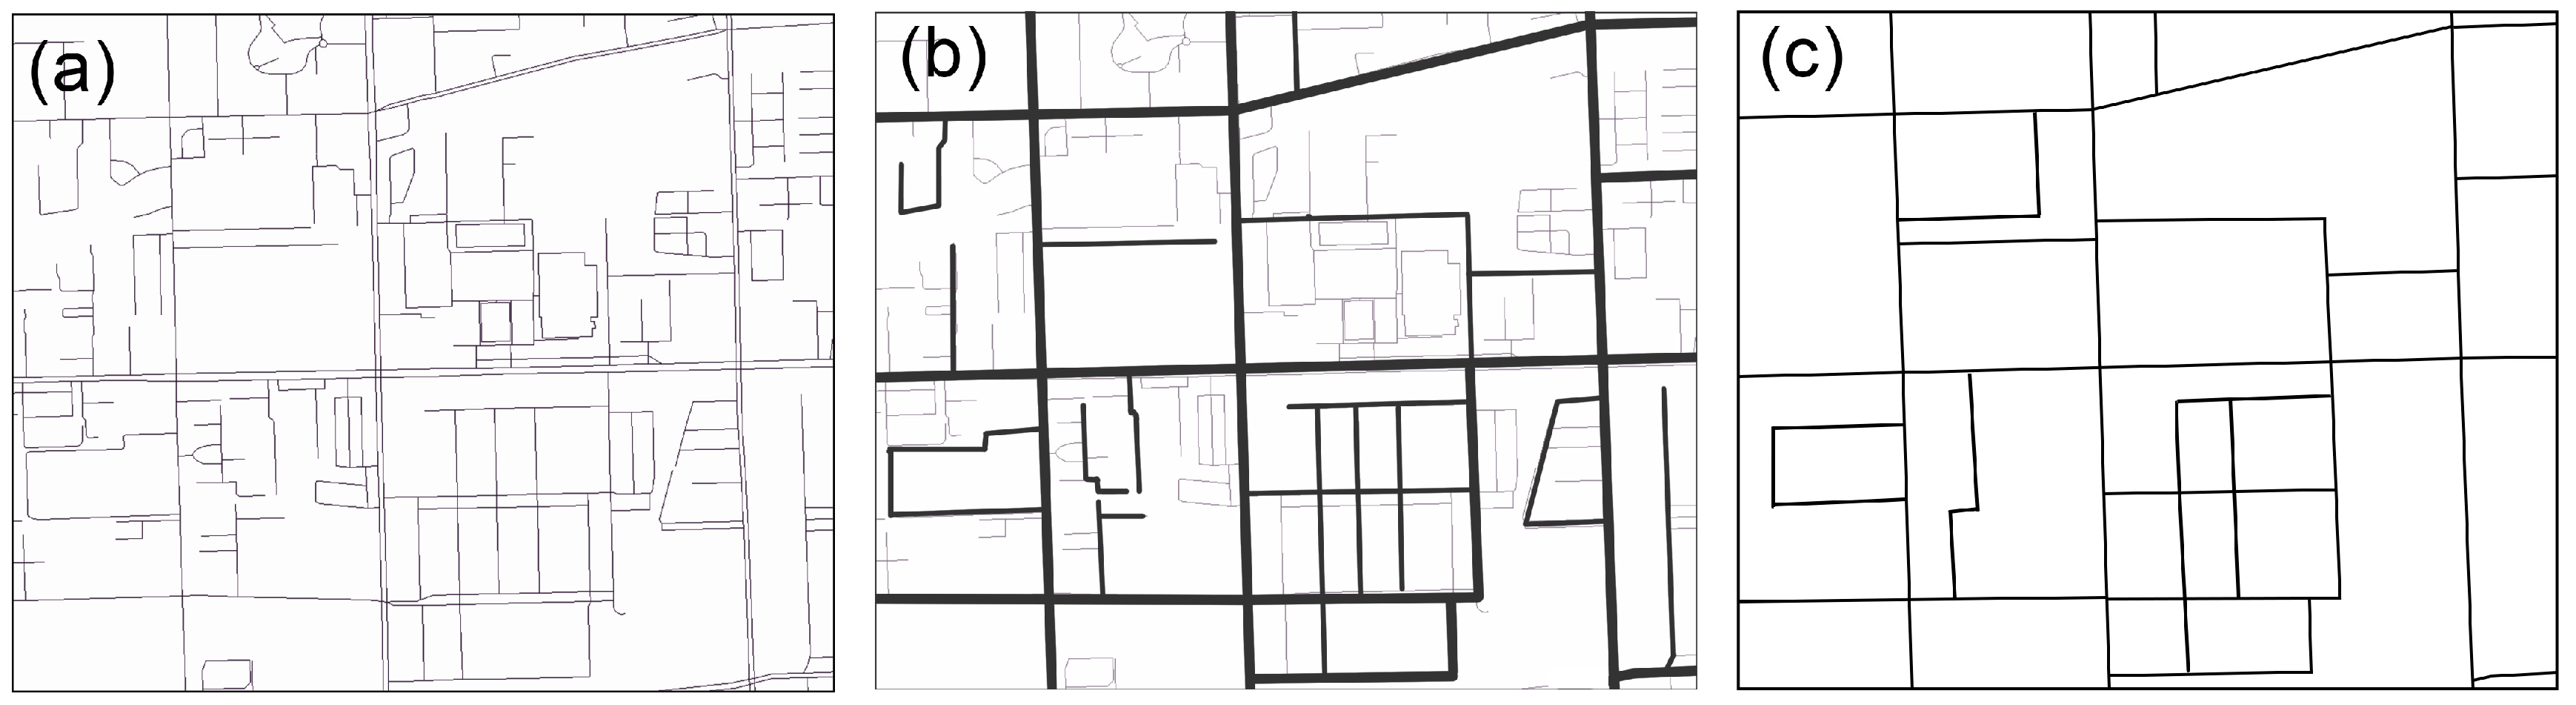
2.3.3. Delineation and Recognition of Urban Functional Zones

For the classification and identification of urban functional zones, this study utilizes open-source geospatial big data (OSM and POI data) to identify urban functional zones. The method of using OSM and POI data for functional zone classification is fast, convenient, and highly operable, providing a methodological reference for urban spatial structure and functional zone classification [43]. According to the relevant literature [24,44,45,46], we delimited urban functional zones (UFZs) in three steps, with all operations performed in ArcGIS 10.8.
Step 1: (a) Based on OSM road network data and vector surface data of the study area, the study area was preliminarily divided in ArcGIS 10.7 feature-to-surface operation, with 18,359 blocks preliminarily divided. (b) For the vector data after the preliminary division, the vector surface blocks of the first-level, second-level, and third-level road areas were selected and merged. (c) The center line of the merged road vector surface data was selected to intersect with the study area to generate independent research units with different block characteristics. Then, referring to Baidu Maps, the boundaries of those blocks with obvious natural boundaries (such as rivers, green spaces, etc.) and changes in building forms were refined to minimize the number of meaningless blocks. After adjustment and refinement, there were 6953 valid blocks in total. The operation is shown in Figure 3.
Step 2: The various types of POI data within each study unit are differentiated and statistically analyzed. POI plays a critical role in identifying urban functional zones (UFZs), as it represents geographic points labeled by socioeconomic activities. This study will collect POI data and combine it with the national construction land classification standards to reclassify it into five categories: residence zones, industry zones, business zones, public service zones, and green land zones, as shown in Table 2. The study uses two indicators, frequency density (Fi) and category ratio (Ci), to identify the functional zone category for each sample block.
F i = n i N i
C i = F i i = 0 5 F i
where i represents the POI type; n i represents the number of POI data of type i in the sample square; N i represents the total number of POI data of type i; F i represents the frequency density of type i POI data in the sample square; and C i represents the ratio of the frequency density of type i POI data in the sample square to the total frequency density of POI. When the value of a specific category C i is the highest within a square, it is identified as the functional zone for that type of POI data.
Step 3: The functional category of blocks was determined by the POI category corresponding to the maximum Ci within the block. To ensure the validity of the UFZ classification results, the UFZ map was carefully verified by visual interpretation based on Baidu image, Essential Urban Land Use Categories in China dataset [47], and experience knowledge. The misclassification of UFZs was manually corrected. The final classification results are presented in Section 3.1.

2.3.4. The Urban Thermal Field Variation Index (UTFVI)

This study uses the Urban Thermal Field Variation Index (UTFVI) to assess urban thermal comfort levels. UTFVI identifies areas more prone to extreme temperatures and helps determine potential areas that require intervention and improvement. The UTFVI calculation formula is as follows:
U T F V I = T s T m e a n T m e a n + 273.5
where UTFVI is urban thermal field variance index. TS is the LST of a pixel (°C), and Tmean is the mean LST of the study area (°C) [48]. UTFVI is evaluated and categorized into six different conditions, providing a comprehensive understanding of thermal comfort levels. The classification criteria are outlined in Table 3.

2.3.5. BRT and Spearman’s Analyses

This study employs the boosted regression tree (BRT) method to evaluate the correlation between the selected urban indicator indicators and LST and discusses the relative contributions and marginal effects of these indicators on LST [27]. BRT is a machine learning statistical model (also known as boosted decision tree) [49] that quantifies the relationship between complex urban indicators and the dependent variable. Unlike traditional statistical models, BRT operates based on a boosting strategy, where multiple decision tree models are constructed in a stepwise manner to enhance the overall predictive capability of the model. Additionally, related studies have shown that urban indicator indicators exhibit nonlinear relationships across different seasons [50]. The configuration of the BRT model in this study was a learning rate of 0.005, a tree complexity of 5, and a bagging fraction of 0.8. The best model was determined by 10-fold cross validation to evaluate the relative importance of various indicators on LST. Subsequently, partial dependence plots (PDPs) were used to quantify the impact of key indicators on LST, and these plots were used to explore the best strategy for cooling/reducing the thermal environment temperature.
Based on the operating principle of the aforementioned BRT model, this study divides the research area into 6953 independent units and randomly assigns them to the training set and test set in a 7:3 ratio. All subsequent indicators are calculated on the 30% test set that did not participate in the model training to ensure the generalization ability and prediction performance of the model on out-of-sample data.
This study also evaluates the correlation between urban indicators and LST across different seasons. Spearman’s correlation coefficient is used, as it is relatively suitable for nonlinear or ordinal data and is better at minimizing the influence of outliers [51]. The Spearman coefficient ranges from −1 to 1 and is used to determine whether each indicator has a positive or negative correlation with LST [52,53].

3. Results

3.1. Zhengzhou Functional Area Identification Results

Using OSM and POI data combined with manual verification, the identification of functional zones in Zhengzhou resulted in a total of 6953 independent units. As shown in Figure 4, green land zones are the most widely distributed, comprising 53% of the total area and predominantly located on the outskirts of the study region. Residence and industry zones follow, accounting for 24% and 12% of the total area, respectively, with residence zones primarily concentrated in the city center.

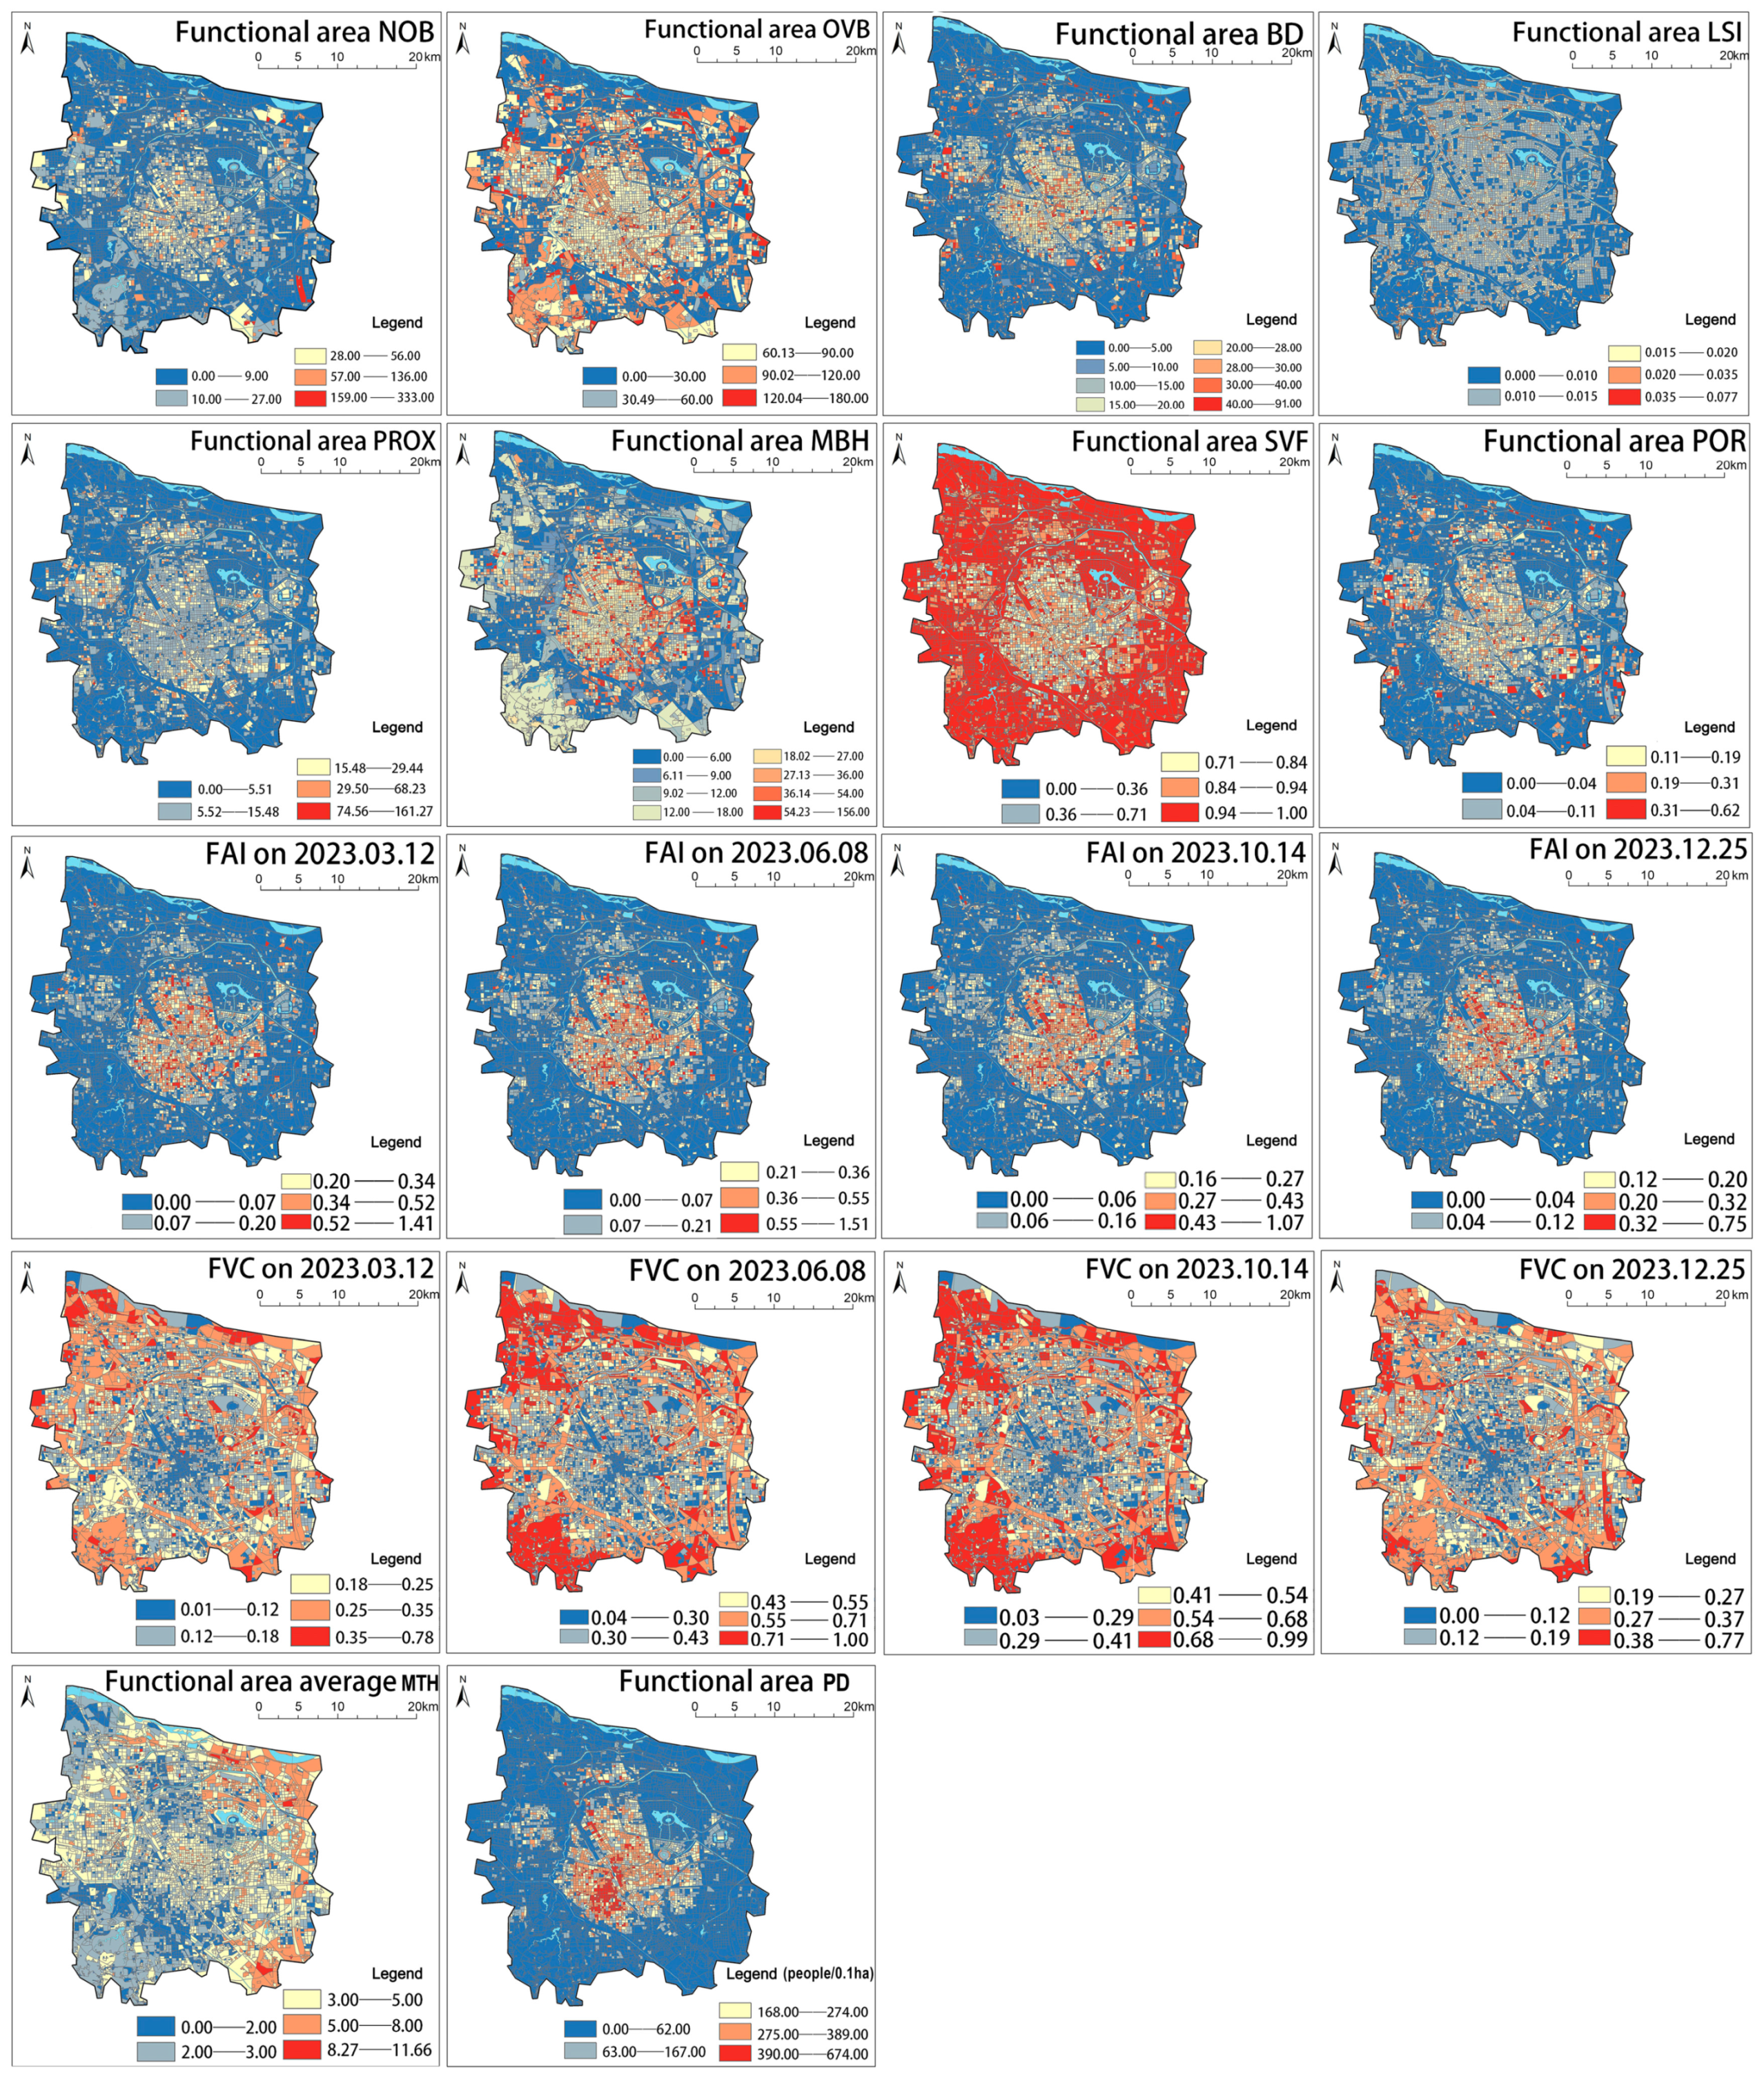
3.2. Seasonal Spatial Distribution of Landscape Architecture Indicators and LST

3.2.1. Seasonal Spatial Distribution of Architectural Landscape Indicators

Figure 5 illustrates the spatial distribution characteristics of various index indicators, revealing significant spatial heterogeneity among the three categories of indicators in Zhengzhou, which reflect the city’s typical urban morphological features. The sky view indicator (SVF) exhibits a “low-to-high” gradient from the city center to the urban periphery, indicating that the central area is characterized by dense buildings, considerable verticality, strong spatial enclosure, and a typical vertically compact urban form. High values of building density (BD) and mean building height (MBH) are concentrated in the central business district and high-density residential areas, with MBH reaching up to 54 m in the core area, indicative of an intensely developed spatial structure. Concurrently, building porosity (POR) remains generally low in the central zone, further confirming the compact building layout and poor ventilation conditions typical of this area. The frontal area index (FAI) displays a pronounced spatial gradient of “high in the center and low at the periphery” across all seasons, peaking at 1.51 in summer. Fractional vegetation cover (FVC) follows an inverse pattern, showing “low in the center and high in the periphery” throughout the year, signifying scarce green space resources and relatively weak ecological buffering capacity in the urban core. Seasonally, FVC attains its annual maximum in summer with a value of 1.00, while it declines significantly in winter, reflecting a reduction in overall vegetation coverage. In contrast, mean tree height (MTH) exhibits minor variation across different functional zones, indicating a relatively balanced distribution of urban tree canopy height. Finally, population density (PD) decreases from the city center to the outskirts, with the highest concentrations in central residential areas, exacerbating anthropogenic heat emissions and urban thermal stress. Detailed data are provided in Supplementary Table S4.

3.2.2. Seasonal Spatial Distribution Characteristics of LST

Figure 6 presents the seasonal distribution of LST in Zhengzhou throughout 2023. In spring, LST ranges from 2.02 °C to 34.94 °C, with higher values predominantly occurring in undeveloped land on the urban periphery, while lower values are mainly observed in areas with substantial water coverage. During summer, LST spans from 15.57 °C to 63.34 °C, with elevated temperatures concentrated in residence and business zones within the city core, and lower temperatures occurring not only in water-covered areas but also in regions with dense vegetation. The LST patterns in autumn and winter exhibit a similar “high-low-high” stepped gradient radiating from the city center outward. Notably, autumn LST values exceed those in winter, which can be attributed to the use of heating systems in northern regions during the colder months. High LST values are primarily concentrated in the southeastern part of the city, encompassing industrial development zones and central residence zones, whereas low LST values are predominantly associated with water bodies.
To analyze the average, maximum, and minimum temperatures and the spatial distribution of five functional zones across different seasons, Table 4 and Supplementary Figure S1 were generated. The results indicate that, regardless of the season, industrial zones consistently exhibit the highest average LST, with mean values of 20.72 °C, 44.41 °C, 27.87 °C, and 5.36 °C in spring, summer, autumn, and winter, respectively. Residence zones maintain higher average LST than green land zones throughout the year. High-temperature areas within residence zones are concentrated in the city center year-round, whereas residential zones adjacent to water bodies demonstrate significant cooling effects. Business zones exhibit an average LST of 54.52 °C in summer and −0.53 °C in winter, representing both the highest summer temperature and the lowest winter temperature among the five functional zones, highlighting a pronounced seasonal variation. In public service zones, LST remains relatively stable across all seasons. For green land zones, LST is the lowest in autumn and winter, attributed to vegetation’s shading effect and low albedo, which enhances the absorption of solar radiation and heat. In spring, overall LST is relatively low, as vegetation’s heat absorption is less than its heat dissipation, resulting in higher spring and winter LST compared to other zones. Overall, the UHI effect is most pronounced in summer across all functional zones, with industry, business, and public service zones exhibiting stronger heat island intensity than residence zones. Green land zones display the lowest heat island intensity, while residence zones experience substantial seasonal LST fluctuations, including a spring-to-summer temperature difference of up to 24.71 °C and a summer peak of 50.18 °C, posing significant heatwave risks.

3.3. Analysis of Indicators Affecting LST and Their Correlations

3.3.1. Correlation Analysis of Each Indicator with LST

Spearman correlation analysis was conducted to assess the relationships among urban population, landscape and building indicators, and LST across different functional zones and seasons. The results demonstrated that, except for winter, the landscape indicator FVC consistently exhibited a significant negative correlation with LST. In summer, the correlation coefficient between FVC and LST across all functional zones reached as low as −0.57, indicating a strong cooling effect of FVC on LST. Conversely, the building indicator BD showed a positive correlation with LST, with stronger associations observed in residence, business, and industry zones. Notably, the correlation coefficient in residence zones during autumn was approximately 0.46. Correlations were relatively weaker in public service and green land zones, with the lowest value of −0.28 observed in public service zones during winter. Additionally, POR demonstrated a positive correlation with LST in residence and industry zones, peaking at approximately 0.46 in industry zones during summer. PD was significantly correlated with LST in residence, industry, and business zones during summer and autumn, reflecting a pronounced warming effect. These findings suggest that seasonal variations and differences among functional zones modulate the strength and direction of these indicator relationships. Overall, the correlations among all categories of indicators were the most pronounced in summer and the weakest in winter (Figure 7).

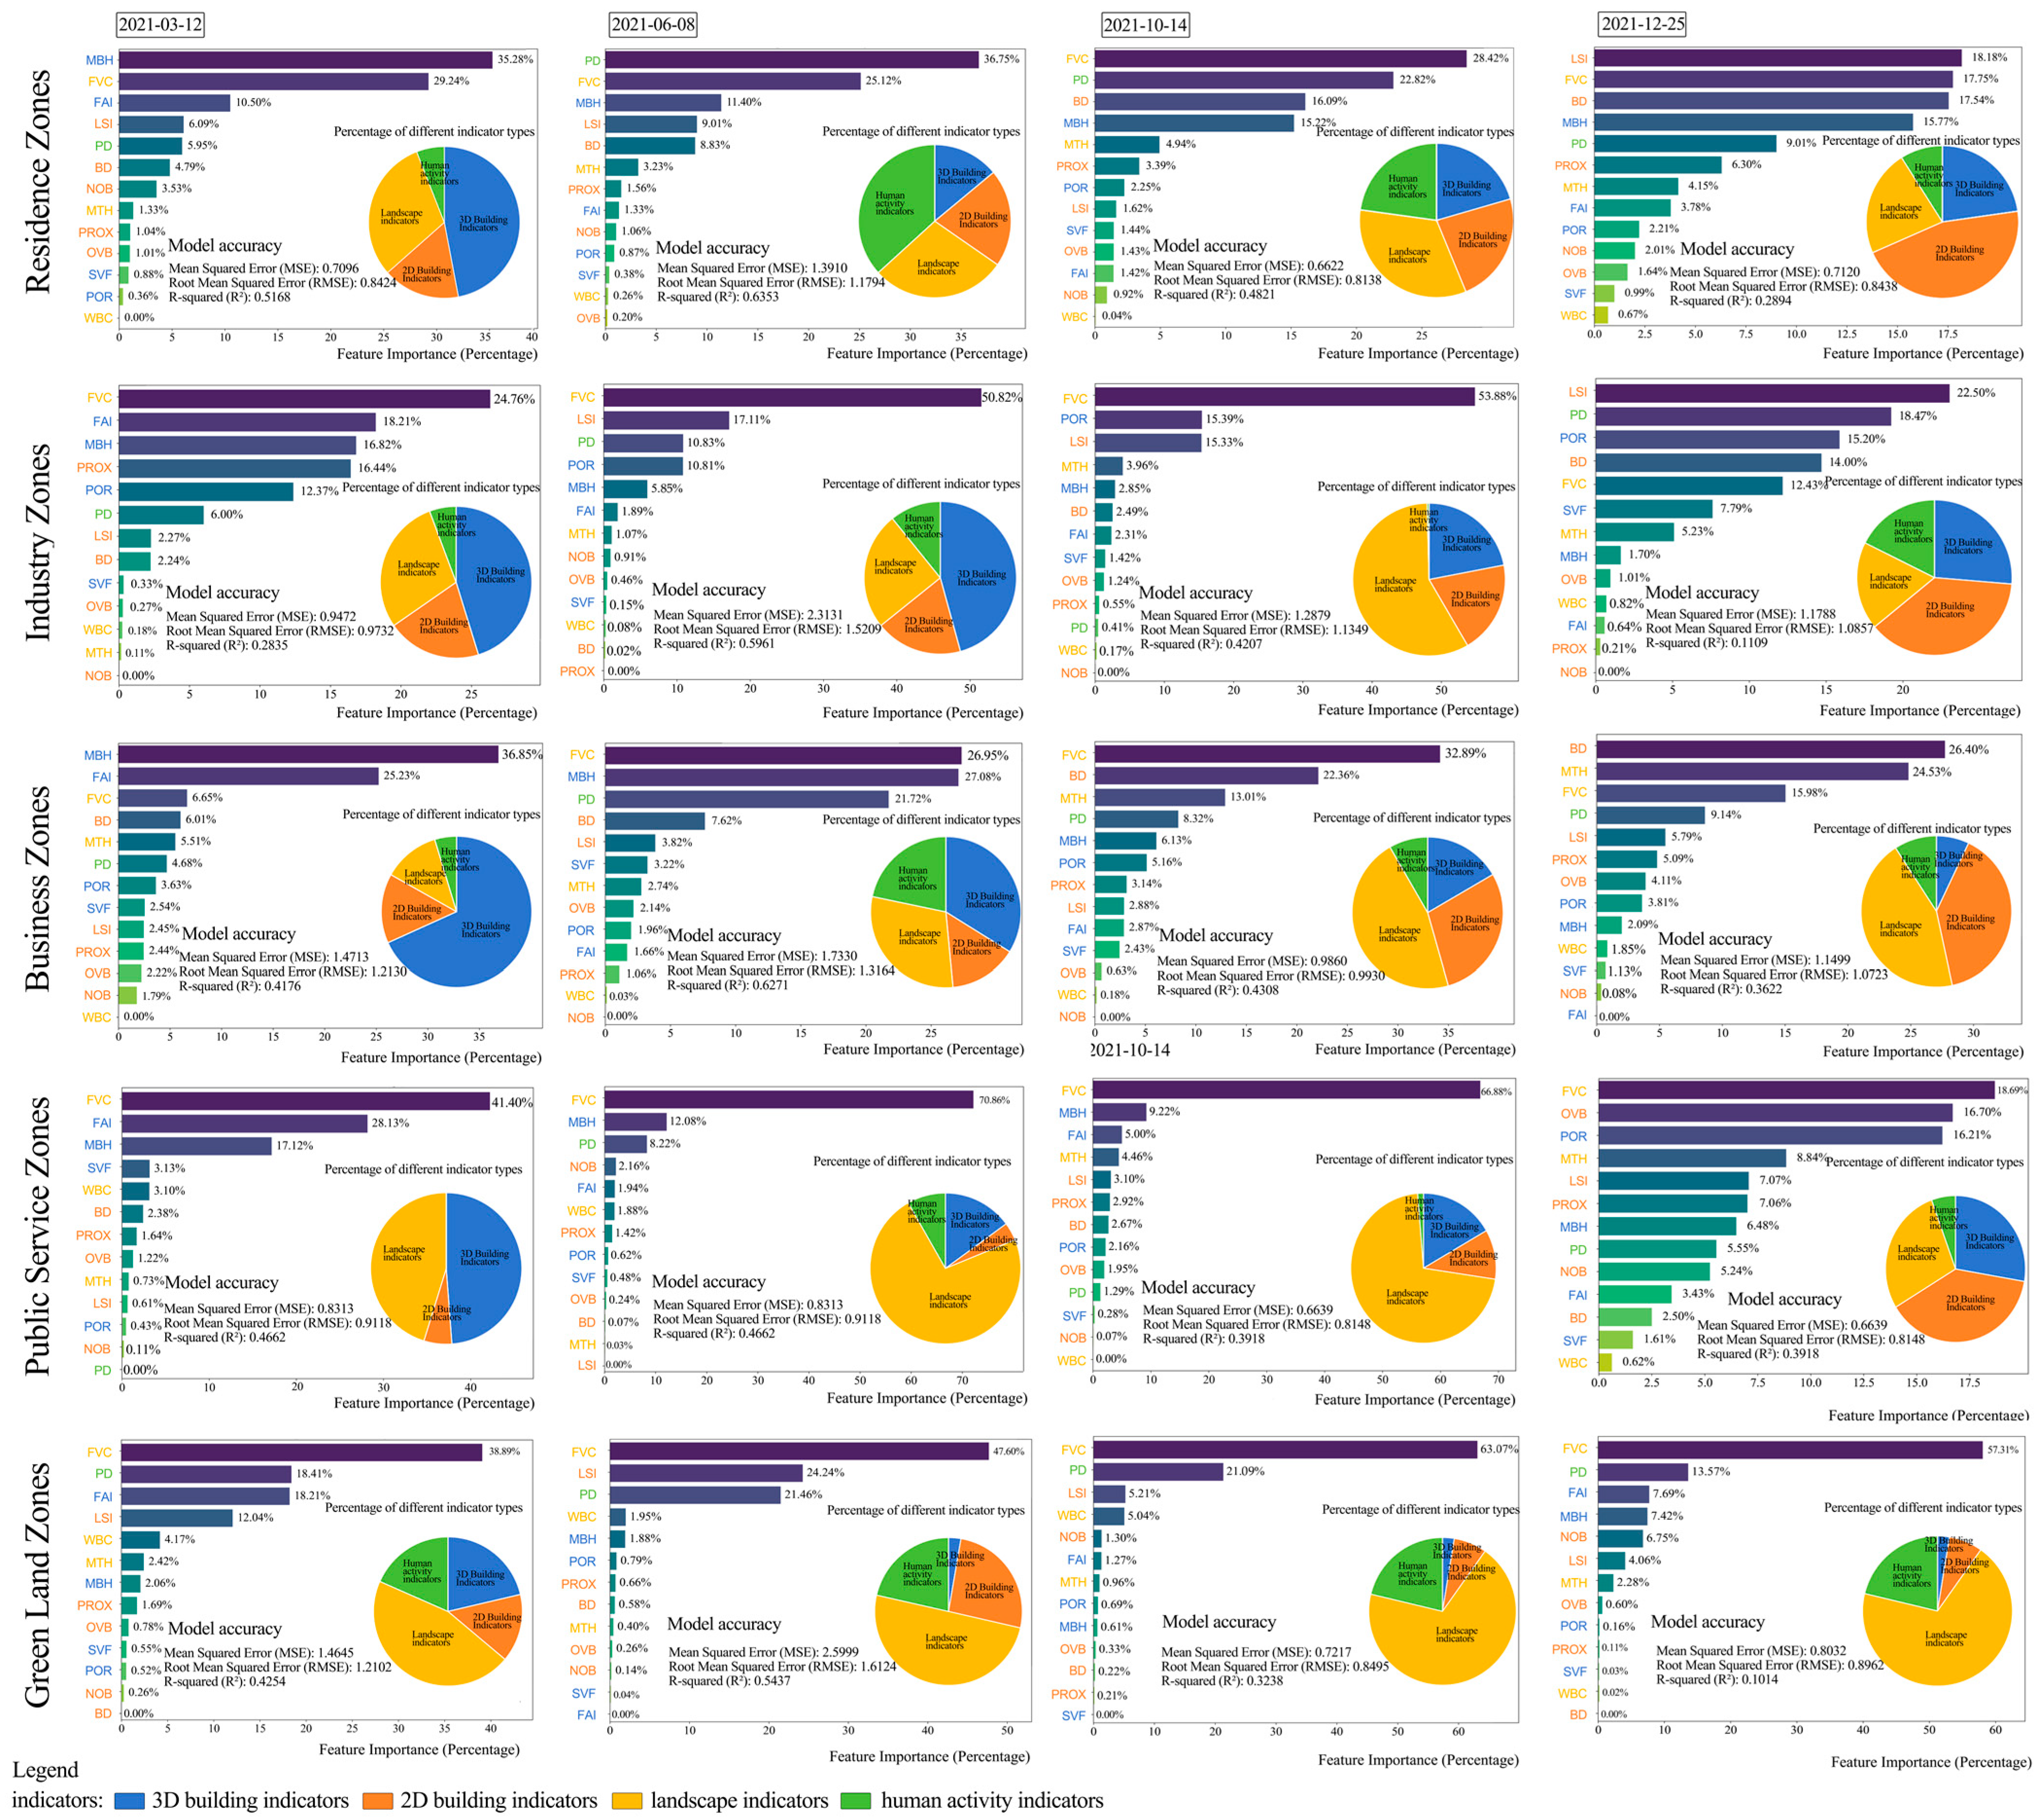
3.3.2. Percentage of Relative Impact of Each Indicator

The overall explanatory power of the model can be evaluated using the R2 values of the BRT model [54]. The indicators selected in this study effectively explain the variations in LST across different functional zones of Zhengzhou in 2023. In spring, the model explains 52% of the variance in residence zones, 28% in industry zones, 42% in business zones, 47% in public service zones, and 43% in green land zones. In summer, the explanatory power increases to 64% for residence zones, 60% for industry zones, 63% for business zones, 47% for public service zones, and 54% for green land zones. In autumn, the explanatory power is 48% for residence zones, 42% for industry zones, 43% for business zones, 39% for public service zones, and 32% for green land zones. In winter, the explanatory power declines markedly, with 29% in residence zones, 11% in industry zones, 36% in business zones, 39% in public service zones, and only 10% in green land zones. Overall, the model exhibits the highest explanatory power in summer and the weakest in winter.
Based on the BRT model, Figure 8 illustrates the relative contributions of human activities, landscape characteristics, and building indicators to LST across five urban functional zones and four seasons. In residence, industry, and public service zones, the relative contribution of building indices during spring and winter surpasses the combined contributions of landscape and human activity indices. Overall, landscape indicators dominate in most zones and seasons. In green land zones, the relative contribution of landscape indices exceeds 45%. Except for business zones in spring, the relative contribution of FVC to landscape indicators remains above 10% across all seasons and functional zones. Beyond the consistently influential FVC indicator, key indicators affecting LST in residential zones include building-related indices such as MBH, BD, and PD. The contribution of MBH peaks at 35.28% in spring, while BD exhibits a relatively low contribution of 4.79% in spring but becomes more influential in summer, autumn, and winter, with respective values of 8.83%, 16.09%, and 17.54%. During summer, PD plays a particularly significant role, with a relative contribution of 36.75%, underscoring the substantial impact of human activities on LST in residence zones during this season.

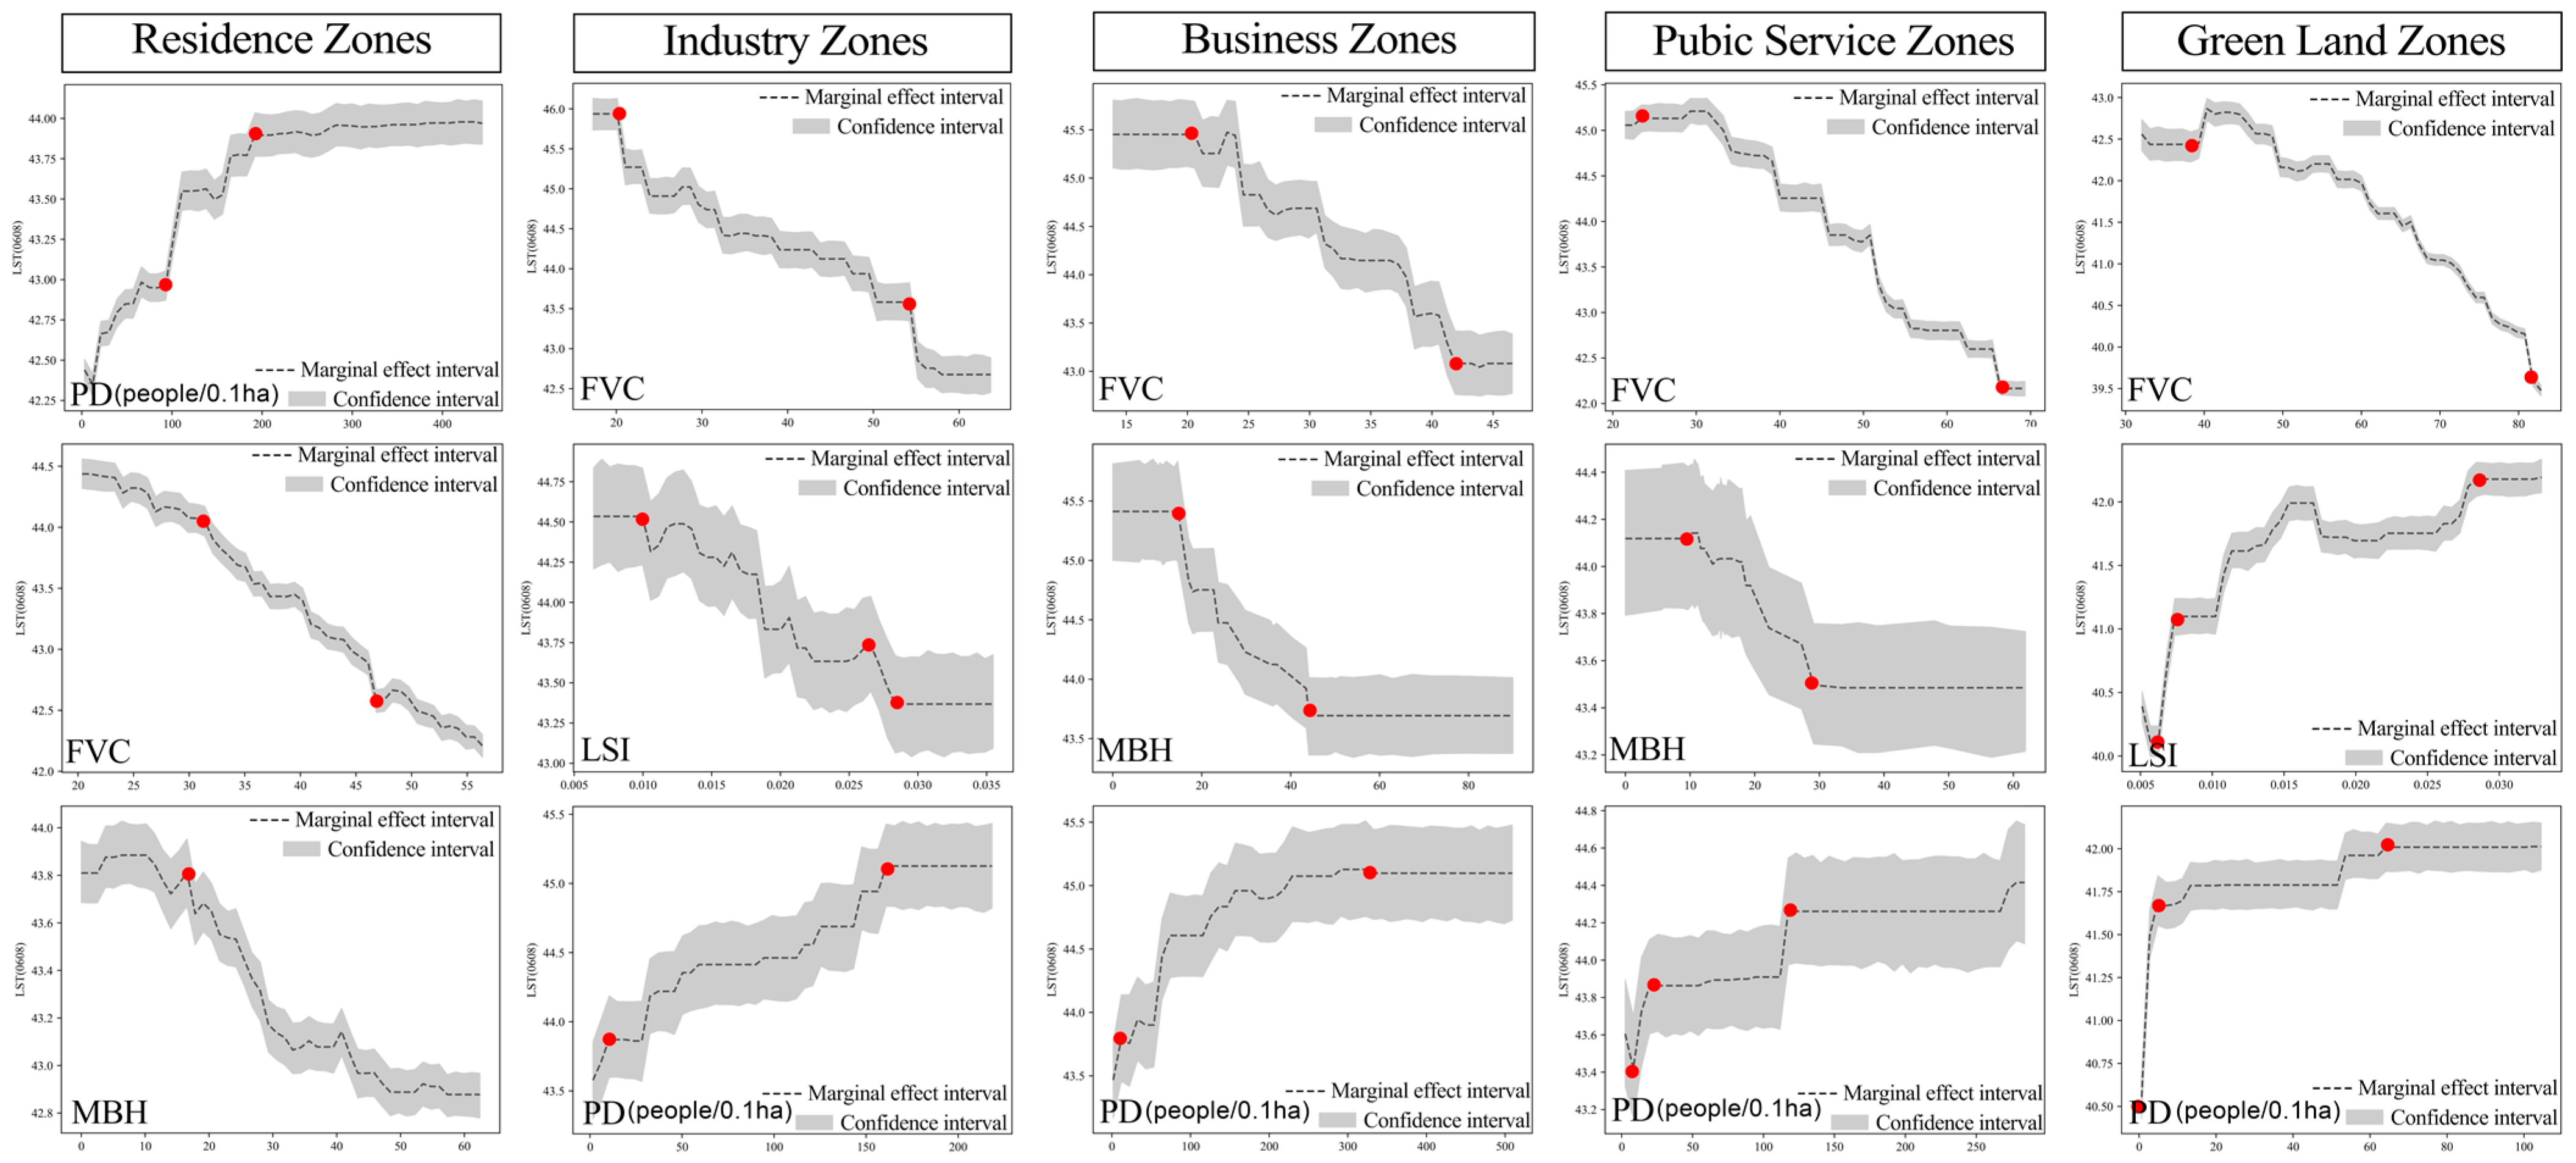
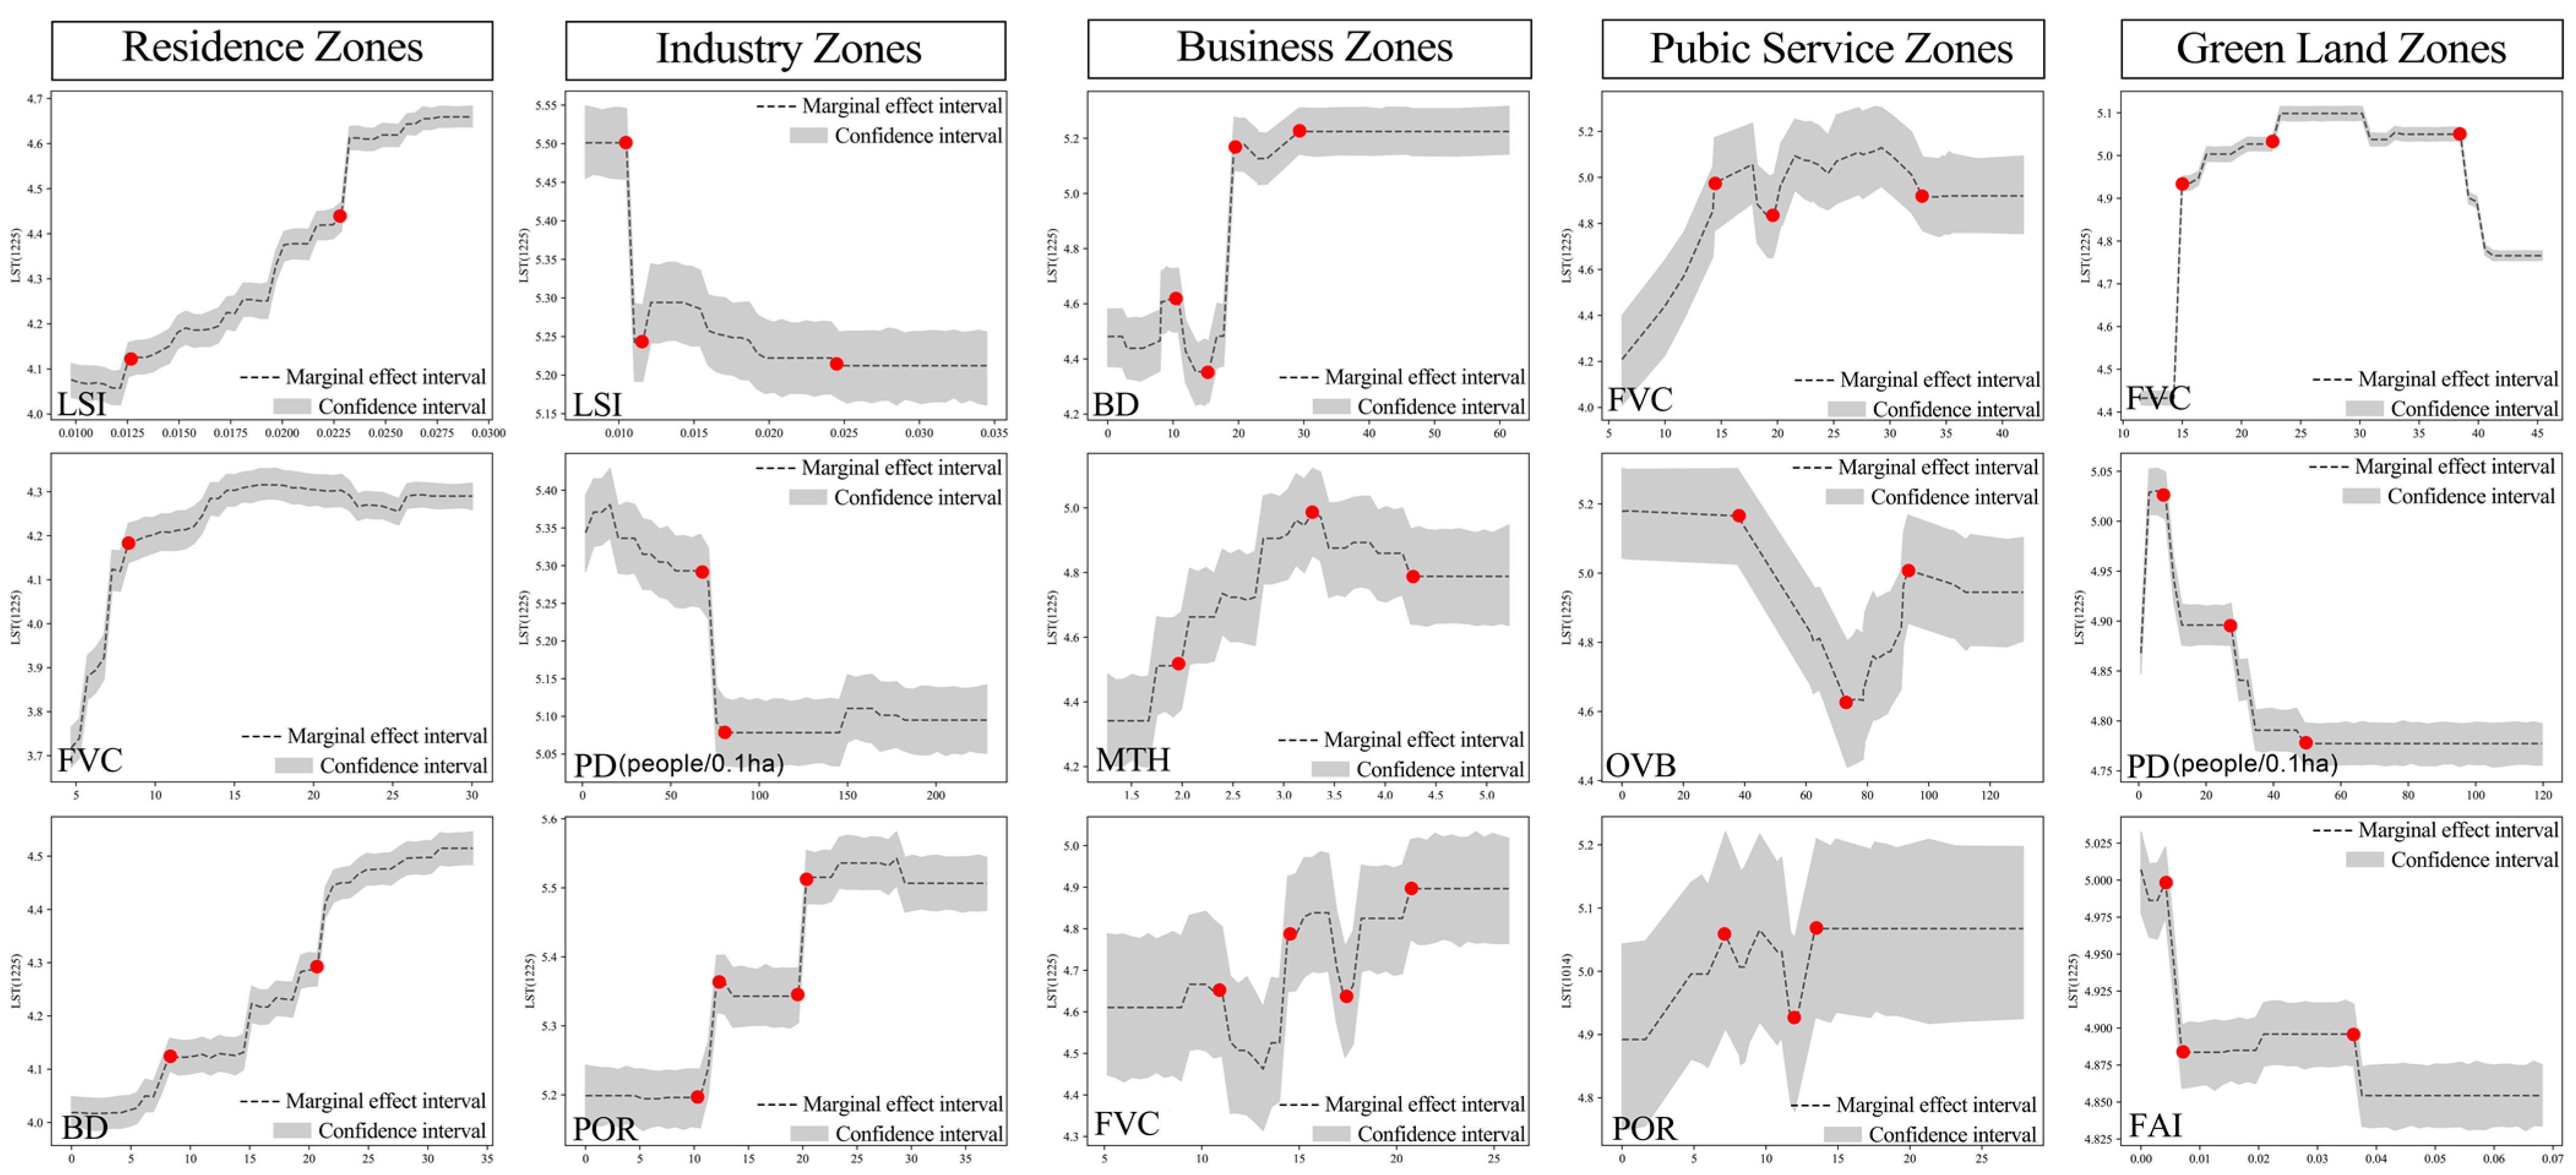
3.4. Quantifying the Effect of Indicators on LST Seasonality

We analyzed the influence of functional zone indicators on LST using marginal effect plots. The results indicate that each indicator exerts a distinct impact on LST, with threshold ranges varying across seasons and functional zones.
In spring, both FVC and FAI demonstrated consistent cooling effects across all functional zones. Specifically, for every 10% increase in FVC, the cooling intensity followed the order: green land zones (−0.95 °C) > residence zones (−0.81 °C) > business zones (−0.53 °C) > public service zones (−0.33 °C) > industry zones (−0.21 °C). The cooling effect of FAI was the strongest in green land zones and the weakest in residence zones, with a temperature reduction of 0.11 °C for every 0.1 increase in FAI. MBH significantly reduced LST in all functional zones except green land zones. Notably, in business zones, LST decreased by 0.69 °C for every 10 m increase in MBH. Additionally, other indicators such as PD also played substantial roles, with their impacts varying across functional zones (Figure 9).
In summer, FVC remains the most significant indicator contributing to cooling across all functional zones. Specifically, for every 10% increase in FVC, LST decreases by 1.15 °C in residence and business zones, 0.95 °C in public service zones, 0.51 °C in industry zones, and 0.19 °C in green land zones. Conversely, an increase in PD leads to an LST rise across all zones, with residence zones being the most affected. This effect is primarily attributed to intensified population mobility during summer, resulting in higher vehicle emissions and anthropogenic heat release. In addition, MBH demonstrates a notable cooling effect in residence, business, and public service zones. Among these, the cooling effect of MBH is most pronounced in business zones, where a 10 m increase in MBH corresponds to a 0.53 °C reduction in LST. To effectively mitigate heat in business zones, it is advisable to maintain building heights around 35 m, achieving a balance between building density and thermal regulation (Figure 10).
In autumn, FVC continues to exert a cooling influence across all functional zones. The impact of BD on residential zones becomes increasingly pronounced; for every 10% increase in BD, LST rises by 0.34 °C. In contrast, MBH exhibits a nonlinear effect in business zones. When MBH is below 4.78 m, LST increases with MBH, whereas beyond this threshold, LST begins to decrease. In public service zones, MBH demonstrates a stable cooling effect throughout the observed range. PD has a significant warming influence in both residence and green land zones. In residence zones, PD varies between 0 and 127 persons per 0.1 hectare, resulting in a rapid temperature increase of approximately 0.44 °C. Additionally, the LSI exhibits a strong cooling effect in industry zones but shows a notable warming effect in green land zones (Figure 11).
In winter, FVC exhibits a warming effect, in contrast to its cooling behavior observed in other seasons. This warming effect is most pronounced in public service zones, where LST can increase by up to 0.94 °C. Such seasonal variation can be attributed to reduced vegetation activity, lower ambient temperatures, weakened solar radiation, and leaf shedding during this period. BD demonstrates a notable warming influence in residence and business zones. Within the range of 0–30%, LST in residence zones increases by 0.49 °C, while in business zones, it rises by 0.73 °C. During winter, building-related indicators dominate thermal regulation. Due to higher indoor population density, these indicators exert significant influence on LST, playing a crucial role in both heat retention and dissipation (Figure 12).
Overall, the landscape indicator FVC consistently exhibited a strong cooling effect across all functional zones and seasons, establishing itself as the dominant cooling driver. PD generally contributed to LST increases, with its impact being most pronounced during summer. Among the building-related indicators, MBH emerged as a key indicator with substantial cooling effects, whereas BD demonstrated a marked warming influence, particularly in residence, business, and industry zones. Furthermore, the influence of building-related indicators on LST was generally stronger in autumn and winter, reflecting seasonal variations in urban thermodynamic processes.

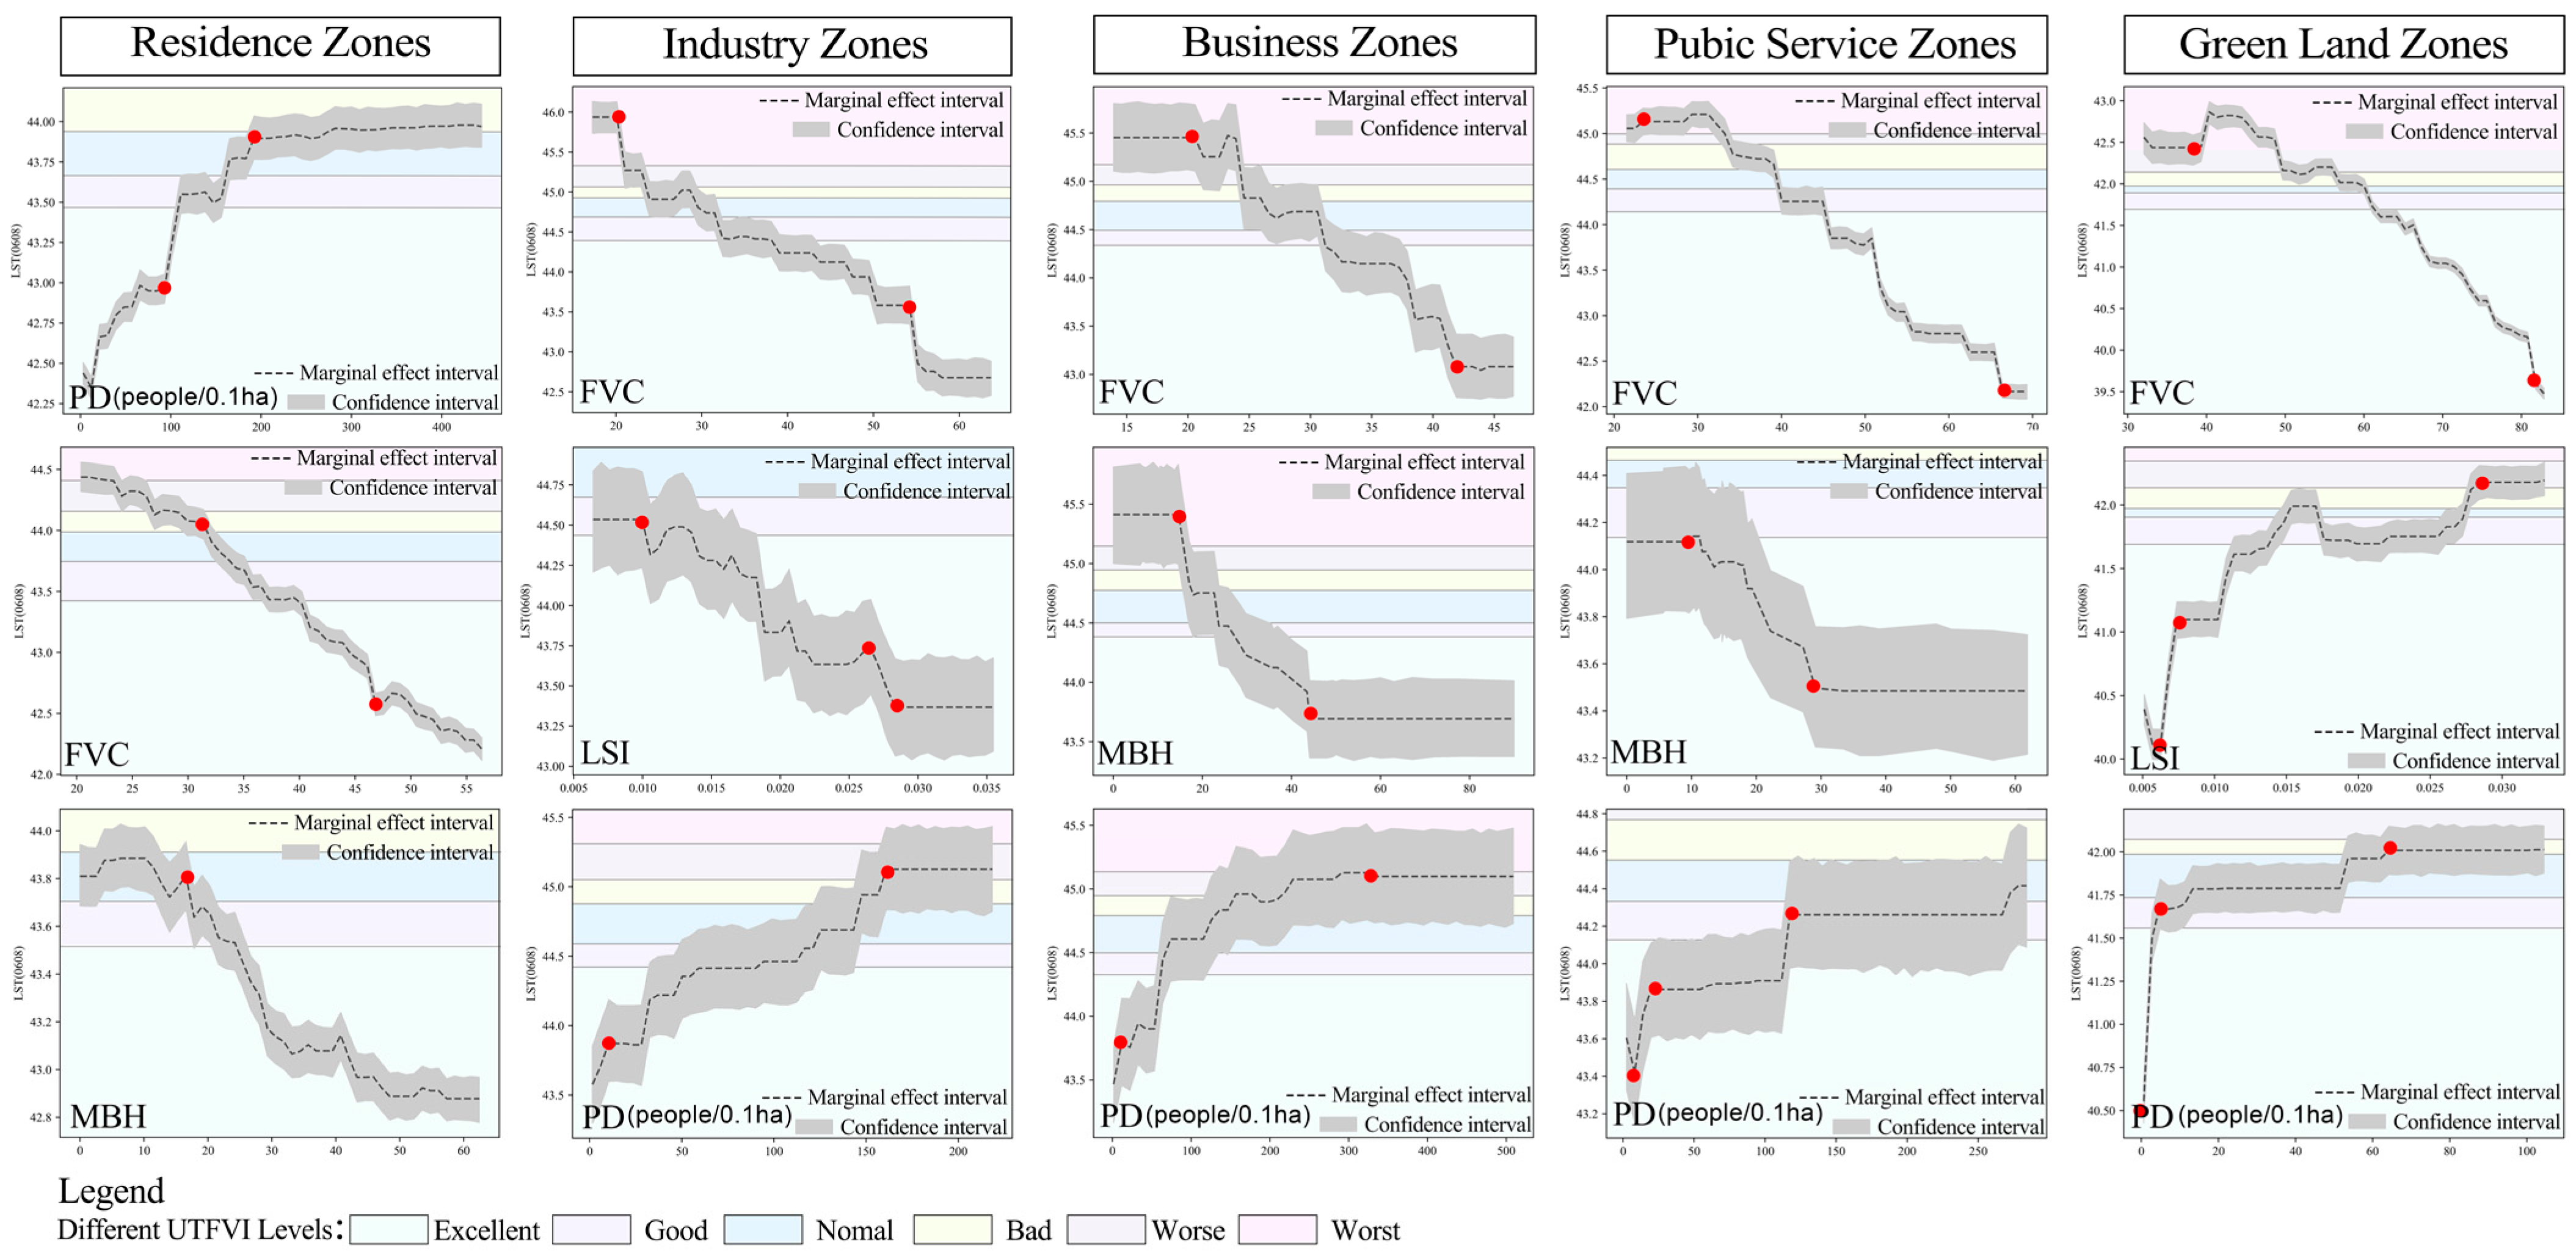
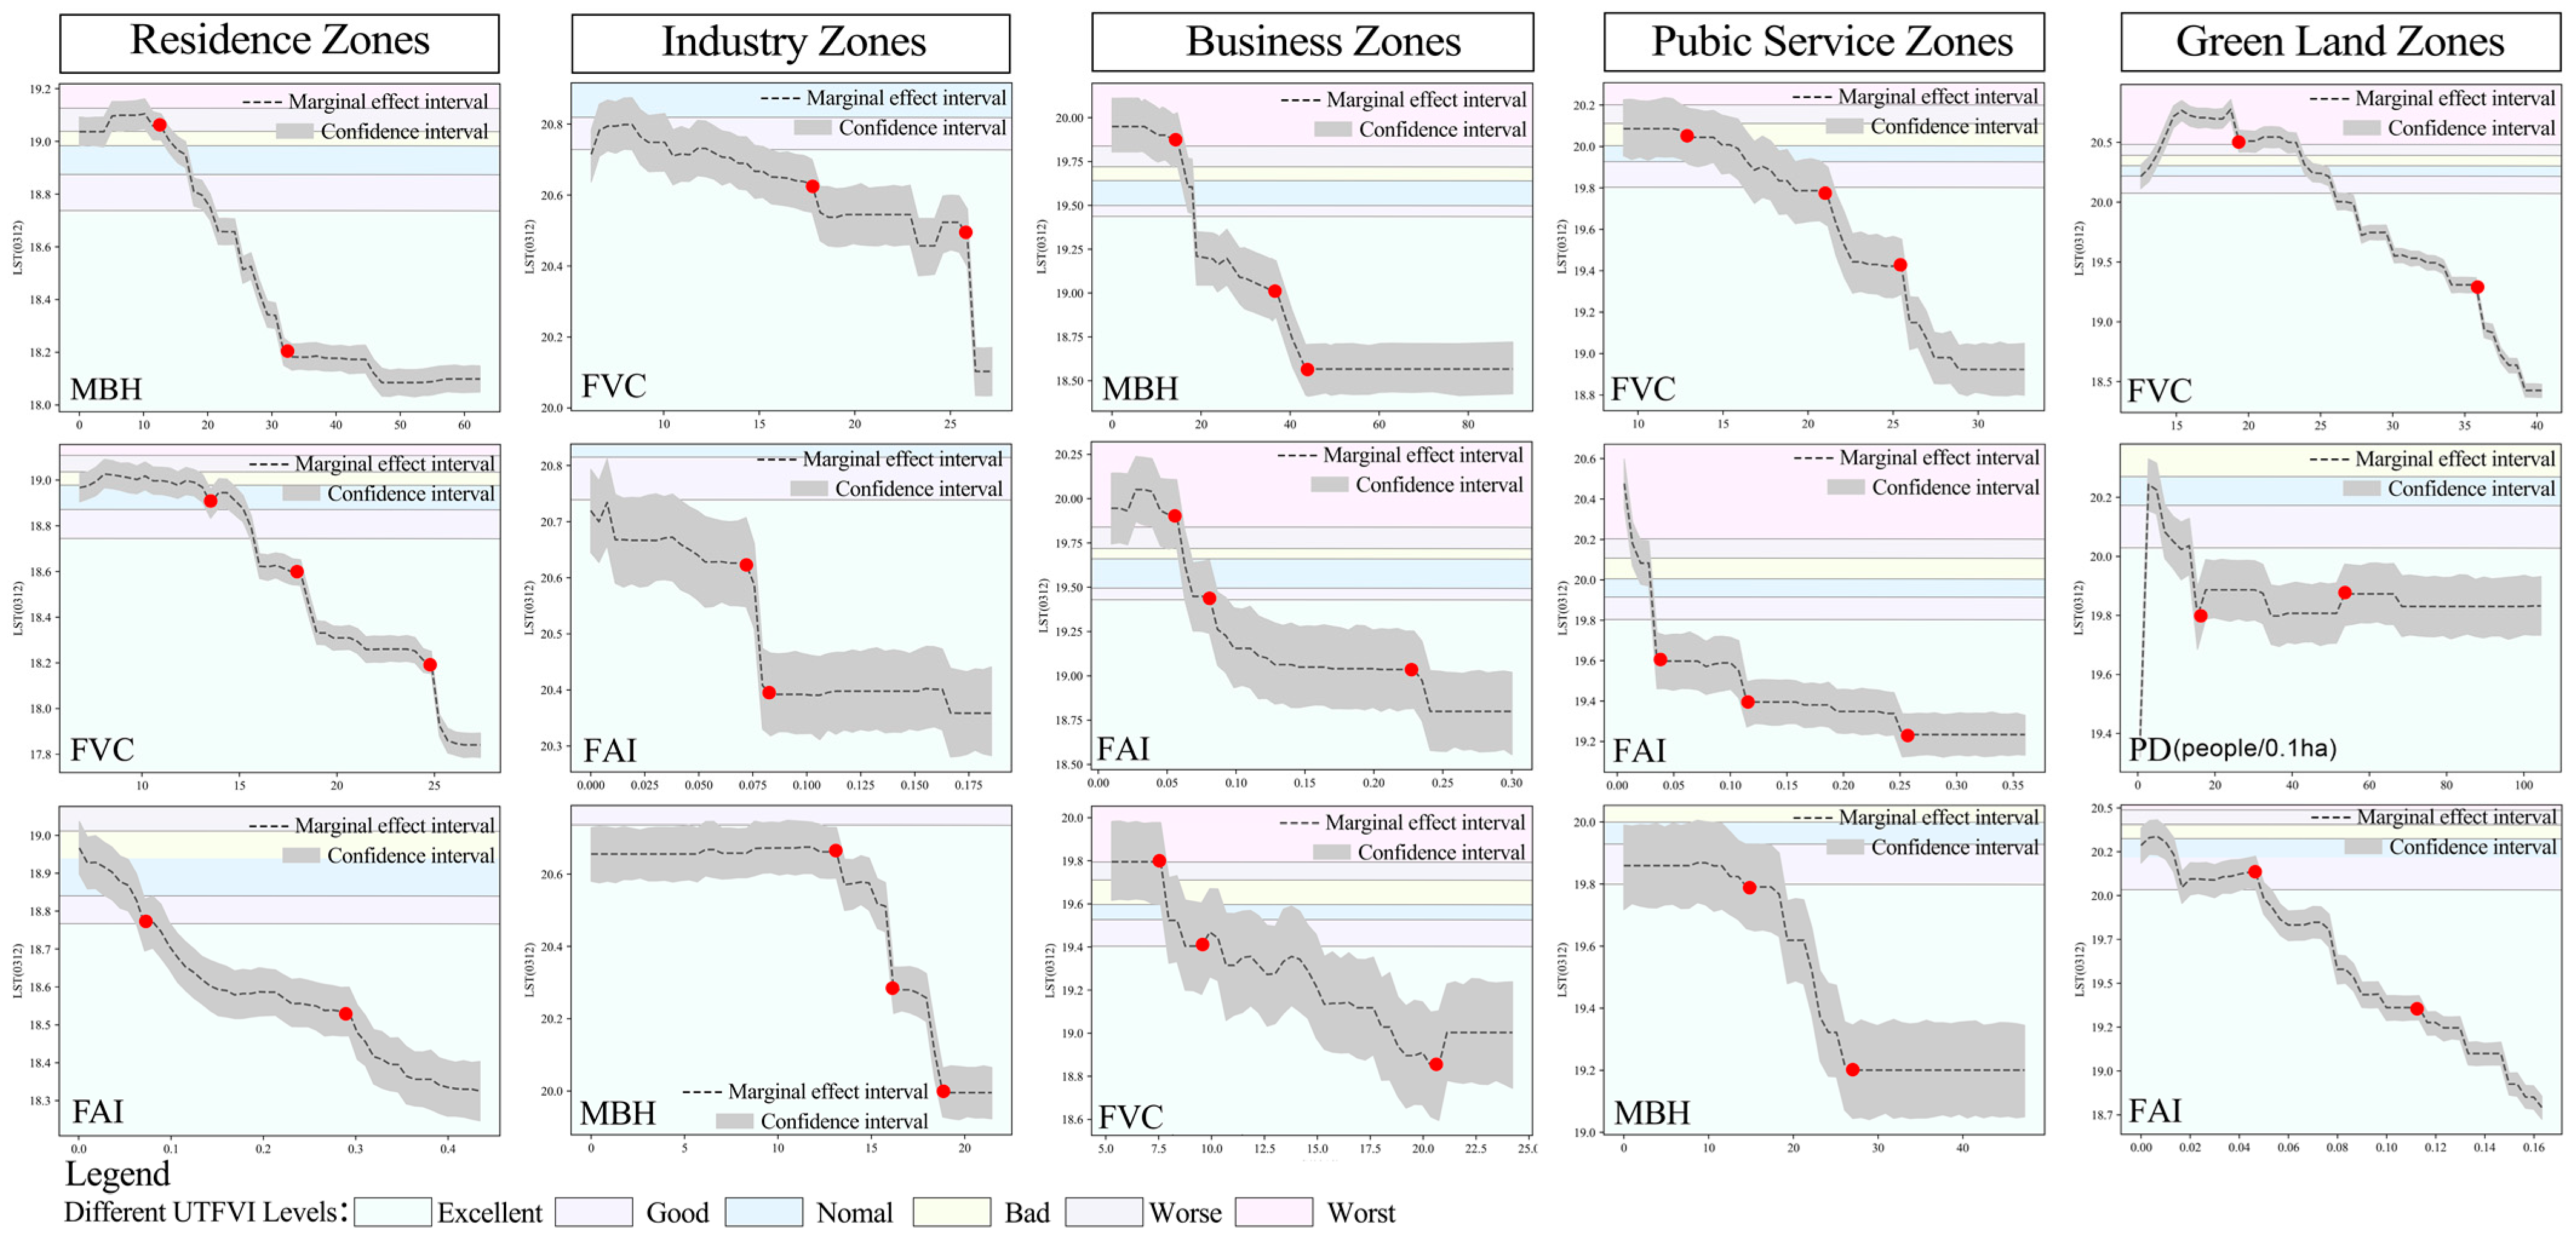
3.5. Morphological Thresholds for Different UTFVI Levels

The UTFVI is an important indicator for assessing environmental conditions and urban health quality. Based on the UTFVI calculation method described in Section 2.3.4, Table 5 highlights the thermal comfort thresholds of morphological indicators for each functional zone under spring (normal climate) and summer (extreme climate) conditions. These results serve as a valuable reference for evaluating the intensity of the thermal environment and the associated quality of life across different urban zones.
According to Table 5 and Figure 9 and Figure 10 in Section 3.5, the indicator thresholds corresponding to different UTFVI levels are presented. As shown in Figure 13, during summer, all functional zones are strongly influenced by the landscape ecological indicator FVC, which is associated with six distinct thermal comfort levels, highlighting its high sensitivity across all regions. Specifically, maintaining FVC above 40% in residence zones, 38% in industry zones, 31% in business zones, 33% in public service zones, and 62% in green land zones ensures that thermal comfort remains optimal during summer. Similarly, the PD indicator exhibits at least three thermal comfort thresholds. Discomfort levels increase when the average population density exceeds 270 people/0.1 ha in residence zones, 144 people/0.1 ha in industry zones, 124 people/0.1 ha in business zones, and 63 people/0.1 ha in green land zones. MBH demonstrates high sensitivity in business zones, where thermal comfort reaches its optimal state when building height exceeds 26.8 m. For the building indicator LSI, maintaining it within the range of 0.0103–0.0115 or above 0.0135 in industry zones, and below 0.0135 in green land zones, ensures optimal thermal comfort.
In spring (Figure 14), the overall indicators result in fewer changes in thermal comfort levels. FVC significantly influences the LST of each functional zone, but the FVC thresholds affecting thermal comfort vary across zones. Specifically, optimal thermal comfort can be achieved when FVC exceeds 15.8% in residence zones, 10.9% in industry zones, 10.6% in business zones, 19.1% in public service zones, and 25.9% in green land zones. The FAI demonstrates high sensitivity across all functional zones, with the greatest sensitivity observed in business and public service zones, resulting in six distinct thermal comfort levels. To ensure optimal thermal comfort during spring, FAI should be maintained above 0.08 in business zones and above 0.032 in public service zones. MBH also exhibits high sensitivity to thermal comfort in business zones, presenting six distinct thermal comfort levels. In these zones, optimal thermal comfort is achieved when MBH exceeds 18.8 m. For detailed indicator thresholds corresponding to different UTFVI levels, see Supplementary Tables S4 and S5.

4. Discussion

4.1. Seasonal Impact of Architectural Landscape Characteristics on LST in Different Functional Zones

This study analyzed the seasonal mechanisms by which three categories of indicators—architectural 2D/3D metrics, landscape characteristics, and human activities—influence LST across different urban functional zones. The results revealed that LST exhibited nonlinear variations in response to changes in architectural and landscape indicators, with certain indicators showing significant seasonal differences in their effects on LST. MBH emerged as the primary cooling indicator, particularly in residence and business zones. This effect may be attributed to high-rise buildings generating larger shadows and increasing surface roughness, which enhances mechanical turbulence and convective heat dissipation, ultimately reducing LST [55]. POR was identified as a key contributor to LST increases in residence, industry, and business zones, likely due to the scarcity of vegetation and the predominance of impervious surfaces, leading to heat accumulation and poor ventilation. BD, which reflects the proportion of built-up area, showed a significant positive correlation with LST in spring and summer, consistent with prior findings [28]. This relationship may stem from increased impervious surface coverage that intensifies heat absorption and storage, thereby exacerbating LST rise. FVC consistently exerted a cooling effect across all functional zones and seasons, with the most pronounced impact observed in summer, aligning with previous research. Landscape indicators generally dominated the regulation of LST across most zones and seasons, exhibiting relative contribution rates exceeding 45% in park green areas. PD also played a significant role in LST modulation, particularly in summer and autumn, when higher population densities were associated with increased LST. This pattern corresponds with existing studies [40] and may be explained by intensified energy consumption and anthropogenic heat emissions in densely populated areas.

4.2. Suggested Implications for Future Urban Planning

This study examined the top three indicators by their relative contributions to LST during extreme and normal seasons across five urban functional zones: residence, industry, business, public service, and green land zones. Key indicators analyzed include FVC, PD, MBH, FAI, and others, whose impacts on LST vary according to urban context and season. The main findings are summarized as follows:
The analysis results are summarized as follows:
  • Residence Zones: The primary influential indicators in both spring and summer are FVC, PD, MBH, and FAI. Enhancing FVC above 13% in spring and 31.6% in summer is recommended to strengthen cooling effects and reduce heat accumulation. Additionally, maintaining MBH above 24 m can improve ventilation and shading, thereby enhancing thermal comfort in high-density residential environments.
  • Industry Zones: Key drivers include FVC, MBH, FAI, LSI, and PD. Increasing FVC beyond 29.2% and integrating green buffer zones with adjacent vegetation can significantly improve thermal comfort during summer. When PD exceeds 144 persons per 0.1 hectare, thermal discomfort tends to rise, likely due to increased anthropogenic heat. Therefore, controlling population density and introducing green infrastructure are effective cooling strategies.
  • Business Zones: FVC, MBH, FAI, and PD significantly affect thermal comfort. Maintaining FVC above 8% in spring and 26% in summer substantially improves thermal conditions, highlighting the importance of preserving green corridors and pocket parks amid high-rise developments. Moreover, an MBH of 26.8 m or greater enhances thermal performance, likely via improved urban ventilation and shading, indicating that vertical development strategies should be integrated with green infrastructure construction.
  • Public Service zones: FVC, MBH, FAI, and PD are significant indicators influencing thermal comfort. FVC should exceed 15% in spring to enhance comfort, but in summer, it should be limited below 39.1% to avoid increased humidity and restricted ventilation due to dense vegetation. A spring FAI above 0.032 promotes wind permeability and should be incorporated into the design criteria for large public buildings.
  • Green Land Zones: Important indicators include FVC, PD, FAI, and LSI. To maintain thermal comfort in summer, LSI should be kept below 0.0135. Additionally, when PD exceeds 63 persons per 0.1 hectare, thermal discomfort increases, suggesting the need for crowd management or shading interventions during peak hours (Figure 15).
Although this study investigated the impacts of built landscape metrics on LST and UTFVI across five urban functional zones, as highlighted in recent IPCC reports (https://www.ipcc.ch/report/ar6/wg2/ (accessed on 13 March 2024)), future research should place greater emphasis on integrated, multi-scale solutions to comprehensively address the urban heat challenge. Concurrently, scholars such as Zhao et al. have advocated for a strategic framework that enhances urban thermal resilience by optimizing both built and natural components [56]. This approach tailors interventions to specific urban contexts and responds to seasonal temperature variability through the incorporation of green infrastructure, water-sensitive urban design, building material retrofitting, and policies promoting sustainable urban forms. These integrated measures align with the objectives of this study, which aims to develop targeted thermal mitigation strategies for different functional zones. Such a holistic, system-level approach transcends isolated interventions, fostering long-term sustainability and resilience in urban planning. Moving forward, future research should focus on synthesizing strategies across functional zones to yield deeper insights into thermal environment management and to support more adaptive, robust urban design solutions.

4.3. Regulation and Management of Urban Green Space

The research demonstrates that FVC exerts a consistent cooling effect across all urban functional zones and seasons, with the strongest impact observed during summer. For instance, maintaining FVC above 31.6% in residential zones can foster favorable outdoor activity environments by reducing surface and air temperatures, thereby lowering energy demand and mitigating the UHI effect in densely populated areas. These findings underscore the critical role of green infrastructure in stabilizing LST year-round. Nevertheless, despite some cities having nearly 30% of their total area designated as a green space, summer temperatures remain abnormally high. This study’s conclusions indicate that uneven vegetation distribution in high-density areas limits cooling capacity during summer months, and that the cooling effect is influenced by the quality and density of vegetation [57]. Variations in shading and evapotranspiration provided by different tree species and qualities necessitate further research to quantify their differential cooling contributions. Moreover, urban planners often face challenges in rationally allocating the three key zones—high-density residence zones, business districts, and cooler green spaces—at the macro functional zoning level [54], which weakens thermal regulation between these zones. The study also highlights the importance of MBH in shaping thermal comfort; for example, vegetation more effectively cools areas below certain MBH thresholds (24 m in residence zones and 27 m in business zones). Overall, urban strategies should prioritize enhancing the distribution of vegetated green space, optimizing tree species composition and density, and integrating green infrastructure to establish green corridors linking existing parks with dense urban centers [58]. Such combined efforts, coupled with adequate vegetation cover, can generate sustained cooling effects across multiple scales and foster more heat-resilient neighborhoods.

4.4. Limitations and Future Research Directions

While this study identifies the seasonal effects of urban landscape patterns on LST from the perspective of functional zones, several limitations highlight avenues for future research. First, due to data constraints, the remote sensing imagery used for LST inversion has a spatial resolution of only 30 m, which limits the ability to capture fine-scale thermal heterogeneity. Future studies should prioritize acquiring higher-resolution remote sensing data to improve accuracy. Second, enhancing classification accuracy requires greater collaboration between governmental agencies and organizations to provide comprehensive urban functional zone datasets accessible to researchers, thereby supporting more effective urban heat mitigation strategies. Third, this study focused exclusively on the seasonal response mechanisms and threshold ranges of landscape features within Zhengzhou’s functional zones. Future research should extend to multiple cities and incorporate longer temporal datasets to distinguish short-term anomalies from long-term trends in LST. Such comparative analyses will help verify the generalizability and spatial variability of findings across diverse urban contexts. Lastly, the conclusions presented here represent a preliminary assessment; they can be strengthened by future investigations that integrate multi-year datasets and advanced modeling techniques to more thoroughly evaluate proposed heat mitigation strategies [59,60,61].

5. Conclusions

This study aimed to investigate the seasonal influence of urban spatial morphology on LST across various urban functional zones, employing BRT modeling with Zhengzhou City as the study area. The key findings are as follows:
(1)
Residence zones constitute the largest portion (41%) of Zhengzhou’s urban landscape, followed by green land zones (29%) and industry zones (16%). The results demonstrate that residence zones exhibit substantial seasonal fluctuations in LST, with an average temperature increase of 24.71 °C from spring to summer, reaching a peak of 50.18 °C. This pronounced sensitivity highlights the critical need to optimize urban planning in residence zones to mitigate heatwave risks.
(2)
FVC demonstrates a consistent cooling effect across all functional zones and seasons, with the strongest influence observed during summer. Elevated FVC reduces LST primarily through evapotranspiration and shading, particularly in business and industry zones. Furthermore, landscape indicators generally dominate in most zones and seasons, with their relative contribution exceeding 45% in green land zones. These findings emphasize the critical role of landscape design in future urban planning, especially in densely populated or high-temperature regions.
(3)
PD plays a pivotal role in regulating LST, exerting a pronounced influence especially during the summer season. The impact of PD is context-dependent and seasonally variable, as it can either mitigate or exacerbate temperature fluctuations. Notably, higher population densities are associated with intensified warming effects during summer and autumn. These findings imply that strategic population distribution planning could serve as an effective measure to mitigate extreme temperature events.
(4)
The effects of the LSI and FAI on LST exhibit notable seasonal variability. MBH plays a significant role in temperature regulation, exerting a pronounced cooling effect particularly in residence and business zones. Tall buildings enhance shading and provide thermal insulation, thereby mitigating UHI effects. Additionally, POR is identified as a key factor that substantially increases LST in residence, industry, and business zones.
(5)
This study suggests adopting an integrated urban design approach. The specific strategies are as follows: a. residence zones: prioritize the regulation through building and vegetation coverage; b. industry zones: maintain vegetation coverage and adjust population density; c. business zones: focus on building height to enhance shading effects; d. public service zones: consider the windward facade area index of buildings as a regulatory indicator; and e. green land zones: increase the ratio of perimeter to area to maximize the cooling effect.
These findings provide valuable strategies for urban planners seeking to mitigate the UHI effect in Zhengzhou. By targeting these critical indicators, planners can enhance thermal comfort, promote sustainability, and foster more climate-resilient urban environments. Such an approach is essential for balancing urban growth with the imperative to develop cooler, more livable cities.

Supplementary Materials

The following supporting information can be downloaded at: https://www.mdpi.com/article/10.3390/land14081581/s1, Table S1: Abbreviations, formulas and descriptions of different categories of indicators. Table S2: Multicollinearity Statistics. Table S3: Data of Indicator Factors for the Five Functional Zones. Table S4: The threshold range of indicator impact under different UTFVI levels. (Summer). Table S5: The threshold range of indicator impact under different UTFVI levels. (Spring). Figure S1: Spatial Distribution of LST in Different Functional Zones of Zhengzhou City.

Author Contributions

Conceptualization, J.X., C.L., T.W. and X.W.; methodology, L.X., T.W. and X.W.; formal analysis, J.X., L.X., C.L. and T.W.; data curation, J.X., C.L.; writing—original draft preparation, J.X.; writing—review and editing, L.X., C.L., Y.W. (Yajing Wang), Y.W. (Yutong Wang), and X.W.; visualization, J.X., L.X., C.L. and T.W.; supervision, X.W. and Y.W. (Yong Wang); project administration, X.W.; funding acquisition, X.W. All authors have read and agreed to the published version of the manuscript.

Funding

This study was supported by the Shaanxi Provincial Social Science Foundation Project (No. 2023J041).

Data Availability Statement

Data are available with the corresponding author and can be shared upon reasonable request.

Conflicts of Interest

The authors declare no conflicts of interest.

References

  1. Li, S.; Yang, X.; Cui, P.; Sun, Y.; Song, B. Machine-Learning-Algorithm-Based Prediction of Land Use/Land Cover and Land Surface Temperature Changes to Characterize the Surface Urban Heat Island Phenomena over Harbin, China. Land 2024, 13, 1164. [Google Scholar] [CrossRef]
  2. Ashwini, K.; Sil, B.S.; Kafy, A.A.; Altuwaijri, H.A.; Nath, H.; Rahaman, Z.A. Harnessing Machine Learning Algorithms to Model the Association between Land Use/Land Cover Change and Heatwave Dynamics for Enhanced Environmental Management. Land 2024, 13, 1273. [Google Scholar] [CrossRef]
  3. Fu, P.; Weng, Q. A time series analysis of urbanization-induced land use and land cover change and its impact on land surface temperature with Landsat imagery. Remote Sens. Environ. 2016, 175, 205–214. [Google Scholar] [CrossRef]
  4. Oke, T.R. City size and the urban heat island. Atmos. Environ. 1973, 7, 769–779. [Google Scholar] [CrossRef]
  5. Safarrad, T.; Ghadami, M.; Dittmann, A.; Pazhuhan, M. Tourism Effect on the Spatiotemporal Pattern of Land Surface Temperature (LST): Babolsar and Fereydonkenar Cities (Cases Study in Iran). Land 2021, 10, 945. [Google Scholar] [CrossRef]
  6. Murage, P.; Hajat, S.; Kovats, R.S. Effect of night-time temperatures on cause and age-specific mortality in London. Environ. Epidemiol. 2017, 1, e005. [Google Scholar] [CrossRef] [PubMed]
  7. Cichowicz, R.; Bochenek, A.D. Assessing the effects of urban heat islands and air pollution on human quality of life. Anthropocene 2024, 46, 100433. [Google Scholar] [CrossRef]
  8. Ezimand, K.; Azadbakht, M.; Aghighi, H. Analyzing the effects of 2D and 3D urban structures on LST changes using remotely sensed data. Sustain. Cities Soc. 2021, 74, 103216. [Google Scholar] [CrossRef]
  9. Asghari Saraskanroud, S.; Faramarzi Ouri, B.; Zeinali, B.; Mostafazadeh, R. Estimation of land surface temperature (LST) using single-channel and multi-band methods in Sablan mountainous region. Adv. Space Res. 2024, 74, 2915–2929. [Google Scholar] [CrossRef]
  10. Dong, S.; Cheng, J.; Shi, J.; Shi, C.; Sun, S.; Liu, W. A data fusion method for generating hourly seamless land surface temperature from Himawari-8 AHI data. Remote Sens. 2022, 14, 5170. [Google Scholar] [CrossRef]
  11. Liu, Z.-H.; Weng, S.-S.; Zeng, Z.-L.; Ding, M.-H.; Wang, Y.-Q.; Liang, Z. Hourly land surface temperature retrieval over the Tibetan Plateau using the Geo-LightGBM framework: Fusion of Himawari-8 satellite, ERA5, and site observations. Adv. Clim. Change Res. 2024, 15, 623–635. [Google Scholar] [CrossRef]
  12. Hou, H.; Longyang, Q.; Su, H.; Zeng, R.; Xu, T.; Wang, Z.-H. Prioritizing environmental determinants of urban heat islands: A machine learning study for major cities in China. Int. J. Appl. Earth Obs. Geoinf. 2023, 122, 103411. [Google Scholar] [CrossRef]
  13. Hou, H.; Su, H.; Yao, C.; Wang, Z.-H. Spatiotemporal patterns of the impact of surface roughness and morphology on urban heat island. Sustain. Cities Soc. 2023, 92, 104513. [Google Scholar] [CrossRef]
  14. Huang, X.; Wang, Y. Investigating the effects of 3D urban morphology on the surface urban heat island effect in urban functional zones by using high-resolution remote sensing data: A case study of Wuhan, Central China. ISPRS J. Photogramm. Remote Sens. 2019, 152, 119–131. [Google Scholar] [CrossRef]
  15. Ding, X.; Zhao, Y.; Strebel, D.; Fan, Y.; Ge, J.; Carmeliet, J. A WRF-UCM-SOLWEIG framework for mapping thermal comfort and quantifying urban climate drivers: Advancing spatial and temporal resolutions at city scale. Sustain. Cities Soc. 2024, 112, 105628. [Google Scholar] [CrossRef]
  16. Hu, D.; Meng, Q.; Schlink, U.; Hertel, D.; Liu, W.; Zhao, M.; Guo, F. How do urban morphological blocks shape spatial patterns of land surface temperature over different seasons? A multiindicatorial driving analysis of Beijing, China. Int. J. Appl. Earth Obs. Geoinf. 2022, 106, 102648. [Google Scholar] [CrossRef]
  17. Uuemaa, E.; Mander, Ü.; Marja, R. Trends in the use of landscape spatial metrics as landscape indicators: A review. Ecol. Indic. 2013, 28, 100–106. [Google Scholar] [CrossRef]
  18. Sun, F.; Liu, M.; Wang, Y.; Wang, H.; Che, Y. The effects of 3D architectural patterns on the urban surface temperature at a neighborhood scale: Relative contributions and marginal effects. J. Clean. Prod. 2020, 258, 120706. [Google Scholar] [CrossRef]
  19. Estoque, R.C.; Murayama, Y.; Myint, S.W. Effects of landscape composition and pattern on land surface temperature: An urban heat island study in the megacities of Southeast Asia. Sci. Total Environ. 2017, 577, 349–359. [Google Scholar] [CrossRef]
  20. Cao, Q.; Luan, Q.; Liu, Y.; Wang, R. The effects of 2D and 3D building morphology on urban environments: A multi-scale analysis in the Beijing metropolitan region. Build. Environ. 2021, 192, 107635. [Google Scholar] [CrossRef]
  21. Yuan, B.; Zhou, L.; Dang, X.; Sun, D.; Hu, F.; Mu, H. Separate and combined effects of 3D building features and urban green space on land surface temperature. J. Environ. Manag. 2021, 295, 113116. [Google Scholar] [CrossRef]
  22. Lin, A.; Wu, H.; Luo, W.; Fan, K.; Liu, H. How does urban heat island differ across urban functional zones? Insights from 2D/3D urban morphology using geospatial big data. Urban Clim. 2024, 53, 101787. [Google Scholar] [CrossRef]
  23. Liu, Y.; Zhang, W.; Liu, W.; Tan, Z.; Hu, S.; Ao, Z.; Li, J.; Xing, H. Exploring the seasonal effects of urban morphology on land surface temperature in urban functional zones. Sustain. Cities Soc. 2024, 103, 105268. [Google Scholar] [CrossRef]
  24. Chen, Y.; Yang, J.; Yang, R.; Xiao, X.; Xia, J. Contribution of urban functional zones to the spatial distribution of urban thermal environment. Build. Environ. 2022, 216, 109000. [Google Scholar] [CrossRef]
  25. Lehnert, M.; Pánek, J.; Kopp, J.; Geletič, J.; Květoňová, V.; Jurek, M. Thermal comfort in urban areas on hot summer days and its improvement through participatory mapping: A case study of two Central European cities. Landsc. Urban Plan. 2023, 233, 104713. [Google Scholar] [CrossRef]
  26. Luo, S.; Liu, Y.; Du, M.; Gao, S.; Wang, P.; Liu, X. The influence of spatial grid division on the layout analysis of urban functional areas. ISPRS Int. J. Geo-Inf. 2021, 10, 189. [Google Scholar] [CrossRef]
  27. Mo, Y.; Bao, Y.; Wang, Z.; Wei, W.; Chen, X. Spatial coupling relationship between architectural landscape characteristics and urban heat island in different urban functional zones. Build. Environ. 2024, 257, 111545. [Google Scholar] [CrossRef]
  28. Zhang, Y.; Li, Q.; Huang, H.; Wu, W.; Du, X.; Wang, H. The combined use of remote sensing and social sensing data in fine-grained urban land use mapping: A case study in Beijing, China. Remote Sens. 2017, 9, 865. [Google Scholar] [CrossRef]
  29. Li, H.; Li, Y.; Wang, T.; Wang, Z.; Gao, M.; Shen, H. Quantifying 3D building form effects on urban land surface temperature and modeling seasonal correlation patterns. Build. Environ. 2021, 204, 108132. [Google Scholar] [CrossRef]
  30. Bai, Z.Q.; Wang, J.L.; Yang, F. Research progress in spatialization of population data. Prog. Geogr. 2013, 32, 1692–1702. [Google Scholar] [CrossRef]
  31. Feng, Y.; Zhang, K.; Li, A.; Zhang, Y.; Wang, K.; Guo, N.; Wan, H.Y.; Tan, X.; Dong, N.; Xu, X.; et al. Spatial and seasonal variation and the driving mechanism of the thermal effects of urban park green spaces in Zhengzhou, China. Land 2024, 13, 1474. [Google Scholar] [CrossRef]
  32. Wang, J.; Gao, C.; Wang, M.; Zhang, Y. Identification of urban functional areas and urban spatial structure analysis by fusing multi-source data features: A case study of Zhengzhou, China. Sustainability 2023, 15, 6505. [Google Scholar] [CrossRef]
  33. Chen, Y.; Xu, C.; Ge, Y.; Zhang, X.; Zhou, Y. A 100 m gridded population dataset of China’s seventh census using ensemble learning and big geospatial data. Earth Syst. Sci. Data 2024, 16, 3705–3718. [Google Scholar] [CrossRef]
  34. Tolan, J.; Yang, H.-I.; Nosarzewski, B.; Couairon, G.; Vo, H.V.; Brandt, J.; Spore, J.; Majumdar, S.; Haziza, D.; Vamaraju, J.; et al. Very high resolution canopy height maps from RGB imagery using self-supervised vision transformer and convolutional decoder trained on aerial lidar. Remote Sens. Environ. 2024, 300, 113888. [Google Scholar] [CrossRef]
  35. Yang, C.; Zhu, W.; Sun, J.; Xu, X.; Wang, R.; Lu, Y.; Zhang, S.; Zhou, W. Assessing the effects of 2D/3D urban morphology on the 3D urban thermal environment by using multi-source remote sensing data and UAV measurements: A case study of the snow-climate city of Changchun, China. J. Clean. Prod. 2021, 321, 128956. [Google Scholar] [CrossRef]
  36. Yang, L.; Yang, X.; Zhang, H.; Ma, J.; Zhu, H.; Huang, X. Urban morphological regionalization based on 3D building blocks—A case in the central area of Chengdu, China. Comput. Environ. Urban Syst. 2022, 94, 101800. [Google Scholar] [CrossRef]
  37. Guo, F.; Schlink, U.; Wu, W.; Hu, D.; Sun, J. A new framework quantifying the effect of morphological features on urban temperatures. Sustain. Cities Soc. 2023, 99, 104923. [Google Scholar] [CrossRef]
  38. Tang, L.; Zhan, Q.; Fan, Y.; Liu, H.; Fan, Z. Exploring the impacts of greenspace spatial patterns on land surface temperature across different urban functional zones: A case study in Wuhan metropolitan area, China. Ecol. Indic. 2023, 146, 109787. [Google Scholar] [CrossRef]
  39. Mao, K.; Qin, Z.; Shi, J.; Gong, P. The research of split-window algorithm on the MODIS. Geomat. Inf. Sci. Wuhan Univ. 2005, 30, 703–707. [Google Scholar]
  40. Deng, H.; Zhang, S.; Chen, M.; Feng, J.; Liu, K. Sensitivity of local climate zones and urban functional zones to multi-scenario surface urban heat islands. Remote Sens. 2024, 16, 3048. [Google Scholar] [CrossRef]
  41. Dash, P.; Göttsche, F.M.; Olesen, F.S.; Fischer, H. Land surface temperature and emissivity estimation from passive sensor data: Theory and practice—Current trends. Int. J. Remote Sens. 2010, 23, 2563–2594. [Google Scholar] [CrossRef]
  42. Qi, L.; Hu, Y.; Bu, R.; Li, B.; Gao, Y.; Li, C. Evaluation of the Thermal Environment Based on the Urban Neighborhood Heat/Cool Island Effect. Land 2024, 13, 933. [Google Scholar] [CrossRef]
  43. Yao, X.; Zhu, Z.; Zhou, X.; Shen, Y.; Shen, X.; Xu, Z. Investigating the effects of urban morphological indicators on seasonal land surface temperature in a “Furnace city” from a block perspective. Sustain. Cities Soc. 2022, 86, 104165. [Google Scholar] [CrossRef]
  44. Zhao, K.; Ning, Z.; Xu, C.; Zhao, X.; Huang, X. How do driving indicators affect the diurnal variation of land surface temperature across different urban functional blocks? A case study of Xi’an, China. Sustain. Cities Soc. 2024, 114, 105738. [Google Scholar] [CrossRef]
  45. Liu, B.; Deng, Y.; Li, X.; Li, M.; Jing, W.; Yang, J.; Chen, Z.; Liu, T. Sub-Block Urban Function Recognition with the Integration of Multi-Source Data. Sensors 2022, 22, 7862. [Google Scholar] [CrossRef] [PubMed]
  46. Li, X.; Deng, Y.; Liu, B.; Yang, J.; Li, M.; Jing, W.; Chen, Z. GDP spatial differentiation in the perspective of urban functional zones. Cities 2024, 151, 105126. [Google Scholar] [CrossRef]
  47. Gong, P.; Chen, B.; Li, X.; Liu, H.; Wang, J.; Bai, Y.; Chen, J.; Chen, X.; Fang, L.; Feng, S.; et al. Mapping essential urban land use categories in China (EULUC-China): Preliminary results for 2018. Sci. Bull. 2020, 65, 182–187. [Google Scholar] [CrossRef]
  48. Moisa, M.B.; Gemeda, D.O. Assessment of urban thermal field variance index and thermal comfort level of Addis Ababa metropolitan city, Ethiopia. Heliyon 2022, 8, e10185. [Google Scholar] [CrossRef] [PubMed]
  49. Alavipanah, S.; Schreyer, J.; Haase, D.; Lakes, T.; Qureshi, S. The effect of multi-dimensional indicators on urban thermal conditions. J. Clean. Prod. 2018, 177, 115–123. [Google Scholar] [CrossRef]
  50. Han, D.; An, H.; Wang, F.; Xu, X.; Qiao, Z.; Wang, M.; Sui, X.; Liang, S.; Hou, X.; Cai, H.; et al. Understanding seasonal contributions of urban morphology to thermal environment based on boosted regression tree approach. Build. Environ. 2022, 226, 109770. [Google Scholar] [CrossRef]
  51. Cao, W.; Zhou, W.; Yu, W.; Wu, T. Combined effects of urban forests on land surface temperature and PM2.5 pollution in the winter and summer. Sustain. Cities Soc. 2024, 104, 105309. [Google Scholar] [CrossRef]
  52. Bai, Y.; Wang, K.; Ren, Y.; Li, M.; Ji, R.; Wu, X.; Yan, H.; Lin, T.; Zhang, G.; Zhou, X.; et al. 3D compact form as the key role in the cooling effect of greenspace landscape pattern. Ecol. Indic. 2024, 160, 111776. [Google Scholar] [CrossRef]
  53. Chinchilla, J.; Carbonnel, A.; Galleguillos, M. Effect of urban tree diversity and condition on surface temperature at the city block scale. Urban For. Urban Green. 2021, 60, 127069. [Google Scholar] [CrossRef]
  54. Yan, Z.; Wu, T.; Xuan, L.; Li, W.; Wang, X.; Dong, L.; Yu, K.; Wang, Y. The Scale-Dependent Differences in Cooling Efficiency of UGS in Different Functional Areas: A Case Study of Xi’an, China. Forests 2024, 15, 1946. [Google Scholar] [CrossRef]
  55. Zheng, Z.; Zhou, W.; Yan, J.; Qian, Y.; Wang, J.; Li, W. The higher, the cooler? Effects of building height on land surface temperatures in residential areas of Beijing. Phys. Chem. Earth 2019, 110, 149–156. [Google Scholar] [CrossRef]
  56. Zhao, Y.; Sen, S.; Susca, T.; Iaria, J.; Kubilay, A.; Gunawardena, K.; Zhou, X.; Takane, Y.; Park, Y.; Wang, X.; et al. Beating urban heat: Multimeasure-centric solution sets and a complementary framework for decision-making. Renew. Sustain. Energy Rev. 2023, 186, 113668. [Google Scholar] [CrossRef]
  57. Li, W.; Wu, T.; Xuan, L.; Zhu, K.; Yu, L.; Wang, Y.; Wang, X.; Yu, K. Quantifying and Mapping the Cooling Effect and Equity of Urban Parks during Extreme Heat Events in Coastal Cities. Land 2024, 13, 1607. [Google Scholar] [CrossRef]
  58. Wu, T.; Wang, X.; Xuan, L.; Yan, Z.; Wang, C.; Du, C.; Su, Y.; Duan, J.; Yu, K. How to Plan Urban Parks and the Surrounding Buildings to Maximize the Cooling Effect: A Case Study in Xi’an, China. Land 2024, 13, 1117. [Google Scholar] [CrossRef]
  59. Zhou, T.; Jia, W.; Yan, L.; Hong, B.; Wang, K. Urban park’s vertical canopy structure and its varied cooling effect under continuous warming climate. Urban Clim. 2024, 53, 101819. [Google Scholar] [CrossRef]
  60. Liu, A.; Ma, X.; Du, M.; Su, M.; Hong, B. The cooling intensity of green infrastructure in local climate zones: A comparative study in China’s cold region. Urban Clim. 2023, 51, 101631. [Google Scholar] [CrossRef]
  61. Yang, B.; Hong, B. Pocket park in urban regeneration of China: Policy and perspective. City Environ. Interact. 2023, 19, 100109. [Google Scholar] [CrossRef]
Figure 1. Study area.
Land 14 01581 g001
Figure 2. Research framework.
Land 14 01581 g002
Figure 3. Schematic diagram of OSM’s process for delineating boundaries of urban functional zones. (a) Preliminary intersection partitioning. (b) Merge road vector data and extract center lines. (c) Block refinement tweaked to remove invalid blocks.
Land 14 01581 g003
Figure 4. Distribution and proportion of urban functional zones.
Land 14 01581 g004
Figure 5. Spatial distribution map of indicators in each functional area of Zhengzhou City.
Land 14 01581 g005
Figure 6. Spatial distribution map of LST in each functional area of Zhengzhou City.
Land 14 01581 g006
Figure 7. Spearman correlation analysis of morphological indicators of functional zones and LST under different seasons.
Land 14 01581 g007
Figure 8. Spatial distribution of five types of cooling capacity bundles.
Land 14 01581 g008
Figure 9. Partial dependence plot of key metrics on LST in the spring UFZ.
Land 14 01581 g009
Figure 10. Partial dependence plot of key metrics on LST in the summer UFZ.
Land 14 01581 g010
Figure 11. Partial dependence plot of key metrics on LST in the autumn UFZ.
Land 14 01581 g011
Figure 12. Partial dependence plot of key metrics on LST in the winter UFZ.
Land 14 01581 g012
Figure 13. Thermal comfort thresholds for LST by key indicators in summer.
Land 14 01581 g013
Figure 14. Thermal comfort thresholds for LST by key indicators in spring.
Land 14 01581 g014
Figure 15. Enhancement strategies for different functional zones.
Land 14 01581 g015
Table 1. Data source and description.
Data TypeResolutionResolutionTimeCloud CoverData Sources
Imaging dataLandsat 8 OLI_TIRS 30 m12 March 2023
(Spring)
0.06%United States Geological Survey (USGS)
(https://earthexplorer.usgs.gov/ (accessed on 11 March 2024))
18 June 2023 (Summer)0.23%
14 October 2023
(Autumn)
0.14%
25 December 2023
(Winter)
4.49%
POI data//2023/Gao De Map
(https://www.amap.com/ (accessed on 13 March 2024))
Road network data//2023/OpenStreetMap
(https://www.openstreetmap.org (accessed on 13 March 2024))
Building vector data//2023/Baidu’s online map (https://map.baidu.com (accessed on 13 March 2024))
Population density/200 m2020/(https://figshare.com/s/d9dd5f9bb1a7f4fd3734 (accessed on 10 March 2024)) [33]
Global 1 m tree height/1 m2020/(https://registry.opendata.aws/dataforgood-fb-forests (accessed on 13 March 2024)) [34]
Global lake boundary vector data//2023/OpenStreetMap (https://www.openstreetmap.org (accessed on 10 March 2024))
Wind dataWind speedWind Time/https://www.wunderground.com/ (accessed on 10 March 2024)
N7 mphSpring
(12 March 2023)
/
NNE7 mphSummer
(18 June 2023)
/
NW11 mphAutumn
(14 October 2023)
/
W4 mphWinter
(25 December 2023)
/
Table 2. Description of the UFZs.
CategoriesDescription
Residence ZonesResidential communities, apartments
Industry ZonesCorporations
Business ZonesCatering services, shopping services, domestic services, financial insurance services
Public Service ZonesPublic utilities, sports and leisure services, healthcare services, science, education and cultural services, government agencies and social organizations
Green Land ZonesParks and squares, and places of interest
Table 3. Classification of different UTFVI levels.
UTFVILSTUHI PhenomenonEcological Evaluation Index
<0<TmeanNoneExcellent
0–0.005Tmean − 0.005 × Tmean + TmeanWeakGood
0.005–0.010.005 × Tmean + Tmean − 0.01 × Tmean + TmeanMiddleNormal
0.01–0.0150.01 × Tmean + Tmean − 0.015 × Tmean + TmeanStrongBad
0.015–0.020.015 × Tmean + Tmean − 0.02 × Tmean + TmeanStrongerWorse
>0.02>0.02 × Tmean + TmeanStrongestWorst
Table 4. LST in different functional zones in different seasons.
Function Type15 March 2023 (Spring)8 June 2023 (Summer)14 October 2014 (Autumn)25 December 2023 (Winter)
Ave.Min.Max.Ave.Min.Max.Ave.Min.Max.Ave.Min.Max.
Residence Zones18.76 °C14.49 °C23.24 °C43.47 °C35.30 °C50.18 °C26.65 °C23.69 °C31.71 °C4.26 °C0.57 °C7.98 °C
Industry Zones20.72 °C15.69 °C22.97 °C44.41 °C35.47 °C50.78 °C27.87 °C23.54 °C31.74 °C5.36 °C0.83 °C8.02 °C
Business Zones19.40 °C13.29 °C25.75 °C44.28 °C37.28 °C54.52 °C27.37 °C22.84 °C35.72 °C4.47 °C−0.5 °C11.59 °C
Public Service Zones19.79 °C16.19 °C23.25 °C44.12 °C39.48 °C50.62 °C27.41 °C24.78 °C31.34 °C4.86 °C1.25 °C7.72 °C
Green Land Zones20.09 °C11.44 °C25.88 °C41.53 °C25.97 °C51.87 °C26.65 °C20.76 °C33.44 °C4.97 °C1.12 °C10.66 °C
Table 5. LST ranges corresponding to different UTFVI levels in spring and summer.
UTFVI
(Summer)
Residence Zones
(TEM)
Industry Zones
(TEM)
Business Zones
(TEM)
Public Service Zones
(TEM)
Green Land Zones
(TEM)
<0 (excellent)<43.47<44.41<44.28<44.12<41.53
0–0.005 (good)43.47–43.6944.41–44.6344.28–44.544.12–44.3441.53–41.74
0.005–0.01 (normal)43.69–43.9144.63–44.8544.5–44.7244.34–44.5641.74–41.95
0.01–0.015 (bad)43.91–44.1344.85–45.0744.72–44.9444.56–44.7841.95–42.16
0.015–0.02 (worse)44.13–44.3545.07–45.2944.94–45.1644.78–4542.16–42.37
>0.02 (worst)>44.35>45.29>45.16>45>42.37
UTFVI
(Spring)
Residence Zones
(TEM/QTY)
Industry Zones
(TEM/QTY)
Business Zones
(TEM/QTY)
Public Service Zones
(TEM/QTY)
Green Land Zones
(TEM/QTY)
<0 (excellent)<18.76<20.72<19.4<19.8<20.09
0–0.005 (good)18.76–18.8520.72–20.8219.4–19.519.8–19.920.09–20.19
0.005–0.01 (normal)18.85–18.9420.82–20.9219.5–19.619.9–20.020.19–20.29
0.01–0.015 (bad)18.94–19.0320.92–21.0219.6–19.720.0–20.120.29–20.39
0.015–0.02 (worse)19.03–19.1221.02–21.1219.7–19.820.1–20.220.39–20.49
>0.02 (worst)>19.12>21.12>19.8>20.2>20.49
Disclaimer/Publisher’s Note: The statements, opinions and data contained in all publications are solely those of the individual author(s) and contributor(s) and not of MDPI and/or the editor(s). MDPI and/or the editor(s) disclaim responsibility for any injury to people or property resulting from any ideas, methods, instructions or products referred to in the content.

