Article

Measurement, Differences, and Driving Factors of Land Use Environmental Efficiency in the Context of Energy Utilization

1
School of Internet of Things, Nanjing University of Posts and Telecommunications, Nanjing 210023, China
2
College of Economics and Management, Nanjing Forestry University, Nanjing 210037, China
3
Business School, Hohai University, Nanjing 211100, China
4
Business School, Nanjing University, Nanjing 210093, China
*
Authors to whom correspondence should be addressed.
These authors contributed equally to this work.
Land 2025, 14(8), 1573; https://doi.org/10.3390/land14081573
Submission received: 26 June 2025 / Revised: 22 July 2025 / Accepted: 29 July 2025 / Published: 31 July 2025

Abstract

Land urbanization enables a thorough perspective to explore the decoupling of land use environmental efficiency (LUEE) and energy use, thereby supporting the shift into low-carbon land use by emphasizing energy conservation and reducing carbon emissions. This paper first calculates LUEE from 2011 to 2021 by using the EBM-DEA model in China. The geographical detector model is used to examine the driving factors of land use environmental efficiency. The results show the following: (1) China’s LUEE is high in general but shows a clear pattern of spatial differentiation internally, with the highest values in the eastern region represented by Beijing, Jiangsu, and Zhejiang, while the central and western regions show lower LUEE because of their irrational industrial structure and lagging green development. (2) Energy consumption, economic development, industrial upgrading, population size, and urban expansion are the driving factors. Their explanatory power for the spatial stratification heterogeneity of land use environmental impacts varies. (3) Urban expansion has the greatest impact on the spatial differentiation of land use environmental effects, while energy consumption also shows significant explanatory strength. In contrast, economic development and population size exhibit relatively weaker explanatory effects. (4) The interaction of the two driving factors has a greater impact on LUEE than their individual effects, and the interaction is a two-factor enhancement. Finally, we make targeted recommendations to help improve land use environmental efficiency.

1. Introduction

Since the beginning of the industrial revolution, additional energy consumption has become one of the most important global concerns. Population urbanization and the expansion of built-up areas have led to a higher need for energy and land for constructing new infrastructure. This expansion has the potential to use fossil energy, accounting for approximately 40–60% of the existing carbon budget. It is generally recognized that human activities operate in accordance with land use practices; thus, environmental conditions and land use activities are deeply interrelated [1]. In light of the climate change challenge, it is imperative to decouple carbon-intensive energy consumption from land use environmental efficiency (LUEE).
Due to de-industrialization and energy efficiency advancement, the economic advancement of developing countries is firstly more dependent on energy consumption and industrial advancement than developed countries. The challenge of decoupling, where there is a lack of a link between the enhancement of environmental efficiency with the consumption of energy, is particularly noticeable in China. China, as the greatest developing economy globally, has had a consistent increase in its overall energy consumption throughout the years, surpassing all other countries [2]. The consumption has grown from 571 million tons of standard coal in 1978 to 5.72 billion in 2023. The research region is delineated in the overview map, as represented in Figure 1, and is divided into east, central, and west according to the level of economic growth. Based on the Global Environmental Performance Index (EPI) Report 2020, the environmental pollution caused by energy use has become a dominant factor restricting the sustainable advancement of China’s economy.
Industrial land is frequently used for the manufacturing of carbon-intensive products, thus increasing China’s energy use intensity and posing inevitable hazards to the ecological environment. In response to immense pressure to reduce energy consumption, China has announced an enhanced regulation on carbon reduction. China’s Nationally Owned Contribution Plan aims to reduce carbon emissions per unit of gross domestic product (GDP) by 60–65% compared to 2005 and raise the proportion of non-fossil energy in principal energy consumption to 20%, indicating China’s great ambition in improving environmental efficiency [3]. Nonetheless, the “lock-in” impact of the long-standing development model of land expansion and energy use for industrial development renders it challenging to transition to a green mode in the future. Accordingly, improving the environmental efficiency of land use or decoupling energy consumption from land use eco-efficiency is a necessary choice to achieve green economic growth. Given the research demand mentioned above, this study aims to evaluate the following three inquiries: What are the distinguishing features and spatial–temporal patterns of LUEE in China? What are the decomposition factors affecting LUEE, and what are the differences in the contribution of these factors to LUEE? What exactly is the relationship of decoupling between energy use, economic growth, and LUEE? At the end, this research will offer significant recommendations for optimizing the energy system, formulating environmental policies, and achieving green and sustainable development objectives in China and other emerging nations.

2. Literature Review

2.1. Land Use Environmental Efficiency Measurement

As the recognition of sustainable development develops, researchers are increasingly exploring the relationship between land use environmental efficiency and economic advancement in the context of energy use [4]. The concept of LUEE is core for land use management and sustainable advancement.
In terms of methodology, DEA can handle multiple input and output variables, does not require the pre-estimation of parameters and is able to calculate data directly, and thus it has been extensively utilized in the domain of carbon emission management, including CCR-DEA and BCC-DEA models. However, radial DEA models do not consider the impact of non-radial relaxation, which might result in an overestimation of the efficiency value of DMUs and introduce measurement bias [5]. The second strategy identifies carbon dioxide emissions as undesirable outputs and relies mainly on non-radial DEA models with unacceptable outcomes.
On this basis, some studies consider carbon emissions as undesirable outputs [6], which makes the results of the model considering undesirable output variables more accurate and reliable. However, since all the above models assume that each decision-making unit has the same production boundary, the results of the model considering undesirable output variables are more accurate and reliable. However, since all the above approaches consider that each DMU has the same production boundary, which is obviously inconsistent with the actual situation, this traditional DEA model cannot reflect the technological differences and growth patterns well [7]. Later, some studies found that network DEA models after adding slack variables can not only effectively analyze the efficiency of individual sectors but also uncover the correlations between individual sectors and their growth patterns [8]. Therefore, some scholars proposed a weighted SBM dynamic network DEA model for calculating multi-stage efficiency values. Wang et al. (2022) use a slack-based measure (SBM) that includes carbon emissions as an undesirable output to explore the efficiency of building land use in China and the United States [9]. Yang et al. (2023) also use the SBM-undesirable model when assessing urban land use efficiency in the Yangtze River Economic Belt [10]. Jiang et al. (2022) [11] and Li et al. (2019) [12] assessed the environmental efficiency of China’s transport system by employing the EBM-DEA model, which incorporates unfavorable outputs. The adverse output variable used in this study was particularly CO2 emissions. Wei and Zhang (2017) [13] conducted a study to evaluate the environmental efficiency of the land transport industry in China. Research indicates that the most commonly used approach for analyzing LUEE is through the application of non-radial EBM-DEA models that consider undesirable outputs.

2.2. Factors Affecting Land Use Environmental Efficiency

The factors influencing the environmental benefits of land use are a critical topic in current environmental science and sustainable development research. Existing studies indicate that economic development levels, industrial restructuring, population density and urbanization processes, technological advancements, and energy structure all significantly affect the environmental benefits derived from land use. For instance, economic growth at certain stages often coincides with intensive resource exploitation and increased energy consumption, leading to land degradation and heightened environmental burdens [14]. In contrast, industrial structure optimization can enhance land use efficiency and reduce pollution loads per unit area [15]. Changes in population density and urbanization levels not only influence land use patterns but also indirectly determine the carbon sequestration capacity and pollution loads of land [16,17]. While reducing carbon emissions, pilot policies also have a negative impact on urban land use efficiency [18].
Technological progress is a key variable. By incorporating economic growth, industrial structure, employment levels, and technological advancement into decomposition models, researchers have found that the peaking and subsequent decline of carbon emissions are driven by technological progress [19]. However, due to economic development demands, technological advancements may also negatively impact the environment through increased carbon-intensive economic production [20].
Additionally, shifts in energy structure, particularly the increased share of clean energy, have long-term positive effects on improving the environmental benefits of land use. Studies have found that reducing energy consumption can effectively mitigate mercury pollution and its impacts [21]. Assessments of the influence of energy intensity on environmental quality in the Beijing–Tianjin–Hebei region reveal that the growth in carbon emissions from 2005 to 2015 was primarily attributed to changes in energy intensity [22].
In summary, the improvement of environmental benefits from land use results from the combined effects of multiple factors, and changes in any single variable may influence the stability of regional ecosystems and the capacity for sustainable resource utilization through complex mechanisms. Therefore, systematically identifying and coordinating these influencing factors is a crucial prerequisite for achieving sustainable land use and synergistic environmental protection.

2.3. Application of Geographic Detector

As a statistical tool for identifying spatial heterogeneity and revealing the driving mechanisms of factors, the Geodetector has been widely applied in the field of land use and environmental efficiency research in recent years. Based on the data of Fujian Province, the InVEST model and Geodetector were combined to analyze water conservation and soil retention, revealing the explanatory power of multiple environmental gradients on ecological services and land efficiency, highlighting the advantages of the Geodetector in identifying driving factors and their interactions [23]. In the study of the Liangzi Lake Basin, the Geodetector was used to identify the impact of urban and rural construction on ecosystem service value (ESV), and the results showed that human activity intensity and the NDVI were the main driving forces. This method provided empirical evidence for land resource allocation and ecological restoration [24]. Based on the data of arid and desert urban agglomerations, scholars used the Geodetector to analyze the driving mechanism of land use pattern changes, providing decision support for the optimization of land environmental efficiency [25]. In the analysis of vegetation changes in the Qinba Mountain Area, researchers used the Geodetector to quantitatively identify the contribution of natural factors such as topography and climate to ecological efficiency, providing a solid theoretical basis for environmental efficiency assessment [26]. The Geodetector was also used to identify the driving factors of the spatial distribution of heavy metals in the soil of the upper reaches of the Yangtze River, and combined with the analysis of interaction effects, it revealed the impact of the combined action of natural factors and agricultural activities on pollution loads, providing a pollution control direction for land environmental efficiency intervention [27]. In the ecological environment quality assessment of regions such as Myanmar, the Geodetector was combined with the RSEI model and spatial causal mapping to successfully identify multiple driving paths of land use, vegetation, and human footprint on environmental quality, providing a method reference for cross-regional land environmental efficiency evaluation [28].
The research structure of the paper is illustrated in Figure 2, and the main innovations are reflected in (1) the inclusion of land elements in the indicator system of environmental efficiency to feedback the environmental effects of land urbanization process; (2) analyzing the influencing factors of LUEE in China from a macro perspective by taking the energy use perspective as an entry point; and (3) decoupling the analysis of LUEE in terms of energy use in order to propose differentiated land use and environmental protection strategies so as to enhance the resilience of the social–land–ecological system.

3. Data Source and Research Method

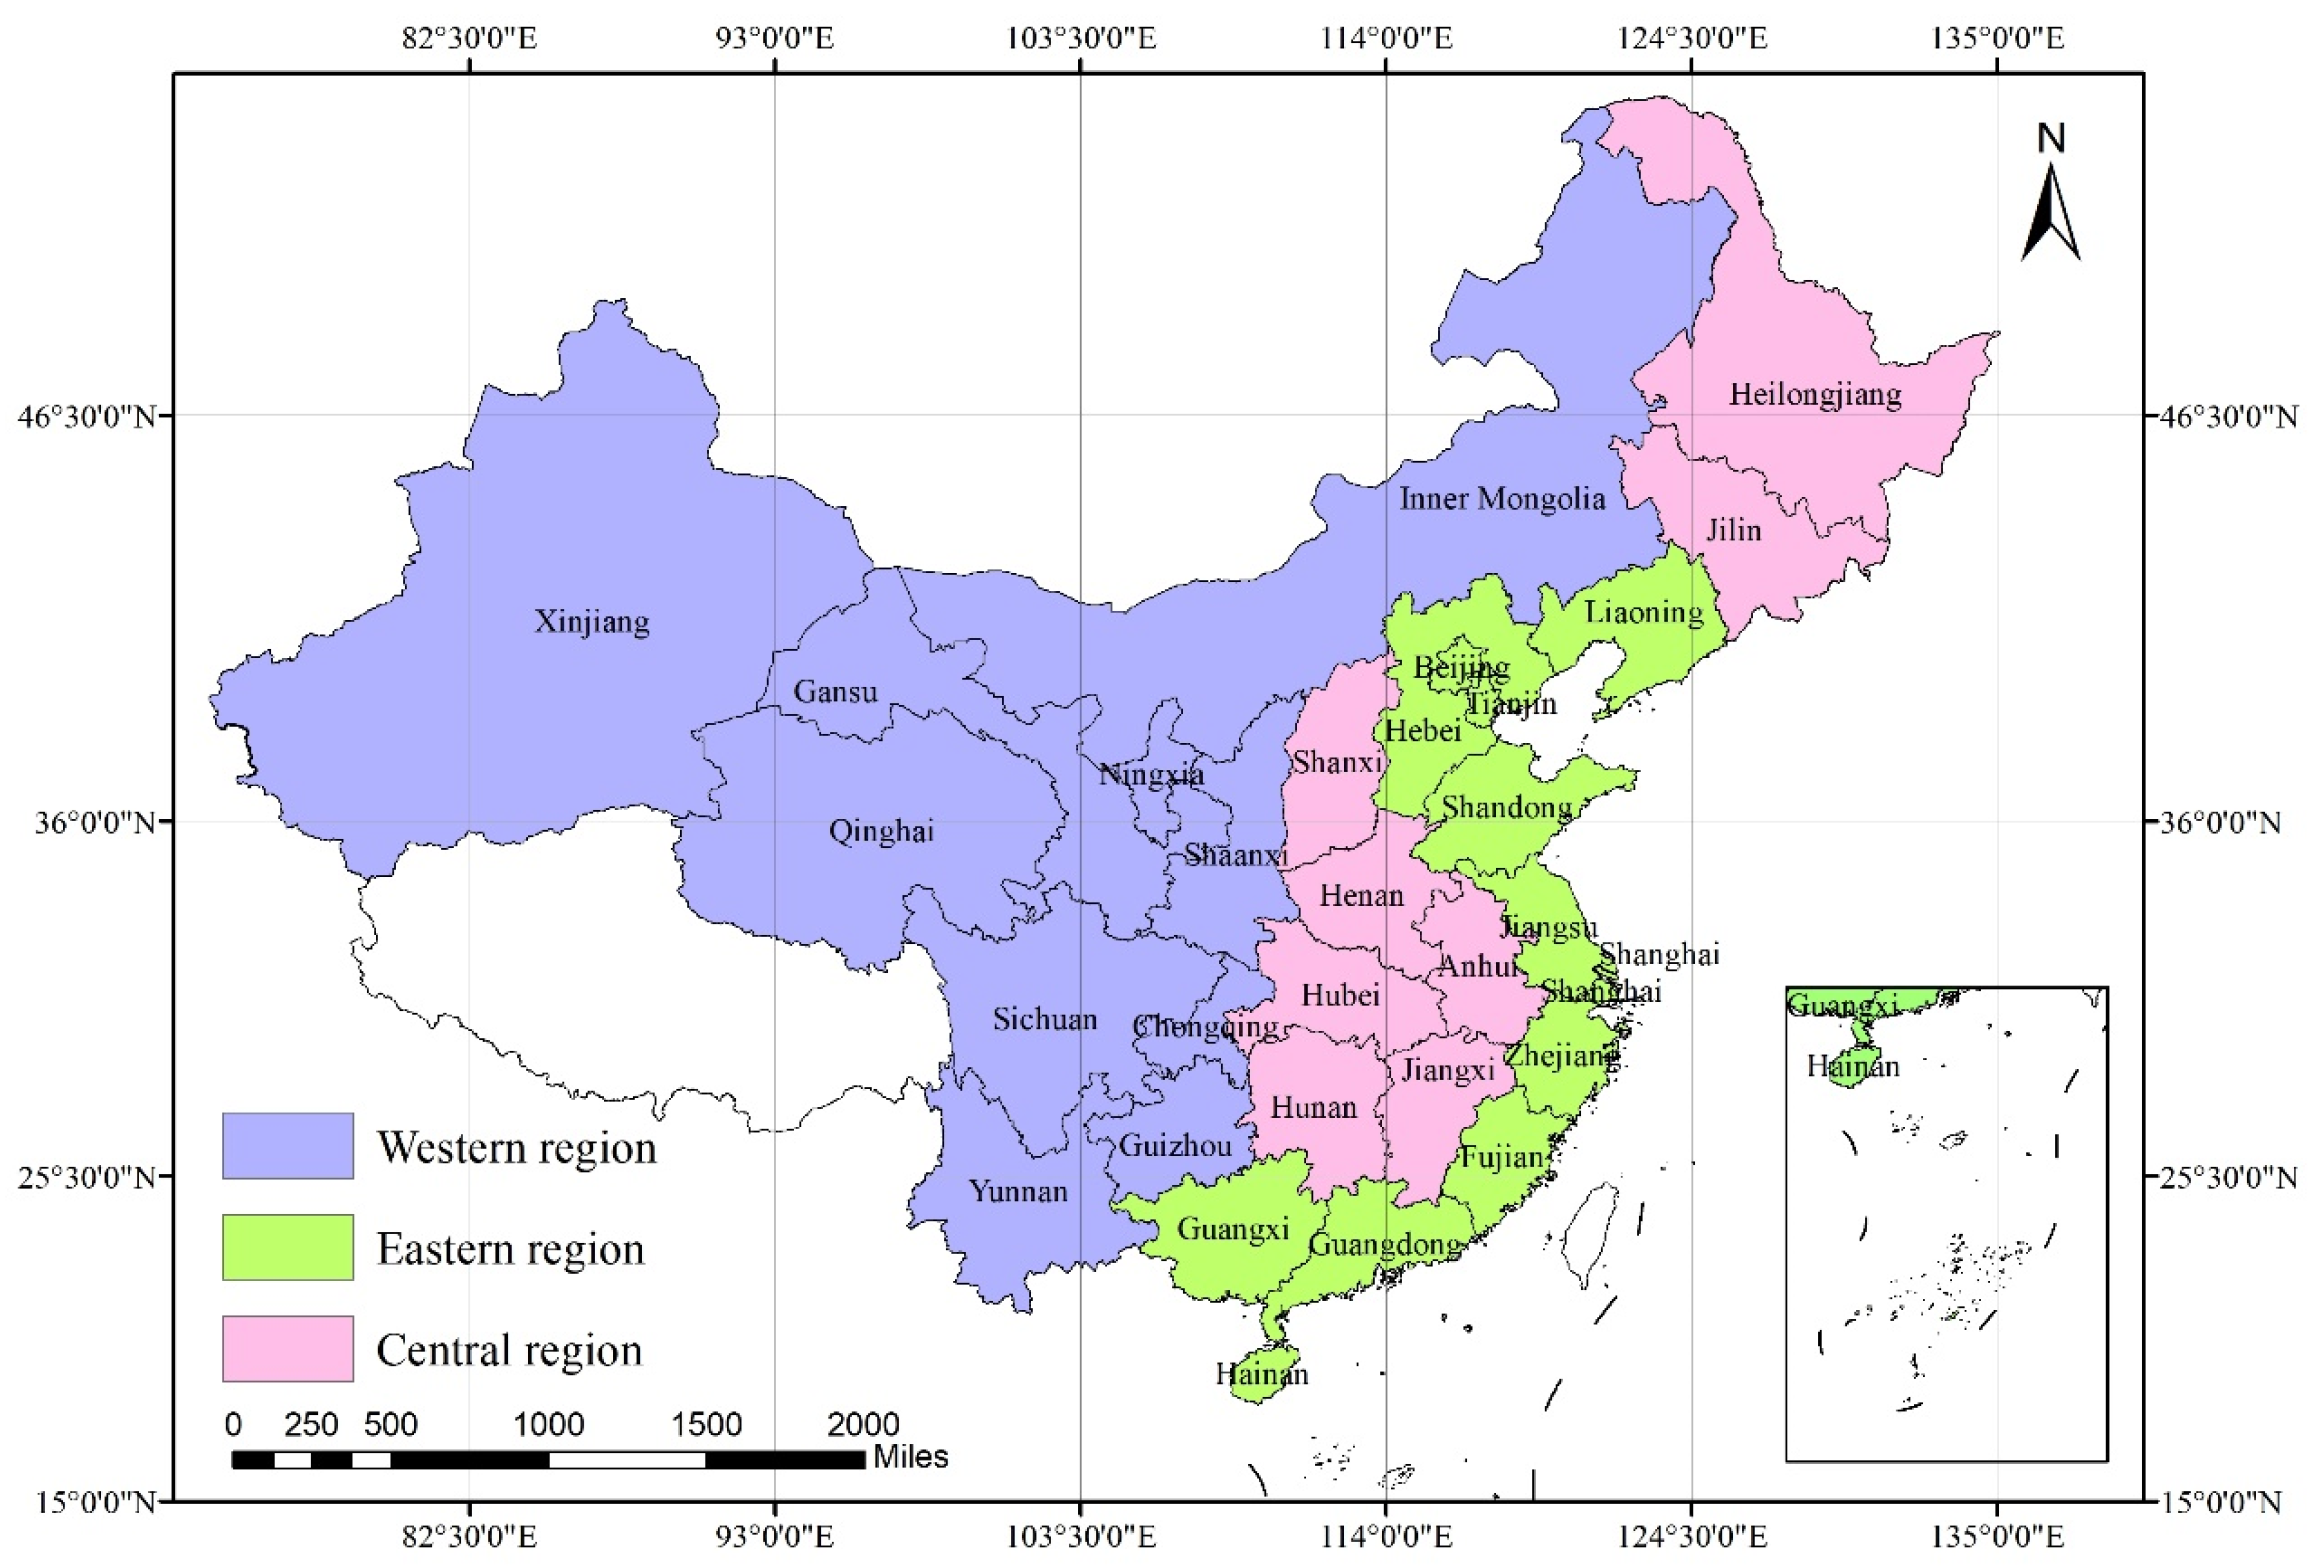
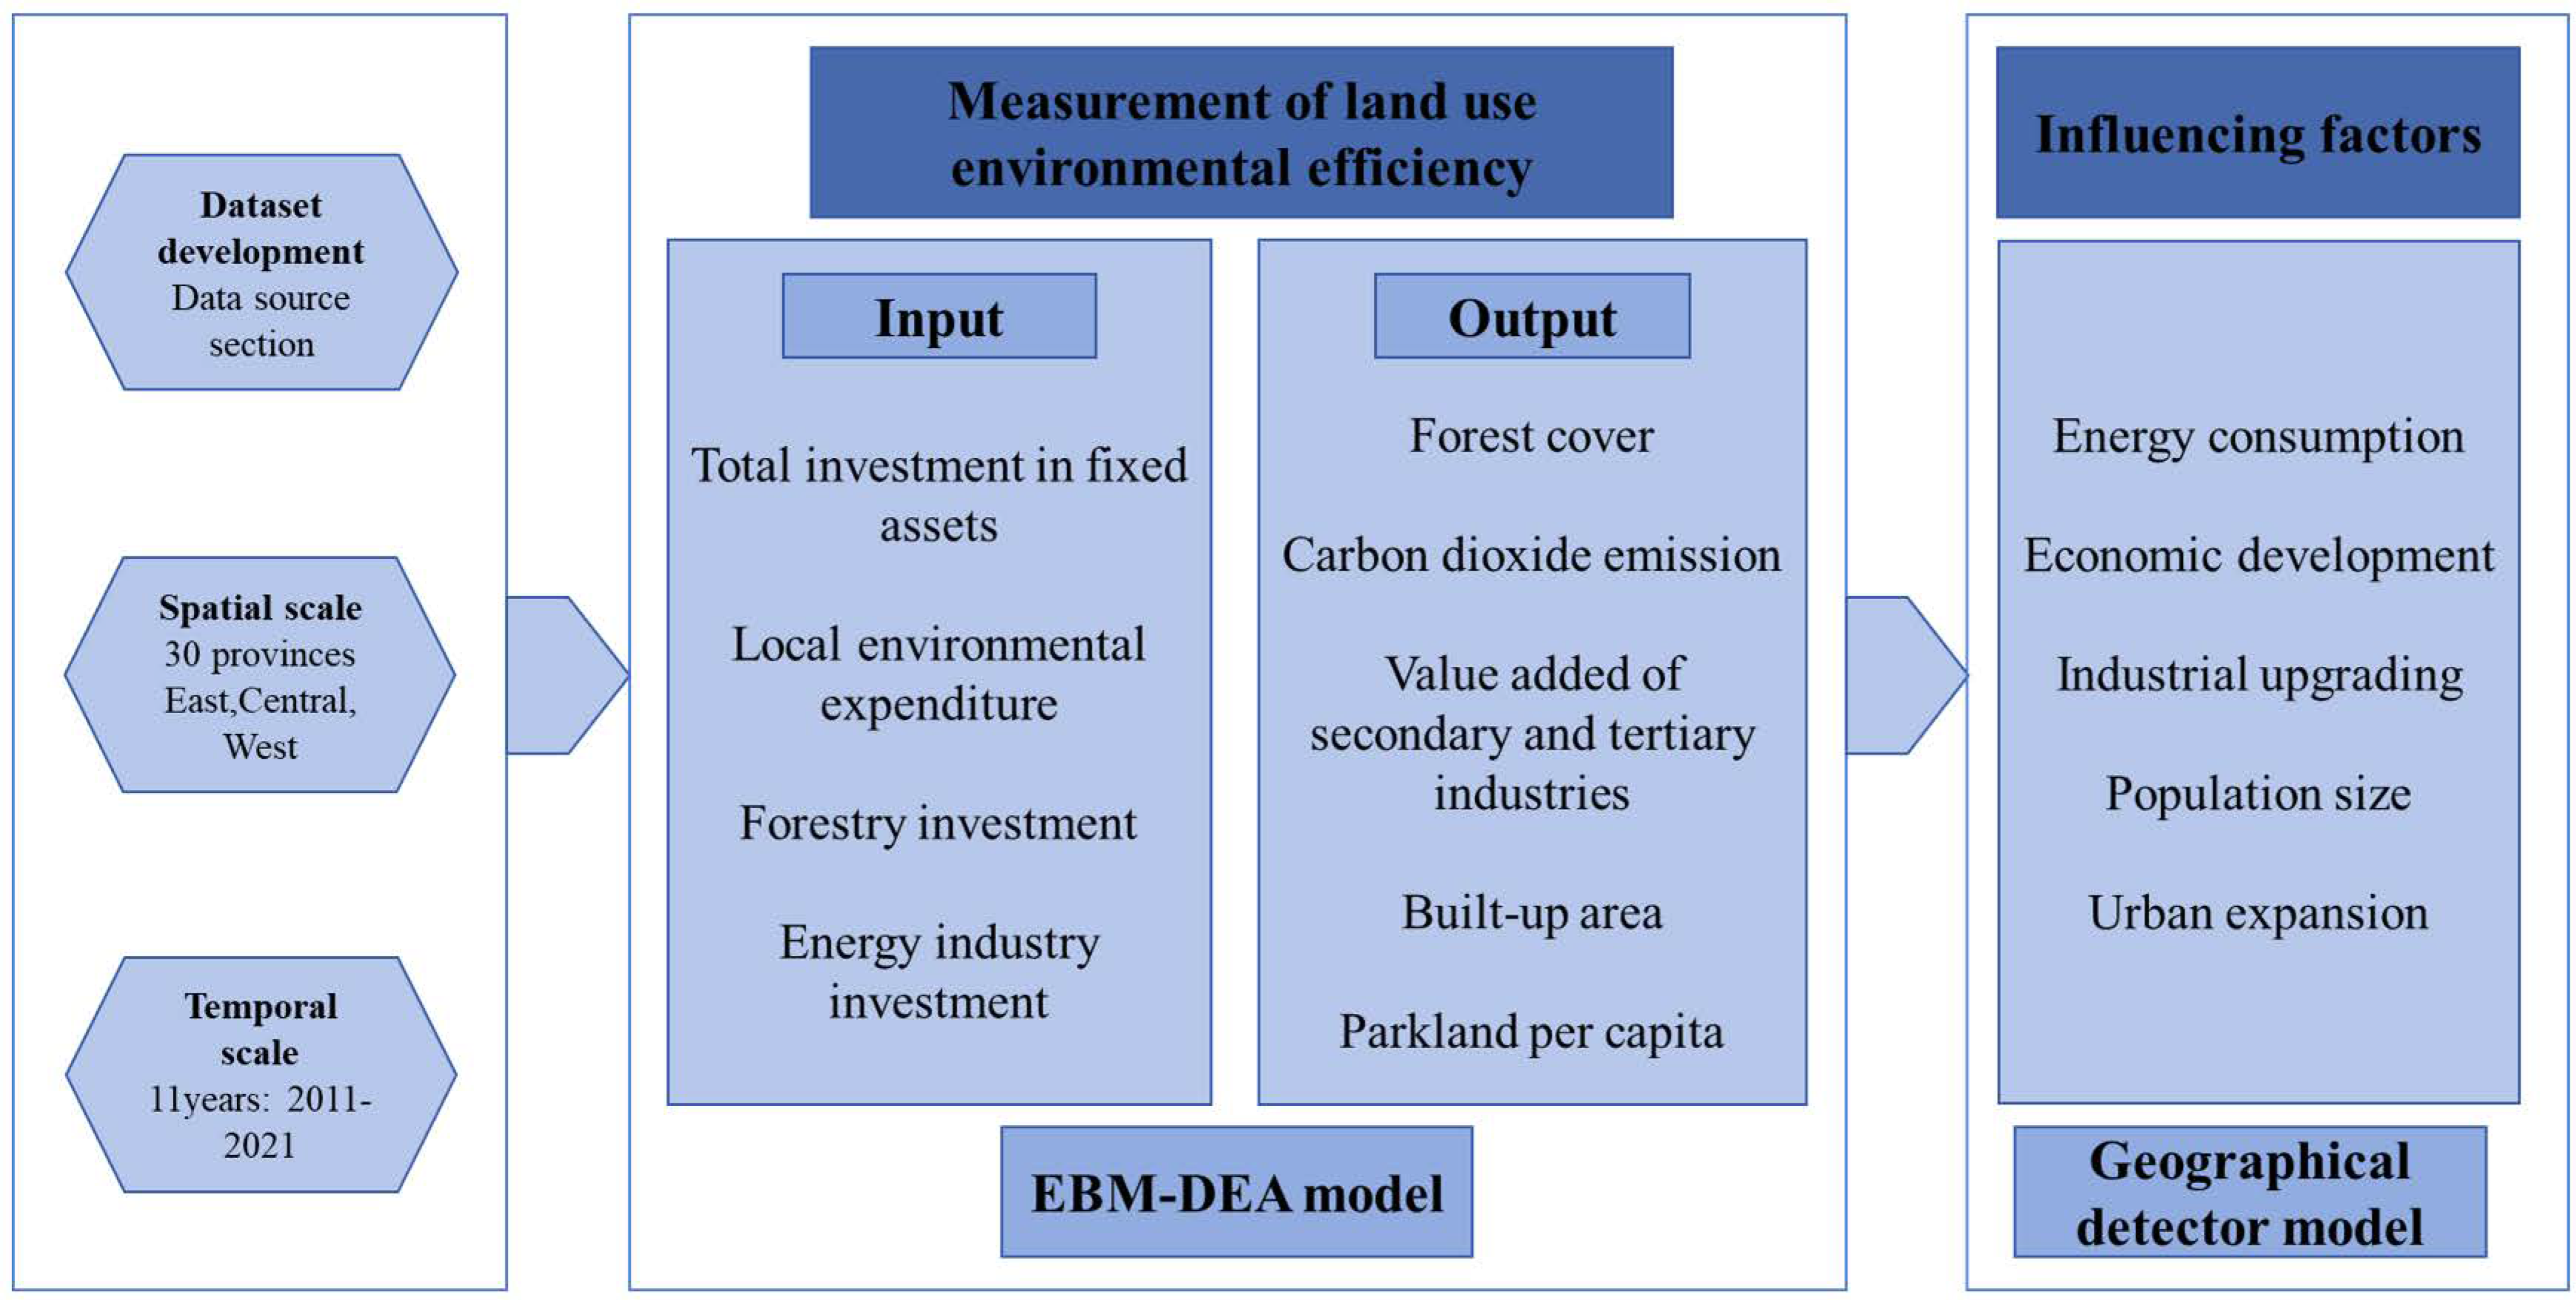
3.1. Data Resource and Indicator System Construction

For computation and analysis, this paper is based on a data sample from 2011 to 2021 in China. It is important to note that data for Tibet were excluded from the analysis due to limited availability and the incomplete reporting of key indicators in relevant statistical databases. The raw data are gathered from the China Energy Statistical Yearbook, China Environmental Yearbook and China Statistical Yearbook. In addition, the Carbon Emission Accounts & Datasets (CEADS) platform offers data on carbon dioxide emissions for each location, and any missing data are filled using the linear interpolated approach. The indicator system is structured based on the principles of systematicity and viability [22,29,30]. It is split into inputs and outputs, and its construction is illustrated in Table 1.

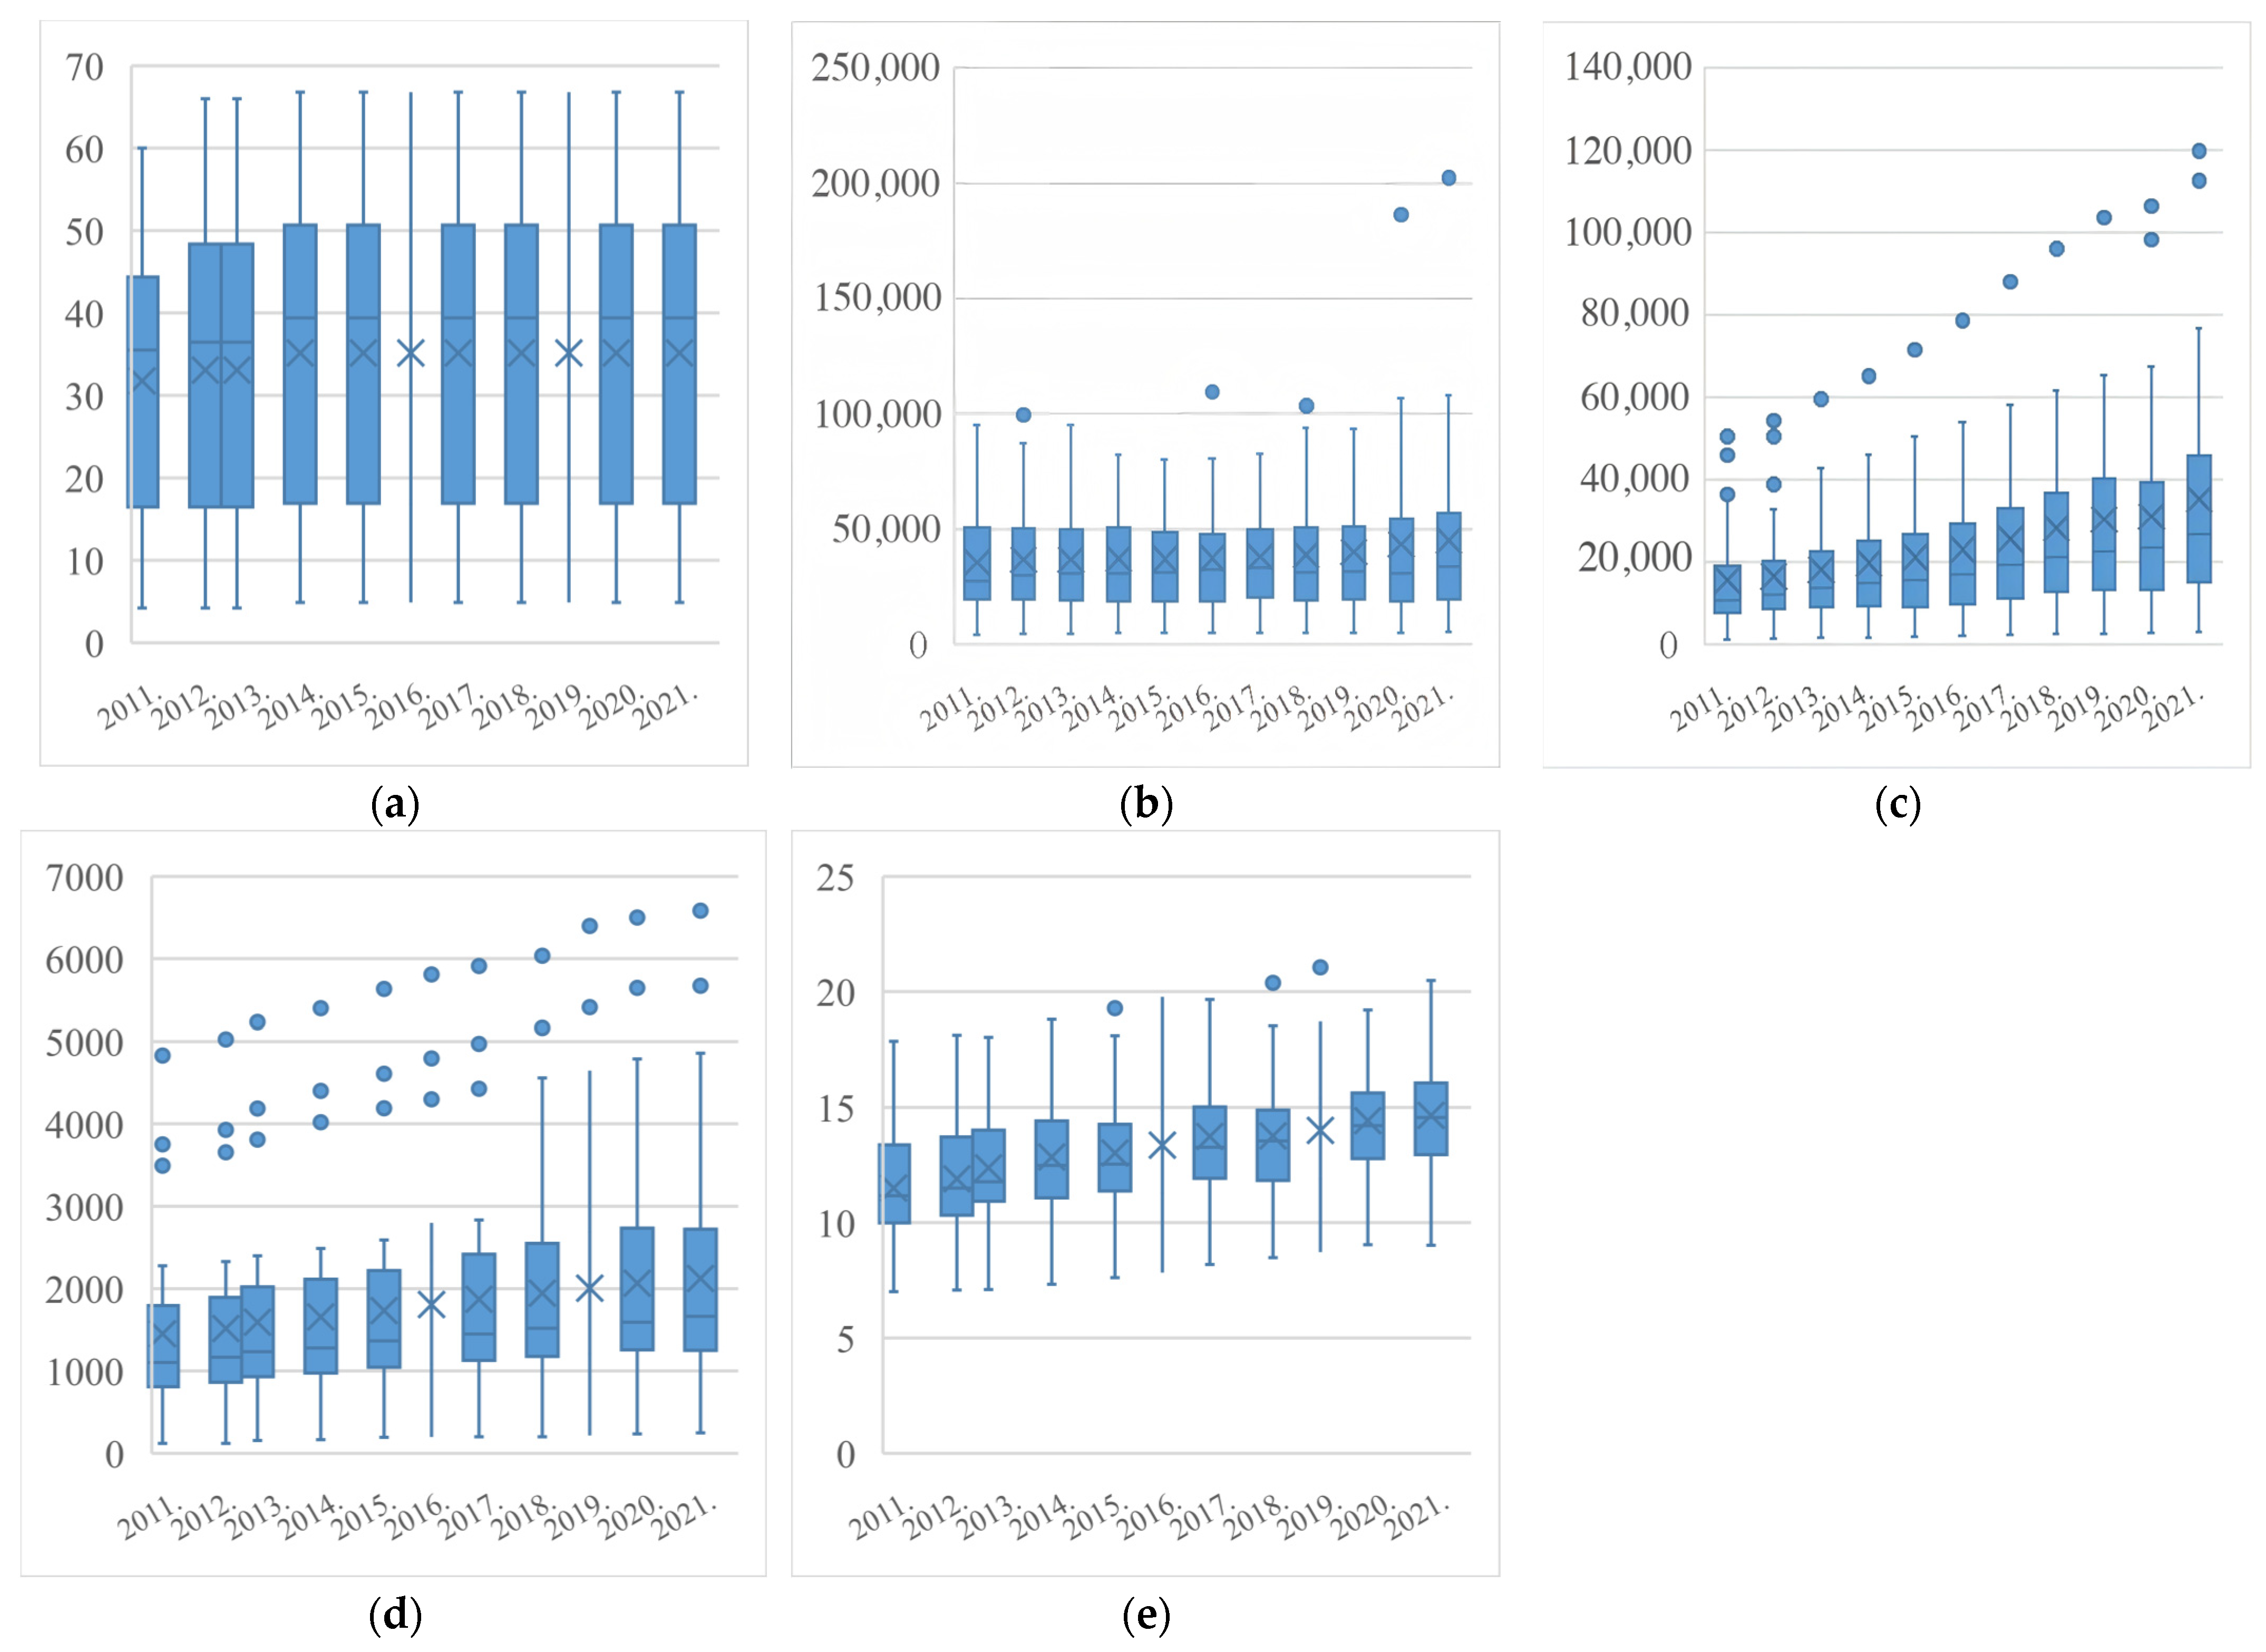
3.2. Descriptive Statistics

In the LUEE system, we choose four input variables (investment in fixed assets, local environmental expenditure, forestry investment, and energy consumption) and five output variables (forest cover, carbon dioxide emission, value added of secondary and tertiary industries, built-up area, and green space per capita) and calculate their maximum, minimum, average, and standard deviation (St. dev.); see (Figure 3) for details.
The amount of investment in fixed assets (Figure 3a) and the local environmental expenditure (Figure 3b) show the same trend of change, all of them increasing during the research period, illustrating that the environmental awareness of the government is gradually strengthening. The average value of forestry investment (Figure 3c) is also increasing in fluctuation, indicating that policymakers are focusing on enhancing the ability of forests to capture and store carbon by promoting the establishment and upkeep of forests. Moreover, the average trend of energy industry investment (Figure 3d) is relatively stable, but the difference between very large and very small values increases significantly after 2016, reflecting the differentiated characteristics of the development of the energy industry.
The fluctuations in forest cover (Figure 4a) are not significant, with little difference in values between years. However, as illustrated in (Figure 4b), the average value of CO2 emissions as a non-desired output changes relatively smoothly, but the great value in 2020–2021 shows a significant upward trend, which may be caused by the fluctuation of greenhouse gas emissions because of the adjustment of industries in certain regions. The added values of secondary and tertiary industries (Figure 4c), built-up area (Figure 4d), and green space per capita (Figure 4e) all show an increasing trend year by year, and the total value added of the secondary and tertiary industries sees a greater amount of growth.

3.3. Measure the Level of Land Use Environmental Efficiency

Thus, it is logical to integrate the EBM-DEA model with undesired aspects to assess efficiency in cases where there are both useful outputs and associated by-products [31,32]. The EBM-DEA model, which incorporates undesirable outcomes, is represented as follows:
σ * = m i n ϕ ν x i = 1 m ω i s i x i 0 ζ + ν y i = 1 s ω r + s r + y r 0 + ν b i = 1 m ω p b s p b x i 0 , s . t . j = 1 n x i j λ j + s i ϕ x i 0 = 0 ,    i = 1 , , m , j = 1 n y r j λ j s r + ξ y r 0 = 0 ,    r = 1 , , s , j = 1 n b p j λ j + s p b ξ b p 0 = 0 ,    p = 1 , , q , λ j 0 , s i 0 , s r + 0 , s p b 0
Equation (1) has m inputs, s acceptable outputs, and q undesirable outputs for each DMU. Efficiency parameter σ * ranges from 0 to 1. The efficiency value of s i ranges from 0 to 1. The slacks of input i , desired output r , and unwanted output p are denoted as s i , s r + , and s p b , respectively. The symbols w r + and w p b signify the target output weight and the non-target output weight, accordingly.
In addition, x represents the pth undesirable outcome of D M U j . It denotes the weight assigned to the desired output and the weight allocated to the undesired output, respectively. q signifies the aggregate quantity of unpleasant outputs. v x represents the collection of radial and non-radial slacks, where 0 < v x < 1 and 0 < v y < 1 . The definitions of the remaining variables are as previously stated.

3.4. Kernel Density Estimation

In this paper, the Gaussian kernel density function is used to analyze the dynamic distribution and evolution trend of land use environmental efficiency, and the expression of the function is as follows:
f x = 1 / n h i = 1 n K X i x ¯ / h ,
K x = 1 2 π e x 2 2 ,
where f x denotes the kernel density estimator, K x denotes the kernel function, X i is the sample observation, X i represents the mean of observations, n refers to the sample size, and h is the optimal bandwidth. We choose the bandwidth value based on the principle of the minimum mean square error.

3.5. Geographical Detector Model

To analyze the driving factors of LUEE, the Geodetector model is employed for the analysis, and the formula is as follows:
q = 1 1 N σ 2 h = 1 L N h σ h 2 ,
where q represents the proportion of variance explained by the factor, L represents the types of factors, N and N h respectively denote the total sample size and the sample size of stratum h , h refers to the class interval of dependent variable Y or influencing factors X , and σ 2 and σ h 2 respectively refer to the variance of Y in the entire study area and within stratum h .

4. Empirical Analyses

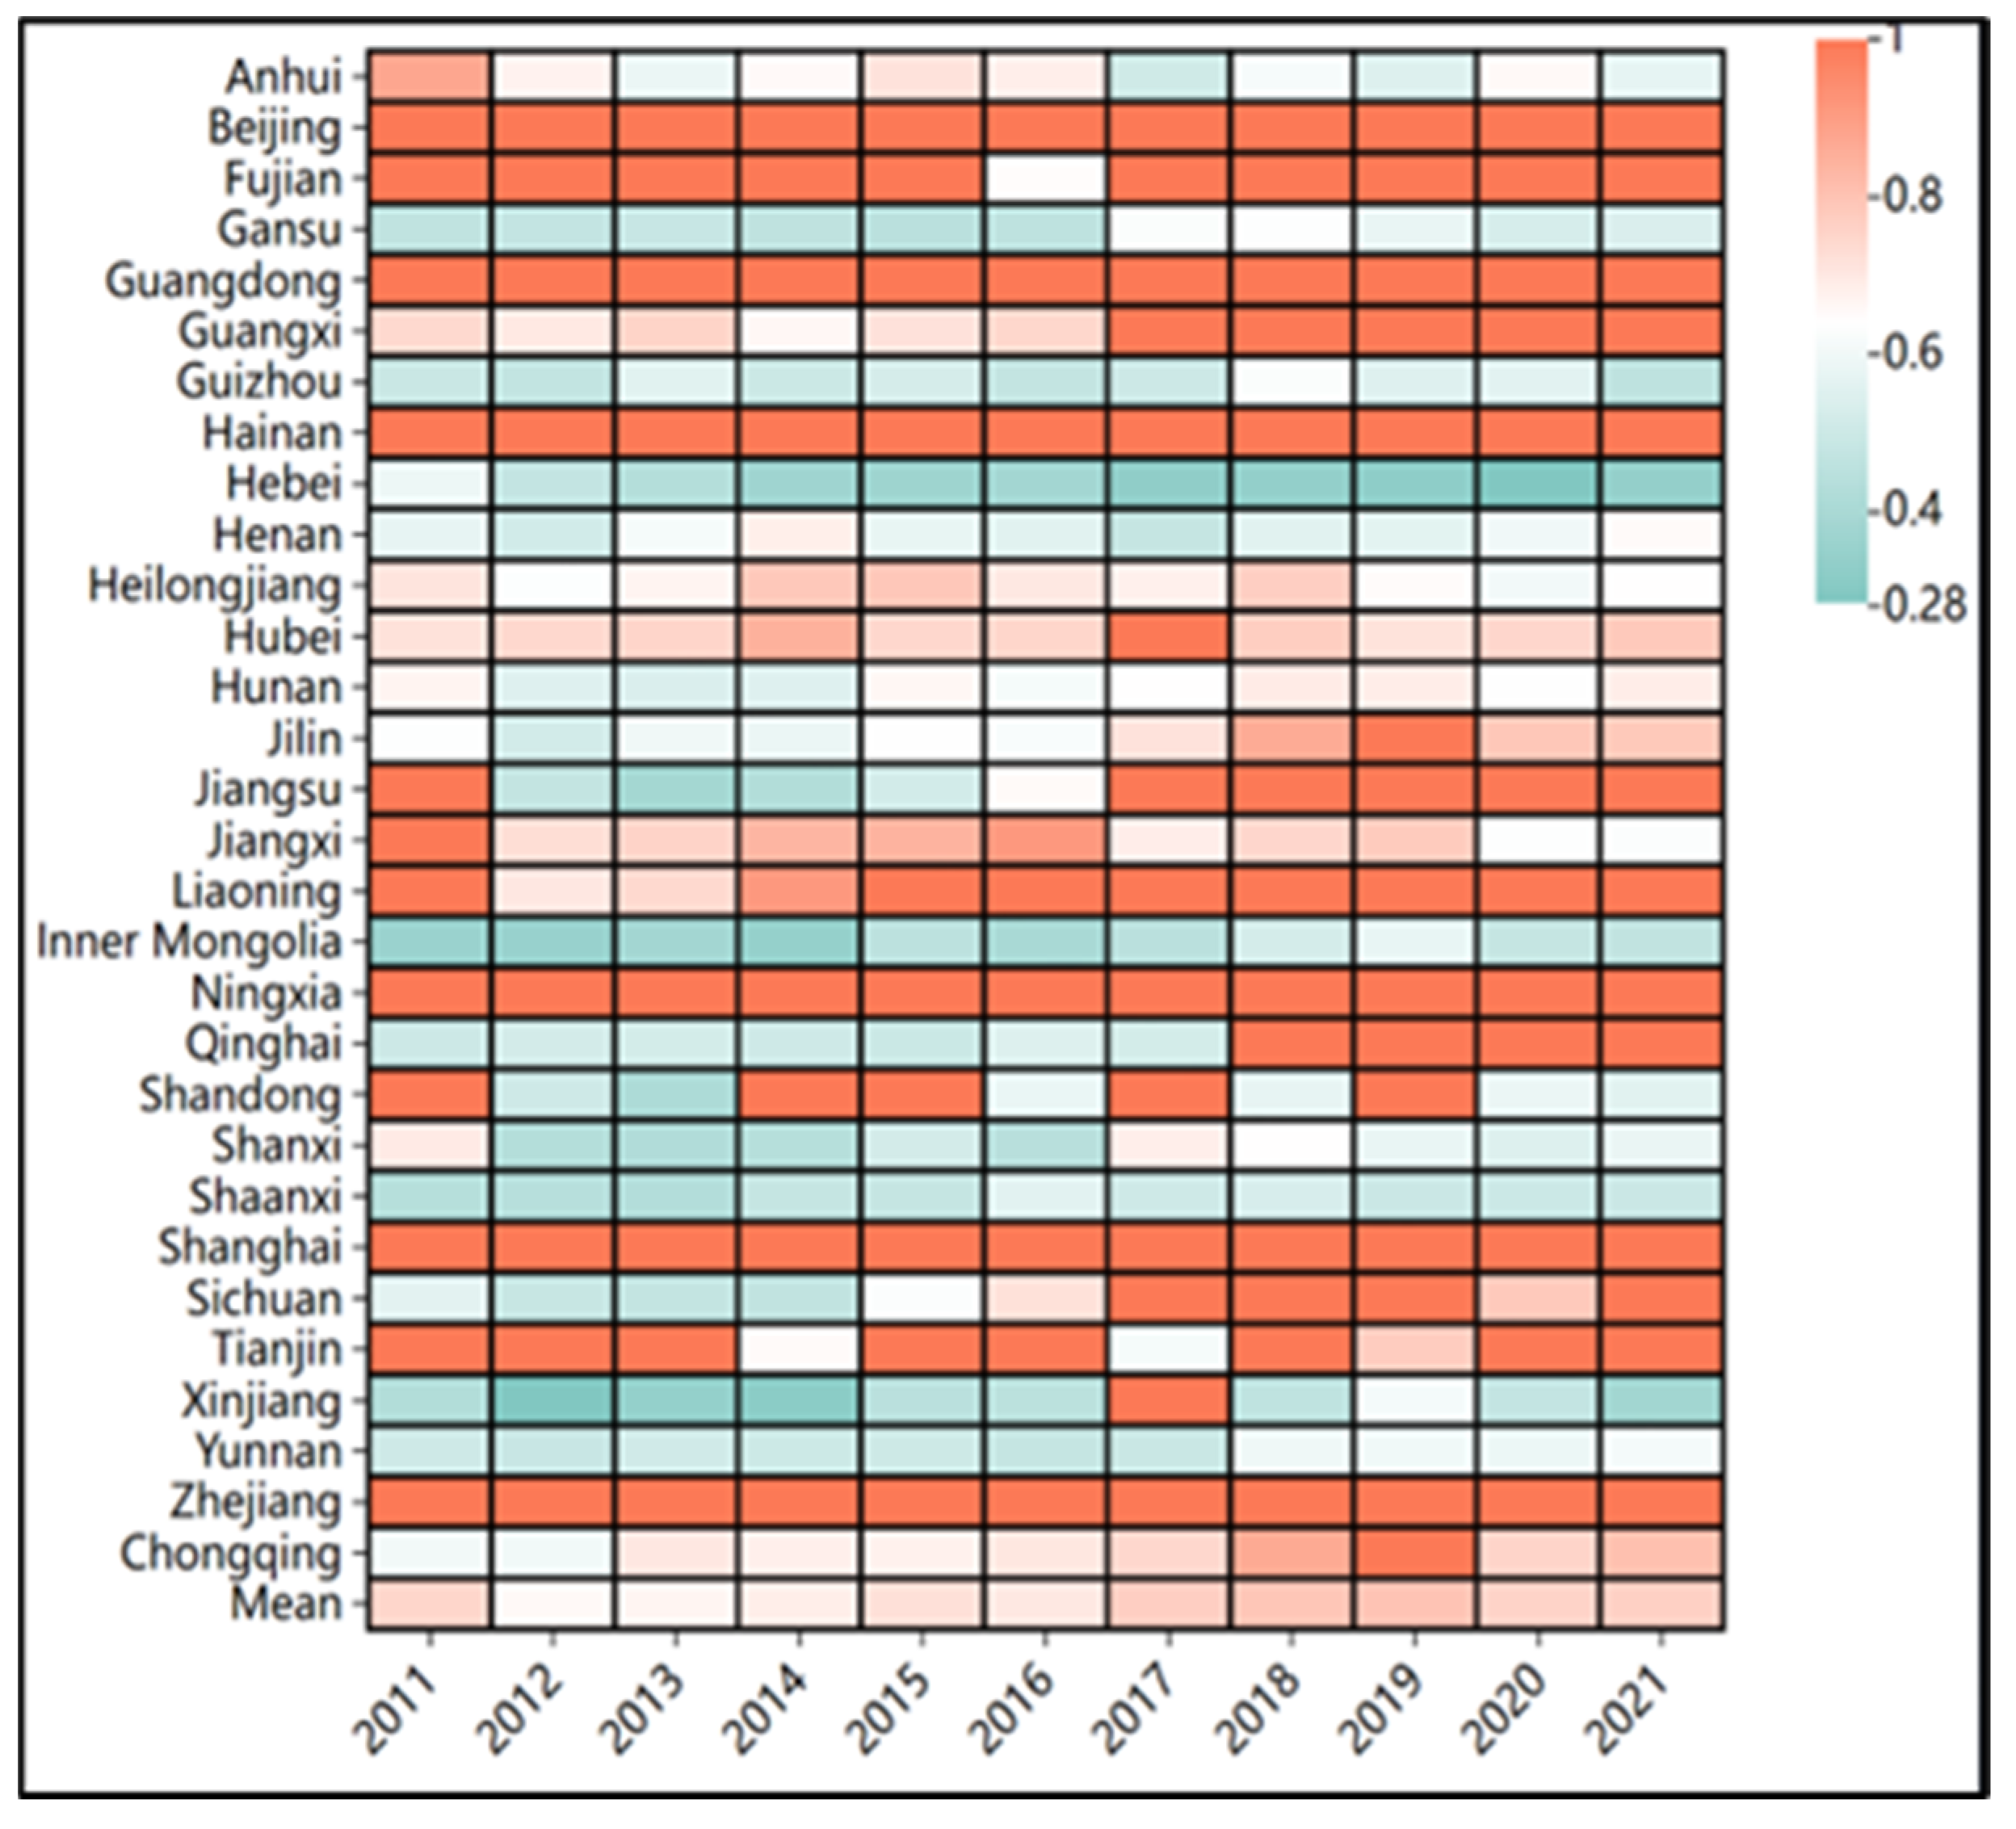
4.1. Assessment of Land Use Environmental Efficiency Results in China

4.1.1. Subsubsection

From the temporal dimension (Figure 5), the overall level of LUEE is high in all provinces, and the average value reaches the level of 0.5 or above in most years. In addition, there are obvious differences in temporal dimension characteristics of LUEE in various regions. Some regional efficiency values are always 1 in the study interval, such as Beijing, Guangdong, Hainan, Shanghai, Zhejiang and other provinces, which may be due to the higher level of environmental governance in the developed eastern coastal areas. The LUEE value in Ningxia, which is located in the west, is also high, which may be related to the land ecological restoration projects carried out in the region. On the contrary, Hebei, Henan, Shaanxi, and Yunnan have low LUEE values, which are always lower than 0.5 in the study interval, and this downward trend may be related to the increase in energy-consuming industries and idle industrial land due to the industrial restructuring carried out in the central region. In addition, some provinces have large differences in efficiency values across years, such as Hubei, Jilin and Shandong, with a difference of 0.4 between the most and least efficient years. This suggests that these regions preferred to rely on energy-intensive industries to develop their economies before 2017 but began to focus on cleaner production and ecological land use after that.

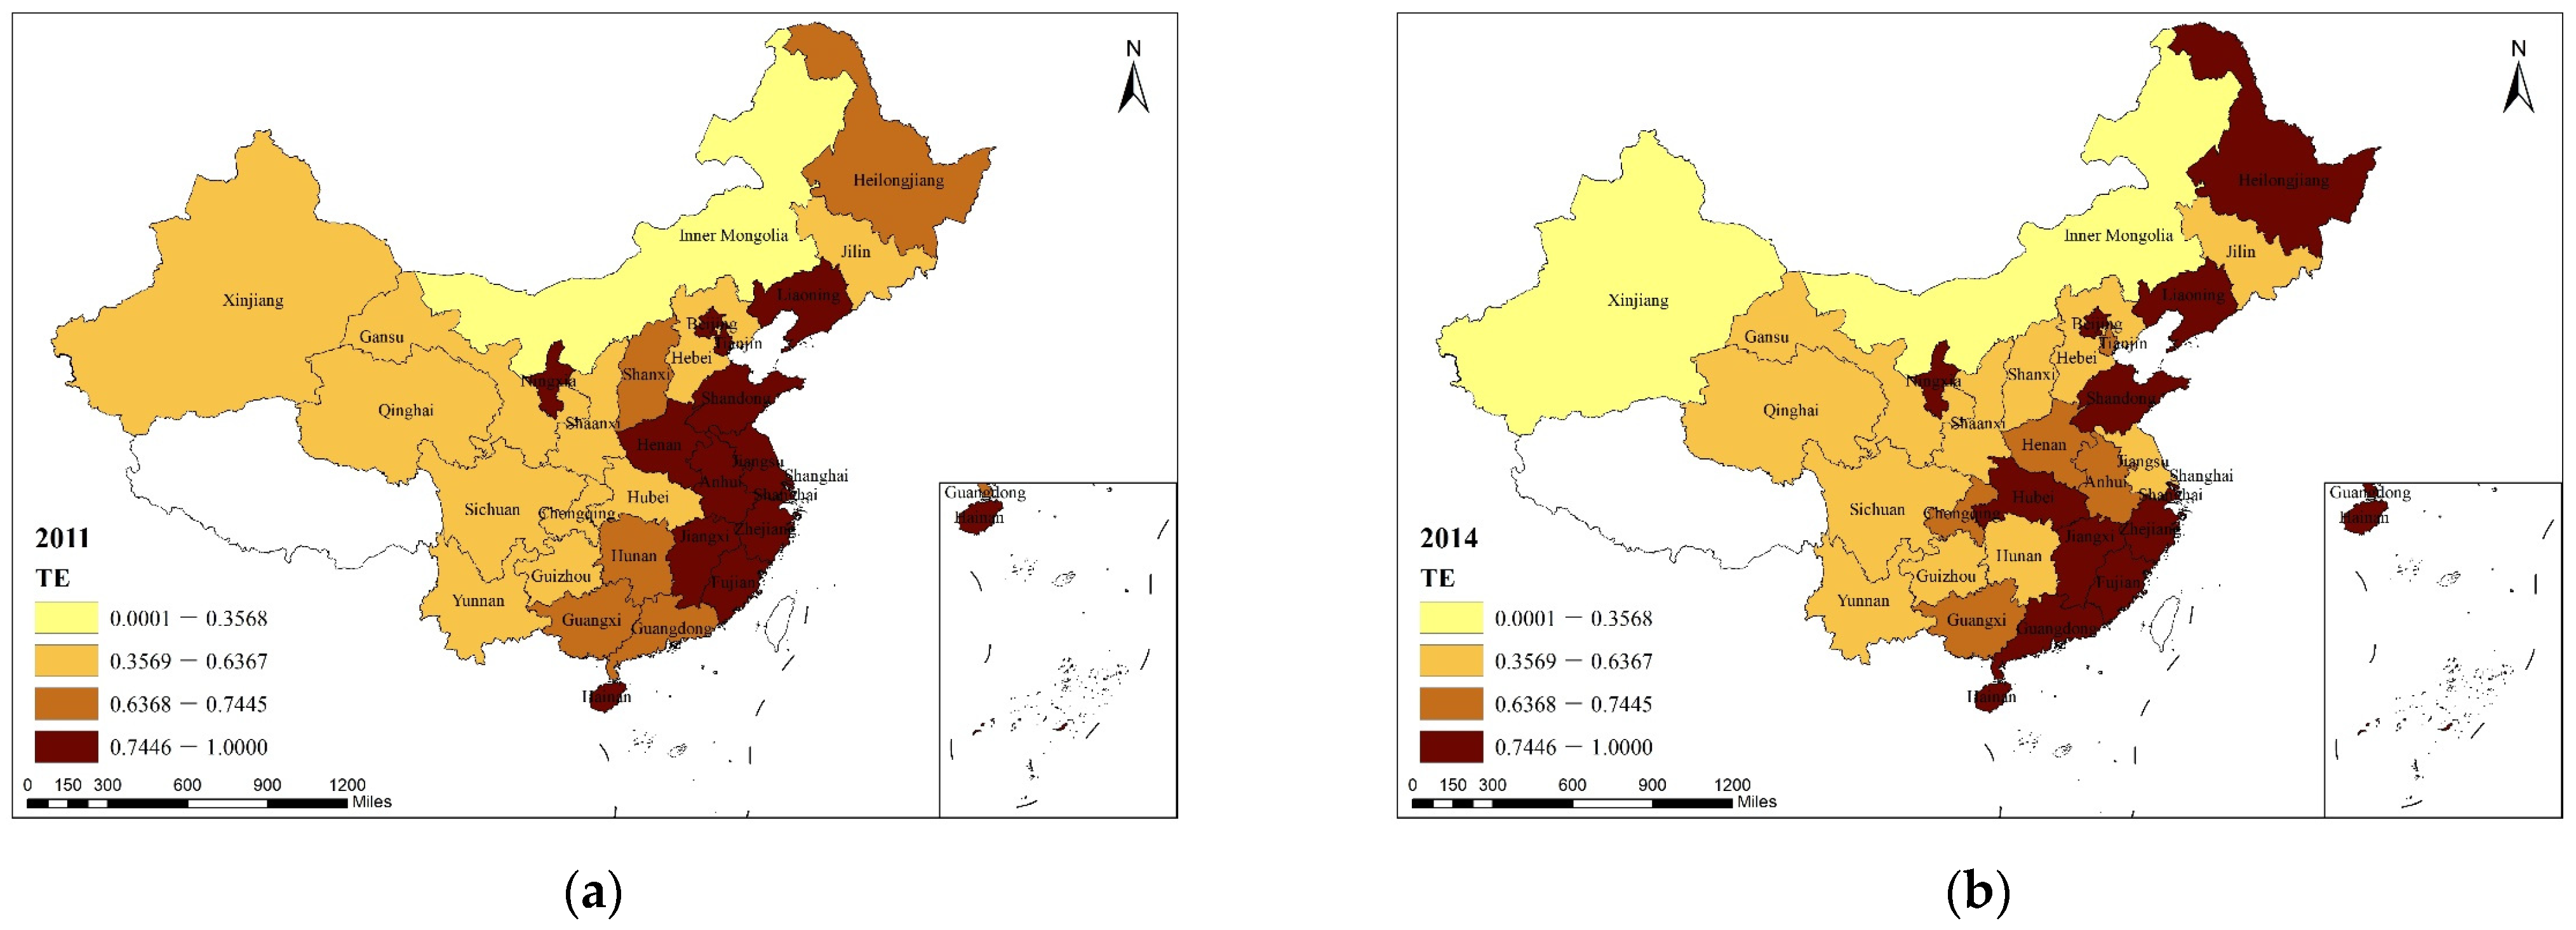
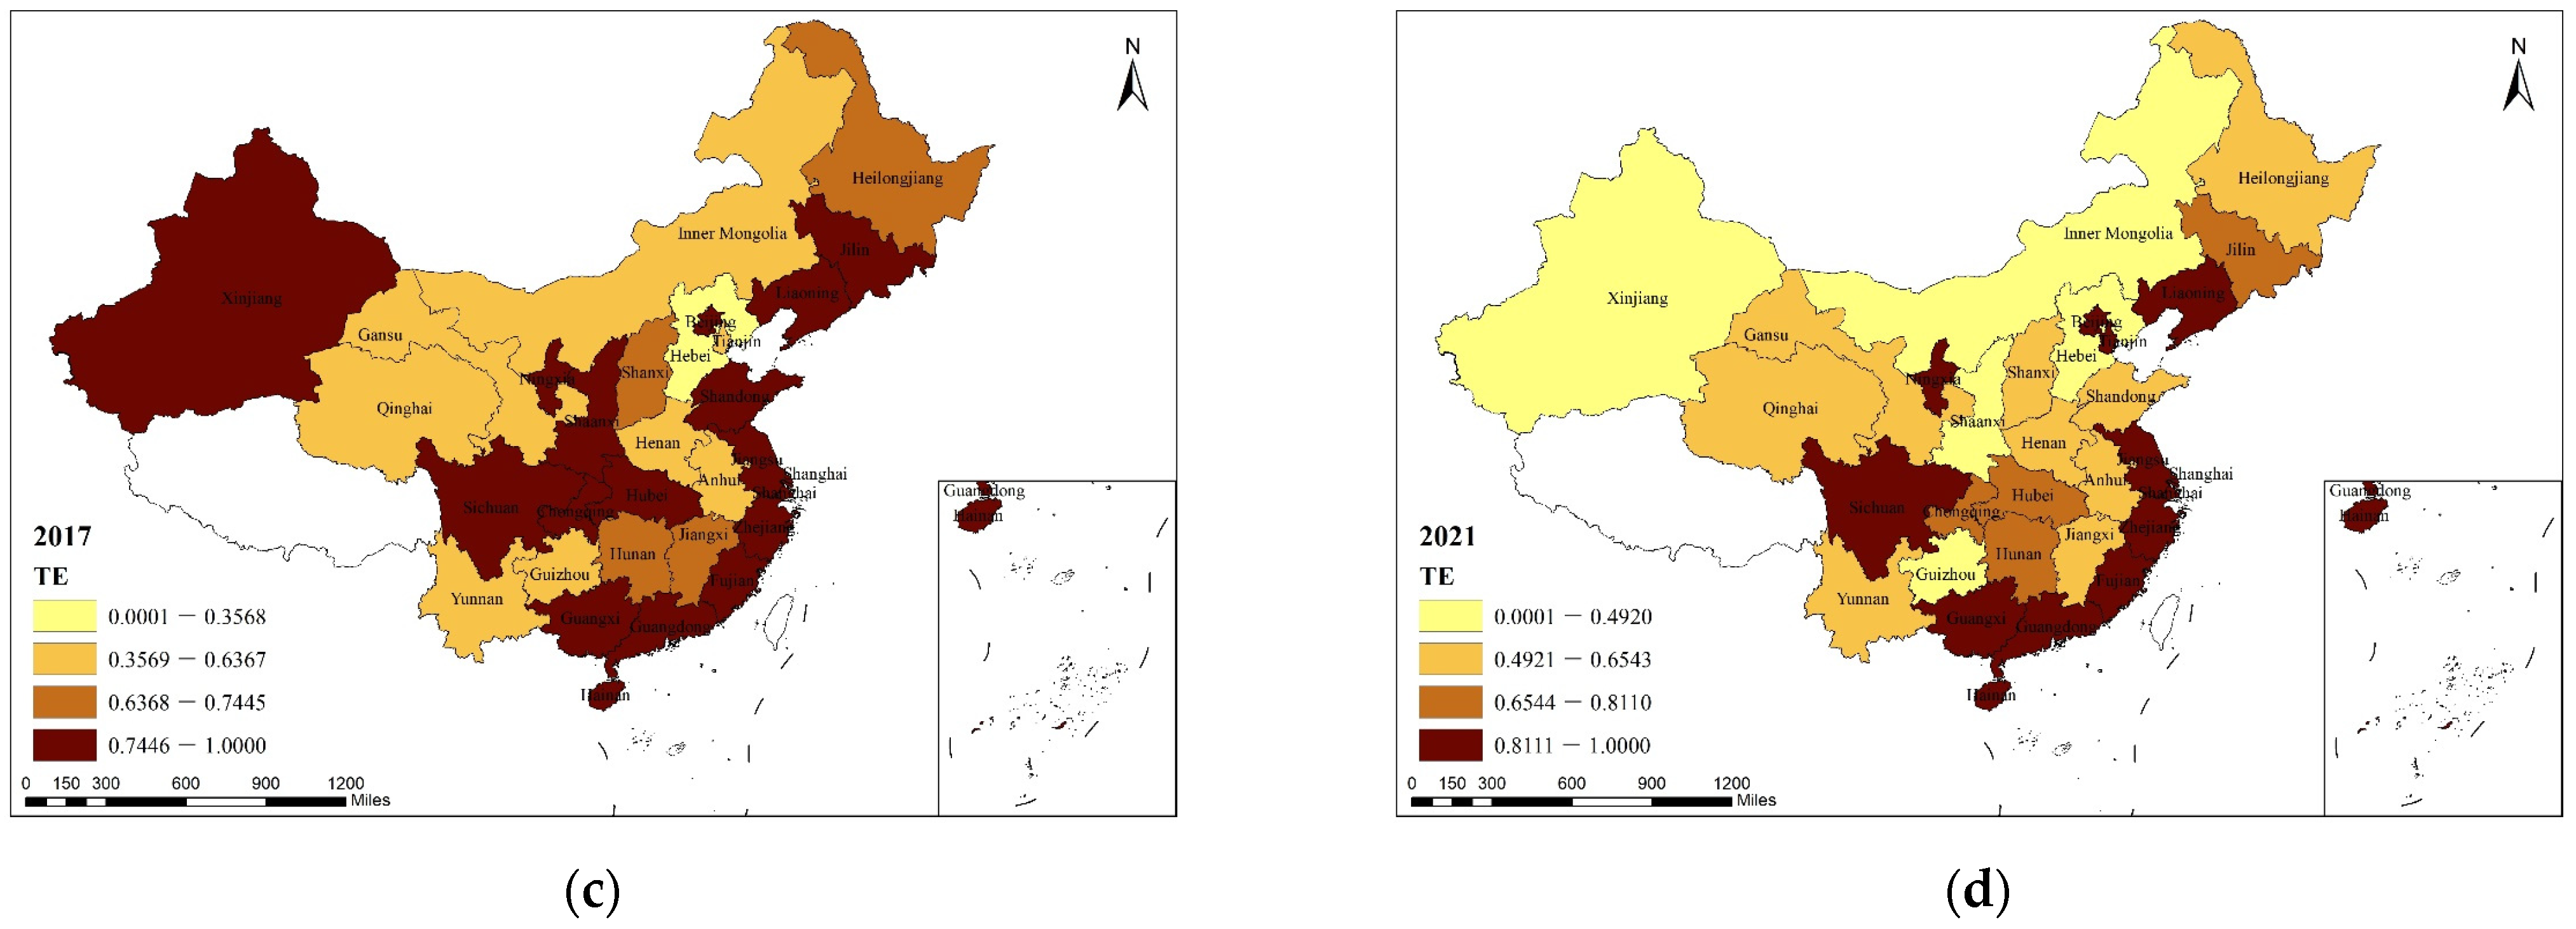
4.1.2. Characterization of Spatial Distribution

The spatial distribution characteristics of LUEE in China are shown in (Figure 6), which indicates that the eastern coastal municipalities have the highest total spatial efficiency rating, followed by the center area, while the western region has the lowest value. Specifically, the efficiency values of Liaoning, Shandong, Jiangsu and Zhejiang in the east are close to 1, which is due to the fact that the governments of economically prosperous areas prioritize the optimization of land use structure and the implementation of energy-saving and carbon reduction initiatives. To accomplish the environmental protection objectives outlined in the 13th Five-Year Plan, the government released the Regulations on the Implementation of the Action Plan for the Prevention and Control of Air Pollution in 2014. These regulations have significantly aided in decreasing emissions of carbon from industrial land use and enhancing the urban environment in these provinces. At the same time, China issued the United States–China Joint Statement on Climate Change, which sets out China’s milestones for green and sustainable development, and the government has since made “greening” a key national strategy.
As economically developed cities respond faster to the policy and implement it more vigorously, the LUEE values in these regions show greater heterogeneity from the central and western areas. Nevertheless, in 2017, the efficiency values of Xinjiang, located in the west, and Hebei, Henan, and Shaanxi, located in the central region, suddenly rose to 1. The reason behind this is that the EPA implemented joint pollution prevention measures in 2016, and in the initial year of the policy implementation, the series of measures had a greater impact on the industrial structure and land use planning, and many high-energy-consuming firms chose to change their production methods temporarily in order to avoid short-term penalties, and thus the policy effective period was also shorter and thus returned to the previous level in 2021.
Furthermore, there exist significant disparities in efficiency metrics within provinces within the eastern region, which can be attributed to industrial transfer policies and the level of regional receptiveness to external influences. In particular, Shandong, Beijing, and Liaoning have gradually shifted their machinery manufacturing industries to Hebei and Shaanxi after 2017, while Jiangsu, Zhejiang, and Fujian have shifted their traditional resource-processing industries to the neighboring provinces of Anhui and Jiangxi. After several rounds of industrial transfer, these highly developed provinces gradually abandoned energy-intensive industries, and the neighboring provinces exported a large amount of implied carbon dioxide to these regions, thus generating a “safe haven effect” of anthropogenic pollution [33].

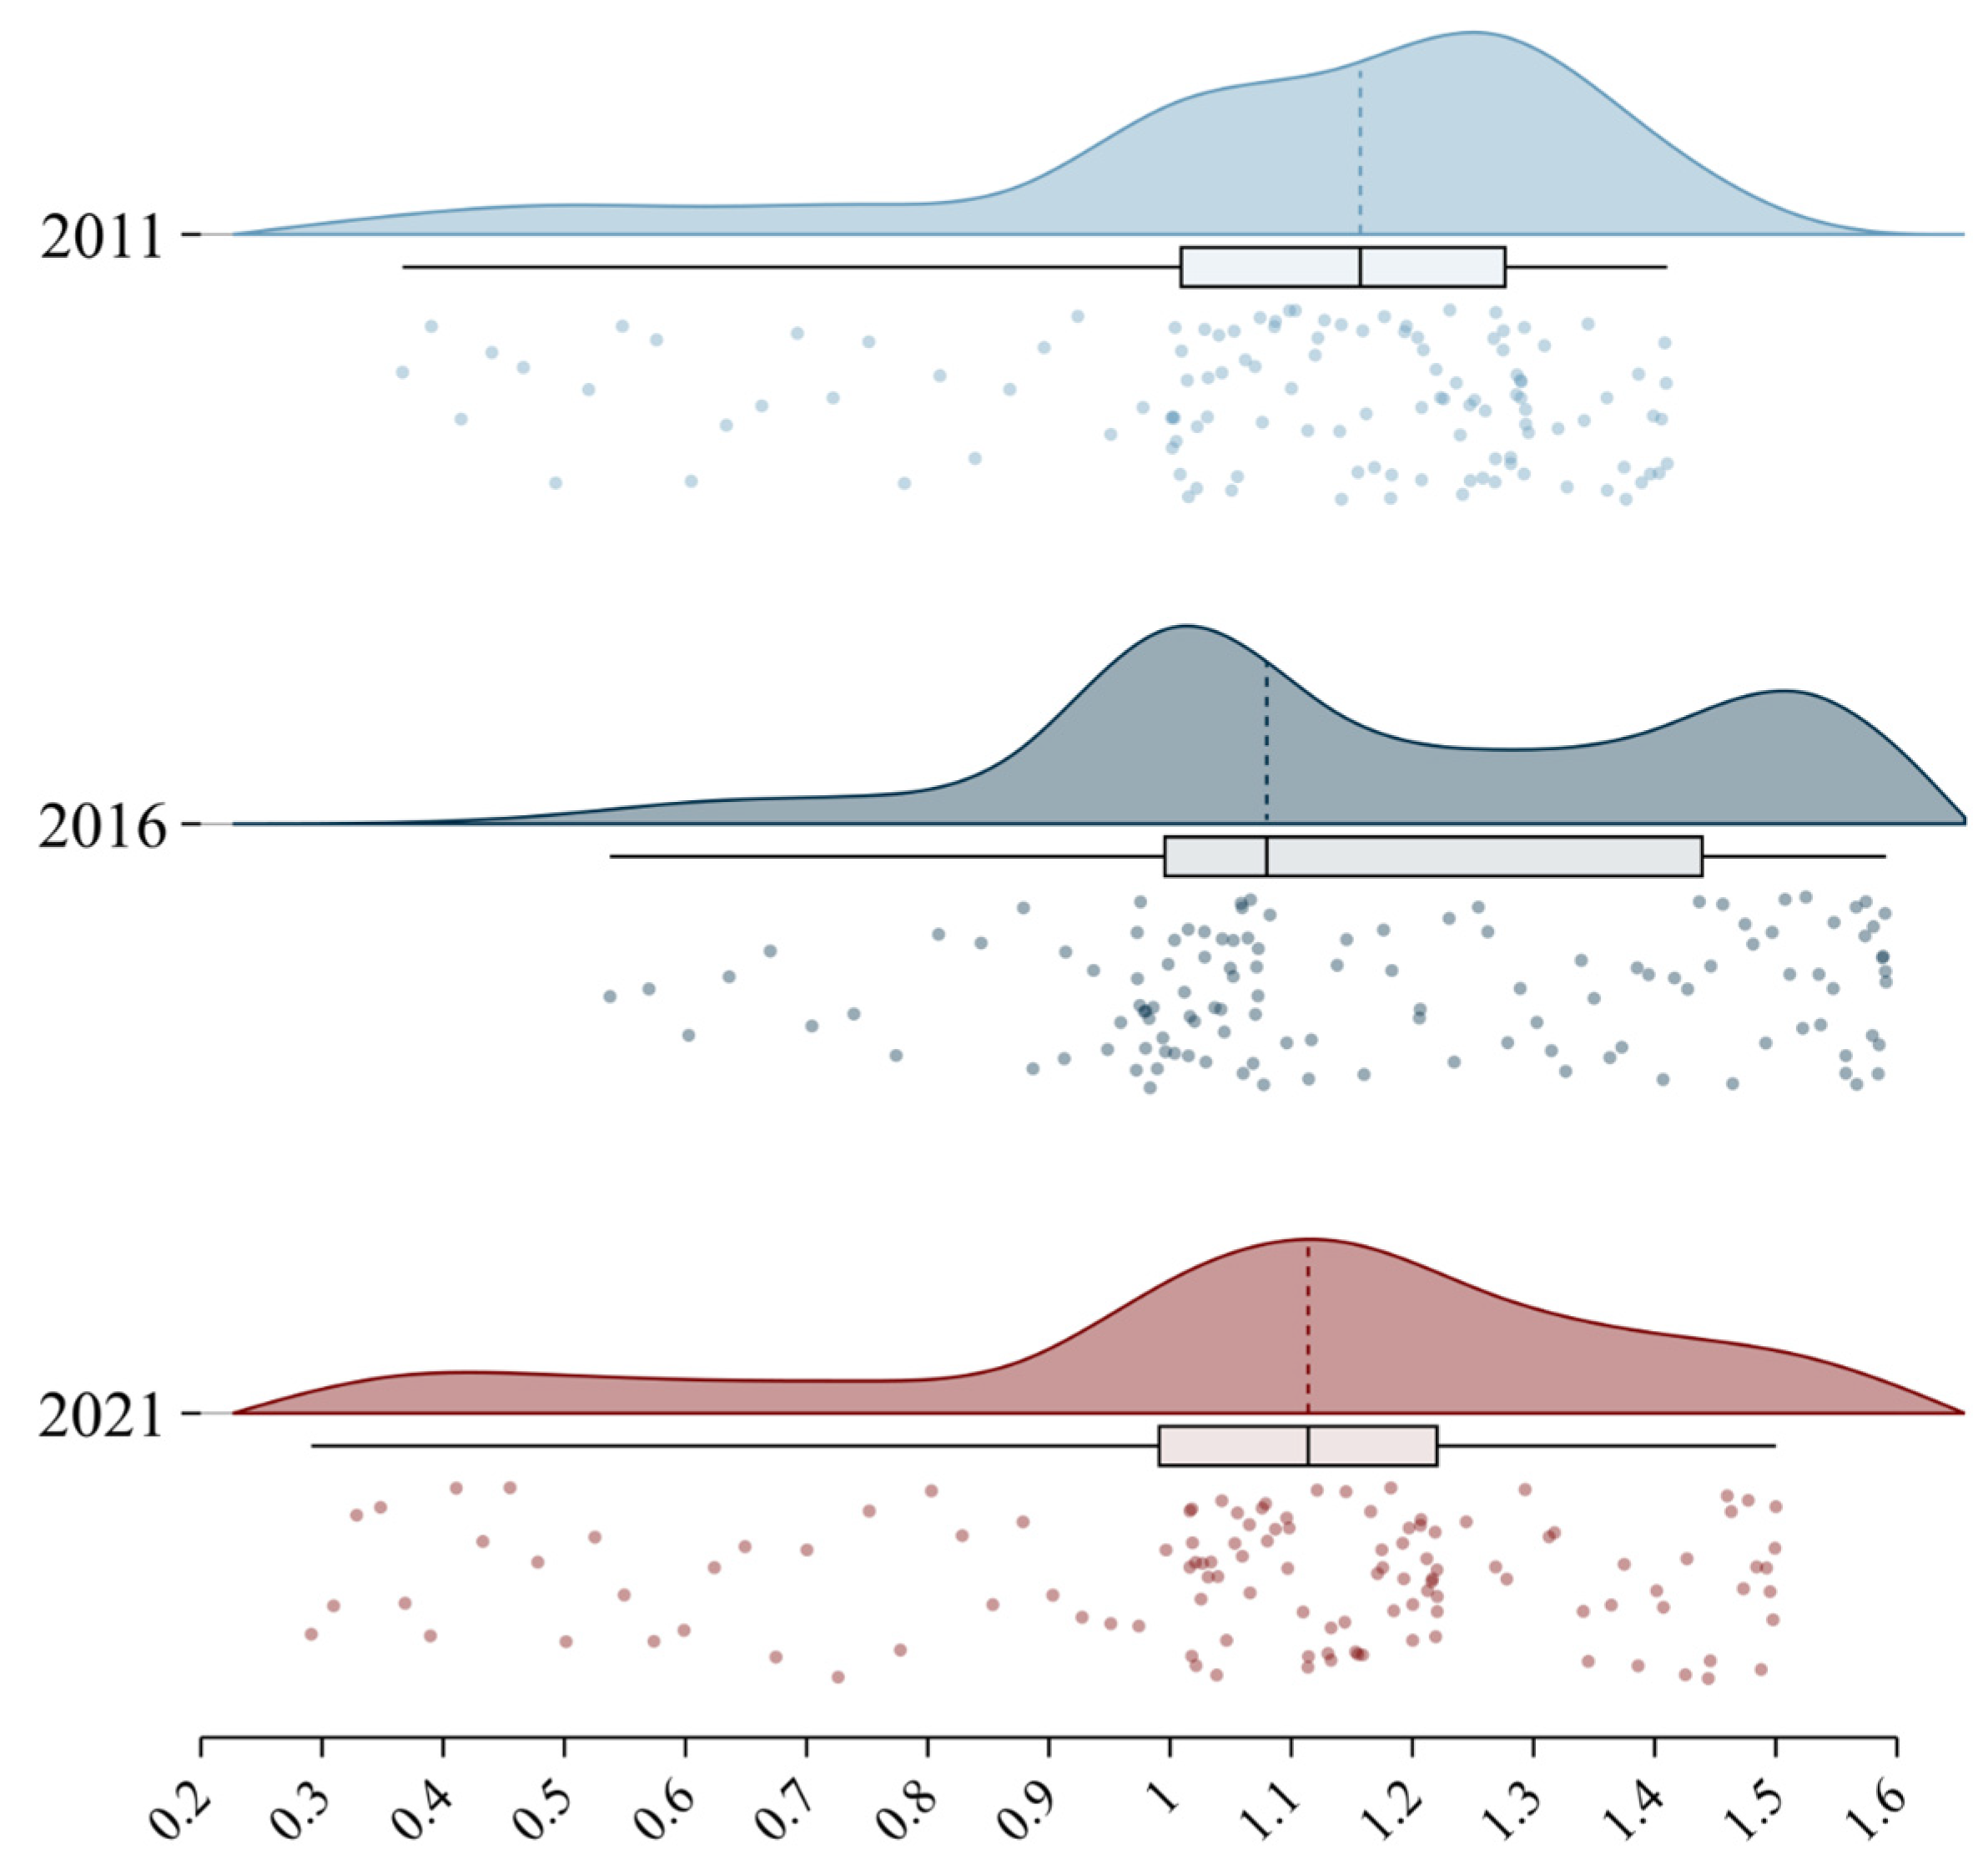
4.2. Kernel Density Analysis

As can be seen from Figure 7, the kernel density curves at the national level are distributed differently in different years. And the center moved to the left in 2016 and to the right in 2021. This indicates that land use environmental efficiency is fluctuating but improving overall. The kernel density curve shows a trend of decreasing the height of the main peak and widening the width of the peak, indicating that the absolute difference in LUEE in different regions increased during the observation period. From the perspective of ductility, the right tailing of the land use environmental efficiency kernel density curve in 2011 and 2021 was gradually obvious, indicating that the land use environmental efficiency of some regions is significantly higher than that in other regions.

4.3. Driver Analysis

The stratified heterogeneity reflects the intrinsic nature of geographic elements. And exploring their temporal and spatial attributes can reveal their evolutionary processes and underlying formation mechanisms. Using the Geodetector, this study analyzes the driving factors behind the spatial differentiation of environmental effects caused by land use in China.

4.3.1. Risk Detector

The Risk Detector revealed differences between the gradations within each driving factor. This study selected five factors, energy consumption (EC), economic development (ED), industrial upgrading (IU), population size (PS), and urban expansion (UE), whose spatial distributions are shown in Figure 8. EC is measured by the total local energy consumption, ED is measured by the total local GDP, IU is measured by the ratio of the added value of the local secondary and tertiary industries to GDP, PS is measured by the local resident population, and UE is measured by the ratio of the urban area to the total local land area. However, it must be pointed out that the urban area is not equal to the built-up area, and urban areas generally include undeveloped areas.
In the Geodetector, these five datasets are sampled separately as independent variables X 1 X 5 , while the environmental effects of land use were treated as Y . The data are input into the Geodetector in the form of (Y, X) to obtain the detection results for each driving factor. The results indicate that internal differences exist within each driving factor, and their explanatory power for the spatial stratified heterogeneity of land use environmental effects varies.

4.3.2. Factor Detector

Table 2 presents the explanatory power of each driving factor on the environmental effects of land use. The ranking of factors explaining the spatial differentiation of land use environmental effects is as follows: X5 (urban expansion: 0.204) > X1 (energy consumption: 0.182) > X3 (industrial upgrading: 0.137) > X4 (population size: 0.098) > X2 (economic development: 0.070). The results indicate that urban expansion has the greatest influence on the spatial differentiation of land use environmental effects, while energy consumption also shows significant explanatory power. In contrast, economic development and population size demonstrate relatively weaker explanatory effects.

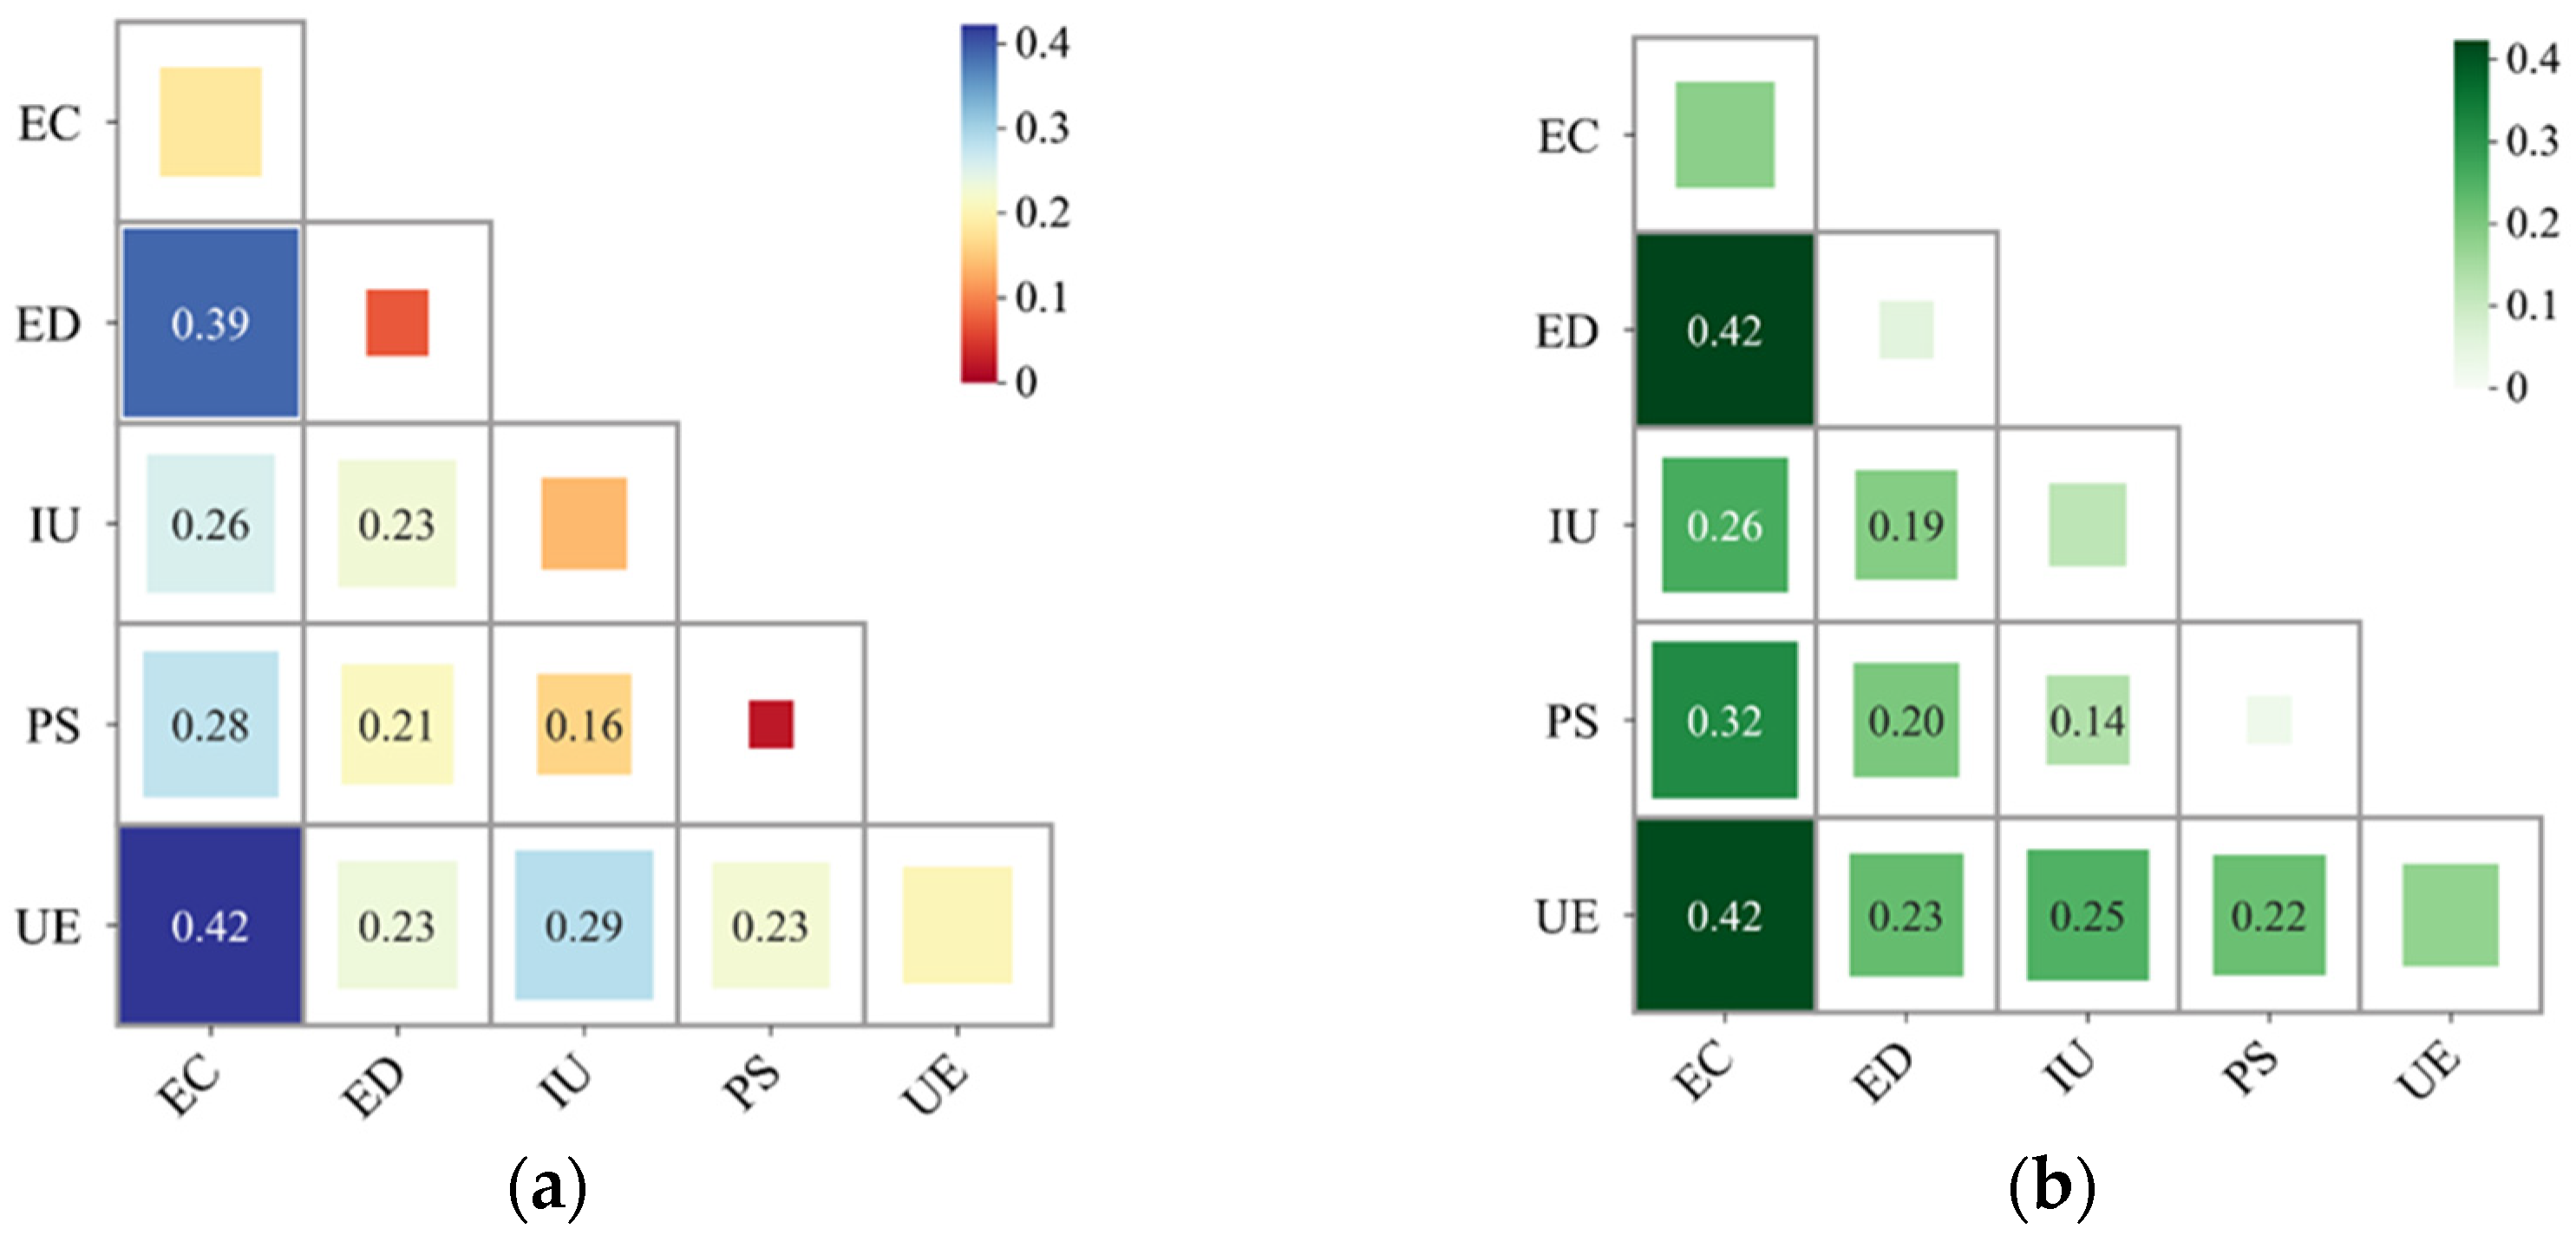
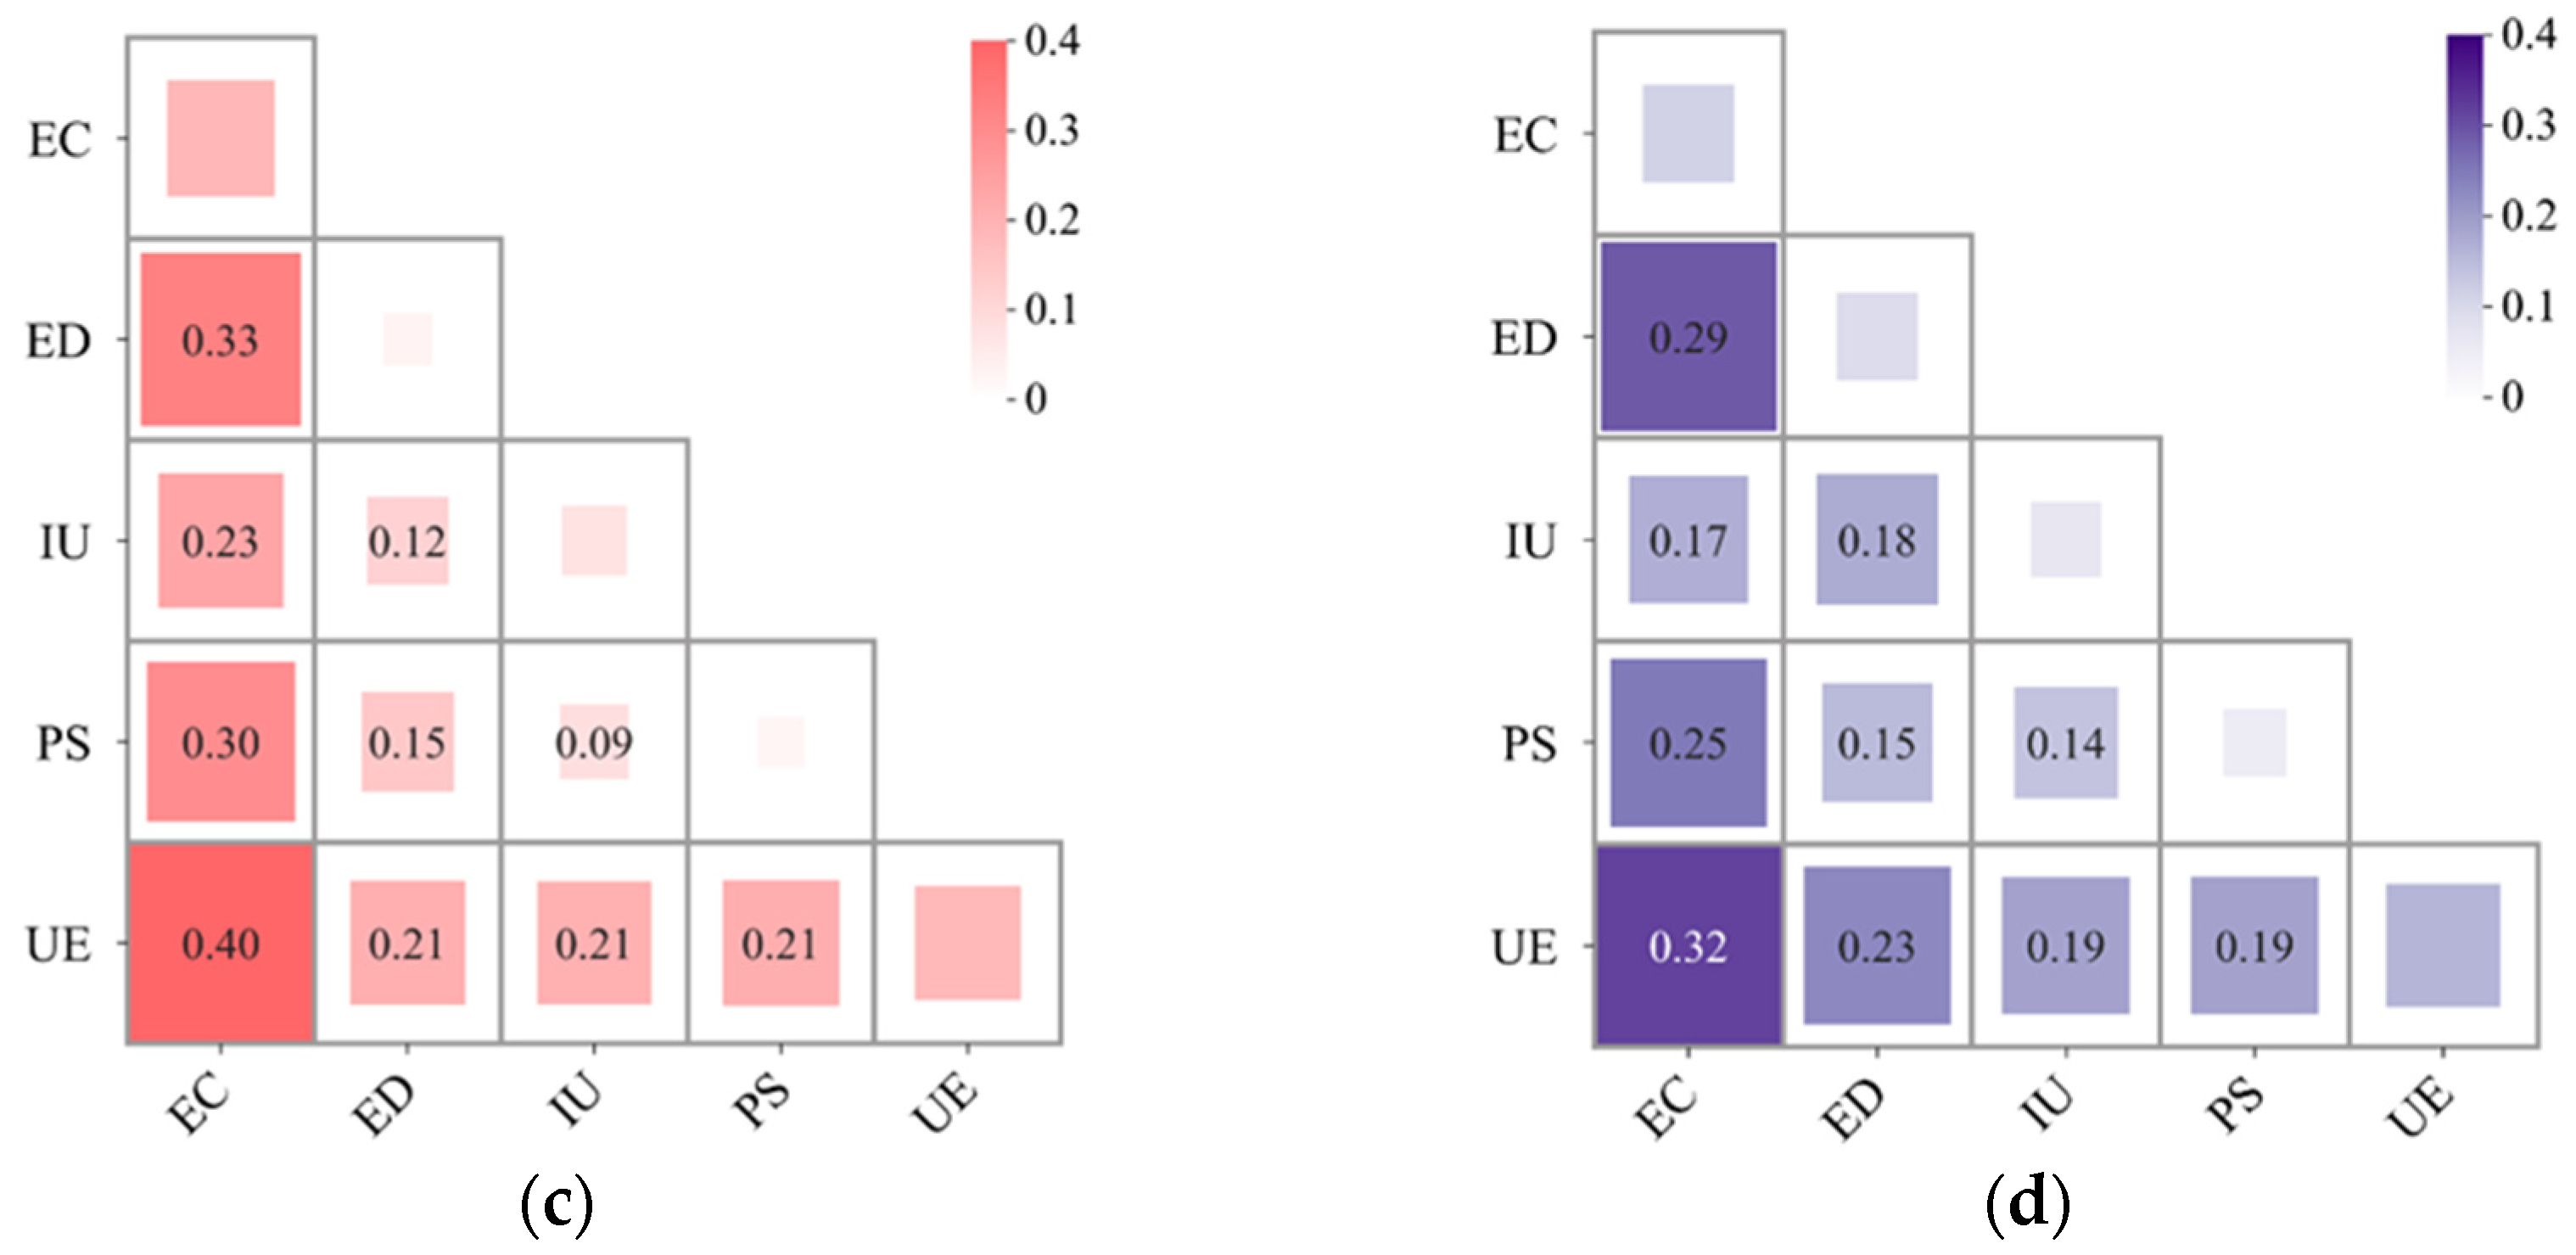
4.3.3. Interaction Detector

As can be seen in Figure 9, the interaction of the two driving factors has a greater impact on LUEE than their individual effects, and the interaction is a two-factor enhancement. From Figure 9, energy consumption economic development, energy consumption population size, energy consumption urban expansion, economic development industrial upgrading, and economic development population size are the dominant interaction drivers at the national level. In terms of regions, the dominant interaction drivers in the eastern region were energy consumption economic development, energy consumption population size, energy consumption urban expansion, economic development industrial upgrading, economic development population size, and population size urban expansion. The central region dominates the interaction drivers energy consumption economic development, energy consumption population size, energy consumption urban expansion, economic development industrial upgrading, and economic development population size. The western region dominates the interaction drivers. The sub-categories are energy consumption economic development, energy consumption population size, energy consumption urban expansion, economic development industrial upgrading, economic development population size, and industrial upgrading population size. In general, all over the country, there are differences in the driving factors of regional interaction, but they mainly involve four driving factors: energy consumption, economic development, population size, and industrial upgrading.

5. Discussion

The urbanization process is often accompanied by multidimensional conflicts such as land use change, ecological quality enhancement and economic aggregation increase. Taking China as the study area, EBM-DEA is used to evaluate LUEE in the context of energy use. LUEE in each region of China during the study interval is fluctuating, but it is generally at a high level. Nevertheless, it is still worthwhile to consider the heterogeneity of various regions and the underlying causes.

5.1. Discrepancies in and Role of LUEE

On the temporal scale, land use environmental efficiency has obvious spatial and temporal heterogeneity. Some provinces maintain efficiency values at the level of 1, indicating high environmental quality, and are dominated by developed coastal areas and provincial capital metropolitan areas. After 2015, LUEE increased in most provinces, and these changes can be attributed to shifts in environmental regulations and changes in input factor costs. From the perspective of environmental policy, China issued documents such as the Opinions on Accelerating the Construction of Ecological Civilization in 2015, which prompted local governments to participate in ecological construction [34].
From an input cost perspective, China’s economy is currently in the process of transforming from industry to business services, with local governments being politically incentivized to provide land for construction. The slowdown in industrial development after 2015 means that the advancement of energy-consuming traditional industries and manufacturing has slowed down [35], which in turn reduces the environmental pressure on industrial land. In addition, due to the continued rise in land rental and labor costs, industrial land rental rates declined after 2016 and technological innovations promoted cleaner production by firms, thus reducing energy consumption by industrial firms and increasing LUEE [36].
In addition, there are obvious differences in LUEE between the western, central and eastern areas, and there is an imbalance within the eastern region, which may be due to the fact that economically developed regions have carried out several rounds of industrial transfer to neighboring regions in order to seek a balance between their own ecology and development. Provinces that bear the ecological costs of economic development in developed regions often face greater environmental protection pressures, leading to the variability of LUEE within the eastern coastal urban agglomerations.
In the comparative analysis of Brazil, India, and China, it is observed that China’s manufacturing clusters are closely aligned with its rapid urbanization. In contrast, Brazil faces ecological constraints imposed by the Amazon region, and India’s lagging infrastructure has led to generally low land ecological efficiency. These challenges bear certain similarities to the regional development disparities observed in central and western China [37].

5.2. Performances of Factors Influencing LUEE

From the results of the Geodetector, energy consumption and economic advancement are the dominant influencing factors of LUEE, and the contribution of environmental regulation to the impact of LUEE shows a non-linear fluctuation trend. Some studies [38] pointed out that both energy intensity and technology innovation are the dominant contributing factors that alleviate the regional environmental pressure and that economic development leads to a rise in greenhouse gas emissions in the region. This is similar to some of the results found in this study, but from a macroscopic perspective, the increased environmental awareness in China in recent years has led local governments to stop aiming for short-term economic growth, which has led to a positive environmental effect to some extent.
In addition, Qian’s study showed that population size had a limited effect on industrial pollutant emissions during 2010–2015 [39]. This study also found that population mobility and agglomeration do not have a significant effect on LUEE in China. Some scholars have argued that environmental regulations help reduce pollutant emissions and energy consumption and are the best way to attain “green” land use and reduce carbon emissions [40]. However, this study found that the effect of environmental regulations on LUEE after 2016 is limited and that the multiple restrictions cannot completely offset the energy consumption and carbon emissions generated by land urbanization and may even be counterproductive, which may be due to the differences in the target of the study and the system of indicators of environmental effects.

5.3. Limitations

The panel data of China from 2011 to 2021 was employed to analyze the LUEE and driving factors in this study. The most recent year is currently unavailable due to the time gap in obtaining statistical data. Furthermore, the analysis in this paper is limited to the national macro-level. Future research may examine various land properties at the micro-city level and incorporate comparative analyses with the environmental effects of other developing countries to elucidate a more comprehensive heterogeneity of the results. Simultaneously, future research may endeavor to establish a more comprehensive LUEE indicator system by incorporating indicators that reflect the quality of life of residents and industrial upgrading factors to investigate additional factors that influence environmental efficiency in the context of urbanization. In addition, exploring finer spatial units (e.g., prefecture-level cities) and integrating social metrics such as income inequality and health outcomes could further enhance the assessment of the human–environment interface.

6. Conclusions and Implications

6.1. Conclusions

In this research, the EBM-DEA model is used to evaluate LUEE in China. Based on this, we used the geo-explorer method to explore the driving ability of five factors, energy consumption, economic development, industrial upgrading, population size, and urban expansion, on LUEE. Based on the empirical data research of provincial zones from 2011 to 2021, the following conclusions can be indicated: (1) China’s high average LUEE level indicates that in recent years, China has begun to integrate economic and environmental effects when using land. However, regional LUEE values in eastern, central and western China show an obvious pattern of spatial differentiation, and there are also large differences in the LUEE of provinces within the developed eastern region. For example, Beijing, Tianjin, Zhejiang and other eastern regions have the highest LUEE, even converging to 1, while neighboring Hebei, Henan and Anhui have the largest space for environmental quality improvement. (2) Energy consumption, economic development, industrial upgrading, population size, and urban expansion are the driving factors. Their explanatory power for the spatial stratification heterogeneity of land use environmental impacts varies. (3) Urban expansion has the greatest impact on the spatial differentiation of land use environmental effects, while energy consumption also shows significant explanatory strength. In contrast, economic development and population size exhibit relatively weaker explanatory effects. (4) The interaction of the two driving factors has a greater impact on LUEE than their individual effects, and the interaction is a two-factor enhancement.

6.2. Policy Implications

  • Enhance region-specific sustainable development strategies. The capital metropolitan area and developed coastal communities have reacted more favorably to green development policies, whereas the less developed regions in the center and west continue to experience greater environmental pressures. Therefore, it is essential to design environmental protection strategies tailored to the unique development characteristics and consumption patterns of each region, unlocking the green development potential of the western areas. Additionally, given the imbalance of land use and ecological efficiency (LUEE) in the eastern region, government efforts should prioritize rational urban land use planning, ecological restoration, and the promotion of industrial structures aligned with cleaner production. This helps transform artificial pollution transfer into a beneficial pollution halo effect.
  • Balance energy consumption with economic advancement. Reducing energy consumption and achieving the goal of sustainable economic development play an important role in easing environmental pressures on land use and achieving decoupling goals in China. Since energy use is closely linked to industrial patterns and energy structures, local governments should encourage enterprises to replace highly polluting energy sources with cleaner alternatives. Policy incentives, especially financial support, should be directed towards technologically innovative industries to promote proactive energy transformation. In particular, the green transformation of the energy structure should be promoted in the western area where the land use pattern is rough and in the northeastern region where heavy industry is dominant [41].
  • Develop more efficient environmental protection measures and land policies. Cities in eastern regions and metropolitan areas generally possess stronger environmental regulatory capacities. To achieve balanced green development, regional environmental protection efforts should emphasize flexibility, market mechanisms, and public participation, tailoring regulation to local conditions. Moreover, integrating industrial and commercial land use naturally with logical green space planning can link carbon sources and sinks effectively, enhancing the ecological benefits of commercial land and improving the economic value of urban properties from a planning perspective.
  • Learn from international practices to optimize land governance. Comparative studies of Brazil, India, and China suggest that land efficiency depends not only on governance models but also on ecological conditions and the degree of policy integration [37]. Research on the sustainability of Transit-Oriented Development (TOD) highlights that improving the coordination between transportation and land management can effectively curb land expansion and reduce energy consumption [42]. China could further advance transit-oriented planning by integrating green ecological design principles and enhancing coordination in energy and land governance between eastern city clusters and those in the central and western regions, thereby improving LUEE.

Author Contributions

Methodology, F.R.; formal analysis, L.W. and F.R.; data curation, L.W.; writing—original draft: H.L.; writing—review and editing, X.L.; project administration, F.R. All authors have read and agreed to the published version of the manuscript.

Funding

This research was funded by the National Social Science Foundation Project (grant number. 24BJY142), China Postdoctoral Science Foundation Project (grant number 2023M741632), and Major Project of Philosophy and Social Science Research in Universities of Jiangsu Province (grant number 2022SJZD053).

Data Availability Statement

The original contributions presented in the study are included in the article, and further inquiries can be directed to the corresponding author.

Conflicts of Interest

The authors declare no conflicts of interest.

Abbreviations

The following abbreviations are used in this manuscript:
LUEELand use environmental efficiency
IPCCIntergovernmental Panel on Climate Change
SBMSlacks-based measure
DMUDecision-making unit
DEAData envelopment analysis
St. dev.Standard deviation
CNYChinese yuan
CEADSChina Carbon Emission Accounts & Datasets
GDPGross domestic product
EPIGlobal environmental performance index
ECEnergy consumption
EDEconomic development
IUIndustrial upgrading
PSPopulation size
UEUrban expansion

References

  1. Jackson, R.B.; Ahlström, A.; Hugelius, G.; Wang, C.; Porporato, A.; Ramaswami, A.; Roy, J.; Yin, J. Human Well-being and per Capita Energy Use. Ecosphere 2022, 13, e3978. [Google Scholar] [CrossRef]
  2. Cao, Y.; Bian, Y. Improving the Ecological Environmental Performance to Achieve Carbon Neutrality: The Application of DPSIR-Improved Matter-Element Extension Cloud Model. J. Environ. Manag. 2021, 293, 112887. [Google Scholar] [CrossRef]
  3. Chen, J.; Gao, M.; Cheng, S.; Hou, W.; Song, M.; Liu, X.; Liu, Y.; Shan, Y. County-Level CO2 Emissions and Sequestration in China during 1997–2017. Sci. Data 2020, 7, 391. [Google Scholar] [CrossRef]
  4. Choi, Y.; Liu, Y.; Lee, H. The Economy Impacts of Korean ETS with an Emphasis on Sectoral Coverage Based on a CGE Approach. Energy Policy 2017, 109, 835–844. [Google Scholar] [CrossRef]
  5. Li, X.; Bei, N.; Hu, B.; Wu, J.; Pan, Y.; Wen, T.; Liu, Z.; Liu, L.; Wang, R.; Li, G. Mitigating NOX Emissions Does Not Help Alleviate Wintertime Particulate Pollution in Beijing-Tianjin-Hebei, China. Environ. Pollut. 2021, 279, 116931. [Google Scholar] [CrossRef] [PubMed]
  6. Zhou, P.; Ang, B.W.; Han, J.Y. Total Factor Carbon Emission Performance: A Malmquist Index Analysis. Energy Econ. 2010, 32, 194–201. [Google Scholar] [CrossRef]
  7. Lin, B.; Zheng, Q. Energy Efficiency Evolution of China’s Paper Industry. J. Clean. Prod. 2017, 140, 1105–1117. [Google Scholar] [CrossRef]
  8. Xu, G.; Schwarz, P.; Yang, H. Determining China’s CO2 Emissions Peak with a Dynamic Nonlinear Artificial Neural Network Approach and Scenario Analysis. Energy Policy 2019, 128, 752–762. [Google Scholar] [CrossRef]
  9. Wang, Y.; Chai, J.; Zhang, H.; Yang, B. Evaluating Construction Land Use Efficiency under Carbon Emission Constraints: A Comparative Study of China and the USA. Environ. Sci. Pollut. Res. 2022, 29, 49998–50009. [Google Scholar] [CrossRef] [PubMed]
  10. Yang, Q.; Pu, L.; Jiang, C.; Gong, G.; Tan, H.; Wang, X.; He, G. Unveiling the Spatial-Temporal Variation of Urban Land Use Efficiency of Yangtze River Economic Belt in China under Carbon Emission Constraints. Front. Environ. Sci. 2023, 10, 1096087. [Google Scholar] [CrossRef]
  11. Jiang, Y.; Zhang, Z.; Xie, G. Emission Reduction Effects of Vertical Environmental Regulation: Capacity Transfer or Energy Intensity Reduction? Evidence from a Quasi-Natural Experiment in China. J. Environ. Manag. 2022, 323, 116180. [Google Scholar] [CrossRef] [PubMed]
  12. Li, X.; Yang, L.; Zheng, H.; Shan, Y.; Zhang, Z.; Song, M.; Cai, B.; Guan, D. City-Level Water-Energy Nexus in Beijing-Tianjin-Hebei Region. Appl. Energy 2019, 235, 827–834. [Google Scholar] [CrossRef]
  13. Wei, H.; Zhang, Y. Analysis of Impact of Urbanization on Environmental Quality in China. China World Econ. 2017, 25, 85–106. Available online: https://onlinelibrary.wiley.com/doi/epdf/10.1111/cwe.12195 (accessed on 23 June 2025). [CrossRef]
  14. Ozcan, B.; Tzeremes, P.G.; Tzeremes, N.G. Energy Consumption, Economic Growth and Environmental Degradation in OECD Countries. Econ. Model. 2020, 84, 203–213. [Google Scholar] [CrossRef]
  15. Li, B.; Wang, Z.; Xu, F. Does Optimization of Industrial Structure Improve Green Efficiency of Industrial Land Use in China? Int. J. Environ. Res. Public Health 2022, 19, 9177. [Google Scholar] [CrossRef]
  16. Qiao, W.; Xie, Y.; Liu, J.; Huang, X. The Impacts of Urbanization on Carbon Emission Performance: New Evidence from the Yangtze River Delta Urban Agglomeration, China. Land 2024, 14, 12. [Google Scholar] [CrossRef]
  17. Zhang, Q.; Liu, S.; Niu, Y.; Hu, Y.; Li, L.; Cai, E.; Zhang, Y.; Zhao, M. Multi-Scenario Simulation of the Dynamic Relationship Between Land Use and Carbon Storage in the Urbanization Process: A Case Study of Zhengzhou, China. Land 2025, 14, 1227. [Google Scholar] [CrossRef]
  18. Liu, J.; Feng, H.; Wang, K. The Low-Carbon City Pilot Policy and Urban Land Use Efficiency: A Policy Assessment from China. Land 2022, 11, 604. [Google Scholar] [CrossRef]
  19. Xu, H.; Pan, X.; Guo, S.; Lu, Y. Forecasting Chinese CO2 Emission Using a Non-Linear Multi-Agent Intertemporal Optimization Model and Scenario Analysis. Energy 2021, 228, 120514. [Google Scholar] [CrossRef]
  20. Xia, H.; Ding, L.; Yang, S.; Wu, A. Socioeconomic Factors of Industrial Air Pollutants in Zhejiang Province, China: Decoupling and Decomposition Analysis. Environ. Sci. Pollut. Res. 2020, 27, 28247–28266. [Google Scholar] [CrossRef] [PubMed]
  21. Li, J.; Song, X.; Guo, Y.; Yang, Q.; Feng, K. The Determinants of China’s National and Regional Energy-Related Mercury Emission Changes. J. Environ. Manag. 2019, 246, 505–513. [Google Scholar] [CrossRef]
  22. Wang, J.; Zhang, X.; Yang, F.; Zhou, Q. Explore the Influence Mechanism of Carbon Emissions Decline on Energy Intensity with Two-Layer Factor Decomposition Method in Beijing-Tianjin-Hebei Region. Environ. Sci. Pollut. Res. 2019, 26, 4041–4055. [Google Scholar] [CrossRef] [PubMed]
  23. Li, T.; Wang, X.; Jia, H. Evaluate Water Yield and Soil Conservation and Their Environmental Gradient Effects in Fujian Province in South China Based on InVEST and Geodetector Models. Water 2025, 17, 230. [Google Scholar] [CrossRef]
  24. Zhou, Y.; Chen, T.; Wang, J.; Xu, X. Analyzing the Factors Driving the Changes of Ecosystem Service Value in the Liangzi Lake Basin—A GeoDetector-Based Application. Sustainability 2023, 15, 15763. [Google Scholar] [CrossRef]
  25. Gan, L.; Halik, Ü.; Shi, L.; Ru, J.; Wei, Z.; Li, J.; Welp, M. Integrating Multi-Source Data to Explore Spatiotemporal Dynamics and Future Scenarios of Arid Urban Agglomerations: A Geodetector–PLUS Modelling Framework for Sustainable Land Use Planning. Remote Sens. 2025, 17, 1851. [Google Scholar] [CrossRef]
  26. Zhang, S.; Zhou, Y.; Yu, Y.; Li, F.; Zhang, R.; Li, W. Using the Geodetector Method to Characterize the Spatiotemporal Dynamics of Vegetation and Its Interaction with Environmental Factors in the Qinba Mountains, China. Remote Sens. 2022, 14, 5794. [Google Scholar] [CrossRef]
  27. Lei, K.; Li, Y.; Zhang, Y.; Wang, S.; Yu, E.; Li, F.; Xiao, F.; Shi, Z.; Xia, F. Machine Learning Combined with Geodetector Quantifies the Synergistic Effect of Environmental Factors on Soil Heavy Metal Pollution. Environ. Sci. Pollut. Res. 2023, 30, 126148–126164. [Google Scholar] [CrossRef] [PubMed]
  28. Shi, S.; Peng, S.; Lin, Z.; Huang, B.; Ma, D.; Zhu, Z.; Zhu, Y.; Zhang, R.; Li, T. Analysis of the Spatial Pattern and Causes of Ecological Environmental Quality in Myanmar Based on the RSEI Model and the Geodetector-GCCM Method. Front. Environ. Sci. 2025, 13, 1514008. [Google Scholar] [CrossRef]
  29. Liang, L.; Wang, Z.; Li, J. The Effect of Urbanization on Environmental Pollution in Rapidly Developing Urban Agglomerations. J. Clean. Prod. 2019, 237, 117649. [Google Scholar] [CrossRef]
  30. Zhang, K.; Xu, D.; Li, S. The Impact of Environmental Regulation on Environmental Pollution in China: An Empirical Study Based on the Synergistic Effect of Industrial Agglomeration. Environ. Sci. Pollut. Res. 2019, 26, 25775–25788. [Google Scholar] [CrossRef]
  31. Shan, Y.; Huang, Q.; Guan, D.; Hubacek, K. China CO2 Emission Accounts 2016–2017. Sci. Data 2020, 7, 54. [Google Scholar] [CrossRef]
  32. Kuang, B.; Lu, X.; Zhou, M.; Chen, D. Provincial Cultivated Land Use Efficiency in China: Empirical Analysis Based on the SBM-DEA Model with Carbon Emissions Considered. Technol. Forecast. Soc. Change 2020, 151, 119874. [Google Scholar] [CrossRef]
  33. Xu, J.; Dong, Y.; Xie, L.; Chen, S. The Pollution Haven Strikes Back?—Evidence from Air Quality Daily Variation in the Jing-Jin-Ji Region of China. Environ. Sci. Policy 2022, 138, 105–121. [Google Scholar] [CrossRef]
  34. Huang, P.; Westman, L. China’s Imaginary of Ecological Civilization: A Resonance between the State-Led Discourse and Sociocultural Dynamics. Energy Res. Soc. Sci. 2021, 81, 102253. [Google Scholar] [CrossRef]
  35. Yi, L.; Bai, N.; Yang, L.; Li, Z.; Wang, F. Evaluation on the Effectiveness of China’s Pilot Carbon Market Policy. J. Clean. Prod. 2020, 246, 119039. [Google Scholar] [CrossRef]
  36. Lin, W.; Huang, J. Impacts of Agricultural Incentive Policies on Land Rental Prices: New Evidence from China. Food Policy 2021, 104, 102125. [Google Scholar] [CrossRef]
  37. Zeng, C.; Deng, X.; Dong, J.; Hu, P. Urbanization and Sustainability: Comparison of the Processes in “BIC” Countries. Sustainability 2016, 8, 400. [Google Scholar] [CrossRef]
  38. Ma, L. Inter-Provincial Power Transmission and Its Embodied Carbon Flow in China: Uneven Green Energy Transition Road to East and West. Energies 2021, 15, 176. [Google Scholar] [CrossRef]
  39. Qian, Y.; Cao, H.; Huang, S. Decoupling and Decomposition Analysis of Industrial Sulfur Dioxide Emissions from the Industrial Economy in 30 Chinese Provinces. J. Environ. Manag. 2020, 260, 110142. [Google Scholar] [CrossRef]
  40. Meng, S.; Siriwardana, M.; McNeill, J.; Nelson, T. The Impact of an ETS on the Australian Energy Sector: An Integrated CGE and Electricity Modelling Approach. Energy Econ. 2018, 69, 213–224. [Google Scholar] [CrossRef]
  41. Zeng, X.; Xiang, H.; Xue, Y.; Su, Y.; Tong, Y.; Mao, Z. A Scenario-Based Optimization Frame to Adjust Current Strategy for Population- Economy-Resource-Environment Harmony in an Urban Agglomeration, China. Sustain. Cities Soc. 2021, 67, 102710. [Google Scholar] [CrossRef]
  42. Yang, W.; Xu, Q.; Yi, S.; Shankar, R.; Chen, T. Enhancing Transit-Oriented Development Sustainability through the Integrated Node-Place-Ecology (NPE) Model. Transp. Res. Part D Transp. Environ. 2024, 136, 104456. [Google Scholar] [CrossRef]
Figure 1. An overview of the study area.
Land 14 01573 g001
Figure 2. Research framework and related indicators based on EBM-DEA model.
Land 14 01573 g002
Figure 3. Statistical analysis of input variables: (a) total investment in fixed assets; (b) local environmental expenditures; (c) forestry investments; (d) energy industry investment.
Land 14 01573 g003
Figure 4. Statistical analysis of output variables: (a) forest cover; (b) carbon dioxide emissions (not aspirational); (c) value added of secondary and tertiary industries; (d) built-up area; (e) green space per capita.
Land 14 01573 g004
Figure 5. Heat map for clustering of changes in LUEE value.
Land 14 01573 g005
Figure 6. Geographical distribution of land use environmental efficiency in China: (a) distribution of spatial features of total efficiency in 2011; (b) spatial distribution features of total efficiency in 2014; (c) geographical distribution of total efficiency in 2017; (d) spatial distribution characteristics of total efficiency in 2021.
Land 14 01573 g006aLand 14 01573 g006b
Figure 7. Kernel density plot of land use environmental efficiency.
Land 14 01573 g007
Figure 8. The detection results for each driving factor: (a) energy consumption; (b) economic development; (c) industrial upgrading; (d) population size; (e) urban expansion.
Land 14 01573 g008
Figure 9. Driver interaction probe results: (a) whole nation; (b) eastern region; (c) central region; (d) western region.
Land 14 01573 g009aLand 14 01573 g009b
Table 1. Index system.
Variable AttributeVariablesUnitMeaning
InputTotal investment in fixed assetsCNY 108 The monetary value associated with the workload of fixed asset building and acquisition activities
Local environmental expenditure CNY 108 The expenditure of funds for environmental protection activities of local governments
Forestry investmentCNY 108 Activities that put factors into forestry production
Energy industry investment CNY 108 The activity of investing elements into energy production
Forest cover%Forest area/total land area
Undesirable outputCarbon dioxide emissionCNY 104 Carbon dioxide emissions
Desirable outputValue added of secondary and tertiary industriesCNY 108 The total value added of the tertiary and secondary industries
Desirable outputBuilt-up areaSquare kilometersActual developed and built-up area within the city’s administrative district, reflecting the degree of urbanization
Desirable outputParkland per capitaSquare meters/personThe amount of parkland per capita occupied by urban residents, reflecting their enjoyment of green space
Table 2. The driving factor interprets the force probe results.
Energy ConsumptionEconomic DevelopmentIndustrial UpgradingPopulation SizeUrban Expansion
Whole nationq statistic0.1820.0700.1370.0210.204
p value0.0000.0470.0130.0440.000
Eastern regionq statistic0.1830.0520.1190.0250.175
p value0.0000.1060.0180.1970.000
Central regionq statistic0.1900.0310.0740.0260.185
p value0.0000.0810.2030.0110.010
Western regionq statistic0.1130.0920.0680.0530.161
p value0.0000.0450.1620.0390.013
Disclaimer/Publisher’s Note: The statements, opinions and data contained in all publications are solely those of the individual author(s) and contributor(s) and not of MDPI and/or the editor(s). MDPI and/or the editor(s) disclaim responsibility for any injury to people or property resulting from any ideas, methods, instructions or products referred to in the content.

