

Revealing the Ecological Security Pattern in China’s Ecological Civilization Demonstration Area
Abstract
1. Introduction
2. Materials and Methods
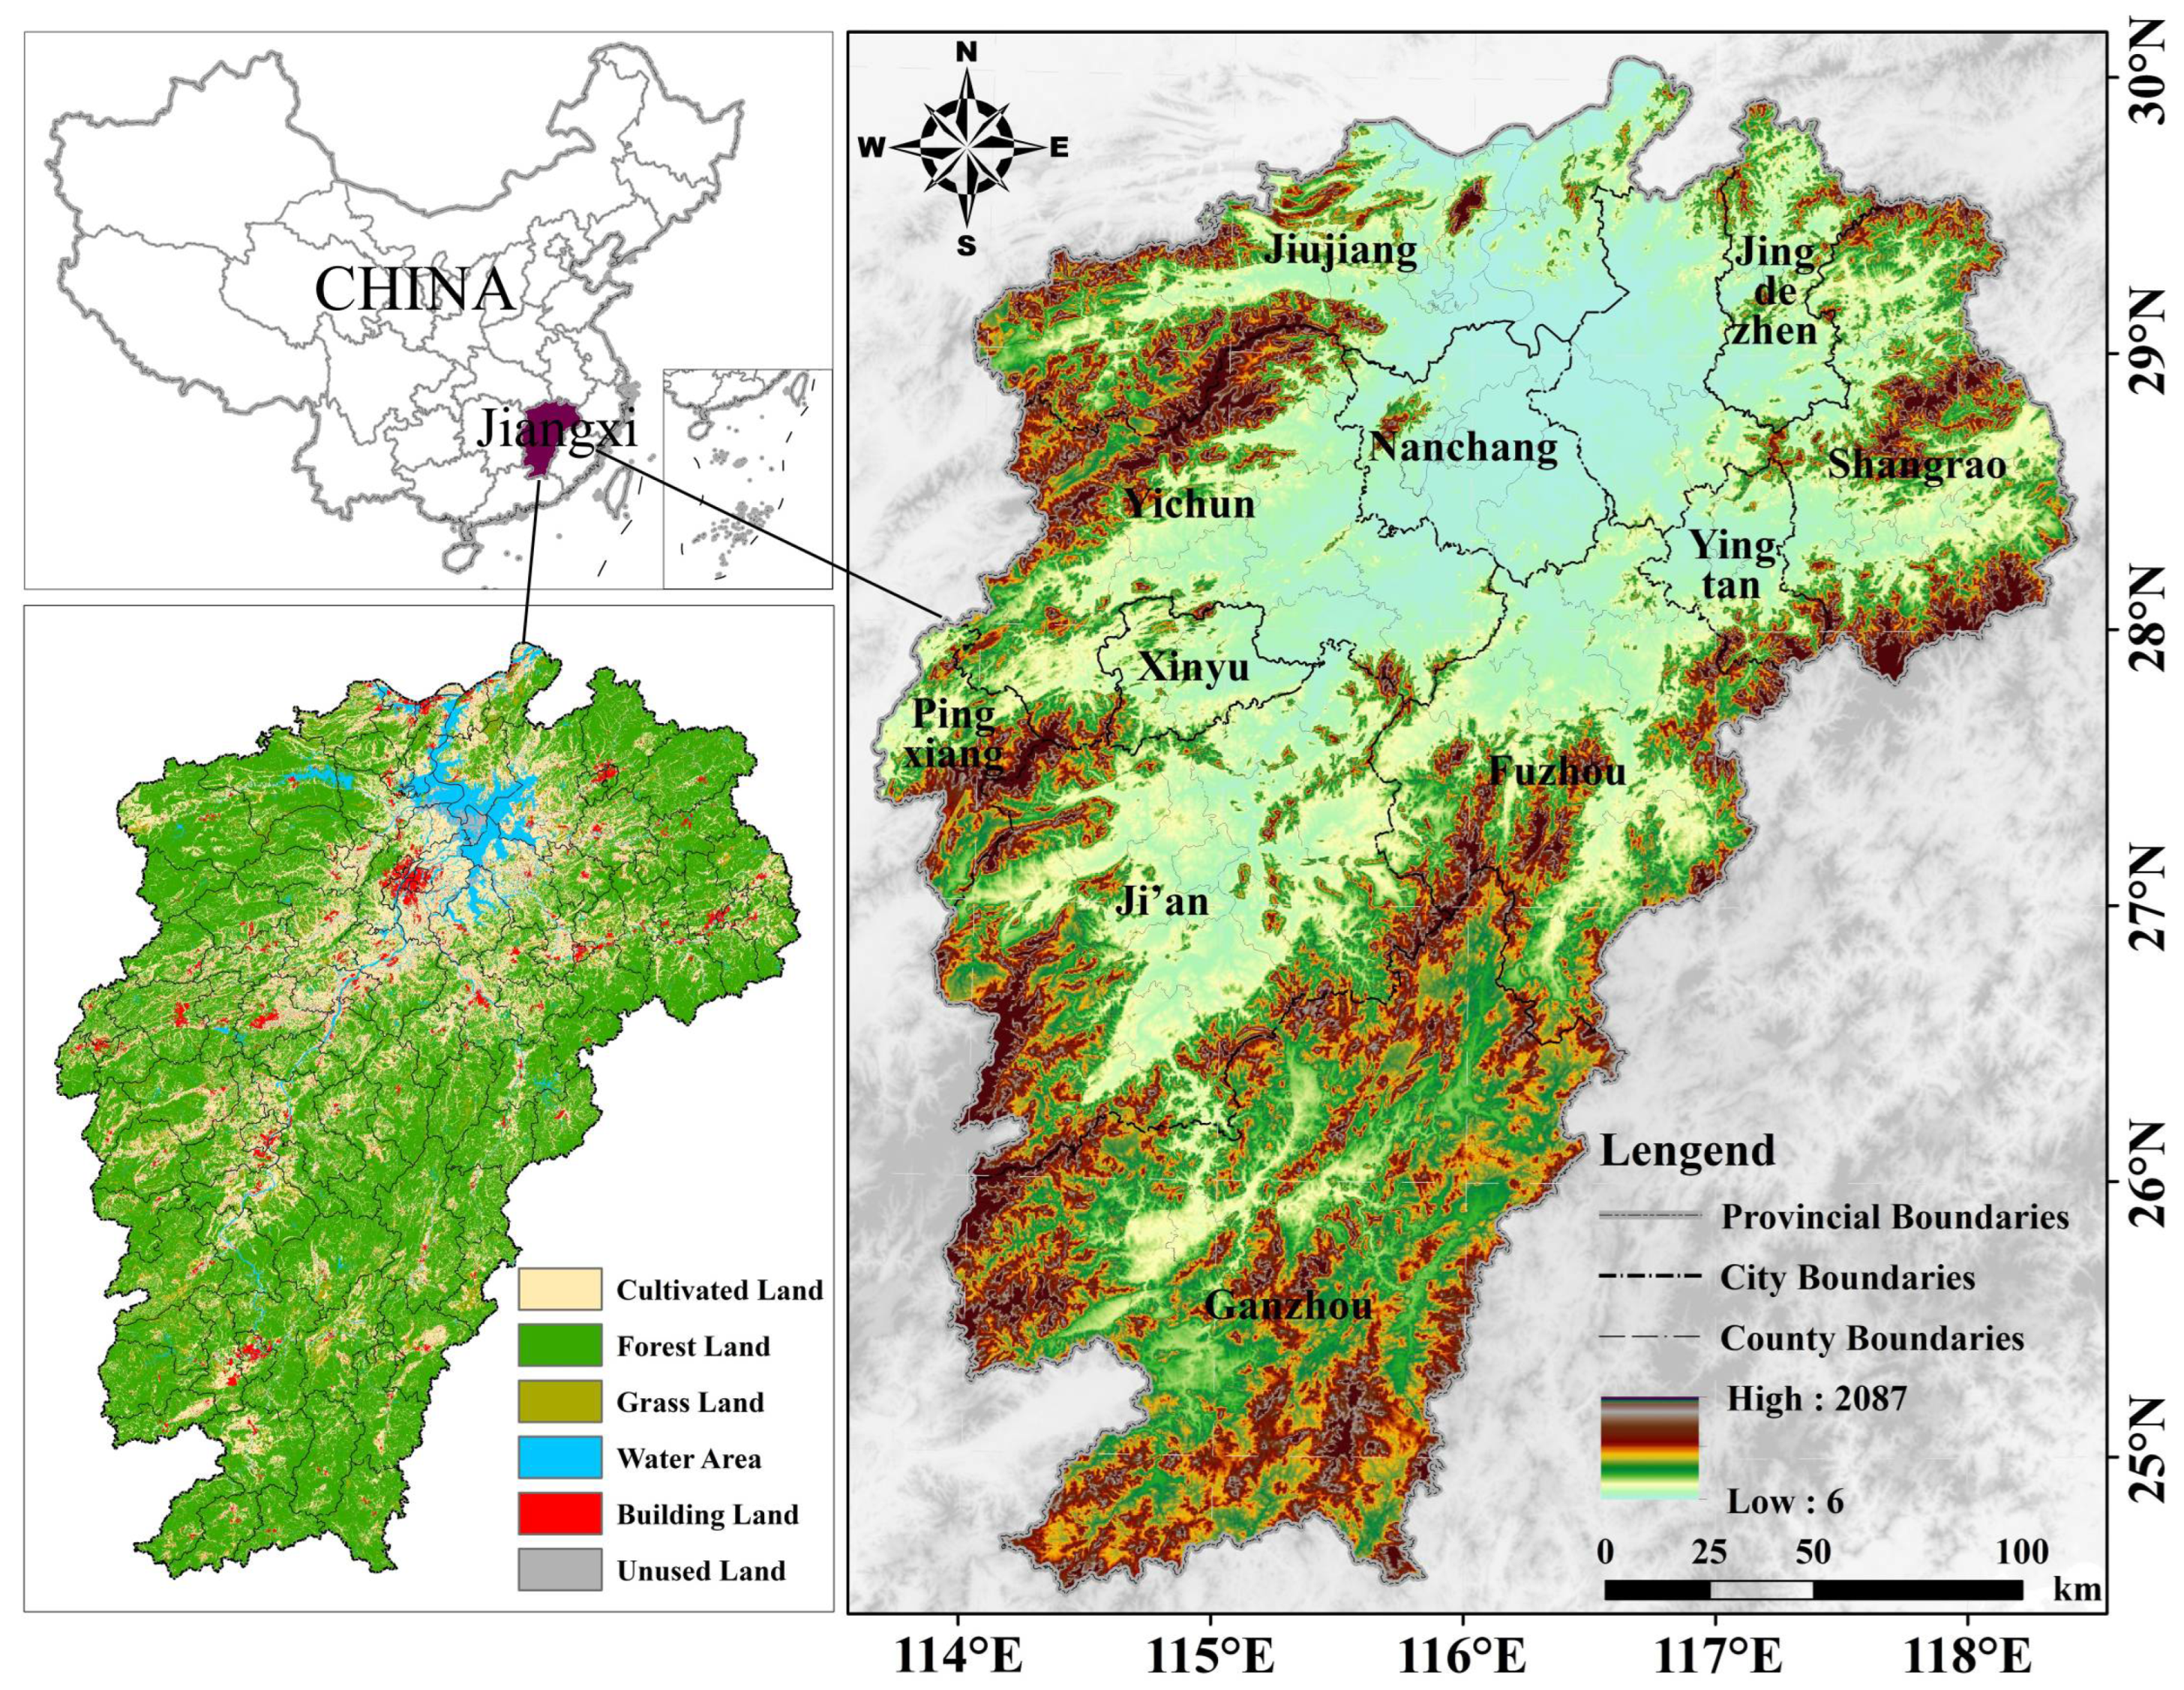
2.1. Study Area
2.2. Data Sources
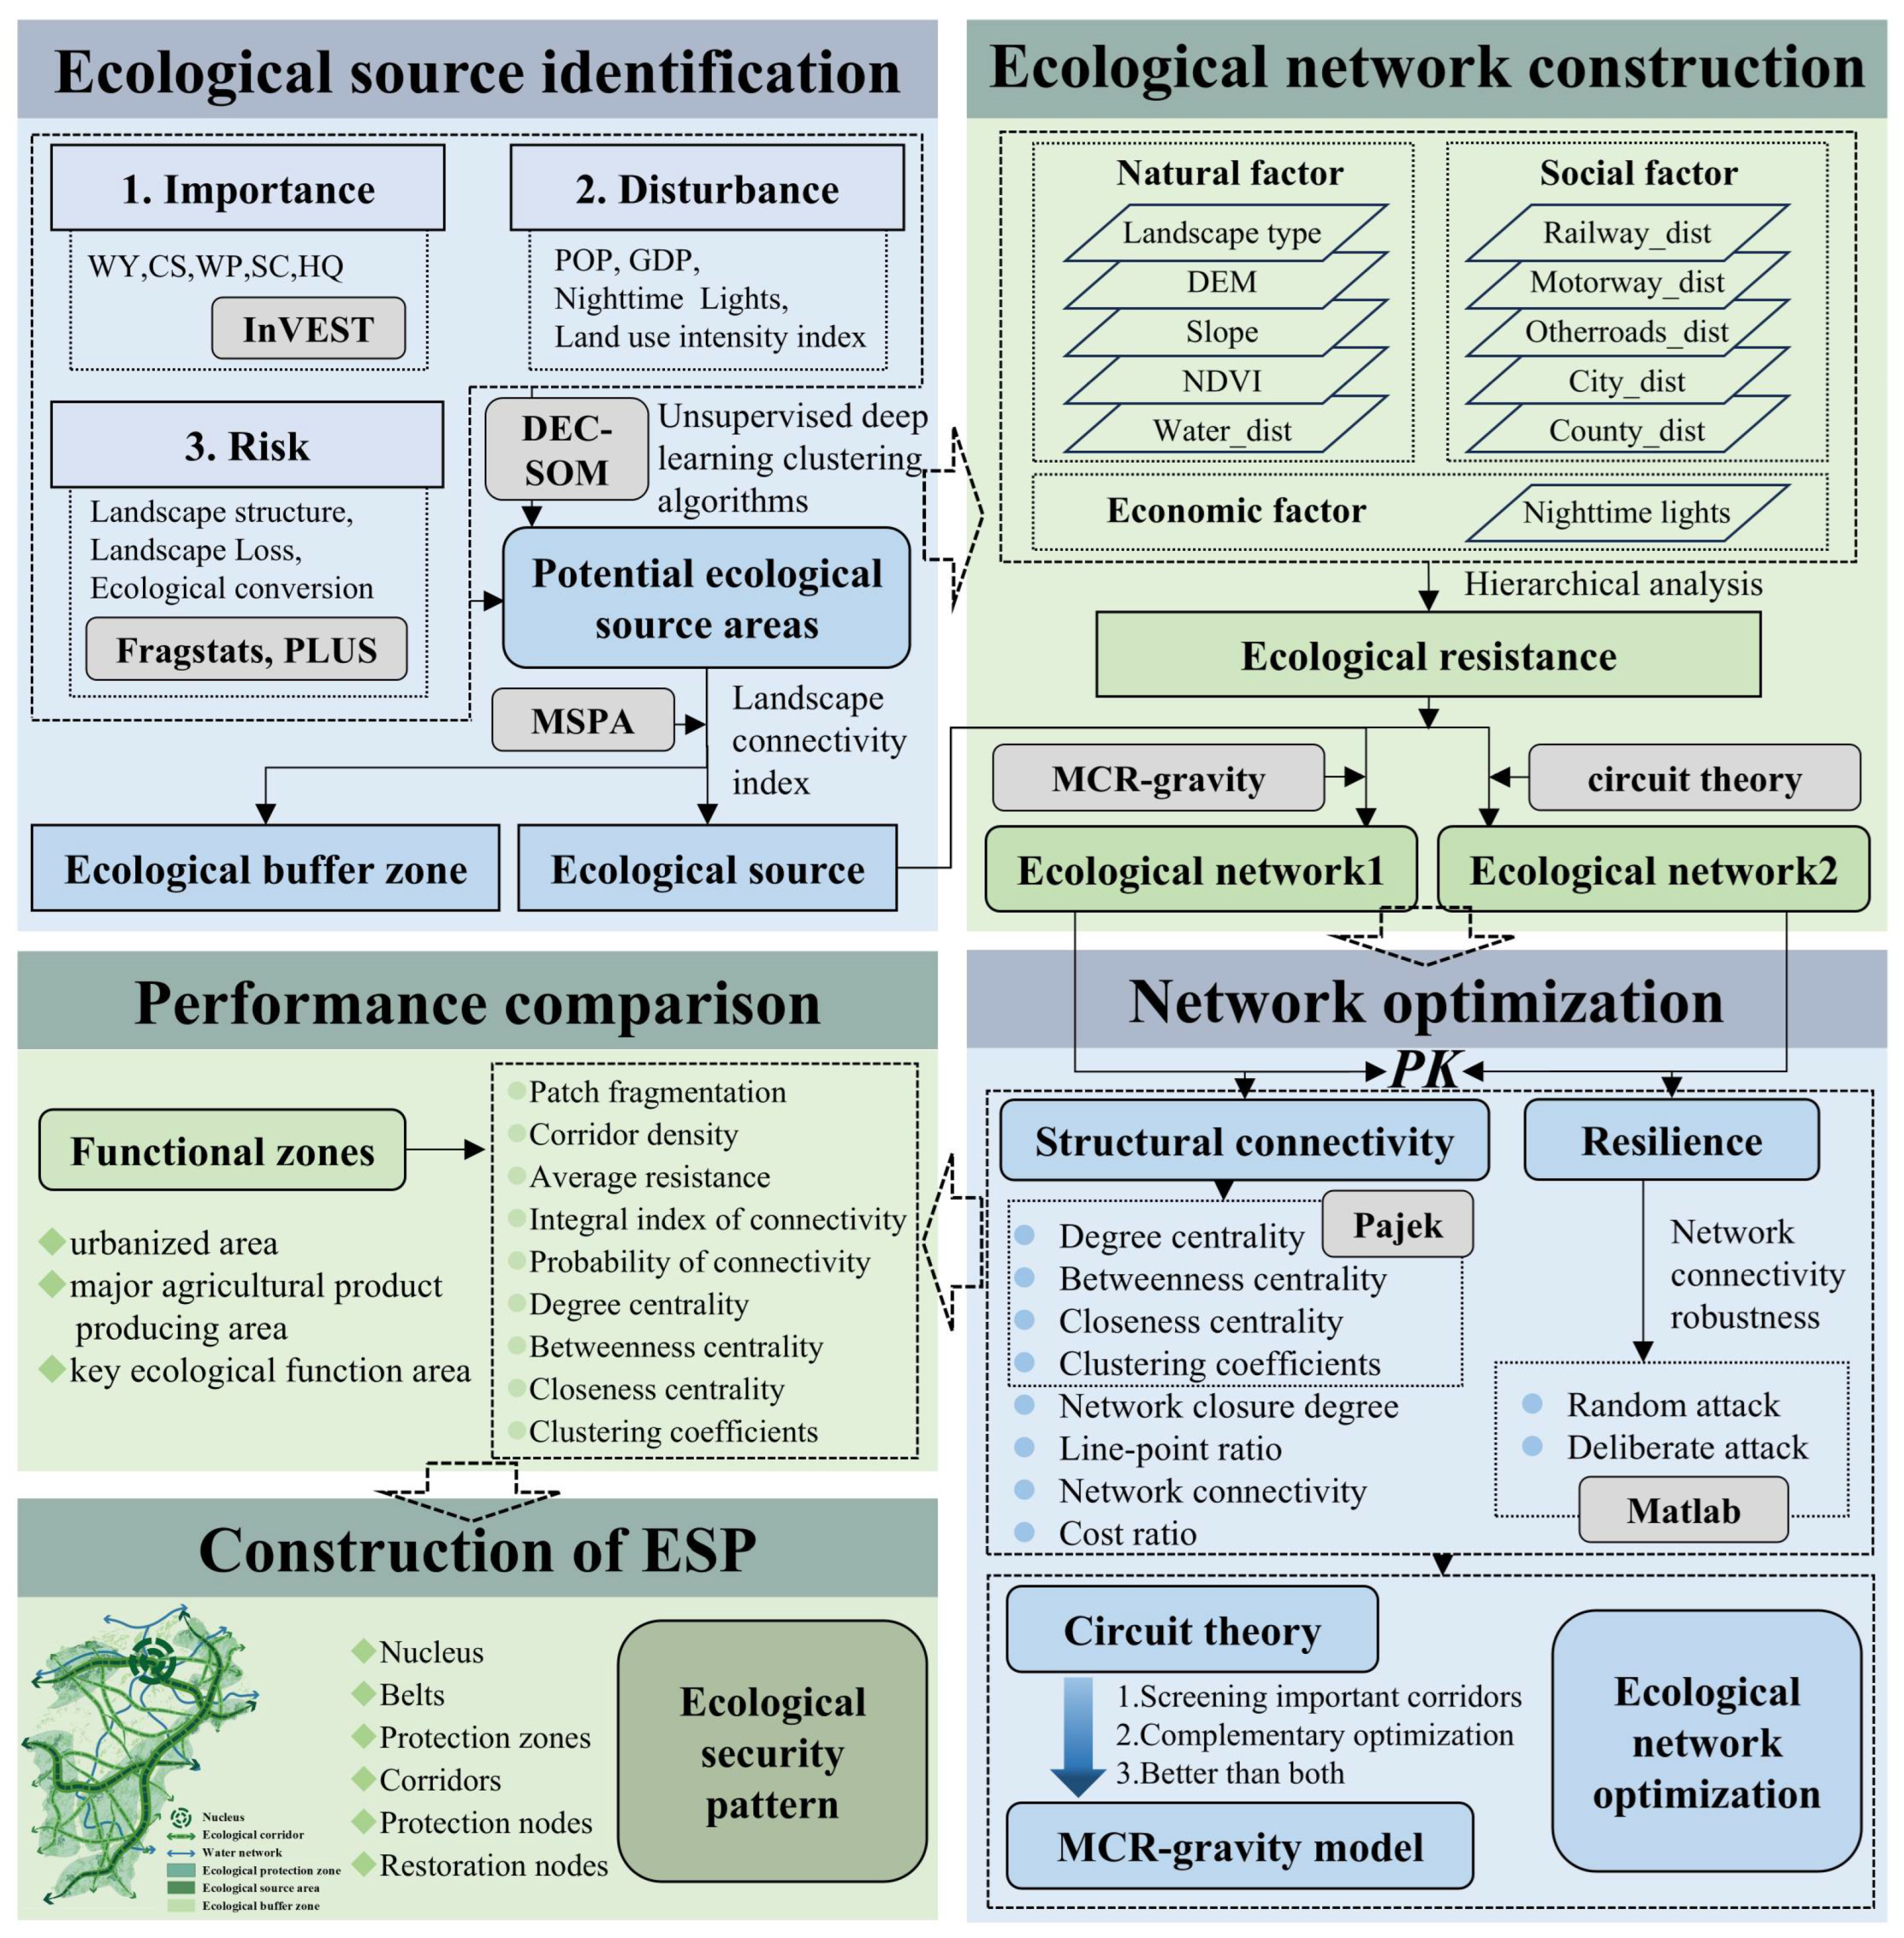
2.3. Methods
2.3.1. Ecological Source Analysis
- Importance assessment
- 2.
- Disturbance assessment
- 3.
- Risk assessment
- 4.
- Deep embedded clustering–self-organizing map (DEC–SOM)
- 5.
- Morphological spatial pattern analysis (MSPA)
- 6.
- Landscape connectivity analysis
2.3.2. EN Construction
- Analysis of resistance
- 2.
- MCR gravity model
- 3.
- Circuit theory
2.3.3. Comparison of ENs
- Structural connectivity analysis
- 2.
- Resilience analysis
3. Results
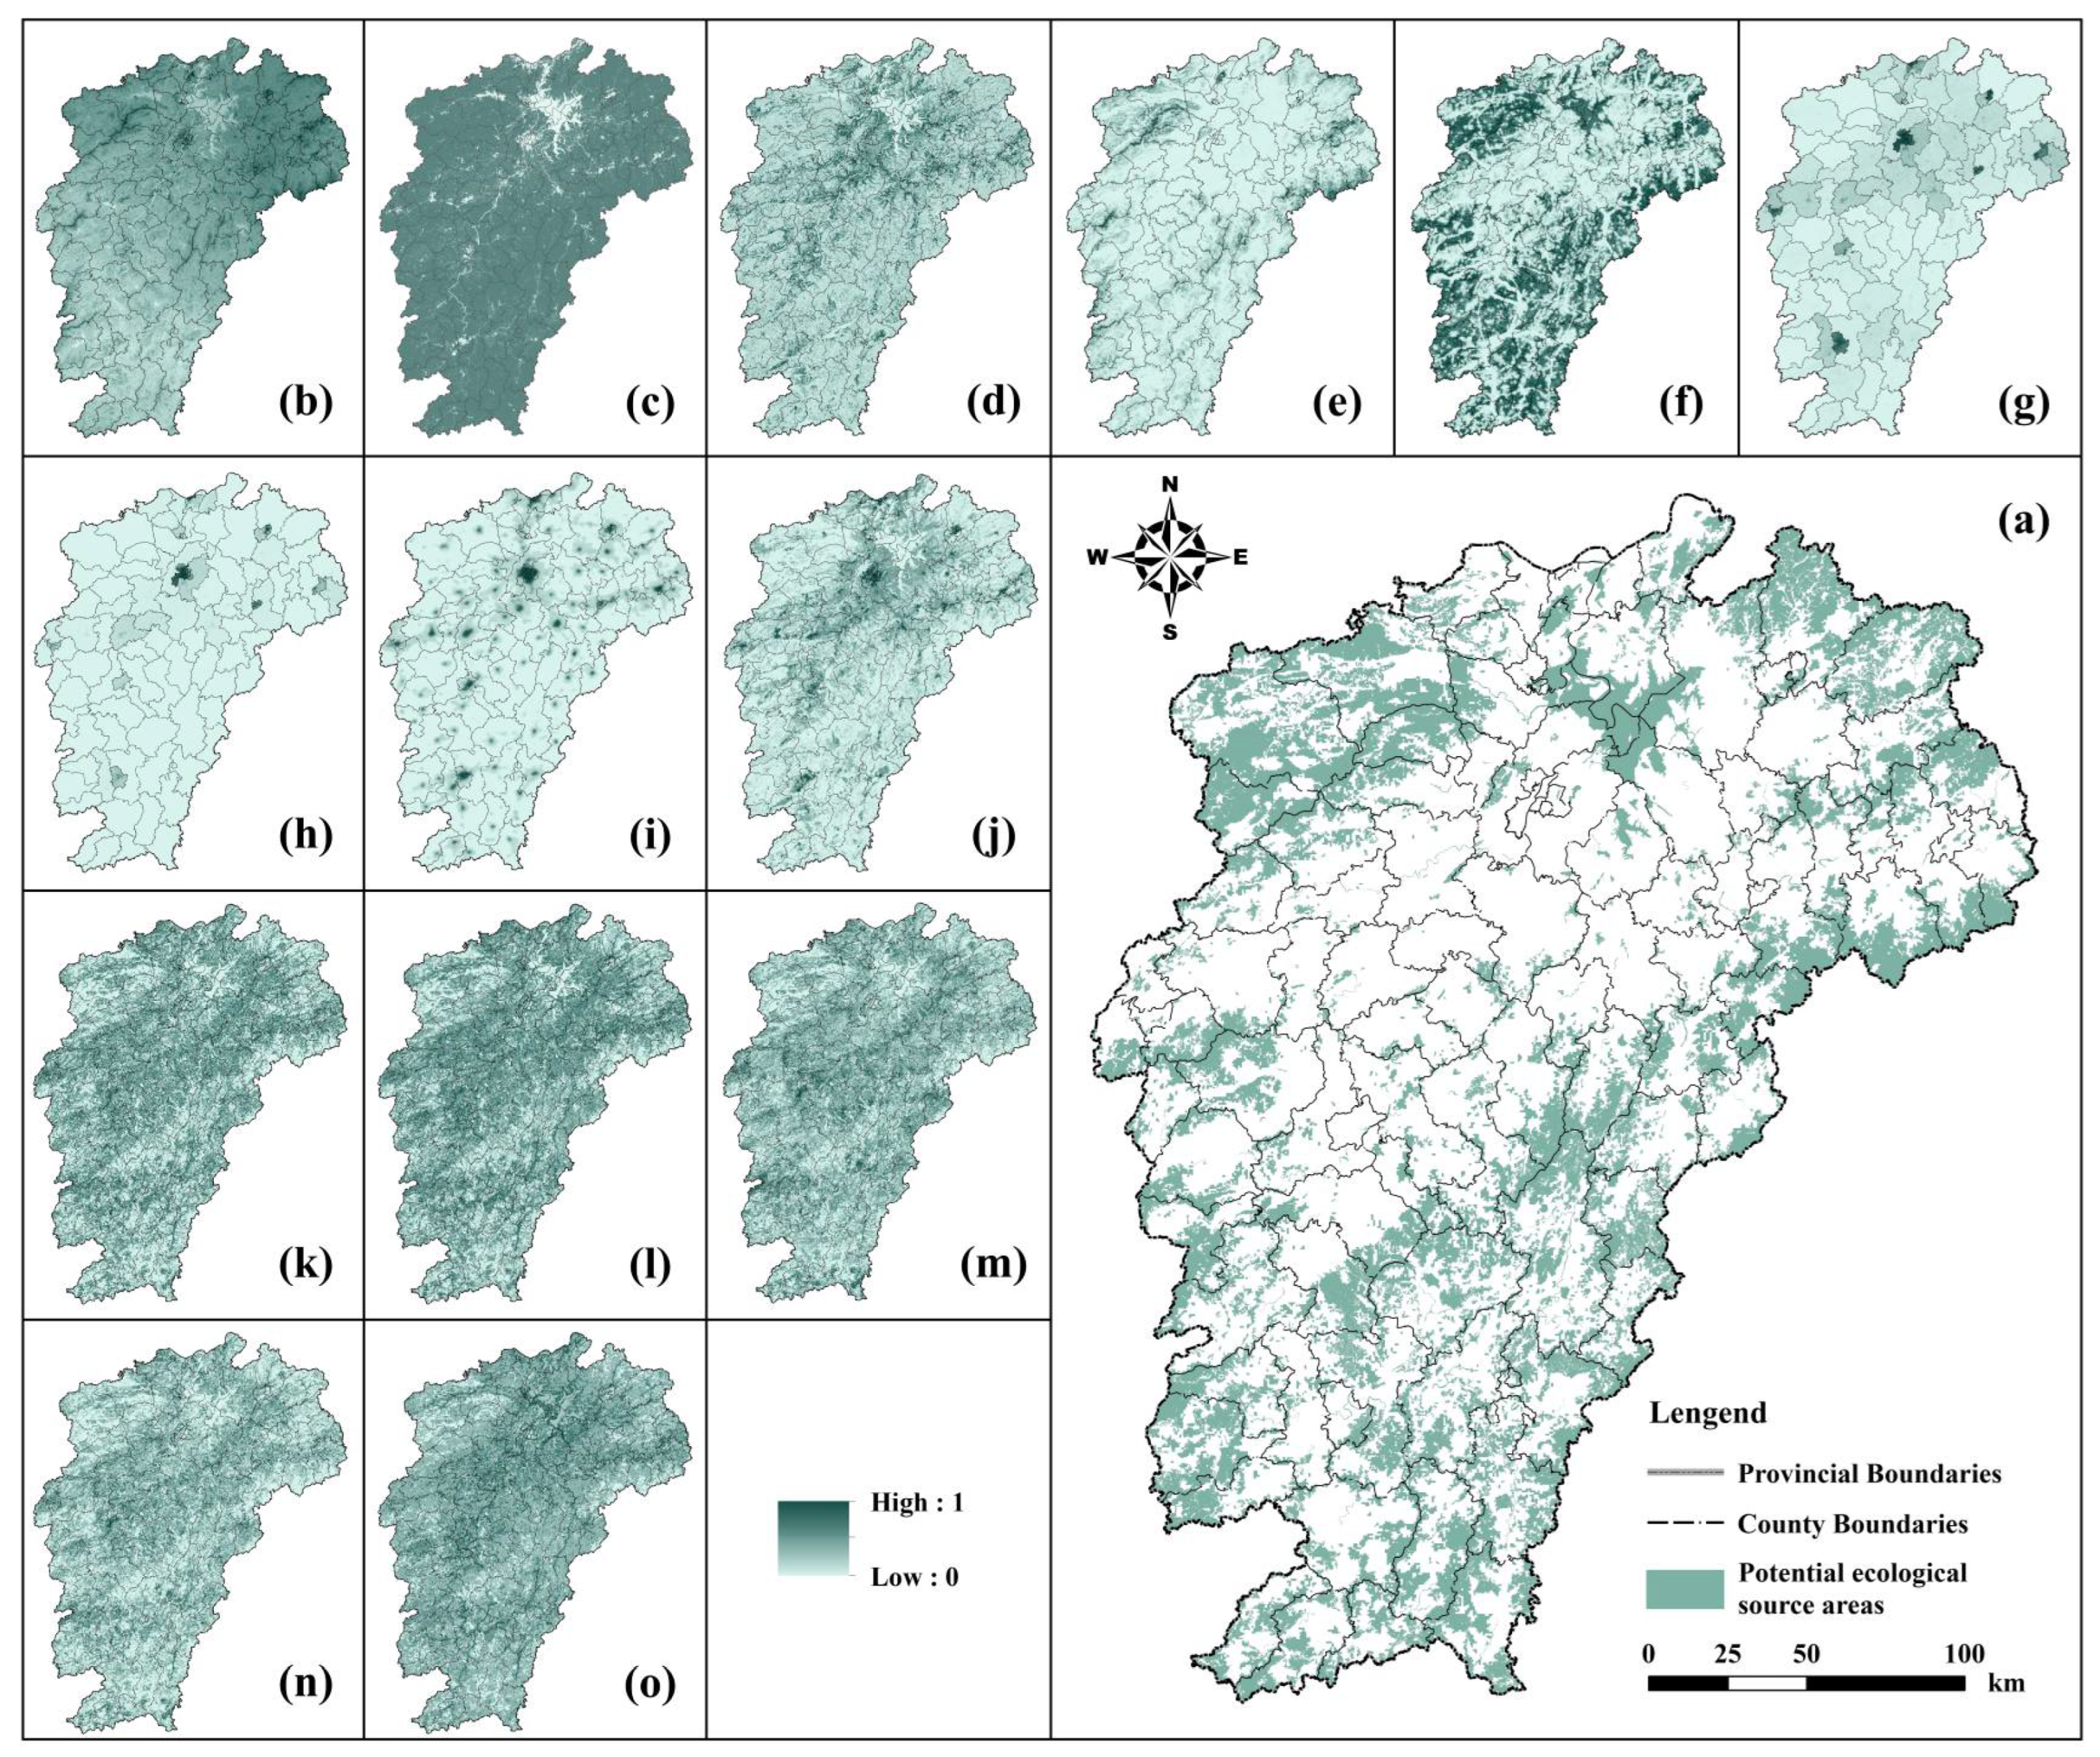
3.1. Ecological Source Area Identification on the Basis of ‘Importance-Disturbance-Risk’
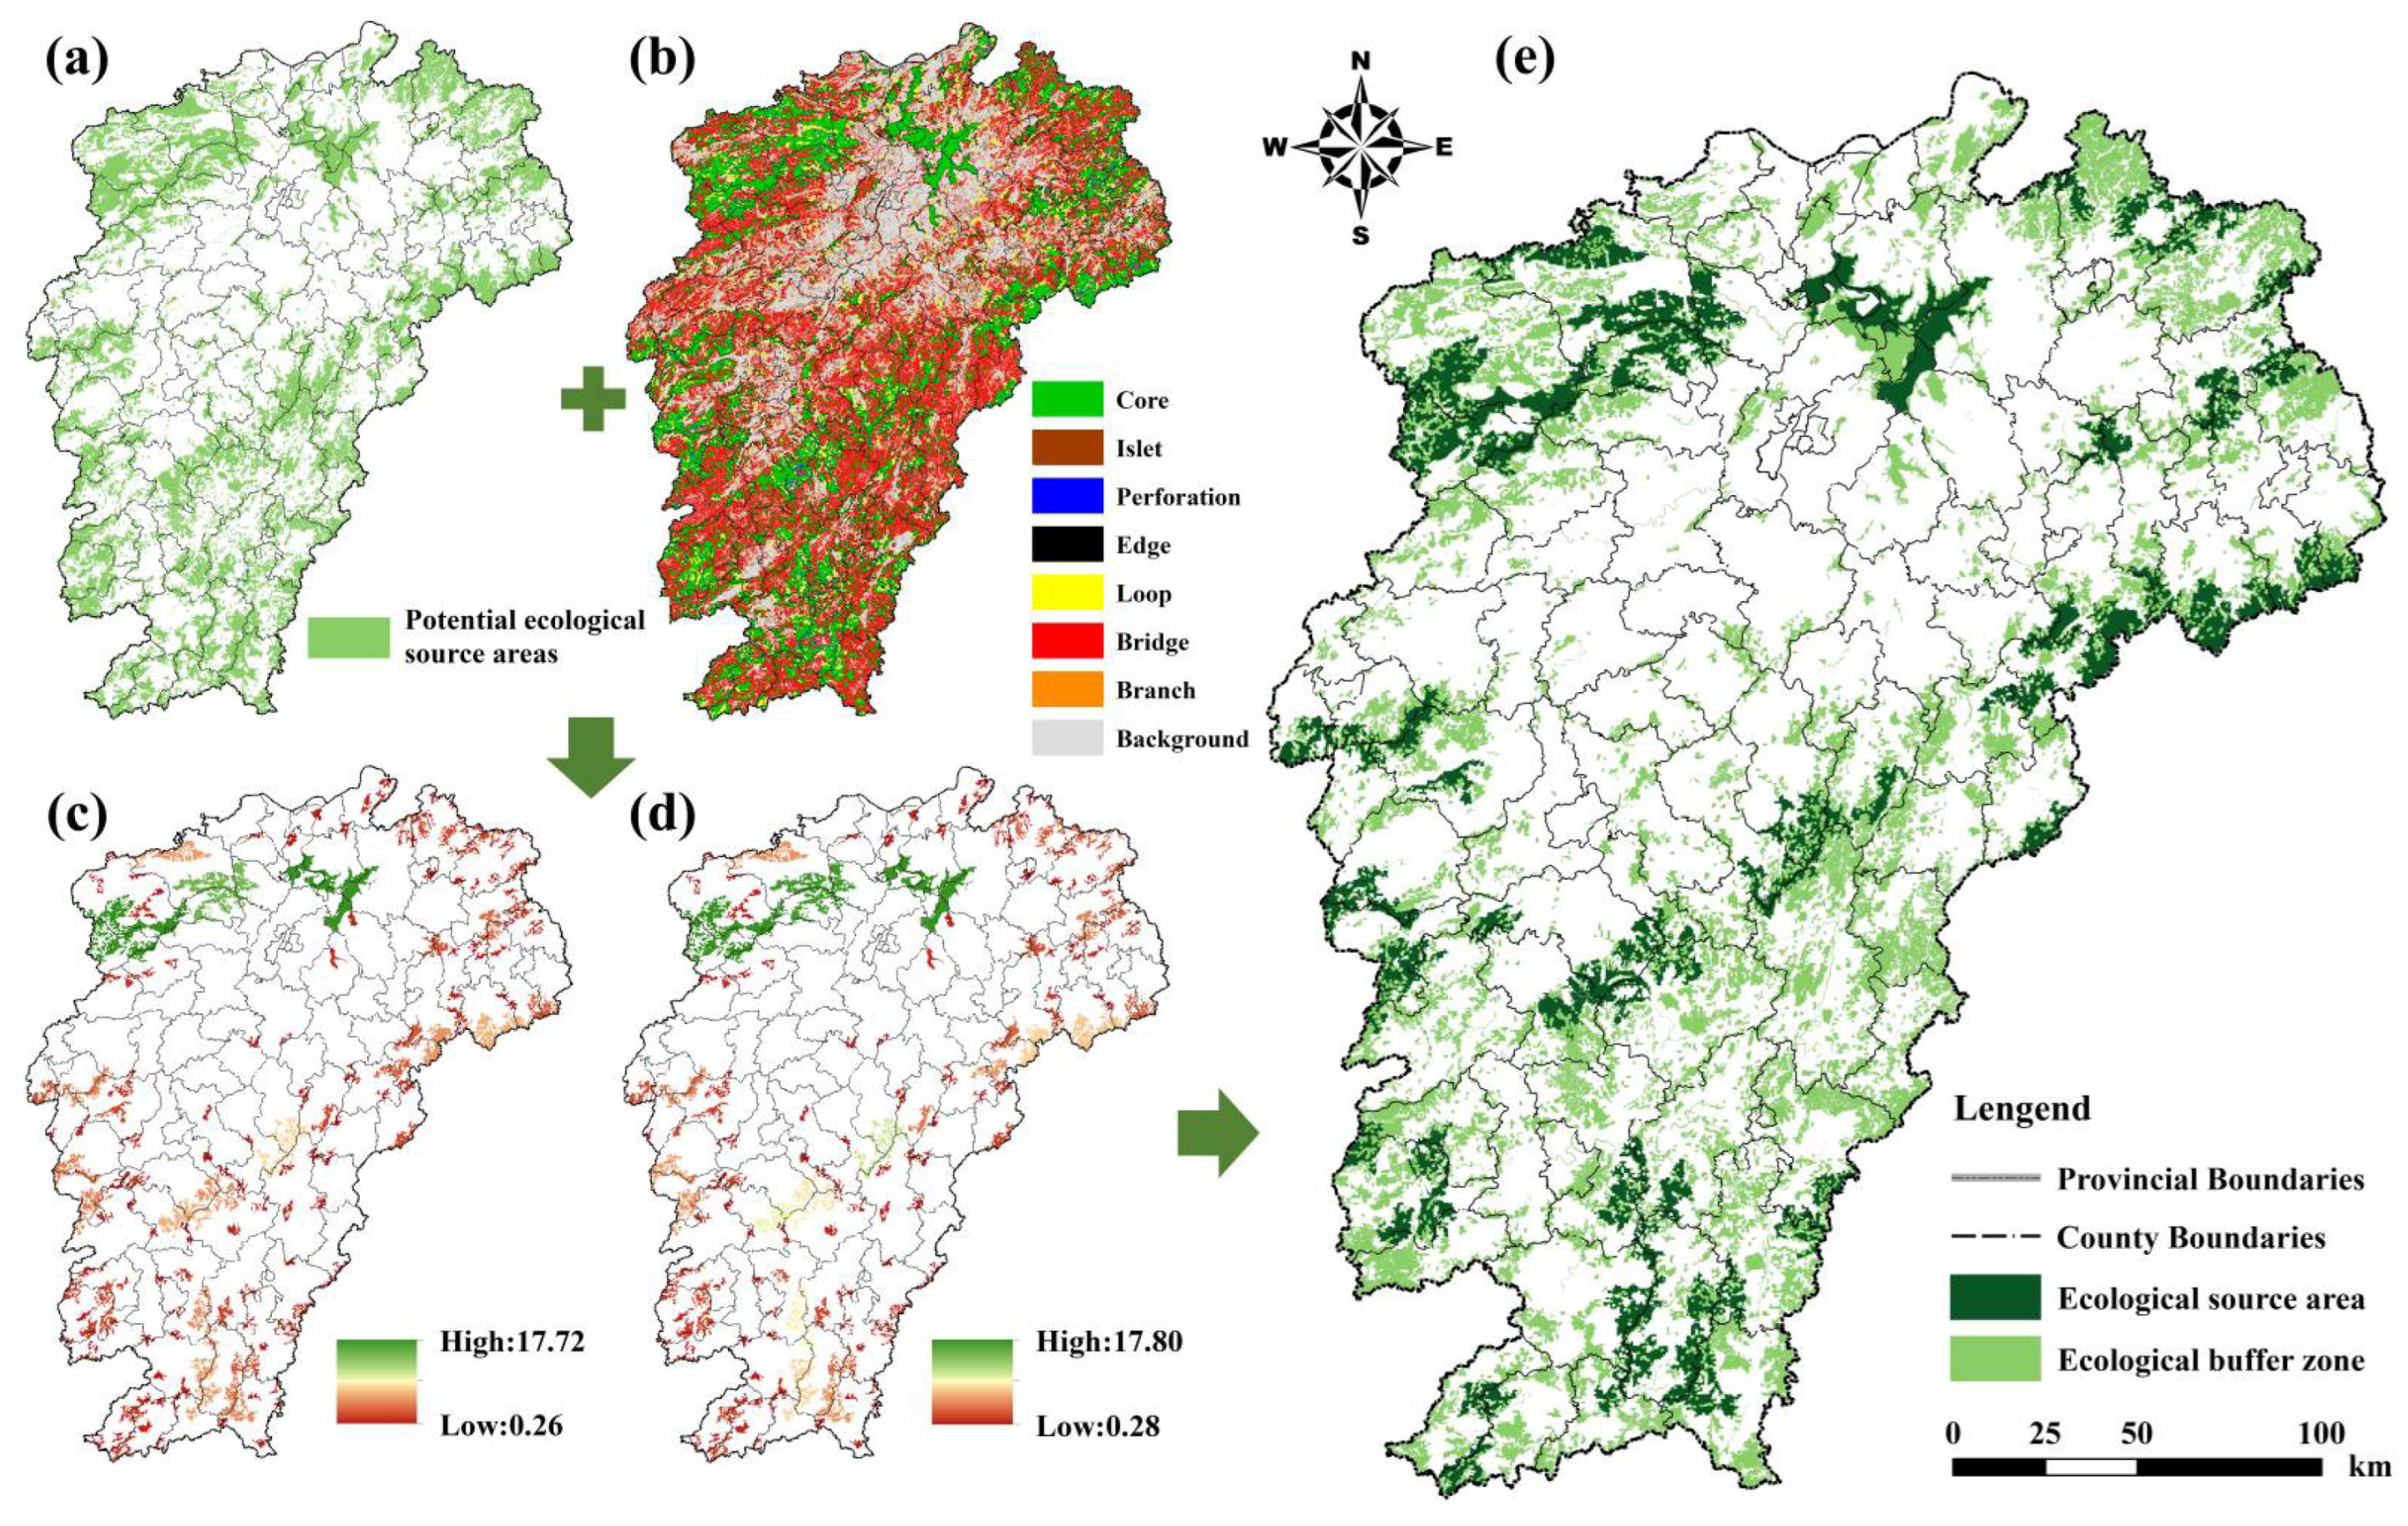
3.1.1. Identification of Potential Ecological Source Areas
3.1.2. Ecological Source Extraction Analysis
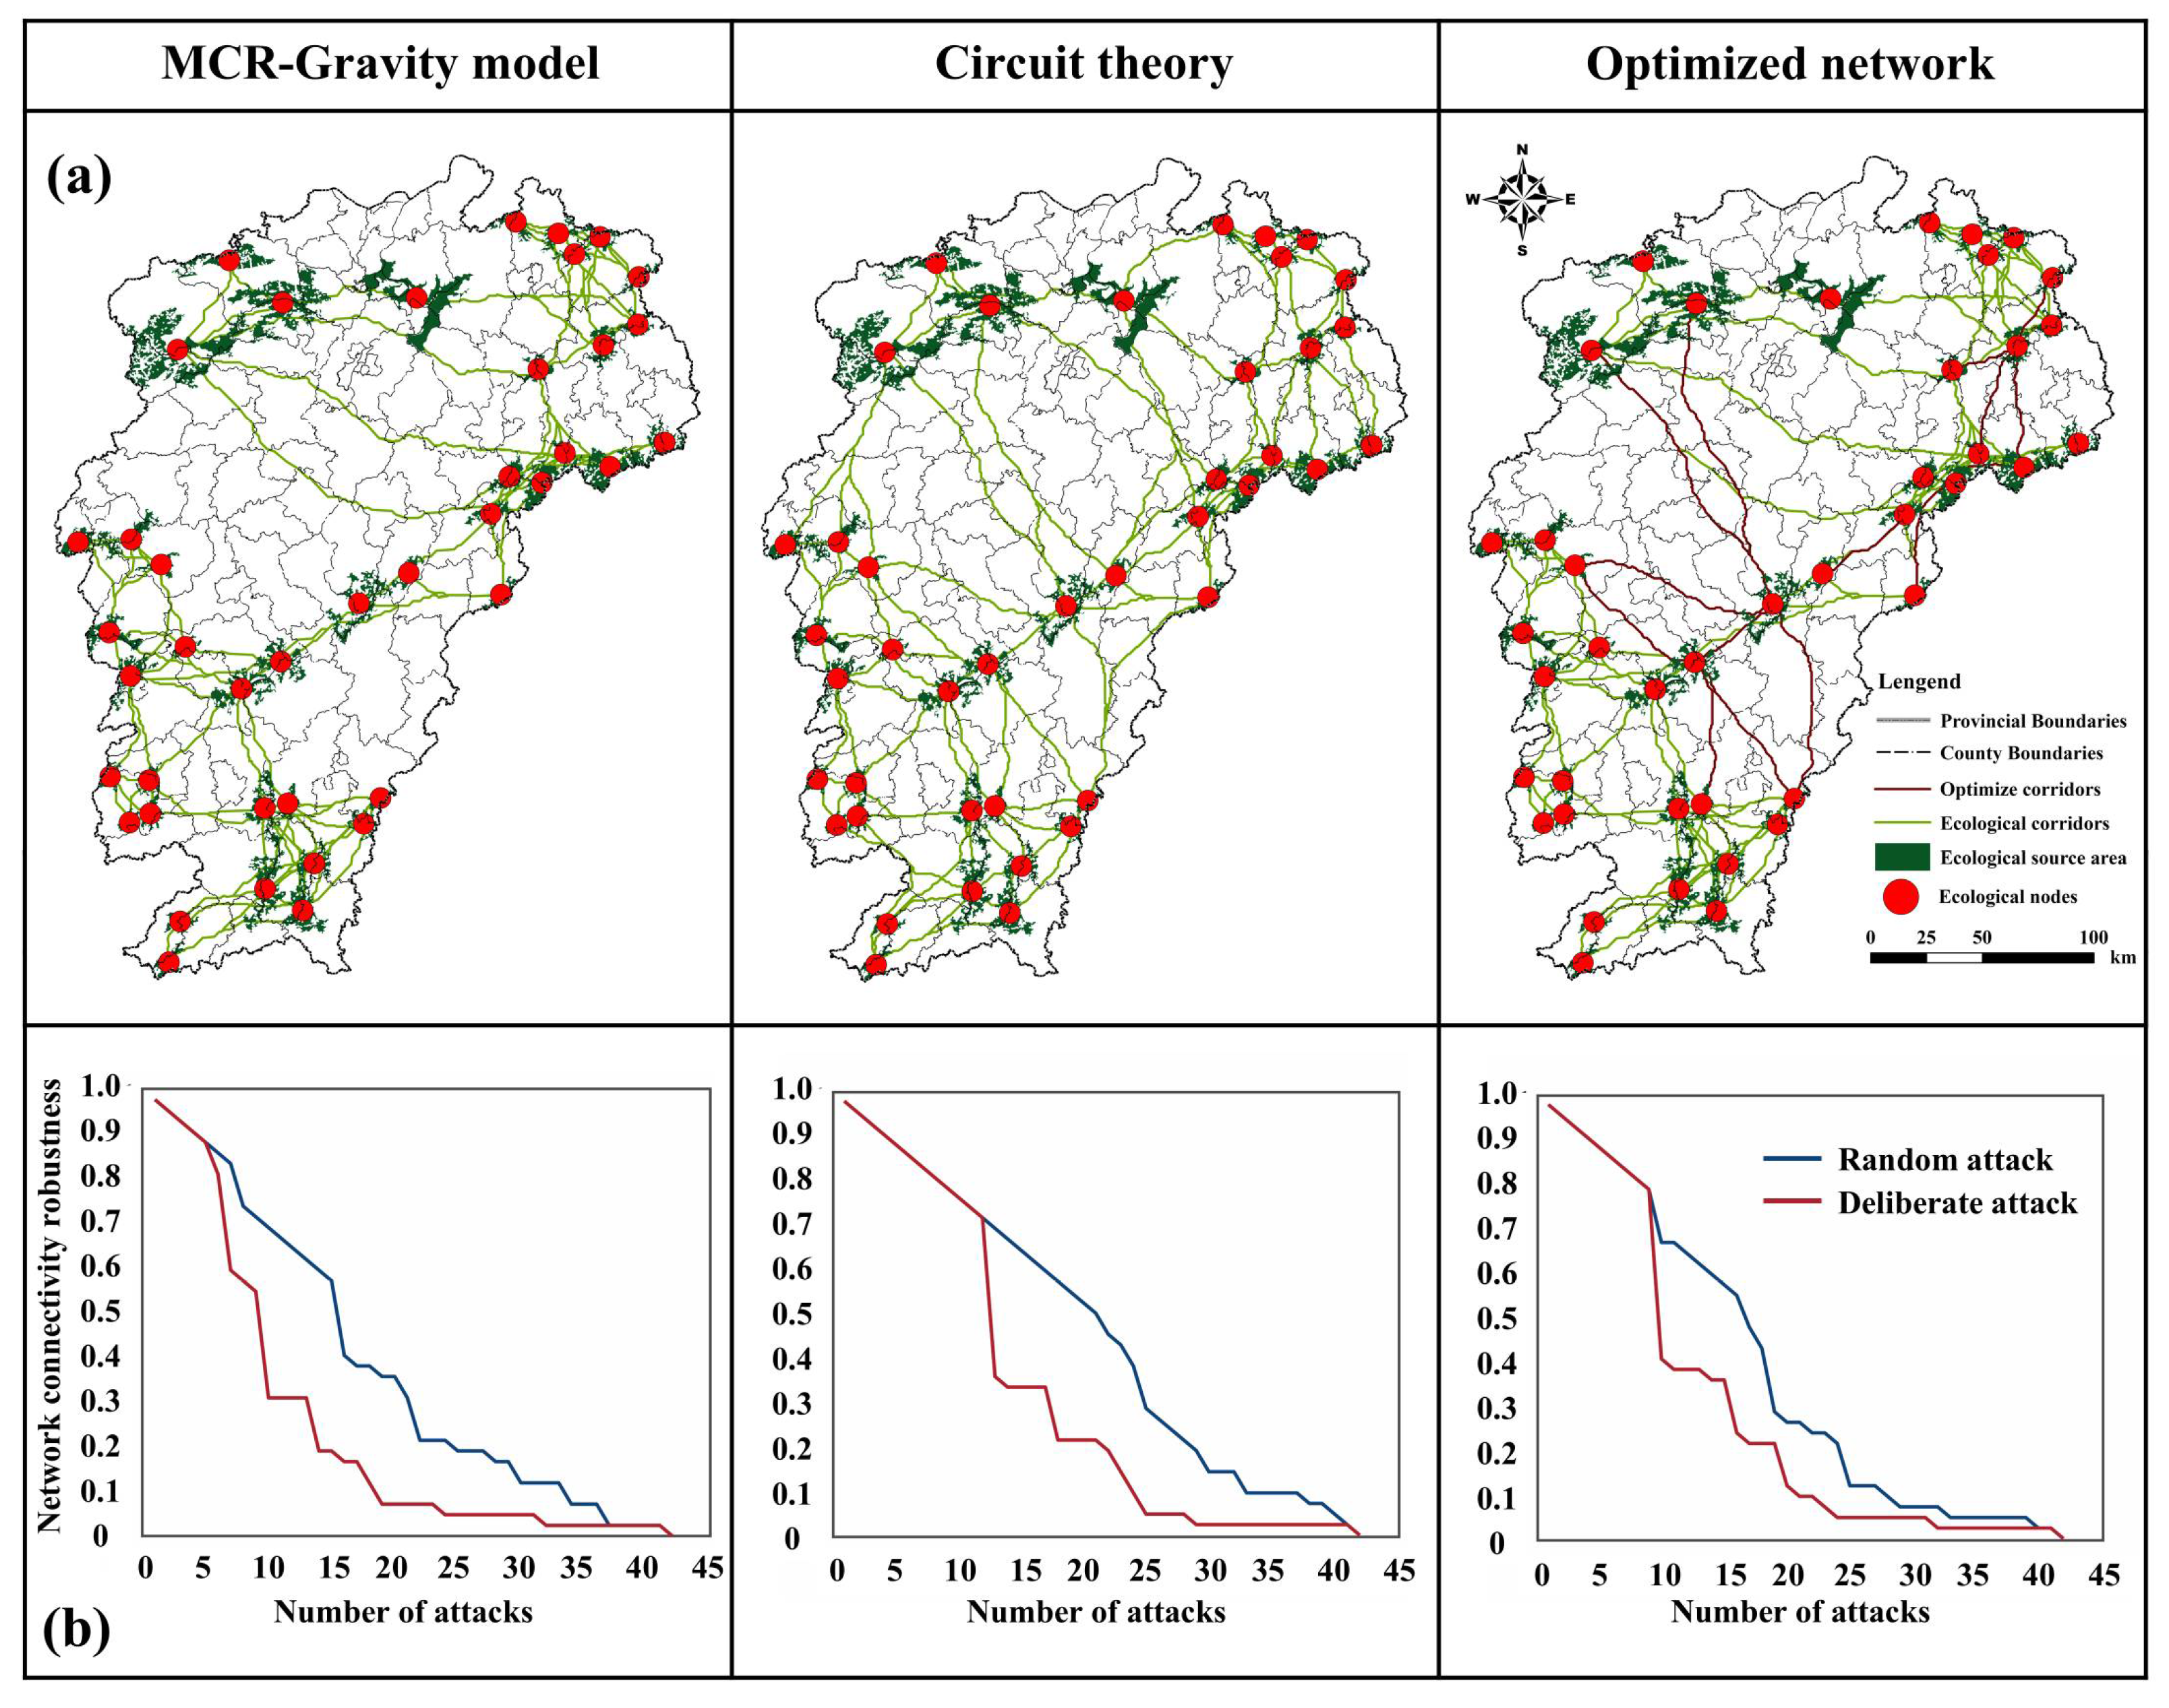
3.2. Establishment of Ecological Corridors via the MCR Gravity Model and Circuit Theory
3.2.1. Ecological Resistance Analysis
3.2.2. Ecological Corridor Analysis
- Constructing corridors via the MCR gravity model
- 2.
- Constructing corridors based on circuit theory
3.3. Comparative Analysis of ENs on the Basis of Structural Connectivity and Resilience
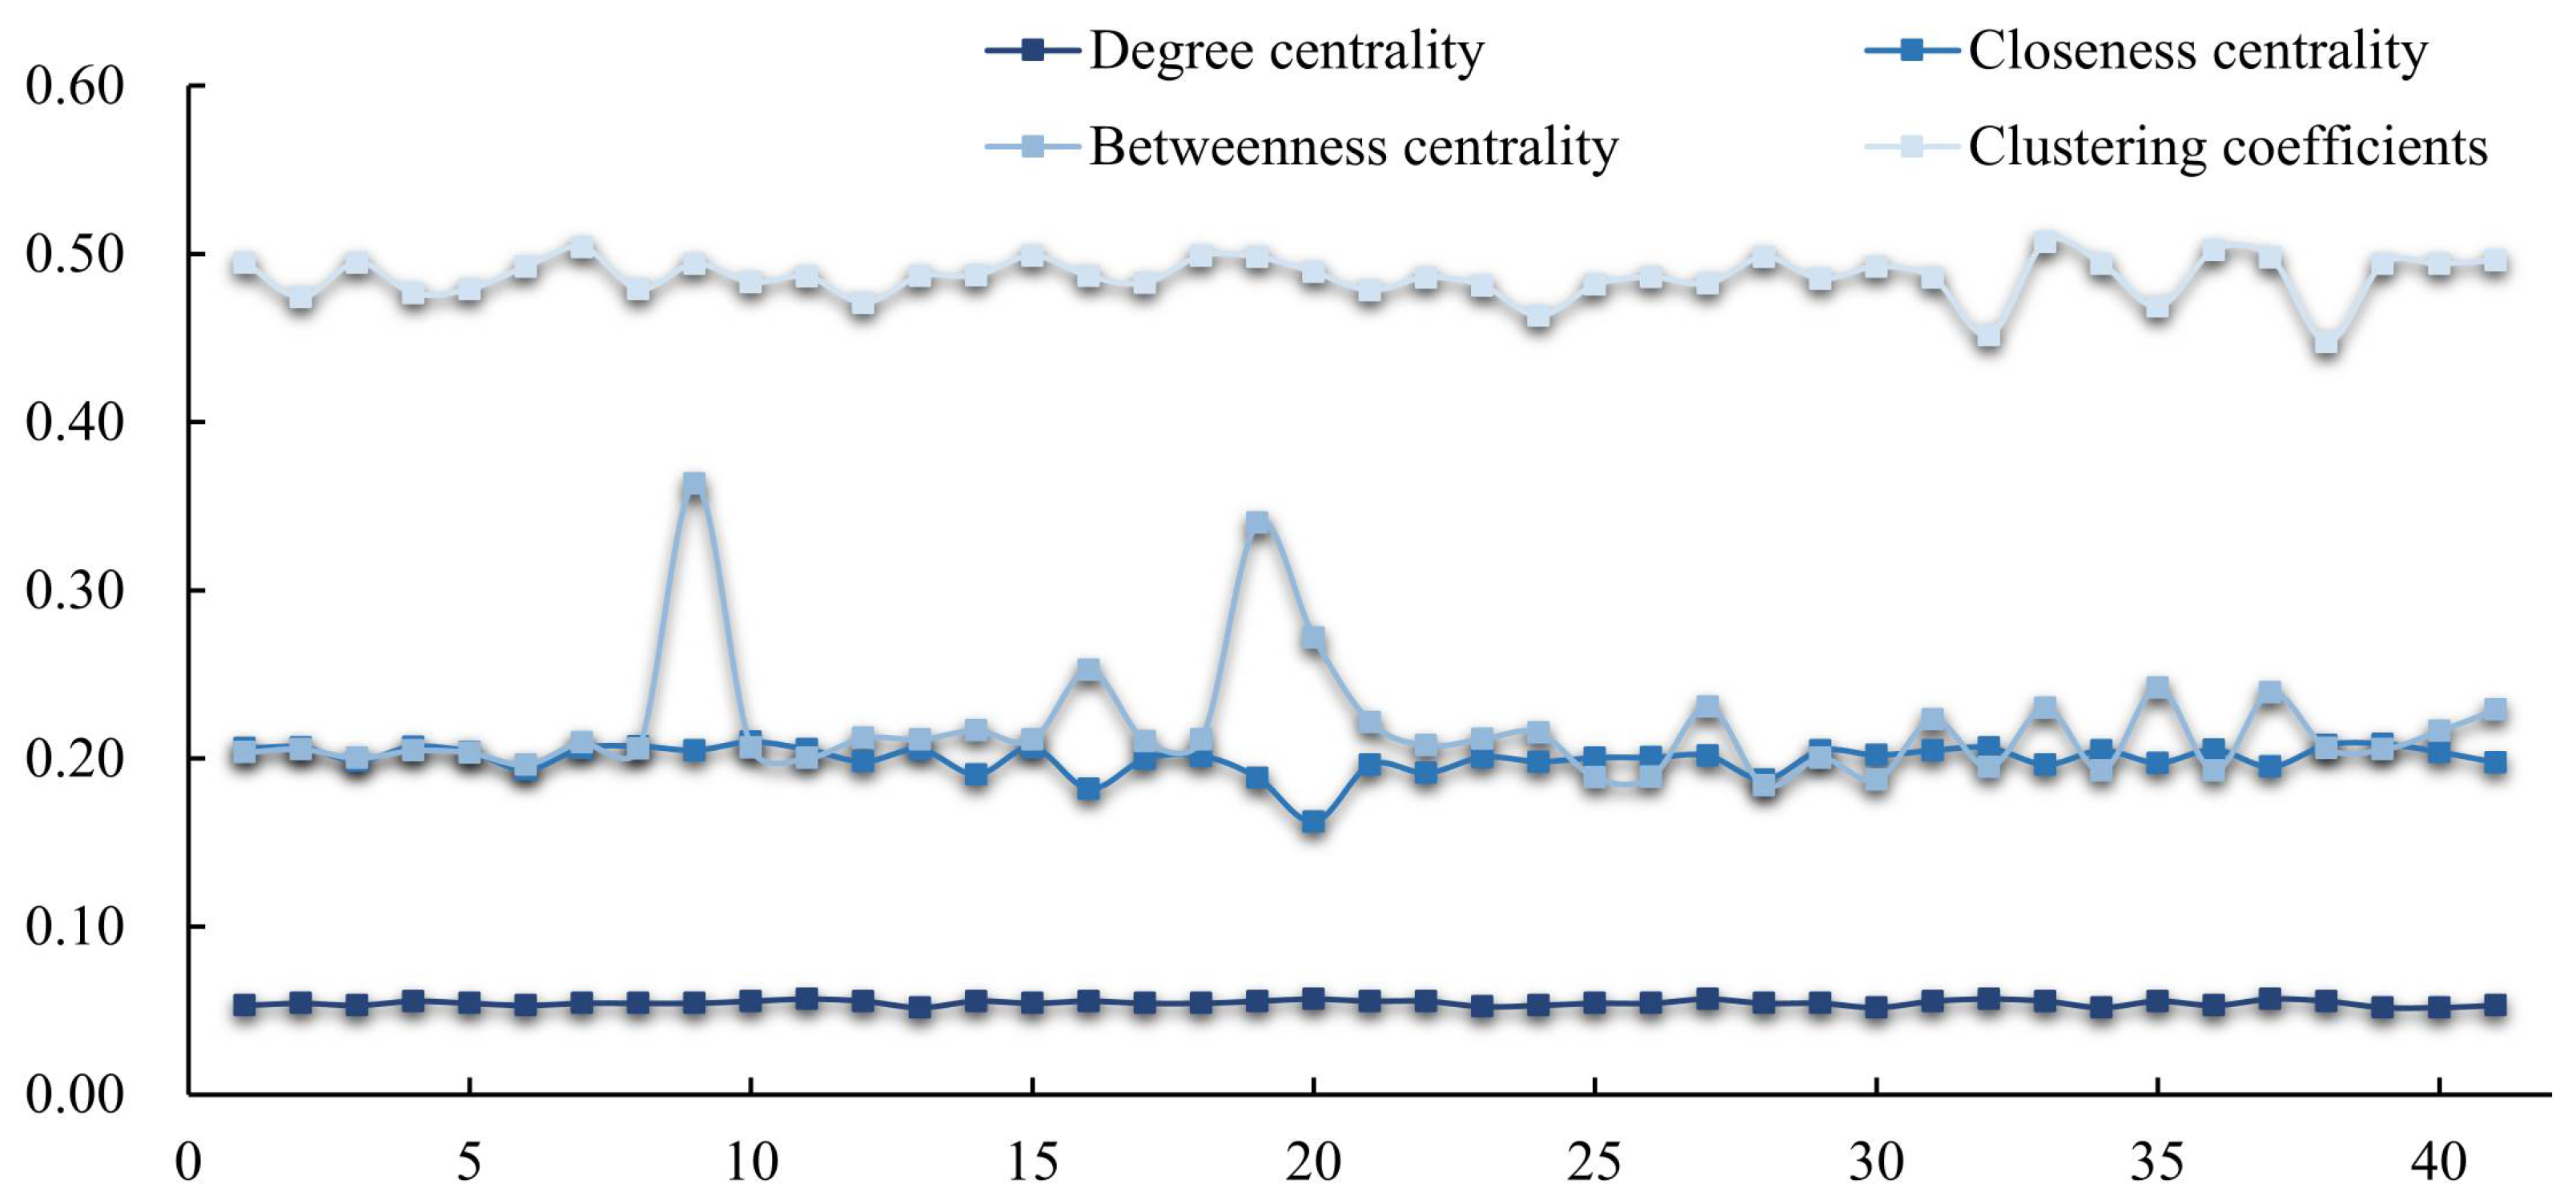
3.3.1. Comparative Analysis of Structural Connectivity
3.3.2. Comparative Analysis of Ecological Resilience
3.3.3. EN Optimization
3.4. Comparative Analysis of EN Performance in Different Functional Control Zones
3.5. ESP Construction
4. Discussion
4.1. ESP Construction Framework
4.2. Significant Differences in EN Performance Across Functional Zones
4.3. Recommendations for ESP Measures
4.4. Limitations of the Study
5. Conclusions
Author Contributions
Funding
Data Availability Statement
Conflicts of Interest
References
- Sun, Y.; Zhang, X.; Ding, Y.; Chen, D.; Qin, D.; Zhai, P. Understanding Human Influence on Climate Change in China. Natl. Sci. Rev. 2022, 9, nwab113. [Google Scholar] [CrossRef]
- Hong, W.; Li, Y.; Yang, X.; Guo, R.; Liang, M.; Li, X. Identification of Intercity Ecological Synergy Regions and Measurement of the Corresponding Policy Network Structure: A Network Analysis Perspective. Landsc. Urban Plan. 2024, 245, 105008. [Google Scholar] [CrossRef]
- Cao, W.; Li, X.; Lyu, X.; Dang, D.; Wang, K.; Li, M.; Liu, S. To Explore the Effectiveness of Various Ecological Security Pattern Construction Methods in Many Growth Situations in the Future: A Case Study of the West Liaohe River Basin in Inner Mongolia. Sci. Total Environ. 2024, 948, 174607. [Google Scholar] [CrossRef]
- Zhang, F.; Jia, Y.; Liu, X.; Li, T.; Gao, Q. Application of MSPA-MCR Models to Construct Ecological Security Pattern in the Basin: A Case Study of Dawen River Basin. Ecol. Indic. 2024, 160, 111887. [Google Scholar] [CrossRef]
- Gong, D.; Huang, M.; Ge, Y.; Zhu, D.; Chen, J.; Chen, Y.; Zhang, L.; Hu, B.; Lai, S.; Lin, H. Revolutionizing Ecological Security Pattern with Multi-Source Data and Deep Learning: An Adaptive Generation Approach. Ecol. Indic. 2025, 173, 113315. [Google Scholar] [CrossRef]
- Forman, R.T.T. Some General Principles of Landscape and Regional Ecology. Landsc. Ecol. 1995, 10, 133–142. [Google Scholar] [CrossRef]
- Wang, T.; Li, H.; Huang, Y. The Complex Ecological Network’s Resilience of the Wuhan Metropolitan Area. Ecol. Indic. 2021, 130, 108101. [Google Scholar] [CrossRef]
- Wang, Z.; Shi, P.; Zhang, X.; Tong, H.; Zhang, W.; Liu, Y. Research on Landscape Pattern Construction and Ecological Restoration of Jiuquan City Based on Ecological Security Evaluation. Sustainability 2021, 13, 5732. [Google Scholar] [CrossRef]
- Li, S.; Xiao, W.; Zhao, Y.; Lv, X. Incorporating Ecological Risk Index in the Multi-Process MCRE Model to Optimize the Ecological Security Pattern in a Semi-Arid Area with Intensive Coal Mining: A Case Study in Northern China. J. Clean. Prod. 2020, 247, 119143. [Google Scholar] [CrossRef]
- Zhang, Y.; Yang, R.; Sun, M.; Lu, Y.; Zhang, L.; Yin, Y.; Li, X. Identification of Spatial Protection and Restoration Priorities for Ecological Security Pattern in a Rapidly Urbanized Region: A Case Study in the Chengdu–Chongqing Economic Circle, China. J. Environ. Manag. 2024, 366, 121789. [Google Scholar] [CrossRef]
- Liu, M.; Peng, J.; Dong, J.; Jiang, H.; Xu, D.; Meersmans, J. Trade-Offs of Landscape Connectivity between Regional and Interregional Ecological Security Patterns in a Junction Area of Beijing-Tianjin-Hebei Region. Appl. Geogr. 2024, 167, 103272. [Google Scholar] [CrossRef]
- Wang, Y.; Yang, X.; Zhang, X.; Zhu, L.; Wang, X.; Li, Y.; Zhou, L.; Yu, X. Spatiotemporal Dynamic Characteristics and Conservation Strategy of Ecological Security Pattern in a Rapidly Urbanizing Zone. Ecol. Indic. 2024, 166, 112457. [Google Scholar] [CrossRef]
- Zhang, L.; Liu, Q.; Wang, J.; Wu, T.; Li, M. Constructing Ecological Security Patterns Using Remote Sensing Ecological Index and Circuit Theory: A Case Study of the Changchun-Jilin-Tumen Region. J. Environ. Manag. 2025, 373, 123693. [Google Scholar] [CrossRef]
- Li, W.; Liu, Y.; Lin, Q.; Wu, X.; Hao, J.; Zhou, Z.; Zhang, X. Identification of Ecological Security Pattern in the Qinghai-Tibet Plateau. Ecol. Indic. 2025, 170, 113057. [Google Scholar] [CrossRef]
- Jiao, Z.; Wu, Z.; Luo, Y.; Wei, B.; Dai, Z.; Li, S. A Framework for Analyzing the Effects of Modifiable Areal Unit Problem on Ecological Security Pattern. J. Clean. Prod. 2024, 458, 142549. [Google Scholar] [CrossRef]
- Wang, C.; Yu, C.; Chen, T.; Feng, Z.; Hu, Y.; Wu, K. Can the Establishment of Ecological Security Patterns Improve Ecological Protection? An Example of Nanchang, China. Sci. Total Environ. 2020, 740, 140051. [Google Scholar] [CrossRef]
- Luo, X.; Le, F.; Zhang, Y.; Zhang, H.; Zhai, J.; Luo, Y. Multi-Scenario Analysis and Optimization Strategy of Ecological Security Pattern in the Weihe River Basin. J. Environ. Manag. 2024, 366, 121813. [Google Scholar] [CrossRef] [PubMed]
- Wang, J.; Bai, Y.; Huang, Z.; Ashraf, A.; Ali, M.; Fang, Z.; Lu, X. Identifying Ecological Security Patterns to Prioritize Conservation and Restoration: A Case Study in Xishuangbanna Tropical Region, China. J. Clean. Prod. 2024, 444, 141222. [Google Scholar] [CrossRef]
- Chen, W.; Liu, H.; Wang, J. Construction and Optimization of Regional Ecological Security Patterns Based on MSPA-MCR-GA Model: A Case Study of Dongting Lake Basin in China. Ecol. Indic. 2024, 165, 112169. [Google Scholar] [CrossRef]
- Sun, D.; Wu, X.; Wen, H.; Ma, X.; Zhang, F.; Ji, Q.; Zhang, J. Ecological Security Pattern Based on XGBoost-MCR Model: A Case Study of the Three Gorges Reservoir Region. J. Clean. Prod. 2024, 470, 143252. [Google Scholar] [CrossRef]
- Teng, M.; Wu, C.; Zhou, Z.; Lord, E.; Zheng, Z. Multipurpose Greenway Planning for Changing Cities: A Framework Integrating Priorities and a Least-Cost Path Model. Landsc. Urban Plan. 2011, 103, 1–14. [Google Scholar] [CrossRef]
- Xu, A.; Hu, M.; Shi, J.; Bai, Q.; Li, X. Construction and Optimization of Ecological Network in Inland River Basin Based on Circuit Theory, Complex Network and Ecological Sensitivity: A Case Study of Gansu Section of Heihe River Basin. Ecol. Model. 2024, 488, 110578. [Google Scholar] [CrossRef]
- Liao, Q.; Li, T.; Wang, Q.; Liu, D. Exploring the Ecosystem Services Bundles and Influencing Drivers at Different Scales in Southern Jiangxi, China. Ecol. Indic. 2023, 148, 110089. [Google Scholar] [CrossRef]
- Gu, K.; Ma, L.; Xu, J.; Yu, H.; Zhang, X. Spatiotemporal Evolution Characteristics and Driving Factors of Water Conservation Service in Jiangxi Province from 2001 to 2020. Sustainability 2023, 15, 11941. [Google Scholar] [CrossRef]
- Duan, P.; Xu, Y.; Guo, X.; Luo, Z.; Zhao, X. Study on Multi-Scale Characteristics and Influencing Factors of Trade-Offs and Synergies between Ecosystem Services in Jiangxi Province. Forests 2023, 14, 598. [Google Scholar] [CrossRef]
- Wang, M.; Wang, X.; Shi, W. Exploring the Response of Trade-Offs and Synergies among Ecosystem Services to Future Land Use Changes in the Hilly Red Soil Region of Southern China. J. Environ. Manag. 2024, 372, 123283. [Google Scholar] [CrossRef] [PubMed]
- Hu, B.; Xie, M.; He, R.; Shi, Z.; Zhou, Y.; Ni, H.; Li, H. Spatio-Temporal Evolution of Cropland Ecosystem Services Value and Its Spatially Varying Dominate over the Past Two Decades: A Case Study in Jiangxi Province in Southern China. J. Clean. Prod. 2023, 427, 139228. [Google Scholar] [CrossRef]
- Yan, F.; Shangguan, W.; Zhang, J.; Hu, B. Depth-to-Bedrock Map of China at a Spatial Resolution of 100 Meters. Sci. Data 2020, 7, 2. [Google Scholar] [CrossRef]
- Qian, M.; Huang, Y.; Cao, Y.; Wu, J.; Xiong, Y. Ecological Network Construction and Optimization in Guangzhou from the Perspective of Biodiversity Conservation. J. Environ. Manag. 2023, 336, 117692. [Google Scholar] [CrossRef]
- Costanza, R.; d’Arge, R.; De Groot, R.; Farber, S.; Grasso, M.; Hannon, B.; Limburg, K.; Naeem, S.; O’neill, R.V.; Paruelo, J.; et al. The Value of the World’s Ecosystem Services and Natural Capital. Nature 1997, 387, 253–260. [Google Scholar] [CrossRef]
- Wu, L.; Luo, Y.; Pang, S.; Wang, G.; Ma, X. Factor Analysis of Hydrologic Services in Water-Controlled Grassland Ecosystems by InVEST Model and Geodetector. Environ. Sci. Pollut. Res. 2024, 31, 20409–20433. [Google Scholar] [CrossRef]
- Zhang, L.; Hickel, K.; Dawes, W.R.; Chiew, F.H.S.; Briggs, P.R. A Rational Function Approach for Estimating Mean Annual Evapotranspiration. Water Resour. Res. 2004, 40, W02502. [Google Scholar] [CrossRef]
- Babbar, D.; Areendran, G.; Sahana, M.; Sarma, K.; Raj, K.; Sivadas, A. Assessment and Prediction of Carbon Sequestration Using Markov Chain and InVEST Model in Sariska Tiger Reserve, India. J. Clean. Prod. 2021, 278, 123333. [Google Scholar] [CrossRef]
- Lu, Y.; Qin, F. Improvements in the InVEST Water Purification Model for Detecting Spatio-Temporal Changesintotal Nitrogen and Total Phosphorus Discharges in the Huai River Watershed, China. J. Environ. Manag. 2024, 366, 121918. [Google Scholar] [CrossRef] [PubMed]
- Hamel, P.; Chaplin-Kramer, R.; Sim, S.; Mueller, C. A New Approach to Modeling the Sediment Retention Service (InVEST 3.0): Case Study of the Cape Fear Catchment, North Carolina, USA. Sci. Total Environ. 2015, 524–525, 166–177. [Google Scholar] [CrossRef] [PubMed]
- Zhang, K.; Fang, B.; Zhang, Z.; Liu, T.; Liu, K. Exploring Future Ecosystem Service Changes and Key Contributing Factors from a “Past-Future-Action” Perspective: A Case Study of the Yellow River Basin. Sci. Total Environ. 2024, 926, 171630. [Google Scholar] [CrossRef] [PubMed]
- Li, S.; Bing, Z.; Jin, G. Spatially Explicit Mapping of Soil Conservation Service in Monetary Units Due to Land Use/Cover Change for the Three Gorges Reservoir Area, China. Remote Sens. 2019, 11, 468. [Google Scholar] [CrossRef]
- Shen, Z.; Wu, W.; Tian, S.; Wang, J. A Multi-Scale Analysis Framework of Different Methods Used in Establishing Ecological Networks. Landsc. Urban Plan. 2022, 228, 104579. [Google Scholar] [CrossRef]
- Karimian, H.; Zou, W.; Chen, Y.; Xia, J.; Wang, Z. Landscape Ecological Risk Assessment and Driving Factor Analysis in Dongjiang River Watershed. Chemosphere 2022, 307, 135835. [Google Scholar] [CrossRef]
- Mo, W.; Wang, Y.; Zhang, Y.; Zhuang, D. Impacts of Road Network Expansion on Landscape Ecological Risk in a Megacity, China: A Case Study of Beijing. Sci. Total Environ. 2017, 574, 1000–1011. [Google Scholar] [CrossRef]
- Luo, J.; Fu, H. Construct the Future Wetland Ecological Security Pattern with Multi-Scenario Simulation. Ecol. Indic. 2023, 153, 110473. [Google Scholar] [CrossRef]
- Han, T.; Luo, J.; Gan, Y.; Sun, Y.; Tian, L. Synergistic Zoning and Management Strategies for Ecosystem Service Value and Ecological Risk at the County Level: A Case Study of Songzi City, Hubei Province, China. Land 2025, 14, 1021. [Google Scholar] [CrossRef]
- Xie, J.; Girshick, R.; Farhadi, A. Unsupervised Deep Embedding for Clustering Analysis. In Proceedings of the 33rd International Conference on Machine Learning (ICML 2016), New York, NY, USA, 19–24 June 2016. [Google Scholar]
- Zhou, J.; Yang, J.; Tang, Z.; Xue, L.; Zhang, W.; Zhang, J. Driving Mechanisms of Ecosystem Services and Their Trade-Offs and Synergies in the Transition Zone between the Qinghai-Tibet Plateau and the Loess Plateau. Ecol. Indic. 2025, 171, 113148. [Google Scholar] [CrossRef]
- Soille, P.; Vogt, P. Morphological Segmentation of Binary Patterns. Pattern Recognit. Lett. 2009, 30, 456–459. [Google Scholar] [CrossRef]
- Bai, H.; Zhang, Y.; Huang, J.; Chen, H. Constructing Ecological Networks and Analyzing Impact Factors in Multi-Scenario Simulation under Climate Change. Land 2025, 14, 1120. [Google Scholar] [CrossRef]
- Cao, C.; Luo, Y.; Xu, L.; Xi, Y.; Zhou, Y. Construction of Ecological Security Pattern Based on InVEST-Conefor-MCRM: A Case Study of Xinjiang, China. Ecol. Indic. 2024, 159, 111647. [Google Scholar] [CrossRef]
- Pickett, S.T.A.; Cadenasso, M.; Rosi, E.; Belt, K.; Groffman, P.; Grove, M.; Irwin, E.; Kaushal, S.; LaDeau, S.; Nilon, C.; et al. Dynamic Heterogeneity: A Framework to Promote Ecological Integration and Hypothesis Generation in Urban Systems. Urban. Ecosyst. 2017, 20, 1–14. [Google Scholar] [CrossRef]
- Qin, X.; Ling, H.; Shan, Q.; Zhang, G.; Yan, J.; Gong, Y.; Xu, J.; Meng, X. Construction of Ecological Security Patterns in Typical Arid Regions Based on the Synergy of Efficient Ecological Water Utilization and Environmental Quality Enhancement. Catena 2025, 249, 108713. [Google Scholar] [CrossRef]
- Ghasemi, A.; Miandoabchi, E.; Soroushnia, S. The Attractiveness of Seaport-Based Transport Corridors: An Integrated Approach Based on Scenario Planning and Gravity Models. Marit. Econ. Logist. 2021, 23, 522–547. [Google Scholar] [CrossRef]
- Mcrae, B.H.; Dickson, B.G.; Keitt, T.H.; Shah, V.B. Using Circuit Theory to Model Connectivity in Ecology, Evolution, and Conservation. Ecology 2008, 89, 2712–2724. [Google Scholar] [CrossRef]
- Taylor, P.D.; Fahrig, L.; Merriam, H.G. Connectivity Is a Vital Element of Landscape Structure. Oikos 1993, 68, 571–573. [Google Scholar] [CrossRef]
- Freeman, L.C. Centrality in Social Networks Conceptual Clarification. Soc. Netw. 1978, 1, 215–239. [Google Scholar] [CrossRef]
- De Montis, A.; Caschili, S.; Mulas, M.; Modica, G.; Ganciu, A.; Bardi, A.; Ledda, A.; Dessena, L.; Laudari, L.; Fichera, C.R. Urban–Rural Ecological Networks for Landscape Planning. Land. Use Policy 2016, 50, 312–327. [Google Scholar] [CrossRef]
- Haggett, P.; Richard, J.C. Network Analysis in Geography; Edward Arnold: London, UK, 1969. [Google Scholar]
- Huang, X.; Ye, Y.; Zhao, X.; Guo, X.; Ding, H. Identification and Stability Analysis of Critical Ecological Land: Case Study of a Hilly County in Southern China. Ecol. Indic. 2022, 141, 109091. [Google Scholar] [CrossRef]
- Zou, Z.; Xiao, Y.; Gao, J. Robustness Analysis of Urban Transit Network Based on Complex Networks Theory. Kybernetes 2013, 42, 383–399. [Google Scholar] [CrossRef]
- Gao, F.; Liao, S.; Wang, Z.; Cai, G.; Feng, L.; Yang, Z.; Chen, W.; Chen, X.; Li, G. Revealing Disparities in Different Types of Park Visits Based on Cellphone Signaling Data in Guangzhou, China. J. Environ. Manag. 2024, 351, 119969. [Google Scholar] [CrossRef] [PubMed]
- Zhang, R.; Liu, H.; Xu, Z.; Zhao, X.; Wen, L.; Zhuo, Y.; Wang, L. Ecological Problem Identification Based on Spatial and Temporal Dynamics of Ecosystem Quality: A Case Study. Ecol. Indic. 2025, 170, 112987. [Google Scholar] [CrossRef]
- Su, J.; Wu, M.; Liu, Z. Spatial–Temporal Evolution of Ecological Network Structure during 1967–2021 in Yongding River Floodplain. Land 2025, 14, 930. [Google Scholar] [CrossRef]
- Li, W.; Liang, X.; Jia, A.; Martin, J. The Impact of Nature Reserves on the Ecological Network of Urban Agglomerations—A Case Study of the Urban Agglomeration in the Middle Reaches of the Yangtze River. Land. 2025, 14, 1054. [Google Scholar] [CrossRef]
- Li, W. Effectiveness and Driving Mechanisms of Ecological Conservation and Restoration in Sichuan Province, China. Ecol. Indic. 2025, 172, 113238. [Google Scholar] [CrossRef]


| Name | Resolution | Source |
|---|---|---|
| Land use and cover change (LUCC), Nighttime lights, and Roads (Open street map, OSM) | 30 m/500 m/- | Resource and Environmental Science Data Platform (https://www.resdc.cn (accessed on 21 November 2024)) |
| Digital elevation model (DEM) | 30 m | Geospatial Data Cloud (https://www.gscloud.cn (accessed on 21 November 2024)) |
| Evaporation (EVP), Precipitation (PRE), Relative humidity (RHU), Temperature (TEM), and Sunshine duration (SSD) | 1 km | National Tibetan Plateau Data Center (https://data.tpdc.ac.cn (accessed on 22 November 2024)), Resource and Environmental Science Data Platform (https://www.resdc.cn (accessed on 21 November 2024)), National Earth System Science Data Center (https://www.geodata.cn (accessed on 22 November 2024)) |
| Soil data (Harmonized world soil database, HWSD) | 1 km | National Cryosphere Desert Data Center (http://www.ncdc.ac.cn (accessed on 22 November 2024)) |
| Root depth | 1 km | Depth-to-bedrock map of China at a spatial resolution of 100 m [28] |
| Normalized difference vegetation index (NDVI) | 1 km | Ecotope (https://eco.gwxll.com/ (accessed on 21 November 2024)) |
| Gross domestic product (GDP) and Population density (POP) | 1 km | Resource and Environmental Science Data Platform (https://www.resdc.cn), Statistical Yearbook Download Station (www.zgtjnj.org (accessed on 21 November 2024)) |
| Name | Formulas | Parameters | References |
|---|---|---|---|
| WY | where Y(i) is WY for raster cell i; AET(i) is EVP for raster cell i; and P(i) is PRE for raster cell i. | [31,32] | |
| CS | where Csum is the total CS; Cabove and Cbelow represent above and belowground biogenic carbon, respectively; and Csoil and Cdead represent soil and dead organic carbon, respectively. | [33] | |
| WP | where Xexptot represents the total nutrient output from the subbasin; Xexp,i represents the amount of nutrient output from raster cell i within the subbasin; n is the number of raster cells; loadsurf,i and NDRsurf,i are the nutrient load and the output efficiency at the surface, respectively; loadsubs,i and NDRsubs,i are the subsurface nutrient load and output efficiency, respectively. | [34] | |
| SC | where SDx represents the capacity of SC; RKLS represents the maximum soil erosion; USLE is the universal soil loss equation, indicating the actual amount of soil erosion; R represents rainfall erosivity; K represents soil erodibility; LS is the slope length gradient; P represents engineering measures; and C represents vegetation cover. | [35] | |
| HQ | where Qxj is HQ for raster x of land type j; Hj represents the habitat quality suitability of land type j; Dxj represents threat degree of land type j in raster cell x; k represents a half-saturation constant, usually set to 0.05; and Z is definite constant, usually set to 2.5. | [36] |
| Classification | Factor | Weight | Direction |
|---|---|---|---|
| Natural factor | Landscape type | 0.2898 | Assigned values |
| DEM | 0.0709 | + | |
| Slope | 0.0402 | + | |
| NDVI | 0.2046 | − | |
| Water_dist | 0.0399 | + | |
| Social factor | Railway_dist | 0.0531 | − |
| Motorway_dist | 0.0277 | − | |
| Otherroads_dist | 0.0064 | − | |
| City_dist | 0.0225 | − | |
| County_dist | 0.0114 | − | |
| Economic factor | Nighttime lights | 0.2335 | + |
| Name | Formulas | Parametric | References |
|---|---|---|---|
| D | where ki represents the quantity of edges that are linked to node i within the current network, and N − 1 indicates the quantity of edges that would exist if node i were connected to every other node. | [53] | |
| B | where represents the quantity of shortest paths that traverse through the node i; gst denotes the quantity of shortest paths that link node s with node t; N indicates the quantity of all nodes. | ||
| C | where refers to the mean value of distance between node i and the remaining nodes; dij represents the distance from node i to node j; N indicates the quantity of all nodes. | ||
| CC | where refers to the quantity of neighbor pairs of node i, i.e., quantity of actual neighbor pairs; refers to the quantity of theoretical neighbor pairs of node i; N indicates the quantity of all nodes. | [54] | |
| α | where L indicates total quantity of ecological corridors that have been built; N indicates the quantity of all nodes; and D indicates the total length of all corridors. | [55] | |
| β | |||
| γ | |||
| CR |
| ENs | Model | D | B | C | CC | α | β | γ | CR |
|---|---|---|---|---|---|---|---|---|---|
| Construction based on one model theory | MCR gravity model (1) | 0.08 | 0.46 | 0.24 | 0.69 | 1.00 | 2.86 | 1.00 | 0.98 |
| Circuit theory (2) | 0.05 | 0.21 | 0.20 | 0.49 | 0.82 | 2.52 | 0.88 | 0.99 | |
| (1) compared with (2) | 68.29% | 122.56% | 17.52% | 42.15% | 21.54% | 13.21% | 13.21% | −0.25% | |
| Optimized construction combining two model theories | After optimization (3) | 0.09 | 0.27 | 0.27 | 0.67 | 1.18 | 3.19 | 1.12 | 0.99 |
| (3) compared with (1) | 10.14% | −42.48% | 15.51% | −3.45% | 17.72% | 11.67% | 11.67% | 0.14% | |
| (3) compared with (2) | 85.37% | 28.02% | 35.74% | 37.25% | 43.08% | 26.42% | 26.42% | −0.11% |
Disclaimer/Publisher’s Note: The statements, opinions and data contained in all publications are solely those of the individual author(s) and contributor(s) and not of MDPI and/or the editor(s). MDPI and/or the editor(s) disclaim responsibility for any injury to people or property resulting from any ideas, methods, instructions or products referred to in the content. |
© 2025 by the authors. Licensee MDPI, Basel, Switzerland. This article is an open access article distributed under the terms and conditions of the Creative Commons Attribution (CC BY) license (https://creativecommons.org/licenses/by/4.0/).
Share and Cite
Yang, X.; Cai, H.; Zhao, X.; Zhang, H. Revealing the Ecological Security Pattern in China’s Ecological Civilization Demonstration Area. Land 2025, 14, 1560. https://doi.org/10.3390/land14081560
Yang X, Cai H, Zhao X, Zhang H. Revealing the Ecological Security Pattern in China’s Ecological Civilization Demonstration Area. Land. 2025; 14(8):1560. https://doi.org/10.3390/land14081560
Chicago/Turabian StyleYang, Xuelong, Haisheng Cai, Xiaomin Zhao, and Han Zhang. 2025. "Revealing the Ecological Security Pattern in China’s Ecological Civilization Demonstration Area" Land 14, no. 8: 1560. https://doi.org/10.3390/land14081560
APA StyleYang, X., Cai, H., Zhao, X., & Zhang, H. (2025). Revealing the Ecological Security Pattern in China’s Ecological Civilization Demonstration Area. Land, 14(8), 1560. https://doi.org/10.3390/land14081560