Article

The Dual Effects of Climate Change and Human Activities on the Spatiotemporal Vegetation Dynamics in the Inner Mongolia Plateau from 1982 to 2022

School of Geography, Geomatics, and Planning, Jiangsu Normal University, Xuzhou 221116, China
*
Author to whom correspondence should be addressed.
Land 2025, 14(8), 1559; https://doi.org/10.3390/land14081559
Submission received: 16 June 2025 / Revised: 24 July 2025 / Accepted: 27 July 2025 / Published: 29 July 2025

Abstract

The Inner Mongolia Plateau (IMP), situated in the arid and semi-arid ecological transition zone of northern China, is particularly vulnerable to both climate change and human activities. Understanding the spatiotemporal vegetation dynamics and their driving forces is essential for regional ecological management. This study employs Sen’s slope estimation, BFAST analysis, residual trend method and Geodetector to analyze the spatial patterns of Normalized Difference Vegetation Index (NDVI) variability and distinguish between climatic and anthropogenic influences. Key findings include the following: (1) From 1982 to 2022, vegetation cover across the IMP exhibited a significant greening trend. Zonal analysis showed that this spatial heterogeneity was strongly regulated by regional hydrothermal conditions, with varied responses across land cover types and pronounced recovery observed in high-altitude areas. (2) In the western arid regions, vegetation trends were unstable, often marked by interruptions and reversals, contrasting with the sustained greening observed in the eastern zones. (3) Vegetation growth was primarily temperature-driven in the eastern forested areas, precipitation-driven in the central grasslands, and severely limited in the western deserts due to warming-induced drought. (4) Human activities exerted dual effects: significant positive residual trends were observed in the Hetao Plain and southern Horqin Sandy Land, while widespread negative residuals emerged across the southern deserts and central grasslands. (5) Vegetation change was driven by climate and human factors, with recovery mainly due to climate improvement and degradation linked to their combined impact. These findings highlight the interactive mechanisms of climate change and human disturbance in regulating terrestrial vegetation dynamics, offering insights for sustainable development and ecosystem education in climate-sensitive systems.

1. Introduction

Since the mid-20th century, global temperatures have consistently risen, and extreme climate events have become increasingly frequent [1]. These changes profoundly disturb regional hydrothermal conditions, triggering a series of ecological responses. Prolonged heatwaves and droughts can exacerbate land desertification and increase the frequency of wildfires, which in turn significantly reduce ecosystem productivity [2]. Conversely, intense precipitation events often induce soil erosion, further undermining ecosystem stability [3]. Meanwhile, rapid population growth, expanding urbanization, and intensified resource exploitation have amplified human disturbances to the Earth system, making human activities an increasingly important driver of climate change and ecosystem evolution [4]. Under this dual pressure of climate change and anthropogenic influence, ecosystems face more complex disturbance regimes and response processes.
As one of the most climate-sensitive elements of terrestrial ecosystems, vegetation responds strongly to variations in regional temperature and moisture [5]. Temperature is a key factor regulating plant photosynthesis and phenology. Within a suitable range, rising temperatures generally promote vegetation growth [6]. However, when warming exceeds an ecosystem’s threshold—especially under water-limited conditions—it can exacerbate drought stress and inhibit vegetation growth [7]. In arid and semi-arid regions, precipitation often becomes the critical limiting factor for plant growth [8]. Therefore, the interplay of temperature and moisture conditions is a crucial ecological determinant of vegetation spatial patterns, biomass dynamics, and community succession [9]. Numerous studies have shown that climate change over the past few decades has significantly altered vegetation dynamics at global and regional scales [10,11]. Nevertheless, climatic factors alone cannot fully account for these changes. In particular, urban expansion, overgrazing, and ecological engineering projects have profoundly altered ecosystems. These human activities disrupt land surface conditions, redistribute resources, and intensify disturbance regimes—ultimately affecting ecosystem functioning and resilience [12].
The Inner Mongolia Plateau (IMP) is a critical ecological barrier in northern China, located in the transition zone between humid and arid/semi-arid regions. Its ecosystems are inherently fragile, and vegetation is susceptible to climate variability [13]. In recent decades, the warming rate in this region has exceeded the global average [14]. The resulting imbalance in temperature–moisture regimes has led to more severe droughts, declining biomass, and serious challenges for agricultural and pastoral systems [15]. Nevertheless, some areas have exhibited positive changes under climate warming, such as extended growing seasons and increased biomass [16]. At the same time, the IMP represents a typical hotspot of human–environment interactions. The region has experienced substantial ecological degradation driven by rapid urbanization, overgrazing, and land use/land cover changes (LUCC) [17]. Meanwhile, it has also been the focus of some of the world’s largest ecological restoration programs, such as the “Three-North Shelter Forest Program” and grazing exclusion policies, which have significantly contributed to vegetation recovery in targeted areas [18]. The combined impacts of accelerated climate change and intense human interventions make the IMP a representative case for examining climate–human interactions in vulnerable regions, offering insights for sustainable management worldwide.
The Normalized Difference Vegetation Index (NDVI) is widely employed for remote sensing-based vegetation monitoring due to its high sensitivity to vegetation cover and aboveground biomass [19]. Among various NDVI metrics, the annual maximum NDVI effectively captures the peak state of vegetation growth and productivity, serving as a reliable indicator for long-term, large-scale vegetation dynamics analysis [20].
Although many studies have explored vegetation change on the IMP, most examined either climate or human factors separately, and few addressed their combined effects. Moreover, limited time spans have hindered analysis of long-term vegetation succession under joint climate and human influences [21]. To address these gaps, the present study focuses on the IMP, which features pronounced topographic variation and diverse vegetation types. This study aims to carry out the following: (1) characterize the spatiotemporal patterns of NDVI over the past four decades and (2) quantitatively assess the relative contributions of climate change and human activities to NDVI variability. The findings aim to enhance the understanding of ecosystem response mechanisms under coupled natural and anthropogenic influences and to provide scientific support for formulating effective ecological restoration policies.

2. Materials and Methods
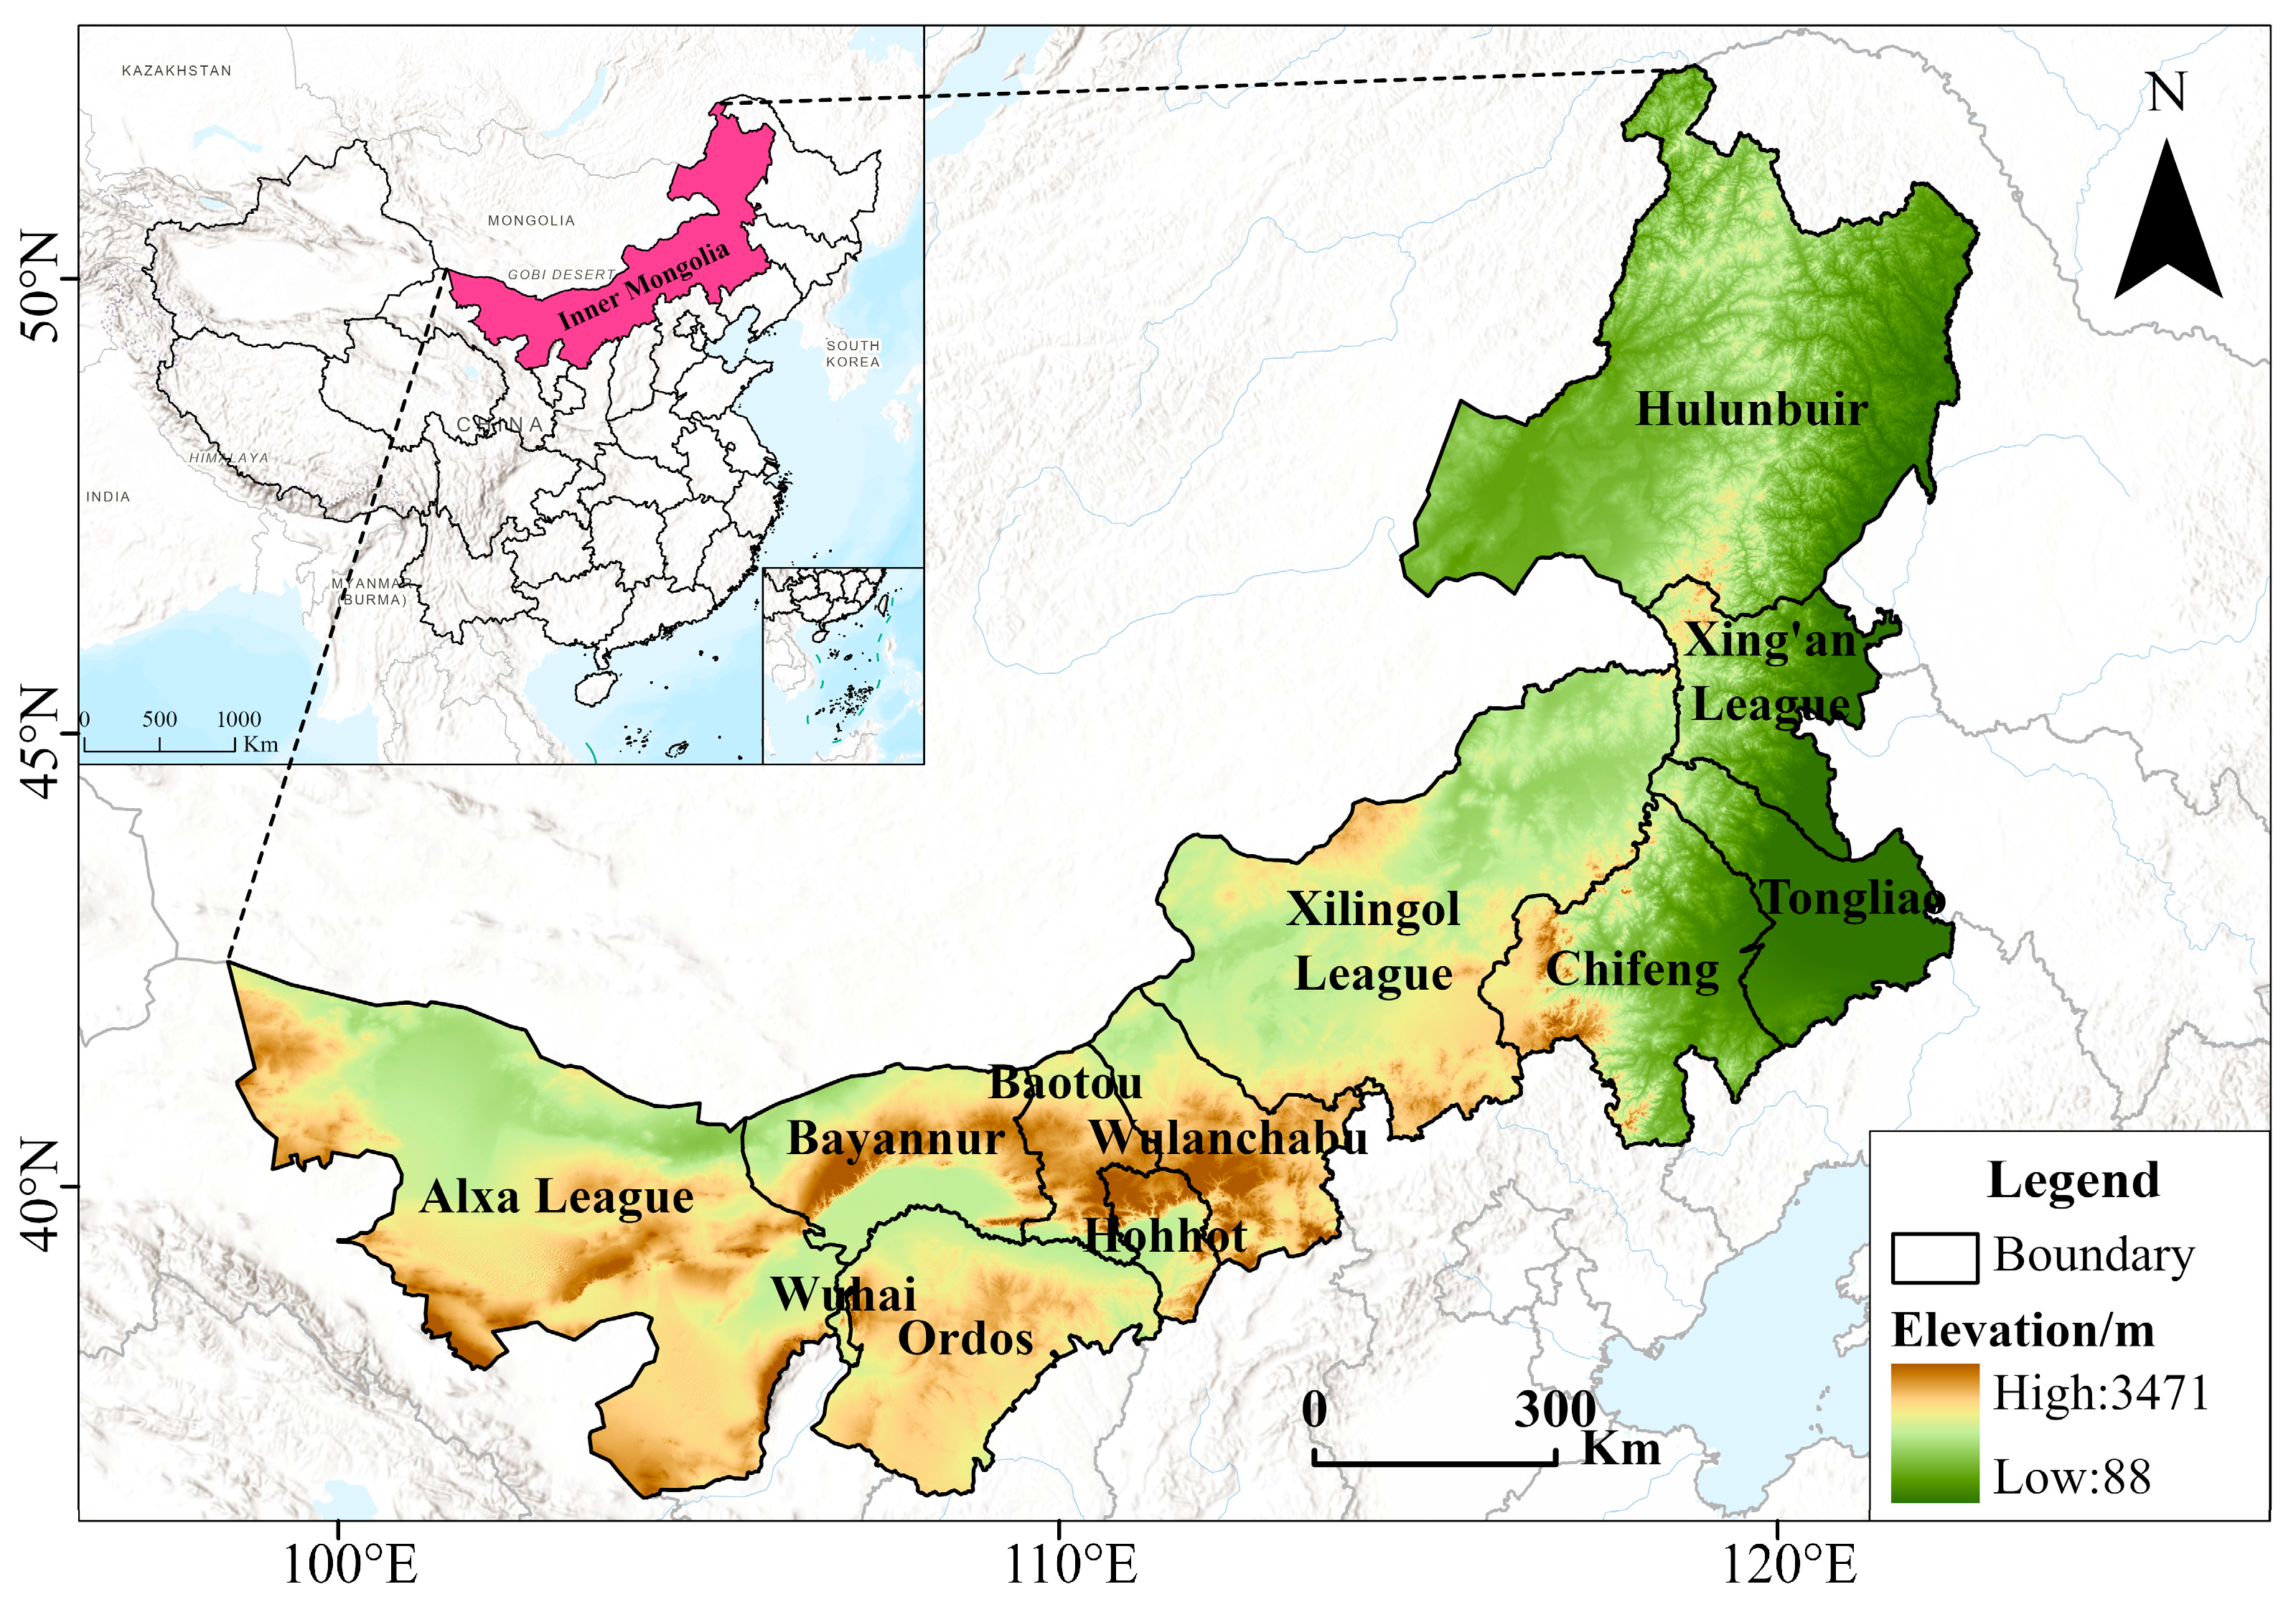
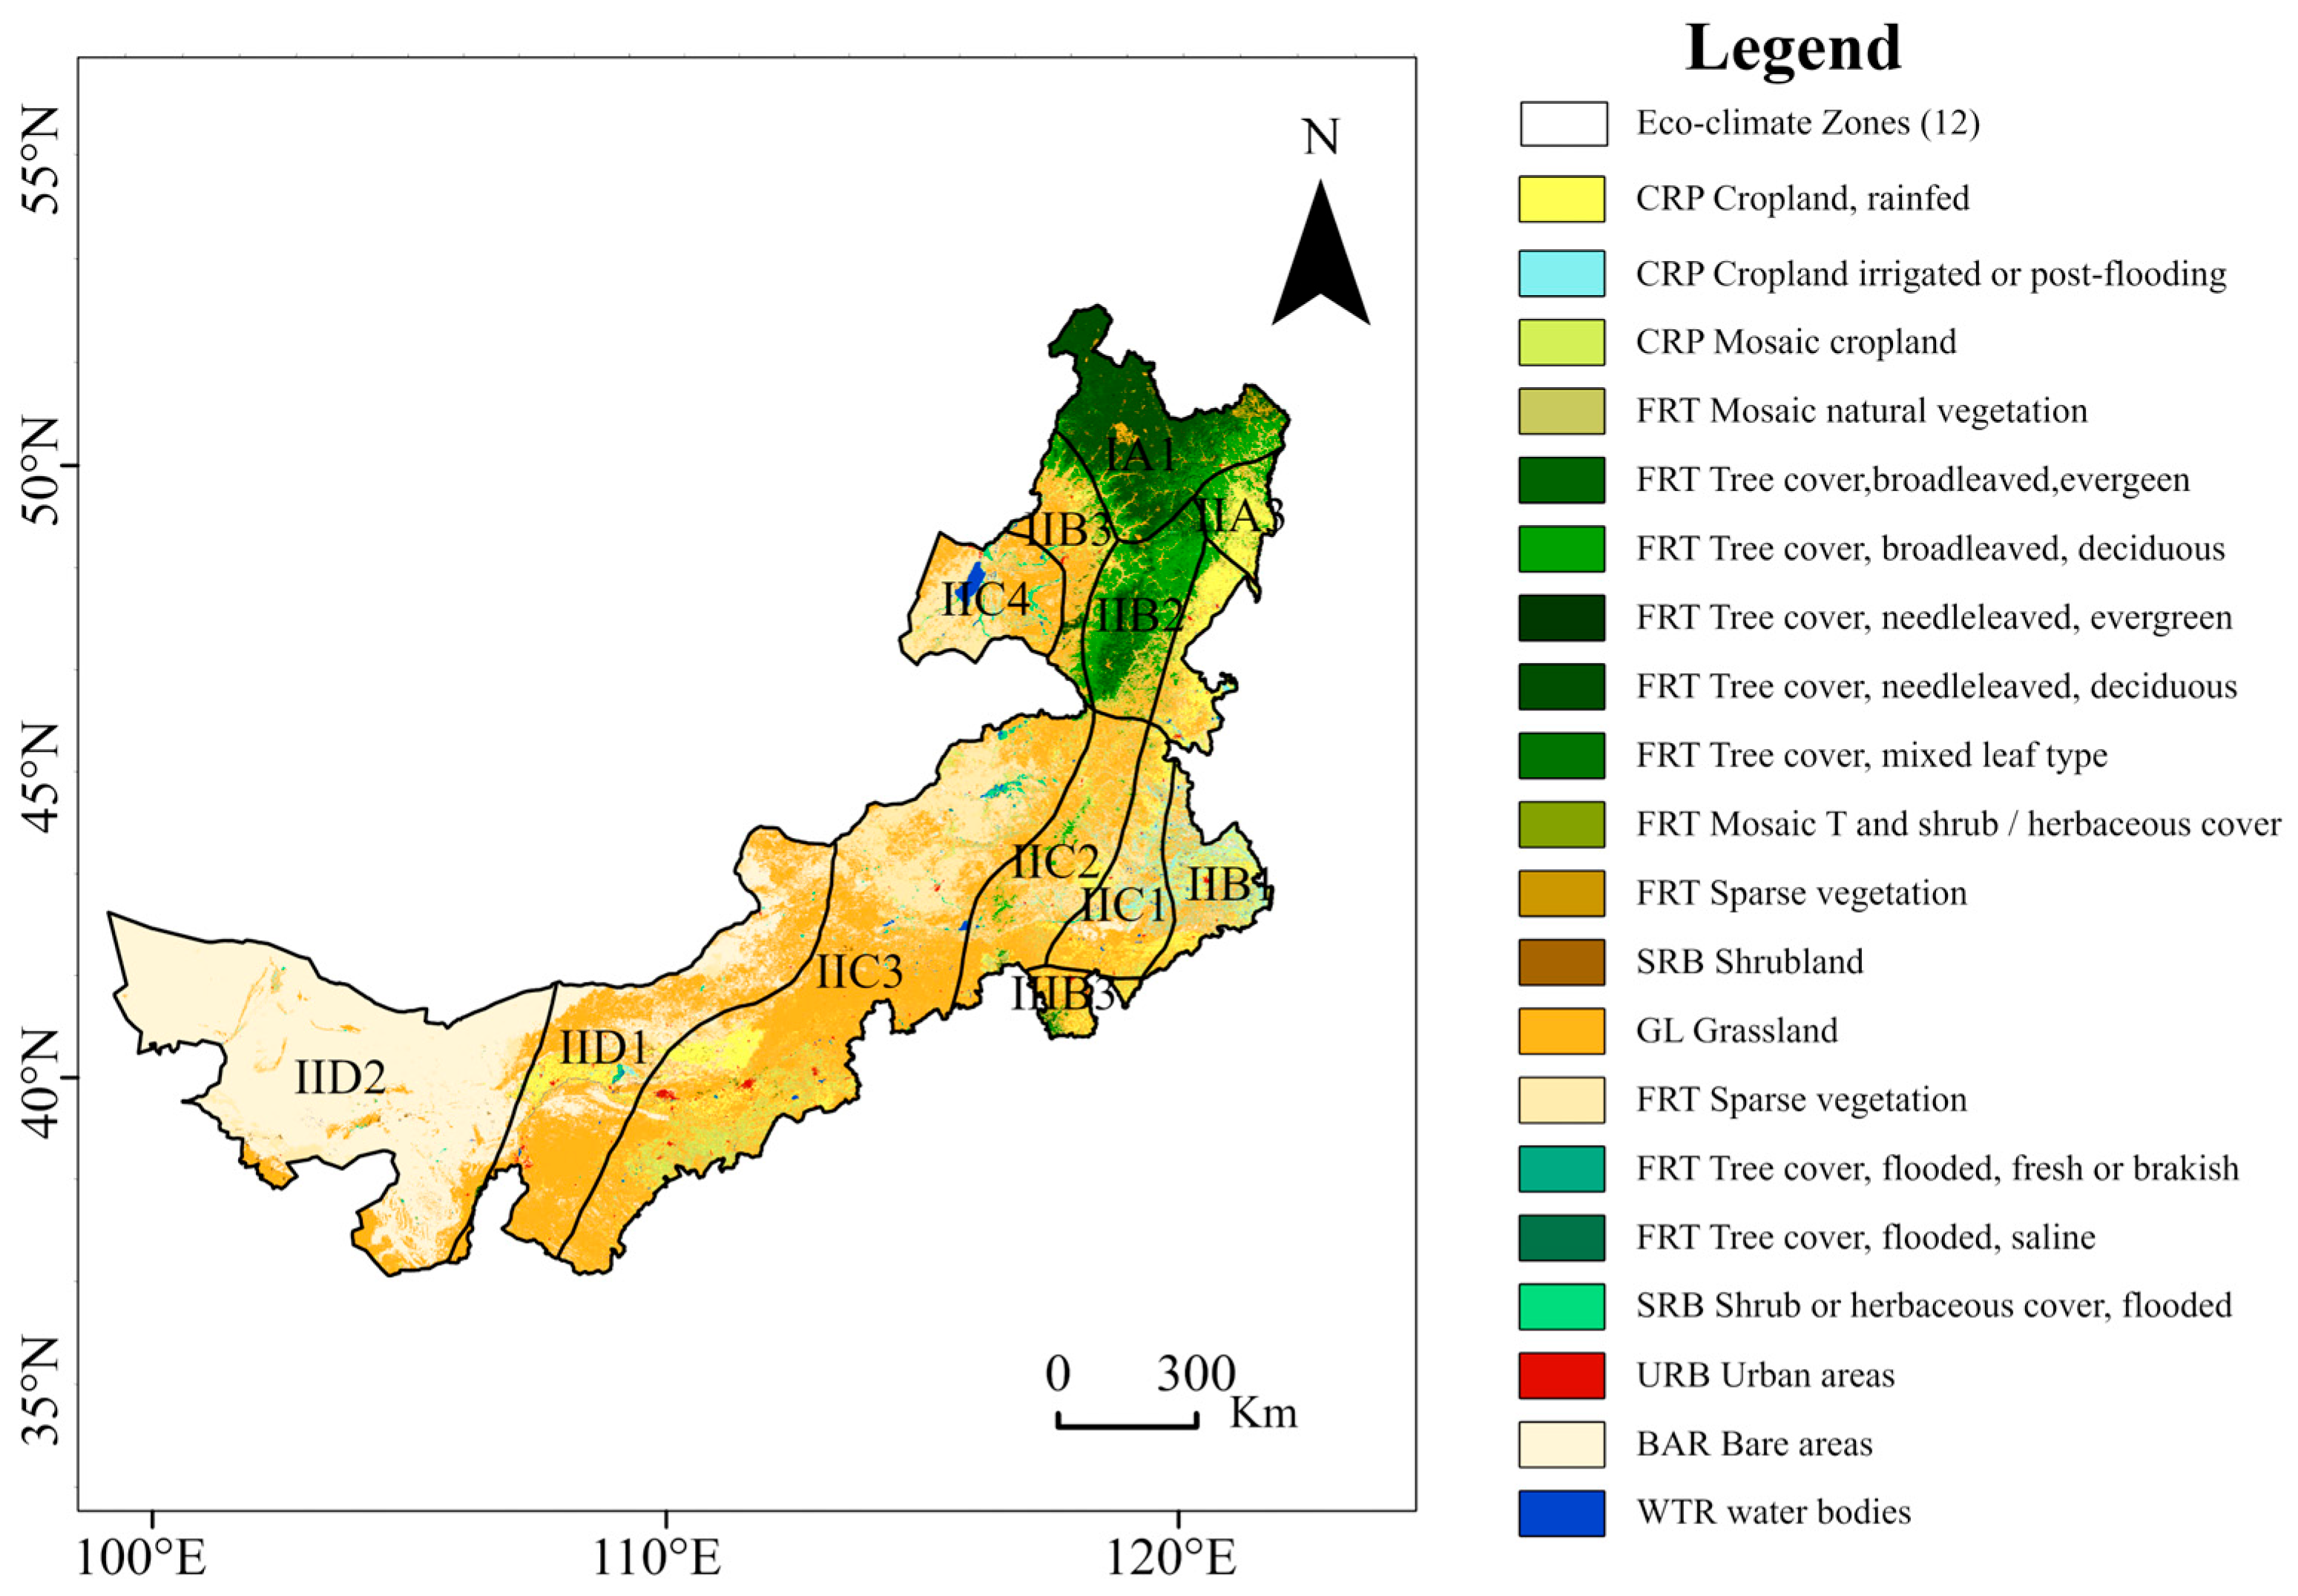
2.1. Study Area

The IMP (37°24′–53°23′ N, 97°12′–126°04′ E) is located along China’s northern frontier, covering an area of approximately 1,183,000 km2—around 12.13% of China’s total land area. It comprises 12 administrative divisions, including leagues and prefecture-level cities (Figure 1). The terrain slopes gently from west to east, with an average elevation of approximately 1000 m above sea level (a.s.l). Geographically, the IMP forms the core of the Mongolian Plateau and consists of several geomorphic units arranged from west to east: the Alxa Plateau, Ordos Plateau, Hetao Plain, Yinshan Mountains, and Xilingol High Plain. Its northeastern part includes the Greater Khingan Range and the Hulunbuir Plateau. Climatically, the region transitions from arid and semi-arid zones in the northwest to humid and semi-humid monsoonal climates in the east [22]. Annual precipitation exhibits a strong east–west gradient, ranging from over 400 mm in the eastern regions to less than 50 mm in the west. The mean annual temperature ranges between −1 °C and 10 °C. The plateau’s vast latitudinal and longitudinal extent, combined with variations in precipitation and temperature, results in diverse vegetation types distributed from east to west. These include montane coniferous forests, deciduous broadleaf forests, forest–steppe ecotones, typical steppe, desert steppe, and desert ecosystems. Animal husbandry is a dominant land use in the IMP, with grassland pastures occupying more than 52% of the region’s area [23]. However, due to the combined effects of naturally arid, sandy environments and persistent pressures from overgrazing and human activities, significant land degradation has occurred in some areas, characterized by low vegetation cover and ecological fragility.

2.2. Data and Material

2.2.1. NDVI Dataset

To support high-resolution and long-term vegetation monitoring, we employed the Daily Gap-Free NDVI Dataset for China [24], available at https://doi.org/10.6084/m9.figshare.c.7002225.v1 (accessed on 9 November 2024). Spanning from 24 June 1981 to 10 May 2023 at a spatial resolution of 0.05°, this dataset originates from the NOAA Climate Data Record (CDR) and was generated through stringent quality control and spatiotemporal interpolation procedures, yielding a continuous, gap-free NDVI time series for China. Its consistency and accuracy have been extensively evaluated to ensure the dataset’s reliability for long-term vegetation monitoring. The dataset shows strong agreement in trend detection when compared with established NDVI products such as GIMMS3g, MODIS MOD13C2, and SPOT/PROBA. Quantitative validation against original observations yielded an R2 of 0.79 and an RMSE of 0.05, further confirming its accuracy and consistency. Compared to other NDVI products, this dataset offers longer temporal coverage and finer temporal resolution, making it particularly advantageous for analyzing vegetation dynamics across temporal and spatial scales. Consequently, it provides a robust foundation for assessing long-term vegetation responses to climate variability and anthropogenic disturbances on the IMP.
To verify the reliability of the NDVI measurements, we additionally employed the MODIS-based annual Enhanced Vegetation Index (EVI) dataset, which spans from 2000 to 2023 with a spatial resolution of 1 km. This dataset was obtained from the Resource and Environmental Science Data Platform (http://www.resdc.cn/DOI (accessed on 9 July 2025)).

2.2.2. Climate, Topographic, and Socio-Ecological Data

To ensure temporal consistency with the NDVI dataset, we collected climatic, topographic, and socio-ecological data covering the period from January 1982 to December 2022. Monthly temperature and precipitation data were obtained from high-resolution gridded datasets available at the National Tibetan Plateau/Third Pole Environment Data Center [25,26]. These datasets covered 1901–2023 with a spatial resolution of approximately 0.0083° and were produced using a spatial delta downscaling method based on the 0.5° Climatic Research Unit (CRU) dataset and the WorldClim dataset. The data were validated against 496 independent meteorological stations across China, ensuring high reliability for regional-scale climate analyses. Socio-economic indicators, including population and gross industrial output, were obtained from the Inner Mongolia Statistical Yearbook. In addition, we used the GlobPOP dataset, which provides gridded population data from 1990 to 2022 at a spatial resolution of 30 arcseconds, for spatial interaction analysis using the Geodetector model [27]. Topographic data were sourced from the Copernicus Global Digital Elevation Model at a spatial resolution of 30 m [28].
Vegetation type classification was based on the European Space Agency (ESA) Climate Change Initiative (CCI) Land Cover Dataset (Figure 2). Eco-climate regions were delineated according to ecological principles and factors such as thermal regimes, moisture conditions, and landform types [29,30]. In this system, Roman numerals I–III represent cold temperate, middle temperate, and warm temperate zones, respectively; letters A–D denote humid, semi-humid, semi-arid, and arid zones; and Arabic numerals specify eco-climate zones (Table 1, Figure 2).

2.3. Methods

2.3.1. Maximum Value Composition (MVC)

Annual NDVI values were derived from monthly data using the Maximum Value Composite (MVC) method, calculated as follows:
N D V I i = max ( N D V I t )
where NDVIi represents the maximum NDVI value in year i; max is the maximum value operator; NDVIt denotes the NDVI value for month t.

2.3.2. Theil–Sen Trend Analysis and Mann–Kendall (M–K) Test

The Theil–Sen median trend method, known for its efficiency, robustness, and resistance to outliers, has been widely adopted for long-term time series analysis, particularly in vegetation dynamics monitoring [8,13]. The slope was calculated as follows:
β = median N D V I j N D V I i j i , for   all   i < j
where i, j = 1, 2, …, n (with n = 35), NDVIi and NDVIj denote the annual maximum NDVI in years i and j, respectively. A positive slope (β > 0) indicates an increasing NDVI trend (i.e., vegetation improvement), while a negative slope (β < 0) reflects a declining trend (i.e., vegetation degradation).
To assess the statistical significance of the trend, the non-parametric Mann–Kendall (M–K) test was applied [31,32]. The Z statistic of the M–K test was computed using the following formula:
Z = S 1 Var ( S ) , if   S > 0 0 , if   S = 0 S + 1 Var ( S ) , if   S < 0
In this study, a trend was considered statistically significant at the 95% confidence level when ∣Z∣ > 1.96 and highly significant at the 99% confidence level when ∣Z∣ > 2.58. Trends with 0 < ∣Z∣ ≤ 1.96 were considered not statistically significant.

2.3.3. Breaks for Additive Season and Trend

In this study, we used the BFAST (Breaks For Additive Season and Trend) algorithm to identify and classify the spatiotemporal trend changes in the annual NDVI dataset for the study area from 1982 to 2022. BFAST is an efficient time series change detection method that decomposes remote sensing time series data into trend, seasonal, and residual components, and identifies significant change points in the trend and seasonal components based on this decomposition [33]. Its basic formula is expressed as follows:
Y t = T t + S t + e t , t = 1 , , n
where Yt is the observed value at time t, Tt represents the trend component, St denotes the seasonal component, and et is the residual component.
In the R programming environment (v4.4.1), we applied the BFAST01 function from the BFAST package to detect break points in the annual NDVI time series for each pixel across the IMP. Furthermore, based on the direction and statistical significance of trend changes before and after the detected breakpoints, all pixels were categorized into 7 types of vegetation change patterns, as detailed in Table 2 [34].

2.3.4. Residual Trend Analysis

Residual trend analysis was performed in three main steps: (1) A multiple linear regression model was built using annual NDVI, temperature, and precipitation data to estimate model parameters. (2) The predicted NDVI (NDVIp) represented the portion of NDVI variation explained by climatic factors. (3) The residual component (NDVIH) was obtained by subtracting the predicted NDVI (NDVIp) from the observed NDVI (NDVIO) derived from remote sensing data. This method isolates the contribution of non-climatic factors to vegetation change. The model is expressed as follows:
N D V I p = a × T + b × P + c
N D V I H = N D V I O N D V I p
where NDVIp denotes the predicted NDVI value based on the regression model, NDVIO represents the observed NDVI value from remote sensing, a, b, and c are the regression coefficients, T is the annual mean temperature, P is the annual total precipitation, and NDVIH is the residual indicating the effect of non-climatic factors.
The linear trend rates of NDVIp and NDVIH were calculated to determine the contributions of climate change and human activities to NDVI changes. The classification criteria and contribution calculation are detailed in the following Table 3.

2.3.5. Geodetector Model

Geodetector is a statistical tool designed to detect spatial stratified heterogeneity and reveal its underlying driving forces. In addition to assessing the impact of a single factor on the dependent variable, it can also analyze the interaction between two factors—evaluating the strength, direction, and whether the interaction is linear or non-linear [35].
The formula for factor detection is as follows:
q = 1 h = 1 L N h σ h 2 N σ 2
where h = 1, …, L represents the number of categories or zones of the driving factor; N and Nh denote the total number of units in the study area and the number of samples in zone h, respectively; σ2 and σ2h represent the overall variance of the study area and the variance within zone h.
The interaction detector is used to assess whether two factors exhibit a joint effect on the dependent variable Y, specifically to determine whether their combined influence strengthens or diminishes the explanatory power for NDVI. The classification of interaction types is presented in the Table 4.

3. Results

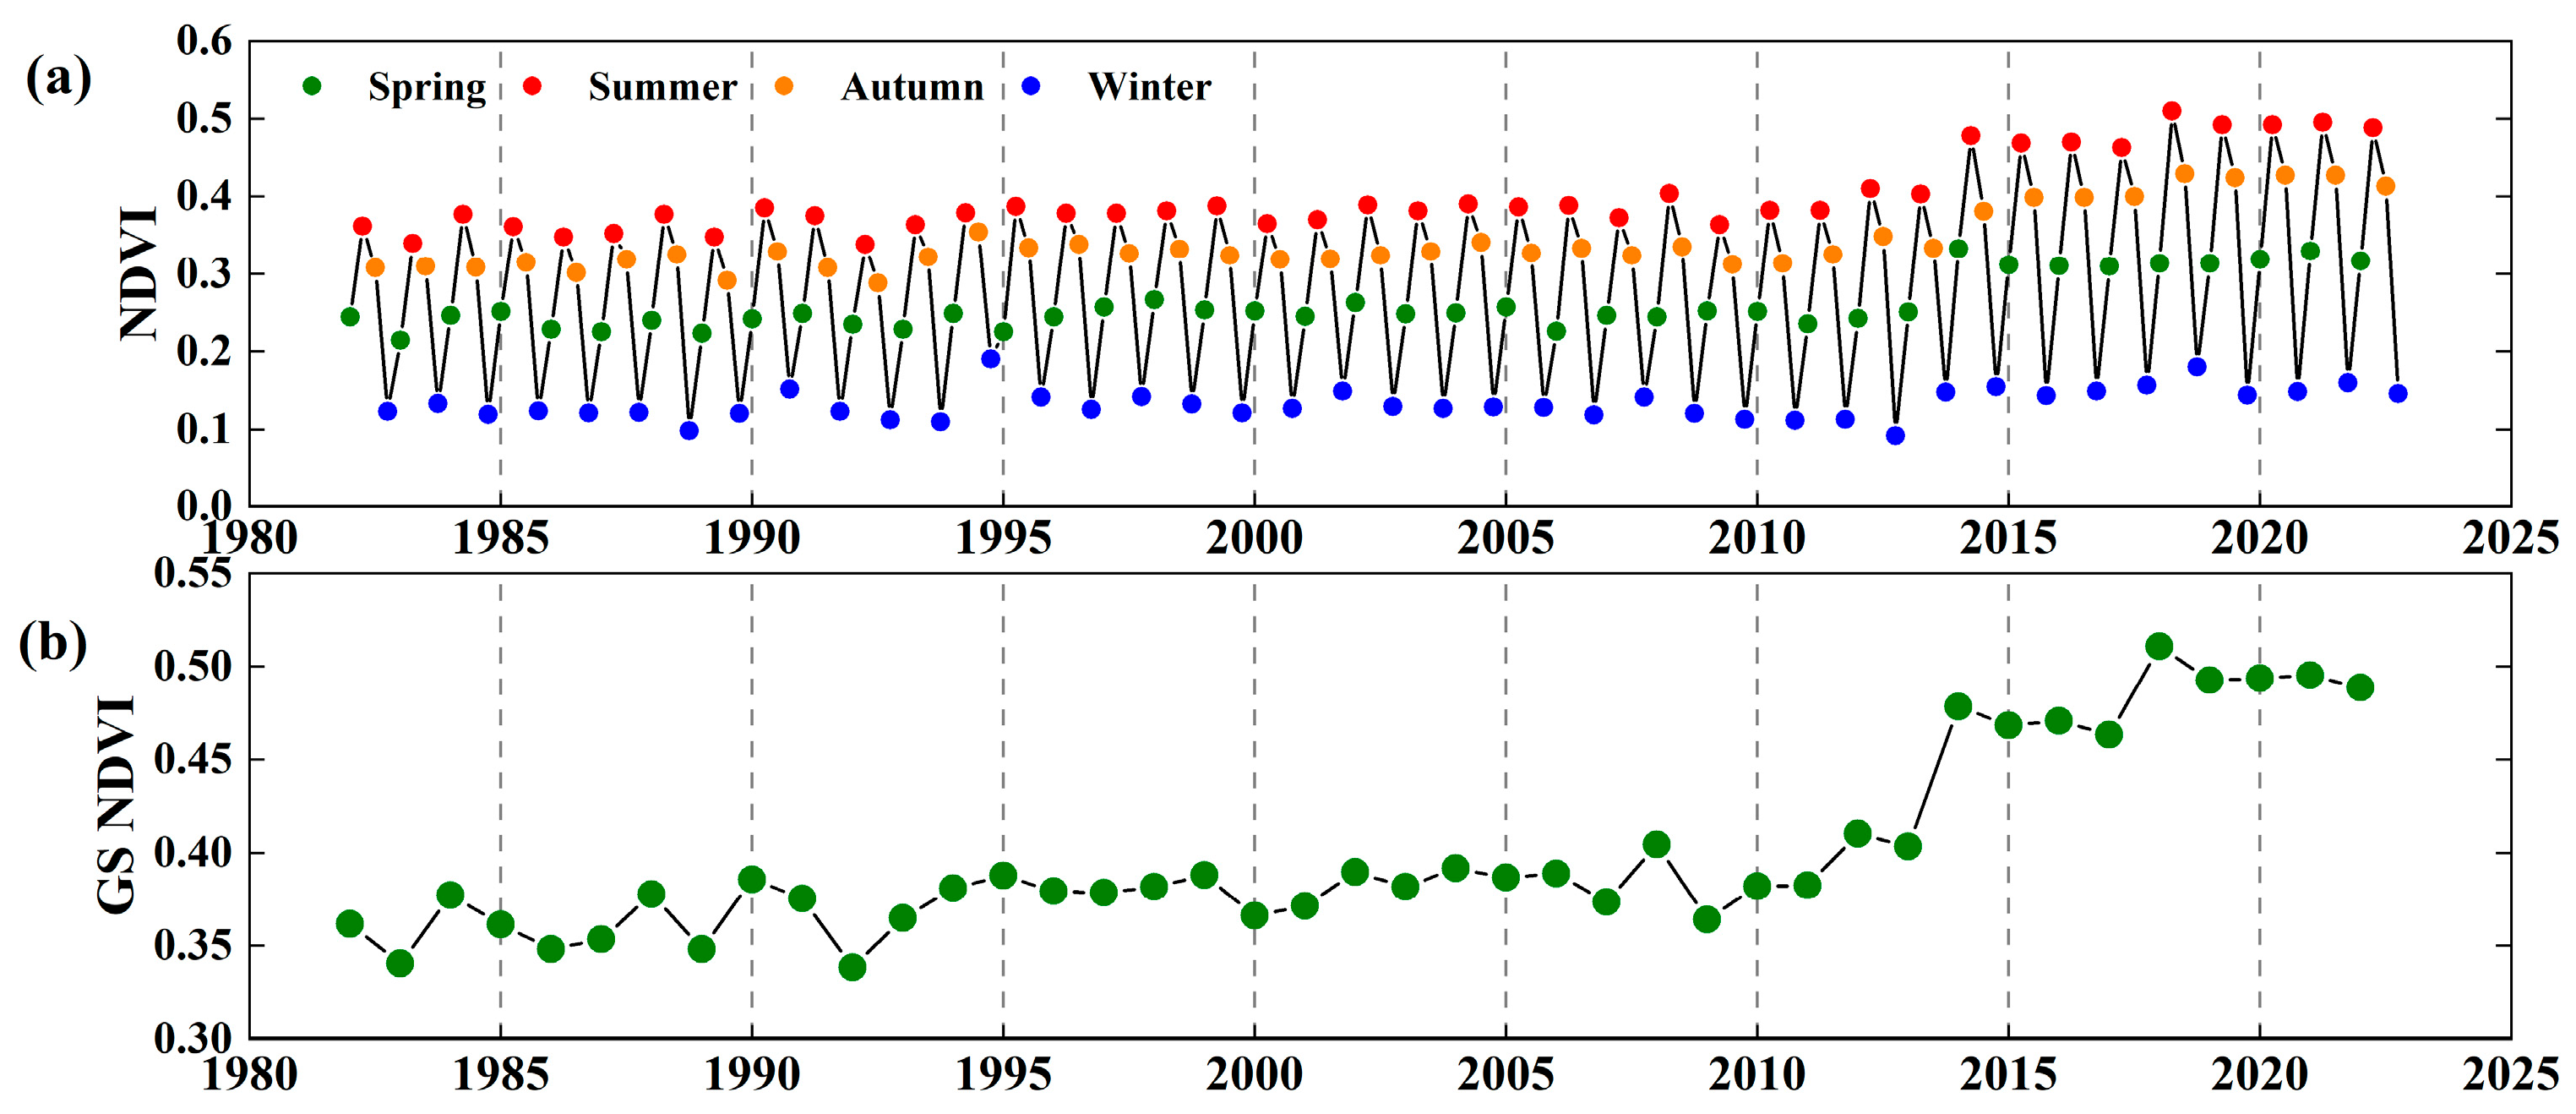
3.1. Temporal Patterns of Vegetation Dynamics

The temporal patterns of monthly NDVI across the IMP exhibited a typical unimodal “inverted U” shape throughout the year (Figure 3a), clearly reflecting pronounced seasonal dynamics. NDVI values showed a clear seasonal cycle, rising from 0.26 in spring to a maximum of 0.40 in summer, decreasing to 0.24 in autumn, and reaching the lowest seasonal mean of 0.13 in winter. Interannually, growing-season NDVI has shown a steady upward trend over the past 40 years (Figure 3b). From 1982 to 2013, the annual NDVI growth rate remained relatively stable at 0.006/10a. However, since 2013, the rate has increased significantly, reaching 0.047/10a. The maximum growing-season NDVI was observed in 2018 (0.36), while the lowest occurred in 1992 (0.24). Overall, vegetation cover in the growing season has steadily improved over the past four decades, with a particularly marked recovery observed during the most recent decade.

3.2. Spatial Patterns of Vegetation Change

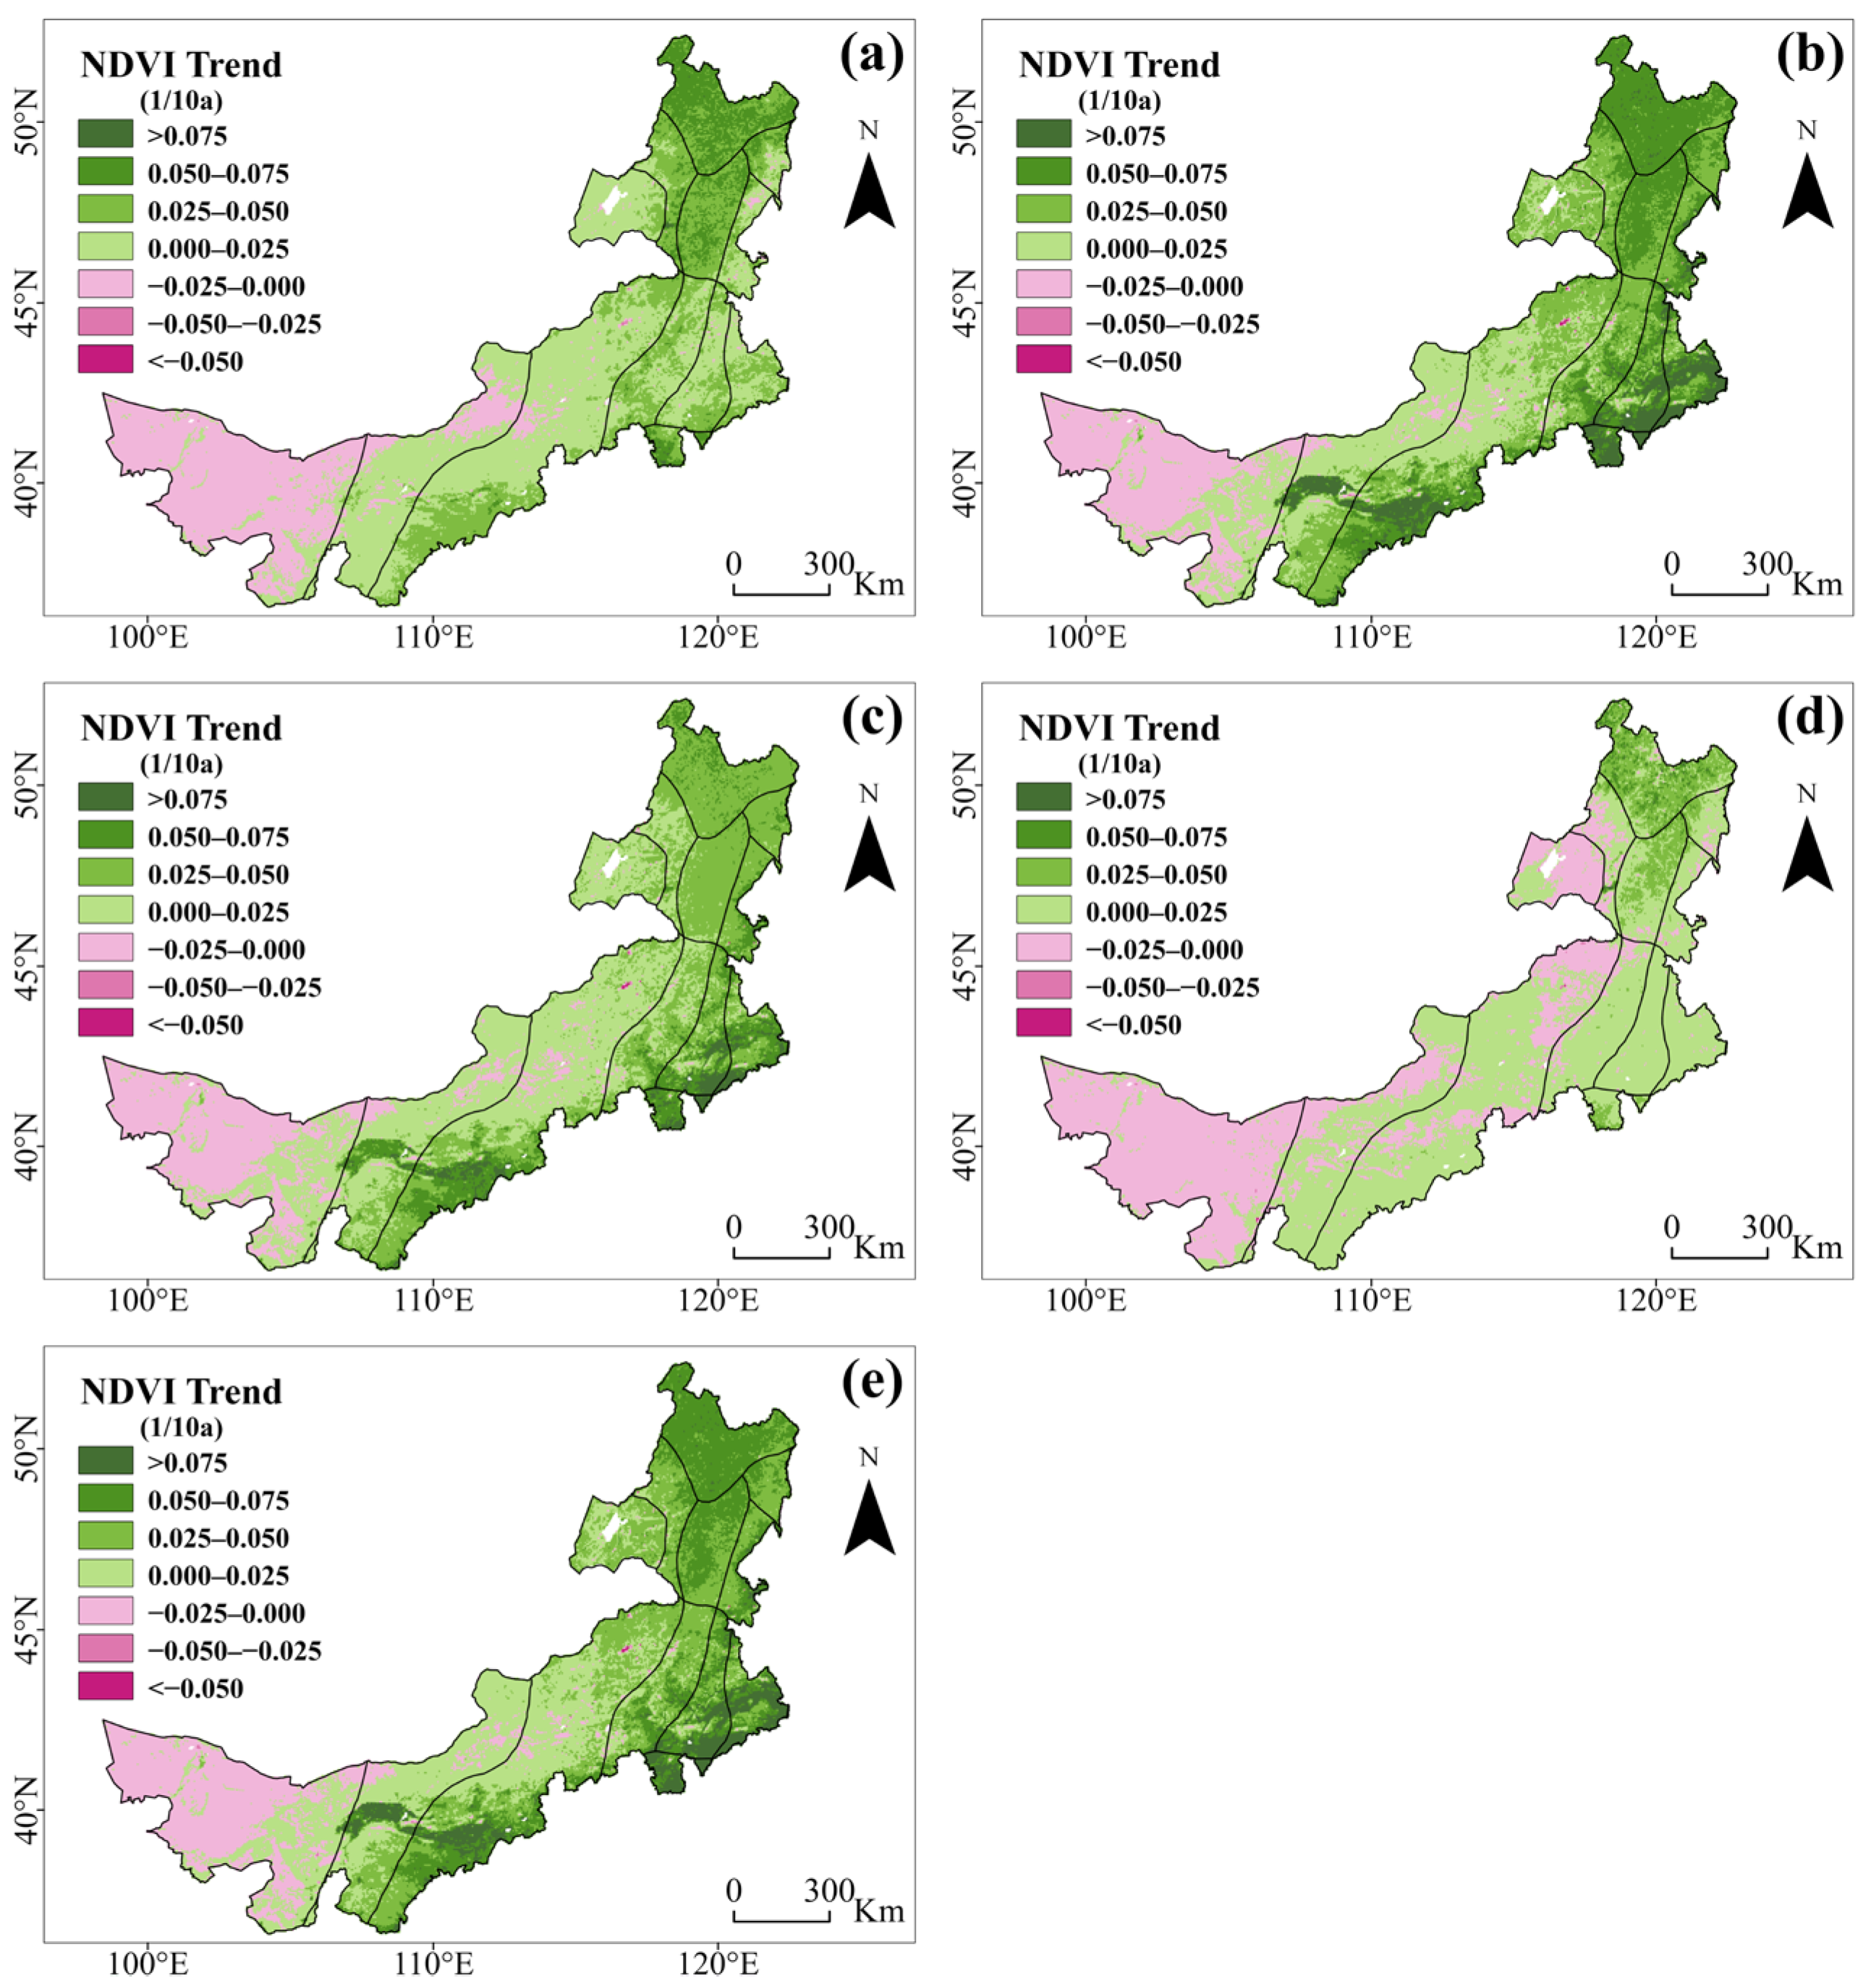
3.2.1. Seasonal Spatial Trends

Spatial analysis revealed distinct seasonal variability in NDVI trends across the IMP. In spring (Figure 4a), vegetation degradation was primarily concentrated in the IID1, the northern parts of IID2, and the central section of IIC3. In contrast, most other zones exhibited varying degrees of greening. In summer (Figure 4b), NDVI experienced the most notable increases. Major greening areas were located in the Greater Khingan Range and extended southward into zones IIC1, IIB1, and IIIB3. Westward, improvements also occurred in the southwestern parts of IIC3 and IID1. Overall, summer NDVI increases were most prominent along the eastern and southern margins of the IMP, with annual growth rates exceeding 0.075/10a. Compared with spring, summer degradation areas were slightly reduced, remaining mainly in the western part of IID2. During autumn (Figure 4c), spatial patterns of NDVI change resembled those of summer. However, NDVI growth was relatively low in IA1 and IIB2, with rates ranging from 0.025 and 0.050/10a. In winter (Figure 4d), NDVI showed the weakest improvement across the entire IMP. Most areas exhibited minimal vegetation change, with NDVI trends ranging between −0.025 and 0.025/10a, indicating limited vegetation recovery during the cold season. The exception was the Greater Khingan Range, which showed slightly more notable gains.
Collectively, from 1982 to 2022, NDVI across the IMP exhibited a significant overall upward trend (Figure 4e). Areas with increasing NDVI accounted for 83.2% of the total study area and were mainly distributed in the low-latitude and eastern regions. With increasing latitude and distance from the ocean, NDVI growth rates gradually weakened or even declined, suggesting a spatial attenuation of vegetation recovery toward the northwest.

3.2.2. Zonal Differences by Climate, Land Cover, and Elevation

Given the extensive latitudinal span and diverse eco-climatic and topographic characteristics of the IMP, analyzing vegetation trends at the regional scale without accounting for internal spatial heterogeneity can obscure important local dynamics. Therefore, a stratified zonal analysis was conducted to improve spatial resolution and interpretability.
Vegetation trends were first examined across eco-climate zones to capture their variation under different climatic conditions. Among these, all zones except IID2 exhibited positive NDVI trends (Figure 5a). The most significant vegetation improvement occurred in the warm temperate semi-humid zone IIIB3, with a median annual NDVI increase of 0.082/10a. This was followed by zones IIC1, IIB1, IA1, IIB2, IIA3, and IIB3, all located in mesothermal climates and showing median growth rates above 0.04/10a. Other zones, such as IIC2, IIC3, and IIC4, also demonstrated moderate greening, with median NDVI increases exceeding 0.03/10a. In contrast, the arid zone IID1 exhibited only a slight NDVI increase (−0.02/10a), while the IID2 zone showed a marginal decline with a median NDVI change rate of −0.0003/10a. Overall, NDVI trends revealed a spatial gradient of vegetation improvement decreasing from southeast to northwest, with more pronounced greening in humid and semi-humid regions than in arid zones.
Vegetation zonation is strongly associated with land cover characteristics, which serve as important proxies for vegetation structure and function. To further examine vegetation trends by type, we reclassified the 25 original land cover categories in the ESA CCI Land Cover dataset into seven dominant classes, including cropland (CRP), forest (FRY), grassland (GL), shrubland (SRB), water bodies (WTR), urban/built-up areas (URB), and bare land (BLD) (Figure 5c). NDVI trends calculated for each land cover class revealed that all categories—except bare land—experienced increasing NDVI trends. Cropland exhibited the most significant median annual increase (>0.05/10a), followed by forest, urban land, grassland, water bodies, and shrubland, with annual NDVI gains ranging from 0.02 to 0.04/10a. Bare land was the only class showing a net decline (−0.0016/10a), mainly distributed in western desert.
As the second-largest plateau in China, the IMP features significant topographic variation, which profoundly influences local climate and vegetation development. The region was stratified into 12 elevation zones to analyze altitudinal patterns of vegetation change. NDVI showed positive trends across all elevation bands (Figure 5e). The low-elevation zone (0–1000 m) exhibited the strongest greening, with a median NDVI increase of 0.049/10a. As elevation increased (1000–2000 m), NDVI growth rates gradually declined to 0.016/10a. Interestingly, in alpine zones above 2000 m, NDVI increases rebounded to 0.023/10a, indicating a slow but steady vegetation recovery at higher altitudes.
In summary, vegetation dynamics across the IMP demonstrate pronounced spatial heterogeneity, with variations linked to eco-climate zonation, land cover characteristics, and elevation. These patterns underscore the importance of spatially explicit approaches for understanding regional vegetation responses to climate change and anthropogenic disturbance.

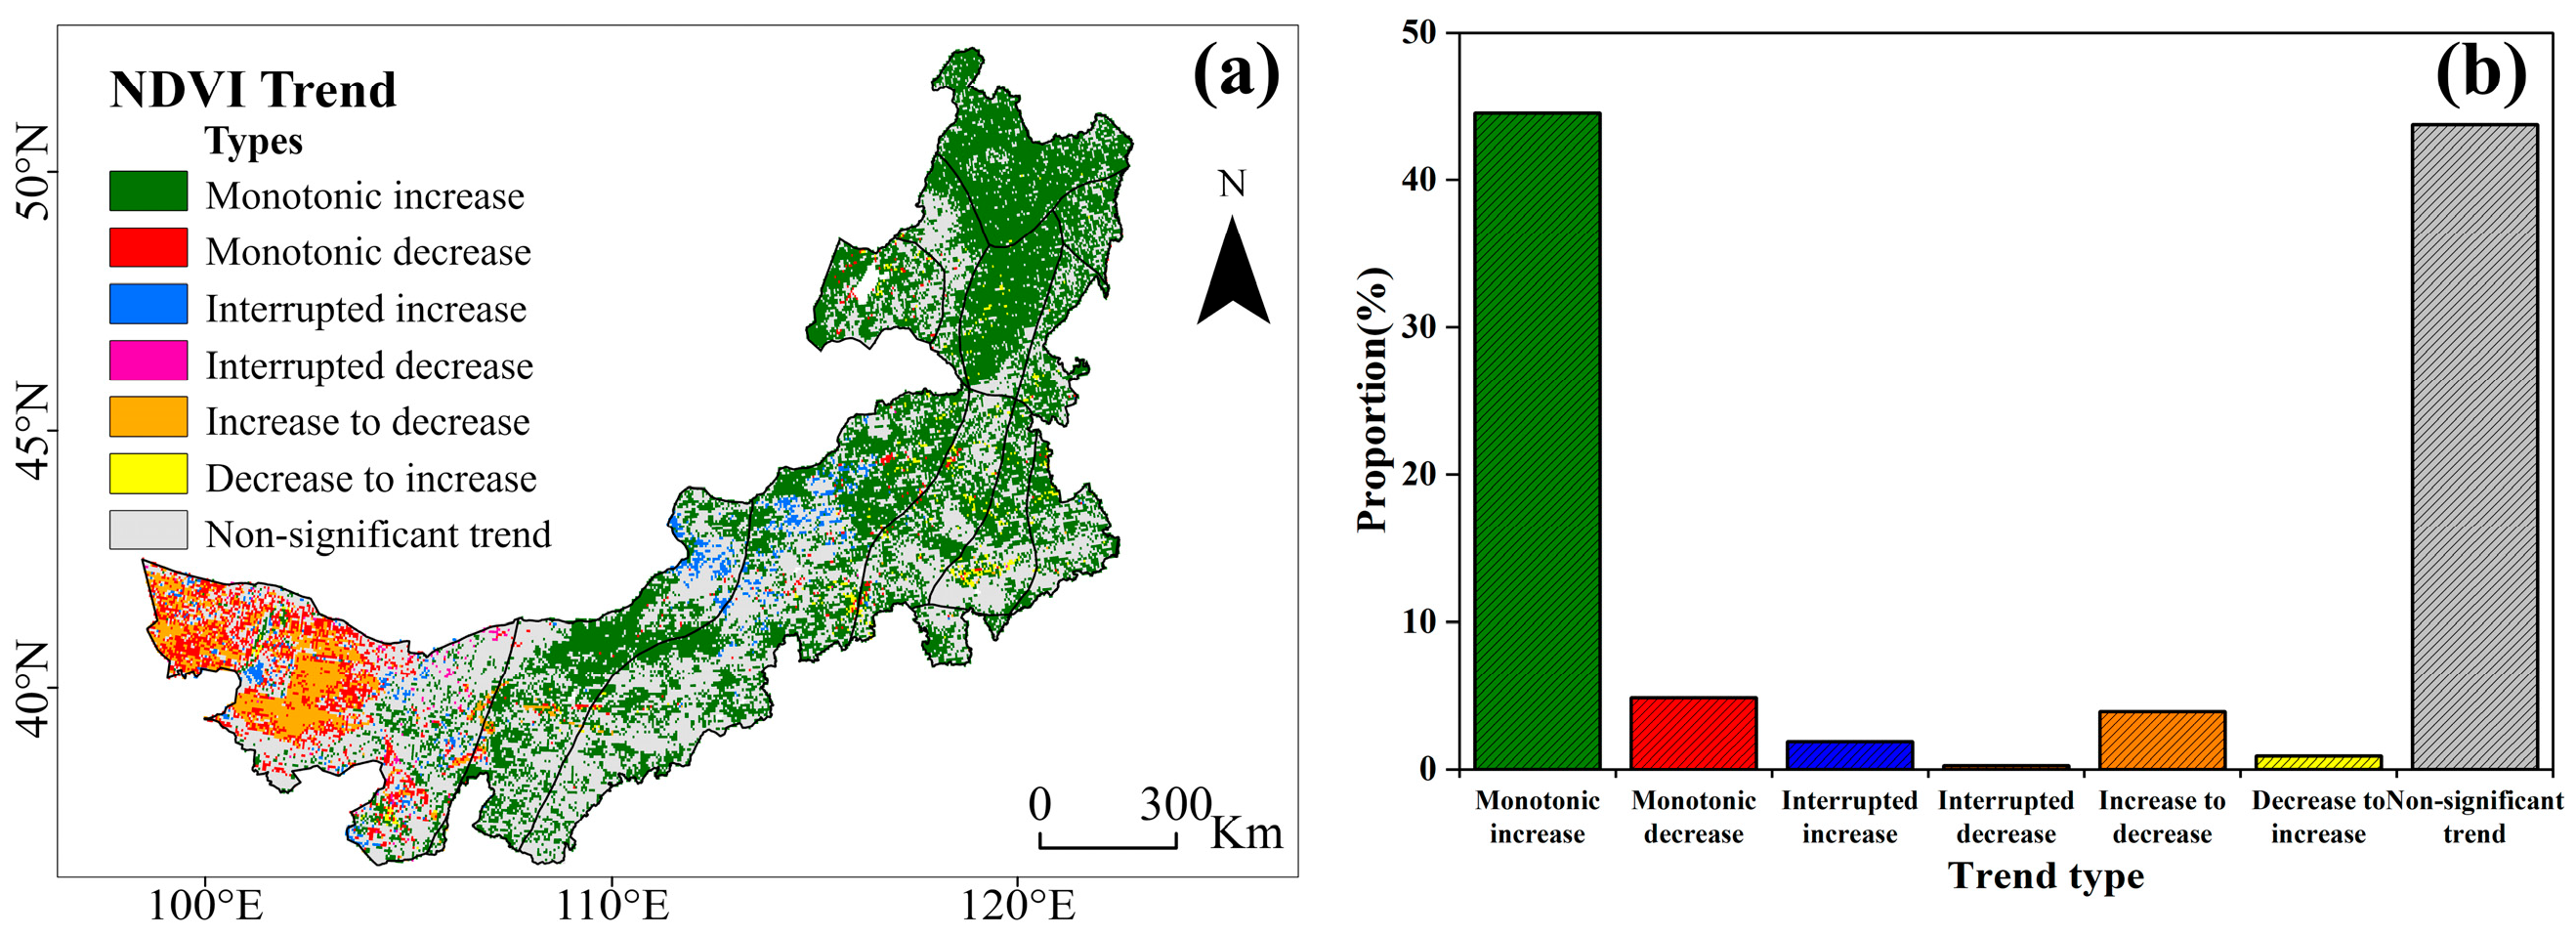
3.2.3. Non-Linear Spatial Trends

By applying the BFAST01 algorithm to detect and classify NDVI change trends from 1982 to 2022 across the IMP, we generated spatial distribution maps of various types of non-linear NDVI trends (Figure 6). Statistical analysis showed that 43.72% of the region exhibited a non-significant trend. Among the significant types, the monotonic increase was the most prevalent, covering 44.52% of the area, followed by monotonic decrease (4.84%) and increase to decrease (3.91%). The proportions of interrupted increase, interrupted decrease, and decrease to increase were relatively small, accounting for 1.86%, 0.26%, and 0.89%, respectively. These results indicate that the non-linear trend classification offers clear distinctions among different patterns, revealing significant differences between them. Relying solely on linear trend analysis may overlook abrupt shifts and phase changes in the evolution of vegetation dynamics.
Overall, the widespread monotonic increase trend reflects continuous vegetation improvement across most of Inner Mongolia from 1982 to 2022. However, the presence of monotonic decrease and increase to decrease trends in some regions indicates a persistent risk of vegetation degradation. Spatially, non-linear vegetation trends vary significantly across ecological zones. The monotonic increase trend is the most common, showing broad, continuous areas of greening, especially in the eastern zones (IA1, IIA3, IIB2, IIC4) and IID1. These areas have experienced minimal disturbance over the past 40 years, with some undergoing rapid short-term greening, suggesting long-term positive trends. In contrast, monotonic decrease trends are concentrated in western IID2, where vegetation shows limited improvement. The interrupted increase trend appears mainly in western IID2 and central grasslands, while the interrupted decrease trend is rare, seen in small patches in southeastern IID2. The increase to decrease trend in western IID2 indicates possible long-term degradation, while decrease to increase is sparsely distributed in southern IID2 and scattered southeastern areas, suggesting ecological recovery. Lastly, non-significant trends occur in zones IB3, IIC2, IIC3, IID1, and IID2, indicating relatively stable or slowly changing ecosystems.

4. Discussion

4.1. Integrated Patterns and Drivers of Vegetation Change

Between 1982 and 2022, NDVI across the IMP demonstrated a significant upward trend, indicating sustained improvement in regional vegetation cover. The marked improvement in vegetation growth post-2013 may be attributed to human-led ecological restoration, particularly the implementation of Phase II of the Beijing–Tianjin Sand Source Control Project initiated that year. This large-scale ecological initiative, through extensive sand stabilization and grassland restoration efforts, greatly enhanced ecosystem resilience and transformed degraded sandy areas into productive grasslands, thereby contributing to a sharp increase in growing-season NDVI values [18]. Summer NDVI, as the peak of the growing season, not only reached the highest values but also reflected the overall annual distribution, emphasizing its dominant role in shaping vegetation patterns across the IMP [36].
Spatially, NDVI trends exhibited pronounced heterogeneity across eco-climate zones, land cover types, and elevation gradients. The most pronounced increases occurred in the warm temperate semi-humid zone (IIIB3), while the arid zones IID1 and IID2 showed weaker or even declining trends. A general decline in NDVI growth rates with increasing latitude and distance from the ocean suggests a strong dependence on regional hydrothermal gradients. In addition to ecological zonation, land cover types and topography also influenced vegetation responses. NDVI increases were particularly prominent in croplands (CRP), likely driven by anthropogenic factors such as irrigation, fertilization, and improved land use management practices [37,38]. Interestingly, NDVI growth rates increased again at elevations above 2000 m, implying that recent warming may have mitigated environmental limitations in alpine zones, thus facilitating vegetation recovery under previously limiting conditions [39].
While linear trend analysis captures the overall upward trajectory of vegetation in the IMP from 1982 to 2022, it fails to reveal the internal stages and structural changes within the trend. The non-linear trend classification based on BFAST01 reveals pronounced spatial differences in vegetation dynamics. The semi-humid to semi-arid zones in the eastern IMP are dominated by a stable and sustained greening trend. In contrast, arid regions in the west exhibit more frequent trend reversals or interrupted fluctuations. These disparities likely stem from differences in hydrothermal conditions, productivity, and external disturbance. In particular, vegetation dynamics in the water-limited and ecologically fragile western regions are more sensitive to the combined effects of extreme climate events and fluctuating human activities.
Collectively, these temporal and spatial dynamics underscore the complex interplay between climate variability, human activities, and topography in shaping vegetation change across the IMP.

4.2. Climatic Influences on Vegetation

Vegetation types and their growth are primarily governed by climatic conditions. These climatic drivers, in conjunction with topography and local environmental contexts, collectively shape ecosystem structures and functions. To assess how vegetation activity responded to climate variability across the IMP, we performed a pixel-wise Pearson correlation between annual NDVI and both temperature and precipitation for the period 1982–2022. Statistical significance was assessed using two-tailed t-tests. The results revealed marked spatial heterogeneity in vegetation–climate relationships (Figure 7). Positive NDVI–temperature correlations dominated most eco-climate zones, particularly in the southern and eastern IMP (Figure 7a). However, certain subregions—namely IID2, IID1, and IIC3—exhibited weaker or even negative correlations. Statistically significant positive correlations (p < 0.01) covered over 36% of the study area, with more than 59% showing significance (p < 0.05) (Figure 7c). In total, 83.12% of the area displayed positive NDVI–temperature associations, while 16.88% exhibited negative correlations. In contrast, NDVI–precipitation relationships showed distinct spatial patterns (Figure 7b). Significant or highly significant positive correlations were predominantly concentrated in grassland regions such as IID1 and IIC3. Conversely, negative correlations were observed mainly in the eastern forested subregions, including IA1, IIA3, and IIB2. Approximately 30% of the region showed highly significant correlations (p < 0.01), while an additional 44% were significant (p < 0.05) (Figure 7d). Overall, 80.89% of the study area exhibited positive NDVI–precipitation correlations, whereas 19.11% showed negative relationships.
To further examine long-term climate trends and their spatial patterns across the IMP, we calculated the differences in mean annual temperature and precipitation between the 1980s and 2010s. The results confirm a clear warming trend across the IMP, with spatially variable magnitudes (Figure 8a). The most substantial warming—exceeding 1 °C—in zones IID2, IID1, and IIC3 followed a west–high to east–low gradient. Precipitation trends displayed similar heterogeneous spatial patterns (Figure 8b), with a general gradient of decreasing increase rates from east to west. While overall precipitation increased during the study period, some areas, particularly in western and northern IID2, IID1, and IIC3, experienced localized declines. The maximum precipitation increase (up to 96 mm) was observed in IA1, IIA3, and IIB2, while the greatest decreases (approximately 20 mm) were recorded in the drier western subregions. On average, annual precipitation increased by 21.79 mm between 1982 and 2022.
Vegetation in the central semi-arid steppe regions, such as IIC3 and IID1, was significantly positively correlated with precipitation but showed no correlation with temperature. This highlights the dominant role of water availability in these grassland systems. Such precipitation-driven responses are consistent with previous findings in arid regions [5,40].
By contrast, in the cold temperate forests of the central and northern Greater Khingan Range, NDVI was significantly positively correlated with temperature and negatively correlated with precipitation. In these previously cold-limited regions, warming reduces frost frequency and intensity, extends the growing season, and enhances photosynthetic activity, thereby promoting forest productivity [41]. Temperature changes thus serve as key regulators of vegetation activity in humid and cold temperate zones [42]. Excessive precipitation may lead to soil saturation and hypoxia, ultimately suppressing root development and reducing aboveground biomass accumulation [43]. Meanwhile, despite pronounced warming, the arid zone IID2 experienced intensified drought stress due to extremely low baseline water availability and localized reductions in precipitation [44,45]. These conditions imposed severe constraints on vegetation growth.
Overall, the relationship between NDVI and climatic factors across the IMP exhibits significant spatial heterogeneity. Precipitation dominates vegetation dynamics in the central grassland zone, while the influence of temperature varies by region—negatively affecting vegetation in the arid west but positively promoting growth in the humid east. However, vegetation in the southeastern Tengger Desert demonstrated minimal climatic sensitivity, whereas in the Hetao Plain, NDVI showed a strong dependence on temperature due to intensive irrigation practices. These contrasting responses highlight the need to further explore non-climatic factors, particularly anthropogenic influences, in shaping regional vegetation patterns.

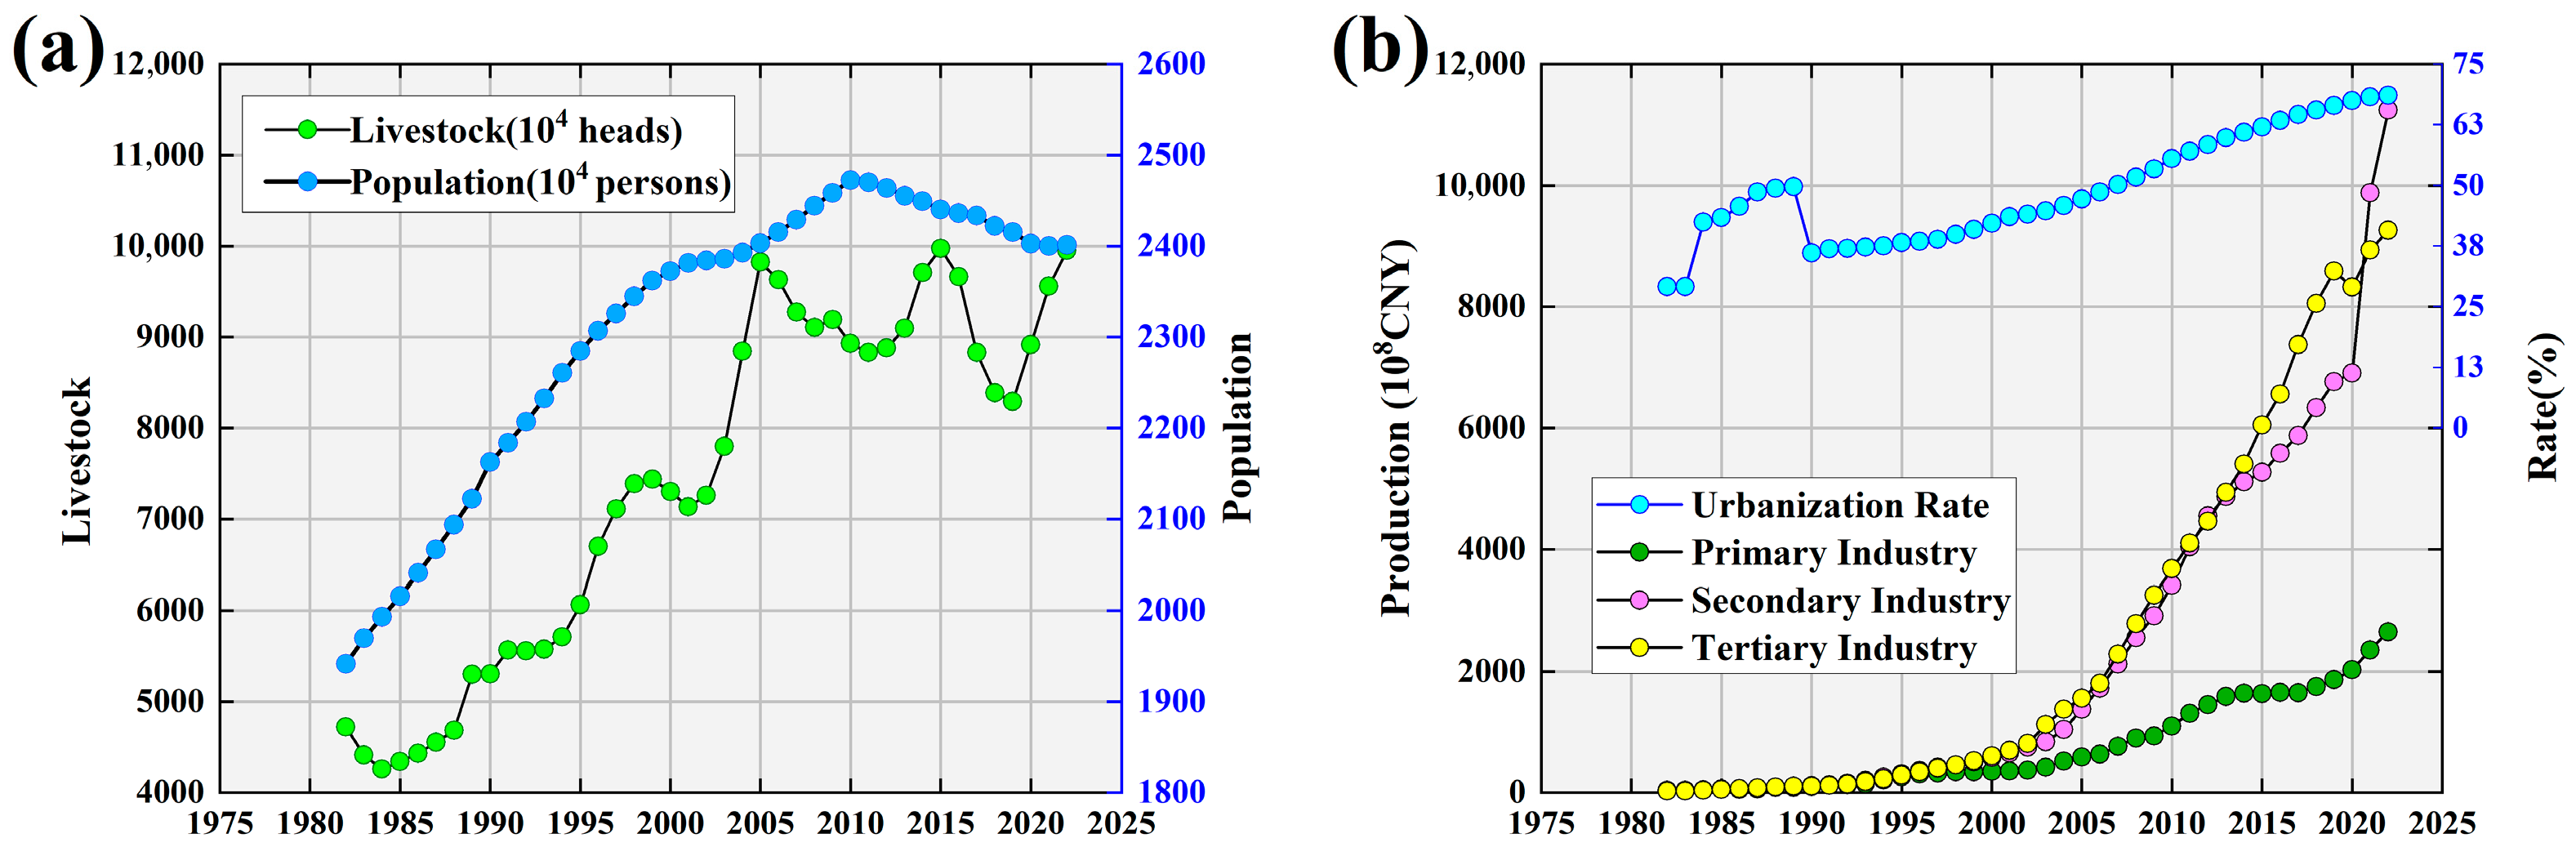
4.3. Human Activities Influences on Vegetation

In addition to climatic drivers, human activities have exerted a significant influence on vegetation patterns across the IMP. Over the past four decades, human pressures have intensified markedly [46]. From 1982 to 2022, the regional population grew from 19.42 million to 24.01 million, while the livestock population more than doubled, rising from 47.22 million to 99.51 million (Figure 9a). As the cornerstone of the regional primary sector, livestock husbandry has profoundly shaped both ecological and economic structures [47]. Stimulated by technological advancement and favorable policies, the output of the primary industry has shown sustained growth (Figure 9b), while the secondary (e.g., mining and energy) and tertiary (e.g., tourism and services) sectors have expanded rapidly. Urbanization surged from 24.9% in 1982 to 70.1% in 2022, indicating substantial land use transformation and socioeconomic development.
To disentangle human influence from climatic effects, we employed the residual trend analysis by regressing NDVI against climate variables and examining the residuals. Positive residuals indicate human-induced greening, while negative values suggest degradation driven by anthropogenic stressors. The results (Figure 10) show that 45.42% of the region exhibited positive residual trends—primarily in the northern Badain Jaran Desert (IID2), Hetao Plain (IID1), southern Horqin Sandy Land (IIC1), and Hulunbuir Grassland (IIC4). Of these, 23.04% exhibited statistically significant positive residual trends (p < 0.01), while an additional 34.03% showed significance (p < 0.05). Conversely, 54.58% of the area exhibited negative residuals, with degradation hotspots in the Badain Jaran Desert, Tengger Desert, Yinshan Mountains (IID1), and Hunshandake Sandy Land (IIC3), as well as scattered patches in the Xilingol Grassland and eastern Greater Khingan Range. Among these, 28.46% reached a high level of statistical significance (p < 0.01), while 27.47% showed significance (p < 0.05).
These patterns reflect differences in the intensity and sustainability of human activities. In areas like the Tengger Desert and Yinshan Mountains, rising population and urbanization have increased demand for meat and dairy, indirectly driving livestock expansion in pastoral zones [48]. Higher livestock density has reduced grassland biomass, weakened vegetation recovery, disturbed soil structure, and increased erosion [17]. Between 2000 and 2005, a surge in livestock numbers coincided with lower NDVI values (Figure 3a), further supporting the negative effects of overgrazing.
Conversely, positive anthropogenic impacts were recorded in the Hetao Plain, southern Horqin Sandy Land, and Hulunbuir Grassland. These regions benefited from agricultural modernization measures—including fertilizer and pesticide use, irrigation expansion, and the implementation of water-saving infrastructure—that enhanced vegetation cover and productivity [38]. In the Hetao Plain of western Inner Mongolia, Yellow River irrigation has transformed shifting dunes into productive farmland, reducing water constraints and making temperature the main yield-limiting factor [49,50]. Meanwhile, national ecological projects—such as the “Three-North” Shelterbelt Project, the Grain-to-Green Program, and the Beijing-Tianjin Sandstorm Source Control Project—have significantly enhanced vegetation cover via afforestation, grazing bans, and soil stabilization. Regions like Hulunbuir and Xilingol with positive NDVI residuals align spatially with policy-implemented zones [51]. These programs have also supported economic development by absorbing rural labor and raising incomes [52]. However, sustainability challenges remain. In arid areas, afforestation suffers from low survival and poor shelterbelt quality due to misaligned species selection and inadequate water assessments. Homogeneous forests with tall trees have caused soil moisture deficits and reduced ecosystem stability. Poor shelterbelt design and management further weaken effectiveness [53].
Similar challenges are also observed in large-scale ecological projects in other arid regions around the world. For instance, although Africa’s Great Green Wall (GWW) initiative has achieved certain progress in vegetation restoration, it continues to face difficulties related to sustained funding, community participation, and coordination across governance systems. The experience of the GWW highlights that the effectiveness of ecological projects depends not only on the scale of afforestation, but more importantly on the establishment of long-term mechanisms that ensure ecological suitability, policy coherence, and collaborative governance across society [54].
Overall, these findings underscore the dual role of human activities in driving both degradation and greening across the IMP. Region-specific land management and policy strategies are therefore essential to balance development with ecosystem sustainability.

4.4. Interactive Effects of Climate Change and Human Activities on Vegetation

Interaction detection results showed that all factor combinations had significantly higher q-values than individual factors, indicating a typical two-factor enhancement effect (Figure 11). NDVI spatial differentiation was mainly driven by interactions between temperature and precipitation (0.92), population and precipitation (0.87), and terrain and precipitation (0.87). Notably, precipitation-involved interactions consistently had high q-values (0.81–0.92), surpassing other combinations. Socioeconomic factors also yielded much higher q-values when coupled with meteorological factors, underscoring the critical role of human–environment coupling. Overall, these results suggest that NDVI variations are shaped not by single drivers, but by complex natural and anthropogenic interactions, highlighting the integrated nature of ecosystem dynamics.
To clarify the respective roles of climate change and human activities in vegetation dynamics, we divided the study area into vegetation improvement and degradation zones and analyzed their relative contributions (Figure 12). In recovery zones, climate change was the dominant driver (Figure 12a), contributing 80–100% in 73.44% of the area, especially across central and eastern IMP. Rising temperatures and increased precipitation created favorable conditions for vegetation growth. In contrast, human activities contributed over 80% in only 1.55% of the region, mainly in the Hetao Plain (Figure 12b), and remained low (0–20%) in 74.39% of the area. In degradation zones, the driving mechanisms were more complex. Human activities dominated in the Badain Jaran Desert, where 46.90% of the area had anthropogenic contributions between 80% and 100% (Figure 12d). Climate change also played a significant role, accounting for 38.51% of the high-contribution areas (Figure 12c). Overall, climate and human factors contributed more evenly to degradation areas, suggesting that vegetation decline is jointly driven by both.
In the western IID2 region, low precipitation and limited natural recovery capacity render the ecosystem highly vulnerable. Intensified by prolonged drought and climatic stress, human disturbances such as overgrazing, farmland expansion, and sand mining have disrupted vegetation structure and stability, resulting in sustained NDVI decline and accelerated ecological degradation [48].
In summary, vegetation improvement areas are predominantly driven by climate change, while vegetation degradation areas are influenced by the combined effects of climate change and human activities. This distinction highlights the need for site-specific ecological restoration and degradation prevention strategies. Management efforts should focus on reinforcing favorable conditions, mitigating adverse disturbances, and promoting the implementation of precise and differentiated regional ecological policies.

4.5. Limitations

Although NDVI is widely used in vegetation monitoring due to its simplicity and availability, it faces notable limitations in arid regions. In areas with high surface exposure and variable soil moisture, NDVI is sensitive to background interference, causing fluctuations that may not reflect actual vegetation conditions. In densely vegetated zones, NDVI often saturates, limiting its capacity to detect further increases in greenness [55]. Consequently, relying solely on NDVI may lead to biased interpretations of vegetation trends. To improve reliability, additional indices should be considered. The Enhanced Vegetation Index (EVI), with greater sensitivity to canopy structure and reduced background noise, helps address NDVI’s limitations under complex surface conditions [56].
In this study, we used EVI data to validate NDVI trends from 2000 to 2022. The results revealed significant spatial variation in their correlation (Figure 13). In western desert areas, NDVI and EVI were negatively correlated; in eastern forested regions, the correlation was generally weak. These patterns confirm NDVI’s susceptibility to background noise in sparse vegetation and saturation in dense vegetation. This highlights the need for an integrated vegetation monitoring framework based on multi-source remote sensing data to reduce bias from relying on a single index.

5. Conclusions

(1)
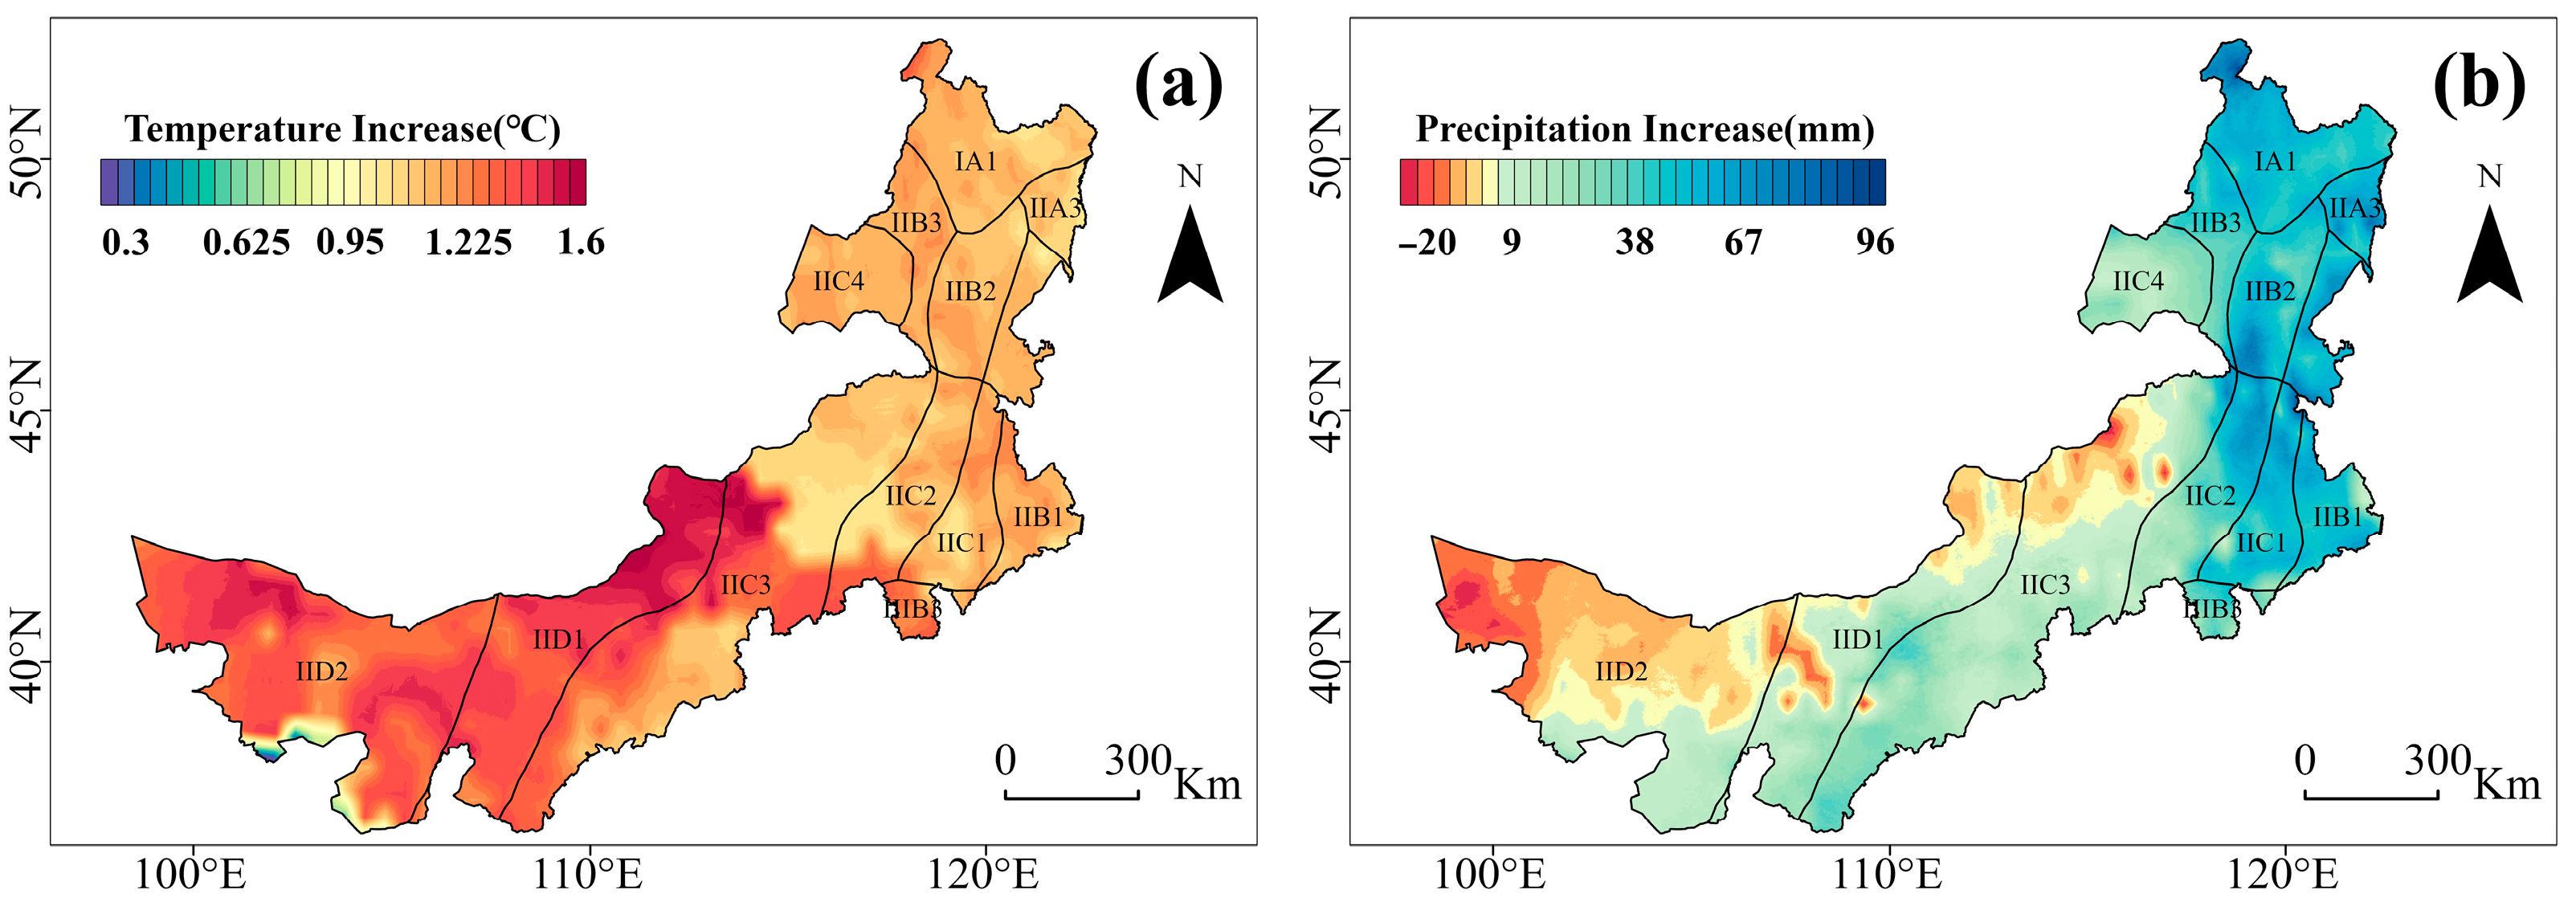
From 1982 to 2022, vegetation cover in the IMP showed an overall increasing trend, aligned with regional warming (0.33 °C/10a) and humidification (2.67 mm/10a). Improvements were mainly concentrated in the humid and semi-humid east and parts of the central arid and semi-arid zones. Eco-climate zone analysis showed that hydrothermal conditions primarily shaped NDVI spatial patterns along the temperature–moisture gradient. Land use analysis revealed distinct ecosystem responses to both climatic and anthropogenic drivers, while altitudinal patterns indicated notable vegetation recovery in alpine regions, especially at higher elevations, suggesting strong restoration potential. Moreover, non-linear trend analysis showed that over half of vegetated areas experienced breakpoints, with interruption increase and increase to decrease being the most frequent, indicating phased and complex vegetation responses to long-term climate change.
(2)
Vegetation dynamics across the IMP were shaped by both climate and human factors, showing pronounced spatial heterogeneity. Temperature was the dominant driver in eastern forested zones, while excessive precipitation suppressed growth in some areas. In central grasslands, vegetation change was primarily driven by precipitation, whereas rising temperatures intensified drought in the arid west, limiting growth. Human activities had both positive effects in the Hetao Plain and southern Horqin Sandy Land and negative impacts in southern deserts and central grasslands, reflecting their dual role in vegetation change. These results highlight the need to further examine the interaction and relative contributions of natural and human influences.
(3)
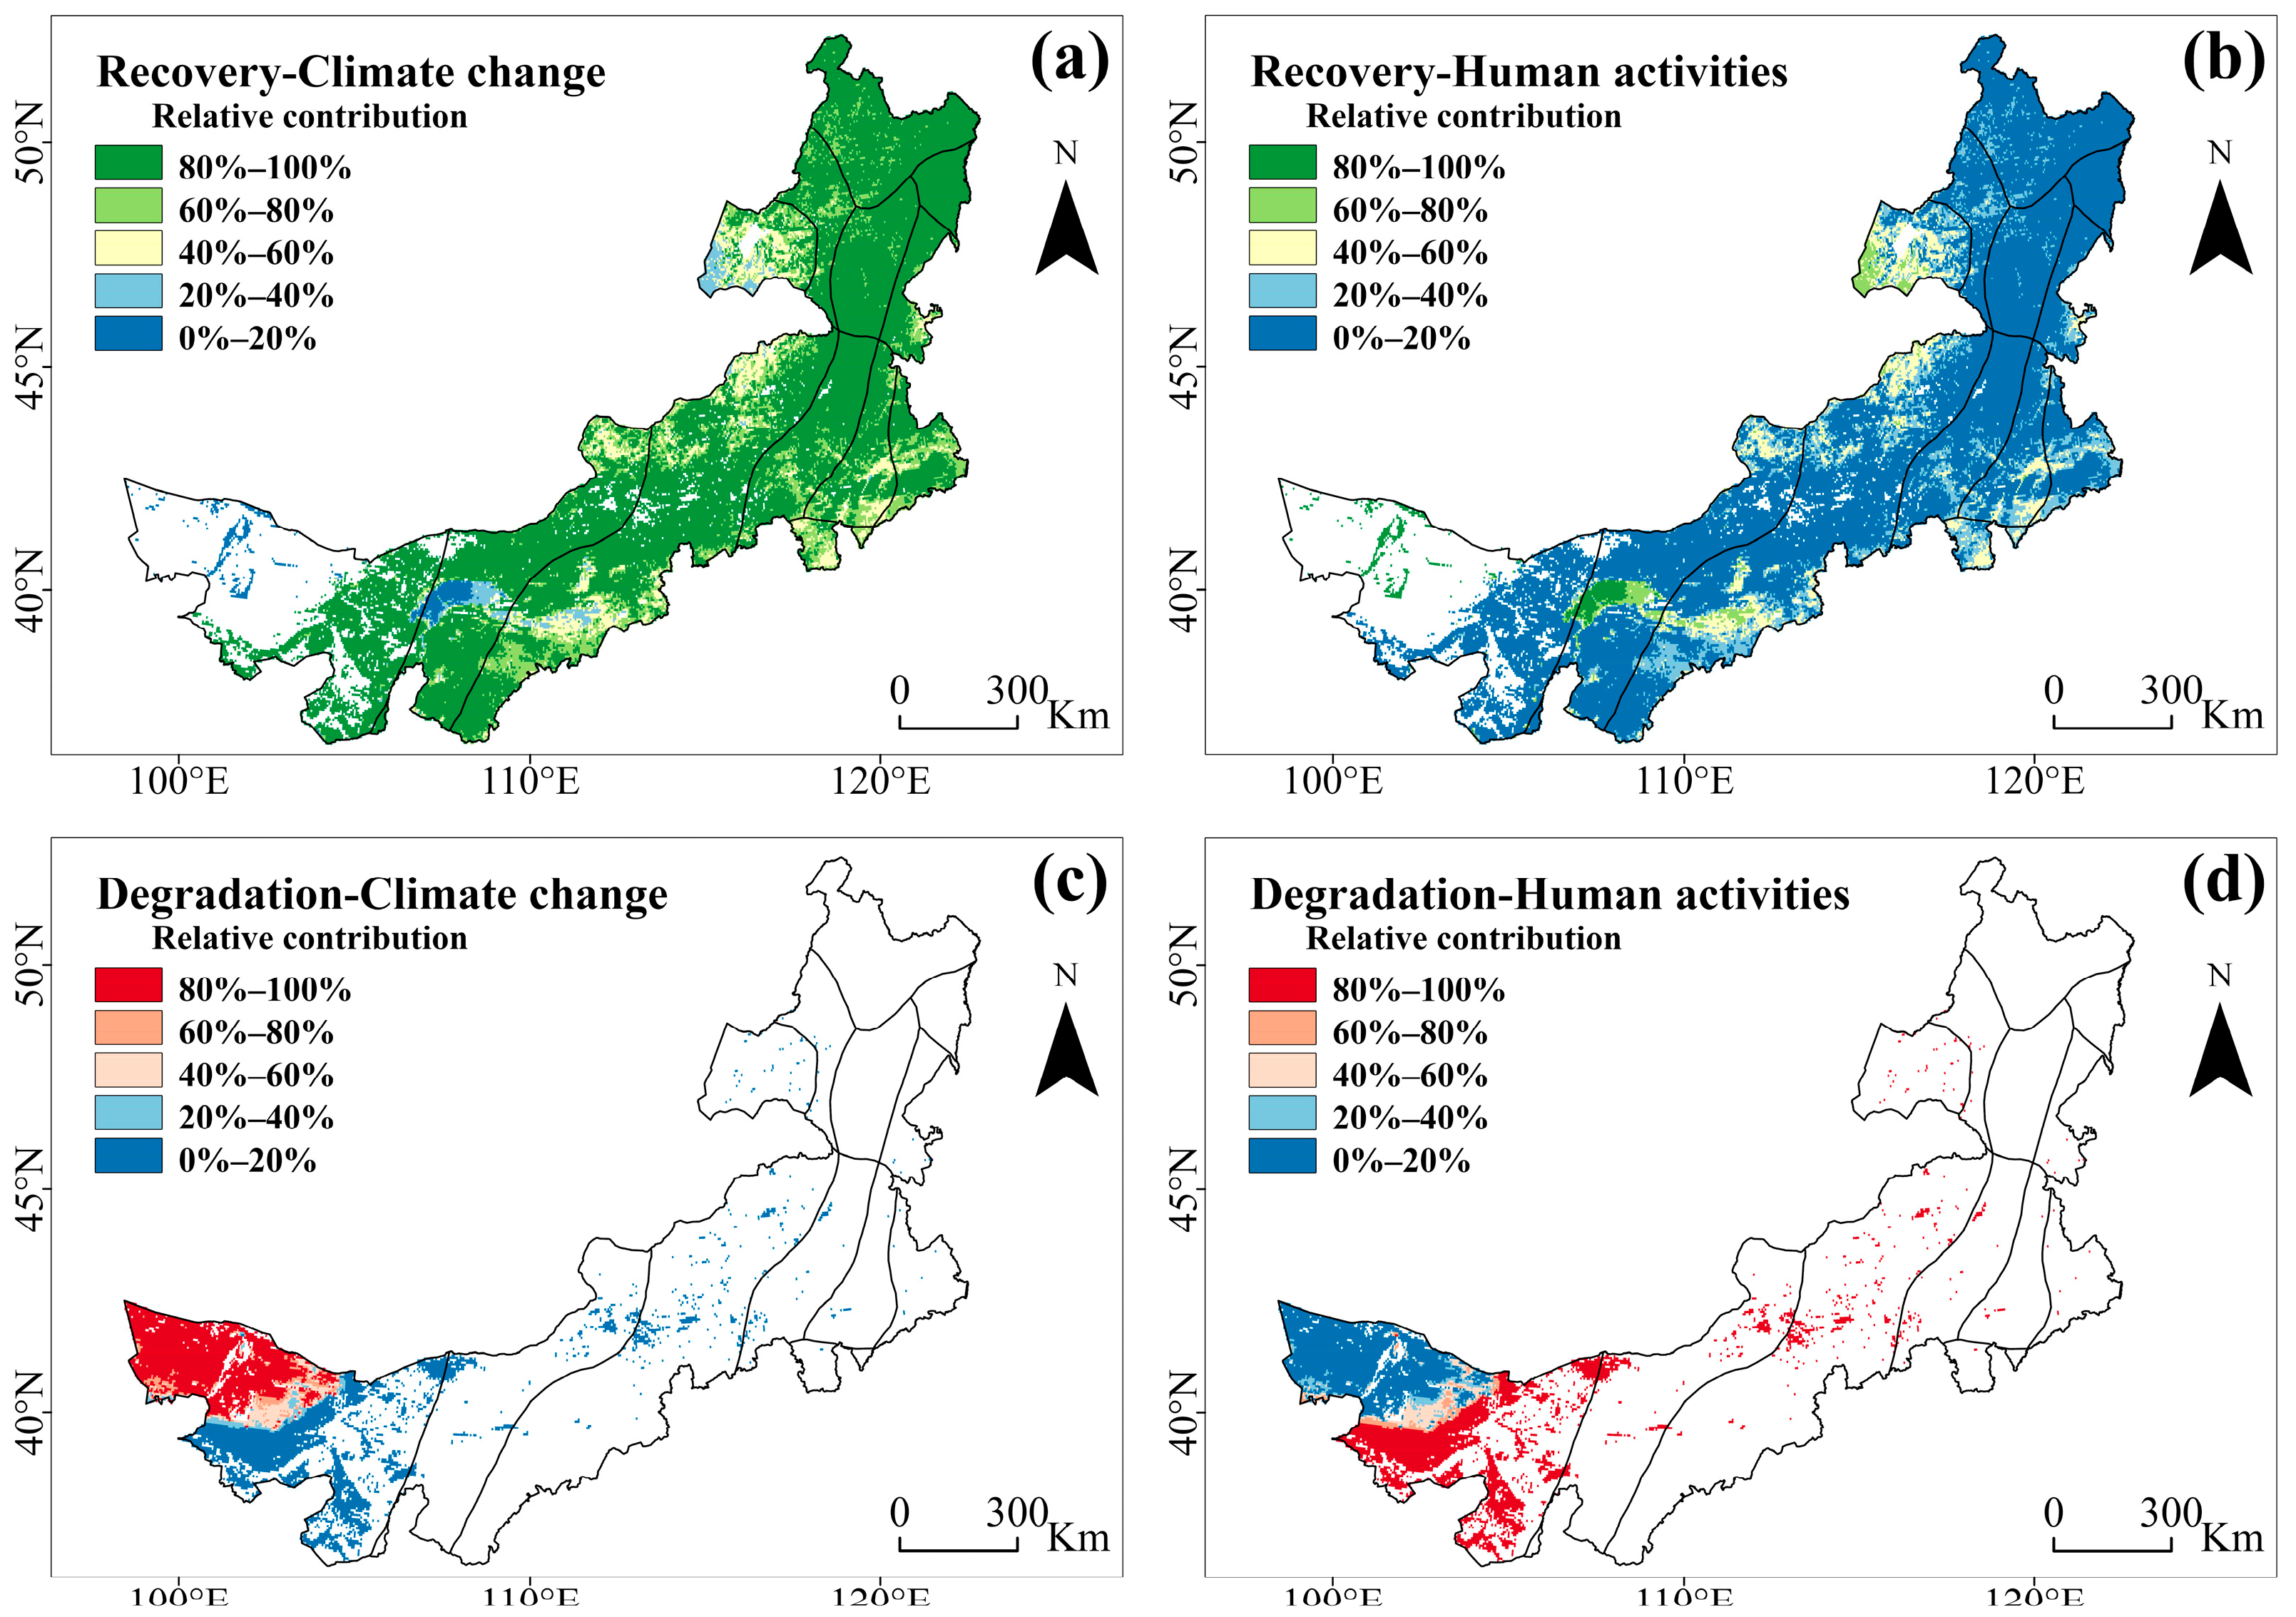
The interaction between temperature and precipitation, as well as the joint impact of climate and socioeconomic factors, played key roles in shaping the spatial patterns of NDVI. Climate change mainly drove vegetation recovery, especially in the central and eastern regions, while vegetation decline was often linked to both climate stress and human activities. These results highlight the need for ecological management strategies tailored to regional conditions.

Author Contributions

Conceptualization, X.Z.; methodology, G.G. and Y.Z.; validation, Y.Z.; formal analysis, G.G. and Y.Z.; investigation, G.G.; data curation, G.G.; writing—original draft preparation, G.G.; writing—review and editing, X.Z.; supervision, X.Z.; funding acquisition, X.Z. All authors have read and agreed to the published version of the manuscript.

Funding

This research was funded by the Natural Science Foundation of China, grant number 42301137, and Natural Science Research of Jiangsu Higher Education Institutions of China, grant number 23KJB170007, and Science Foundation of Jiangsu Normal University, grant number 23XFRS027.

Data Availability Statement

The NDVI dataset is available at https://doi.org/10.6084/m9.figshare.c.7002225.v1 (accessed on 9 November 2024). The EVI dataset is available at http://www.resdc.cn/DOI (accessed on 9 July 2025). Climate datasets (temperature and precipitation) are available at https://data.tpdc.ac.cn/zh-hans/data/71ab4677-b66c-4fd1-a004-b2a541c4d5bf (accessed on 9 November 2024) and https://data.tpdc.ac.cn/zh-hans/data/faae7605-a0f2-4d18-b28f-5cee413766a2 (accessed on 9 November 2024). ESA CCI land cover data is available at https://dx.doi.org/10.5285/26a0f46c95ee4c29b5c650b129aab788 (accessed on 9 November 2024). Copernicus global digital elevation model is available at https://doi.org/10.5069/G9028PQB (accessed on 9 November 2024). Socio-economic data are available at http://www.stats.gov.cn/english/ (accessed on 12 April 2025). GlobPOP data is available at https://zenodo.org/records/11179644 (accessed on 9 July 2025).

Conflicts of Interest

The authors declare no conflicts of interest.

References

  1. Masson-Delmotte, V.; Zhai, P.; Pirani, A.; Connors, S.L.; Péan, C.; Berger, S.; Caud, N.; Chen, Y.; Goldfarb, L.; Gomis, M. Climate change 2021: The physical science basis. Contribution of working group I to the sixth assessment report of the intergovernmental panel on climate change. Camb. Univ. Press 2021, 2, 2391. [Google Scholar]
  2. Brando, P.M.; Balch, J.K.; Nepstad, D.C.; Morton, D.C.; Putz, F.E.; Coe, M.T.; Silvério, D.; Macedo, M.N.; Davidson, E.A.; Nóbrega, C.C. Abrupt increases in Amazonian tree mortality due to drought–fire interactions. Proc. Natl. Acad. Sci. USA 2014, 111, 6347–6352. [Google Scholar] [CrossRef] [PubMed]
  3. Piao, S.; Zhang, X.; Chen, A.; Liu, Q.; Lian, X.; Wang, X.; Peng, S.; Wu, X. The impacts of climate extremes on the terrestrial carbon cycle: A review. Sci. China Earth Sci. 2019, 62, 1551–1563. [Google Scholar] [CrossRef]
  4. Steffen, W.; Broadgate, W.; Deutsch, L.; Gaffney, O.; Ludwig, C. The trajectory of the Anthropocene: The great acceleration. Anthr. Rev. 2015, 2, 81–98. [Google Scholar] [CrossRef]
  5. Wang, S.; Li, R.; Wu, Y.; Zhao, S. Vegetation dynamics and their response to hydrothermal conditions in Inner Mongolia, China. Glob. Ecol. Conserv. 2022, 34, e02034. [Google Scholar] [CrossRef]
  6. Wang, X.; Piao, S.; Ciais, P.; Li, J.; Friedlingstein, P.; Koven, C.; Chen, A. Spring temperature change and its implication in the change of vegetation growth in North America from 1982 to 2006. Proc. Natl. Acad. Sci. USA 2011, 108, 1240–1245. [Google Scholar] [CrossRef]
  7. Ge, W.; Deng, L.; Wang, F.; Han, J. Quantifying the contributions of human activities and climate change to vegetation net primary productivity dynamics in China from 2001 to 2016. Sci. Total Environ. 2021, 773, 145648. [Google Scholar] [CrossRef] [PubMed]
  8. Lai, J.; Zhao, T.; Qi, S. Spatiotemporal variation in vegetation and its driving mechanisms in the southwest alpine canyon area of China. Forests 2023, 14, 2357. [Google Scholar] [CrossRef]
  9. Gong, Z.; Kawamura, K.; Ishikawa, N.; Goto, M.; Wulan, T.; Alateng, D.; Yin, T.; Ito, Y. MODIS normalized difference vegetation index (NDVI) and vegetation phenology dynamics in the Inner Mongolia grassland. Solid Earth 2015, 6, 1185–1194. [Google Scholar] [CrossRef]
  10. Friedlingstein, P.; Cox, P.; Betts, R.; Bopp, L.; von Bloh, W.; Brovkin, V.; Cadule, P.; Doney, S.; Eby, M.; Fung, I. Climate–carbon cycle feedback analysis: Results from the C 4 MIP model intercomparison. J. Clim. 2006, 19, 3337–3353. [Google Scholar] [CrossRef]
  11. Nemani, R.R.; Keeling, C.D.; Hashimoto, H.; Jolly, W.M.; Piper, S.C.; Tucker, C.J.; Myneni, R.B.; Running, S.W. Climate-driven increases in global terrestrial net primary production from 1982 to 1999. Science 2003, 300, 1560–1563. [Google Scholar] [CrossRef]
  12. Siero, E.; Siteur, K.; Doelman, A.; Koppel, J.V.D.; Rietkerk, M.; Eppinga, M.B. Grazing away the resilience of patterned ecosystems. Am. Nat. 2019, 193, 472–480. [Google Scholar] [CrossRef] [PubMed]
  13. Wei, Y.; Zhu, L.; Chen, Y.; Cao, X.; Yu, H. Spatiotemporal variations in drought and vegetation response in Inner Mongolia from 1982 to 2019. Remote Sens. 2022, 14, 3803. [Google Scholar] [CrossRef]
  14. Hu, Q.; Pan, F.; Pan, X.; Zhang, D.; Li, Q.; Pan, Z.; Wei, Y. Spatial analysis of climate change in Inner Mongolia during 1961–2012, China. Appl. Geogr. 2015, 60, 254–260. [Google Scholar] [CrossRef]
  15. Wang, Y.; Liu, G.; Guo, E. Spatial distribution and temporal variation of drought in Inner Mongolia during 1901–2014 using Standardized Precipitation Evapotranspiration Index. Sci. Total Environ. 2019, 654, 850–862. [Google Scholar] [CrossRef]
  16. Sha, Z.; Zhong, J.; Bai, Y.; Tan, X.; Li, J. Spatio-temporal patterns of satellite-derived grassland vegetation phenology from 1998 to 2012 in Inner Mongolia, China. J. Arid Land 2016, 8, 462–477. [Google Scholar] [CrossRef]
  17. Huang, L.; Ning, J.; Zhu, P.; Zheng, Y.; Zhai, J. The conservation patterns of grassland ecosystem in response to the forage-livestock balance in North China. J. Geogr. Sci. 2021, 31, 518–534. [Google Scholar] [CrossRef]
  18. Zhao, X.; Zhang, F.; Liu, Q.; Li, Y.; Jing, Y.; Lu, Y. Climate change overshadows human activities in enhancing vegetation activity in Inner Mongolia. Theor. Appl. Climatol. 2023, 154, 245–259. [Google Scholar] [CrossRef]
  19. Zhang, Y.; Zhang, L.; Wang, J.; Dong, G.; Wei, Y. Quantitative analysis of NDVI driving factors based on the geographical detector model in the Chengdu-Chongqing region, China. Ecol. Indic. 2023, 155, 110978. [Google Scholar] [CrossRef]
  20. Gamon, J.A.; Huemmrich, K.F.; Stone, R.S.; Tweedie, C.E. Spatial and temporal variation in primary productivity (NDVI) of coastal Alaskan tundra: Decreased vegetation growth following earlier snowmelt. Remote Sens. Environ. 2013, 129, 144–153. [Google Scholar] [CrossRef]
  21. Li, C.; Leal Filho, W.; Yin, J.; Hu, R.; Wang, J.; Yang, C.; Yin, S.; Bao, Y.; Ayal, D.Y. Assessing vegetation response to multi-time-scale drought across inner Mongolia plateau. J. Clean. Prod. 2018, 179, 210–216. [Google Scholar] [CrossRef]
  22. Bai, Y.; Han, X.; Wu, J.; Chen, Z.; Li, L. Ecosystem stability and compensatory effects in the Inner Mongolia grassland. Nature 2004, 431, 181–184. [Google Scholar] [CrossRef] [PubMed]
  23. Wang, Z.; Xu, D.; Yang, H.; Ding, X.; Li, D. Impacts of climate change and human activities on vegetation dynamics in Inner Mongolia, 1981–2010. Prog. Geogr. 2017, 36, 1025–1032. [Google Scholar]
  24. Li, H.; Cao, Y.; Xiao, J.; Yuan, Z.; Hao, Z.; Bai, X.; Wu, Y.; Liu, Y. A daily gap-free normalized difference vegetation index dataset from 1981 to 2023 in China. Sci. Data 2024, 11, 527. [Google Scholar] [CrossRef] [PubMed]
  25. Peng, S. 1-km Monthly Mean Temperature Dataset for China (1901–2023); National Tibetan Plateau/Third Pole Environment Data Center: Beijing, China, 2019. [Google Scholar]
  26. Peng, S. 1-km Monthly Precipitation Dataset for China (1901–2023); National Tibetan Plateau/Third Pole Environment Data Center: Beijing, China, 2020. [Google Scholar]
  27. Liu, L.; Cao, X.; Li, S.; Jie, N.A. A 31-year (1990–2020) global gridded population dataset generated by cluster analysis and statistical learning. Sci. Data 2024, 11, 124. [Google Scholar] [CrossRef]
  28. European Space Agency. Copernicus Global Digital Elevation Model; European Space Agency: Paris, France, 2021. [Google Scholar]
  29. Zheng, D.; Yang, Q.; Wu, S. China’s Ecogeographical Regionalization Research; The Commercial Press: Beijing, China, 2008. [Google Scholar]
  30. Shaohong, W.; Qinye, Y.; Du, Z. Delineation of eco-geographic regional system of China. J. Geogr. Sci. 2003, 13, 309–315. [Google Scholar] [CrossRef]
  31. Shao, Y.; Taff, G.N.; Ren, J.; Campbell, J.B. Characterizing major agricultural land change trends in the Western Corn Belt. ISPRS J. Photogramm. Remote Sens. 2016, 122, 116–125. [Google Scholar] [CrossRef]
  32. Hamed, K.H. Trend detection in hydrologic data: The Mann–Kendall trend test under the scaling hypothesis. J. Hydrol. 2008, 349, 350–363. [Google Scholar] [CrossRef]
  33. Verbesselt, J.; Hyndman, R.; Newnham, G.; Culvenor, D. Detecting trend and seasonal changes in satellite image time series. Remote Sens. Environ. 2010, 114, 106–115. [Google Scholar] [CrossRef]
  34. Brakhasi, F.; Hajeb, M.; Mielonen, T.; Matkan, A.; Verbesselt, J. Investigating aerosol vertical distribution using CALIPSO time series over the Middle East and North Africa (MENA), Europe, and India: A BFAST-based gradual and abrupt change detection. Remote Sens. Environ. 2021, 264, 112619. [Google Scholar] [CrossRef]
  35. Wang, J.; Xu, C.D. Geodetector: Principle and prospective. Acta Geogr. Sin. 2017, 72, 116–134. [Google Scholar]
  36. Tuo, M.; Xu, G.; Zhang, T.; Guo, J.; Zhang, M.; Gu, F.; Wang, B.; Yi, J. Contribution of climatic factors and human activities to vegetation changes in arid grassland. Sustainability 2024, 16, 794. [Google Scholar] [CrossRef]
  37. Sun, R.; Chen, S.; Su, H. Spatiotemporal variations of NDVI of different land cover types on the Loess Plateau from 2000 to 2016. Prog. Geogr. 2019, 38, 1248–1258. [Google Scholar] [CrossRef]
  38. Sun, Y.; Guo, P.; Yan, X.; Zhao, T. Dynamics of Vegetation Cover and Its Relationship with Climate Change and Human Activities in Inner Mongolia. J. Nat. Resour. 2010, 25, 407–414. [Google Scholar]
  39. Wei, Y.; Lu, H.; Wang, J.; Wang, X.; Sun, J. Dual influence of climate change and anthropogenic activities on the spatiotemporal vegetation dynamics over the Qinghai-Tibetan plateau from 1981 to 2015. Earth’s Future 2022, 10, e2021EF002566. [Google Scholar] [CrossRef]
  40. Yan, Z.; Zhang, S.; Wang, Y. Spatiotemporal dynamics of fractional vegetation cover and climate response in Inner Mongolia during 1982–2021 based on GEE. Trans. Chin. Soc. Agric. Eng. 2023, 39, 94–102. [Google Scholar]
  41. Mao, D.; Wang, Z.; Luo, L.; Ren, C. Integrating AVHRR and MODIS data to monitor NDVI changes and their relationships with climatic parameters in Northeast China. Int. J. Appl. Earth Obs. Geoinf. 2012, 18, 528–536. [Google Scholar] [CrossRef]
  42. Zhang, X.; Friedl, M.A.; Schaaf, C.B.; Strahler, A.H. Climate controls on vegetation phenological patterns in northern mid-and high latitudes inferred from MODIS data. Glob. Change Biol. 2004, 10, 1133–1145. [Google Scholar] [CrossRef]
  43. Fang, J.; Piao, S.; Zhou, L.; He, J.; Wei, F.; Myneni, R.B.; Tucker, C.J.; Tan, K. Precipitation patterns alter growth of temperate vegetation. Geophys. Res. Lett. 2005, 32, 21411–21416. [Google Scholar] [CrossRef]
  44. Chuai, X.; Huang, X.J.; Wang, W.; Bao, G. NDVI, temperature and precipitation changes and their relationships with different vegetation types during 1998–2007 in Inner Mongolia, China. Int. J. Climatol. 2013, 33, 1696–1706. [Google Scholar] [CrossRef]
  45. Liu, Z.; Dong, Z.; Wang, J.; Cui, X.; Zhang, Y.; Jiao, Y.; Luo, W.; Lu, J.; Yang, L.; Li, J. Vegetation Characteristics in the Marginal Areas of the Badain Jaran Desert. J. Desert Res. 2016, 36, 1348. [Google Scholar]
  46. Zhai, X.; Liang, X.; Yan, C.; Xing, X.; Jia, H.; Wei, X.; Feng, K. Vegetation dynamic changes and their response to ecological engineering in the Sanjiangyuan Region of China. Remote Sens. 2020, 12, 4035. [Google Scholar] [CrossRef]
  47. Niu, X.; He, M.; Zhang, Y.; Luan, Z. A Study on the Relationship Between Livestock Carbon Emission and Economic Growth in Inner Mongolia. Sustainability 2024, 16, 10180. [Google Scholar] [CrossRef]
  48. Zhang, H.; Fan, J.; Cao, W.; Harris, W.; Li, Y.; Chi, W.; Wang, S. Response of wind erosion dynamics to climate change and human activity in Inner Mongolia, China during 1990 to 2015. Sci. Total Environ. 2018, 639, 1038–1050. [Google Scholar] [CrossRef]
  49. Tong, S.; Zhang, J.; Ha, S.; Lai, Q.; Ma, Q. Dynamics of fractional vegetation coverage and its relationship with climate and human activities in Inner Mongolia, China. Remote Sens. 2016, 8, 776. [Google Scholar] [CrossRef]
  50. Xin, Z.; Xu, J.; Zheng, W. Spatiotemporal variations of vegetation cover on the Chinese Loess Plateau (1981–2006): Impacts of climate changes and human activities. Sci. China Ser. D Earth Sci. 2008, 51, 67–78. [Google Scholar] [CrossRef]
  51. Wang, Z.; Yu, Q.; Guo, L. Quantifying the impact of the grain-for-green program on ecosystem health in the typical agro-pastoral ecotone: A case study in the Xilin Gol league, Inner Mongolia. Int. J. Environ. Res. Public Health 2020, 17, 5631. [Google Scholar] [CrossRef]
  52. Li, M.-M.; Liu, A.-T.; Zou, C.-J.; Xu, W.-D.; Shimizu, H.; Wang, K. An overview of the “Three-North” Shelterbelt project in China. For. Stud. China 2012, 14, 70–79. [Google Scholar] [CrossRef]
  53. Zhai, J.; Wang, L.; Liu, Y.; Wang, C.; Mao, X.J. Assessing the effects of China’s three-north shelter forest program over 40 years. Sci. Total Environ. 2023, 857, 159354. [Google Scholar] [CrossRef] [PubMed]
  54. Turner, M.D.; Carney, T.; Lawler, L.; Reynolds, J.; Kelly, L.; Teague, M.S.; Brottem, L. Environmental rehabilitation and the vulnerability of the poor: The case of the Great Green Wall. Land Use Policy 2021, 111, 105750. [Google Scholar] [CrossRef]
  55. Huete, A.; Didan, K.; Miura, T.; Rodriguez, E.P.; Gao, X.; Ferreira, L.G. Overview of the radiometric and biophysical performance of the MODIS vegetation indices. Remote Sens. Environ. 2002, 83, 195–213. [Google Scholar] [CrossRef]
  56. Huete, A.; Justice, C.; Van Leeuwen, W. MODIS vegetation index (MOD13). Algorithm Theor. Basis Doc. 1999, 3, 295–309. [Google Scholar]
Figure 1. Geographic location of the study area.
Land 14 01559 g001
Figure 2. Eco-climate zones and vegetation types/land cover on the Inner Mongolian Plateau.
Land 14 01559 g002
Figure 3. Monthly trends (a) and growing-season trends (b) in the normalized difference vegetation index (NDVI) across the Inner Mongolian Plateau from 1982 to 2022. Seasons are defined as spring (March–May), summer (June–August), autumn (September–November), and winter (December–February). The growing-season spans May–September.
Land 14 01559 g003
Figure 4. Seasonal and annual mean vegetation trends on the Inner Mongolia Plateau from 1982 to 2022: spring (a), summer (b), autumn (c), winter (d), and annual mean (e).
Land 14 01559 g004
Figure 5. The statistical trends of vegetation in different zones: (a) eco-climate zones, (c) vegetation types/land covers, (e) elevation zones at 250 m intervals, and the corresponding areas (b,d,f), indicating the total area of each subzone (1000 km2). Green indicates a positive NDVI trend (median > 0), while red indicate a negative trend (median < 0). (CRP: Cropland; FRT: Forest; URB: Urban areas; GL: Grassland; SRB: Shrubland; WTR: Water; BAR: Bare areas).
Land 14 01559 g005
Figure 6. Spatial distribution of (a) non-linear NDVI trend types and (b) their proportions across the Inner Mongolia Plateau from 1982 to 2022.
Land 14 01559 g006
Figure 7. Correlation coefficients and significance levels for yearly NDVI–Temperature (a,c) and NDVI–Precipitation (b,d) relationships in the Inner Mongolia Plateau during 1982–2022.
Land 14 01559 g007
Figure 8. Climate trends in the Inner Mongolia Plateau based on the 1 km climate dataset (1901–2023). Mean annual temperature (T) and precipitation (P) were calculated for the 1980s and 2010s. The temperature increment map (a) and precipitation increment map (b) were generated by differencing the two periods (mean T/P 2010–2020 minus mean T/P 1980–1990).
Land 14 01559 g008
Figure 9. Population and livestock numbers (a), and output value of the primary, secondary, and tertiary industries along with the urbanization rate (b), in the Inner Mongolia Plateau from 1982 to 2022. (CNY: Chinese Yuan).
Land 14 01559 g009
Figure 10. Spatial distribution of (a) residual trends and (b) significance levels (p-values) of NDVI residuals from the regression of NDVI against precipitation and temperature across the Inner Mongolia Plateau during 1982–2022.
Land 14 01559 g010
Figure 11. Interaction detector results between individual factor pairs and the mean NDVI on the Inner Mongolia Plateau from 1982 to 2022: all interactions exhibited a bi-variable enhancement effect.
Land 14 01559 g011
Figure 12. Spatial distribution of the relative contributions of climate change and human activities to vegetation dynamics on the Inner Mongolia Plateau during 1998–2020, including vegetation recovery areas attributed to climate change (a) and to human activities (b), as well as vegetation degradation areas attributed to climate change (c) and to human activities (d).
Land 14 01559 g012
Figure 13. Spatial distribution of the correlation coefficients (a) and significance levels (b) between NDVI and EVI on the Inner Mongolia Plateau from 2000 to 2022.
Land 14 01559 g013
Table 1. Eco-climate zoning system of Inner Mongolia Plateau.
Temperature ZoneArid/HumidEco-Climate Zone
I Cold temperate zoneA Humid regionIA1 North Da Hinggan mountain deciduous coniferous forest region
II Medium temperate zoneA Humid regionIIA3 East of Northeast China piedmont platform broad-leaved and coniferous mixed forest
B Sub-humid regionIIB1 Middle Songhuajiang and Liaohe plain forest-steppe region
IIB2 Middle Da Hinggan mountain steppe-forest region
IIB3 Hilly land of north part of west Da Hinggan mountain piedmont forest-steppe region
C Semi-arid regionIIC1 West Liaohe plain steppe region
IIC2 West Liaohe plain steppe region
IIC3 East Inner Mongolia mid-altitude plain steppe region
IIC4 Hulun Buir plain steppe region
D Arid regionIID1 Hetao and west Inner Mongolia mid-altitude plain desert steppe region
IID2 Alax and Hexi Corridor shrub and semi-shrub desert region
III Warm temperate zoneB Sub-humid regionIIIB3 North China mountain deciduous broad-leaved forest region
Table 2. The different types of vegetation cover change detected by BFAST01.
Type NameMeaning
Monotonic increaseA significant increase with one significant break or none.
Monotonic decreaseA significant decrease with one significant break or none.
Interrupted increaseAn increasing trend with a negative breakpoint.
Interrupted decreaseA decreasing trend with a positive breakpoint.
Increase to decreaseAn increasing pattern disrupted and followed by a decreasing trend.
Decrease to increaseA decreasing pattern disrupted and followed by an increasing trend.
Non-significant trendNo breakpoint or both segments show no significant trend.
Table 3. Identification criterion and contribution calculation of the drivers of NDVI change.
Slope (NDVIO)Driving FactorsDriving Factors Classification CriteriaContribution of Drivers (%)
Slope (NDVIP)Slope (NDVIH)Climate ChangeHuman Activities
>0P&H>0>0 s l o p e ( N D V I P ) s l o p e ( N D V I O ) s l o p e ( N D V I H ) s l o p e ( N D V I O )
P>0<01000
H<0>00100
<0P&H<0<0 s l o p e ( N D V I P ) s l o p e ( N D V I O ) s l o p e ( N D V I H ) s l o p e ( N D V I O )
P<0>01000
H>0<00100
Table 4. Types of interaction between two covariates.
CriterionInteractive Forms
q(X1∩X2) < min(q(X1), q(X2))Weakened, non-linear
min(q(X1), q(X2)) < q(X1∩X2) < max(q(X1), q(X2))Weakened, single factor non-linear
q(X1∩X2) > max(q(X1), q(X2))Enhanced, double factors
q(X1∩X2) = q(X1) + q(X2)Independent
q(X1∩X2) > q(X1) + q(X2)Enhanced, non-linear
Disclaimer/Publisher’s Note: The statements, opinions and data contained in all publications are solely those of the individual author(s) and contributor(s) and not of MDPI and/or the editor(s). MDPI and/or the editor(s) disclaim responsibility for any injury to people or property resulting from any ideas, methods, instructions or products referred to in the content.

