Article

Do Metropolitan Zoning Asymmetries Influence the Geography of Suburban Growth and Gentrification?

1
Graduate School of Environmental Studies, Seoul National University, Gwanak-ro, Gwanak-gu, Seoul 08826, Republic of Korea
2
Graduate School of Education and Psychology, Pepperdine University, 6100 Center Drive, Los Angeles, CA 90045, USA
*
Author to whom correspondence should be addressed.
Land 2025, 14(8), 1555; https://doi.org/10.3390/land14081555
Submission received: 21 June 2025 / Revised: 22 July 2025 / Accepted: 24 July 2025 / Published: 29 July 2025

Abstract

Zoning policies play a critical role in shaping the geography of urban and suburban development in the United States. Using data from the National Zoning and Land-Use Database and tract-level census data from 42 Metropolitan Statistical Areas, we classify metros into four zoning regime types based on the relative restrictiveness of urban and suburban land-use policies and compare trends in population growth and neighborhood change across these regimes. Our findings show that suburban areas have outpaced urban cores in population growth across all zoning configurations, with the most pronounced growth occurring in metros where restrictive urban zoning coexists with permissive suburban regulation. This growth is disproportionately concentrated in affluent suburban neighborhoods, suggesting a spatial sorting of access to resources and amenities. We also find that urban–suburban gentrification gaps are the smallest in these asymmetrical zoning regimes, suggesting that permissive suburban land use may facilitate spillover effects from constrained cores. These findings suggest that zoning asymmetries shape not only the geography of growth but also the spatial dynamics of gentrification. We argue for a metropolitan perspective on land-use governance to better understand the interconnected nature of suburbanization and the spatial expansion of gentrification.

1. Introduction

In recent decades, U.S. suburbs have undergone a profound transformation, reshaping the demographic, spatial, and economic fabric of American metropolitan areas. Once viewed as stable, affluent, and demographically homogeneous, suburbs are now at the center of dynamic and complex shifts in the nation’s housing and population landscape. Across the country, many suburban communities are experiencing explosive population growth [1], driven by a combination of push factors—such as escalating urban housing costs and restrictive zoning policies—and pull factors including greater land availability and expanded capacity for new housing development. This accelerated suburbanization has rendered suburbs as increasingly fragmented, racially differentiated, and economically unequal landscapes [2,3,4,5].
In contrast to the mid-20th-century model of suburbanization, when middle- and upper-middle-class families left the urban core while lower-income residents remained behind [6]—today’s suburban growth looks very different. It is marked by heightened demographic diversity and intensified market pressures, often originating within the urban core itself [7,8,9]. These pressures are shaped by a confluence of regional dynamics: the geography of employment, housing shortages, migration patterns, and—as this paper emphasizes—the fragmented land-use governance within metropolitan areas. While cities and suburbs are often viewed as independent, they are better understood as flip sides of the same metropolitan ecosystem.
One emerging trend within this broader transformation is suburban gentrification—a process historically thought to be exclusive to central cities but now increasingly visible in certain suburban contexts [10]. While suburban growth and suburban gentrification are distinct processes, we argue that they increasingly unfold in parallel and may be driven by similar intra-metropolitan dynamics, particularly the spatial distribution of housing regulations. A key factor influencing both processes is the metropolitan regulatory environment, namely, zoning and land-use policies. These include minimum lot sizes, lot coverage limits, parking requirements, setback rules (which dictate minimum distances from property lines), height restrictions, and floor area ratio (FAR) caps [11]. These regulations combine to regulate not only the supply and form of housing, but also the overall built environment of metropolitan areas.
Although prior research has established a strong link between restrictive zoning and constrained housing supply [12,13], relatively less attention has been paid to how these policies vary within metropolitan regions. This is a critical oversight, given that land-use policy in the United States largely happens at the local level by municipalities and counties, leading to considerable variation between jurisdictions within metropolitan areas. In some metropolitan areas, for example, central cities maintain restrictive zoning regimes even as surrounding suburban jurisdictions adopt more permissive policies—or vice versa. These mismatches could be referred to as metropolitan zoning asymmetries: configurations in which the relative restrictiveness or permissiveness of land-use policies diverges between urban and suburban municipalities.
This paper argues that zoning asymmetries play a critical role in shaping patterns of both suburban growth and suburban gentrification. We find that suburbs have outpaced urban cores in population growth across all zoning configurations, underscoring the central role of suburbs in contemporary metropolitan growth. The growth was most pronounced in metros, where restrictive urban zoning coexists with more permissive suburban regulation—a dynamic that appears to redirect housing demand and development pressure into suburban jurisdictions. Importantly, this growth has been disproportionately concentrated in affluent suburban communities, particularly those in the top income quintile. This raises critical questions about the spatial concentration of opportunity, the reproduction of inequality, and the uneven distribution of poverty and affluence across suburban landscapes.
We also find that the gap in gentrification rates between urban cores and suburbs is the smallest in metros with the same asymmetrical zoning structure. That is, while gentrification generally occurs more often in urban neighborhoods compared to suburban areas, the difference was relatively smaller in the metros with restrictive central-city zoning and more permissive suburban land-use regimes. This suggests that zoning asymmetries not only influence where growth occurs, but also facilitate the spatial expansion of gentrification, enabling reinvestment and demographic change to spill beyond tightly regulated urban cores. Taken together, these findings underscore the importance of analyzing suburban growth and gentrification not as isolated processes but as interdependent outcomes shaped by regional housing policy ecosystems.

2. A Literature Review

2.1. From Homogeneous Suburbs to Metropolitan Complexity

In the decades following the Second World War, the American suburb emerged as a symbol of “the good life”, offering middle-class families an opportunity to escape the perceived problems of the urban core. Federal policies played a central role in facilitating this mass suburbanization by promoting home construction, offering favorable lending terms, and subsidizing homeownership [6]. However, these early suburbs were not universally accessible; they were explicitly designed to be racially and economically exclusive through mechanisms such as redlining, restrictive covenants, public housing placement, and zoning tools like single-family zoning [14]. These policies effectively entrenched residential segregation and ensured that suburban homeownership remained largely a privilege of white, middle-class families [14,15]. While suburbs prospered, urban areas across much of the U.S. experienced sharp declines. Capital disinvestment, population outmigration, and systemic neglect led to a deterioration of many central cities, a trend that persisted well into the 1960s and 1970s [16].
In recent decades, however, suburbs have undergone a rapid demographic and economic transformation, reshaping the metropolitan landscape. Black, Latino, and Asian American families increasingly moved into suburban neighborhoods, upending the post-war image of racial homogeneity [5,17]. Simultaneously, poverty and immigrant settlement patterns shifted outward, making suburbs home to the fastest-growing poor populations in the U.S. by 2008 [18]. By the end of the Global Financial Crisis in 2010, a majority of the U.S. population resided in suburban areas [19,20]. These shifts have challenged the traditional lens of urban decline and suburban affluence, revealing a fragmented, dynamic, and complex metropolitan reality.
Contributing further to this complexity is the emergence of suburban gentrification. Once considered an urban phenomenon, gentrification is now increasingly evident in inner-ring and even peripheral suburbs. Forces traditionally associated with urban change—capital reinvestment, demographic turnover, and accelerated housing costs—are now transforming suburban neighborhoods as well [21,22]. This evolution signifies a major shift in the geography of gentrification, suggesting that suburbs are no longer insulated from the pressures once seen as exclusive to the urban core. Scholars have only recently begun to explore how suburban gentrification differs in form and impact from its urban counterpart [10,21]. A deeper understanding of these dynamics is crucial for capturing the dynamic complexity of contemporary metropolitan change.

2.2. The Role of Land-Use Regulations

A key force shaping both suburban growth and gentrification is land-use regulation. Historically, suburban jurisdictions enacted exclusionary zoning and anti-growth policies to preserve racial and class homogeneity by limiting the construction of dense or affordable housing [6,23]. In contrast, cities were often cast as “growth machines,” promoting development to attract capital investment and expand local tax bases [24]. While the urban–suburban divide was always something of a false dichotomy, it has become even less so over time. Many cities have since adopted restrictive zoning practices historically associated with suburbs, and there is now significant variation in growth policies both across and within jurisdictions [24,25]. Shifts in land-use policy have contributed to increasingly complex and controversial regulatory geographies within metropolitan regions, see [26]. As housing demand intensifies within the many cities [8] and urban supply remains constrained by restrictive zoning, households are increasingly diverted to less regulated—and often historically less affluent—suburban areas. In this context, both suburban gentrification and suburban growth can be understood as interconnected responses to uneven land-use regimes operating across metropolitan space.
This paper argues that the relative restrictiveness of urban versus suburban land-use regulation within a metropolitan region plays a central role in shaping patterns of neighborhood change. We propose that different combinations of urban and suburban zoning regimes within a metropolitan statistical area (MSA) create distinct conditions for growth and gentrification. Some configurations may fuel rapid suburban expansion, while others may drive gentrification beyond city centers. By focusing on these regional zoning dynamics, we argue that the importance of understanding suburban transformation plays a part in a broader metropolitan policy landscape.

3. Methods and Data

3.1. Measuring Metropolitan Zoning Asymmetries

To assess the restrictiveness of local zoning and land-use policies, we utilized the Zoning Restrictiveness Index (ZRI) scores from the National Zoning and Land-Use Database (NZLUD) [27] 1. In contrast to other land-use regulatory indices such as the Wharton Residential Land-Use Regulatory Index and the National Longitudinal Land-Use Survey, which rely primarily on self-reported survey data, the NZLUD employs natural language processing to systemically analyze the full text of publicly available municipal codes, zoning ordinances, and land-use regulations. This approach allows for broader and more granular coverage, particularly within Metropolitan Statistical Areas (MSAs). The ZRI is constructed as a composite index based on 11 subindices in the NZLUD, offering a robust measure of the overall regulatory stringency of municipalities across the United States. Specifically, principal components analysis of the subindices is employed to construct the ZRI as a weighted sum of the subindex values, with the resulting component loadings serving as weights.
Using data from the NZLUD, we classify the 50 largest Metropolitan Statistical Areas (MSAs) into four categories based on the relative stringency of land-use regulations in their urban cores and suburban municipalities: (1) restrictive urban–restrictive suburban; (2) restrictive urban–permissive suburban; (3) permissive urban–restrictive urban; and (4) permissive urban–permissive suburban. Admittedly, zoning restrictiveness is a relative rather than absolute concept and should be interpreted as such within the context of the sample. For this classification, urban cores are defined as the largest principal city within each MSA, as well as the second- or third-largest city with a population of at least 100,000 residents, building on previous studies on city and suburban neighborhoods [8,28,29,30]. All other jurisdictions within the MSA that do not meet the urban core criterion are designated as suburban municipalities. Due to incomplete municipal coverage in the NZLUD, 8 of the top 50 MSAs are excluded from this analysis, resulting in a final sample of 42 MSAs 2. For each MSA, we assess the relative restrictiveness of zoning in both urban and suburban areas by comparing their respective ZRI scores to those of comparable jurisdictions. In cases where an MSA includes multiple qualifying urban or suburban jurisdictions, we calculate the average ZRI score for each category. An urban or suburban area is classified as restrictive if its average ZRI exceeds the median ZRI for urban or suburban areas among the 42 MSAs; otherwise, it is considered permissive.
The resulting MSA classification is presented in Table 1. Broadly speaking, metropolitan areas in the South and West, such as San Antonio–New Braunfels, TX (4.02), Jacksonville, FL (3.94), and San Diego–Chula Vista–Carlsbad, CA (3.72), tend to have relatively restrictive urban zoning and land-use policies. In contrast, urban areas in the Northeastern and Midwestern metros such as Cincinnati, OH–KY–IN (1.27), Detroit–Warren–Dearborn, MI (1.37), and New York–Newark–Jersey City, NY–NJ–PA (1.60) exhibit more permissive land-use regulatory environments. Suburban municipalities show a different pattern. Larger metropolitan areas like Washington–Arlington–Alexandria, DC–VA–MD–WV (5.41), New York–Newark–Jersey City, NY–NJ–PA (5.22), and San Jose–Sunnyvale–Santa Clara, CA (4.54), tend to impose relatively strict suburban zoning restrictions. In contrast, mid-sized metros such as Jacksonville, FL (−2.42), San Antonio–New Braunfels, TX (−0.15), and Oklahoma City, OK (0.51) have comparatively permissive suburban zoning and land-use policies. Based on this classification, our sample includes 7 restrictive urban–restrictive suburban MSAs, 14 restrictive urban–permissive suburban MSAs, 14 permissive urban–restrictive urban MSAs, and 7 permissive urban–permissive suburban MSAs.

3.2. Classifying Neighborhoods Within Metropolitan Statistical Areas

To examine patterns of population movement toward suburban neighborhoods, we draw on census tract-level data from the 2008–2012 and 2018–2022 American Community Survey (ACS) 5-year estimates. These data were used to represent neighborhood status in 2010 and 2020, respectively. Our initial sample consists of 35,613 census tracts located within 42 MSAs. We exclude tracts with fewer than 200 residents, no households, or missing data on median household income or the share of adults with at least a bachelor’s degree in either the 2012 or 2022 ACS 5-year estimates, as they often have missing values. Consistent with our earlier classification, we define urban tracts as those located within the largest principal city of each MSA, as well as up to two additional cities with populations exceeding 100,000 3. All remaining areas within the MSA boundaries are designated as suburban census tracts. After applying these criteria, the final analytic sample comprises 35,180 census tracts, including 12,549 urban tracts and 22,631 suburban tracts.
We further categorize neighborhoods according to their potential for gentrification. Building on the methodology of prior studies [31,32,33], we identify gentrifiable neighborhoods as census tracts whose median household income in 2010 falls within the bottom 40% of the income distribution in their respective MSAs. Among these gentrifiable tracts, we define gentrifying neighborhoods as those tracts that experienced a marked improvement—defined as more than five percentile points—in their MSA-relative ranking of the share of residents aged 25 and older with at least a bachelor’s degree between 2010 and 2020. All other tracts that fall within the top 60% of the income distribution are categorized as non-gentrifiable neighborhoods, regardless of their educational attainment trends.
Table 2 presents a summary of neighborhood classifications and transitions based on our typology. Among the 35,180 census tracts across the 42 MSAs in our sample, over 14,000 tracts were identified as gentrifiable—that is, low-income neighborhoods in 2010 that could potentially gentrify. These tracts were disproportionately concentrated in urban areas: more than half of urban neighborhoods met the gentrifiable criteria, compared to about one-third of suburban neighborhoods. Gentrification during the 2010s was likewise more prevalent in urban areas, with a larger share of gentrifiable urban tracts experiencing transitions than in suburban settings.
Lastly, we classify 35,180 census tracts across 42 MSAs into quintiles based on their 2010 median household income relative to the income distribution within their respective MSAs. This results in the following distribution: 7010 census tracts fall into the bottom 20% (first quintile), 7037 into the second quintile, 7033 into the third, 7036 into the fourth, and 7064 into the top 20% (fifth quintile).

4. Results

4.1. Population Growth Across Metropolitan and Neighborhood Types

We begin by analyzing population growth across metropolitan and neighborhood types between 2010 and 2020 (Table 3). Among the four MSA typologies, restrictive urban–permissive suburban MSAs experienced the most rapid population growth, with an increase of 15.7% over the decade. In contrast, the lowest growth rate was observed in permissive urban–permissive suburban MSAs, which grew by only 3.3%. The rapid population surge in restrictive urban–permissive suburban MSAs was driven primarily by suburban expansion, as their suburban populations grew by 18.5% during the period.
Examining population growth by neighborhood type within metropolitan areas reveals that relatively affluent, non-gentrifiable neighborhoods were the primary drivers of growth during the 2010s, across all metropolitan typologies. From permissive urban–permissive suburban metros (5.3% growth) to restrictive urban–permissive suburban metros (19.8% growth), these neighborhoods consistently outpaced others in growth rates. This trend was evident in both urban and suburban settings, underscoring the widespread role of non-gentrifiable areas in shaping metropolitan population dynamics.
A parallel analysis based on neighborhood income levels shows that the fastest-growing areas during the 2010s were typically the most affluent suburban neighborhoods for all metropolitan typologies except permissive urban–permissive suburban metros, where top-tier urban neighborhoods grew faster than their suburban counterparts (12.9% vs. 7.1%). Notably, in metros with permissive urban land-use regulations, the top 20% income urban neighborhoods often experienced population growth on par with their suburban counterparts. Conversely, in metros with restrictive urban land-use policies, suburban neighborhoods, particularly those in MSAs with permissive suburban zoning, exhibited significantly higher growth than their urban peers. In fact, the top 20% of suburban neighborhoods by income grew by 27.7% during the 2010s, underscoring the role of zoning permissiveness in the link between geography and the socioeconomic character of metropolitan growth.

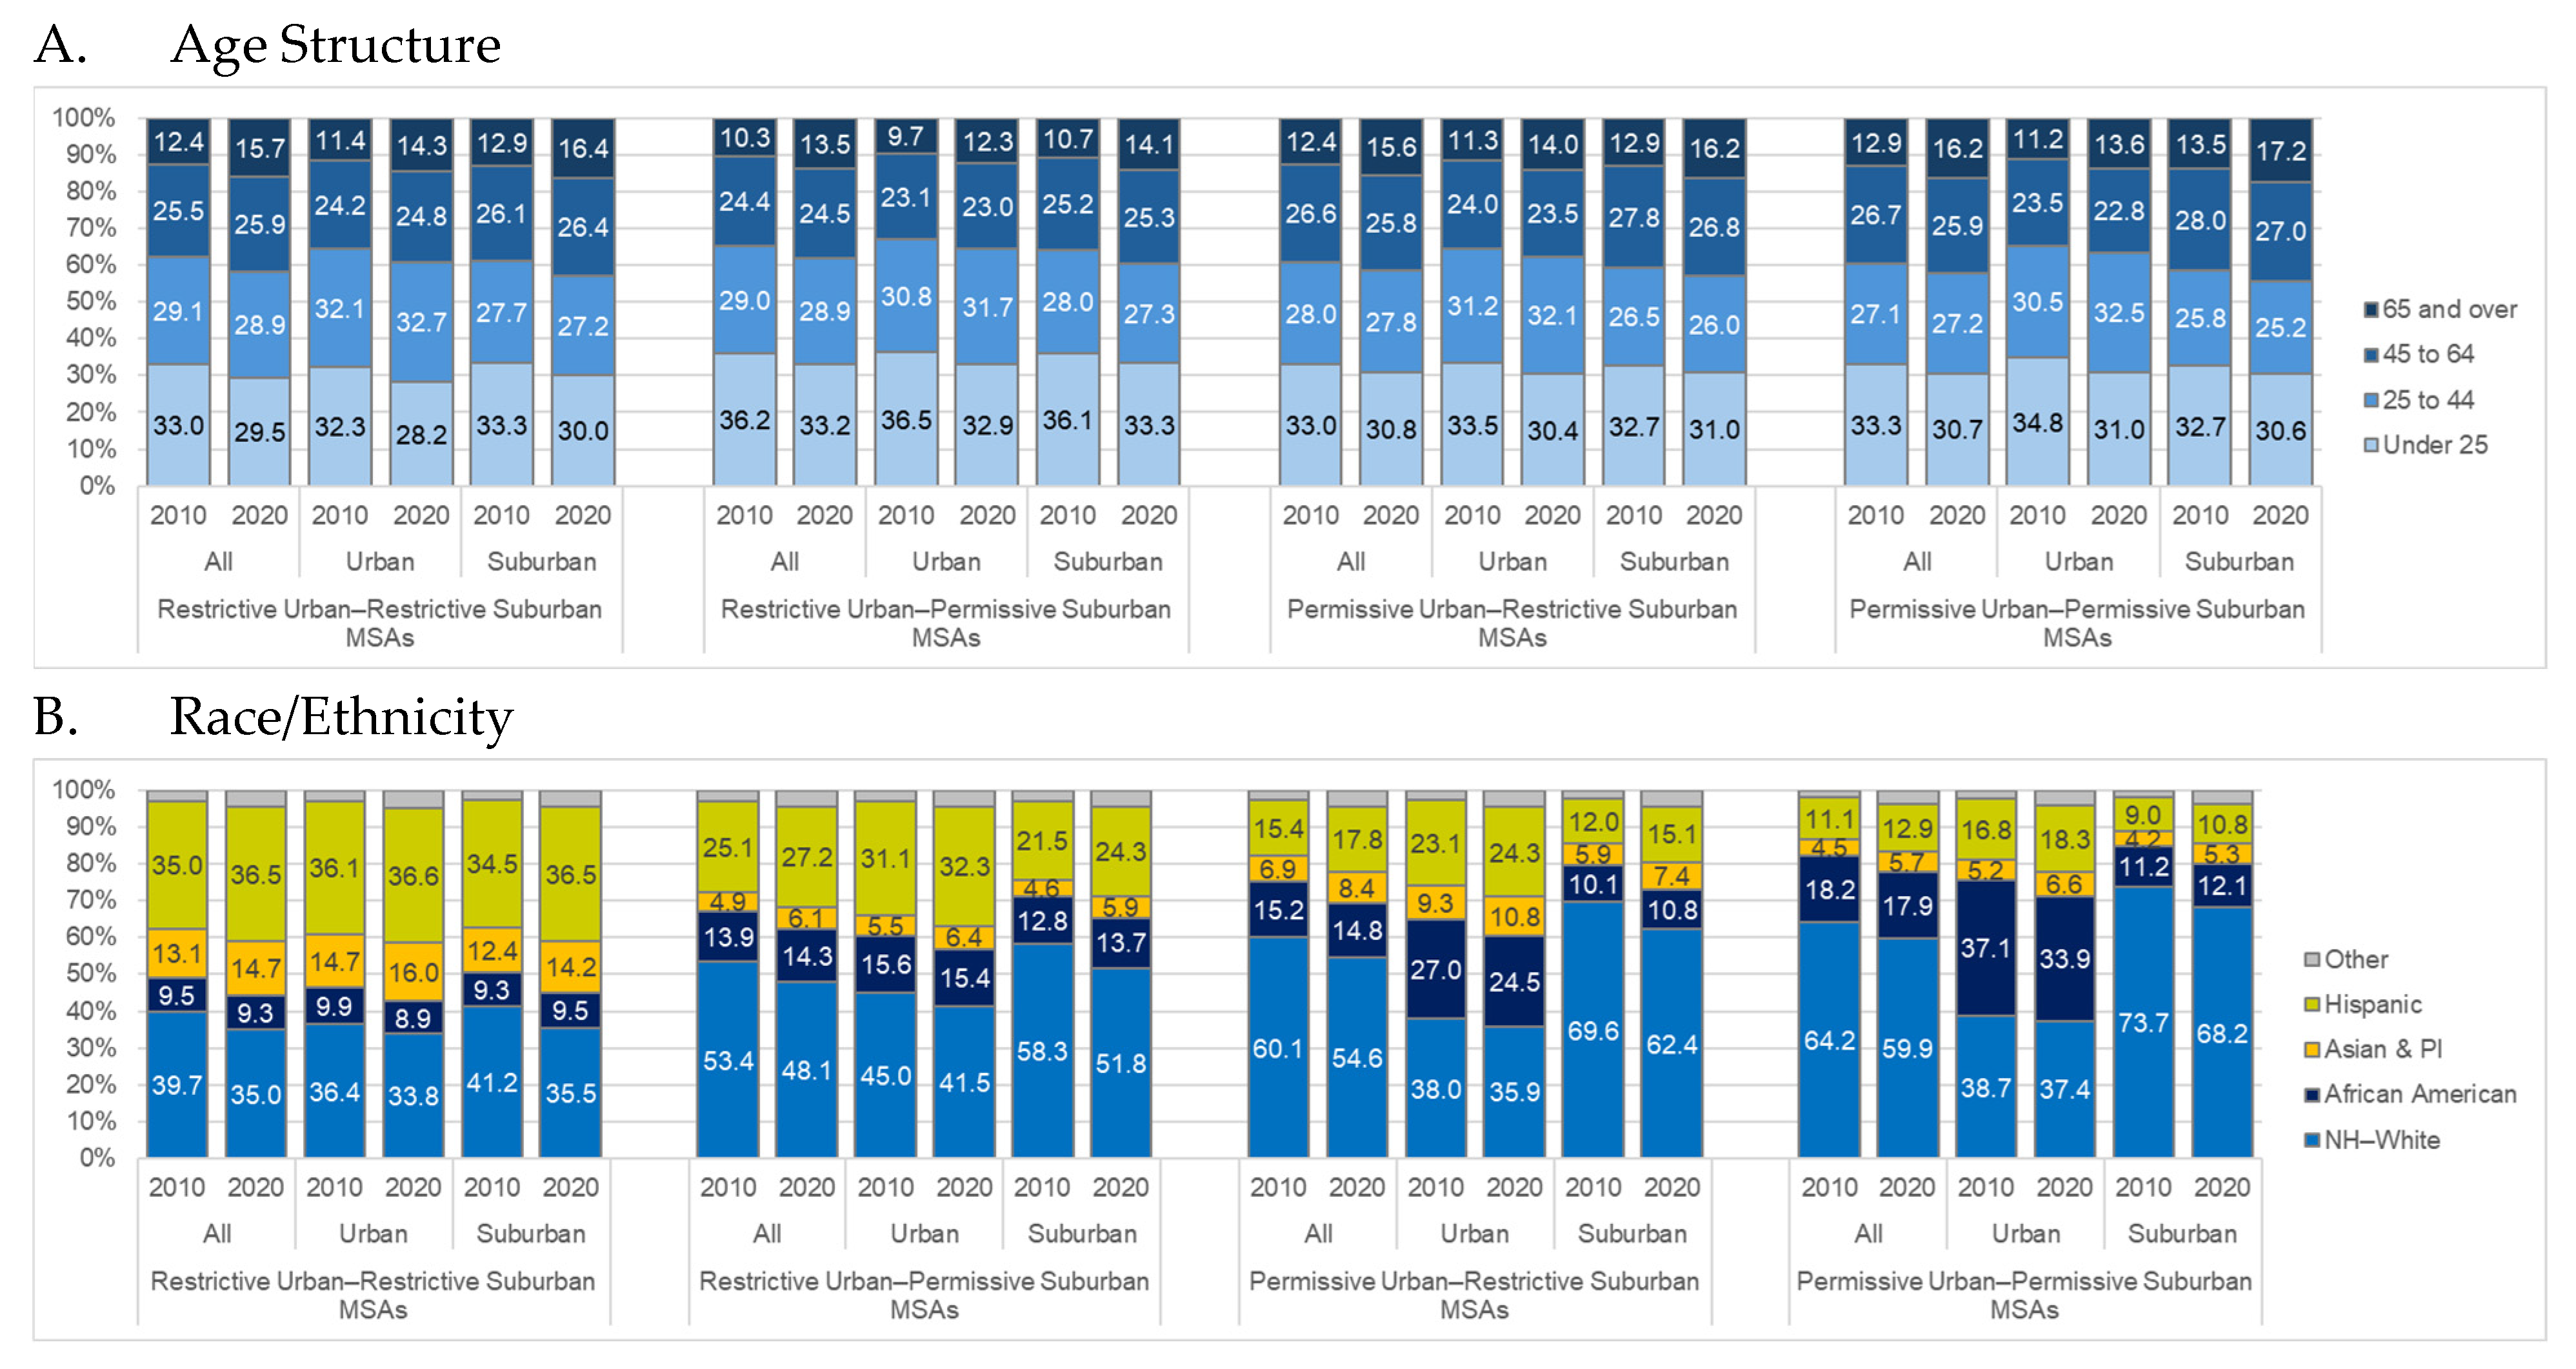
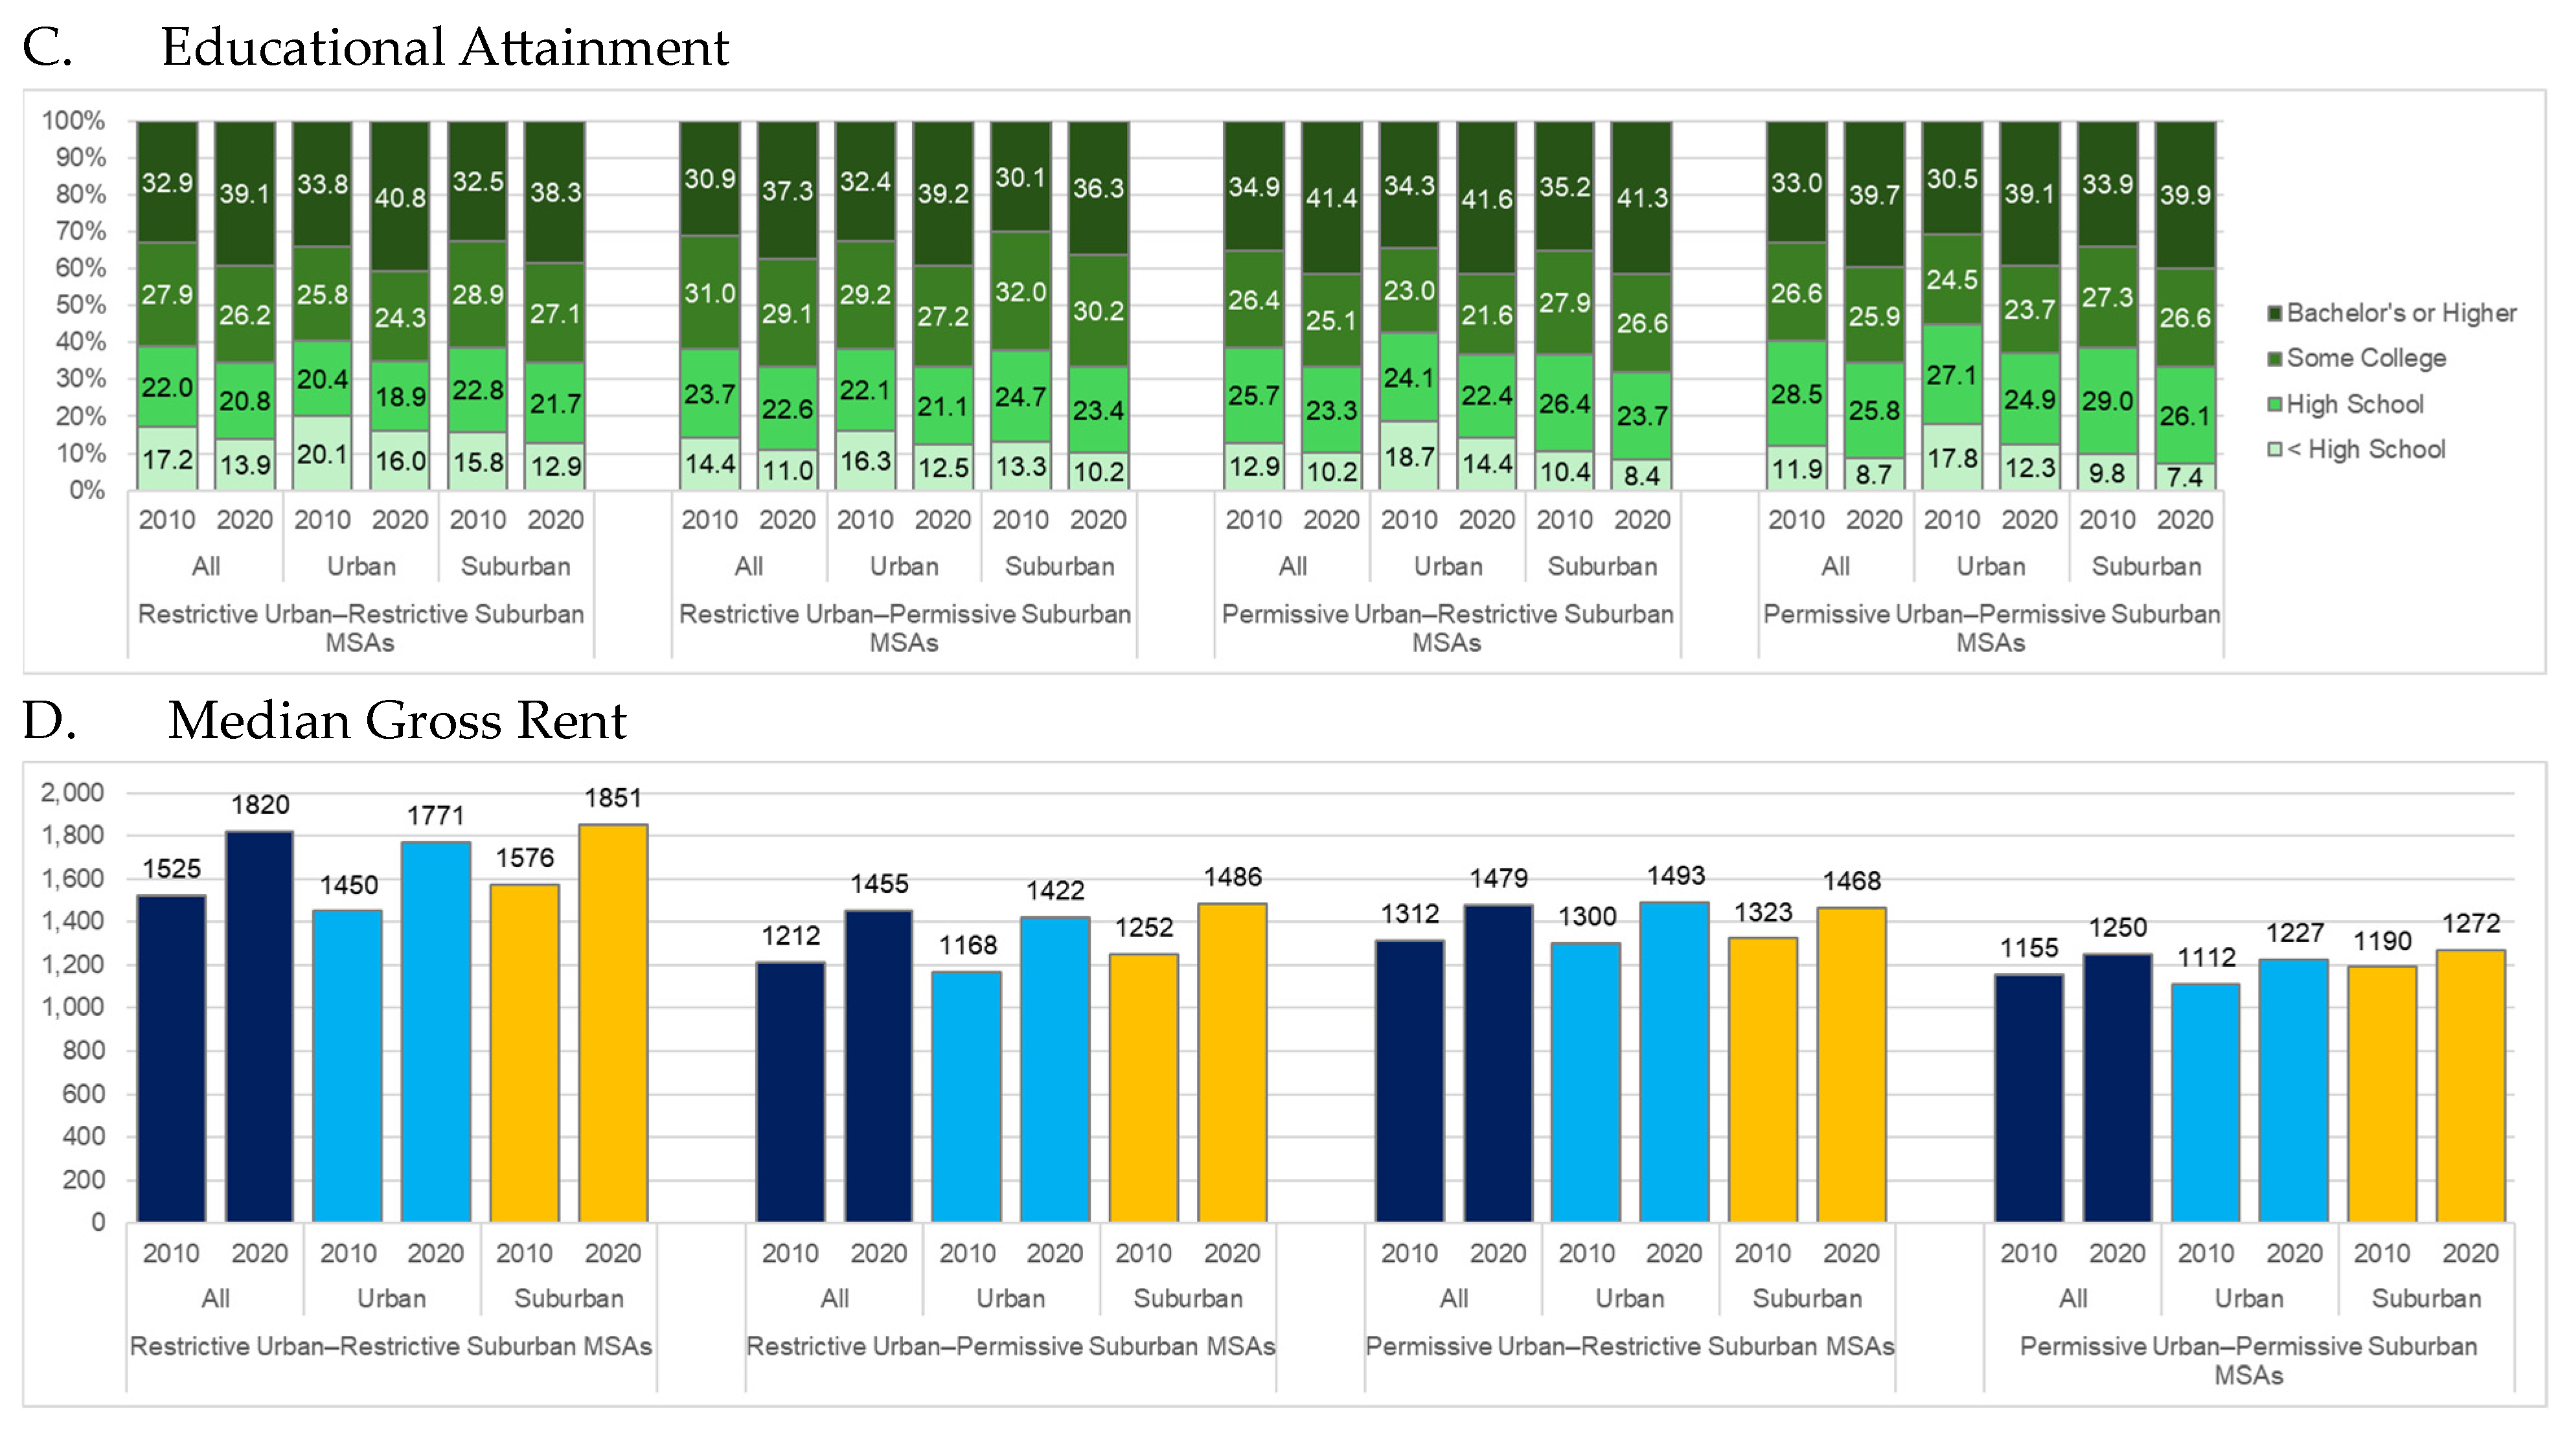
4.2. Changes in Demographic Characteristics by Metro Zoning Configurations

Next, we examine a range of neighborhood characteristics across our metropolitan zoning typologies, including changes in age structure, race/ethnicity, educational attainment, and median gross rent (see Figure 1). Notably, median rents are highest—and increased the most during the 2010s—in metros with restrictive zoning regimes, whereas the more modest rent increases were observed in metros with permissive zoning. In terms of racial and ethnic composition, metros with both urban and suburban restrictive zoning have the largest and fastest-growing shares of Hispanic and Asian residents. Across all four zoning configurations, the non-Hispanic white population declined in both urban and suburban neighborhoods. The Black population share declined in urban areas across all configurations but increased in suburban areas, indicating a notable suburbanization trend. In fact, in metros with restrictive urban and restrictive suburban zoning, the Black population share is now larger in suburban areas than in urban cores—a striking demographic shift for a group historically concentrated in central cities.

4.3. Urban–Suburban Gentrification Gaps by Zoning Configuration

Across the four metropolitan zoning configurations, the gap between urban and suburban gentrification varies markedly. Table 4 shows that the narrowest gap can be found in metros with restrictive urban cores and permissive suburbs: only 3.4 percentage points separate the two areas, with 37.5% of urban gentrifiable neighborhoods gentrifying versus 34.2% of suburban tracts. Even within this category, there is considerable heterogeneity; for example, Table 4 (Metro Denver) shows that 32.8% of urban tracts gentrified compared with 35.5% in the suburbs, producing a negative gap—more gentrification outside than in the core. By contrast, metros that are permissive in both city and suburb post the largest urban–suburban gap (15.3 points) and the lowest overall share of suburban gentrification. Figure 2 illustrates this pattern spatially by showing selected metropolitan areas that exemplify each zoning regime and reveal how urban–suburban gentrification dynamics differ. For example, in Metro Pittsburgh, roughly 63% of urban tracts have been gentrified compared to only 40.5% of suburban tracts—a disparity of over 22 percentage points. Similarly, metros with permissive urban cores and restrictive suburbs also show higher rates of urban gentrification than suburban gentrification.
Metros with permissive urban cores and restrictive suburbs also display significant gaps favoring urban gentrification. Figure 1 (Metro Washington, D.C.) illustrates this pattern spatially: more than 53% of urban tracts experienced gentrification, while only about 20% of suburban tracts did—a gap of 33 points. Finally, metros with restrictive zoning in both the city and the suburb show a more moderate gap of roughly 7%. Although these high-cost metros (see Figure 1 of change in median rent) are growing more slowly than their mixed-regime counterparts, gentrification pressures still spill over into their suburbs.

5. Discussion

The findings from our analysis suggest that regulatory differences between cities and suburbs within the same metropolitan areas may help explain patterns of population growth and gentrification. This is most apparent in metros where regulatory regimes in urban cores are more restrictive, and adjacent suburbs more permissive. In these contexts, suburbs appear to have absorbed a larger share of population growth and show narrower gentrification gaps relative to their urban cores. While we do not examine the driving mechanism, this pattern may reflect how housing demand shifts toward less regulated areas when supply is constrained in city centers. This pattern is similar to Towe, Klaiber, and Wrenn’s (2017) [34] single metro study of Baltimore; when Baltimore County tightened its zoning, new development spilled over into neighboring jurisdictions with looser regulations, fueling suburban and exurban growth within the greater metro. They also align with broader arguments that mismatched zoning regimes can generate growth spillovers from core to periphery [35,36]. For instance, Byun et al.’s (2005) [35] California study found that such spillovers often land in fringe suburbs. Our findings suggest that similar spillover dynamics may operate more broadly across U.S. metros.
We speculate that the stark affluent suburban growth observed in restrictive urban/permissive suburban metros, in particular, may be driven by housing demand from constrained urban cores into nearby suburbs with more flexible zoning and capacity for large and upscale development—options unavailable in tightly regulated cores. In contrast, in loose–loose metros, where both urban and suburban areas maintain permissive zoning, high-income neighborhood growth was more pronounced in urban areas. This may be because the core is better positioned to absorb growth. In that case, it suggests that suburban growth is not driven by permissiveness alone, but by the relative regulatory asymmetry between cities and their suburbs. These possibilities remain speculative and warrant further investigation.
We also observe that suburban gentrification rates, relative to their urban cores, vary across different metro land-use configurations. In metros where urban zoning is more restrictive and suburban zoning more permissive, the urban–suburban gentrification gap tends to be smaller—suggesting that some redevelopment pressure may spill over into less regulated suburban areas. Interestingly, average gentrification rates are lowest in urban areas with strict land-use regulation. This is consistent with findings from Leguizamon and Christafore (2021) [37], who report that increased regulation moderated gentrification between 2000 and 2010, even as housing prices rose.
In metros where both urban and suburban areas are relatively permissive, gentrification appears more concentrated in urban neighborhoods, potentially because these areas are better equipped to absorb reinvestment and demographic change (e.g., Metro Pittsburgh, Metro Philadelphia). Conversely, metros with permissive cities and restrictive suburbs also show large urban–suburban gentrification gaps—perhaps because suburban regulations redirect housing demand back into the urban core (e.g., Washington, DC, USA). Highly regulated metros—where both city and suburb are restrictive—show more moderate gaps overall.
While land-use policy plays a central role in shaping metropolitan development, other factors—such as local planning initiatives and environmental constraints—also influence growth trajectories. For example, the Las Vegas metro area ranks high in zoning restrictiveness, with especially restrictive suburban areas (see Table 1), yet it has experienced rapid population growth. This pattern is shaped, in part, by unique geographic and political features: federally owned lands serve as a de facto urban growth boundary, and water scarcity limits outward expansion [38]. Such cases underscore how land-use regulation operates in tandem with broader forces to shape the built environment of metropolitan areas.
Our analysis focuses on the 2010–2020 period, which is a decade marked by a profound shift in the U.S. housing market. The country shifted from a post-recession environment of excess housing supply and elevated vacancy rates to one of acute housing shortages [39]. This shift likely contributed to the growth and gentrification patterns we observe—particularly the movement into less-regulated suburban areas. Although our data do not extend beyond 2020, the onset of the COVID-19 pandemic likely intensified these dynamics, accelerating demand for lower-density housing and suburban living as remote work reshaped residential preferences [40]. Future research using post-2020 data will be essential to understanding whether these trends represent a lasting structural shift or a short-term pandemic shock.

6. Conclusions

Although these findings are associative, they suggest that the relative balance of regulatory regimes within a metro may help shape the geography of gentrification and suburbanization more generally. Of course, other factors that vary both within and across metropolitan areas, such as local amenities, job access, crime and demographic dynamics, transportation infrastructure, perceived school quality, and the broader supply of school choice, are also likely to shape these patterns [41]. Future research will require more sophisticated, multilevel models and datasets to account for this variation. Researchers and advocates should continue to build on this work by investigating the links between zoning asymmetries and socially related outcomes, such as school enrollment, segregation patterns, and social mobility, to better understand how local land-use policies reverberate across multiple social domains.
Our study, despite its contributions, is not without limitations. First, while we believe that our land-use measures improve on prior indices in terms of coverage and detail, they do not capture the full complexity of local zoning and land-use regulations. Second, our data do not reflect the period following the outbreak of COVID-19 and the subsequent shifts in population movement and suburbanization. Lastly, we hope our findings encourage further exploration of whether greater coordination across municipal land-use policies might help address some of the spatial disparities highlighted in this study.

Author Contributions

Methodology, H.L.; formal analysis, H.L. and K.M.; writing—review and editing, K.M. All authors have read and agreed to the published version of the manuscript.

Funding

This research received no external funding.

Data Availability Statement

All generated or analyzed data is available upon request.

Conflicts of Interest

The authors declare no conflicts of interest.

Notes

1.
The NZLUD is constructed by applying natural language processing techniques on publicly available zoning and land-use information such as minimum lot size, maximum permitted density, minimum parking requirements, and maximum building height restrictions. For a more detailed explanation, please refer to Mleczko and Desmond (2023) [27]. To ensure consistency with the NZLUD data, we use the 2020 metropolitan area boundaries.
2.
The 8 MSAs that were excluded from this study are Hartford-East Hartford-Middletown, CT, Kansas City, MO-KS, Louisville/Jefferson County, KY–IN, Memphis, TN–MS–AR, Nashville–Davidson–Murfreesboro–Franklin, TN, New Orleans-Metairie, LA, Richmond, VA, and Sacramento–Roseville–Folsom, CA. While the NZNUD is generally considered representative, consistent, and accurate relative to other zoning indices derived from fielding surveys (Mleczko and Descmond, 2023 [27]), there remains the possibility of systemic bias within the sample.
3.
To maintain consistency over time, the census tract boundaries are standardized to 2010 geographic definitions. For census tracts located along the boundaries of urban municipalities, we assign them to either urban or suburban areas based on the proportion of their land area that falls within the urban municipalities.

References

  1. Frey, W.H. Diversity Explosion: How New Racial Demographics are Remaking America; Brookings Institution Press: Washington, DC, USA, 2018. [Google Scholar]
  2. Anacker, K.B. The New American Suburb: Poverty, Race and the Economic Crisis; Routledge: London, UK, 2015. [Google Scholar]
  3. Lichter, D.T.; Thiede, B.C.; Brooks, M.M. Racial diversity and segregation: Comparing principal cities, inner-ring suburbs, outlying suburbs, and the suburban fringe. RSF Russell Sage Found. J. Soc. Sci. 2023, 9, 26–51. [Google Scholar] [CrossRef]
  4. Mordechay, K.; Terbeck, F.J. Moving out and apart: Race, poverty, and the suburbanization of public school segregation. Am. J. Educ. 2023, 129, 205–235. [Google Scholar] [CrossRef]
  5. Orfield, M.; Luce, T.F. America’s racially diverse suburbs: Opportunities and challenges. Hous. Policy Debate 2013, 23, 395–430. [Google Scholar] [CrossRef]
  6. Jackson, K.T. Crabgrass Frontier: The Suburbanization of the United States; Oxford University Press: Oxford, UK, 1987. [Google Scholar]
  7. Buchholz, M. Priced out? Household migration out of “superstar” US city-regions. Environ. Plan. A Econ. Space 2022, 54, 1623–1640. [Google Scholar] [CrossRef]
  8. Frey, W.H. Today’s Suburbs are Symbolic of America’s Rising Diversity: A 2020 Census Portrait; Brookings Institution: Washington, DC, USA, 2022; Available online: https://www.brookings.edu/articles/todays-suburbs-are-symbolic-of-americas-rising-diversity-a-2020-census-portrait/ (accessed on 20 July 2025).
  9. Pfeiffer, D. African Americans’ search for “more for less” and “peace of mind” on the exurban frontier. Urban Geogr. 2012, 33, 64–90. [Google Scholar] [CrossRef]
  10. Brown-Saracino, J. Explicating divided approaches to gentrification and growing income inequality. Annu. Rev. Sociol. 2017, 43, 515–539. [Google Scholar] [CrossRef]
  11. Gyourko, J.; Molloy, R. Regulation and housing supply. In Handbook of Regional and Urban Economics; Duranton, G., Henderson, J.V., Strange, W.C., Eds.; Elsevier: Amsterdam, The Netherlands, 2015; Volume 5B, pp. 1289–1337. [Google Scholar]
  12. Gyourko, J.; Mayer, C.; Sinai, T. Superstar cities. Am. Econ. J. Econ. Policy 2013, 5, 167–199. [Google Scholar] [CrossRef]
  13. Baum-Snow, N. Constraints on city and neighborhood growth: The central role of housing supply. J. Econ. Perspect. 2023, 37, 53–74. [Google Scholar] [CrossRef]
  14. Rothstein, R. The Color of Law: A Forgotten History of How Our Government Segregated America; Liveright Publishing: New York, NY, USA, 2017. [Google Scholar]
  15. Massey, D.S.; Denton, N.A. American Apartheid: Segregation and the Making of the Underclass; Harvard University Press: Cambridge, MA, USA, 1993. [Google Scholar]
  16. Beauregard, R.A. When America Became Suburban; University of Minnesota Press: Minneapolis, MN, USA, 2006. [Google Scholar]
  17. Hanlon, B. A typology of inner–ring suburbs: Class, race, and ethnicity in US suburbia. City Community 2009, 8, 221–246. [Google Scholar] [CrossRef]
  18. Kneebone, E.; Garr, E. The Suburbanization of Poverty; Brookings Institution: Washington, DC, USA, 2010. [Google Scholar]
  19. Kneebone, E. The Changing Geography of U.S. Poverty; Brookings Institution: Washington, DC, USA, 2017. [Google Scholar]
  20. Mordechay, K. Race, space, and America’s subprime housing boom. Urban Geogr. 2020, 41, 936–946. [Google Scholar] [CrossRef]
  21. Finio, N. Measurement and definition of gentrification in urban studies and planning. J. Plan. Lit. 2022, 37, 249–264. [Google Scholar] [CrossRef]
  22. Markley, S. Suburban gentrification? Examining the geographies of New Urbanism in Atlanta’s inner suburbs. Urban Geogr. 2018, 39, 606–630. [Google Scholar] [CrossRef]
  23. Elmendorf, C.S. Beyond the double veto: Housing plans as preemptive intergovernmental compacts. Hastings Law J. 2019, 71, 79–118. [Google Scholar]
  24. Been, V. City NIMBYs. J. Land Use Environ. Law 2018, 33, 217–250. [Google Scholar]
  25. Glaeser, E.L.; Gyourko, J.; Saks, R.E. Why have housing prices gone up? Am. Econ. Rev. 2005, 95, 329–333. [Google Scholar] [CrossRef]
  26. Brouwer, N.R.; Trounstine, J. NIMBYs, YIMBYs, and the politics of land use in American cities. Annu. Rev. Political Sci. 2024, 27, 10.1–10.20. [Google Scholar] [CrossRef]
  27. Mleczko, M.; Desmond, M. Using natural language processing to construct a national zoning and land use database. Urban Stud. 2023, 60, 2564–2584. [Google Scholar] [CrossRef]
  28. Frey, W.H. Population Growth in Metro America Since 1980: Putting the Volatile 2000s in Perspective; Brookings Institute: Washington, DC, USA, 2012; Available online: https://www.brookings.edu/wp-content/uploads/2016/06/0320_population_frey.pdf (accessed on 20 July 2025).
  29. Lee, H. Are Millennials leaving town? Reconciling peak Millennials and youthification typotheses. Int. J. Urban Sci. 2022, 26, 68–86. [Google Scholar] [CrossRef]
  30. Masnick, G. Despite Upswing in City Population Growth Rates, Suburbs Still Outpace Cities in Numerical Growth; Joint Center for Housing Studies: Cambridge, MA, USA, 2013; Available online: https://www.jchs.harvard.edu/blog/despite-upswing-in-city-population-growth-ratessuburbs-still-outpace-cities-in-numerical-growth (accessed on 20 July 2025).
  31. Ding, L.; Hwang, J.; Divringi, E. Gentrification and residential mobility in Philadelphia. Reg. Sci. Urban Econ. 2016, 61, 38–51. [Google Scholar] [CrossRef] [PubMed]
  32. Ellen, I.G.; O’Regan, K.M. How low-income neighborhoods change: Entry, exit, and enhancement. Reg. Sci. Urban Econ. 2011, 41, 89–97. [Google Scholar] [CrossRef]
  33. Lee, H.; Perkins, K.L. The geography of gentrification and residential mobility. Soc. Forces 2023, 101, 1856–1887. [Google Scholar] [CrossRef]
  34. Towe, C.A.; Klaiber, H.A.; Wrenn, D.H. Not my problem: Growth spillovers from uncoordinated land use policy. Land Use Policy 2017, 67, 679–689. [Google Scholar] [CrossRef]
  35. Byun, P.; Waldorf, B.S.; Esparza, A.X. Spillovers and local growth controls: An alternative perspective on suburbanization. Growth Chang. 2005, 36, 196–219. [Google Scholar] [CrossRef]
  36. McLaughlin, R.B. Land use regulation: Where have we been, where are we going? Cities 2012, 29, S50–S55. [Google Scholar] [CrossRef]
  37. Leguizamon, S.; Christafore, D. The influence of land use regulation on the probability that low-income neighbourhoods will gentrify. Urban Stud. 2021, 58, 993–1013. [Google Scholar] [CrossRef]
  38. Catenaccio, G. Urban growth boundaries: Two American examples. MIT J. Plan. 2011, 3, 31–51. [Google Scholar]
  39. Airgood-Obrycki, W.; McCue, D. The housing shortage is still out there. Hous. Policy Debate 2025, 35, 75–79. [Google Scholar] [CrossRef]
  40. Gupta, A.; Mittal, V.; Peeters, J.; Van Nieuwerburgh, S. Flattening the curve: Pandemic-induced revaluation of urban real estate. J. Financ. Econ. 2022, 146, 594–636. [Google Scholar] [CrossRef]
  41. Mordechay, K.; Schachner, J.N. The link between changes in neighborhood and school demographics: A multi-level perspective. In Gentrification and Schooling in Global Cities; Bonal, X., Cordini, M., Eds.; Edward Elgar Publishing: Cheltenham, UK, in press.
Figure 1. Neighborhood Characteristics by Metropolitan and Neighborhood by MSA Category. Source: Authors’ analysis based on the 2008–2012 and 2018–2022 American Community Survey 5-year estimates. Notes: The sample is restricted to census tracts in the 42 Metropolitan Statistical Areas for which the NZLUD data are available.
Land 14 01555 g001aLand 14 01555 g001b
Figure 2. Gentrification in the Selected Metropolitan Areas. Notes: MSA boundaries reflect 2020 definitions.
Land 14 01555 g002
Table 1. List of 42 Metropolitan Statistical Areas by ZRI Scores.
Zoning Restrictiveness Index (ZRI)
MSA TitleMSAUrbanSuburban
Restrictive UrbanRestrictive Suburban
 Las Vegas–Henderson–Paradise, NV4.583.327.09
 San Jose–Sunnyvale–Santa Clara, CA3.873.204.54
 Miami–Fort Lauderdale–Pompano Beach, FL3.953.004.01
 Orlando–Kissimmee–Sanford, FL3.793.323.84
 San Francisco–Oakland–Berkeley, CA3.553.483.55
 Portland–Vancouver–Hillsboro, OR–WA3.423.403.42
 Los Angeles–Long Beach–Anaheim, CA3.362.803.40
Restrictive UrbanPermissive Suburban
 Salt Lake City, UT3.013.712.92
 Austin–Round Rock–Georgetown, TX2.913.042.83
 Phoenix–Mesa–Chandler, AZ2.883.672.78
 Riverside–San Bernardino–Ontario, CA2.703.712.65
 Dallas–Fort Worth–Arlington, TX2.612.822.59
 Atlanta–Sandy Springs–Alpharetta, GA2.573.322.55
 Charlotte–Concord–Gastonia, NC–SC2.473.472.30
 Denver–Aurora–Lakewood, CO2.413.262.24
 San Diego–Chula Vista–Carlsbad, CA2.023.721.85
 Raleigh–Cary, NC2.053.471.76
 Virginia Beach–Norfolk–Newport News, VA–NC2.262.931.59
 Oklahoma City, OK0.743.390.51
 San Antonio–New Braunfels, TX0.174.02–0.15
 Jacksonville, FL–0.303.94–2.42
Permissive UrbanRestrictive Suburban
 Washington–Arlington–Alexandria, DC–VA–MD–WV5.181.905.41
 New York–Newark–Jersey City, NY–NJ–PA5.121.605.22
 Tampa–St. Petersburg–Clearwater, FL4.302.195.01
 Providence–Warwick, RI–MA4.832.304.96
 Seattle–Tacoma–Bellevue, WA4.532.534.69
 Milwaukee–Waukesha, WI4.061.904.16
 Detroit–Warren–Dearborn, MI3.871.373.98
 Boston–Cambridge–Newton, MA–NH3.872.493.92
 St. Louis, MO–IL3.391.783.45
 Minneapolis–St. Paul–Bloomington, MN–WI3.342.633.35
 Cleveland–Elyria, OH3.281.783.33
 Houston–The Woodlands–Sugar Land, TX3.171.053.28
 Indianapolis–Carmel–Anderson, IN3.001.973.08
 Cincinnati, OH–KY–N3.001.273.06
Permissive UrbanPermissive Suburban
 Philadelphia–Camden–Wilmington, PA–NJ–DE–MD3.042.693.05
 Chicago–Naperville–Elgin, IL–IN–WI2.942.692.95
 Baltimore–Columbia–Towson, MD2.352.412.33
 Pittsburgh, PA2.182.302.17
 Birmingham–Hoover, AL1.991.872.01
 Columbus, OH1.692.541.61
 Buffalo–Cheektowaga, NY1.332.211.21
Source: Authors’ analysis based on the National Zoning and Land-Use Database (NZLUD). Notes: MSA boundaries reflect 2020 definitions. Eight MSAs are excluded from the analysis due to incomplete municipal coverage in the NZLUD.
Table 2. The Number of Neighborhoods by Gentrification and Suburban Status.
AllUrban NeighborhoodsSuburban Neighborhoods
All Neighborhoods35,18012,54922,631
 Non-Gentrifiable21,123521515,908
 Gentrifiable14,05773346723
 (%)100.0100.0100.0
  Gentrifying500729462061
  (%)35.640.230.7
  Non-Gentrifying905043884662
  (%)64.459.869.3
Source: Authors’ analysis based on the 2008–2012 and 2018–2022 American Community Survey 5-year estimates. Notes: The sample is restricted to census tracts in the 42 Metropolitan Statistical Areas for which the NZLUD data are available.
Table 3. Population Growth from 2010 to 2020, by MSA Category.
All NeighborhoodsUrban NeighborhoodsSuburban Neighborhoods
20102020(%)20102020(%)20102020(%)
Restrictive UrbanRestrictive Suburban30,93733,3067.7985210,4446.021,08522,8628.4
 Non-Gentrifiable19,03420,7318.9464350107.914,39115,7219.2
 Gentrifiable11,90312,5755.6520954344.3669471416.7
  Gentrifying790283465.6321233504.3469049966.5
  Non-Gentrifying400142295.7199720844.3200421457.0
Restrictive UrbanPermissive Suburban38,44244,48815.714,31615,90311.124,12628,58618.5
 Non-Gentrifiable24,25529,07019.87389846914.616,86720,60022.1
 Gentrifiable14,18615,4198.7692774337.37259798610.0
  Gentrifying936810,1658.5436146797.3500754869.6
  Non-Gentrifying481852549.1256627557.42253250011.0
Permissive UrbanRestrictive Suburban60,97065,9888.218,40019,4755.842,57046,5129.3
 Non-Gentrifiable39,01442,7239.5713677468.631,87834,9779.7
 Gentrifiable21,95623,2646.011,26411,7294.110,69211,5357.9
  Gentrifying14,54415,3935.8692671973.9761881977.6
  Non-Gentrifying741278716.2433945324.5307433398.6
Permissive UrbanPermissive Suburban24,56525,3853.3666168262.517,90418,5603.7
 Non-Gentrifiable16,05416,9005.3218123507.713,87314,5504.9
 Gentrifiable85118486−0.344804476−0.140314010−0.5
  Gentrifying555055580.1264726600.529032898−0.2
  Non-Gentrifying29612928−1.118321816−0.911291112−1.5
Source: Authors’ analysis based on the 2008–2012 and 2018–2022 American Community Survey 5-year estimates. Notes: The sample is restricted to census tracts in the 42 Metropolitan Statistical Areas for which the NZLUD data are available.
Table 4. Gentrification by Metropolitan and Suburban Status.
% GentrificationUrban–Suburban Gap (pp.)
MSA TitleMSAUrbanSuburban
Restrictive UrbanRestrictive Suburban34.538.131.27.0
 Las Vegas–Henderson–Paradise, NV38.544.229.514.7
 San Jose–Sunnyvale–Santa Clara, CA28.928.331.0–2.8
 Miami–Fort Lauderdale–Pompano Beach, FL41.650.039.610.4
 Orlando–Kissimmee–Sanford, FL36.434.437.3–3.0
 San Francisco–Oakland–Berkeley, CA28.537.519.817.7
 Portland–Vancouver–Hillsboro, OR–WA38.842.034.57.5
 Los Angeles–Long Beach–Anaheim, CA33.037.028.18.9
Restrictive UrbanPermissive Suburban36.137.534.23.4
 Salt Lake City, UT36.844.431.712.7
 Austin–Round Rock–Georgetown, TX43.849.10.049.1
 Phoenix–Mesa–Chandler, AZ37.837.638.2–0.6
 Riverside–San Bernardino–Ontario, CA37.441.436.25.2
 Dallas–Fort Worth–Arlington, TX31.833.628.15.5
 Atlanta–Sandy Springs–Alpharetta, GA41.549.238.710.5
 Charlotte–Concord–Gastonia, NC–SC40.950.030.219.8
 Denver–Aurora–Lakewood, CO33.732.835.5–2.7
 San Diego–Chula Vista–Carlsbad, CA33.536.230.35.9
 Raleigh–Cary, NC34.234.333.31.0
 Virginia Beach–Norfolk–Newport News, VA–NC35.538.530.28.2
 Oklahoma City, OK36.735.839.1–3.3
 San Antonio–New Braunfels, TX34.535.220.015.2
 Jacksonville, FL34.731.866.7–34.8
Permissive UrbanRestrictive Suburban36.240.430.010.3
 Washington–Arlington–Alexandria, DC–VA–MD–WV30.653.420.832.6
 New York–Newark–Jersey City, NY–NJ–PA38.039.234.05.2
 Tampa–St. Petersburg–Clearwater, FL37.256.128.927.1
 Providence–Warwick, RI–MA38.755.232.922.2
 Seattle–Tacoma–Bellevue, WA34.044.829.615.3
 Milwaukee–Waukesha, WI32.631.050.0–19.0
 Detroit–Warren–Dearborn, MI34.435.033.31.7
 Boston–Cambridge–Newton, MA–NH30.144.122.621.5
 St. Louis, MO–IL35.545.327.517.9
 Minneapolis–St. Paul–Bloomington, MN–WI38.736.541.3–4.8
 Cleveland–Elyria, OH38.239.036.52.5
 Houston–The Woodlands–Sugar Land, TX38.640.134.95.2
 Indianapolis–Carmel–Anderson, IN40.045.711.134.5
 Cincinnati, OH–KY–IN38.844.133.810.3
Permissive UrbanPermissive Suburban37.243.227.915.3
 Philadelphia–Camden–Wilmington, PA–NJ–DE–MD35.746.621.225.5
 Chicago–Naperville–Elgin, IL–IN–WI35.842.823.918.9
 Baltimore–Columbia–Towson, MD35.632.442.9–10.5
 Pittsburgh, PA47.962.940.522.4
 Birmingham–Hoover, AL39.239.538.51.0
 Columbus, OH37.741.322.718.6
 Buffalo–Cheektowaga, NY36.741.726.715.0
Source: Authors’ analysis based on the National Zoning and Land-Use Database (NZLUD). Notes: MSA boundaries reflect 2020 definitions. Eight MSAs are excluded from the analysis due to incomplete municipal coverage in the NZLUD.
Disclaimer/Publisher’s Note: The statements, opinions and data contained in all publications are solely those of the individual author(s) and contributor(s) and not of MDPI and/or the editor(s). MDPI and/or the editor(s) disclaim responsibility for any injury to people or property resulting from any ideas, methods, instructions or products referred to in the content.

