Article

GIS-Based Flood Susceptibility Mapping Using AHP in the Urban Amazon: A Case Study of Ananindeua, Brazil

by
Lianne Pimenta
1,
Lia Duarte
2,3,*,
Ana Cláudia Teodoro
2,3,
Norma Beltrão
1,
Dênis Gomes
1 and
Renata Oliveira
1
1
Department of Applied Social Sciences, State University of Pará State, Enéas Pinheiro, 2626-Marco, Belém 66095-015, PA, Brazil
2
Department of Geosciences, Environment and Spatial Planning, Faculty of Sciences, University of Porto, 4169-007 Porto, Portugal
3
Institute of Earth Sciences, Faculty of Sciences, University of Porto, 4169-007 Porto, Portugal
*
Author to whom correspondence should be addressed.
Land 2025, 14(8), 1543; https://doi.org/10.3390/land14081543
Submission received: 20 June 2025 / Revised: 23 July 2025 / Accepted: 25 July 2025 / Published: 27 July 2025
(This article belongs to the Section Land Use, Impact Assessment and Sustainability)

Abstract

Flood susceptibility mapping is essential for urban planning and disaster risk management, especially in rapidly urbanizing areas exposed to extreme rainfall events. This study applies an integrated approach combining Geographic Information Systems (GIS), map algebra, and the Analytic Hierarchy Process (AHP) to assess flood-prone zones in Ananindeua, Pará, Brazil. Five geoenvironmental criteria—rainfall, land use and land cover (LULC), slope, soil type, and drainage density—were selected and weighted using AHP to generate a composite flood susceptibility index. The results identified rainfall and slope as the most influential criteria, with both contributing to over 184 km2 of high-susceptibility area. Spatial patterns showed that flood-prone zones are concentrated in flat urban areas with high drainage density and extensive impermeable surfaces. CHIRPS rainfall data were validated using Pearson’s correlation (r = 0.83) and the Nash–Sutcliffe efficiency (NS = 0.97), confirming the reliability of the precipitation input. The final susceptibility map, categorized into low, medium, and high classes, was validated using flood events derived from Sentinel-1 SAR data (2019–2025), of which 97.2% occurred in medium- or high-susceptibility zones. These findings demonstrate the model’s strong predictive performance and highlight the role of unplanned urban expansion, land cover changes, and inadequate drainage in increasing flood risk. Although specific to Ananindeua, the proposed methodology can be adapted to other urban areas in Brazil, provided local conditions and data availability are considered.

1. Introduction

Urban challenges, including overcrowding, resource depletion, and urban expansion, present complex issues requiring careful management. Achieving a balance between economic growth, social inclusivity, and environmental preservation is essential [1]. These challenges are particularly pronounced in urban and peri-urban areas, which experience significant transformations over time due to soil functionality and other factors [2].
Urban settlements frequently occupy floodplain areas, making them particularly vulnerable to flood events. Understanding the concept of flooding is crucial before exploring its implications. Meteorological factors, especially rainfall, are vital in determining hydrological regimes [3]. Beyond rainfall, community participation and visual observations of river behavior are critical in assessing flood risks [4].
Policy measurements are necessary to mitigate the environmental challenges posed by urbanization. The rapid growth of urban areas, fueled by population increase, often leads to unplanned development and impermeabilization of land, especially near riverbanks. These areas are chosen for their accessibility to water and suitability for activities such as agriculture, livestock, and industry [5]. Urban expansion disrupts natural processes, resulting in diverse and significant impacts, including environmental degradation, socio-economic losses, and loss of life across various regions and seasons [6,7].
The La Niña phenomenon and the negative Atlantic Dipole significantly impact rainfall patterns in the Amazon region, leading to increased river levels and flows. Refs. [3,8,9,10] observed a pronounced influence of La Niña on the river regime in the northern Amazon basin, while the effect was more modest in the eastern regions. However, ref. [11] identified above-average flow values in the east of Amazon. Consequently, extreme events may increase the flooding risk [12].
Various land use and land cover (LULC) studies/maps, developed across diverse terrains and assessed on micro and macro scales, tend to directly or indirectly induce disasters or undesirable situations in the urban environment [13]. Therefore, understanding the causes, effects, and contributing factors of environmental phenomena in urban areas is relevant for sustainable urban planning and management [14].
Grasping these meteorological–hydrological interactions is essential for effective water resource management and disaster preparedness in the Amazon basin. Further research is necessary to explore the complex dynamics and potential impacts of climate variability on river systems.
Andrade et al. [15] reported that between 1991 and 2012, approximately 4691 flood events occurred in Brazil. The same authors emphasized that the Amazon region has a higher population density near rivers, making these areas more susceptible to hydroclimatic extremes. This vulnerability is compounded by human-induced LULC, which can impact the hydrological cycle pattern [16], intensifying the susceptibility to floods.
When adequate rainwater management measures are not implemented due to accelerated and disorderly urbanization, harmful effects simultaneously impact inhabitants’ lives and urban infrastructure [6,17]. Brito et al. [18] noted that urbanization favors interference in the water regime, reducing permeability and loss of green areas [19,20]. Such changes can also cause the suspension of public transport and health problems with the spread of diseases caused by water transport [21]. That is why it is important to pay attention to this issue. In addition to temporal analysis, developing spatial tools for assessing flood risk is crucial. Geographical Information Systems (GIS) have been widely employed to analyze the spatial distribution of flood risk areas [22,23,24,25,26,27,28,29,30,31]. Several studies have highlighted the significance of geoenvironmental components in identifying regions prone to imminent flood risk [32,33,34,35].
Technological progress, particularly in GIS and related geoprocessing tools, is crucial in deciphering these dynamics. These tools facilitate the development of spatial models that reflect flood phenomena within specific regions, highlighting diverse susceptibility levels [36,37].
Various methods of Multi-Criteria Decision Making (MCDM) have emerged, each with distinct features, resources, computational complexity, and application ranges [14,38,39]. MCDM is a multi-staged structured process tailored to each specific method, so it aims to formalize and streamline the decision-making process. It is necessary to define the problem under investigation accurately, determine the pertinent criteria and alternatives, and ensure the proper application of these methods to acquire reliable outcomes [40,41,42,43].
Combining the MCDM methodology with GIS enhances research robustness by integrating various variables into spatial categorization. The theoretical–methodological foundation relies on applying map algebra within a GIS environment and utilizing the Analytical Hierarchy Process (AHP) method [44]. This approach identifies areas with varying potential for different uses, such as assessing the adaptability of human settlements [45], using multifactorial GIS modeling to select areas for solid waste disposal [46], evaluating eligible areas for agrovoltaics systems [38,47], and assessing and mapping susceptibility to flood events [39,48,49].
Based on a literature review from 1980 to 2021, the AHP emerged as the most widely used method [50]. Its popularity stems from its perceived ease of application and user-friendly nature, requiring fewer specialized skills than other methodologies. AHP aims to organize objectives, attributes, criteria, issues, and stakeholders, providing a comprehensive perspective on the complexities of decision-making processes [51].
In addition, the wide-ranging effects of floods on the health and well-being of urban inhabitants must be carefully considered [52]. Understanding these dynamics and employing appropriate tools and methodologies is critical for sustainable urban development and resilience. As reiterated by [17], mapping and identifying flood-prone areas in urban environments allows for the appropriate allocation and redirection of resources (financial, personnel, and material) and the creation of emergency plans to reduce vulnerability.
To contextualize the selection of parameters adopted in this study, a bibliographic review was conducted in the ScienceDirect database (Elsevier), using the keywords “urban floods”, “Amazon”, and “MCDM”. This search yielded only 20 results, none of which focused specifically on the Amazon region, and only one applied in Brazil. When the term “susceptibility” was included to refine the search, the number of relevant publications decreased even further, underscoring a pronounced gap in studies that address flood susceptibility and spatial mapping of flood-prone areas in the Amazon context.
Among the limited findings, only one study was identified that examined the city of Manaus, Amazonas, emphasizing the damages caused by flood events, rather than on spatial susceptibility modeling [53]. Moreover, when studies focusing solely on river basins are excluded, the scarcity becomes even more evident. For instance, within the Amazon region, only six studies focused on the metropolitan area of Belém were found. A noteworthy contribution is the work by [54], which employed geospatial analysis to identify flood-prone areas in Belém, highlighting the compounded effects of unplanned urban expansion near water bodies, infrastructural deficits, and hydrometeorological conditions.
This research gap becomes even more critical in the context of Ananindeua, a rapidly urbanizing municipality in the Amazon. In 2023, a comprehensive municipal study identified 43 distinct zones vulnerable to environmental hazards, including rainfall-induced and coastal erosion, landslides, and flooding. These areas were classified by risk level, with 7 zones designated as “high risk” and 36 as “very high risk”, indicating a critical potential for destructive events [55]. The study emphasized the urgent need for more localized investigations focusing on Ananindeua. This urgency is magnified when considering the intersection of “flooding”, “GIS”, and “AHP”—a thematic niche with virtually no precedent in this municipality. In contrast, related studies have been more frequent in neighboring Belém, including spatial assessments of hydrometeorological impacts and urban flood risk [56,57].
Despite increasing global interest in urban flood susceptibility modeling—particularly those employing MCDM approaches—studies on the Amazon region remain exceedingly rare. This scarcity is particularly notable concerning spatially explicit, municipal-scale analyses. Given the region’s ecological singularity, urban development pressures, and complex hydrological dynamics, the absence of geospatial flood susceptibility assessments represents a significant void in the literature. The present study seeks to address this gap by applying a GIS-based AHP methodology to Ananindeua, offering novel insights into flood vulnerability in one of the planet’s most environmentally sensitive and hydrologically dynamic regions.
Thus, the primary objective of this study is to detect, spatialize, and analyze flood susceptibility areas, discussing their impacts on the urban environmental quality of Ananindeua, Pará, Brazil. Data from rainfall, land use and land cover change (LULC), soil type, slope, and drainage density were employed to assess flood susceptibility (from 1981 to 2023). The city has consistently faced such occurrences, necessitating a comprehensive understanding of this dynamic. A multi-criteria framework will be employed to achieve this, utilizing geoprocessing techniques, MCDM, and map algebra. Spatial data will be processed using map algebra within the QGIS software (version 3.34.8 “Prizren”) to understand these dynamics better.
Rainfall and changes in land cover increase the susceptibility to flooding and reduce the urban environmental quality of Ananindeua. Therefore, this study aims to observe whether rainfall increases the potential susceptibility to flooding in the municipality.

2. Materials and Methods

2.1. Study Area

This study focuses on the Ananindeua municipality (Brazil), which spans approximately 190.581 km2, with 62.75 km2 classified as urbanized. Ananindeua has an estimated population of 478,778 inhabitants [58]. The Municipal Human Development Index (IDHM) ranks Ananindeua just behind the state capital, Belém [59]. Notably, Ananindeua is the fourth largest in Gross Domestic Product (GDP) among the 144 municipalities of Pará, showcasing strengths in commerce, services, and tourism, and boasting 30 municipal schools and 27 primary health units [58,60,61].
The climatic conditions in Ananindeua are characterized by average temperatures ranging from 24 °C to 32 °C. The area receives an average annual rainfall of 3800 mm, with the highest rainfall typically occurring in March [62]. Understanding these urban attributes alongside socio-economic factors is crucial for strategic planning and promoting sustainable growth in Ananindeua.
Historically, Ananindeua experienced rapid urbanization, initially driven by the Belém–Bragança Railway’s development (1884). Currently, the city’s structure and expansion are significantly influenced by the BR-316 Highway, which serves as the primary terrestrial route to the capital, Belém [63]. Ananindeua is part of the Metropolitan Region of Belém (RMB), bordering the municipalities of Benevides, Marituba, and the capital city of Belém (Figure 1).

2.2. Selection and Justification of Criteria

Flood susceptibility mapping using GIS and multi-criteria decision-making methods, such as the AHP, requires careful selection of criteria that capture the key physical, environmental, and anthropogenic factors associated with flood risk. The selection process must balance scientific robustness, data availability, and regional applicability. This study adopted five criteria: rainfall, LULC, slope, soil type, and drainage density.
These criteria were selected based on their frequent application in peer-reviewed studies, their strong conceptual association with flood processes, and the availability of spatial data for the study area. Table 1 presents a comparative overview of selected flood susceptibility studies that have employed AHP, detailing the criteria used, number of parameters, methodology, and geographic setting.
As shown in Table 1, although there is variation in the number and types of parameters employed across different contexts, the five criteria selected in the present study are consistently among the most used. Their relevance is especially evident in urban or peri-urban regions with constrained data environments. Studies, such as those by [67,68,69,70,71], reinforce the methodological adequacy of these variables in flood susceptibility assessments using AHP, even when more complex alternatives are available. Notably, none of these studies were conducted in Brazil, highlighting the originality and relevance of the current research, particularly in the Amazonian urban context of Ananindeua.
The limited availability of reliable, high-resolution geospatial data in the study area also guided the selection of only five criteria. While additional variables—such as proximity to rivers, runoff coefficients, or impervious surface ratios—may enhance model complexity, their absence in open-access databases or their redundancy with selected criteria (e.g., impervious surfaces already represented within LULC classes) would not substantively improve the analysis. Therefore, the criteria adopted in this study provide a robust and context-appropriate basis for modeling urban flood susceptibility in medium-sized cities prone to flooding.

2.3. Datasets and Data Sources

The spatial criteria adopted in this study were implemented in raster format and processed using map algebra techniques within the QGIS software (version 3.34.8 “Prizren”) [75]. All spatial layers were reprojected to the SIRGAS 2000 coordinate reference system and resampled, when necessary, to ensure compatibility in cell resolution.
Table 2 summarizes the data sources, spatial resolutions, and reference years for each of the five criteria used in the modeling framework.
Rainfall data were derived from the Climate Hazards Group InfraRed Precipitation with Stations (CHIRPS) dataset, which offers reliable precipitation estimates for tropical regions at a spatial resolution of 0.05° (~5 km). This product has been widely validated and is regularly updated, ensuring its reliability and consistency for climate-related studies [76,77]. The temporal range considered spans from 1981 to 2023, with special attention to the month of March, identified as the period of peak rainfall intensity in the region.
Slope data were calculated from the Digital Elevation Model (DEM) derived from ALOS PALSAR (Advanced Land Observing Satellite—Phased Array L-band Synthetic Aperture Radar), obtained from the Alaska Satellite Facility (ASF), with a resolution of 12.5 m. The Kernel density method was applied to delineate drainage density based on river networks acquired from the Brazilian National Water Agency (ANA) [69].
The land use and land cover (LULC) map was obtained from the MapBiomas Project, Collection 8 (2023), with a spatial resolution of 30 m. The classification incorporates detailed land use typologies for Brazil based on satellite imagery and time-series analyses. Soil type data were retrieved from the geospatial platform of Embrapa’s Brazilian Soil Information System (GeoInfo), also at a 30 m resolution.
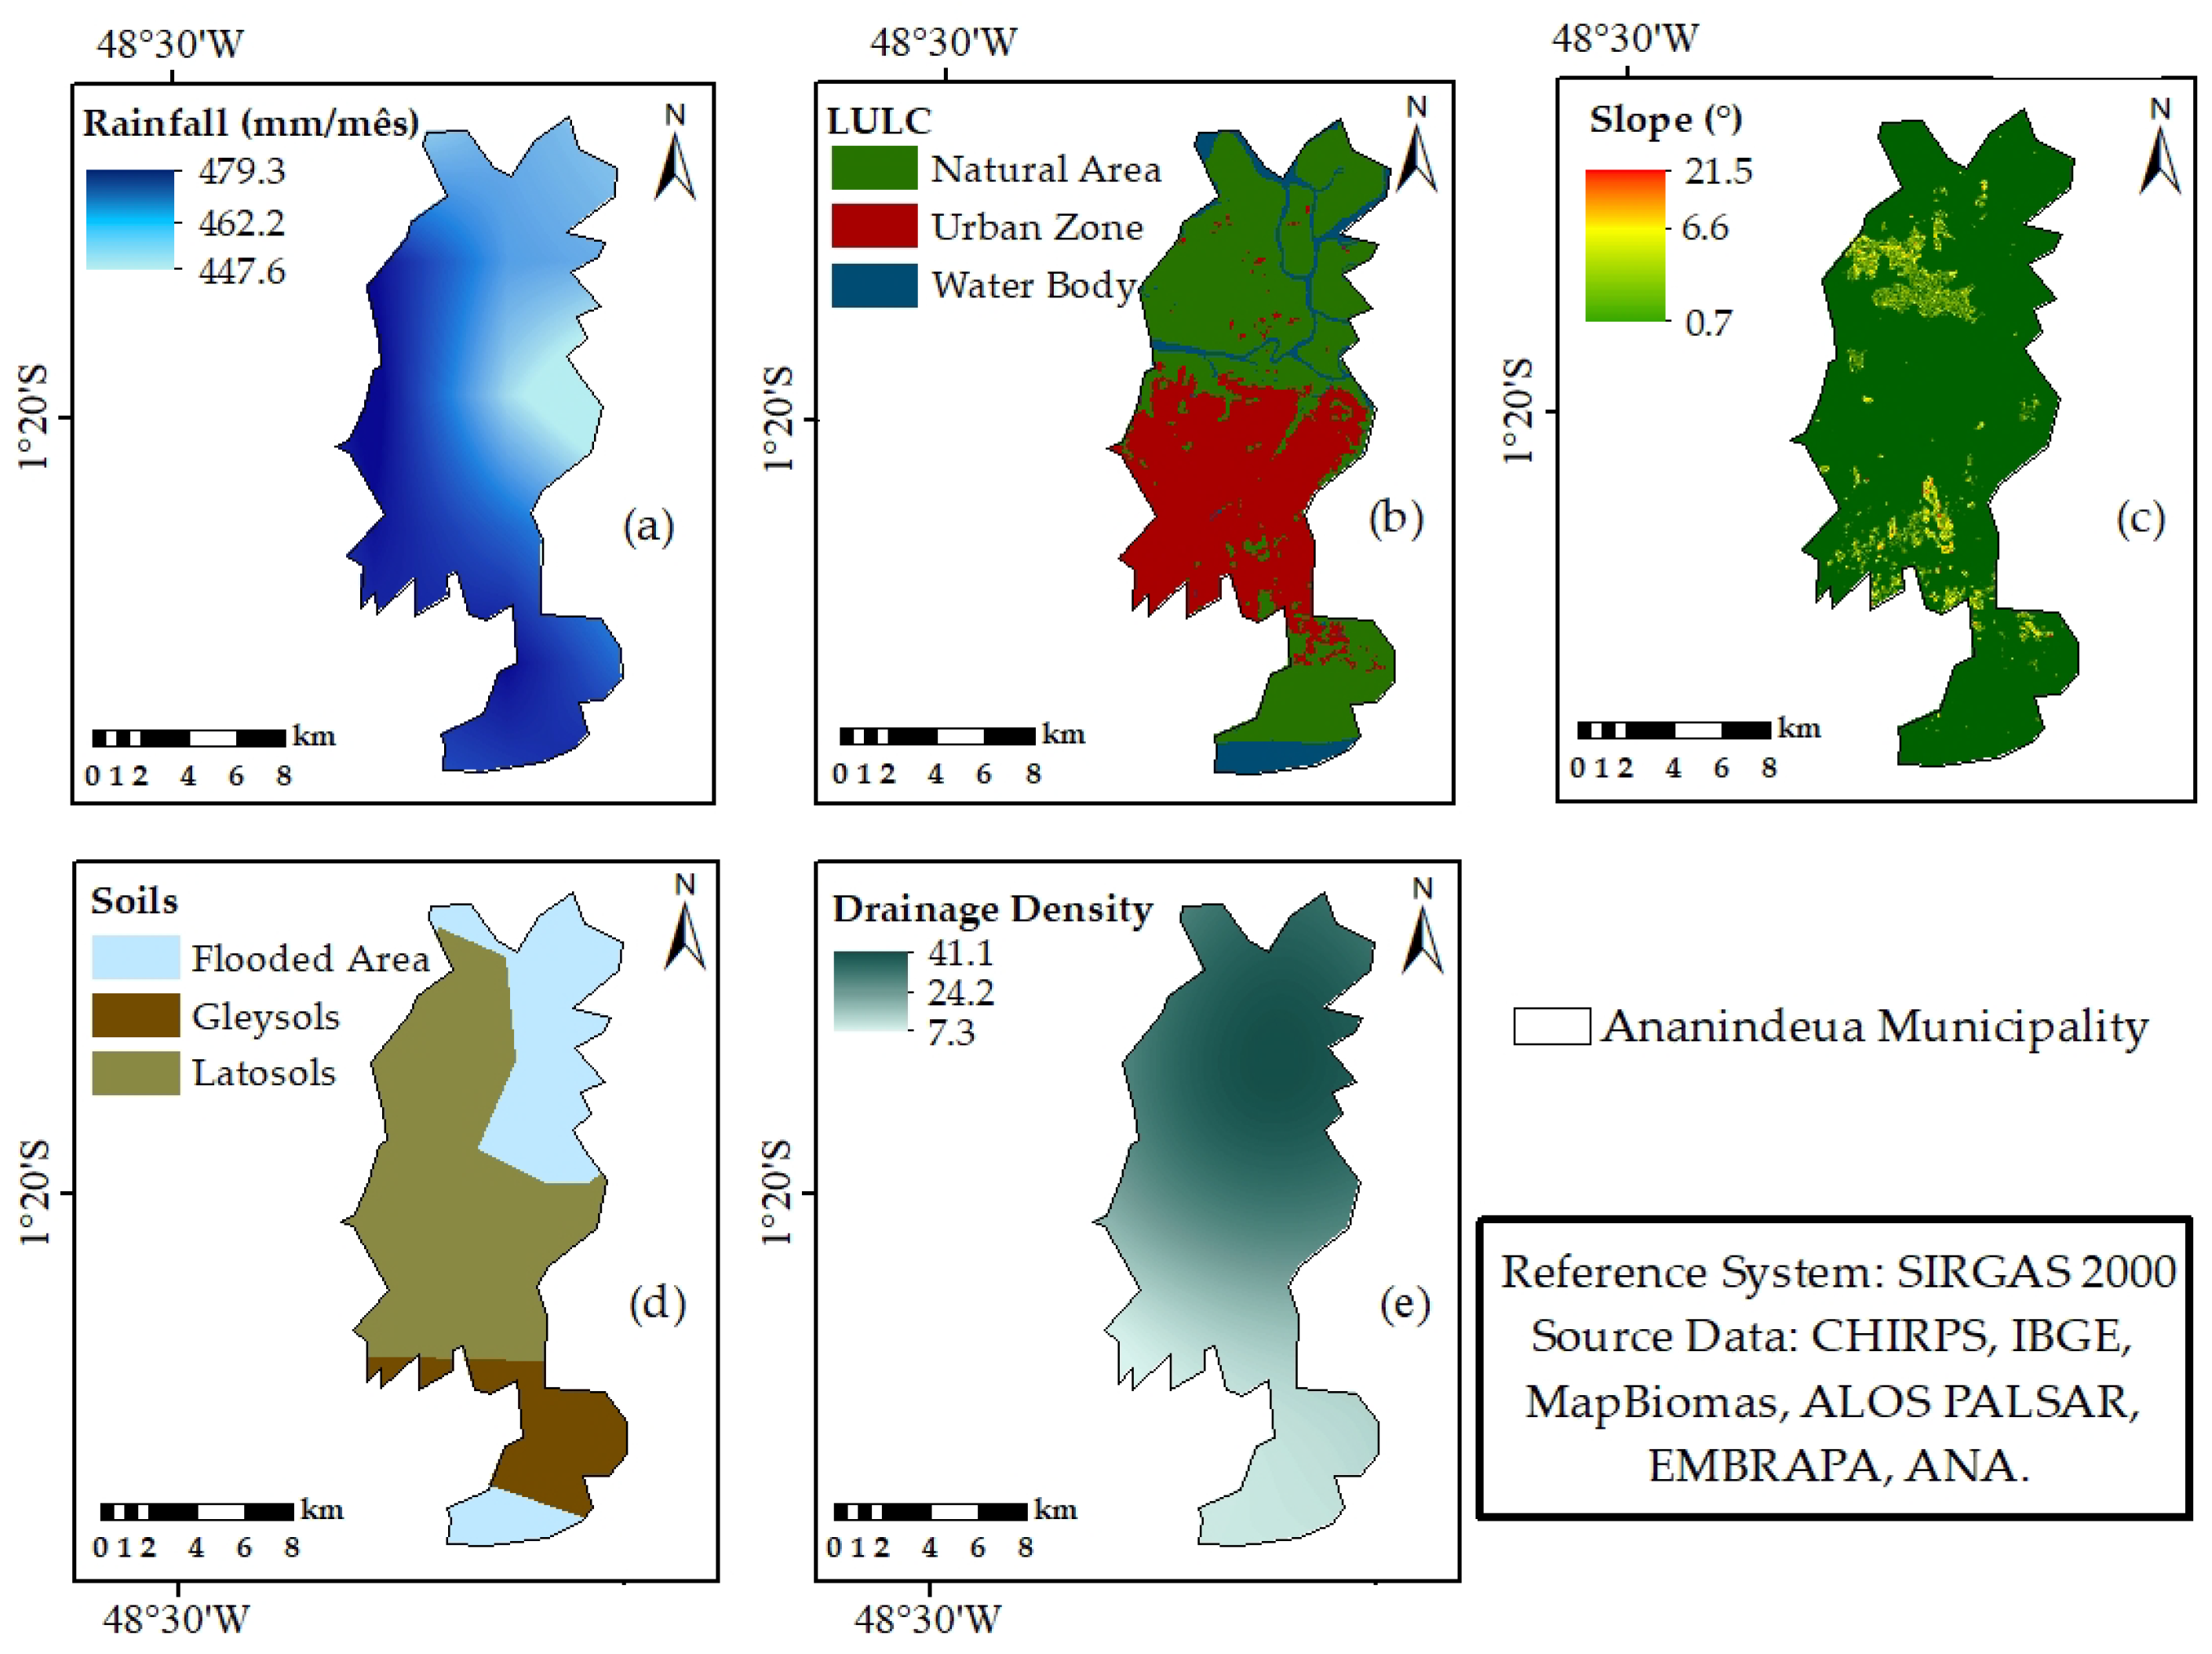
Figure 2 illustrates the geospatial layers used in the flood susceptibility analysis, showing the spatial distribution and characteristics of each input criterion.
These geoenvironmental variables influence flooding events, such as the high volume of observed rainfall, urban expansion, locations with steep gradients, unstable soils, and areas with higher concentrations of water bodies.

2.4. AHP and Susceptibility Calculation

2.4.1. Methodology Overview and Justification

The Analytical Hierarchy Process (AHP), a robust multi-criteria decision-making tool, was employed to derive the relative importance of criteria for flood susceptibility mapping. Following an extensive literature review, as outlined in preceding sections, spatial geographic data were collected and pre-processed from relevant databases.
The AHP methodology was selected due to its simplicity and structure in the hierarchical process, its ability to handle qualitative and quantitative factors, the inclusion of expert judgment, the existence of consistency verification, and its widespread academic acceptance and validation [68,78,79,80,81]. Thus, due to often encountering certain computational complexity, lack of hierarchical structure, difficulty in interpreting obtained results, and/or lack of consistency verification, AHP was selected in many studies over other multi-criteria analysis methodologies [69,70,80,81].
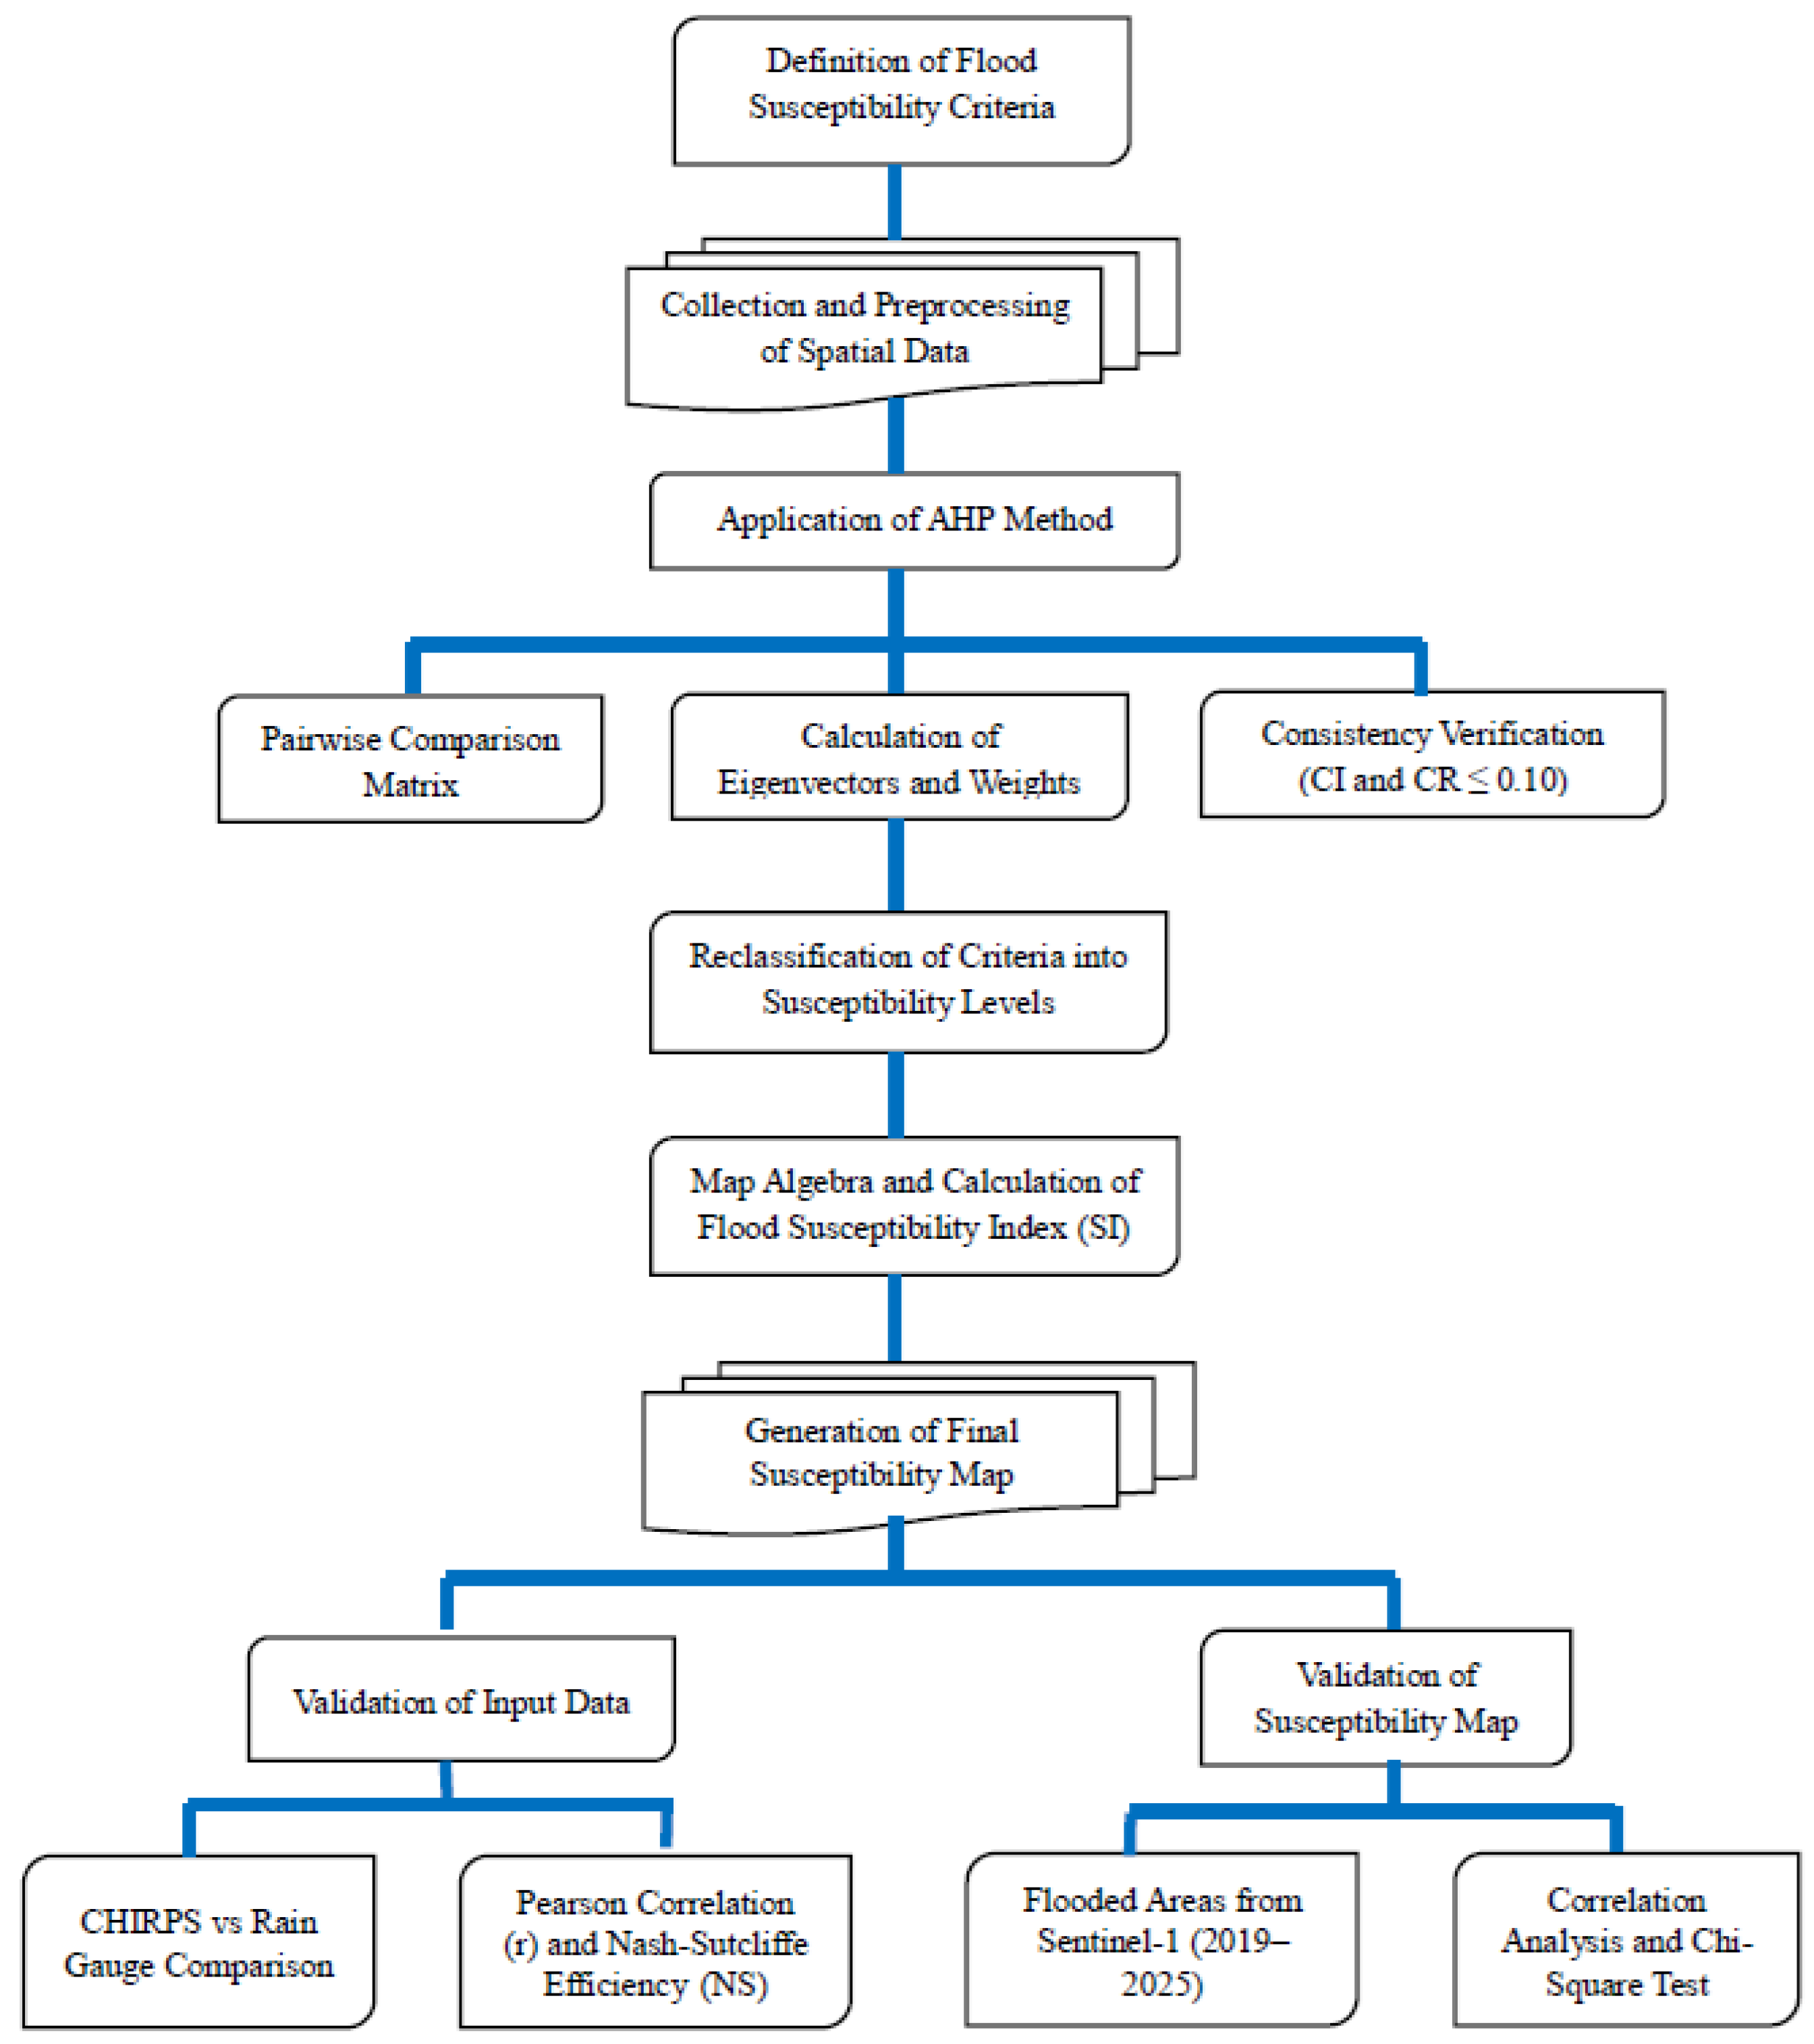
The applicability of the AHP methodology is reinforced by the study of [82]. Among the 18 AHP-based articles identified in the scoping review, these studies collectively received a total of 457 citations. Nonetheless, there is no documented application of AHP to urban environmental quality data in Brazil, possibly due to the inherent complexity of acquiring suitable and sufficient research data for such analyses. This gap underscores the originality and relevance of applying AHP to assess flood susceptibility in the municipality of Ananindeua. Figure 3 presents the flowchart with the methodology implemented.

2.4.2. AHP Implementation Framework

Using the flood susceptibility criteria established in Section 2.2, the AHP methodology was applied to derive their relative importance. The flood susceptibility map development followed the AHP-based approach proposed by [83] and aligned with methodologies established by various authors [78,79,84,85]. Geoenvironmental components were spatialized using QGIS software [86].
The implementation process consisted of three main stages: establishment of a relevance scale to provide a systematic framework for comparing criteria importance, pairwise comparison for systematic assessment of each variable’s influence on flood occurrence, and hierarchical ranking to determine criteria importance based on expert judgment.
Expert judgment during the pairwise comparison process was guided by Saaty’s Relative Importance Scale (Table 3), which provides standardized values for comparing criteria.

2.4.3. Detailed Methodological Steps

The methodological steps adopted to apply the AHP and generate the flood susceptibility index are detailed below:
  • The relative importance among criteria was determined using a pairwise comparison scale (Table 4).
  • A pairwise comparison matrix (PCM) was constructed, in which each element represented the relative importance of one criterion over another.
  • The principal eigenvector of the PCM was calculated to derive the initial weights associated with each criterion.
  • The weights were normalized by dividing each entry by its column sum and averaging the values across rows, ensuring the total equaled one.
  • The consistency index (CI) was calculated using Equation (1):
    CI = (λmax − n)/(n − 1)
    where λmax is the maximum eigenvalue and n is the number of criteria.
  • The consistency ratio (CR) was computed using Equation (2):
    CR = CI/RI
    where RI is the random index. A CR ≤ 0.10 indicated acceptable consistency in the judgments.

2.4.4. Weight Derivation and Validation

The AHP results yielded normalized weights from the PCM, which were used to assign relative importance to the five geoenvironmental criteria: rainfall, land use and land cover (LULC), slope, soil type, and drainage density. Table 4 presents the comparison matrix and respective weights attributed to the selected criteria.
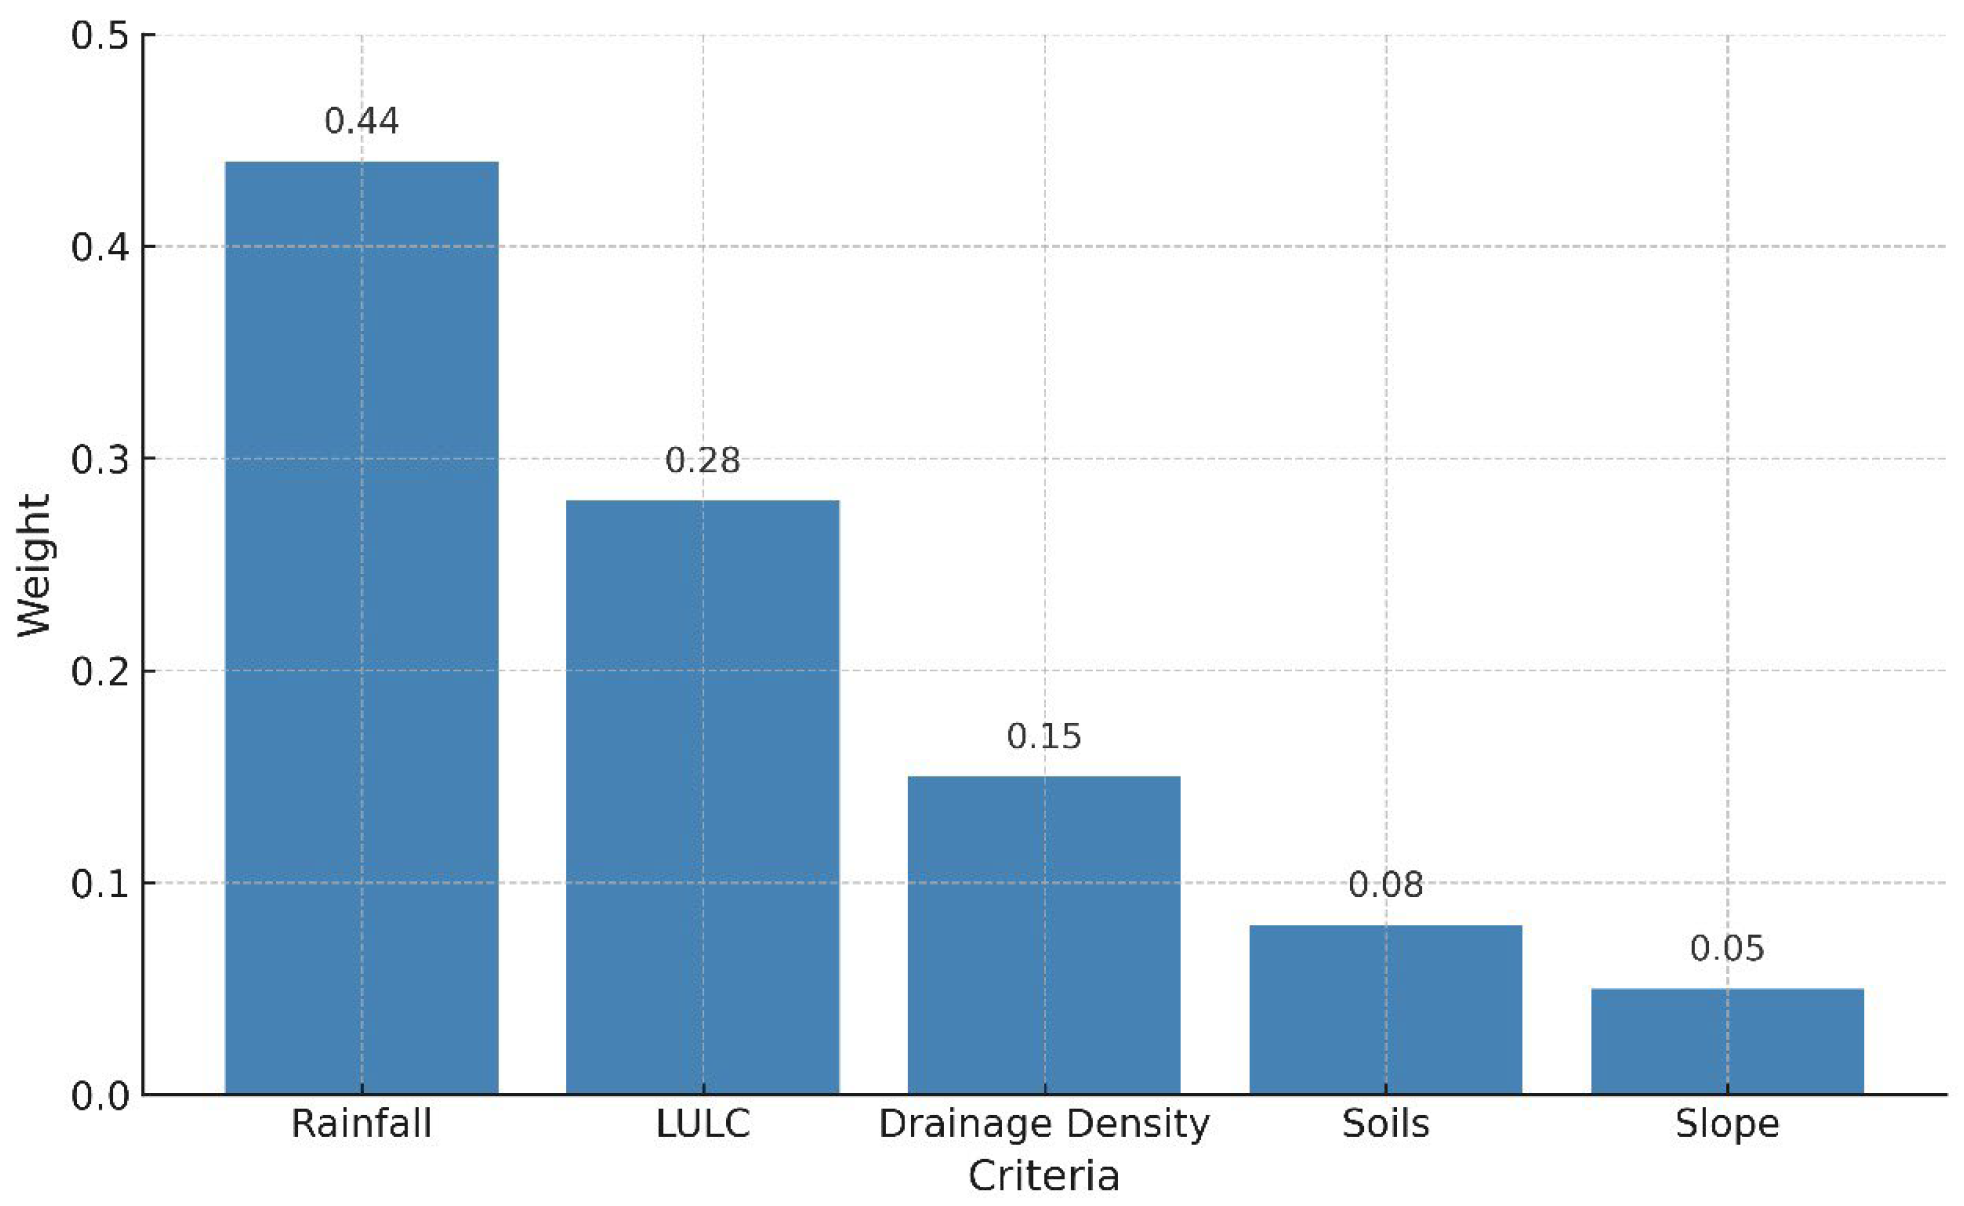
Thus, it is possible to observe in Figure 4 a graphical summary of the weights of the criteria aligned in a line graph to improve understanding.
To ensure the reliability of the pairwise comparisons, the consistency ratio (CR) was calculated for all comparisons. All CR values remained below the acceptable threshold of 0.10, indicating satisfactory consistency and judgment quality in the pairwise comparison matrix. The obtained values demonstrate acceptable judgment quality, with consistency ratios remaining below 10%, indicating reliable variable weights. According to established protocols [88], pairwise ratings exceeding this threshold would require revision until the consistency index (CI) falls below 10%.

2.4.5. Criteria Classification and Susceptibility Levels

The geoenvironmental criteria, represented as raster layers, were reclassified into three susceptibility levels (low, medium, and high) based on their contribution to flood potential. The data related to these selected criteria delineates susceptibility levels to flood events in the Ananindeua municipality. Table 5 outlines the degree of influence of the variables and provides information on the classes and weights considered for susceptibility.
Table 6 lists the characteristics of each variable, considering their weighting and classification criteria. All geoenvironmental variables were classified based on the study developed by [79] and adapted to the tropical context of the study area, which is a flat, highly rainy region with numerous channels and small rivers crossing the urban area, a common feature of cities in the Amazon.

2.4.6. Final Map Generation

Once the weights were validated, map algebra was applied to the rasterized geoenvironmental variables to compute the flood susceptibility index (SI). Map algebra operations were performed using the Raster Calculator tool in the GIS environment. Each raster layer was multiplied by its corresponding weight, and the resulting layers were summed to generate the flood susceptibility index, as shown in Equation (3):
SI = p1 × U + p2 × R + p3 × D + p4 × S + p5 × DD
where:
  • SI = flood susceptibility index (dimensionless);
  • p1 to p5 = normalized weights of each criterion;
  • U, R, D, S, DD = reclassified values of land use/land cover, rainfall, slope, soil type, and drainage density, respectively.
This weighted overlay approach ensured proportional integration of each factor’s influence into the final susceptibility map. The resulting map was classified into three susceptibility levels: low, medium, and high [90].

2.5. Validation Procedures

CHIRPS precipitation data were validated against ground-truth measurements to assess their accuracy and suitability for flood susceptibility mapping. Rainfall data from the meteorological station were compared with the raster product pixel overlaid on the collection point [49]. Pearson’s correlation coefficient (r) was calculated to relate the independent variable (station data) to the dependent variable (CHIRPS data) [91] as shown in Equation (4):
r = X X ¯ · Y Y ¯ ( X X ¯ ) 2 · ( Y Y ¯ ) 2
The correlation coefficient (r) is a dimensionless statistical indicator calculated to assess the dependency relationship between variables using a numerical range (−1 to 1). It indicates the increase or decrease of the dependent variable concerning the independent variable [92].
The Nash–Sutcliffe coefficient was calculated to assess the efficiency of CHIRPS data in representing actual rainfall in the study region [93], as shown in Equation (5):
N S = 1 i = 1 n ( P O b s P E s t ) 2 i = 1 n ( P O b s P ¯ O b s ) 2
where n is the number of observations, PM is Measured Rainfall; and P ¯ Est is Estimated Average Rainfall. The Nash–Sutcliffe statistic (NS) values were classified according to the criteria presented in Table 7 [94].
The flood susceptibility map was validated using flooded area data estimated from Sentinel-1 SAR (Synthetic Aperture Radar) images. For this analysis, the months of February and March, which are the periods with the highest rainfall in the study area, were utilized and compared with data from October (the driest period) for the years 2019 to 2025.
To validate the predictive capability of the map, raster values were extracted at the centroids of the polygons representing the flooded areas estimated from SAR images. A Python-based analysis was performed to evaluate the correlation between predicted flood susceptibility and observed flood events across the study period.
Additionally, a chi-square goodness-of-fit test was applied to verify whether the observed distribution significantly deviated from a uniform distribution (null hypothesis). This statistical analysis helped determine if the spatial distribution of flood events correlated with the predicted susceptibility levels. The test compared the observed frequency of events across susceptibility categories against an expected uniform distribution. A significance level of α = 0.05 was used as the threshold for hypothesis rejection. The analysis was performed using the scipy.stats module in Python (3.11.11) to ensure computational accuracy and reproducibility.
It is important to highlight that the implementation of ROC-AUC curves, confusion matrices, or Kappa indices was not feasible due to the scarcity and inconsistency of reliable ground-truth data in the Amazon basin. Additionally, persistent cloud cover during peak flood seasons hinders optical data acquisition, restricting the application of conventional validation metrics in this data-scarce tropical region.

3. Results and Discussions

Results obtained provide a comprehensive overview of the spatial distribution of flood susceptibility within the municipality, highlighting the significance of each studied geoenvironmental variable in these events. Furthermore, this study presents the validation methods employed to ensure the robustness and reliability of the generated results.

3.1. Potential Susceptibility

Figure 5 highlights the spatial distribution of flood-prone areas based on multiple geoenvironmental variables used in the map algebra analysis. Figure 5a shows that high precipitation levels, especially during extremely rainy periods influenced by La Niña events—a climatic phenomenon that increases rainfall in the study region—can promote flooding. Figure 5b presents land use and land cover (LULC), highlighting anthropogenic factors such as urban expansion, which increases soil impermeabilization and intensifies surface runoff. This leads to the accumulation of rainwater in water bodies and contributes to a rapid rise in river levels.
Figure 5c displays soil types, indicating that the predominant soil is highly impermeable; its compaction hinders water infiltration and percolation, thereby contributing to rainwater accumulation. Figure 5d represents slope classes, revealing a very low terrain inclination, which characterizes a flood-prone plain. Figure 5e shows drainage density, which is high in the study area. This means there are numerous small rivers in close proximity, a fluvial factor that is crucial for assessing flood risks, as it increases the potential for simultaneous overflow events.
The combined effect of these geoenvironmental variables—precipitation, land use, soil type, slope, and drainage density—is sufficient to generate signs of potential natural disasters in the study area.
The results underscore the need for systemic actions to address socio-environmental issues arising from urbanization processes, which do not affect the territory uniformly [88]. Urbanization has a direct impact on the significant increase in impermeable surfaces, which prevents rainwater from infiltrating the soil, leading to surface accumulation and posing serious challenges to residents [90]. This accumulation intensifies surface runoff in urban contexts, accelerating its flow through engineered drainage structures such as pipes and river channels [89]. As a result, the soil’s capacity to absorb and infiltrate water is compromised, disrupting the local hydrological cycle.
Understanding the selection and behavior of specific criteria—among the numerous variables inherent to urban environments—is crucial for assessing flood susceptibility. Criteria such as slope, soil type, drainage density, and litho-geomorphological units are considered stable indicators due to their slow rate of spatial and temporal variation [97]. In this context, the development of tools capable of evaluating the susceptibility of urban areas to hydrological disasters becomes critical, especially in developing countries and in regions undergoing rapid urban expansion [98].
Urban flood events are generally associated with extreme rainfall combined with specific geomorphological characteristics. When these conditions occur in areas with high impermeability, surface runoff is significantly intensified, resulting in the accumulation of rainwater in drainage networks, especially during intense precipitation events [99,100].
High rainfall volumes in areas with a dense river network significantly exacerbate the risk of urban flooding by increasing surface runoff and overloading drainage systems [101,102]. Continued, unplanned urban expansion may further increase susceptibility to such events. Therefore, proper planning of drainage density is essential, as it directly affects residents’ quality of life and well-being, involving not only technical but also socio-environmental considerations [103].
Although the Analytic Hierarchy Process (AHP) can be integrated with other methods due to its ability to manage uncertainty [104], this study focused exclusively on its standalone application. To ensure the correct implementation of the AHP methodology, it is necessary to follow three main steps: (1) decomposition of the central problem into hierarchical levels; (2) construction of pairwise comparison matrices to evaluate the relative importance of selected criteria; and (3) consistency assessment of the judgments to validate their reliability [44].
The analysis of individual criteria revealed distinct susceptibility patterns across the study area (Table 8). Given the high rainfall characteristics of the region and considering that March was identified as the rainiest month during the study period, the “Rainfall” criterion showed no areas with low susceptibility, 4.0km2 classified as medium susceptibility, and 184.8 km2 as high susceptibility to flooding.
The topographic characteristics, represented by the “Slope” criterion, demonstrated a similar pattern to rainfall, with minimal medium-susceptibility areas (0.1 km2) and extensive high-susceptibility coverage (184.7 km2). This distribution reflects the predominantly flat terrain of the study area, which naturally increases flood susceptibility due to reduced drainage capacity.
The “Land Use and Land Cover (LULC)” criterion revealed a contrasting pattern, with 44.4 km2 classified as low susceptibility, minimal medium susceptibility (0.1 km2), and 140.1 km2 as high susceptibility. This distribution highlights the significant impact of land cover changes, particularly the replacement of green areas with impermeable surfaces, which disrupts natural surface runoff and soil absorption processes.
Soil characteristics showed a more balanced distribution, with no areas of low susceptibility, 105.1 km2 of medium susceptibility, and 79.7 km2 classified as highly susceptible. The “Drainage Density” criterion exhibited the most varied distribution across all susceptibility classes: 18.5 km2 (low), 55.3 km2 (medium), and 110.9 km2 (high susceptibility).
The comprehensive analysis reveals that medium susceptibility to flooding events is primarily driven by “Rainfall” and “Drainage Density” criteria. This combination underscores the critical influence of intense precipitation events coupled with inadequate drainage infrastructure, particularly in areas experiencing land use transitions where natural surfaces are replaced by impermeable materials.
For high susceptibility classification, the analysis identified “Rainfall” and “Slope” as the most influential criteria, covering 184.8 km2 and 184.7 km2, respectively. These findings emphasize how the combination of intense rainfall and flat topography creates optimal conditions for flood occurrence. The “LULC” and “Drainage Density” criteria also contributed significantly to high-susceptibility areas, with 140.1 km2 and 110.9 km2, respectively, reinforcing the importance of land cover management and drainage system adequacy in flood risk mitigation.
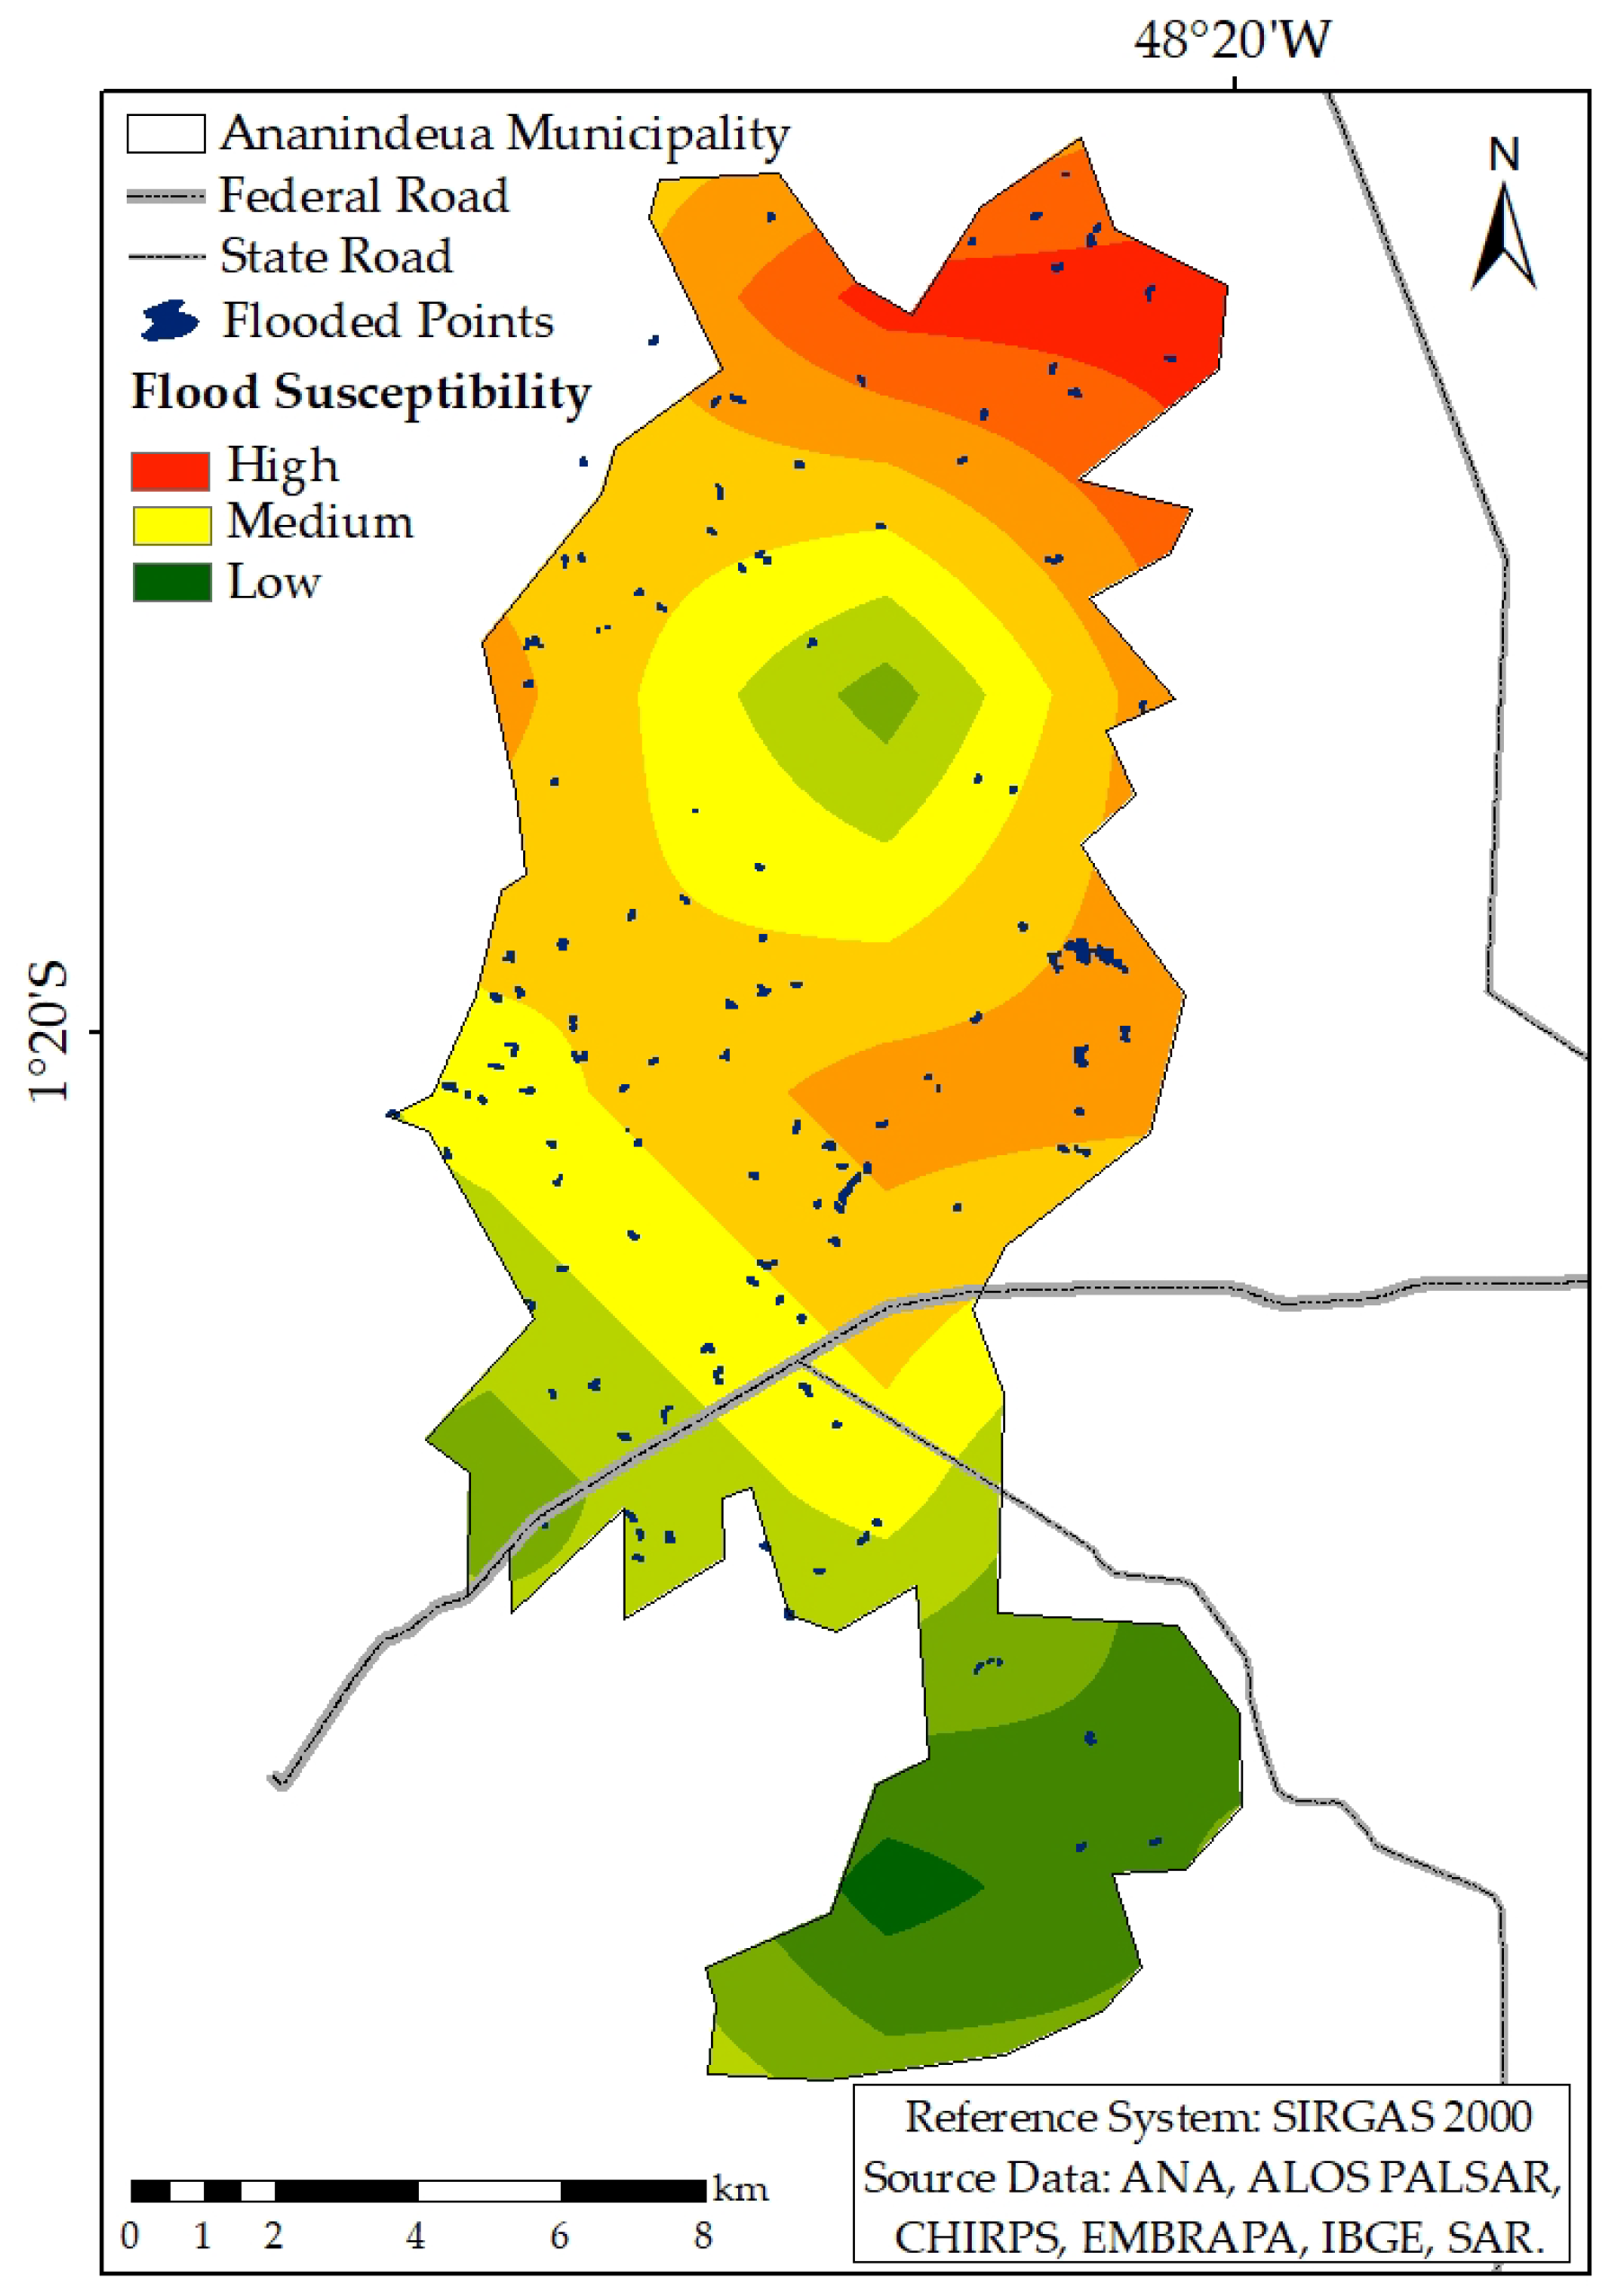
The spatial integration of all susceptibility criteria produced a comprehensive flood risk map for Ananindeua municipality (Figure 6). The analysis reveals a heterogeneous distribution of susceptibility levels across the municipal territory, with distinct spatial patterns that reflect the complex interaction between natural and anthropogenic factors.
Areas classified as having low susceptibility to flooding cover 20.7 km2 of the municipality’s territory, representing the smallest portion of the study area. The spatial distribution of these areas is primarily determined by favorable conditions in two key criteria: land use and land cover (LULC) and drainage density. These areas typically correspond to regions with adequate vegetation cover and well-distributed drainage networks, which enhance the natural capacity for water infiltration and runoff management.
Medium-susceptibility areas occupy the largest extent of the municipality, totaling 87.9 km2. This classification results from a balanced combination of all analyzed criteria—rainfall, LULC, soils, slope, and drainage density—indicating areas where flood risk is moderated by the mixed influence of both favorable and unfavorable conditions. Spatially, these areas are concentrated primarily in the central part of the municipality, where urban development patterns and topographic conditions create intermediate flood risk scenarios.
High-susceptibility areas cover 76.0 km2 and represent zones of greatest concern for flood management. Notably, this classification is influenced by four of the five selected criteria, suggesting that the convergence of specific risk factors creates critical conditions for flood occurrence. The spatial distribution of high-susceptibility areas is predominantly concentrated in the central and western parts of the municipality.
A significant finding from the spatial analysis concerns the relationship between flood susceptibility and major transportation infrastructure. High-susceptibility areas show fewer direct intersections with major roads, specifically BR-316 and PA-483, compared to medium-susceptibility zones. This pattern indicates that while the most flood-prone areas may have a reduced direct impact on major transportation corridors, the intersection of medium-susceptibility areas with federal and state roads (BR-316 and PA-483) presents important considerations for infrastructure resilience and emergency response planning.
The spatial patterns identified in this study align with established principles of urban flood management. Urban drainage systems are fundamentally interconnected with city infrastructure, serving to control rainwater and direct it to appropriate discharge points that minimize societal harm [100]. The concentration of high river densities combined with large rainfall volumes contributes significantly to urban flooding formation [101].
The susceptibility patterns observed in Ananindeua municipality reflect broader challenges associated with unplanned urban expansion, which can substantially increase flooding susceptibility [103]. The predominance of medium- and high-susceptibility areas (163.9 km2 combined, representing 88.8% of the study area) underscores the critical importance of implementing adequate drainage density planning strategies.
Based on the AHP integrated analysis which generated the comprehensive susceptibility map, Ananindeua municipality exhibits a moderate to high potential for flood events. This assessment is supported by the limited extent of low-susceptibility areas and the substantial coverage of medium- and high-risk zones. The spatial concentration of moderate-susceptibility areas in central and western regions, combined with the infrastructure intersection patterns, provides essential information for prioritizing flood risk management interventions and urban planning strategies that address both socio-environmental and technical aspects of flood resilience.

3.2. Validation of the Flood Susceptibility Map

The validation of rainfall data (CHIRPS) yielded exceptional results, with a strong correlation (r = 0.83) and coefficient of determination (r2 = 0.70) in the study region. This robustness is particularly significant considering that the rainfall criterion received the highest weight in the previously conducted Analytic Hierarchy Process (AHP). Furthermore, the Nash–Sutcliffe efficiency coefficient (NS) demonstrated outstanding agreement (NS = 0.97) between estimated and measured precipitation values, confirming the reliability of the rainfall data used as a foundation for priority decisions in the model.
The susceptibility map, obtained through the application of the AHP methodology, classifies pixel values into three categories: low (20 to 23), medium (24 to 26), and high (27 to 30). To validate the predictive capability of the map, raster values were extracted at the centroids of the polygons representing the flooded areas estimated from SAR images. A Python-based analysis was performed, considering a total of 637 flood events across the study period from 2019 to 2025. The observed frequencies were as follows: low (18 events), medium (362 events), and high (257 events).
These frequencies correspond to approximately 2.8% in the low susceptibility class, 56.8% in the medium class, and 40.3% in the high susceptibility class. Additionally, a chi-square goodness-of-fit test was applied to verify whether the observed distribution significantly deviates from a uniform distribution (null hypothesis). The test produced a chi-square statistic of 292.75 with a p-value below 0.0001, leading to the rejection of the null hypothesis.
This statistical evidence demonstrates that flood events are predominantly concentrated in the “Medium Susceptibility” class (56.8%), followed by the “High Susceptibility” class (40.3%), with very few events occurring in the “Low Susceptibility” class (2.8%). The combined occurrence of events in medium- and high-susceptibility areas accounts for 97.2% of all flood events, indicating a strong predictive capability of the model. These results demonstrate that the AHP analysis—considering criteria such as rainfall, LULC, soils, slope, and drainage density—adequately captures the factors influencing the occurrence of floods in Ananindeua.
This analysis represents a pioneering approach, particularly given its implementation within a Brazilian Northern Region municipality, where such methodologies are not commonly applied.

4. Conclusions

This study demonstrated the effectiveness of the Analytic Hierarchy Process (AHP) in identifying flood-prone areas in the municipality of Ananindeua, Pará, highlighting the relevance of a systemic and spatially explicit approach to addressing socio-environmental challenges resulting from uneven urbanization. The criteria of rainfall and drainage density received the highest weights in the multi-criteria analysis, emerging as key determinants of flood occurrence, particularly in residential zones near water bodies and urban areas influenced by linear infrastructure such as highways.
The predominance of areas classified as medium and high susceptibility (over 88% of the analyzed territory) reveals the magnitude of the issue and the urgency of integrated urban planning and environmental management interventions. The results suggest that the combination of intense rainfall, low slope, and urban densification over impermeable soils and dense drainage networks creates critical conditions for flooding. The strong correlation between observed flood events (derived from SAR imagery) and the susceptibility levels defined by the AHP model (with over 97% of events occurring in medium- and high-susceptibility zones) confirms the robustness and reliability of the proposed approach.
Although this study did not directly assess infrastructure or building damage, the identified spatial patterns offer valuable insights for future mitigation and adaptation measures, including the redesign of drainage systems, rehabilitation of vulnerable areas, and the development of climate resilience strategies. Given its adaptable methodological structure, the approach can be replicated in other Brazilian municipalities, provided local specificities and data availability.
The originality of this research lies primarily in the systematic application of a robust multi-criteria technique in a municipality of the Amazon region, where flood susceptibility studies of this methodological depth remain scarce. Therefore, the findings contribute not only to advancing technical–scientific knowledge but also to informing evidence-based public policies aimed at fostering safer and more sustainable cities in contexts of rapid territorial transformation.

Author Contributions

Conceptualization, L.P., L.D. and N.B.; methodology, L.P., N.B. and R.O.; software, L.P.; N.B. and D.G.; validation, L.P., L.D. and N.B.; formal analysis, L.D., A.C.T. and N.B.; investigation, L.P., L.D. and D.G.; resources, L.P., L.D., A.C.T., N.B. and D.G.; data curation, L.P.; writing—original draft preparation, L.P. and N.B.; writing—review and editing, L.P., L.D., A.C.T., N.B. and D.G.; visualization, L.P., L.D., A.C.T., N.B. and D.G.; supervision, L.D., A.C.T. and N.B.; project administration, L.D. and N.B.; funding acquisition, L.P. and L.D. All authors have read and agreed to the published version of the manuscript.

Funding

This study was financed in part by the Coordenação de Aperfeiçoamento de Pessoal de Nível Superior-Brasil (CAPES)—Finance Code 001.

Data Availability Statement

The raw data supporting the conclusions of this article will be made available by the authors on request.

Acknowledgments

The authors acknowledge the financial support provided to the Institute of Earth Sciences (ICT) through the multi-annual funding contract with the Foundation for Science and Technology (FCT), under project UID/04683.

Conflicts of Interest

The authors declare no conflicts of interest.

References

  1. Kumar, K.; Singh, D.P. Assessing the Dynamics of Urbanization: A Comprehensive Review of Associated Risks and Mitigation Strategies. J. Res. Infrastruct. Des. 2024, 6, 1–10. [Google Scholar] [CrossRef]
  2. Arif, M.; Sengupta, S.; Mohinuddin, S.K.; Gupta, K. Dynamics of land use and land cover change in peri urban area of Burdwan city, India: A remote sensing and GIS based approach. GeoJournal 2023, 88, 4189–4213. [Google Scholar] [CrossRef]
  3. Towner, J.; Ficchi, A.; Cloke, H.L.; Bazo, J.; Perez, E.C.; Stephens, E.M. Influence of ENSO and tropical Atlantic climate variability on flood characteristics in the Amazon basin. Hydrol. Earth Syst. Sci. 2021, 25, 3875–3895. [Google Scholar] [CrossRef]
  4. Xavier, D.R.; Barcellos, C.; Freitas, C.M. Eventos climáticos extremos e consequências sobre a saúde: O desastre de 2008 em Santa Catarina segundo diferentes fontes de informação. Ambient. Soc. 2014, 17, 273–294. [Google Scholar] [CrossRef]
  5. Goulart, L.P.; Matsuoka, J.V. Análise das Áreas Suscetíveis à Alagamentos E Inundações Na Área Urbana Do Município De Uberlândia—Mg Utilizando Geoprocessamento E O Método De Análise Hierárquica AHP. GETEC, v.10, n.34, p.21–44/2021. Available online: https://revistas.fucamp.edu.br/index.php/getec/article/view/2566 (accessed on 10 May 2024).
  6. Garcia, F.R.; Júnior, M.J.A. Comparação de MDTs a partir do acoplamento de modelo hidrológico e hidrodinâmico aplicado à identificação de áreas de inundações urbanas. Rev. Bras. De Geogr. Física 2022, 15, 783–803. [Google Scholar] [CrossRef]
  7. Agonafir, C.; Lakhankar, T.; Khanbilvardi, R.; Krakauer, N.; Radell, D.; Devineni, N. A review of recent advances in urban flood research. Water Secur. 2023, 19, 100141. [Google Scholar] [CrossRef]
  8. Gomes, D.J.C.; Nascimento, M.M.M.; Pereira, F.M.; Dias, G.F.M.; Meireles, R.R.; Souza, L.G.N.; Picanço, A.R.S.; Ribeiro, H.M.C. Flow variability in the Araguaia River Hydrographic Basin influenced by precipitation in extreme years and deforestation. Rev. Bras. De Ciências Ambient. 2022, 57, 451–466. [Google Scholar] [CrossRef]
  9. Gomes, D.J.C.; Beltrão, N.E.S. Impacts of ocean-atmosphere interaction phenomena on hydrometeorology of the Gurupi river watershed, Eastern Amazon. Rev. Bras. De Climatol. 2024, 34, 643–667. [Google Scholar] [CrossRef]
  10. Foley, J.A.; Botta, A.; Coe, M.T.; Costa, M.H. El Niño-Southern Oscillation and the climate, ecosystems and rivers of Amazonia. Glob. Biogeochem. Cycles 2002, 16, 1–17. [Google Scholar] [CrossRef]
  11. Ronchail, J.; Labat, D.; Callède, J.; Cochonneau, G.; Guyot, J.L.; Filizola, N.; Oliveira, E. Discharge Variability within the Amazon basin. Reg. Hydrol. Impacts Clim. Changes Hidroclimatic Var. 2005, 296, 21–30. Available online: https://iahs.info/uploads/dms/13191.07%2021-30%20Foz%20S6-2-22%20Ronchail.pdf (accessed on 10 May 2024).
  12. Coutinho, E.C.; Rocha, E.J.P.; Lima, A.M.M.; Ribeiro, H.M.C.; Gutierrez, L.A.C.L.; Barbosa, A.J.S.; Paes, G.K.A.A.; Bispo, C.J.C.; Tavares, P.A. Variabilidade climática da precipitação na bacia Amazônica brasileira entre 1982–2021. Rev. Bras. De Climatol. 2018, 22, 476–500. [Google Scholar] [CrossRef]
  13. Ministério do Meio Ambiente (MMA). Vulnerabilidade Ambiental/Rozely Ferreira dos Santos, Organizadora. 2007. Available online: https://fld.com.br/wp-content/uploads/2019/07/Vulnerabilidade_Ambiental_Desastres_Naturais_ou_Fenomenos_Induzidos.pdf (accessed on 14 May 2024).
  14. Zhang, J.X.; Cheng, J.W.; Philbin, S.P.; Ballesteros-Perez, P.; Skitmore, M.; Wang, G. Influencing factors of urban innovation and development: A grounded theory analysis. Environ. Dev. Sustain. 2023, 25, 2079–2104. [Google Scholar] [CrossRef]
  15. Andrade, M.M.N.; Bandeira, I.C.N.; Fonseca, D.D.F.; Bezerra, P.E.S.; Andrade, A.S.; Oliveira, R.S. Flood risk mapping in the Amazon. In: Theodore Hromadka and Prasada Rao. (Org.). Flood Risk Manag. 2017, 1, 41–54. [Google Scholar] [CrossRef]
  16. Marengo, J.A.; Souza, C.M., Jr.; Thonicke, K.; Burton, C.; Halladay, K.; Betts, R.A.; Alves, L.M.; Soares, W.R. Changes in climate and land use over the Amazon region: Current and future variability and trends. Front. Earth Sci. 2018, 6, 1–21. [Google Scholar] [CrossRef]
  17. Portela, B.M.; Alves, G.B.; Silva, S.R.; Lafayette, K.P.V. Análise da vulnerabilidade à inundação na Bacia Hidrográfica do rio Sirinhaém, utilizando o Método de Análise Hierárquica. Rev. Bras. De Geogr. Física 2023, 16, 1247–1262. [Google Scholar] [CrossRef]
  18. Brito, A.J.; Conserva, C.S.; Araújo, C.B.; Lavinas, E.C.; Andrade, L.M.S. Expansão urbana e drenagem: Análise das soluções propostas para manejo de águas pluviais em região produtora de água na bacia do Paranoá, DF. Rev. Gestão Sustentabilidade Ambient. 2020, 9, 558. [Google Scholar] [CrossRef]
  19. Li, T.; Chen, C.; Li, Q.; Liu, L.; Wang, Z. Evolution Characteristics of Landscape Patterns and the Response of Surface Runoff in a Rapid Urbanization Area: Focus on the Chang–Zhu–Tan Metropolitan Area of China. Water 2023, 15, 3467. [Google Scholar] [CrossRef]
  20. Eshghizadeh, M. Urban development scenarios on flood peak discharge in an arid urban watershed using the WinTR-55 hydrologic model. Int. J. Hum. Cap. Urban Manag. 2024, 9, 345–356. [Google Scholar] [CrossRef]
  21. Lu, X.H.; Faith, K.S.C.; Hing, K.C.; Chen, W.-Q. Mitigating flood impacts on road infrastructure and transportation by using multiple information sources. Resour. Conserv. Recycl. 2024, 206, 107607. [Google Scholar] [CrossRef]
  22. Ayenew, W.A.; Kebede, H.A. GIS and remote sensing based flood risk assessment and mapping: The case of Dikala watershed in Kobo Woreda Amhara region, Ethiopia. Environ. Sustain. Indic. 2023, 18, 2023. [Google Scholar] [CrossRef]
  23. Ghosh, A.; Chatterjee, U.; Pal, S.C.; Islam, A.R.M.T.; Alam, E.; Islam, M.K. Flood hazard mapping using GIS-based statistical model in vulnerable riparian regions of sub-tropical environment. Geocarto Int. 2023, 38, 1–18. [Google Scholar] [CrossRef]
  24. Miranda, F.; Franco, A.B.; Rezende, O.; Costa, B.B.F.; Najjar, M.; Haddad, A.N.; Miguez, M. A GIS-base index of physical susceptibility to flooding as a tool for flood risk management. Land 2023, 12, 1408. [Google Scholar] [CrossRef]
  25. Osman, S.A.; Das, J. GIS-based flood risk assessment using multi-criteria decision analysis of Shebelle river basin in Southern Somalia. SN Appl. Sci. 2023, 5, 1–17. [Google Scholar] [CrossRef]
  26. Trif, S.; Bilasco, S.; Petrea, D.; Rosca, S.; Fodorean, I.; Vescan, I. Spatial modelling through GIS analysis of flood risk and related financial vulnerability: Case study: Turco river, Romania. Appl. Sci. 2023, 13, 9869. [Google Scholar] [CrossRef]
  27. Li, Z.W.; Tang, X.G.; Li, L.; Chu, Y.; Wang, X.; Yang, D. GIS-based risk assessment of flood disaster in the Lijiang river basin. Sci. Rep. 2023, 13, 6160. [Google Scholar] [CrossRef]
  28. Akallouch, A.; Al Mashoudi, A.; Ziani, M.; Elhani, R. GIS application in urban flood risk analysis: Midar as a case study. Open J. Ecol. 2024, 14, 148–164. [Google Scholar] [CrossRef]
  29. Bullen, J.; Miles, A. Exploring local perspectives on flood risk: A participatory GIS approach for bridging the gap between modelled and perceived flood risk zones. Appl. Geogr. 2024, 163, 103176. [Google Scholar] [CrossRef]
  30. Efraimidou, E.; Spiliotis, M. A GIS-based flood risk assessment using the decision-making trial and evaluation laboratory approuach at a regional scale. Environ. Process. 2024, 11, 9. [Google Scholar] [CrossRef]
  31. Mukhtar, M.A.; Shangguan, D.; Ding, Y.; Anjum, M.N.; Banerjee, A.; Butt, A.Q.; Yadav, N.; Li, D.; Yang, Q.; Khan, A.A.; et al. Integrated flood risk assessment in Hunza-Nagar, Pakistan: Unifying big climate data analytics and multi-criteria decision-making with GIS. Front. Environ. Sci. 2024, 12, 1337081. [Google Scholar] [CrossRef]
  32. Ozkan, S.P.; Terhan, C. Detection of Flood Hazard in Urban Areas using GIS: Izmir Case. Procedia Technol. 2016, 22, 373–381. [Google Scholar] [CrossRef]
  33. Samela, C.; Albano, R.; Sole, A.; Manfreda, S. A GIS tool for cost-effective delineation of flood-prone areas. Comput. Environ. Urban Syst. 2018, 70, 43–52. [Google Scholar] [CrossRef]
  34. Silva, L.O.; Barbosa, K.V. Análise espacial da suscetibilidade à inundação na sub-bacia Muriaé 2, Campos dos Goytacazes (RJ). Rev. Ibero-Am. De Ciências Ambient. 2018, 9, 127–138. [Google Scholar] [CrossRef]
  35. Prama, M.; Omran, A.; Schroder, D.; Abouelmagd, A. Vulnerability assessment of flash floods in Wadi Dahab basin, Egypt. Environ. Earth Sci. 2020, 79, 1–17. [Google Scholar] [CrossRef]
  36. Mandel, L.H.; Bishop, B.W.; Orehek, A.M. A new decade of uses for geographic information systems (GIS) as a tool to research, measure and analyze library services. Libr. Hi Tech 2023, 41, 1022–1038. [Google Scholar] [CrossRef]
  37. Lima, A.C.C.; Faccioli, G.G.; Medeiros, F.C. Creation of a flood risk model for The Jacuípe River Basin (AL/PE) using the Analytical Hierarchical Process Method—AHP. Rev. De Gestão Soc. E Ambient. 2024, 18, 1–18. [Google Scholar] [CrossRef]
  38. Senouci, R.; Taibi, N.-E.; Teodoro, A.C.; Duarte, L.; Mansour, H.; Yahia Meddah, R. GIS-Based Expert Knowledge for Landslide Susceptibility Mapping (LSM): Case of Mostaganem Coast District, West of Algeria. Sustainability 2021, 13, 630. [Google Scholar] [CrossRef]
  39. Alarifi, S.S.; Abdelkareem, M.; Abdalla, F.; Alotaibi, M. Flash Flood Hazard Mapping Using Remote Sensing and GIS Techniques in Southwestern Saudi Arabia. Sustainability 2022, 14, 14145. [Google Scholar] [CrossRef]
  40. Zarghami, M.; Szidarovszky, F. Introduction to Multicriteria Decision Analysis. In Multicriteria Analysis; Springer: Berlin/Heidelberg, Germany, 2011. [Google Scholar] [CrossRef]
  41. Esmail, B.A.; Geneletti, D. Multi-criteria decision analysis for nature conservation: A review of 20 years of applications. Methods Ecol. Evol. 2018, 9, 42–53. [Google Scholar] [CrossRef]
  42. Zlaugotne, B.; Zihare, L.; Balode, L.; Kalnbalkite, A.; Khabdullin, A.; Blumberga, D. Multi-Criteria Decision Analysis Methods Comparison. Environ. Clim. Technol. 2020, 24, 454–471. [Google Scholar] [CrossRef]
  43. Gongora-Salazar, P.; Rocks, S.; Dphil, P.F.; Dphil, O.R.-A.; Tsiachristas, A. The Use of Multicriteria Decision Analysis to Support Decision Making in Healthcare: An Updated Systematic Literature Review. Value Health 2023, 26, 780–790. [Google Scholar] [CrossRef]
  44. Saaty, T.L. What is the Analytic Hierarchy Process? In Mathematical Models for Decision Support; Mitra, G., Greenberg, H.J., Lootsma, F.A., Rijkaert, M.J., Zimmermann, H.J., Eds.; NATO ASI Series; Springer: Berlin/Heidelberg, Germany, 1988; Volume 48. [Google Scholar] [CrossRef]
  45. Li, H.; Wang, Y.; Chen, W.; Li, H.; Tian, Y.; Chen, R. Adaptability Evaluation of Human Settlements in Chengdu Based on ArcGIS. Sustainability 2024, 16, 1989. [Google Scholar] [CrossRef]
  46. Kalisha, S.M.; Munthali, K.G. Multi-Factor GIS Modeling for Solid Waste Dumpsite Selection in Lilongwe, Malawi. Sustainability 2024, 16, 1202. [Google Scholar] [CrossRef]
  47. Fattoruso, G.; Toscano, D.; Venturo, A.; Scognamiglio, A.; Fabricino, M.; Di Francia, G. A Spatial Multicriteria Analysis for a Regional Assessment of Eligible Areas for Sustainable Agrivoltaic Systems in Italy. Sustainability 2024, 16, 911. [Google Scholar] [CrossRef]
  48. Swain, K.C.; Singha, C.; Nayak, L. Flood Susceptibility Mapping through the GIS-AHP Technique Using the Cloud. ISPRS Int. J. Geo Inf. 2020, 9, 720. [Google Scholar] [CrossRef]
  49. Nguyen, H.N.; Fukuda, H.; Nguyen, M.N. Assessment of the Susceptibility of Urban Flooding Using GIS with an Analytical Hierarchy Process in Hanoi, Vietnam. Sustainability 2024, 16, 3934. [Google Scholar] [CrossRef]
  50. Madzík, P.; Falát, L. State-of-the-art on analytic hierarchy process in the last 40 years: Literature review based on Latent Dirichlet Allocation topic modelling. PLoS ONE 2022, 17, e0268777. [Google Scholar] [CrossRef]
  51. Saaty, T.L. How to make a decision: The analytic hierarchy process. Eur. J. Oper. Res. 1990, 48, 9–26. [Google Scholar] [CrossRef]
  52. Robin, C.; Beck, C.; Armstrong, B.; Waite, T.D.; Rubin, G.J.; Oliver, I. Impact of flooding on health-related quality of life in England: Results from the National Study of Flooding and Health. Eur. J. Public Health 2020, 30, 942–948. [Google Scholar] [CrossRef]
  53. Santos, J.A.; Moreno, J.A.; Monteiro, J.B. Urban Flooding in Manaus, Northern Brazil: Extreme Events, Susceptibility, and Inequalities. In Urban Flooding in Brazil; Springer: Cham, Switzerland, 2023. [Google Scholar] [CrossRef]
  54. Pegado, R.S.; Blanco, C.J.C.; Roehrig, J.; Caroça, C.; Costa, F.S. Risco de Cheia e Vulnerabilidade: Uma Abordagem às Inundações Urbanas de Belém/Pará/ no Brasil. Territorium 2014, 21, 71–76. Available online: http://www.uc.pt/fluc/nicif/riscos/Territorium/numeros_publicados (accessed on 6 June 2025). [CrossRef]
  55. Teixeira, S.G.; Pacheco, A.A. Cartografia de Risco Geológico: Ananindeua, Pará. Fev-2023; Editor: SGB-CPRM. Available online: https://rigeo.cprm.gov.br/handle/doc/23504 (accessed on 6 June 2025).
  56. Campos, W.S.; Miranda, S.B.A.; Dias, G.F.M.; Costa, J.A. Uso da Ferramenta SIG Aplicado a Alagamentos: Estudo de Caso Na Cidade de Belém (PA). DELOS 2020, 13. Available online: https://ojs.revistadelos.com/ojs/index.php/delos/article/view/669 (accessed on 6 June 2025).
  57. Gutierrez, C.B.B.; Souza, E.B.; Gutierrez, D.M.G. Global/Regional Impacts on Present and Near-Future Climate Regimes in the Metropolitan Region of Belém, Eastern Amazon. Atmosphere 2022, 13, 1077. [Google Scholar] [CrossRef]
  58. Instituto Brasileiro de Geografia e Estatística (IBGE)—Cidades. Ananindeua. Available online: https://cidades.ibge.gov.br/brasil/pa/ananindeua/panorama (accessed on 14 May 2024).
  59. Secretaria Municipal de Planejamento (SEGEP). Anuário Belém. Tabela 21-Ranking dos 10 Maiores IDHM dos Municípios do Pará; 2020. Available online: https://anuario.belem.pa.gov.br/wp-content/uploads/2020/12/Tabela-21-Demografia.pdf (accessed on 16 April 2024).
  60. Companhia de Desenvolvimento Econômico do Pará (CODEC). Distritos Industriais do Estado do Pará. Available online: https://www.codec.pa.gov.br/publicacoes/distritosindustriais (accessed on 6 June 2023).
  61. Prefeitura Municipal de Ananindeua Geo (PMA-Geo). Ananindeua—Mapas. Available online: https://www.ananindeua.pa.gov.br/mapas/ (accessed on 6 September 2023).
  62. Weather Spark (WS). Clima e Condições Meteorológicas Médias em Ananindeua no ano Todo Brasil. Available online: https://pt.weatherspark.com/y/30138/Clima-caracter%C3%ADstico-em-Ananindeua-Brasil-durante-o-ano (accessed on 7 April 2023).
  63. Prefeitura Municipal de Ananindeua (PMA). O Município. Available online: https://cma.pa.gov.br/o-municipio/ (accessed on 7 April 2023).
  64. Ullah, N.; Tariq, A.; Qasim, S.; Panezai, S.; Uddin, M.G.; Abdullah-Al-Wadud, M.; Ullah, S. Geospatial analysis and AHP for flood risk mapping in Quetta, Pakistan: A tool for disaster management and mitigation. Appl Water Sci 2024, 14, 236. [Google Scholar] [CrossRef]
  65. Mohammed, Z.T.; Hussein, L.Y.; Abood, M.H. Potential Flood Hazard Mapping Based on GIS and Analytical Hierarchy Process. J. Water Manag. Model. 2014, 32, C528. [Google Scholar] [CrossRef]
  66. Ozturk, D.; Yilmaz, I.; Kirbas, U. Flood hazard assessment using AHP in Corum, Turkey. Tecnol. Y Cienc. Del Agua 2021, 12, 379–415. [Google Scholar] [CrossRef]
  67. Belazreg, N.E.H.; Hasbaia, M.; Sen, Z.; Ferhati, A. Flood risk mapping using multi-criteria analysis (MCA) through AHP method case of El-Ham wadi watershed of Hodna basin (Algeria). Nat. Hazards 2024, 120, 1023–1039. [Google Scholar] [CrossRef]
  68. Msabi, M.M.; Makonyo, M. Flood susceptibility mapping using GIS and multi-criteria decision analysis: A case of Dodoma region, central Tanzania. Remote Sens. Appl. Soc. Environ. 2021, 21, 100445. [Google Scholar] [CrossRef]
  69. Shekar, P.R.; Mathew, A. Chapter 7—Flood susceptibility mapping of the Peddavagu River Basin using GIS-AHP techniques. Dev. Environ. Sci. 2023, 14, 125–141. [Google Scholar] [CrossRef]
  70. Edamo, M.L.; Bushira, K.; Ukumo, T.Y. Flood susceptibility mapping in the Bilate catchment, Ethiopia. H2Open J. 2022, 5, 691–712. [Google Scholar] [CrossRef]
  71. Bokhari, B.F.; Bassam, T.; Baalousha, H.M. A analytical hierarchy process -GIS approach to flood susceptibility mapping in NEOM, Saudi Arabia. Front. Water 2024, 6, 1–14. [Google Scholar] [CrossRef]
  72. Sharir, K.; Lai, G.T.; Simon, N.; Ern, L.K.; Talip, M.A.; Roslee, R. Assessment of Flood Susceptibility Analysis Using Analytical Hierarchy Process (AHP) in Kota Belud Area, Sabah, Malaysia. IOP Conf. Ser. Earth Environ. Sci. 2022, 1103, 012005. [Google Scholar] [CrossRef]
  73. Khoeun, C.; Sok, T.; Chan, R.; Khe, S.; Ich, I.; Chan, K. Assessing Flood Hazard Index using Analytical Hierarchy Process (AHP) and Geographical Information System (GIS) in Stung Sen River Basin. IOP Conf. Ser. Earth Environ. Sci. 2022, 1091, 012031. [Google Scholar] [CrossRef]
  74. Seejata, K.; Yodying, A.; Wongthadam, T.; Mahavik, N.; Tantanee, S. Assessment of flood hazard areas using Analytical Hierarchy Process over the Lower Yom Basin, Sukhothai Province. Procedia Eng. 2018, 212, 340–347. [Google Scholar] [CrossRef]
  75. QGIS Development Team, (QGIS). Geographic Information System. Open source geospatial Foundation Project. 2015. Available online: http://qgis.osgeo.org (accessed on 1 June 2024).
  76. Funk, C.; Peterson, P.; Landsfeld, M.; Pedreros, D.; Verdin, J.; Shukla, S.; Husak, G.; Rowland, J.; Harrison, L.; Hoell, A.; et al. The climate hazards infrared precipitation with stations—A new environmental record for monitoring extremes. Sci. Data 2015, 2, 150066. [Google Scholar] [CrossRef]
  77. Hofstra, N.; Haylock, M.; New, M.; Jones, P.D. Testing E-OBS European high-resolution gridded data set of daily precipitation and surface temperature. J. Geophys. Res. 2009, 114, D21101. [Google Scholar] [CrossRef]
  78. Mantis, A.B.; Vaz, J.A. Mapeamento de áreas de risco de alagamento do município de Guarujá-SP utilizando método de análise hierárquica. Leopoldianum 2019, 45, 69–85. [Google Scholar] [CrossRef]
  79. Leal, F.C.B.S.; Barbosa, I.M.R.; Aquino, J.T. Mapeamento de áreas vulneráveis à inundação com o uso do SIG e da análise multicritério: O caso da bacia hidrográfica do rio UNA em Pernambuco. Rev. Gestão Sustentabilidade Ambient. 2020, 9, 20–40. [Google Scholar] [CrossRef]
  80. Kader, Z.; Islam, M.R.; Aziz, M.T.; Hossain, M.M.; Islam, M.R.; Miah, M.; Jaafar, W.Z.W. GIS and AHP-based flood susceptibility mapping: A case study of Bangladesh. Sustain. Water Resour. Manag. 2024, 10, 170. [Google Scholar] [CrossRef]
  81. Ashfaq, S.; Tufail, M.; Niaz, A.; Muhammad, S.; Alzahrani, H.; Tariq, A. Flood susceptibility assessment and mapping using GIS-based analytical hierarchy process and frequency ratio models. Glob. Planet. Change 2025, 251, 104831. [Google Scholar] [CrossRef]
  82. Pimenta, L.B.; Beltrão, N.E.S.; Oliveira, R.M.S.; Gomes, D.J.C. Multi-criteria Decision-Making methods to evaluate urban environmental quality: A scoping review. Concilium 2024, 24, 492–516. [Google Scholar] [CrossRef]
  83. Satty, T.L. A scaling method for priorities in hierarquical structures. J. Math. Psychol. 1977, 15, 234–281. [Google Scholar] [CrossRef]
  84. Magalhães, I.A.L.; Thiago, C.R.L.; Agrizzi, D.V.; Santos, A.R. Uso de Geotecnologias Para Mapeamento de Áreas de Risco de Inundação em Guaçui, ES: Uma Análise Comparativa Entre Dois Métodos. Cad. De Geociências 2011, 8, 63–70. Available online: https://periodicos.ufba.br/index.php/cadgeoc/article/view/5288 (accessed on 7 July 2024).
  85. Pereira, M.D.R.; Cristo, S.S.V. Análise da Susceptibilidade a Inundação na Bacia Hidrográfica do Córrego São João, Porto Nacional-TO. Rev. Interface. 2018, 16, pp. 82–96. Available online: https://sistemas.uft.edu.br/periodicos/index.php/interface/article/view/6523 (accessed on 6 May 2024).
  86. Dias, F.G.; Lima, A.M.M. Zoneamento hidroambiental da bacia hidrográfica do rio Acará, Amazônia Oriental. Cad. De Geogr. 2020, 30, 431–450. [Google Scholar] [CrossRef]
  87. Pimenta, L.B.; Beltrão, N.E.S.; Gemaque, A.M.S.; Tavares, P.A. Processo Analítico Hierárquico (AHP) em ambiente SIG: Temáticas e aplicações voltadas à tomada de decisão utilizando critérios espaciais. Interações 2019, 20, 407–420. [Google Scholar] [CrossRef]
  88. Castro, A.C.V.; Alvim, A.T.B. Sustainable Urbanization in Valley-Bottom Areas in Urban Settings: The Case of the Jaguaré Stream Basin, São Paulo, Brazil. Sustainability 2024, 16, 3018. [Google Scholar] [CrossRef]
  89. Lustosa, K.; Júnior, F.L.; Oliveira, H. The use of permeable asphalt for the benefit of drainage systems in urban areas - A literature review. ITEGAM-JETIA 2023, 9, 18–24. [Google Scholar] [CrossRef]
  90. Pezente, M.F.M. Relação entre urbanização e rios: Um Estudo da Cidade de Francisco Beltrão (PR). Repositório Institucional da UFSC. Dissertação. 2018. Available online: https://repositorio.ufsc.br/handle/123456789/198544 (accessed on 7 April 2025).
  91. Caroletti, G.N.; Coscarelli, R.; Caloiero, T. Validation of satellite, reanalysis and RCM data of Monthly rainfall in Calabria (Southern Italy). Remote Sens. 2019, 11, 1625. [Google Scholar] [CrossRef]
  92. Kim, S.; Lee, J.; Jeon, S.; Lee, M.; An, H.; Jung, K.; Kim, S.; Park, D. Correlation analysis between hydrologic flow metrics and Benthic Macroinvertebrates Index (BMI) in the Han River basin, South Korea. Sustainability 2021, 13, 11477. [Google Scholar] [CrossRef]
  93. Krakauer, N.Y.; Pradhanang, S.M.; Lakhankar, T.; Jha, A.K. Evaluating satellite products for precipitation estimation in mountain regions: A case study for Nepal. Remote Sens. 2013, 5, 4107–4123. [Google Scholar] [CrossRef]
  94. Lufi, S.; Ery, S.; Rispiningtati, R. Hydrological analysis of TRMM (Tropical Rainfall Measuring Mission) Data in Lesti Sub Watershed. Civ. Environ. Sci. J. 2020, 3, 18–30. [Google Scholar] [CrossRef]
  95. Lin, F.; Chen, X.; Yao, H. Evaluating the Use of Nash-Sutcliffe Efficiency Coefficient in Goodness-of-Fit Measures for Daily Runoff Simulation with SWAT. J. Hydrol. Eng. 2017, 22, 05017023. [Google Scholar] [CrossRef]
  96. Perreault, S.; Alem, A.E.; Chokmani, K.; Cambouris, A.N. Development to pedotransfer functions to predict soil physical properties in Southern Quebec (Canada). Agronomy 2022, 12, 526. [Google Scholar] [CrossRef]
  97. França, L.C.D.J.; Lopes, L.F.; Morais, M.S.D.; Lisboa, G.D.S.; Rocha, S.J.S.S.D.; Morais Junior, V.T.M.D.; Santana, R.C.; Mucida, D.P. Environmental Fragility Zoning Using GIS and AHP Modeling: Perspectives for the Conservation of Natural Ecosystems in Brazil. Conservation 2022, 2, 349–366. [Google Scholar] [CrossRef]
  98. Gomes, D.J.C.; Beltrão, N.E.S.; Lima, A.M.M. Influence of climatic phenomena and deforestation on hydroenvironmental fragility, Gurupi River watershed, Northern Brazil. Rev. Bras. De Ciências Ambient. 2023, 58, 375–385. [Google Scholar] [CrossRef]
  99. Moraes, R.B.F. Development of the Urban Hydrological Disasters Susceptibility Index. Doctorate Thesis, Universidade Federal de Mato Grosso do Sul, UFMS, Campo Grande, Brasil, 2023. Available online: https://repositorio.ufms.br/handle/123456789/6487 (accessed on 7 July 2025).
  100. Muttil, N.; Nasrin, T.; Sharma, A.K. Impacts of Extreme Rainfalls on Sewer Overflows and WSUD-Based Mitigation Strategies: A Review. Water 2023, 15, 429. [Google Scholar] [CrossRef]
  101. Leite, M.E.; Dias, F.T.; Almeida, J.W.L.; Santos-Neto, N.F. Land use and environmental impacts: Flood model in a medium-sized Brazilian city as a tool for urban sustainability. Environ. Sci. Policy 2024, 151, 103613. [Google Scholar] [CrossRef]
  102. Rözer, V.; Mehryar, S.; Surminski, S. From managing risk to increasing resilience: A review on the development of urban flood resilience, its assessment and the implications for decision making. Environ. Res. Lett. 2022, 17, 123006. [Google Scholar] [CrossRef]
  103. Waseem, M.; Ahmad, S.; Ahmad, I.; Wahab, H.; Leta, M.K. Urban flood risk assessment using AHP and geospatial techniques in Swat Pakisan. SN Appl. Sci. 2023, 5, 215. [Google Scholar] [CrossRef]
  104. Saaty, R.W. The analytic hierarchy process—What it is and how it is used. Math. Model. 1987, 9, 161–176. [Google Scholar] [CrossRef]
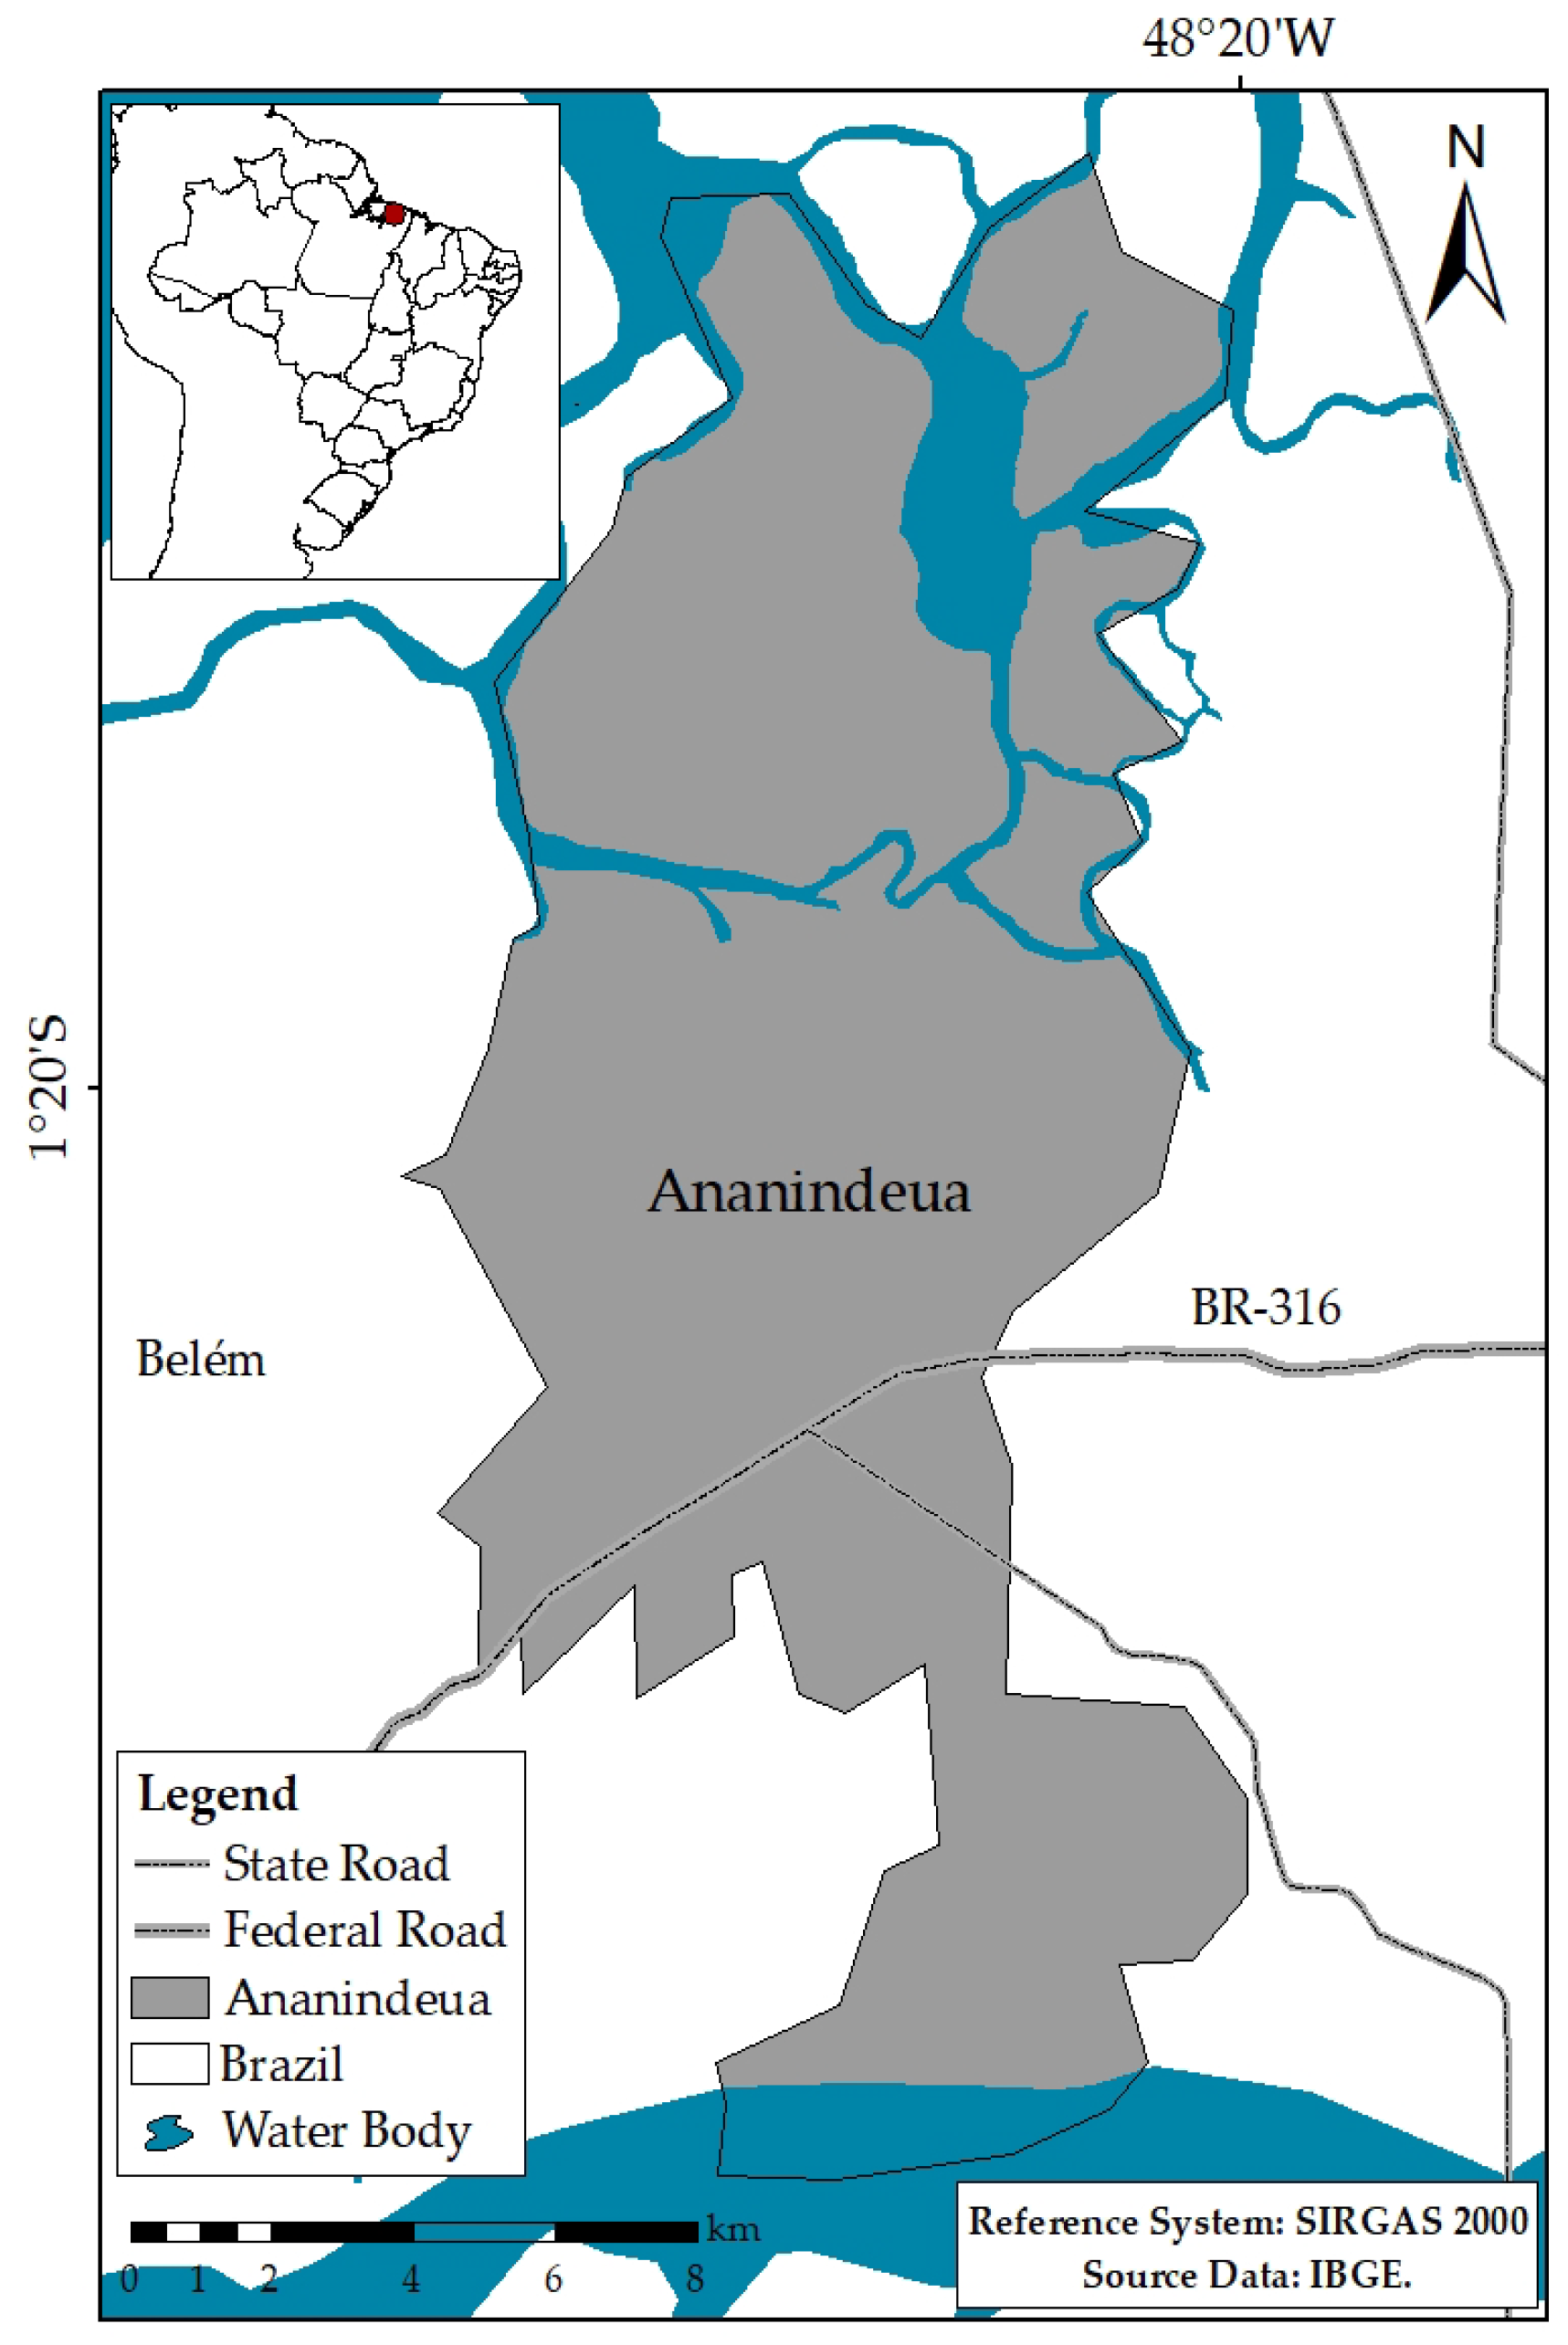
Figure 1. Location of the study area.
Land 14 01543 g001
Figure 2. Information layers utilized in the map algebra analysis. (a) rainfall; (b) LULC; (c) slope; (d) soils; and (e) drainage density (km.km−2).
Land 14 01543 g002
Figure 3. Flowchart of the Flood Susceptibility Assessment Methodology.
Land 14 01543 g003
Figure 4. Graphical summary of AHP-derived weights for flood susceptibility criteria.
Land 14 01543 g004
Figure 5. Susceptibility to flood events. Information layers utilized in the map algebra analysis. (a) rainfall; (b) LULC; (c) soils; (d) slope; and (e) drainage density (km.km−2).
Land 14 01543 g005
Figure 6. Susceptibility map of Ananindeua municipality.
Land 14 01543 g006
Table 1. Comparative overview of selected flood susceptibility studies using AHP and related approaches.
ParametersCriteria NumberMethodsStudy AreasReferences
TWI, elevation, slope, LULC, rainfall, stream distance, DD, and soil type.8AHP and GISQuetta city, Pakistan (urban)[64]
TWI, NDVI, elevation, slope, LULC, rainfall, DD, distance from the road, and distance from river.9AHP, GIS, and Remote SensingDiyala city, Iraq (Urban)[65]
Rainfall, distance to rivers, slope, elevation, LULC, rocks, and watershed size.7AHP and GISCorum city, Turkey (Urban)[66]
Rainfall, DD, slope, elevation, LULC, and soil type.6AHP and GISEl-Ham, Algeria (Watershed)[67]
Rainfall, DD, flow accumulation, slope, elevation, LULC, rocks, and soil type.8AHP and GISDodoma city, Tanzania (Urban)[68]
TWI, elevation, slope, LULC, rainfall, distance to river, and DD.7AHP, GIS, and Remote SensingPeddavagu, India (Watershed)[69]
LULC, TWI, STI, elevation, slope, rainfall, distance to river, and DD.8AHP and GISBilate, Ethiopia (Watershed)[70]
LULC, TWI, NDVI, elevation, slope, soil type, rainfall, distance to river, and DD.9FAHP and GISNeom, Saudi Arabia (Watershed)[71]
DD, slope elevation, soil type, LULC, TWI.6AHP and GISKota Belud city, Malaysia (Urban)[72]
Slope, elevation, soil type, LULC flow accumulation, DD, and rainfall.7FHI, AHP and GISStung Sen, Cambodia (Watershed)[73]
Rainfall, slope, elevation, river density, LULC, and soil permeability.6AHP and GISYom, Thailand(Watershed)[74]
AHP (Analytic Hierarchy Process); DD (drainage density); FAHP (Fuzzy Analytic Hierarchy Process); FHI (Flood Hazard Index); GIS (Geographic Information System); LULC (land use land cover) NDVI (Normalized Difference Vegetation Index); TWI (Topographic Wetness Index); and STI (Sediment Transport Index).
Table 2. Geodatabase: criteria, sources, spatial resolution (SR), and reference year.
CriteriaSourcesSRYear
Rainfall (mm)Spatial distribution–Climate Hazards Group InfraRed Precipitation with Stations (CHIRPS) data set: https://www.chc.ucsb.edu/data/chirps (accessed on 14 May 2024)0.05°2022
LULCMapBiomas Project is available through Google Earth Engine from the website https://mapbiomas.org/ (accessed on 14 May 2024)30 m2023
SlopeAlos Palsar (ASF): https://asf.alaska.edu/datasets/daac/alos-palsar/ (accessed on 14 May 2024)12.5 m2020
SoilsObtained from: https://geoinfo.dados.embrapa.br/catalogue/#/dataset/2350 (accessed on 14 May 2024)30 m2020
Drainage Density (km.km−2)Based on the delimitations of rivers acquired from Agência Nacional de Águas e Saneamento Básico (ANA)30 m2020
Table 3. Saaty’s relative scale is used for a paired comparison.
Importance RelativeDegree of Importance
Equal1
MoreFew3
Very5
Quite7
Extremely9
LessFew1/3
Very1/5
Quite1/7
Extremely1/9
Source: Adapted from [51,87].
Table 4. Comparison matrix.
Rainfall (mm/month)LULCSlope(°)SoilsDrainage Density (km.km−2)SumWeights
Rainfall (mm/month)15330.3319.000.44
LULC0.21550.214.200.28
Slope (°)0.330.2130.142.060.05
Soils0.330.20.3310.144.730.08
Drainage Density (km.km−2)357717.660.15
Total4.8611.416.33191.8147.651.00
Table 5. Classifications, weights, and descriptions of susceptibility.
ClassWeightsDescription
Low1Potential flood formation resistance
Medium2Moderate potential of some geoenvironmental variables that favor flood formation
High3Potential unstable areas extremely sensitive to the action of geoenvironmental factors that contribute to the flood
Source: Adapted from [89].
Table 6. Respective criteria and classification adopted for flood susceptibility.
LowMediumHigh
Rainfall (mm/month)<170171 > 250251<
LULCNatural area-Urban zone
Slope (°)<88 > 1717<
Soils-GleisoilWater, Latosoil
Drainage Density (km.km−2)<1010 > 2020<
Source: Adapted from [79].
Table 7. Classification of Nash–Sutcliffe efficiency coefficient index values.
NSInterpretation
≤0Unacceptable
0.0 ≤ 0.40Weak
0.41 ≤ 0.60Moderate
0.60 ≤ 0.80Good
0.81 ≤ 1.0Excellent
Source: Adapted from [95,96].
Table 8. Criteria, classes, and areas of susceptibility to flood events.
LowMediumHigh
Rainfall (mm/month)04.0 km2184.8 km2
LULC44.4 km20.1 km2140.1 km2
Soils0105.1 km279.7 km2
Slope (°)00.1 km2184.7 km2
Drainage Density (km.km−2)18.5 km255.3 km2110.9 km2
Disclaimer/Publisher’s Note: The statements, opinions and data contained in all publications are solely those of the individual author(s) and contributor(s) and not of MDPI and/or the editor(s). MDPI and/or the editor(s) disclaim responsibility for any injury to people or property resulting from any ideas, methods, instructions or products referred to in the content.