Abstract
This study investigates the spatio-temporal dynamics of Climate Potential Productivity (CPP) in Central Africa during 1901–2019 using the Thornthwaite Memorial model coupled with Mann–Kendall tests based on high spatial and temporal resolution data. The results demonstrate the climate–vegetation interactions under global warming: (1) Central Africa exhibited a statistically significant warming trend (r2 = 0.33, p < 0.01) coupled with non-significant rainfall reduction, suggesting an emerging warm–dry climate regime that parallels meteorological trends observed in North Africa. (2) Central Africa exhibited an overall increasing trend in CPP, with temporal fluctuations closely aligned with precipitation variability. Specifically, the CPP in Central Africa has undergone three distinct phases: an increasing phase (1901–1960), a decreasing phase (1960–1980), and a slow recovery phase (1980–2019). The multiple intersection points between the UF and UB curves indicate that Central Africa’s CPP has been significantly affected by climate change under global warming. (3) The correlation of CPP–Temperature was mainly positive, mainly distributed in the Lower Guinea Plateau and the northern part of the Congo Basin (r2 = 0.26, p < 0.1). The relationship of CPP–Precipitation showed predominantly a very strong positive correlation (r2 = 0.91, p < 0.01).
1. Introduction
Climate change poses environmental challenges to humanity, with far-reaching consequences for ecosystems and livelihoods, particularly in agriculture-dependent regions [1,2,3]. Its effects on food security, encompassing availability, access, and stability, are already evident worldwide [1,2,3]. Studies have examined climate-induced risks to crop production across diverse contexts, including South Africa [4], Nigeria [5], Rwanda [6], Canada [7,8], China [9,10], and other regions [11,12].
The IPCC (2014) highlights that agricultural systems with limited adaptive capacity, such as those in Sub-Saharan Africa, will face disproportionate adversity under climate change [13]. This vulnerability stems from heavy reliance on rain-fed agriculture, with heightened sensitivity to climatic variables like temperature fluctuations and erratic rainfall [13]. Projected impacts include reduced yields due to heat stress, droughts, floods, and shifting precipitation patterns [14,15,16]. However, uncertainties persist regarding the magnitude of these effects, and actionable insights for region-specific cropping systems remain scarce [17,18]. Agroecological conditions fundamentally shape a region’s agricultural potential and carrying capacity. Understanding these dynamics is fundamental for the optimization of resource management and the promotion of sustainable production to meet future demands [19]. Given Africa’s acute exposure to climate threats, research on crop production resilience is indispensable to safeguarding the continent’s food security.
Africa has seen a drop in precipitation levels since the latter half of the 19th century [20]. This implies that agricultural policymakers need to act to reduce the risk of unforeseen droughts in Africa’s agricultural sector [21]. This, together with irrational human economic activities, will significantly affect the production and livelihoods of local farmers and herders, as well as the sustainable development of the whole region. The dual challenges of ensuring a secure food supply and maintaining sustainable agriculture in Central Africa have been complicated by climate change. As one of the most ecologically fragile areas in the world, the question of how to respond to climate change while achieving the rational use of agricultural resources and sustainable development has become a pressing issue for Central Africa.
Climate potential productivity (CPP) refers to the maximum biological yield that plants can obtain per unit area of land when climate resources such as temperature and precipitation are fully utilized [22,23,24]. This metric is intentionally designed to reflect an idealized biophysical ceiling, not actual attainable yields, which are inevitably constrained by extreme events, soil limitations, and management practices. Analyzing CPP not only helps assess vegetation production capacity but also provides insights into future agricultural trends under climate change, making it essential for sustainable resource planning [25,26]. Central Africa, spanning the equator (Figure 1), relies heavily on agriculture, with limited economic diversification and a high dependence on agro-exports [27]. The region’s agroecosystem sustains livelihoods for a predominantly farming population, yet faces escalating environmental threats, including soil erosion, deforestation, desertification, and water pollution [27]. These challenges, compounded by climate change, undermine efforts to balance agricultural productivity with natural resource conservation [28]. Understanding the spatiotemporal dynamics of CPP in Central Africa can thus contribute to guiding climate adaptation strategies, enhancing agricultural and forestry output, and supporting ecological and socio-economic development across the region.
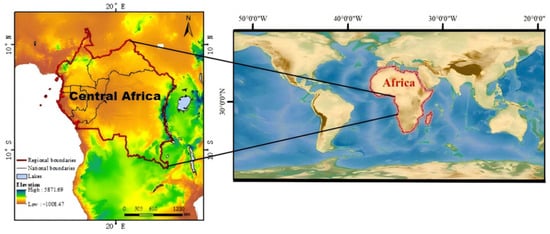
Figure 1.
Research area.
Previous studies have examined Africa’s CPP from diverse perspectives [29,30,31,32,33,34,35,36,37,38]. Lieth [29] established the Miami model to investigate the relationship between productivity and vegetation cover characteristics, as well as environmental factors affecting agricultural potential and cultural development. Schulze et al. [30] demonstrated southern Africa’s CPP dependence on rainfall variability using the Lund–Potsdam–Jena (LPJ) dynamic vegetation model. Barrios et al. [31] identified precipitation–temperature-based CPP as the dominant constraint in sub-Saharan Africa (SSA), linking post-1960s climate change to SSA’s agricultural productivity gap. Müller et al. [14], Roudier et al. [32], Knox et al. [17], and Sultan [33] also investigated the impacts of climate change on CPP in Africa, and verified that climate change has had a negative impact on the productivity of major crops in Africa. Zhao et al. [35] applied the Global Agro-Ecological Zones (GAEZ) framework to show Central Africa’s declining CPP (1981–2015), while Li et al. [36] and Ren et al. [37] implemented the Thornthwaite Memorial model for Chinese provinces, revealing its utility in capturing hydrothermal constraints.
The current methodologies for estimating CPP can be categorized into three distinct approaches, each demonstrating unique characteristics when applied to Central African studies: Empirical models (e.g., Thornthwaite Memorial model, Miami model) offer the advantage of minimal data requirements, making them particularly suitable for long-term trend analysis [36,37], although their neglect of radiation and CO2 effects may compromise estimation accuracy [31]; process-based models (e.g., LPJ, GAEZ) mechanistically link climatic factors to photosynthetic processes [30,35], yet their computational complexity and extensive parameter calibration requirements present significant challenges [14]; and remote sensing approaches (e.g., light-use efficiency models) provide high spatiotemporal resolution data, but are constrained by limited temporal coverage and sensor dependency.
The selection of the Thornthwaite–Mann–Kendall integrated framework in this study was predicated on three principal considerations: (1) its parsimonious nature is particularly well-suited to data-scarce regions like Central Africa; (2) methodological consistency facilitates robust century-scale analysis (1901–2019); (3) and its hydrothermal focus aligns precisely with Central Africa’s dominant climatic constraints [31,35]. Through systematic examination of 119-year CPP trends in Central Africa, this research will not only contribute to macro-scale regional studies of Central Africa, but also achieve methodological synergy by bridging empirical and process-based modeling paradigms, thereby providing references for agricultural potential assessment in climate-sensitive zones.
In our prior research [38], we quantified North Africa’s CPP and investigated its variation mechanisms using the Thornthwaite Memorial model with Mann–Kendall tests [38]. While this established methodology proved effective for North Africa, its application to Central Africa remains important for several reasons, which are outlined below.
First, Central Africa’s equatorial climate regime, characterized by low seasonal temperature variability but high rainfall predictability, differs fundamentally from North Africa’s arid and semi-arid conditions. This unique climatic setting creates distinct CPP dynamics: high baseline precipitation coupled with rising temperatures may amplify evapotranspiration (ET) losses, disproportionately affecting productivity despite water abundance. Unlike in water-limited North Africa, where rainfall primarily constrains CPP, Central Africa’s productivity may hinge on temperature-driven ET modulation and cloud cover-mediated radiation changes. Second, Central Africa’s ecological sensitivity extends beyond climate. Its nutrient-poor, highly weathered soils exhibit lower buffering capacity against climatic fluctuations compared to North Africa’s more mineral-rich arid soils. This makes the CPP in the region particularly vulnerable to compounding stressors, even if absolute climatic changes appear moderate. Third, as Africa’s most vulnerable region to short-term climate variability, such as intensified dry spells during rainy seasons, and long-term shifts, Central Africa’s food security situation demands separate investigation. Our approach enables direct North–Central comparisons while controlling for methodology, revealing how similar climatic trends may produce divergent impacts across aridity gradients. Finally, the 1901–2019 study period captures century-scale climate–vegetation feedback specific to tropical ecosystems, such as delayed forest–savanna transitions or gradual soil carbon depletion. These processes are irrelevant to North Africa but critical for Central Africa’s CPP sustainability.
Building on our previous work [38], this study applied the Thornthwaite Memorial model with Mann–Kendall tests using Central Africa’s meteorological data (1901–2019) to (1) assess climate change impacts through annual temperature and precipitation trends; (2) evaluate spatio-temporal patterns of CPP; and (3) identify agricultural suitability and key production constraints. By employing this similar approach to examine CPP variations, our comparative analysis yields strategies for region agricultural optimization. This research can facilitate climate-resource utilization, crop layout optimization, and risk mitigation, contributing directly to food security and agricultural resilience in Central Africa.
2. Materials and Methods
2.1. Study Area
The study area includes countries Cameroon, Central African Republic, Equatorial Guinea, Gabon, the Republic of the Congo, the Democratic Republic of the Congo, and São Tomé and Príncipe (Figure 1).
2.2. Data Sources and Preprocessing
African national boundary vector data were obtained from the Natural Earth world regions map (https://www.naturalearthdata.com/features/, accessed on 21 August 2024). Climate data were derived from CRU TS v. 4.04 (Climatic Research Unit Time-Series, https://www.uea.ac.uk/web/groups-and-centres/climatic-research-unit/data, accessed on 21 August 2024), a widely used global dataset with 0.5° × 0.5° spatial resolution. The dataset includes monthly near-surface observations of temperature, precipitation, humidity, frost days, cloud cover, and potential evapotranspiration (ET). This study utilized 1901–2019 temperature and precipitation data for Central Africa. To ensure robustness, this paper performed the following preprocessing steps:
- (1)
- Missing Data HandlingCRU TS v.4.04 employs spatial interpolation to fill missing station data, as described in Harris et al. [39]. This paper further excluded grids with >20% missing values in the study period to minimize uncertainty.
- (2)
- Bias CorrectionCRU precipitation estimates in humid tropical zones are known to exhibit slight underestimation due to sparse gauge networks [40]. This paper applied a regional correction factor (+5%) to annual precipitation where station density was <1 per 50,000 km2 [41].
- (3)
- Reprojection and Spatial AggregationOriginal 0.5° grids were reprojected to an equal-area projection, Mollweide, before zonal statistics to minimize area distortion in Africa’s low latitudes. Monthly NetCDF files were batch-converted to GeoTIFF in MATLAB 2022b, then masked with African boundaries in ArcMap ModelBuilder. In the Model Builder of ArcMap, this study performed batch clipping, averaging, and summing of raster images to obtain the raster data of mean annual temperature and precipitation in the Central African region.
- (4)
- CPP CalculationZero-precipitation grids were set to 0.01 mm to avoid computational errors in the Thornthwaite model. Annual CPP was computed in MATLAB 2022b using reprojected, bias-corrected temperature and precipitation inputs.
- (5)
- Temporal and Spatial AnalysisTo analyze both spatial and temporal patterns of climate variables across Central Africa, this study first extracted mean annual temperature and precipitation from the reprojected rasters. These spatial trend analyses were complemented by a comprehensive time-series examination, according to which this study applied zonal statistics to derive key climatic indicators, including annual means, maxima, and minima, for each subregion over the 1901–2019 study period. This dual analytical approach enabled us to simultaneously capture the geographical distribution of climate parameters and their long-term temporal variations across Central Africa.
2.3. Methodology
The technology roadmap for the analysis is shown in Figure 2.
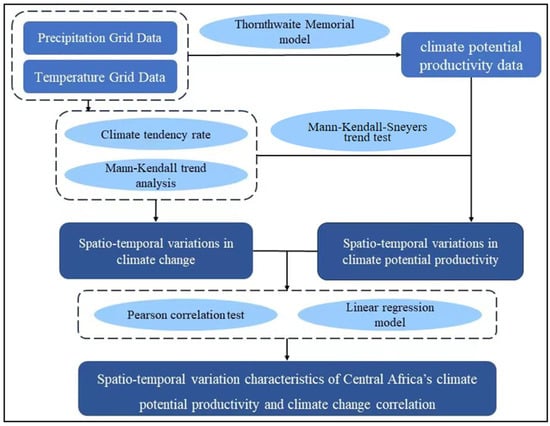
Figure 2.
Technical route.
2.3.1. Climate Tendency Rate
The annual climate elements regression model was constructed as follows:
where X refers to the climate tendency rate, is the regression constant, t is the time series, and is the change rate of climate element tendency [38].
2.3.2. Thornthwaite Memorial Model
Instead of using a single factor, the widely used Thornthwaite Memorial model incorporates both temperature and precipitation into its calculations, to assess CPP. It has a small deviation and involves fewer parameters, and is widely used in large-scale CPP change studies [29,30,31]. The relevant formulas are as follows [38,42]:
where the unit of CPP is , is the average annual ET (mm), is the average annual evaporation (mm), and e is the base of natural logarithms. T is average annual temperature (°C), and P is the average annual precipitation (mm) [38].
2.3.3. Mann–Kendall Trend Test
Hydrometeorological studies commonly utilize the Mann–Kendall (MK) trend test to analyze temporal patterns in climate and water resource data [43,44,45]. Supposing there is a time series of n sample sizes (), for all k, , and , the distributions of and are different, and the test statistic S was calculated with the following equations [43,44,45]:
If or 2.58, this indicates a significant increasing or decreasing trend at confidence levels of 95% and 99%, respectively.
2.3.4. Mann–Kendall–Sneyers Trend Test
This approach can be adopted to detect the non-random character of a time series X = {X1, X2, X3…XN} [43,44], where n is the total number of years under observation. (i = 1, 2, …, N) represents the total number of elements. precedes (j < i), where < . Based on , the test statistic Sk derives the cumulative for each year, as shown in Equation (8) [43,44].
Mean value and variance of can be derived by
The test statistic UFk and UBk was defined as
When the values of are significant, the existence of an increasing or a decreasing trend of same series will be indicated. For a significance level of , this study used the standard normal critical value of ±1.96, as established in Sneyers (1990) [42], for non-parametric trend analysis. To account for potential serial correlation in the climatic time series, we applied pre-whitening following the method of Yue et al. [45] prior to trend detection. The graphical approach plots all UFk and UBk values along the time axis, with trend timing identified by the intersection point of the forward (UFk) and backward (UBk) curves. A valid trend transition is only considered when this intersection occurs within the 95% confidence bounds (between −1.96 and +1.96) and persists beyond the crossing point [43].
In addition, according to the Pearson correlation analysis, Figure 3 was mapped to reveal the division of correlation degree.
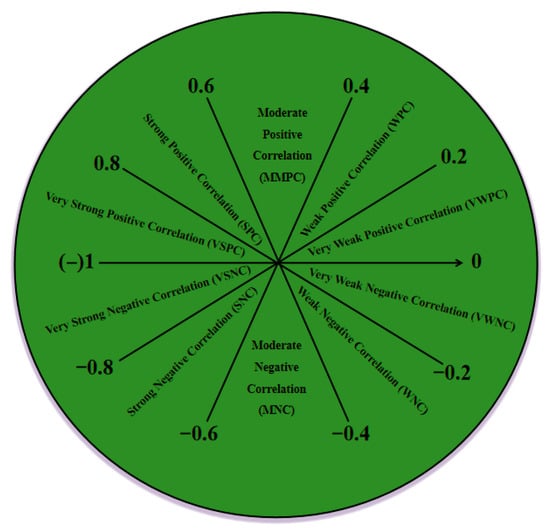
Figure 3.
Degree of Pearson correlation.
3. Results
3.1. Spatio-Temporal Climate Patterns
The mean annual temperature and annual maximum temperature exhibited an increasing trend during 1901–1940, followed by a decline between 1940 and 1970, before gradually rising thereafter. In contrast, the annual minimum temperature showed a decreasing trend from 1901 to 1940 but shifted to an upward trend after 1940 (Figure 4a–c). In general, temperatures across Central Africa demonstrated a long-term increasing trend with periodic variability (r2 = 0.33, p < 0.01). The region exhibited persistent warming from 1901, with decadal trends of +0.04 °C (mean), +0.05 °C (maximum), and +0.07 °C (minimum temperatures). The warming of Central Africa is evident in terms of climate tendency rates and increases.
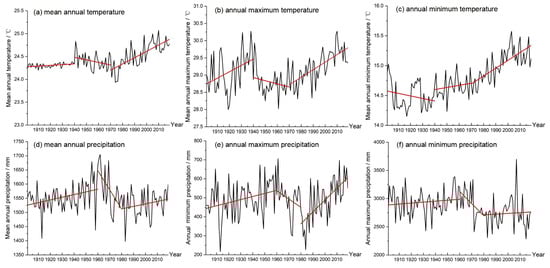
Figure 4.
Variations in temperature (a–c) and precipitation (d–f) in Central Africa.
The mean annual precipitation, annual maximum precipitation, and annual minimum precipitation exhibited an increasing trend during the period 1901–1960, followed by a decline between 1960 and 1980, and demonstrated an upward trend thereafter (Figure 4d–f). However, both the mean annual precipitation and annual maximum precipitation generally exhibited a fluctuating downward trend, while the annual minimum precipitation showed an overall increasing trend. The mean annual and maximum precipitation in Central Africa have been decreasing at a rate of 1.2 mm/10a and 21.2 mm/10a, respectively, while the annual minimum precipitation has been increasing at a rate of 3.6 mm/10a. Precipitation is decreasing in the Central African region, with the annual maximum precipitation decreasing particularly significantly.
Central Africa’s mean annual temperature since 1901 has been 24.2 °C. As shown in Figure 5 and Table 1 and Table 2, temperatures in the range of 20–25 °C were the most prevalent, covering 73% of the region. Accounting for 25.5% of Central Africa’s surface area, the 25 °C+ temperature range represented the second most extensive thermal regime, with its distribution centered on the Congo Basin. Furthermore, all areas exhibited an extremely significant upward trend in annual temperature.
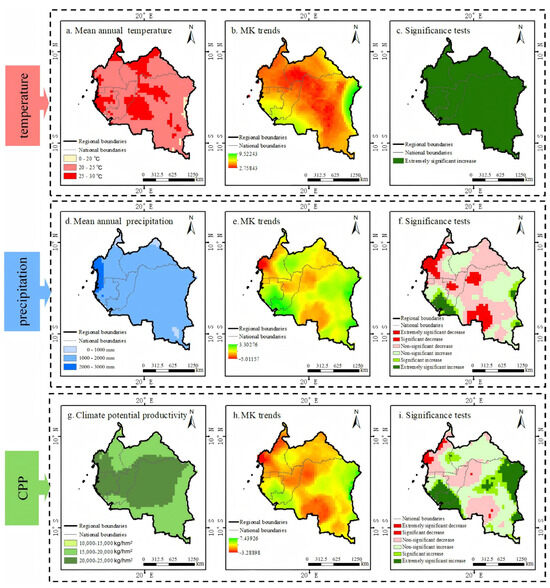
Figure 5.
Temperature (a–c), precipitation (d–f), and CPP (g–i), with MK trends and significance tests.

Table 1.
Central Africa’s mean annual temperature, mean annual precipitation, and CPP (1901–2019).
Table 2.
Significance of trends in mean annual temperature, mean annual precipitation, and CPP (1901–2019).
Central Africa’s mean annual precipitation was 1549.6 mm, predominantly concentrated within the 1000–2000 mm range, which accounts for 93.4% of Central Africa. Of the areas showing declining precipitation trends, 59.3% were located in the Congo Basin. Overall, 76.9% of Central Africa exhibited no statistically significant trends in mean annual precipitation.
3.2. Spatio-Temporal Patterns of CPP in Central Africa
Linear regression analysis reveals an overall increasing trend in Central Africa’s CPP (9.4 ) during 1901–2019 (Figure 6a). The temporal pattern shows three distinct phases: an upward trend (1901–1960), followed by decline (1960–1980), and subsequent slow recovery (1980–2019). The maximum CPP was 20,282.4 in 1969 and the minimum was 19,067.5 in 1913. The intersection of the UF and UB curves (Figure 6b) reveals a climate change-induced shift in CPP under global warming. Significance testing (95% confidence level) identifies 2006 as a change point, with data showing significant trends before but not after this year, which means the CPP of Central Africa underwent a sudden change in 2006.
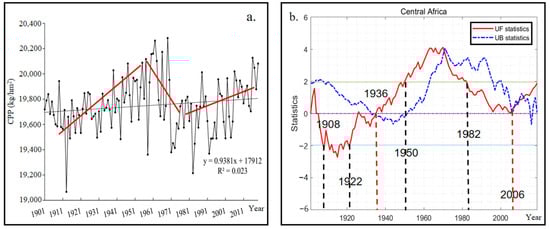
Figure 6.
Variations in CPP (a) and Mann–Kendall–Sneyers trend test for CPP (b) in Central Africa.
The analysis shows three distinct phases:
- Pre-1936: Declining CPP (UF < 0), particularly significant during 1908–1922;
- Period of 1936–2006: Increasing CPP (UF > 0), with significant rise during 1950–1982;
- Post-2006: Non-significant trends.
The change points in Figure 6a reflect CPP trend transitions, whereas Figure 6b marks years with extreme anomalies. These are complementary but non-overlapping analyses, as abrupt events (Figure 6b) do not always alter long-term trends (Figure 6a).
The mean annual CPP of Central Africa during 1901–2019 was 19,751.2 . As shown in Table 1 and Table 2 and Figure 5g–i, the CPP was mostly concentrated in the area above 15,000 , accounting for 99.4% of the area of Central Africa. The area above 20,000 accounted for 51.4% of Central Africa, which was mainly distributed in the Guinea Plateau and the Congo Basin (r2 = 0.91, p < 0.01). In total, 71.1% of the area of Central Africa showed an increasing trend for CPP, of which 18.7% was extremely significant increase, mainly distributed in the Guinea Plateau and the vicinity of the Great Rift Valley of East Africa (r2 = 0.89, p < 0.01). The overall trend showed predominantly non-significant changes, accounting for 68.3% of the area of Central Africa, with non-significant increases dominating.
3.3. Impacts of Climate Change on Central Africa’s CPP
The spatial analysis reveals distinct CPP–Temperature and CPP–Precipitation relationships across Central Africa (Table 3, Figure 7). Positive CPP–Temperature correlations predominated, covering 82.8% of Central Africa, particularly in the Lower Guinea Plateau and northern Congo Basin (r2 = 0.26, p < 0.1). There was a significant correlation between CPP and precipitation in Central Africa, expressed as VSPC, covering 99.6% of the Central African region (r2 = 0.91, p < 0.01).
Table 3.
Correlation of CPP–Temperature and CPP–Precipitation.
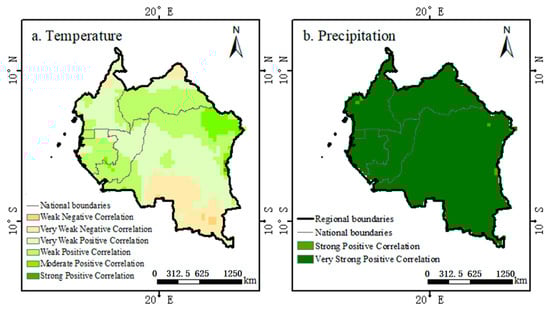
Figure 7.
Geographic distribution of correlation of CPP–Temperature (a) and CPP–Precipitation (b).
4. Discussion
This research explored the spatial and temporal distribution of climate and CPP in Central Africa, based on the Thornthwaite Memorial model. The results demonstrate that global warming has significantly altered CPP, aligning with the existing literature highlighting temperature and precipitation as critical long-term determinants of agricultural productivity. Central Africa exhibited a statistically significant warming trend accompanied by marginally decreasing precipitation, indicating progression toward warmer and drier conditions—a pattern consistent with observed climate shifts in North Africa [38]. North Africa is predominantly subtropical, while Central Africa is equatorial. The presence of similar trends despite different latitudes makes this correspondence particularly noteworthy and may indicate a stronger signal of global warming overriding local climatic differences. It is worth investigating whether this temporal synchronization extends to other climatic variables and ecological impacts across these regions.
Contrary to North Africa [38], linear regression analysis reveals an overall increasing trend in Central Africa’s CPP during 1901–2019 (Slope = 0.94, R2 = 0.02). The divergent CPP trends between North Africa and Central Africa can probably be attributed to their contrasting climatic regimes and ecosystem sensitivities. North Africa, characterized by arid and semi-arid conditions, is highly vulnerable to even marginal reductions in precipitation, as water availability has become the primary limitation for vegetation growth. Rising temperatures exacerbate ET, further straining already water-stressed ecosystems, thereby suppressing CPP. In contrast, Central Africa’s equatorial climate features abundant rainfall and higher baseline humidity, which mitigates moisture limitations. Here, moderate warming enhances photosynthetic activity and extends growing seasons, particularly in cooler highland areas, leading to increased CPP. Additionally, elevated atmospheric CO2 concentrations may benefit Central Africa’s dense vegetation more significantly due to greater water-use efficiency, whereas North Africa’s arid ecosystems are too moisture-constrained to capitalize on this effect. These regional differences highlight how the same global climate drivers, namely warming and rising CO2 concentrations, can have opposing effects on productivity depending on local environmental thresholds. Despite declining precipitation patterns across Africa, the observed long-term increase in CPP suggests that temperature-mediated effects, such as extended growing seasons and enhanced photosynthetic efficiency within optimal temperature ranges, may outweigh the negative impacts of reduced rainfall on CPP.
While our results demonstrate a strong positive correlation between CPP and precipitation in Central Africa (r2 = 0.91, p < 0.01), this relationship appears stronger than expected for humid tropical regions, where water saturation and diminishing returns typically reduce precipitation–CPP coupling [46]. This divergence may be explained by soil hydrological constraints, ET competition, and nutrient-mediated thresholds. Highly weathered Oxisols and Ultisols dominate Central Africa [47], where poor drainage under intense rainfall (>2000 mm/year) can induce waterlogging, limiting oxygen availability for root respiration [48]. This effectively converts ‘excess’ precipitation into an ecological stressor, maintaining precipitation–CPP linearity beyond typical saturation thresholds. Dense rainforest canopies in the Congo Basin exhibit transpiration rates exceeding 1500 mm/year [49], creating strong water competition between vegetation and atmospheric demand. Higher rainfall may alleviate this tension, disproportionately boosting CPP compared to drier tropical systems [50]. Phosphorus limitation in ancient tropical soils [51] may prevent vegetation from reaching theoretical productivity maxima even at high rainfall, delaying the onset of precipitation–CPP decoupling observed in younger, more fertile systems. These mechanisms collectively suggest that Central Africa’s unique edaphic and biophysical context modulates conventional humid-climate expectations, justifying the sustained precipitation–CPP correlation observed in this paper.
This study also has some limitations. First, the Thornthwaite Memorial model does not account for land cover heterogeneity, soil properties, and crop types. Presenting CPP as a generalized index may overlook the fact that different crops respond differently to climatic stressors. Second, while the results highlighted the temperature–photosynthesis linkage in Central Africa, we acknowledge the need to examine altitudinal gradients in key regions like the Guinea Highlands. Future work should incorporate topographic modulation of temperature–productivity relationships, as elevation-dependent thermal regimes may significantly alter CPP responses. Third, the Thornthwaite method estimates ET using only temperature and precipitation. This oversimplification introduces significant bias, especially in tropical and rainfall-variable regions like Central Africa, undermining the reliability of CPP trend detection at regional scales. This will be further improved in our future study by adding other meteorological factors such as solar radiation, relative humidity, and wind speed, coupling satellite-derived ET products (e.g., MODIS or GLEAM) for validation where data permit.
5. Conclusions and Implications
5.1. Main Conclusions
(1) This paper investigated the spatio-temporal patterns of CPP in Central Africa (1901–2019) using an integrated methodological approach combining the Thornthwaite Memorial model, MK–Sneyers trend test, and Pearson correlation analysis. The main findings are as follows:
(2) Central Africa exhibited a statistically significant warming trend (r2 = 0.33, p < 0.01) coupled with non-significant rainfall reduction, suggesting an emerging warm–dry climate regime that parallels meteorological trends observed in North Africa.
(3) Central Africa exhibited an overall increasing trend in CPP, with temporal fluctuations closely aligned with precipitation variability. Specifically, the CPP in Central Africa has undergone three distinct phases: an increasing phase (1901–1960), a decreasing phase (1960–1980), and a slow recovery phase (1980–2019). The multiple intersection points between the UF and UB curves indicate that Central Africa’s CPP has been significantly affected by climate change under global warming.
Temperature and precipitation are verified to be the main limiting factors for vegetation growth in Central Africa, with little difference in their limiting effects. The correlation of CPP–Temperature was mainly positive, mainly distributed in the Lower Guinea Plateau and the northern part of the Congo Basin (r2 = 0.26, p < 0.1). The relationship of CPP–Precipitation showed predominantly a very strong negative correlation (r2 = 0.91, p < 0.01).
5.2. Policy Implications
These findings support the integration of climatic characteristics and eco-socioeconomic conditions in Central Africa through multi-scale interventions to enhance regional climate resilience. Based on this, national and local institutions in the Central African region should prioritize climate issues in their policy frameworks and adopt appropriate adaptation strategies to curb the negative impacts of climate change on agricultural production. Specific policy recommendations are as follows:
(1) Strengthening early warning systems. Given the phase variations in precipitation across Central Africa, it is important to establish a regional climate monitoring network that integrates remote sensing data to provide drought and flood early warnings, thereby enabling the agricultural sector to adjust production plans in a timely manner. Meteorological, hydrological, and pest-monitoring agencies should be reinforced with additional personnel, funding, and instrumentation. Furthermore, automated weather stations should be deployed to deliver real-time weather and climate information to farmers and other agricultural stakeholders, minimizing crop losses.
(2) Enhancing water resource management and developing climate-smart agriculture. To adapt to the warming–drying climatic trend, Central Africa should strengthen water regulation infrastructure, including reservoirs and irrigation systems, while promoting water-saving agricultural technologies such as drip irrigation. Breeding heat-tolerant and stress-resistant crop varieties also helps to enhance agricultural resilience under climate change. Central Africa should enhance climate-smart agriculture to reduce the sector’s exposure to unanticipated drops in future rainfall in Africa [21]. Central African governments should provide farmers with new agricultural technologies such as climate-smart agricultural practices and promote their capacity building in new agricultural technologies. It is worth mentioning that farmers in Central African countries are highly impoverished and cannot afford the latest technological equipment for agriculture, so the government should take up this burden. A combination of top-down and bottom-up approaches should be used in the design and implementation of such projects and programs. Actions taken should benefit the most vulnerable farmers in order to contribute to the overall achievement of the United Nations Sustainable Development Goals.
(3) Promoting regional cooperation and policy integration. Given the similarity in climatic trends between Central and North Africa, Central African countries could adopt great practices from Morocco, Egypt, and other North African nations in drought management and solar-powered irrigation systems. Regional collaboration should be facilitated through platforms such as the African Union (AU) or the Economic Community of Central African States (ECCAS) to enhance technology transfer and financial support, thereby strengthening cross-border climate governance. Furthermore, Central African nations should incorporate CPP dynamics—such as its three-phase variability—into their National Adaptation Plans (NAPs). This integration should define adaptation targets for key sectors like agriculture and forestry within national climate strategies, harmonize policies across the region, and secure international climate financing (e.g., the Green Climate Fund) to support implementation.
(4) Advancing climate-–vegetation research and policy evaluation mechanisms. To address the synergistic constraints of temperature and precipitation on vegetation growth, Central Africa should implement long-term in situ monitoring to quantify response thresholds across diverse ecosystems (e.g., the Lower Guinea Highlands vs. the Congo Basin), thereby informing zoned management strategies. Concurrently, a relational database linking CPP dynamics to policy interventions should be established to systematically evaluate the actual efficacy of adaptation measures (e.g., irrigation projects, afforestation initiatives). This will enable evidence-based dynamic optimization of climate adaptation policies.
Author Contributions
Conceptualization, M.B. and F.R.; methodology, Y.X.; software, Y.X. and X.G.; validation, M.B., F.R. and X.Z.; formal analysis, M.B.; investigation, X.Z.; resources, X.Z.; data curation, H.R. and X.G.; writing—original draft preparation, M.B. and F.R.; writing—review and editing, D.v.d.B., X.L. and H.R.; visualization, X.G.; supervision, X.L.; project administration, X.L.; funding acquisition, X.L. and H.R. All authors have read and agreed to the published version of the manuscript.
Funding
This research was supported by the Fundamental Research Funds for the Central Universities, grant number 2242025S30047; the Start-up Research Fund of Southeast University, grant number 4017002503; the National Natural Science Foundation of China, grant number 42301227; and the China–Africa Research Platform Development Initiative, grant number 5017002409.
Data Availability Statement
Dataset available on request from the authors.
Conflicts of Interest
The authors declare no conflicts of interest.
References
- Schmidhuber, J.; Tubiello, F.N. Global food security under climate change. Proc. Natl. Acad. Sci. USA 2007, 104, 19703–19708. [Google Scholar] [CrossRef] [PubMed]
- Godfray, H.C.J.; Beddington, J.R.; Crute, I.R.; Haddad, L.; Lawrence, D.; Muir, J.F.; Pretty, J.; Robinson, S.; Thomas, S.M.; Toulmin, C. Food security: The challenge of feeding 9 billion people. Science 2010, 327, 812–818. [Google Scholar] [CrossRef]
- Niang, A.; Becker, M.; Ewert, F.; Dieng, I.; Gaiser, T.; Tanaka, A.; Senthilkumar, K.; Rodenburg, J.; Johnson, J.-M.; Akakpo, C.; et al. Variability and determinants of yields in rice production systems of West Africa. Field Crops Res. 2017, 207, 1–12. [Google Scholar] [CrossRef]
- Calzadilla, A.; Zhu, T.; Rehdanz, K.; Tol, R.S.; Ringler, C. Climate change and agriculture: Impacts and adaptation options in South Africa. Water Resour. Econ. 2014, 5, 24–48. [Google Scholar] [CrossRef]
- Jagtap, V.; Bhargava, S. Variation in the Antioxidant Metabolism of Drought Tolerantand Drought Susceptible Varieties of Sorghum Bicolor (L.) Moench. exposed to high light, low water and high temperature stress. J. Plant Physiol. 1995, 145, 195–197. [Google Scholar] [CrossRef]
- Austin, K.G.; Baker, J.S.; Sohngen, B.L.; Wade, C.M.; Daigneault, A.; Ohrel, S.B.; Ragnauth, S.; Bean, A. The economic costs of planting, preserving, and managing the world’s forests to mitigate climate change. Nat. Commun. 2020, 11, 5946. [Google Scholar] [CrossRef]
- Pearson, C.J.; Bucknell, D.; Laughlin, G.P. Modelling crop productivity and variability for policy and impacts of climate change in eastern Canada. Environ. Model. Softw. 2008, 23, 1345–1355. [Google Scholar] [CrossRef]
- Li, Z.; Wang, S.; Li, J. Spatial variations and long-term trends of potential evaporation in Canada. Sci. Rep. 2020, 10, 22089. [Google Scholar] [CrossRef]
- Qin, Z.; Huang, Y.; Zhuang, Q. Soil organic carbon sequestration potential of cropland in China. Glob. Biogeochem. Cycles 2013, 27, 711–722. [Google Scholar] [CrossRef]
- Cao, J.; Zhang, Z.; Tao, F.; Zhang, L.; Luo, Y.; Han, J.; Li, Z. Identifying the contributions of multi-source data for winter wheat yield prediction in China. Remote Sens. 2020, 12, 750. [Google Scholar] [CrossRef]
- Kontgis, C.; Schneider, A.; Ozdogan, M.; Kucharik, C.; Tri, V.P.D.; Duc, N.H.; Schatz, J. Climate change impacts on rice productivity in the Mekong River Delta. Appl. Geogr. 2019, 102, 71–83. [Google Scholar] [CrossRef]
- Lachaud, M.A.; Bravo-Ureta, B.E.; Ludena, C.E. Economic effects of climate change on agricultural production and productivity in Latin America and the Caribbean (LAC). Agric. Econ. 2022, 53, 321–332. [Google Scholar] [CrossRef]
- Ibe, G.O.; Amikuzuno, J. Climate change in Sub-Saharan Africa: A menace to agricultural productivity and ecological protection. J. Appl. Sci. Environ. Manag. 2019, 23, 329–335. [Google Scholar] [CrossRef]
- Müller, C.; Cramer, W.; Hare, W.L.; Lotze-Campen, H. Climate change risks for African agriculture. Proc. Natl. Acad. Sci. USA 2011, 108, 4313–4315. [Google Scholar] [CrossRef]
- Wheeler, T.; Von Braun, J. Climate change impacts on global food security. Science 2013, 341, 508–513. [Google Scholar] [CrossRef]
- Müller, C. African lessons on climate change risks for agriculture. Annu. Rev. Nutr. 2013, 33, 395–411. [Google Scholar] [CrossRef] [PubMed]
- Knox, J.; Hess, T.; Daccache, A.; Wheeler, T. Climate change impacts on crop productivity in Africa and South Asia. Environ. Res. Lett. 2012, 7, 034032. [Google Scholar] [CrossRef]
- Descheemaeker, K.; Oosting, S.J.; Homann-Kee Tui, S.; Masikati, P.; Falconnier, G.N.; Giller, K.E. Climate change adaptation and mitigation in smallholder crop–livestock systems in sub-Saharan Africa: A call for integrated impact assessments. Reg. Environ. Change 2016, 16, 2331–2343. [Google Scholar] [CrossRef]
- Jagtap, S.S. Environmental characterization of the moist lowland savanna of Africa. In Moist Savannas of Africa: Potentials and Constraints for Crop Production: Proceedings of an IITA/FAO Workshop Held from 19–23 September 1994, Cotonou, Republic of Benin; Kang, B., Akobundu, I., Manyong, V., Carsky, R., Sanginga, N., Kueneman, E., Eds.; IITA: Cotonou, Benin, 1995; pp. 9–30. [Google Scholar]
- Nicholson, S.E. Climatic and environmental change in Africa during the last two centuries. Clim. Res. 2001, 17, 123–144. [Google Scholar] [CrossRef]
- Ogundari, K.; Onyeaghala, R. The effects of climate change on African agricultural productivity growth revisited. Environ. Sci. Pollut. Res. 2021, 28, 30035–30045. [Google Scholar] [CrossRef]
- Li, H.; Zhang, X. A spatial explicit assessment of food security in Africa based on simulated crop production and distribution. J. Clean. Prod. 2017, 147, 628–636. [Google Scholar] [CrossRef]
- Kohli, M.; Mijiddorj, T.N.; Suryawanshi, K.R.; Mishra, C.; Boldgiv, B.; Sankaran, M. Grazing and climate change have site-dependent interactive effects on vegetation in Asian montane rangelands. J. Appl. Ecol. 2021, 58, 539–549. [Google Scholar] [CrossRef]
- Yang, C.Y.; Wang, C.C.; Lu, C.C.; Chiu, Y.H.; Chiu, S.Y. Evaluating the impact of agricultural production efficiency on sustainable development goals in coffee-producing countries in Africa. Sustain. Dev. 2024, 32, 3375–3388. [Google Scholar] [CrossRef]
- Cui, Z.; Zhang, H.; Chen, X.; Zhang, C.; Ma, W.; Huang, C.; Zhang, W.; Mi, G.; Miao, Y.; Li, X.; et al. Pursuing sustainable productivity with millions of smallholder farmers. Nature 2018, 555, 363–366. [Google Scholar] [CrossRef]
- Zhang, W.; Cao, G.; Li, X.; Zhang, H.; Wang, C.; Liu, Q.; Chen, X.; Cui, Z.; Shen, J.; Jiang, R.; et al. Closing yield gaps in China by empowering smallholder farmers. Nature 2016, 537, 671–674. [Google Scholar] [CrossRef]
- Olanipekun, I.O.; Olasehinde-Williams, G.O.; Alao, R.O. Agriculture and environmental degradation in Africa: The role of income. Sci. Total Environ. 2019, 692, 60–67. [Google Scholar] [CrossRef] [PubMed]
- Jalloh, A.; Nelson, G.C.; Thomas, T.S.; Zougmoré, R.B.; Roy-Macauley, H. (Eds.) West African Agriculture and Climate Change: A Comprehensive Analysis; International Food Policy Research Institute: Washington, DC, USA, 2013. [Google Scholar]
- Lieth, H. Modeling the primary productivity of the world. Prim. Product. Biosph. 1975, 14, 237–263. [Google Scholar]
- Schulze, R.E.; Kiker, G.A.; Kunz, R.P. Global climate change and agricultural productivity in southern Africa. Glob. Environ. Change 1993, 3, 330–349. [Google Scholar] [CrossRef]
- Barrios, S.; Ouattara, B.; Strobl, E. The impact of climatic change on agricultural production: Is it different for Africa? Food Policy 2008, 33, 287–298. [Google Scholar] [CrossRef]
- Roudier, P.; Sultan, B.; Quirion, P.; Berg, A. The impact of future climate change on West African crop yields: What does the recent literature say? Glob. Environ. Change 2011, 21, 1073–1083. [Google Scholar] [CrossRef]
- Sultan, B. Global warming threatens agricultural productivity in Africa and South Asia. Environ. Res. Lett. 2012, 7, 041001. [Google Scholar] [CrossRef][Green Version]
- Abraham, B.; Araya, H.; Berhe, T.; Edwards, S.; Gujja, B.; Khadka, R.B.; Koma, Y.S.; Sen, D.; Sharif, A.; Styger, E.; et al. The system of crop intensification: Reports from the field on improving agricultural production, food security, and resilience to climate change for multiple crops. Agric. Food Secur. 2014, 3, 4. [Google Scholar] [CrossRef]
- Zhao, J.; Kong, X.; Jiang, Y.; Qian, Y. Impact Assessment of Climate Change on Climatic Potential Productivity in Global Major Agricultural Regions Based on High Spatial and Temporal Resolution Data. Ecol. Environ. Sci. 2019, 28, 1. [Google Scholar]
- Li, Z.; Duan, C.; Jin, L.; Hu, X.; Li, B.; Yang, H.Y. Spatial and temporal variability of climatic potential productivity in Yunnan Province, China. Chin. J. Appl. Ecol. 2019, 30, 2181–2190. [Google Scholar]
- Ren, Q.; Weng, L.; Gu, K.; Wu, X.; Xie, Q.; Luo, H. Spatiotemporal Variation Characteristics of Climate Potential Production in Guizhou Province. Chin. J. Agrometeorol. 2025, 46, 872–882. [Google Scholar]
- Bi, M.; Wan, L.; Zhang, Z.; Zhang, X.; Yu, C. Spatio-temporal variation characteristics of North Africa’s climate potential productivity. Land 2023, 12, 1710. [Google Scholar] [CrossRef]
- Harris, I.; Osborn, T.J.; Jones, P.; Lister, D. Version 4 of the CRU TS monthly high-resolution gridded multivariate climate dataset. Sci. Data 2020, 7, 109. [Google Scholar] [CrossRef]
- Sun, Q.; Miao, C.; Hanel, M.; Borthwick, A.G.; Duan, Q.; Ji, D.; Li, H. Global heat stress on health, wildfires, and agricultural crops under different levels of climate warming. Environ. Int. 2019, 128, 125–136. [Google Scholar] [CrossRef]
- Beck, H.E.; Wood, E.F.; Pan, M.; Fisher, C.K.; Miralles, D.G.; van Dijk, A.I.J.M.; McVicar, T.R.; Adler, R.F. MSWEP V2 global 3-hourly 0.1° precipitation: Methodology and quantitative assessment. Bull. Am. Meteorol. Soc. 2019, 100, 473–500. [Google Scholar] [CrossRef]
- Sneyers, R. On the Statistical Analysis of Series of Observations; Technical Note No. 143, WMO No. 415; World Meteorological Organization: Geneva, Switzerland, 1990. [Google Scholar]
- Oladipo, E.O. Drought in Northern Nigeria: An indication of abrupt climatic change? Weather. Clim. 1993, 13, 34–39. [Google Scholar] [CrossRef]
- Tabari, H.; Talaee, P.H. Analysis of trends in temperature data in arid and semi-arid regions of Iran. Glob. Planet. Change 2011, 79, 1–10. [Google Scholar] [CrossRef]
- Yue, S.; Pilon, P.; Phinney, B.; Cavadias, G. The influence of autocorrelation on the ability to detect trend in hydrological series. Hydrol. Process. 2002, 16, 1807–1829. [Google Scholar] [CrossRef]
- Jones, A.; Breuning-Madsen, H.; Brossard, M.; Dampha, A.; Deckers, J.; Dewitte, O.; Hallett, S.; Jones, R.; Kilasara, M.; Le Roux, P. Soil Atlas of Africa; European Commission, Publications Office of the European Union: Luxembourg, 2013. [Google Scholar]
- Fan, Y.; Miguez-Macho, G.; Jobbágy, E.; Otero-Casal, C. Hydrologic regulation of plant rooting depth. Proc. Natl. Acad. Sci. USA 2017, 114, 10572–10577. [Google Scholar] [CrossRef]
- Zhou, L.; Tian, Y.; Myneni, R.B.; Ciais, P.; Saatchi, S.; Liu, Y.Y.; Piao, S.; Chen, H.; Vermote, E.F.; Song, C.; et al. Widespread decline of Congo rainforest greenness in the past decade. Glob. Change Biol. 2014, 20, 2943–2954. [Google Scholar] [CrossRef]
- Malhi, Y.; Doughty, C.; Galbraith, D. The allocation of ecosystem net primary productivity in tropical forests. Philos. Trans. R. Soc. B Biol. Sci. 2015, 366, 3225–3245. [Google Scholar] [CrossRef] [PubMed]
- Quesada, C.A.; Lloyd, J.; Schwarz, M.; Patiño, S.; Baker, T.R.; Czimczik, C.; Fyllas, N.M.; Martinelli, L.; Nardoto, G.B.; Schmerler, J.; et al. Variations in chemical and physical properties of Amazon forest soils in relation to their genesis. Biogeosciences 2010, 7, 1515–1541. [Google Scholar] [CrossRef]
- Vitousek, P.M.; Porder, S.; Houlton, B.Z.; Chadwick, O.A. Terrestrial phosphorus limitation: Mechanisms, implications, and nitrogen-phosphorus interactions. Ecol. Appl. 2010, 20, 5–15. [Google Scholar] [CrossRef] [PubMed]
Disclaimer/Publisher’s Note: The statements, opinions and data contained in all publications are solely those of the individual author(s) and contributor(s) and not of MDPI and/or the editor(s). MDPI and/or the editor(s) disclaim responsibility for any injury to people or property resulting from any ideas, methods, instructions or products referred to in the content. |
© 2025 by the authors. Licensee MDPI, Basel, Switzerland. This article is an open access article distributed under the terms and conditions of the Creative Commons Attribution (CC BY) license (https://creativecommons.org/licenses/by/4.0/).