Perspective

Context-Specific Urban Optimisations Through Data-Driven Classification: A Perspective on Methods and Applications

1
Faculty of Architecture, University of Ljubljana, 1000 Ljubljana, Slovenia
2
Faculty of Computer and Information Science, University of Ljubljana, 1000 Ljubljana, Slovenia
*
Author to whom correspondence should be addressed.
Land 2025, 14(8), 1505; https://doi.org/10.3390/land14081505
Submission received: 24 April 2025 / Revised: 14 July 2025 / Accepted: 17 July 2025 / Published: 22 July 2025

Abstract

Urban environments are increasingly challenged by rapid urbanisation and climate change, demanding strategic responses that are both adaptable and sensitive to local context. Typological classification offers a structured approach to understanding diverse urban contexts, enabling targeted interventions that support climate neutrality and livability. While global pressures are shared, their impacts differ widely across cities, highlighting the need for context-aware urban analytics to guide effective transformation. This paper presents a methodological perspective on a computational framework and workflow based on open source data, designed to support the classification and optimisation of urban environments across different urban contexts; it explores the framework’s potential and limitations, grounded in a review of relevant literature and available datasets. We propose a workflow encompassing four main steps: (1) classifying urban environments based on quantifiable characteristics, (2) identifying key performance indicators (KPIs) differentiated by urban typology, (3) proposing interventions to optimise urban environments according to underlying typological classification, and (4) validating the proposed solutions in simulated environments. The framework prioritises open data sources provided by public authorities as well as open science and citizen science initiatives. A more streamlined integration of data is proposed, facilitating both the classification and assessment of urban environments aligned with their primary typological designation.

1. Introduction

The effects of climate change and rapid population growth are becoming increasingly evident across all levels of society, particularly in densely populated urban areas. These challenges include the appearance of urban heat island effects, increased frequency of storms, severe congestion and air pollution, excessive noise levels and light pollution, as well as social fragmentation and strain on housing, infrastructure and energy resources due to growing populations. Addressing these issues requires a coordinated global response, as reflected in major initiatives like the Paris Agreement [1], the United Nations’ Agenda 2030 [2], and the European Green Deal [3]. These initiatives include measures to mitigate climate change by reducing greenhouse gas emissions while simultaneously promoting liveable neighbourhoods and fostering the smart city concept of adaptability. However, despite the increasing interest in these initiatives, progress in evaluating and measuring their outcomes remains limited [4].
Given the complexity of urban environments, the impacts of climate change and urbanisation are not uniform. Although diverse urban settings, characterised by different spatial and social attributes, collectively experience the severe effects of global warming and climate transformation, they face significantly different consequences due to varying levels of vulnerability and susceptibility to pressures. These factors, diversity and deviation, underscore the importance of tailored analyses and distinct approaches in devising effective solutions to urban challenges. Recognising the type of neighbourhood, district, or other urban entity and conducting analyses accordingly can lead to better-informed decision making in urban planning, design, and policy formulation. One of the methods for understanding and categorising urban environments is typological analysis, which serves as both a classification tool and a comparative examination technique.
Typological analysis has a long tradition in architecture and urban planning [5]. This longstanding practice was initially developed as a fundamental tool for analysing buildings and urban areas (analytical typology) and later evolved into an approach for designing and planning strategies (generative typology) [6,7,8]. With its roots deeply embedded in architectural history, classical typology stands out as the oldest method for classifying architectural objects, initially utilised for establishing fundamental divisions among building types by form, scale and materials often influenced by the geographical context, climate, topography, etc. [9]. Rossi [6] introduced the concept of typology as the study of elements within a city and architecture that cannot be further deconstructed, a principle akin to a logical operation, enabling a deeper understanding and comparison by considering fundamental, irreducible components. He suggested focusing on the similarities of urban form exploring the concept of morphological regions and their hierarchical organisation within the urban fabric. This perspective, often referred to as typo-morphological study, was principally focused on interpreting and classifying the spatial and morphological characteristics of buildings [10] extending toward the urban scale by exploring the connections between larger urban patterns and housing [11], including the organisation and connectivity of residential areas, districts, and other urban areas within the pronounced socio-geographical context. City-scale morphological classification accentuates the study of the building block arrangements and the corresponding street grid, forming recognisable urban patterns. Before the GIS and digitalisation era, this was typically conducted by graphically analysing the cartographic types parallel to historic evolutionary characteristics [12], i.e., the distinctive character of an urban fabric that stems directly or indirectly from the historical context of its formation [13].
The identification and classification of urban areas in recent years have undergone a substantial transformation, driven by the advancement of computational methods and data analytics. Mathematical models and clustering techniques now extend beyond static form–function relationships to incorporate a wide array of spatial, social, and environmental variables, enabling a more refined understanding of urban dynamics. The initial concept of numerical taxonomy in biology [14] and the rise of mathematical multivariate morphometrics quickly extended their influence to the domain of urban analytics and associated classification methodologies. This has been accelerated by the wealth and easy accessibility of open source data, facilitating the integration of multidimensional and problem-initiated aspects of urban settings.
The concept of urban typological classification is thus central to understanding variations in planning and design practice, as it categorises urban environments into distinct types, according to their demonstrated or simulated capacities. This helps the decision-making processes to optimise their functionality through customised planning endeavours. Specifically, the characteristics and (dis)qualities of urban areas are often influenced by the prevailing design philosophy and building regulation of the time, their political and social imprint, and the attributes of the specific geographical location [15]. They reflect the geographies, ideas and technologies prevalent during their planning, evident in their authentic manifestation through housing size, form and building footprint, street width and design, distribution of green spaces, and the accessibility of central services, etc. [16].
Building on the legacy of these opportunities and addressing the specific challenges to achieving climate neutrality and sustainability, it is crucial to forge highly tailored strategies for urban regeneration and improving living quality.
We approached this idea by developing an analytical classification framework1 aimed at enhancing decision making in urban practices across diverse urban settings, grounded in an initial classification of urban attributes. The proposed strategic and computational approach (1) classifies urban environments based on quantifiable characteristics and associated typological markers; (2) identifies critical urban points and key performance indicators (KPIs) specific to each typological class; (3) proposes a set of interventions or implementation steps to optimise urban environments within their respective classes; and (4) validates the proposed solutions in simulated (in silico) environments.
We envision basing our framework on different types of data available for a specific location, relying on open data sources provided by public authorities, municipalities, open science and/or citizen science initiatives. Such datasets will be seamlessly integrated into a comprehensive set of relevant KPIs, which will not only aid with the classification and assessment of a specific environment but also suggest optimisations towards the main urban type designation. As part of this effort, the research aims to establish a computational decision recommendation engine grounded in an assessment methodology and tested in simulated environments. In the paper, we overview different datasets and metrics that can be used in the framework reconstruction process as well as different methods to integrate these towards a decision support system.

2. Computational Framework: Structured Methodology and Analytical Workflow

This section outlines the methodological design and analytical workflow of the proposed computational framework. The approach is structured into four main components: data acquisition and filtering, urban classification based on spatial and functional attributes, assessment of typology-specific performance indicators (KPIs), and recommendation of targeted interventions, including a feedback loop for in silico validation. The optimisation phase incorporates an iterative refinement approach to mitigate the limitations of the urban environments under consideration. Each component is described in the subsections that follow, highlighting the data inputs, analytical techniques, and expected outputs relevant to each stage of the framework Figure 1.

2.1. Data Acquisition and Filtering

The efficacy of computational and data-driven approaches is largely dependent on the quality and spectrum of available data. A comprehensive collection of datasets offers deeper insights into the phenomena and dynamics of the studied environment, supporting more accurate analysis and better-informed decision making. By integrating a wide range of diverse, high-quality data sources and applying advanced analytical methods, urban practitioners are better equipped to detect emerging trends, recognise patterns, and develop targeted strategies to tackle complex urban challenges effectively. Moreover, ongoing improvements in data collection methodologies and the expansion of existing data repositories further augment the precision and utility of quantitative approaches in environmental analysis and optimisation.
The proposed computational framework incorporates two primary types of data sources:
  • The primary datasets (i.e., reference datasets) facilitate the classification of arbitrary urban areas into distinct typology classes through adaptive automated methodologies. We stimulate the application of open datasets accessible via open application programming interfaces (open APIs). These enable the automated acquisition of available data for arbitrary locations; however, after data collection, the implementation of appropriate data models and data integration is required.
  • A curated array of additional datasets is utilised to extract relevant KPIs, with each dataset being tailored to the specific characteristics of the corresponding urban area type. The curation and selection process of these datasets is guided by their relevance and applicability to addressing the distinct urban challenges pertinent to each case study. The acquired and integrated data layers can be applied to the assessment of multi-domain KPIs, each potentially relevant to different urban settings.

2.1.1. Selection Criteria

In formulating the envisioned methodology, one of the critical junctures recognised in the research process was the selection of the most applicable datasets and indicators based on predefined constraints. This entails evaluating the utility and the added value of envisioned datasets for classification processing, ranking them according to their role within the assessment frame, as well as estimating their applicability proportionally to their availability, coverage, and processing complexity. To address this challenge, we embraced a systematic modular approach, integrating a compilation of criteria that were used to conduct the selection process (described below in more details):
  • Open source opportunities.
  • Data suitability to climate-related issues.
  • Spatial and temporal coverage.
Open Source Opportunities
Given the importance of data accessibility and sharing efforts (e.g., European strategy for data2), we prioritise open source datasets, available across well-represented governmental or international repositories (e.g., Copernicus3, European Environmental Agency4). Additionally, many of the institutional research records are offered in shared repositories. Notable examples include the European Data Portal5, OpenAIRE6, and the European Open Science Cloud (EOSC)7, which provide freely accessible datasets with standardised quality-estimation metadata. Despite these advancements, there is still considerable room for improvement in terms of the actual operability of these systems. Challenges such as data interoperability and user-friendly access remain areas that need further development to enhance the overall effectiveness of these initiatives.
In addition, community-driven and citizen science initiatives that promote participatory practices are considered. For example, OpenStreetMap (OSM) [17] is an open and free geographic database that provides data for an arbitrary location across the globe. It is regarded as the most comprehensive global crowd-sourced geospatial data collection [18] released under the Open Database License (ODbL). Access to OSM data can be facilitated through different services8. Furthermore, various citizen science initiatives, such as Telraam9 or sensor.community10 enabled the acquisition of domain-specific data, thus enhancing the availability of critical insights into traffic patterns, micro-local meteorological conditions, and pollution levels for urban areas throughout Europe and globally. Leveraging such datasets allows us to develop robust inference frameworks that can be effectively deployed across arbitrarily chosen locations with comparable datasets.
On the other hand, crowd-sourced public datasets are often easy to capture and manage, but more frequently encounter issues related to data accuracy, reliability, and incompleteness [19]. Considerable efforts have been dedicated to examining the existence and quality standards of, for example, OSM or Mapillary11 datasets, including road networks, points of interest, and building footprints [18,20,21,22,23]. Huang et al. [24], in their study, reveal several limitations in the classification of OSM characteristics and POI as a consequence of inconsistencies related to the ambiguous linkage between POIs and their actual urban functions. As put by Psyllidis et al. [25], despite the many eyes that govern crowd-sourced datasets, mapped data on open source platforms may still suffer from coverage issues and data quality bias, but benefit from their potential for highly automated acquisition, offering substantial advantages in terms of processing time and costs while also reducing the likelihood of human errors. Despite their benefits, these datasets may introduce systematic bias, coverage inconsistencies, or misrepresentations of functional uses, which can influence the robustness of classification outputs and should be considered when interpreting results.
Data Suitability to Climate-Related Issues
The selection process involves examining the dataset’s content, structure, and characteristics to ascertain its relevance and applicability to specific urban challenges or phenomena in a particular case study. Specifically, we assess how well the dataset aligns with the complex dynamics of urban climate change challenges and its impact on overall livability. This entails considering the dataset’s capacity to address existing climate-related issues as well as its potential to discover the correlation with other phenomena captured by data. Such a holistic perspective ensures the extraction of insights beyond the obvious patterns and their use in further assignments of KPIs.
Spatial and Temporal Coverage
One of the important considerations in the data selection process is geospatial and temporal coverage. In the past decade, there has been a noticeable rise in the use of spatially granulated data in urban analytics, particularly for predicting local outcomes. To grasp the subtle variations along urban networks, our data selection process is led by prioritising the datasets with broader spatial and temporal coverage. This involves assessing spatial resolution and temporal frequency to ensure a comprehensive representation of urban dynamics and comparability across wider geographical areas. Nevertheless, wide-ranging geographical data coverage offers significant potential for conducting robust cross-regional and cross-national analyses and classification. This is closely tied to the spatial granularity of geographic variables, with higher-resolution datasets offering more detailed information, thereby facilitating a more precise inventory of features and predictive accuracy of the model [26].
Similarly, the temporal frequency of data (i.e., the frequency of observations or measurements) determines time-based granularity, (i.e., how repeatedly and continually data are collected or updated). Whether the dataset offers real-time, near-real-time, or historical data, we aim for the minimum temporal specificity that can align with the sequential dynamics of the urban phenomena during a given period. This ensures that trends, fluctuations, and events are captured and analysed within an appropriate temporal context and historical sequence.

2.2. Urban Classification

The evolution of urban classification has undergone a significant transformation from form-based typologies to multivariate approaches. Formerly, urban analytical classification relied heavily on morphological concepts in a historical sense [11,27], underscoring how the historical backdrop of an area significantly shaped the urban landscape over time [6,13]. This also plays an important role in understanding the benchmarks of quality and efficiency principles in a particular area according to contemporary standards. More specifically, the regulatory framework of the historical period during which a particular urban area was built not only reflects the typical architectural or urbanistic style of the time but also impacts the measures of efficiency, living quality, and sustainability due to differing building and planning standards in force at the time of their construction.
The primary focus on form patterns progressively evolved towards a classification that included urban utility and function. This trend has become more apparent with the rise of new urban zoning paradigms, initially conceived as a strategic response to the disorder of the industrial city [28]. Planning strategies that emerged aimed to regulate land use within urban areas through the subdivision of cities into distinct functional zones, each governed by specific regulations and permissible land uses, particularly confining heavy industrial activities, as well as residential zones [29,30].
Recent advances in urban analytics reveal the importance of using classification based on multiple criteria and clustering techniques for tailored planning [31,32]. Large volumes of different types of data from various sources, such as remote sensors, satellites, surveys, and administrative records, raise the necessity for its systematic organisation, processing and retrieval to uncover patterns, relationships, and trends that may not be apparent through individual data. Progress in high-resolution satellite imagery, coupled with advanced image processing algorithms, enabled the extraction of detailed spatial information relating to land cover, land use, and built-up areas [33]. Hyperspectral and LiDAR (Light Detection and Ranging) remote sensing have further enhanced the accuracy and granularity of spatial data and the potential for morphological classification driven by the machine learning algorithms, and geospatial information systems [34,35,36,37].
Morphometric analyses and classification in combination with socioeconomic indicators allow for a more complex comparative approach, as exemplified, for instance, by mapping accessibility to cultural heritage through social media [38] or as demonstrated by Malah and Bahi [39], who illustrate the effectiveness of multivariate statistical techniques in assessing various aspects of urban sustainability based on the integration of five environmental indices retrieved from Landsat-8 imagery and coupled with eight general census socioeconomic indicators. Furthermore, linking energy consumption to urban morphology offers important opportunities to address climate change at the city scale. Blanco et al. [40] develop a data-driven method to classify urban areas into Urban Energy Units (UEUs)—zones defined by shared building characteristics, settlement patterns, and energy demand. Using open data and machine learning models, they enrich incomplete building stock information and identify typical urban patterns to support modular energy district planning, as demonstrated in the German city of Oldenburg in line with municipal heating strategies. Amado and Poggi [41], on the other hand, approach the link between morphology and energy through a detailed categorisation and analysis of the urban fabric, building typologies, land uses, and volumetric characteristics. Their work focuses on solar energy production and consumption potential, supporting the development of targeted regulations and incentives for upgrading existing buildings. This enables cities to move towards higher energy efficiency standards, informed by both present conditions and long-term objectives. Similarly, they geographically define urban spaces based on shared architectural and building characteristics, contributing to more context-sensitive planning strategies.
Oliveira et al. [42] demonstrated the classification in urban air pollution assessment and landscape metric analysis, highlighting its role in informing decision making and cross-sectoral policy formulation. Similarly, Grafius et al. [43] employed multivariate landscape metric analysis by quantifying connectivity, built tissue fragmentation, and biodiversity. The resulting categories serve as a roadmap for urban planning strategies, identifying the areas with a prioritised need for green corridors, pocket parks, or multi-functional textures.
Given the robust correlation between urban land use and socio-economic factors within urban areas, recent efforts have delved deeper by leveraging social sensing data layers and employing advanced multivariate analytics to categorise the urban environment. These comprise cell phone records and activity, location-based social networks and social media check-ins, including frequencies on points of interest (POIs)12, GPS trajectory information or floating car data [44] to unveil the latent dimensions of social activities [45,46,47,48,49,50]. These social data layers serve as essential classification factors in a range of applications, including spatial econometrics, demography modelling, building energy consumption modelling, and traffic flow and accessibility analysis [20].
The computational framework proposed in our study builds upon the rich legacy of classification techniques. In the initial phase, it proposes an adaptive method to identify similar neighbourhood-scale units based on their morphological and population characteristics and land use. In the subsequent phase, semantic data layers are integrated to identify typology-specific features and facilitate the extraction of key performance indicators. This structured approach introduces an automated, modular system for assessing urban neighbourhood variables, progressively incorporating relevant data layers tailored to the specific location and urban challenges being addressed. The adaptive method is being developed to classify urban areas in Ljubljana based on 250 m × 250 m and 100 m × 100 m grid segments, according to their morphological, demographic and functional features. The classification process in the demonstration stage tends to include three primary datasets: building footprints, population counts, and land cover. While the building footprint layer provides information on building tissue compactness, the population layer offers insights into resident density. The land cover further filters the designated use. This approach is expected to allow us to distinguish between low-rise and high-rise residential and non-residential typologies. While the framework enables the classification of diverse urban areas, some degree of typological overlap is unavoidable due to transitional zones and mixed-use areas. These overlaps can blur clear boundaries between types, which may influence the precision of targeted interventions and should be considered in further development.

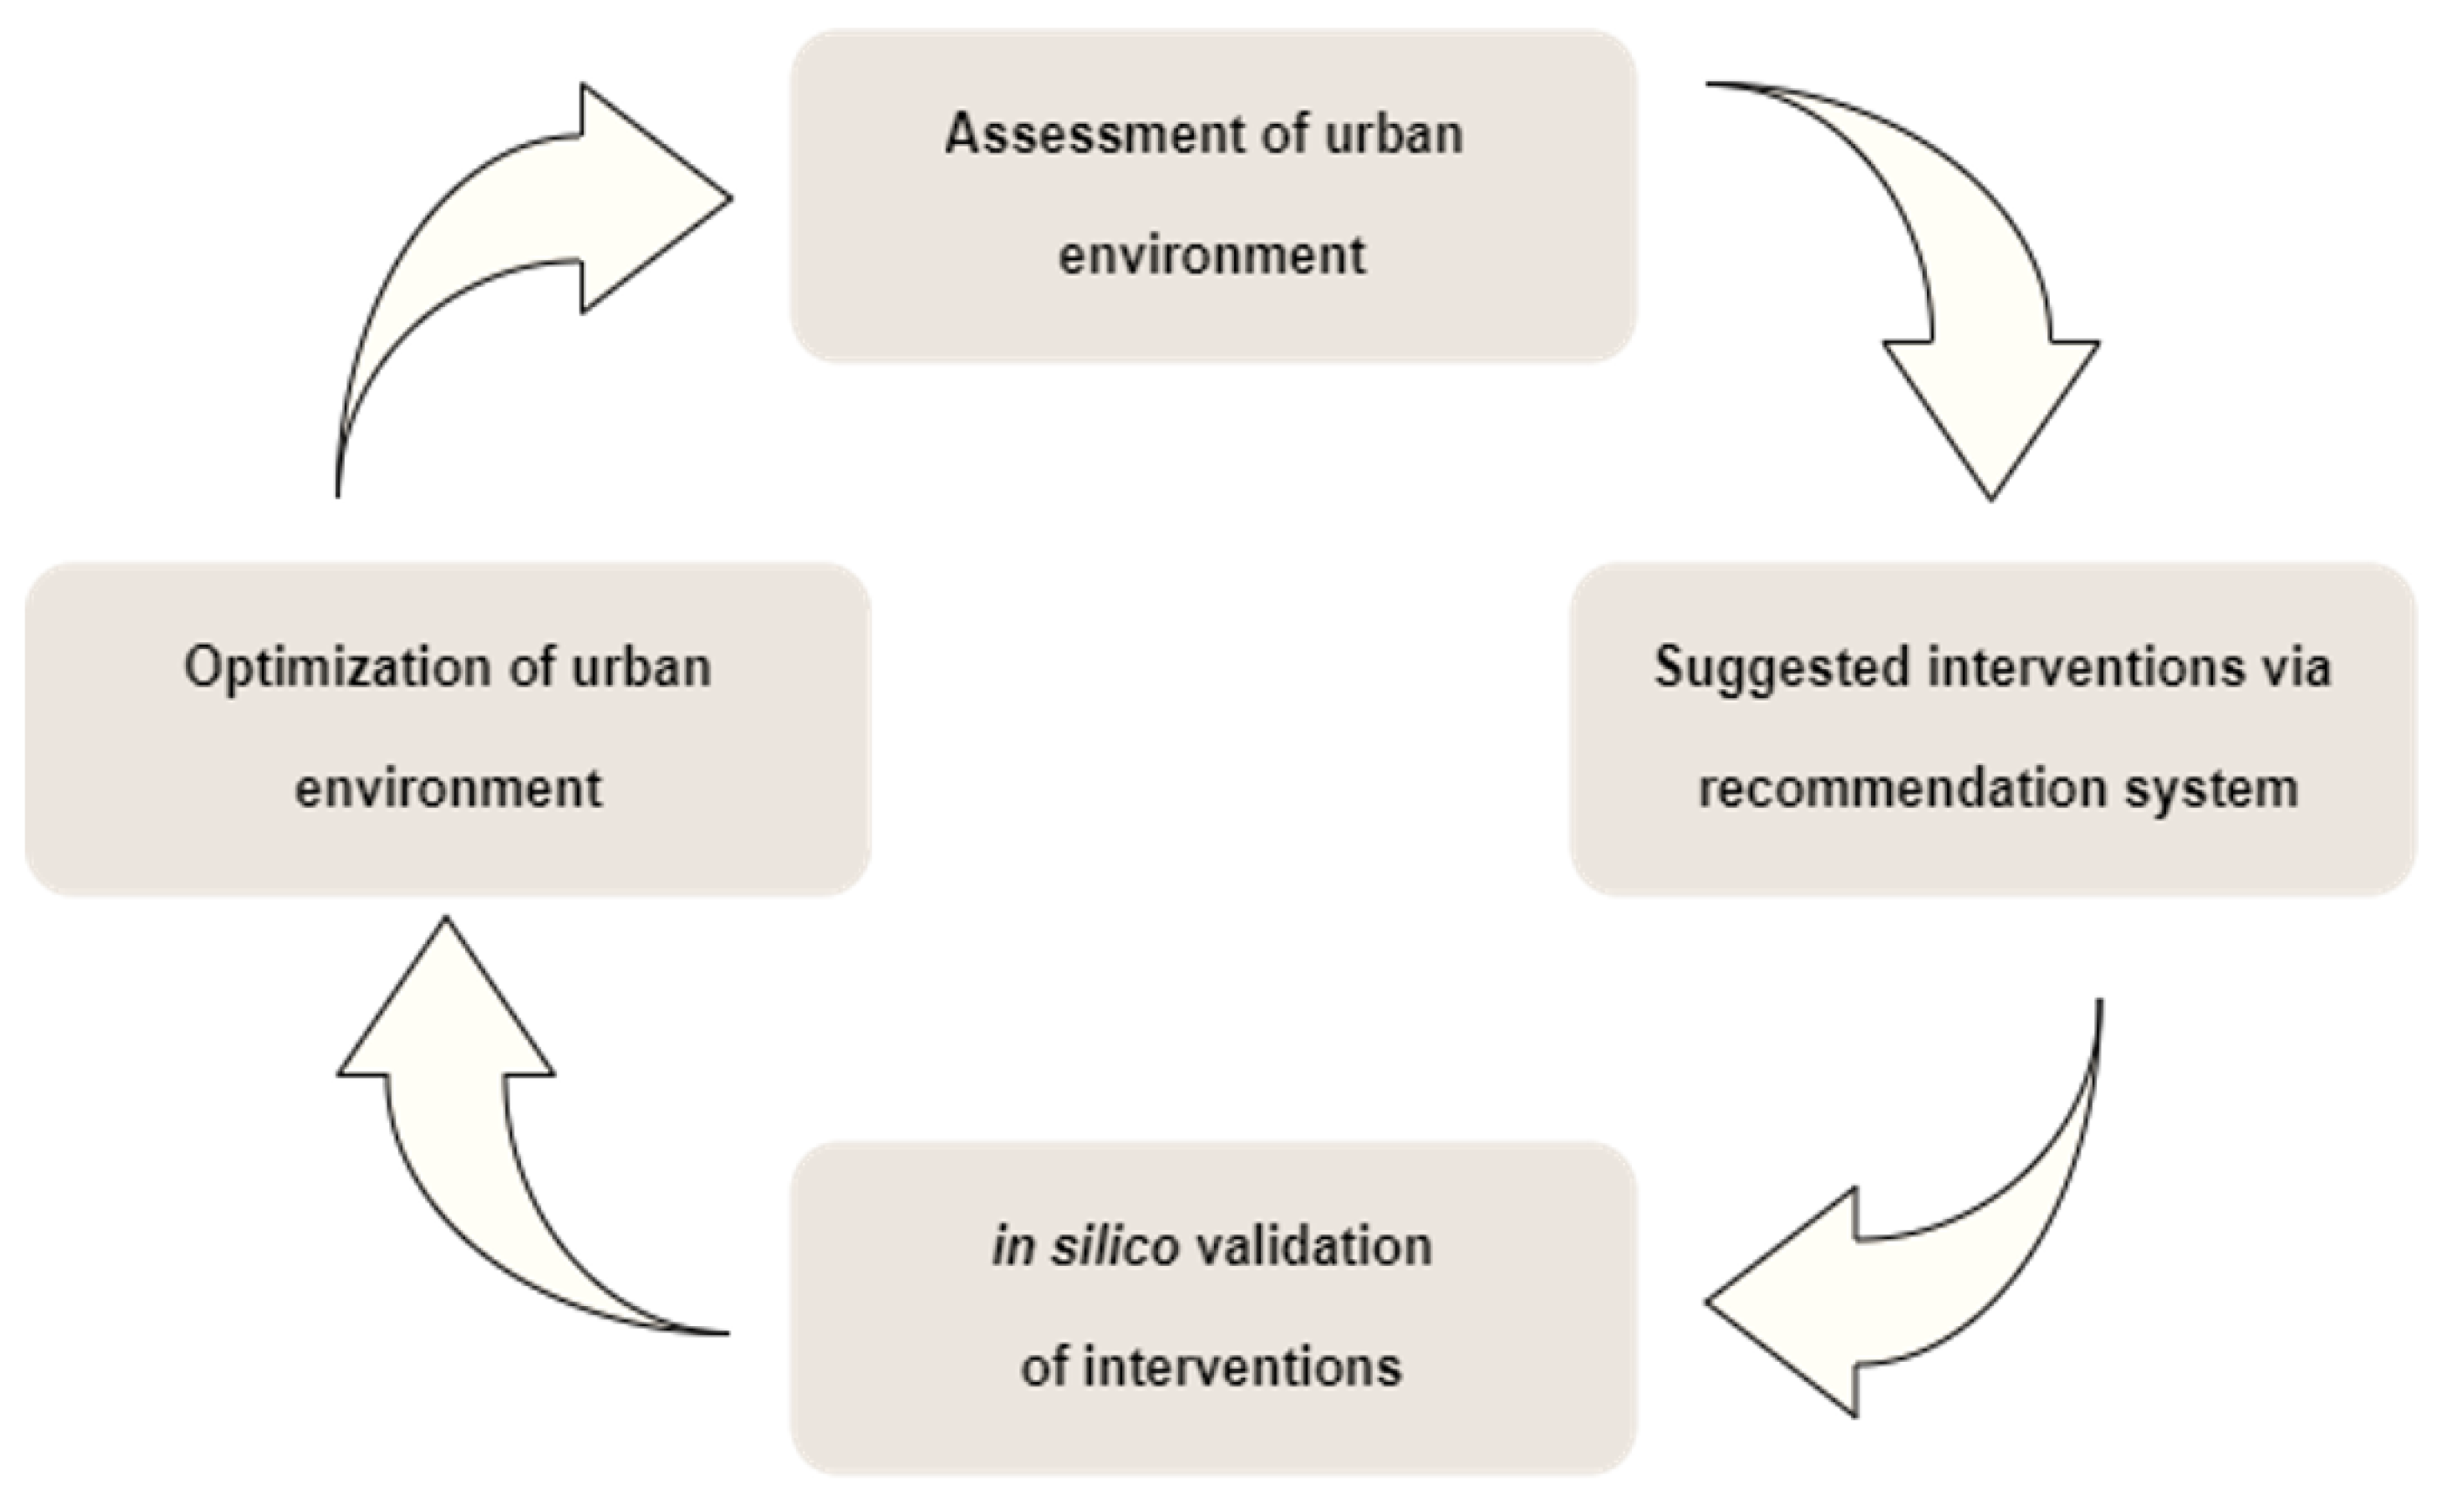
2.3. Assessment of KPIs and Identification of Critical Points

Over the years, a multitude of KPIs have been developed to assess progress and quality across various dimensions, particularly within the smart city paradigm. These KPIs extend beyond traditional metrics to encompass aspects such as traffic sustainability, sustainable urban renovation, and energy efficiency planning, reflecting the complexity of urban systems. Such thematic scopes align closely with the objectives of the Sustainable Development Goals [2], which serve as strategic frameworks guiding cities toward enhanced intelligence, sustainability, and resilience [4]. Moreover, when deliberately selected and combined with pre-classification techniques, they allow for the comparison of different geographical locations and settings as well as the identification of targeted critical points within a location, thus forming a robust decision-making mechanism. The new spatial metrics have emerged as powerful tools for quantifying urban morphology and spatial dynamics, offering a more nuanced understanding of urban form and structure. Metrics such as landscape proportions and patterns, network density and accessibility, fractal dimensions, and spatial autocorrelation measures provide deep insights into how cities evolve and function. These quantitative descriptors enable a rigorous characterisation of spatial configurations, revealing critical linkages between urban form and sustainable development imperatives [26,51,52]. As highlighted in Fleischmann’s comprehensive review on quantitative methods in urban morphology [53], morphometric analysis serves three key research objectives: (1) evaluating the performance of urban form in relation to sustainability, resilience, accessibility, and urbanity; (2) facilitating comparative assessments across different spatial contexts; and (3) monitoring and predicting patterns of urban growth. Building upon this analytical foundation, each district typology identified in the preceding phases will be assigned a tailored set of KPIs, curated to address the specific characteristics and challenges of the given spatial unit. By systematically analysing these indicators at the neighbourhood or district level, as outlined in Section 3.2, the approach ensures that urban planning and policy interventions are both context-sensitive and strategically aligned with broader sustainability objectives. Table 1 illustrates the possible relationships between different urban types, corresponding KPIs, and interventions.

2.4. Recommendation and Validation of Interventions to Optimise Urban Environments

Following the identification of critical points by assessing the relevant indicators, a computational framework will facilitate the recommendation of potential improvements (through policies or spatial interventions) aimed at optimising the functionality of the environment. Integrating this recommendation engine with a simulation environment, such as digital twins, enables virtual modelling and evaluation of proposed interventions prior to their actual implementation. The impact of these interventions can be assessed within the digital twin environment by computing relevant KPIs for specific scenarios, thereby providing quantifiable metrics to support evidence-based decision making. This process will be complemented by a validation module, specifically engineered to assess the proposed actions through in silico predictions and simulations, thereby enabling a thorough evaluation of their potential impact before real-world deployment.
For instance, a neighbourhood typology identified as a compact high-rise residential area, exhibiting high population density and low green space availability, may receive a recommendation to increase vegetated surfaces and improve microclimatic comfort. Before real-world implementation, this proposed intervention is tested within the digital twin environment by simulating its expected impact on KPIs such as urban heat mitigation, walkability, and public space accessibility. The simulation produces quantifiable outputs, which are then assessed against baseline conditions. Once the intervention is carried out in the physical environment, actual performance data—such as measured surface temperatures or user feedback on comfort—are fed back into the system to refine both the classification logic and future scenario assessments. This creates a continuous learning loop between prediction, implementation, and empirical validation.
This approach integrates theoretical predictions with practical complexities, providing a proactive framework to mitigate risks and enhance outcomes. Once an intervention has been successfully implemented in the real world, both the recommendation engine and the simulation environment are updated with empirical data derived from the intervention’s effects. Such updates refine the recommendation engine’s accuracy by incorporating actual performance data, thus enabling it to learn from real-world scenarios and continuously improve its predictive capabilities. This iterative, or potentially cyclic, process promotes a dynamic model of ongoing refinement, where data-driven insights facilitate progressively more effective interventions over time (Figure 2).

3. Applicability Potential and Contextual Fitting

The feasibility of the proposed methodology will be explored through a demonstration stage conducted in Ljubljana. We aim to identify similar neighbourhood-scale units based on their morphological and population characteristics, and land use (Figure 3). In doing so, we partly draw upon the Local Climate Zone (LCZ) framework, originally designed for urban climate investigations and widely applied as a conceptual reference [54,55]). The LCZ classification delineates common and generic urban types, relying on universally applicable, standardised, and easily quantifiable urban parameters. These include surface structure (e.g., building height and spacing) and surface cover (e.g., proportion of impervious surfaces), providing a consistent foundation for typological delineation.
In our case, LCZ principles are used to inform the spatial delimitation and preliminary categorisation of urban typologies, which are then further refined through the integration of auxiliary indicators. The demonstration serves as a testbed to evaluate the framework’s applicability and flexibility, and to iteratively optimise its mechanisms. The process unfolds in two stages: the first involves establishing semantic data layers that define the core morphological and land use types; the second adds auxiliary data to designated KPIs that enable performance evaluation, scenario testing, and tailored recommendations. These indicators support the identification of typology-specific features and help demonstrate the extensibility of the classification process. Each resulting class serves as a reference base for semantic enrichment and KPI development, ultimately supporting context-sensitive and scalable urban optimisation strategies. This approach enables the formulation of recommendations that are not only structurally grounded but also sensitive to local conditions and policy goals. For instance, two areas with similar morphological characteristics may differ significantly in their climate vulnerability, access to services, or demographic resilience. The incorporation of auxiliary data layers makes such variations visible and actionable. The ultimate aim is to develop a classification model that supports dynamic scenario testing and generates actionable, evidence-based insights.
The initial tripartite classification proposed in the Ljubljana case informs the generation of semantically meaningful zones, each of which can be assigned a set of KPIs relevant to its urban role. This logic supports the application of tailored optimisation strategies and allows further integration of auxiliary datasets (e.g., POIs, impervious surfaces, canopy cover) for multi-criteria assessments. While the Ljubljana demonstration currently serves as an operational prototype, not a fully validated application, we have planned several measures to strengthen the framework. In particular, quantitative validation will be performed using statistical tests and machine learning models to evaluate the internal consistency and predictive power of the classification logic; stakeholder engagement will be pursued through structured workshops and consultations with municipal and planning stakeholders to assess the interpretability and usability of the framework outputs; and scenario-based simulations will be conducted to test the responses of different typologies under hypothetical policy or infrastructure interventions, thereby evaluating the robustness and adaptability of the optimisation mechanisms.

3.1. Reference Data Layers: Building Footprints, Population Counts and Land Use

Building footprints. The use of the building footprints’ layer, akin to traditional typo-morphological analysis, addressed the build-up range across different parts of the studied city. This classification has the potential to further inform indicators of area compactness, neighbourhood/district accessibility, and land permeability. In terms of digital geometry, building footprints are typically represented by polygons, denoting the building’s location, shape, dimensions, and area. They also provide information on spatial characteristics such as building distribution, floor space ratio, and the relationship between buildings and other objects (e.g., topology, orientation and proximity) [56]. The building footprints are commonly stored and displayed by vector data, allowing individual features to be linked with attributes (e.g., building height, type, use, occupancy, etc.). There are various sources for collecting building footprints from datasets, such as national cadastral maps, high-resolution satellite images, and open source projects (e.g., GlobalML Building Footprints [57] or EUBUCCO [58]). For demonstration purposes in the Slovenia (Ljubljana) case, we propose EUBUCCO, a scientific database of individual building footprints for 200+ million buildings across the 27 countries of the European Union. A 250 m × 250 m grid is initially applied to define classes based on their physical structures and contextual relationship with nearby objects. Metrics such as size, form, proximity to other buildings, and building compactness can be extracted using Momepy [59]. Momepy is an urban morphology Python library developed for OSM, enabling the creation of homogeneous categories by amalgamating neighbouring squares, thus establishing contiguous zones with analogous building compositions. The underlying principle posits that structures resembling each other in shape and size and situated in close proximity are more likely to share the same occupancy type [33]. Moreover, descriptive attributes such as age, height and usage are commonly additionally provided in EUBUCCO or OSM; however, these are often incomplete [58,60]. To address these disparities, especially to compensate for the missing height of the objects, we can utilise a population data source to distinguish between the residential and non-residential areas and to discern the type of residential neighbourhoods accordingly.
Population counts. We tend to employ a high-resolution population density indicator to distinguish between residential and non-residential areas and to discern the type of residential neighbourhoods accordingly (high-rise, low-rise). Several open data possibilities exist; for instance, the comprehensive open access demographic collection WorldPop [61] covers most worldwide areas by spatial resolution of 3 arcseconds (or approx. 90 m × 65 m if demonstrated in Slovenia). In many instances, the accuracy of this population data collection can be validated (or exchanged) by equivalent national sources; many national statistics authorities keep high-resolution population statistics openly available. For demonstration purposes, located within Slovenia, we will be using equivalent 100 × 100 m grid demographic data from the National Slovene Census, easily available through the STAGE geoinformation portal13, provided by the Surveying and Mapping Authority of the Republic of Slovenia and the Statistical Office of the Republic of Slovenia.
Figure 3. The initial classification process in the demonstration phase (Ljubljana) will utilise three data layers: building footprints [58], population densities [62] and land use [63] (street-view demonstration by Google Street View, Google Inc., Mountain View, CA, United States, 2025).
Land 14 01505 g003
Land use. To complement data on building types and prevailing area function, we can additionally utilise a land use data layer sourced from the Copernicus Urban Atlas collection14. The dataset provides detailed land cover/land use maps for 788 urban regions across Europe every 6 years. The latest 2018 vector dataset includes 17 urban classes, each with a Minimum Mapping Unit (MMU) of 1 hectare (100 × 100 m). The classification defines continuous urban build fabric and assesses the level of compactness (ranging from high sealing level: S.L > 80% to low sealing Level S.L < 10%); it also differentiates between several main uses. However, the overlapping criteria in the classification taxonomy do not allow for distinguishing the use in the high-compactness subcategory of urban areas with dominant residential use or inner-city areas or central business district (see Figure 4). For example, a specific area labelled under this category cannot convey both building tissue compactness and distinguishing use concurrently. Consequently, we can only extract information on the three relevant non-residential uses (green/open/recreational urban areas, industrial/commercial/public/transport use areas, and brown/dump areas) to complement the building’s footprint and population layer. This allows us to differentiate between low-rise and high-rise residential typologies; nonetheless, this approach still fails to provide full insights into the vertical dimension of structures within non-residential zones.

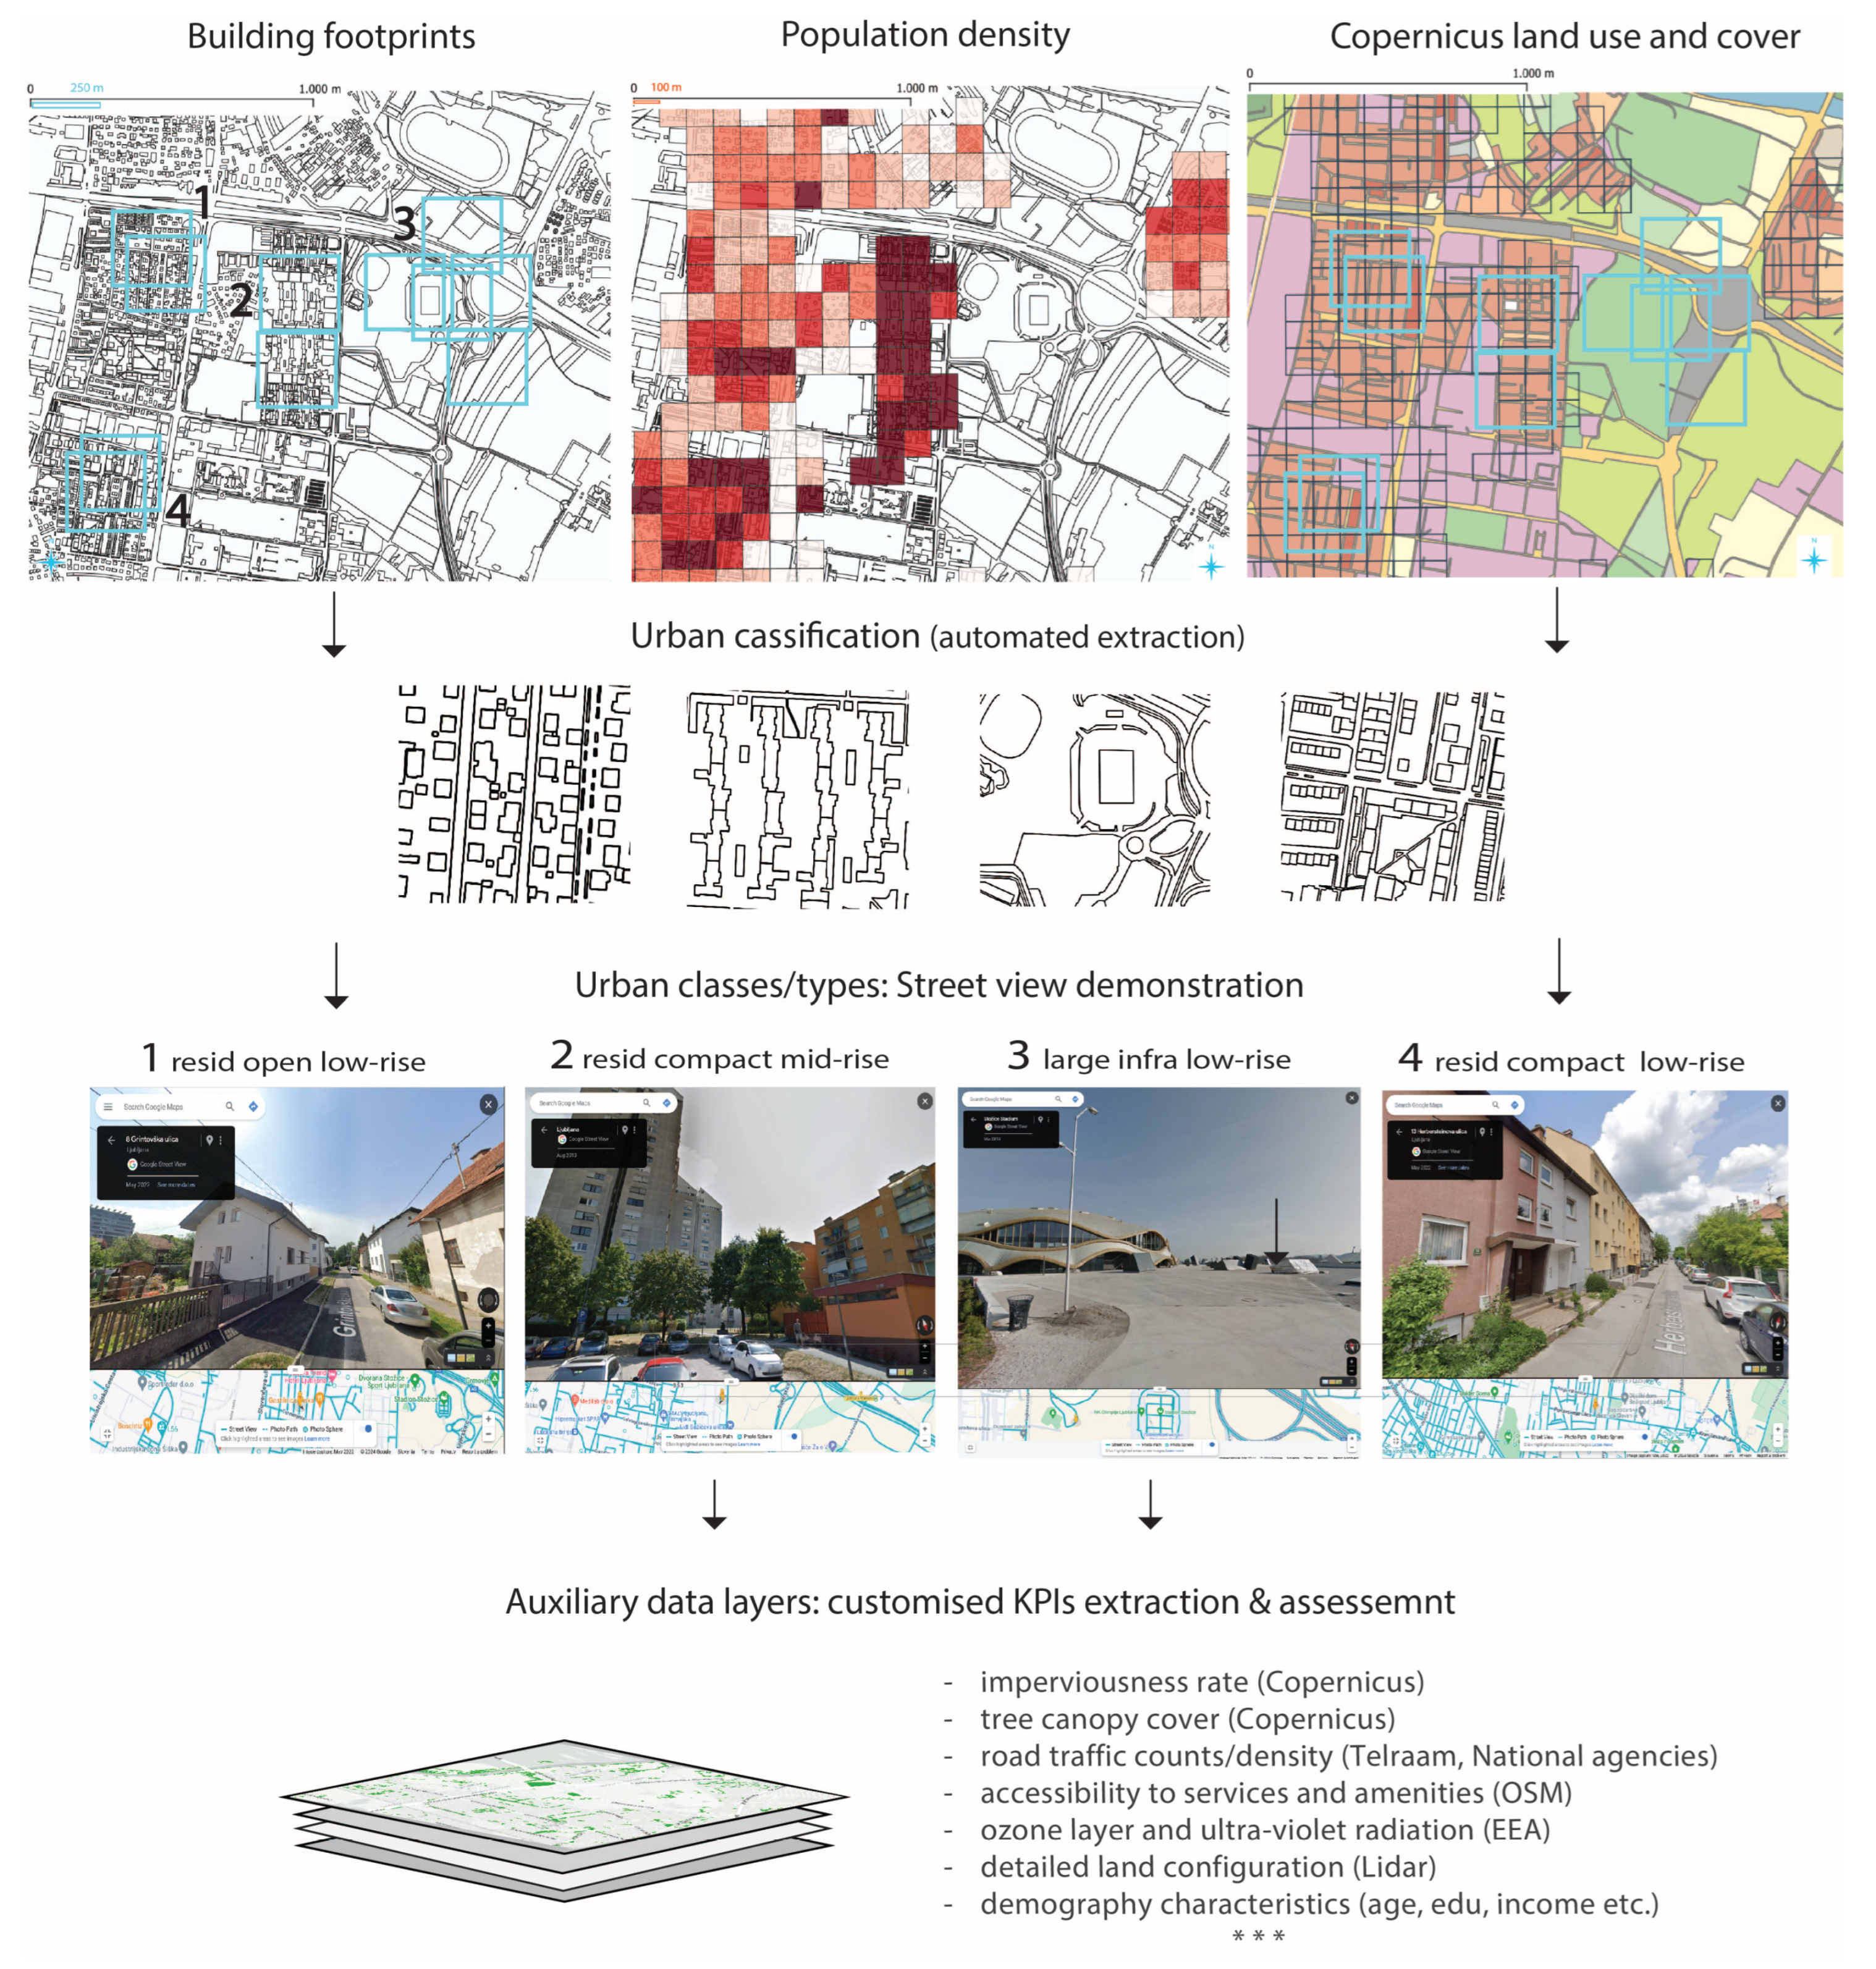
3.2. Potential Auxiliary Data Layers

Building height. The utilisation of building height datasets presents a potential solution to address the gap related to the incompleteness of data on the objects’ vertical dimensions. Copernicus data layer Building height 2012 (BH2012)15 released in 2018 brings a raster dataset with a resolution of 10 m, offering height information specifically for core urban areas within the capitals of the EEA38 countries. According to the validation study for Bratislava [65], the BH2012 database provides sufficiently accurate data for primary planning analyses and strategic purposes; however, for detailed studies focusing on the quality of life in cities at the local level, more precise identification of the building height is recommended. Complementing existing datasets with high-resolution LIDAR can provide a more comprehensive, accurate and up-to-date representation of building heights. Nonetheless, the applicability limitations include the restrained availability of LIDAR layers for some regions and the requirement of additional processing techniques to extract building height information.
Imperviousness. The datasets on imperviousness can assist in assessing the extent of land–sealing, which poses significant environmental risks due to impermeable barriers between the surface and underlying soil. The primary concerns include heightened surface runoff during rainstorms, elevating flood risks, and hampering the recharge of groundwater resources. Additionally, impervious surfaces exacerbate urban heat islands by absorbing heat, particularly evident in materials like concrete and asphalt [66]. The open Copernicus data portfolio with pan-European coverage comprises two land imperviousness products, namely the Imperviousness Build-up map that captures binary information, distinguishing between areas (building/non-building) within the sealing outline, and second, the Imperviousness Density which provides data on sealing density in the range from 0% to 100% encompassing all sealed areas, including built-up and non-building artificial covers.
POI distribution. Detailed urban land use patterns and an overview of various central services and amenities are some of the essentials for evaluating KPIs that assess the adequacy of infrastructure and resource distribution within urban districts, as well as to examine accessibility aspects. Associated analysis can leverage the POI concept and information for this purpose. POIs are geographic locations or landmarks that are significant for various reasons, such as tourism, commerce, or public services. Collecting POIs involves gathering data about these locations, including their coordinates, names, categories, and other relevant information from various sources (e.g., user data and check-ins, web scraping, governmental and NGOs databases, etc.). Many in-depth discussions suggest that user-generated POI data, with its universal availability and open access on a large scale, has great potential to reveal up-to-date urban land use patterns through the points’ semantic analysis and frequencies [24,67,68]. As stated by Psyllidis et al. [25], the digital POI as a type of contemporary social sensing data can effectively present urban functions and temporal dynamics of geographic entities, capturing high correlation to activities like jobs, tourism, recreation, and wayfinding. Based on the massive use of mobile devices and big-tech social platforms and mapping/navigation resources (e.g., Twitter, Instagram, Google Places, OpenStreetMap), POI-based information forms a new data ecosystem characterised by rich attributes and high location-time granularity. Advanced algorithms have been used to understand the internal structure of cities by building mathematical models of POIs and relations among them [49,69]. These, as described by Xu et al. [69], predominantly fall into two categories: a feature-frequency-based method and a semantic-analysis-based method. The feature-frequency-based method can be used to classify land use by counting regional indicators extracted from POI attributes. Similarly, the semantic-analysis-based method can leverage natural language processing (NLP) technology to extract contextual features or interpret the frequencies.
Canopy street cover. In densely sealed and built-up areas, the presence of street trees and their canopies plays an important role in maintaining ecological balance and enhancing urban livability. Beyond their contributions to carbon reduction and soil erosion prevention, urban tree canopies play a significant role in moderating local temperatures and humidity levels through shading, thereby mitigating the effects of heat islands and hot spots at the micro-local levels [55]. Additionally, they assist in managing stormwater runoff [70]. While larger tree-covered areas within cities, such as parks, are relatively well documented, data on small-scale, scattered tree canopies are scarce, despite their significant role in the micro-local aspect of liveability. In the urban types where canopy presence is relevant for quality assessments, we can use a blend of three Copernicus products, the high-resolution Street Tree Layer [71], Tree Cover Density Layer [72] and the Small Woody Features Layer [73], all accessible for the European region. The Tree Cover Density Layer provides information on the percentage of tree cover at spatial resolutions of 10 m and 100 m for the reference year 2018. Renowned for its three-year update cycle and high-resolution data, this product is widely considered one of the finest publicly available European tree cover maps. Urban Atlas Street Tree Layer provides a separate layer of Urban Atlas 2018, showing contiguous rows or patches of trees covering 500 m2 or more and with a Minimum Mapping Width (MMW) of 10 m over “artificial surfaces” (nomenclature class 1 in Urban Atlas) inside each Functional Urban Area (FUA). The dataset is available as vector data. Moreover, the Small Woody Features Layer, additionally provides pan-European-level information on linear structures such as hedgerows, as well as patches of woody features for the 2018 reference year.

4. Discussion

To frame a well-transferable and broadly applicable urban nomenclature in the first categorisation cycle, we leaned upon the existing literature, specifically delving into the typification of metropolitan and densely populated urban areas, higher on a spectrum of urbanity. We are partly drawing upon the Local Climate Zone (LCZ) framework initially designed for urban climate investigations that has been widely examined [54]. It delineates common and generic urban types with a minimum diameter between 400 and 1000 m [55]. This classification system relies on universally applicable, standardised, and easily quantifiable urban parameters. It categorises urban landscapes based on attributes according to surface structure (height, spacing of buildings and trees) and surface cover (perviousness rate), refining the patterns to the most probable, logical urban prototypes. The standard set is divided into 10 recognisable “built types” ranging from compact high-rise to industrial. As such, it serves as a footing for refining the boundaries of urban areas, providing a robust framework to comprehensively tackle climate change challenges. Specifically, the surface structure influences the local climate by altering airflow patterns, atmospheric heat distribution, and the balance of shortwave and longwave radiation. Meanwhile, surface cover impacts albedo, moisture retention, and the ground’s heating and cooling capacity [54,55]. These attributes often exhibit adopted local clustering, indicating that in areas where the ratio of building height to width is substantial, there is a concurrent rise in both the proportion of impermeable surfaces and the density of urban construction materials. Over the years, the system has broadened its scope beyond urban heat island research and is now utilised in various fields, including urban planning [74], building energy consumption [75], and urban thermal comfort [76]. Therefore, we consider this approach recurrently applicable for subsequent clustering analysis, especially when complementing the initial practice with advanced classifier techniques and improved data collection methodologies. In parallel, the urban structure type (UST) approach has gained traction within the remote sensing and urban morphology communities. USTs are defined by specific spatial characteristics, e.g., the morphology and spatial relationships between urban features such as buildings, street networks, green plots, etc. [77,78]. Lehnen et al. [78] formulate a generic structural and object-based typology, enabling hierarchically and terminologically consistent USTs. Their classification focuses on morphology and the exterior appearance of buildings, specifying data requirements for proper implementation. In a recent study [79], USTs are used with building footprints to examine how neighbourhood morphology varies across large U.S. metropolitan areas, incorporating unsupervised classification and regression models to explore socioeconomic and demographic correlations. Similarly, Zhang’s review [52] outlines six core typological dimensions relevant to “sustainable urban morphology,” including urban tissue configurations, street networks, building-plot characteristics, greenspaces, land use, and growth. While the LCZ framework categorises urban landscapes based on surface structure and cover, and USTs deliver insights into morphology and layout, our research seeks to systematically extend both frameworks. We do this by integrating generic layers of socioeconomic, environmental, and infrastructural data that enhance the classification’s relevance to policy and planning contexts. This layering acts as a set of “soft filters,” adding nuance to typological categories. For instance, two areas sharing the same LCZ type may differ dramatically in vulnerability to flooding or heatwaves depending on their socioeconomic composition, green infrastructure, or building materials. Likewise, morphologically similar USTs may vary in resilience due to differences in public transport connectivity or environmental buffers. These multidimensional perspectives facilitate both enhanced classification and context-specific vulnerability analysis. Furthermore, the integration of diverse data layers enables validation through cross-referencing and provides a foundation for scenario modelling. For example, simulations could test the impact of tree canopy expansion in a densely built LCZ or the effect of improved transit accessibility in a sprawling UST. Such predictive capabilities transform the framework from a static classification tool into a strategic planning support system. It is also important to acknowledge that urban typologies, though derived from shared attributes, may behave differently across cities due to local planning practices, cultural factors, or infrastructural baselines. This variation can affect both classification accuracy and the transferability of recommended interventions.

5. Conclusions

The proposed analytical classification framework introduces a methodological step in urban typology classification by merging established spatial classification schemes with adaptive data layering and predictive planning capabilities. It goes beyond static categorisation, enabling planners to simulate, evaluate, and optimise interventions in a context-sensitive and resource-efficient manner. The framework’s open-data-driven, modular structure ensures adaptability across urban scales and geographies, ranging from dense megacities to emerging peri-urban settlements. Its transformative value lies not just in its integrative scope but in its future-forward adaptability. We envision a living classification system – one that dynamically evolves through continuous data inputs and machine learning feedback loops. Such a system could redefine typologies in near-real time, reacting to climatic events, infrastructural changes, or demographic transitions. The integration of high-frequency data streams (e.g., air quality, energy use, mobility flows) will unlock new dimensions of urban diagnostics and enhance operational decision making. Further research should focus on two priority areas: (1) incorporating real-time urban analytics to move beyond static snapshots, and (2) refining machine learning pipelines that allow automated updating of typologies and KPIs. Long-term, this could support the development of responsive urban governance platforms capable of deploying targeted, evidence-based strategies in a time-sensitive manner. Ultimately, this framework aspires to function as a cognitive scaffold for cities: offering a shared spatial language, a means of comparison, and a strategic compass for transition toward climate-neutral, inclusive, and resilient urban futures.

Author Contributions

Conceptualization, Š.V. and M.M.; investigation, Š.V. and M.M.; writing—original draft preparation, Š.V. and M.M.; visualization, Š.V. and M.M.; writing—review and editing, Š.V. and M.M. All authors have read and agreed to the published version of the manuscript.

Funding

The research was supported by the Development Fund of the University of Ljubljana (UL) and scientific-research programmes P5-0068 and P2-0359, both financed by the Slovenian Research and Innovation Agency (ARIS).

Data Availability Statement

Not applicable.

Acknowledgments

The research was supported by the Development Fund of the University of Ljubljana (UL) and scientific-research programmes P5-0068 and P2-0359, both financed by the Slovenian Research and Innovation Agency (ARIS). We thank Ana Halužan Vasle and members of the interdisciplinary team within the UL Development Fund project for their support/contribution.

Conflicts of Interest

The authors declare no conflicts of interest. The funders had no role in the design of the study; in the collection, analyses, or interpretation of data; in the writing of the manuscript; or in the decision to publish the results.

Notes

1
In this paper, the term analytical classification framework refers to a structured computational framework and methodological workflow. It integrates open source spatial data, analytics, and classification methods, and serves as a conceptual structure for organising the analysis.
2
European strategy for data: https://digital-strategy.ec.europa.eu/en/policies/strategy-data (accessed on 7 February 2025).
3
Copernicus: https://www.copernicus.eu/en (accessed on 19 February 2025).
4
European Environmental Agency: https://www.eea.europa.eu/en (accessed on 16 February 2025).
5
European Data Portal: https://data.europa.eu/en (accessed on 12 March 2025).
6
OpenAIRE: https://www.openaire.eu/ (accessed on 17 February 2025).
7
European Open Science Cloud: https://eosc.eu/eosc-about/ (accessed on 17 February 2025).
8
e.g., Geofabrik Downloads: https://download.geofabrik.de/; the Pyrosm API: https://pyrosm.readthedocs.io/en/latest/; Overpass API: http://overpass-api.de/ or QGIS: https://www.qgis.org/en/site/ plug-ins such as QuickOSM: https://plugins.qgis.org/plugins/QuickOSM/; OSMDownloader: https://plugins.qgis.org/plugins/OSMDownloader/ (all accessed on 7 February 2025).
9
Telraam: https://telraam.net/ (accessed on 7 February 2025).
10
sensor.community: https://sensor.community/en/ (accessed on 7 February 2025).
11
12
POIs primarily denote amenities and central functions, not necessarily related to genuine interest as the term might imply.
13
Statistical Office of the Republic of Slovenia. https://gis.stat.si/ (accessed on 7 February 2025).
14
Urban Atlas Land Cover, Land Use 2018. 10.2909/fb4dffa1-6ceb-4cc0-8372-1ed354c285e6 (accessed on 18 February 2025).
15
Urban Atlas Building Height 2012. https://land.copernicus.eu/en/products/urban-atlas/building-height-2012 (accessed on 12 February 2025).

References

  1. Connections Between the Paris Agreement and the 2030 Agenda. 2021. Available online: https://www.sei.org/wp-content/uploads/2019/08/connections-between-the-paris-agreement-and-the-2030-agenda.pdf (accessed on 16 March 2025).
  2. United Nations. The 2030 Agenda for Sustainable Development. 2015. Available online: https://sdgs.un.org/sites/default/files/publications/21252030%20Agenda%20for%20Sustainable%20Development%20web.pdf (accessed on 16 March 2025).
  3. European Commission. The European Green Deal. 2019. Available online: https://www.esdn.eu/fileadmin/ESDN_Reports/ESDN_Report_2_2020.pdf (accessed on 16 March 2025).
  4. Angelakoglou, K.; Nikolopoulos, N.; Giourka, P.; Svensson, I.L.; Tsarchopoulos, P.; Tryferidis, A.; Tzovaras, D. A methodological framework for the selection of key performance indicators to assess smart city solutions. Smart Cities 2019, 2, 269–306. [Google Scholar] [CrossRef]
  5. Stavroulaki, I.; Pont, M.B. A systematic review of the scientific literature on the theme of multi-functional streets. In Proceedings of the IOP Conference Series: Earth and Environmental Science; IOP Publishing: Bristol, UK, 2020; Volume 588, p. 052046. [Google Scholar]
  6. Rossi, A. The Architecture of the City; MIT Press: Cambridge, MA, USA, 1984. [Google Scholar]
  7. Aymonino, C. La formazione di un moderno concetto di tipologia edilizia. Rapp. Tra La Morfol. Urbana E La Tipol. Edil. Doc. Del Corso Di Caratter. Distrib. Degli Edif. Anno Accad. 1965, 1966, 12–51. [Google Scholar]
  8. Leupen, B. Design and Analysis; 010 Publishers: Rotterdam, The Netherlands, 1997. [Google Scholar]
  9. Perez, J.; Fusco, G.; Araldi, A.; Fuse, T. Building typologies for urban fabric classification: Osaka and Marseille case studies. In Proceedings of the International Conference on Spatial Analysis and Modeling (SAM), Kuala Lumpur, Malaysia, 24–25 April 2018. [Google Scholar]
  10. Petruccioli, A. (Ed.) Exoteric—Polytheistic—Fundamentalist Typology: Gleanings in the Form of an Introduction. In Typological Process and Design Theory; Harvard University and Massachusetts Institute of Technology: Cambridge, MA, USA, 1998. [Google Scholar]
  11. Whitehand, J.W.R. Recent advances in urban morphology. Urban Stud. 1992, 29, 619–636. [Google Scholar] [CrossRef]
  12. Pinho, P.; Oliveira, V. Cartographic analysis in urban morphology. Environ. Plan. B Plan. Des. 2009, 36, 107–127. [Google Scholar] [CrossRef]
  13. Dibble, J.; Prelorendjos, A.; Romice, O.; Zanella, M.; Strano, E.; Pagel, M.; Porta, S. On the origin of spaces: Morphometric foundations of urban form evolution. Environ. Plan. B Urban Anal. City Sci. 2019, 46, 707–730. [Google Scholar] [CrossRef]
  14. Sneath, P.H.A.; Sokal, R. The principles and practice of numerical classification. Numer. Taxon. 1973, 573, 190–199. [Google Scholar]
  15. Alverti, M.N.; Themistocleous, K.; Kyriakidis, P.C.; Hadjimitsis, D.G. A study of the interaction of human smart characteristics with demographic dynamics and built environment: The case of Limassol, Cyprus. Smart Cities 2020, 3, 48–73. [Google Scholar] [CrossRef]
  16. Hall, P. Cities of Tomorrow: An Intellectual History of Urban Planning and Design Since 1880; John Wiley & Sons: Hoboken, NJ, USA, 2014. [Google Scholar]
  17. OpenStreetMap contributors. OpenStreetMap Data; Packt Publishing Ltd.: Mumbai, India, 2025. [Google Scholar]
  18. Biljecki, F.; Chow, Y.S.; Lee, K. Quality of crowdsourced geospatial building information: A global assessment of OpenStreetMap attributes. Build. Environ. 2023, 237, 110295. [Google Scholar] [CrossRef]
  19. Janež, M.; Verovšek, Š.; Zupančič, T.; Moškon, M. Citizen science for traffic monitoring: Investigating the potentials for complementing traffic counters with crowdsourced data. Sustainability 2022, 14, 622. [Google Scholar] [CrossRef]
  20. Yap, W.; Janssen, P.; Biljecki, F. Free and open source urbanism: Software for urban planning practice. Comput. Environ. Urban Syst. 2022, 96, 101825. [Google Scholar] [CrossRef]
  21. Zhou, Q.; Zhang, Y.; Chang, K.; Brovelli, M.A. Assessing OSM building completeness for almost 13,000 cities globally. Int. J. Digit. Earth 2022, 15, 2400–2421. [Google Scholar] [CrossRef]
  22. Haklay, M. How good is volunteered geographical information? A comparative study of OpenStreetMap and Ordnance Survey datasets. Environ. Plan. B Plan. Des. 2010, 37, 682–703. [Google Scholar] [CrossRef]
  23. Brovelli, M.A.; Zamboni, G. A new method for the assessment of spatial accuracy and completeness of OpenStreetMap building footprints. ISPRS Int. J. Geo-Inf. 2018, 7, 289. [Google Scholar] [CrossRef]
  24. Huang, W.; Cui, L.; Chen, M.; Zhang, D.; Yao, Y. Estimating urban functional distributions with semantics preserved POI embedding. Int. J. Geogr. Inf. Sci. 2022, 36, 1905–1930. [Google Scholar] [CrossRef]
  25. Psyllidis, A.; Gao, S.; Hu, Y.; Kim, E.K.; McKenzie, G.; Purves, R.; Yuan, M.; Andris, C. Points of Interest (POI): A commentary on the state of the art, challenges, and prospects for the future. Comput. Urban Sci. 2022, 2, 20. [Google Scholar] [CrossRef] [PubMed]
  26. Yap, W.; Stouffs, R.; Biljecki, F. Urbanity: Automated modelling and analysis of multidimensional networks in cities. NPJ Urban Sustain. 2023, 3, 45. [Google Scholar] [CrossRef]
  27. Conzen, M.R.G. Alnwick, Northumberland: A study in town-plan analysis. Trans. Pap. (Inst. Br. Geogr.) 1960, 27, iii–122. [Google Scholar] [CrossRef]
  28. Talen, E. City Rules: How Regulations Affect Urban Form; Island Press: Washington, DC, USA, 2012. [Google Scholar]
  29. Fischel, W.A. The Economics of Zoning Laws: A Property Rights Approach to American Land Use Controls; JHU Press: Baltimore, MD, USA, 1987. [Google Scholar]
  30. McLaughlin, R.B. Land use regulation: Where have we been, where are we going? Cities 2012, 29, S50–S55. [Google Scholar] [CrossRef]
  31. Alexiou, A.; Singleton, A.; Longley, P.A. A classification of multidimensional open data for urban morphology. Built Environ. 2016, 42, 382–395. [Google Scholar] [CrossRef]
  32. Abrantes, P.; Rocha, J.; Marques da Costa, E.; Gomes, E.; Morgado, P.; Costa, N. Modelling urban form: A multidimensional typology of urban occupation for spatial analysis. Environ. Plan. B Urban Anal. City Sci. 2019, 46, 47–65. [Google Scholar] [CrossRef]
  33. Fan, Y.; Ding, X.; Wu, J.; Ge, J.; Li, Y. High spatial-resolution classification of urban surfaces using a deep learning method. Build. Environ. 2021, 200, 107949. [Google Scholar] [CrossRef]
  34. Liu, Y.; Lu, S.; Lu, X.; Wang, Z.; Chen, C.; He, H. Classification of urban hyperspectral remote sensing imagery based on optimized spectral angle mapping. J. Indian Soc. Remote Sens. 2019, 47, 289–294. [Google Scholar] [CrossRef]
  35. Kuras, A.; Brell, M.; Rizzi, J.; Burud, I. Hyperspectral and lidar data applied to the urban land cover machine learning and neural-network-based classification: A review. Remote Sens. 2021, 13, 3393. [Google Scholar] [CrossRef]
  36. Wang, J.; Huang, W.; Biljecki, F. Learning visual features from figure-ground maps for urban morphology discovery. Comput. Environ. Urban Syst. 2024, 109, 102076. [Google Scholar] [CrossRef]
  37. Yu, T.; Sützl, B.S.; van Reeuwijk, M. Urban neighbourhood classification and multi-scale heterogeneity analysis of Greater London. Environ. Plan. B Urban Anal. City Sci. 2023, 50, 1534–1558. [Google Scholar] [CrossRef]
  38. Serrano-Estrada, L.; Martí, P.; Bernabeu-Bautista, Á.; Huskinson, M. Mapping heritage engagement in historic centres through social media insights and accessibility analysis. Land 2024, 13, 1972. [Google Scholar] [CrossRef]
  39. Malah, A.; Bahi, H. Integrated multivariate data analysis for Urban Sustainability Assessment, a case study of Casablanca city. Sustain. Cities Soc. 2022, 86, 104100. [Google Scholar] [CrossRef]
  40. Blanco, L.; Alhamwi, A.; Schiricke, B.; Hoffschmidt, B. Data-driven classification of Urban Energy Units for district-level heating and electricity demand analysis. Sustain. Cities Soc. 2024, 101, 105075. [Google Scholar] [CrossRef]
  41. Amado, M.; Poggi, F. (Eds.) Chapter 7—Morphological Analysis. In Sustainable Energy Transition for Cities; Elsevier: Amsterdam, The Netherlands, 2022; pp. 89–122. [Google Scholar] [CrossRef]
  42. De Oliveira, R.; Carneiro, C.d.C.; De Almeida, F.; de Oliveira, B.; Nunes, E.; dos Santos, A. Multivariate air pollution classification in urban areas using mobile sensors and self-organizing maps. Int. J. Environ. Sci. Technol. 2019, 16, 5475–5488. [Google Scholar] [CrossRef]
  43. Grafius, D.R.; Corstanje, R.; Harris, J.A. Linking ecosystem services, urban form and green space configuration using multivariate landscape metric analysis. Landsc. Ecol. 2018, 33, 557–573. [Google Scholar] [CrossRef] [PubMed]
  44. Yu, B.; Wang, Z.; Mu, H.; Sun, L.; Hu, F. Identification of urban functional regions based on floating car track data and POI data. Sustainability 2019, 11, 6541. [Google Scholar] [CrossRef]
  45. Su, Y.; Zhong, Y.; Zhu, Q.; Zhao, J. Urban scene understanding based on semantic and socioeconomic features: From high-resolution remote sensing imagery to multi-source geographic datasets. ISPRS J. Photogramm. Remote Sens. 2021, 179, 50–65. [Google Scholar] [CrossRef]
  46. Liu, X.; He, J.; Yao, Y.; Zhang, J.; Liang, H.; Wang, H.; Hong, Y. Classifying urban land use by integrating remote sensing and social media data. Int. J. Geogr. Inf. Sci. 2017, 31, 1675–1696. [Google Scholar] [CrossRef]
  47. McKenzie, G.; Janowicz, K. The effect of regional variation and resolution on geosocial thematic signatures for points of interest. In Proceedings of the Societal Geo-Innovation: Selected Papers of the 20th AGILE Conference on Geographic Information Science; Springer: Berlin/Heidelberg, Germany, 2017; pp. 237–256. [Google Scholar]
  48. Andrade, R.; Alves, A.; Bento, C. POI mining for land use classification: A case study. ISPRS Int. J. Geo-Inf. 2020, 9, 493. [Google Scholar] [CrossRef]
  49. Huang, H.; Huang, J.; Chen, B.; Xu, X.; Li, W. Recognition of Functional Areas in an Old City Based on POI: A Case Study in Fuzhou, China. J. Urban Plan. Dev. 2024, 150, 04024001. [Google Scholar] [CrossRef]
  50. Xu, Y.; Jin, S.; Chen, Z.; Xie, X.; Hu, S.; Xie, Z. Application of a graph convolutional network with visual and semantic features to classify urban scenes. Int. J. Geogr. Inf. Sci. 2022, 36, 2009–2034. [Google Scholar] [CrossRef]
  51. Li, F.; Yigitcanlar, T.; Nepal, M.; Nguyen, K.; Dur, F. Machine learning and remote sensing integration for leveraging urban sustainability: A review and framework. Sustain. Cities Soc. 2023, 96, 104653. [Google Scholar] [CrossRef]
  52. Zhang, P.; Ghosh, D.; Park, S. Spatial measures and methods in sustainable urban morphology: A systematic review. Landsc. Urban Plan. 2023, 237, 104776. [Google Scholar] [CrossRef]
  53. Fleischmann, M.; Romice, O.; Porta, S. Measuring urban form: Overcoming terminological inconsistencies for a quantitative and comprehensive morphologic analysis of cities. Environ. Plan. B Urban Anal. City Sci. 2021, 48, 2133–2150. [Google Scholar] [CrossRef]
  54. Han, J.; Mo, N.; Cai, J.; Ouyang, L.; Liu, Z. Advancing the local climate zones framework: A critical review of methodological progress, persisting challenges, and future research prospects. Humanit. Soc. Sci. Commun. 2024, 11, 1–18. [Google Scholar] [CrossRef]
  55. Stewart, I.D.; Oke, T.R. Local Climate Zones for Urban Temperature Studies. Bull. Am. Meteorol. Soc. 2012, 93, 1879–1900. [Google Scholar] [CrossRef]
  56. Hazarika, M.; Nashrrullah, S.; Alam, M.; Chen, L.; van Westen, C.; Dwijananto, A.; Roxas, M. Building Footprint Maps. 2014. Available online: https://www.cdema.org/virtuallibrary/index.php/charim-hbook/data-management-book/5-elements-at-risk-data/5-2-building-footprint-maps (accessed on 16 March 2025).
  57. Microsoft. Global ML Building Footprints, 2025. Open Data Commons Open Database License (ODbL). Available online: https://gee-community-catalog.org/projects/msbuildings/ (accessed on 16 March 2025).
  58. Milojevic-Dupont, N.; Wagner, F.; Nachtigall, F.; Hu, J.; Brüser, G.B.; Zumwald, M.; Biljecki, F.; Heeren, N.; Kaack, L.H.; Pichler, P.P.; et al. EUBUCCO v0. 1: European building stock characteristics in a common and open database for 200+ million individual buildings. Sci. Data 2023, 10, 147. [Google Scholar] [CrossRef] [PubMed]
  59. Fleischmann, M. Momepy: Urban morphology measuring toolkit. J. Open Source Softw. 2019, 4, 1807. [Google Scholar] [CrossRef]
  60. Atwal, K.S.; Anderson, T.; Pfoser, D.; Züfle, A. Predicting building types using OpenStreetMap. Sci. Rep. 2022, 12, 19976. [Google Scholar] [CrossRef] [PubMed]
  61. Chen, R.; Yan, H.; Liu, F.; Du, W.; Yang, Y. Multiple global population datasets: Differences and spatial distribution characteristics. ISPRS Int. J. Geo-Inf. 2020, 9, 637. [Google Scholar] [CrossRef]
  62. Statistical Office of the Republic of Slovenia. GIS Application—Statistical Office of the Republic of Slovenia; Statistical Office of the Republic of Slovenia: Ljubljana, Slovenia, 2025.
  63. European Environment Agency. Urban Atlas Land Cover/Land Use 2018 (Vector), Europe, 6-Yearly, July 2021; European Environment Agency: Copenhagen, Denmark, 2021. [Google Scholar]
  64. European Environment Agency. Mapping Guide for a European Urban Atlas; European Environment Agency: Copenhagen, Denmark, 2011. [Google Scholar]
  65. Szatmári, D.; Kopecká, M.; Feranec, J. Accuracy Assessment of the Building Height Copernicus Data Layer: A Case Study of Bratislava, Slovakia. Land 2022, 11, 590. [Google Scholar] [CrossRef]
  66. Sohn, W.; Kim, J.H.; Li, M.H.; Brown, R.D.; Jaber, F.H. How does increasing impervious surfaces affect urban flooding in response to climate variability? Ecol. Indic. 2020, 118, 106774. [Google Scholar] [CrossRef]
  67. Barlacchi, G.; Lepri, B.; Moschitti, A. Land use classification with point of interests and structural patterns. IEEE Trans. Knowl. Data Eng. 2020, 33, 3258–3269. [Google Scholar] [CrossRef]
  68. Fan, J.; Thakur, G. Towards POI-based large-scale land use modeling: Spatial scale, semantic granularity, and geographic context. Int. J. Digit. Earth 2023, 16, 430–445. [Google Scholar] [CrossRef]
  69. Xu, Y.; Zhou, B.; Jin, S.; Xie, X.; Chen, Z.; Hu, S.; He, N. A framework for urban land use classification by integrating the spatial context of points of interest and graph convolutional neural network method. Comput. Environ. Urban Syst. 2022, 95, 101807. [Google Scholar] [CrossRef]
  70. Mullaney, J.; Lucke, T.; Trueman, S.J. A review of benefits and challenges in growing street trees in paved urban environments. Landsc. Urban Plan. 2015, 134, 157–166. [Google Scholar] [CrossRef]
  71. Copernicus Land Monitoring Service. Urban Atlas Street Tree Layer (STL) 2018. 2018. Available online: https://land.copernicus.eu/en/products/urban-atlas/street-tree-layer-stl-2018 (accessed on 18 March 2025).
  72. Copernicus Land Monitoring Service. Tree Cover Density 2018. 2018. Available online: https://land.copernicus.eu/en/products/high-resolution-layer-forests-and-tree-cover/tree-cover-density-2018-raster-10-m-100-m-europe-yearly (accessed on 18 March 2025).
  73. Copernicus Land Monitoring Service. Small Woody Features 2018. 2018. Available online: https://land.copernicus.eu/en/products/high-resolution-layer-small-woody-features/small-woody-features-2018 (accessed on 18 March 2025).
  74. Kopp, J.; Frajer, J.; Novotná, M.; Preis, J.; Dolejš, M. Comparison of ecohydrological and climatological zoning of the cities: Case study of the city of Pilsen. ISPRS Int. J. Geo-Inf. 2021, 10, 350. [Google Scholar] [CrossRef]
  75. Benjamin, K.; Luo, Z.; Wang, X. Crowdsourcing urban air temperature data for estimating urban heat island and building heating/cooling load in London. Energies 2021, 14, 5208. [Google Scholar] [CrossRef]
  76. Wu, J.; Liu, C.; Wang, H. Analysis of Spatio-temporal patterns and related factors of thermal comfort in subtropical coastal cities based on local climate zones. Build. Environ. 2022, 207, 108568. [Google Scholar] [CrossRef]
  77. Bochow, M.; Taubenböck, H.; Segl, K.; Kaufmann, H. An automated and adaptable approach for characterizing and partitioning cities into urban structure types. In Proceedings of the 2010 IEEE International Geoscience and Remote Sensing Symposium, Honolulu, HI, USA, 25–30 July 2010; pp. 1796–1799. [Google Scholar]
  78. Lehner, A.; Blaschke, T. A generic classification scheme for urban structure types. Remote Sens. 2019, 11, 173. [Google Scholar] [CrossRef]
  79. Durst, N.J.; Sullivan, E.; Jochem, W.C. The spatial and social correlates of neighborhood morphology: Evidence from building footprints in five US metropolitan areas. PLoS ONE 2024, 19, e0299713. [Google Scholar] [CrossRef] [PubMed]
Figure 1. The proposed computational framework for classification and optimisation of urban environments in the context of their typological classification. The workflow consists of five main steps: data acquisition, typological classification, environment assessment, improvement recommendations with in silico validation and environment optimisation.
Land 14 01505 g001
Figure 2. The iterative recursive loop in the analytical process tends to enhance the accuracy of the recommendation engine by incorporating real outcomes, allowing it to learn from actual scenarios and progressively refine its recommendations. Following the successful real-world implementation of an intervention, both the recommendation engine and the simulation environment will be updated with the actual assessment of indicators resulting from the intervention.
Land 14 01505 g002
Figure 4. The Urban Atlas nomenclature presents several limitations for detailed artificial surfaces classification when used in isolation: the urban fabric classes 1.1.1 and 1.1.2 are distinguished solely by their degree of soil sealing, not by building type (e.g., single-family houses or apartment blocks). Additionally, the class predominant residential use denotes areas with a high degree of soil sealing, regardless of the housing scheme (single-family homes, high-rise dwellings, city centre, or suburb). Nomenclature source: [64].
Land 14 01505 g004
Table 1. Illustrative relation between exemplar urban typologies, selected KPIs, and typical intervention levers.
Generic Urban TypologyIllustrative KPIsTypical Intervention Levers
Low-rise residential fabric
(Dispersed/single-family dominant)
  • Impervious surface ratio.
  • Population-weighted accessibility to daily services.
  • Street/tree canopy coverage.
  • Mode share of active travel.
  • Per capita energy demand for space heating.
  • Retrofit detached housing for envelope efficiency.
  • Strengthen last-mile public transport and micro-mobility hubs.
  • Replace asphalt with permeable surfaces to reduce runoff.
  • Expand pocket parks and street trees to increase canopy coverage.
High-rise residential fabric
(Compact apartment blocks)
  • Sky-view factor/average building height-to-width.
  • Day–night land-surface temperature anomaly.
  • Net indoor cooling demand per dwelling.
  • Green-space accessibility within 300 m.
  • Lift and stair utilisation index.
  • Cool-roof or reflective façade retrofits.
  • Photovoltaic canopy and battery storage on flat roofs.
  • Courtyard or rooftop greening to reduce microclimate stress.
  • Indoor ventilation upgrades integrated with energy management systems.
Non-residential & mixed-use activity zones
(Industrial, commercial, civic, or transport hubs)
  • Delivery trips per business unit (daily avg.).
  • Hourly PM2.5/NOx concentration at kerbside sensors.
  • Share of renewable electricity in site demand.
  • Percent of workers within 15 min transit catchment.
  • Water runoff coefficient.
  • Consolidated urban logistics depots and last-mile e-cargo fleets.
  • Electrification of process heat and fleets via PV + storage.
  • Stormwater attenuation retrofits (green roofs, bioswales).
  • Transit-oriented development incentives for large employers.
Disclaimer/Publisher’s Note: The statements, opinions and data contained in all publications are solely those of the individual author(s) and contributor(s) and not of MDPI and/or the editor(s). MDPI and/or the editor(s) disclaim responsibility for any injury to people or property resulting from any ideas, methods, instructions or products referred to in the content.

