Abstract
Assessing the risks associated with waste disposal is essential for environmental protection and sustainable development, especially given concerns about the impact of industrial activities on the environment. This study analyses soil contamination in the Defor Petrila tailings-dump area caused by the deposition of waste material resulting from coal exploitation. To characterise the heavy-metal contamination in detail, we applied a comprehensive methodology that includes the calculation of the geo-accumulation index (Igeo), contamination factor (Cf), and potential ecological risk index (PERI), along with an analysis of the heavy-metal concentration isolines and a statistical analysis using the Pearson correlation coefficient. The results reveal varying levels of heavy-metal concentrations, as indicated by the calculated indices. The findings underscore the need for remediation and ongoing monitoring to mitigate the environmental impacts. This study provides a scientific basis for decision making in environmental management and highlights the importance of assessing mining-waste disposal near human settlements using various contamination-assessment methods.
1. Introduction
Soil is a vital natural resource that supports life, agriculture, and ecosystem functions [1,2]. The importance of sustainable soil and land management is globally recognised and reflected in international policy agendas, such as the United Nations Sustainable Development Goals (SDGs), Global Soil Partnership Initiatives, and programmes of the United Nations Environment Programme (UNEP) [3]. Soil contamination, defined as the introduction of biochemicals or other modifications to the natural soil environment, is a growing threat worldwide [4,5]. Industrial, agricultural, and inappropriate waste management activities exacerbate this problem, endangering human health, food security, and ecosystem stability [6,7,8,9].
One of the major causes of soil pollution is the mining industry, particularly processes involving the extraction of fossil fuels such as coal. The mining sector produces large quantities of tailings resulting from coal processing, which contain various heavy metals, such as lead, cadmium, chromium, cobalt, and nickel, but also other harmful compounds [10,11,12]. This waste, stored in an uncontrolled manner, can contaminate soil, surface water, and groundwater, affecting the local landscape and causing biodiversity loss in the area. These tailings represent a significant obstacle to the restoration of affected regions and the sustainable development of nearby populations [13]. The ecological effect of mining operations often continues long after the end of exploitation [14,15].
For the development of effective soil-contamination remediation-management strategies, an essential step is an ecological risk assessment. To assess the degree of contamination and the potential harmful effects of pollutants, several types of methods are used, namely, contamination indices (geo-accumulation index (Igeo), potential ecological risk index (PERI), and contamination factor (Cf)) and statistical analyses (Pearson’s correlation coefficient and analyses of heavy-metal concentration isolines, which can help identify relationships between different pollutants and understand contamination processes in the studied area).
Research conducted at mining sites in China, South Africa, and Brazil has revealed the negative consequences of heavy metals present in soil in significant quantities on the environment and human health [16,17,18,19]. These studies highlight the importance of integrated methods for assessing and controlling environmental hazards related to the cessation of mining activities, which include local environmental specificities and involve cooperation between researchers, authorities, and communities [20,21].
In this context, the present study is based on soil contamination caused by the storage of waste material resulting from coal mining in the area of the Defor Petrila tailings dump. This area is characterised by a long history of mining activity, presenting particular interest in the assessment of the ecological impact of these tailings dump. This study applies an integrated methodology using contamination indices (geo-accumulation index, contamination factor, contamination degree, potential ecological risk index, and analysis of heavy-metal concentration isolines, as well as statistical analysis of the Pearson correlation coefficient) and assesses the degree of contamination with associated heavy metals. The results obtained will contribute to a better understanding of the impact of mining activities on soil and provide a scientific basis for the development of effective remediation strategies and management of tailings dumps.
2. Materials and Methods
2.1. Location and Description of the Study Area
The Defor tailings dump is a waste dump from coal mining. Located in the heart of the Jiu Valley, the Petrila mine is in the eastern part of the coal basin in the town of Petrila. From 1859 to 2015, this mine played an essential role in the economic and industrial development of the area, becoming a symbol of the efforts and sacrifices made by the miners. Going to a depth of approximately 1000 m underground, the mine represented not only a vital source of energy but also a true testimony to the passion for mining over the decades.
The Defor tailings dump occupies an area of 12,750 ha and a volume of 2,149,970 thousand m3 and is completely covered by naturally established arboreal vegetation, and at a distance of 200 m, the first human settlements can be observed. The construction of the tailings dump led to the formation of two lakes at a distance of 50–200 m from the base. These lakes were formed as a result of the tailings-dump process, namely, through the accumulation of groundwater and precipitation. They represent important elements in the tailings-dump landscape, with the potential to influence both local biodiversity and contaminant dynamics [22].
Figure 1 shows a general map of the region, its positioning in the national context, and a detailed satellite image of the study area.
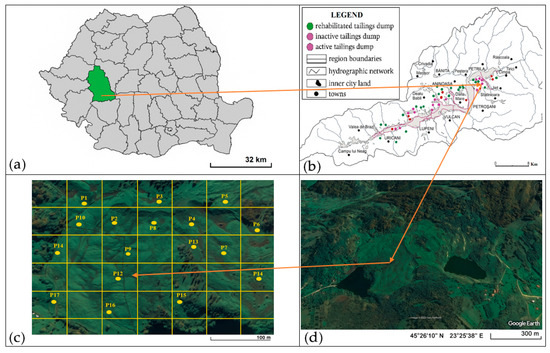
Figure 1.
Location of the study area: (a) administrative map of Romania highlighting Hunedoara County; (b) map of the Valea Jiului coal basin showing the locations of spoil heaps; (c) Google Earth aerial view of the Defor Petrila tailings dump with a grid overlay; (d) map of the Defor Petrila tailings dump with the 17 sampling points.
2.2. Soil Sampling
In accordance with OM 184/1997 [23], mapping of the Defor Petrila tailings dump was undertaken, and the area was subdivided into units of approximately 1 ha (Figure 1d). For each unit, an aggregate sample consisting of 10–20 equal subsamples (≈100 g) was collected along a zig-zag path (Figure 2), adapted to the microrelief, to ensure the representativeness of the aggregate samples. The subsamples were collected with a soil sampler and the organic residues removed, and they were homogenised in polyethylene bags and reduced to between 800 and 1000 g. The labelled samples were then transported to the laboratory for the determination of their heavy-metal content [24].
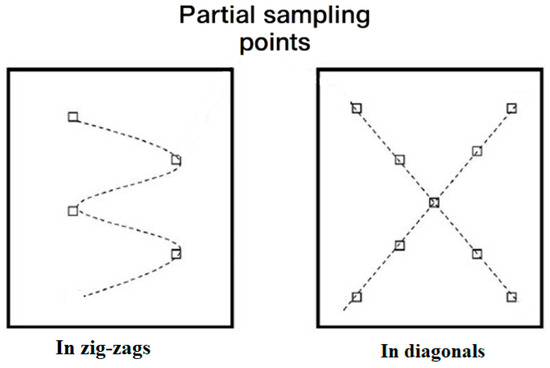
Figure 2.
Soil-sampling schemes: zig-zags and diagonal patterns.
2.3. Determination of the Presence of Heavy Metals in Soil Samples
To determine the heavy-metal content of soil samples taken from the Defor tailings dump, the inductively coupled plasma optical emission spectrometry (ICP-OES) technique was used with a Thermo Scientific iCAP PRO Series instrument [25,26]. The principle of this method involves extracting the air-dried soil sample with nitric acid solution, which was left at ambient temperature for 16 h. After this period, the sample underwent a reflux boiling process for 2 h [27]. The resulting extract was clarified and made up to volume with nitric acid. After the sample preparation, the analysis of heavy metals was performed by optical emission spectrometry, using calibration standards for the heavy metals of interest [28].
Figure 3 shows the instrument used to identify the presence of heavy metals in the soil samples taken from the Defor Petrila tailings dump.
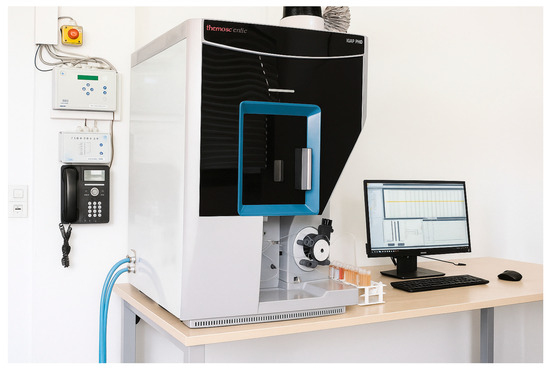
Figure 3.
Thermo Scientific iCAP PRO Series instrument.
To identify the presence of heavy metals in the soil samples from the Defor Petrila tailings dump, reference values for trace elements in soil, as specified in Order 756/1997 [29], were used (see Table 1).

Table 1.
Reference values for trace elements in soil.
2.4. Determination of the Geo-Accumulation Index of Heavy Metals in Soil
One frequently used method for assessing soil heavy-metal contamination is the geo-accumulation index (Igeo), originally developed by Müller in 1969 [30]. This method enables the assessment of contamination and the determination of the accumulation levels of these metals in a given area. In calculating this index, the measured metal concentrations in the soil samples were used, with the results compared against natural background values [31].
The geo-accumulation index was calculated using the following formula (Equation (1)):
- Cn—Metal concentration in the analysed sample (mg/kg−1 dry matter);
- Bn—Reference concentration of the metal in the soil (mg/kg−1 dry matter);
- 1.5—Associated with the correction factor due to the lithogen.
2.5. Determination of the Contamination Factor for Heavy Metals in the Tailings Dump
Another measure of soil heavy-metal contamination is the contamination factor (Cf).
This factor compares heavy-metal concentrations in analysed soils to background values (natural or reference), thereby indicating the level of anthropogenic contamination (Equation (2)), as follows:
- Cmetal—Heavy-metal concentration in the soil;
- Cbackground—Normal value for the respective heavy metal that can be found in the soil.
2.6. Pearson Correlation Coefficient Method for Analysing the Presence of Heavy Metals in Soil
The Pearson correlation matrix was used to assess associations among heavy-metal concentrations across tailings samples or different areas of the dump [32].
Using this matrix, the strength and direction of the relationships among heavy-metal concentrations can be evaluated.
Patterns or trends in the distribution of heavy metals within the tailings dump can thereby be identified. This information is valuable for informing decisions on remediation and monitoring of heavy-metal contamination, and it also supports the estimation of pollution extent and the development of remediation strategies [33].
2.7. Method for Mapping Heavy-Metal Concentrations in the Tailings Dump
In managing soil pollution by heavy metals, an essential component is understanding the spatial distributions of these contaminants [34]. The concentration-contour method is an effective cartographic and analytical tool that allows for the visualisation and interpretation of variations in heavy-metal concentrations over large land areas [35].
The isoline method involves drawing contour lines connecting points with identical heavy-metal concentrations, thus creating maps that illustrate the geographical distribution of pollutants [36]. These maps are essential for identifying areas of elevated concentrations, assessing contamination levels, and monitoring temporal changes. The use of isolines facilitates the interpretation of complex data in an intuitive visual format accessible to environmental specialists, decision makers, and the public.
We used the following equation to calculate the percentage variation in the soil heavy-metal concentration (Equation (3)):
- %ΔC—Percentage variation in the heavy-metal concentration in the soil;
- Cmax—Highest concentration of heavy metals in the soil;
- Cmin—Lowest concentration of heavy metals in the soil;
- Cmed—Average concentration of heavy metals in soil.
2.8. Determining the Potential Ecological Risk Index
The potential ecological risk index is an integrated approach used to assess the risk associated with soil heavy-metal contamination, introduced by Hakanson (1980) [37].
This index combines contaminant concentrations with toxicity information, thus providing a more comprehensive assessment of the ecological impact. It is widely used to prioritise high-risk areas and guide remedial actions.
For each metal contaminant, a contamination factor (Cf) is calculated as the ratio of its concentration to a reference value (the normal limit permissible in soil), which is then multiplied by a metal-specific toxicity coefficient (Tr).
Thus, the potential ecological risk index (PERI) is calculated as follows (Equation (4)):
- Individual ecological risk for the analysed heavy metal, i.e., the potential for a negative effect on the environment due to the presence of that metal;
- Toxicity coefficient (or toxic response factor) for the heavy metal analysed. This reflects the relative toxicity of the metal and the sensitivity of the environment to it;
- Contamination factor for the analysed heavy metal.
To determine the ecological risk index, the contamination factor is first calculated for each heavy metal analysed, using (Equation (5)), as follows:
- —Contamination factor;
- —Heavy-metal concentration in the soil (in mg/kg−1 dry matter);
- —Background concentration (natural, before contamination) of the same metal in that environment.
2.9. Assessment of Metallophyte Adaptability to Heavy-Metal-Contaminated Soils
An experimental setup comprising eighteen vegetative pots was established in the laboratory. Nine pots were filled with 250 g of soil taken from the composite sample obtained by homogenizing the seventeen chemically analysed subsamples, while the remaining nine pots were filled with a commercial potting mix serving as the control. Nine plant species, each exhibiting distinct phytoremediation capacities, were sown.
Native species occurring near the tailings deposit were selected, as follows: Calendula officinalis (marigold), Alyssum spp. (alyssum), and Viola calaminaris (calamine violet) as hyperaccumulators; Trifolium spp. (clover), Panicum miliaceum (proso millet), and Triticum aestivum (wheat) for phytostabilisation; and Lupinus spp. (lupin), Hypericum perforatum (St John’s wort), and Brassica spp. (mustard) for phytoextraction of heavy metals.
The study aimed to evaluate the suitability of these three plant groups (hyperaccumulators, phytostabilisers, and phytoextractors) for growth in heavy-metal-contaminated soils. A set of ecological and limiting factors was considered to ensure efficient plant development under varying environmental conditions, including soil type and pH (7.3 in contaminated soil and 6.5 in the commercial control), nutrient availability, presence of co-contaminants, and climatic variables [38].
These data are essential for correctly interpreting phytoremediation efficacy and developing optimised strategies for tailing-dump management.
3. Results
3.1. Determination of Soil Heavy-Metals Concentrations in Samples
Figure 4 illustrates the distribution of soil heavy-metal concentrations in the Defor Petrila tailings dump as a heat map. Significant variations are observed between sampling points and the analysed metals (Cr, Cu, Ni, Zn, Co, and Pb), enabling the identification of potentially contaminated areas.
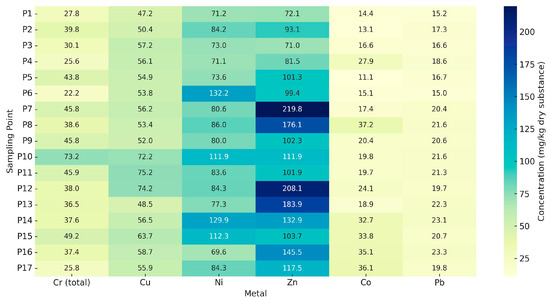
Figure 4.
Distribution of heavy-metal concentrations in the soil.
Among the pollutants studied, Zn exhibits the highest concentrations, reaching up to 219.8 mg kg−1 dry matter in sample P7, as well as showing elevated levels in P14 (208.1 mg kg−1 dry matter), P13 (183.9 mg kg−1 dry matter), and P8 (176.1 mg kg−1 dry matter). These high values may indicate point-source pollution or increased mobility of Zn within the local soil. The accumulation of Zn in the central area of the dump may relate to the drainage direction or the distribution of the mining waste.
Ni also shows elevated concentrations in P6 (132.2 mg kg−1 dry matter), P14 (129.9 mg kg−1 dry matter), and P15 (112.3 mg kg−1 dry matter), exceeding the alert thresholds for non-agricultural soils under Romanian legislation (Ord. 756/1997). These findings align with the high contamination factor (Cf) values observed for Ni at these points (see Figure 5), supporting significant contamination by this metal.
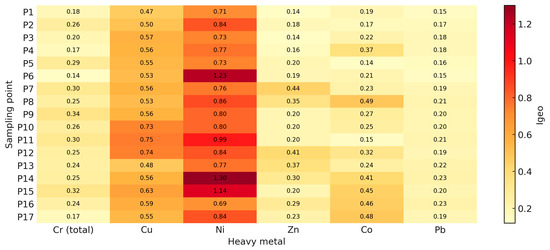
Figure 5.
Index of the geo-accumulation of heavy metals at the sampling points.
Although Co does not exceed alert thresholds, it presents relatively high levels in P8 (37.2 mg kg−1 dry matter), P17 (36.1 mg kg−1 dry matter) and P16 (35.1 mg kg−1 dry matter), suggesting slight to moderate accumulation. Pb varies between 15.2 mg kg−1 dry matter (P1) and 23.3 mg kg−1 dry matter (P16), remaining generally below intervention limits.
The highest total Cr value occurs in sample P10 (73.2 mg kg−1 dry matter), with concentrations at other sites remaining low and below alert levels, indicating minimal contamination. For Cu, higher values are recorded in P11 (75.3 mg kg−1 dry matter), P12 (74.2 mg kg−1 dry matter) and P10 (73.2 mg kg−1 dry matter), likely reflecting Cu-rich materials or increased mobility in acidic (low pH) conditions.
Overall, the spatial distribution of heavy metals reveals critical accumulation hotspots, particularly for Zn and Ni, warranting further monitoring and risk assessment.
3.2. Determination of the Geo-Accumulation Index for Soil Heavy-Metal Concentrations
The analysis of the geo-accumulation index (Igeo) for heavy metals in the soil samples from the Defor Petrila tailings dump (Figure 5) indicates variable pollution levels, depending on the metal analysed and the sampling point. According to Müller’s classification [30], Igeo values < 1 indicate unpolluted to moderately polluted conditions, while values > 1 indicate significant pollution.
Ni records the highest Igeo values, with maxima at P14 (1.30), P6 (1.23), and P15 (1.14), indicating moderate to severe contamination at these locations.
For the other heavy metals, the Igeo values are generally below unity, reflecting low contamination. Cr (total), Pb, and Zn show values between 0.14 and 0.35, indicating non-pollution or negligible contamination. Co exhibits increased values at P7 (0.49) and P17 (0.48), suggesting localised accumulation without exceeding critical risk thresholds.
Moderate Igeo values (0.47–0.75) indicate slight but consistent contamination at most sampling points. The highest values occur in P11 (0.75) and P10 (0.73), which also show higher absolute metal concentrations.
These results confirm that the Defor Petrila tailings-dump area is affected by heavy-metal contamination, particularly Ni, which frequently exceeds the reference Igeo thresholds. The spatial distribution of the index suggests anthropogenic contamination, likely due to historical mining activities and differential metal mobility.
In conclusion, Igeo provides an integrative overview of contamination at the dump, highlighting priority monitoring and intervention areas, especially at P6, P14, and P15.
3.3. Determination of the Contamination Factor for Heavy Metals in the Tailings Dump
The analysis of the contamination factor (Cf) for heavy metals (total Cr, Cu, Ni, Zn, Co, and Pb) in the soil samples collected from the Defor Petrila tailings dump (Figure 6) highlights significant variation in contamination levels depending on the sampling point and the metal analysed.
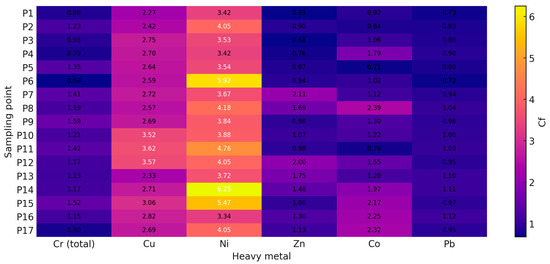
Figure 6.
Heavy-metal contamination factors at the sampling points.
The Cf values for Ni are the highest, especially in samples P6 (Cf = 1.23), P14 (Cf = 1.30), and P15 (Cf = 1.14), indicating moderate to severe contamination at these locations. According to the standard classification, Cf values > 1 indicate significant contamination, which may pose local ecotoxicological concerns. In contrast, the total Cr, Pb, and Zn present lower Cf values across all points (0.14–0.30), corresponding to mild or negligible contamination.
Moderate Cf values occur, with a maximum of 0.75 in sample P11, indicating possible localised accumulation without exceeding critical thresholds. The Cf values for Co are generally uniform but slightly elevated in samples P8 (Cf = 0.49) and P17 (Cf = 0.48), suggesting point-source contamination potentially linked to geochemical characteristics or localised anthropogenic inputs.
At points P14 and P15, elevated Cf values for Ni coincide with slightly increased values for other heavy metals in the soil. This pattern suggests a common contamination source and differential metal accumulation tendencies in that area.
The spatial distribution of Cf underscores the need for careful soil monitoring around the Defor Petrila tailings dump, particularly where Ni levels are elevated, and a Pearson correlation coefficient matrix for hourly assessment of the environmental and human health risks.
3.4. Pearson Correlation Coefficient Matrix for Heavy-Metal Presence in the Tailings Dump
A Pearson correlation matrix was used to assess the associations among heavy-metal concentrations across the tailings samples or different areas of the dump. A correlation coefficient close to +1 indicates a positive correlation (increasing concentrations of one metal are associated with increasing concentrations of another), whereas a coefficient near −1 indicates a negative correlation (increasing concentrations of one heavy metal are associated with decreasing concentrations of another).
To evaluate the statistical relationships among heavy metals in soils from the Defor Petrila tailings dump, the Pearson correlation coefficient was calculated, and the results are presented in Table 2 and Figure 7.
Table 2.
Pearson correlation coefficient matrix.
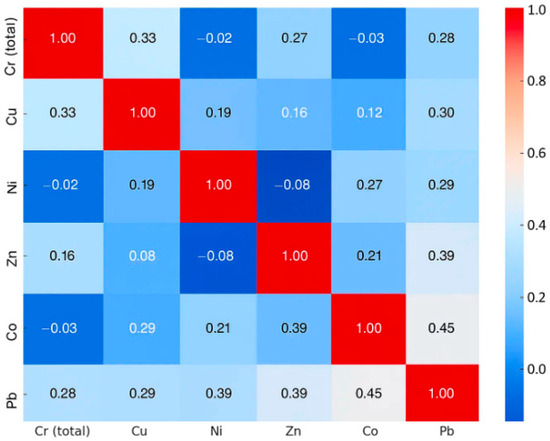
Figure 7.
Graphical interpretation of the Pearson coefficient matrix.
The strongest association was observed between Co and Pb, with a coefficient of 0.45, suggesting a common pollution source or similar soil behaviour. A significant correlation was also found between Zn and Pb (r = 0.39) and between Ni and Pb (r = 0.29), indicating possible co-mobility within the dump.
Moderate correlations occur between Cr (total) and Cu (r = 0.33) and between Cu and Pb (r = 0.30), reflecting synchronous distributions of these metals. Weak correlations were noted for Cu and Ni (r = 0.19) and Cu and Zn (r = 0.16), while Ni and Zn (r = −0.08) show a slight negative but non-significant correlation.
Low values close to zero were recorded between Cr and Ni (r = −0.02) and Cr and Co (r = −0.03), indicating no significant relationship. These patterns reflect distinct geochemical origins, varied adsorption behaviours, or differing mobilisation processes in the soil.
3.5. Isoline Method for Mapping Heavy-Metal Concentrations in the Tailings Dump
To better understand the spatial distribution of the heavy metals in the soil within the Defor Petrila tailings-dump perimeter, contour maps were generated for the analysed metals based on the values in Table 3. These maps (Figure 8) highlight areas of varying concentrations according to the recorded sampling-point values.
Table 3.
Analytical data for the interpolation of heavy metal concentration isolines on the Defor Petrila tailings dump.
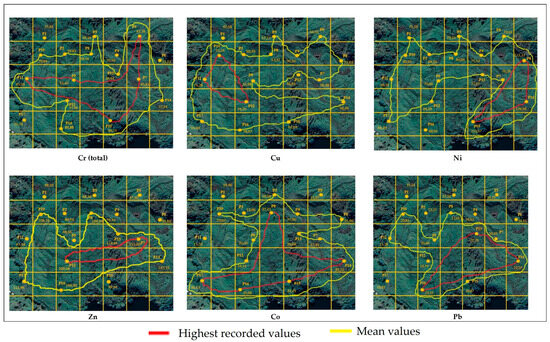
Figure 8.
Spatial distributions of heavy metals in soil.
Isolines for concentrations exceeding the normal soil allowable limit by three to four times are drawn in red, while isolines for concentrations above the normal limit are drawn in yellow.
As the field data are concentrated at a few sampling locations with medium to high intensity, Cr total isolines indicate higher accumulation in the central–eastern region. Concentrations are lower in the western and southern zones, suggesting a non-uniform distribution likely influenced by local geological substrates.
A notable Cu concentration is found in the central–western region, with slight northern extension, indicating a potential local source. Intensity gradually decreases towards the edges, while remaining areas display nearly uniform values.
The eastern sector, particularly the south–eastern area, shows clear accumulation patterns. High values may indicate a point pollution source or local geogenic reservoir. This distribution does not replicate elsewhere, emphasising the contamination’s localised nature.
Zn distribution is marked by a slight concentration in the central–western area, with low concentrations elsewhere, suggesting reduced mobility and geogenic rather than anthropogenic influence.
In the north–west central area, extensive accumulation suggests diffuse input or natural predisposition to metal concentration. Well-defined contours indicate clear variation in the concentrations.
For Pb, the highest values occur in the south–eastern perimeter, within a well-defined zone, which is potentially associated with anthropogenic activities, such as material storage, road traffic, or surface-water transport of contaminants.
The dispersion of heavy metals across the spoil-heap surface is detailed via an isoline analysis, identifying ecologically sensitive areas and potential contamination sources. By assessing soil-pollution risks and developing effective monitoring and remediation plans, environmental quality can be restored.
3.6. Determining the Potential Ecological Risk Index (Er)
The potential ecological risk index (Er), calculated from the contamination factor (Cf) and the toxicity coefficient (Tr), provides critical insight into the hazard posed by heavy metals in the Defor Petrila tailings-dump area (Table 4).
Table 4.
Potential ecological risk assessment (Er) for heavy metals.
The highest potential ecological risk is associated with Ni (Er = 21.75), followed by Cu (Er = 14.60). These values fall within the mild-to-moderate risk category, suggesting significant ecosystem impact, particularly under prolonged bioaccumulation conditions.
This finding is supported by high Cf values for Ni (Cf = 4.35) and Cu (Cf = 2.92), indicating persistent anthropogenic sources or enhanced environmental mobility [28].
The Er values for Co and Pb are moderate (7.90 and 4.90 respectively), not reaching severe risk thresholds but warranting ongoing monitoring of their cumulative toxicity potential.
Cr (total) and Zn present the lowest ecological risk values (Er = 2.48 and Er = 1.26, respectively), classified as minor risk. These results reflect natural background levels or limited bioavailability and biota impact.
Figure 9 illustrates the Er values for each metal, highlighting the potential ecological risks and underscoring the variations in the pollution source distribution and element mobility/toxicity.
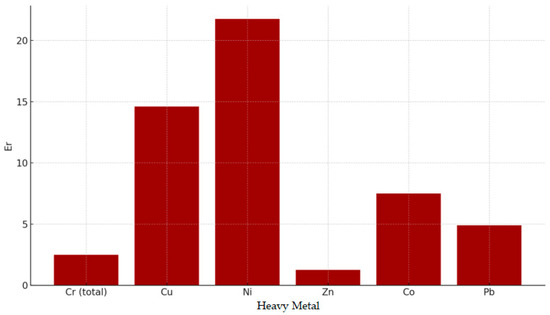
Figure 9.
Potential ecological risk index (Er) values for the analysed heavy metals.
The Er analysis emphasises urgent intervention for Ni and Cu contamination in the Defor Petrila tailings dump, alongside preventive measures for other heavy metals.
3.7. Evaluating Metallophyte Adaptation to Heavy-Metal-Contaminated Soils
In this study, 50 seeds of each of the nine species were sown uniformly in 25 cm2 containers filled with contaminated and control soils (three replicates per treatment). After sowing, the containers were incubated at 25 °C under a 16 h light/8 h dark photoperiod and watered daily with 5 mL of distilled water to maintain constant moisture. Germination was assessed on day 7, with seeds considered germinated when the radicle reached at least 2 mm, and the germination rate (%) was calculated as the number of germinated seeds divided by the total sown. Plant height was measured on day 14 post-sowing, from the soil line to the shoot tip, and the mean ± standard deviation is reported for each species. On the same day, plant density (plants/cm2) was determined by dividing the total number of emerged seedlings by the container surface area. The results are presented in Table 5 and Figure 10, respectively.
Table 5.
Seed germination rate, mean plant height, and density in contaminated and control soils across nine species.
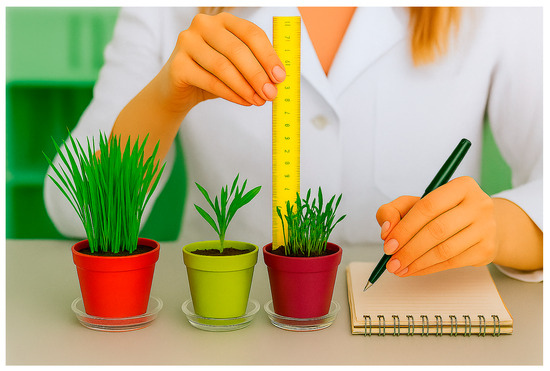
Figure 10.
Experimental setup for measuring plant growth.
- Best performers
Mustard (Brassica spp.), wheat (Triticum aestivum), and marigold (Calendula officinalis) consistently exhibited high germination rates (90–96%) and average shoot heights of 4.0–6.0 cm in the contaminated soil, with densities exceeding 1.8 plants cm−2. Their robust establishment under metal stress confirms their suitability for phytoextraction (mustards), phytostabilisation (wheat), and hyperaccumulation (marigold). Aspect illustrated in Figure 11, Figure 12 and Figure 13.
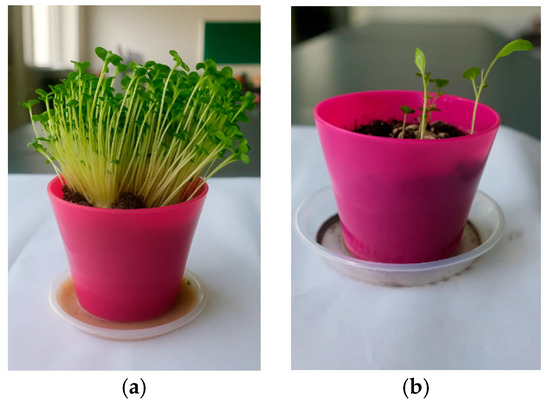
Figure 11.
Mustard (Brassica spp.) plant development under different soil conditions: (a) seedlings grown in contaminated soil; (b) seedlings grown in commercial control soil.
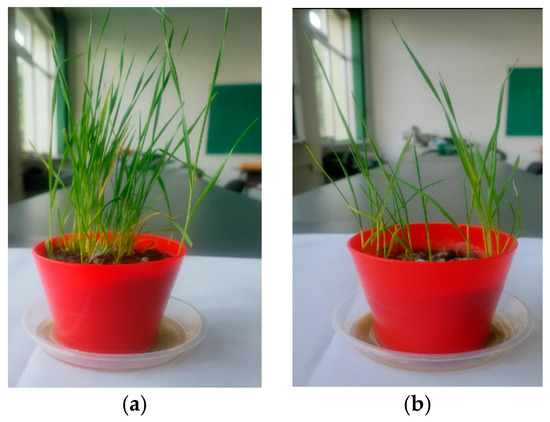
Figure 12.
Plant development of wheat (Triticum aestivum) under different soil conditions: (a) seedlings grown in contaminated soil; (b) seedlings grown in commercial control soil.
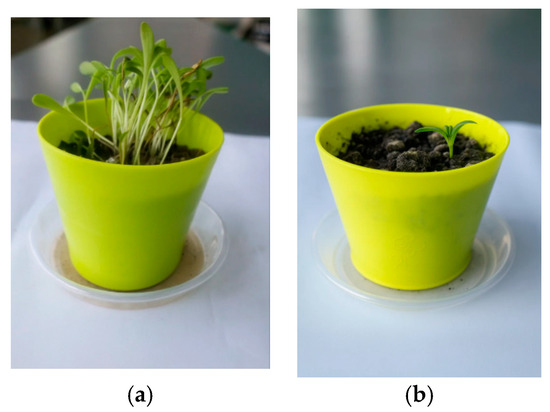
Figure 13.
Marigold (Calendula officinalis) plant development under different soil conditions: (a) seedlings grown in contaminated soil; (b) seedlings grown in commercial control soil.
- Moderate responses
The remaining hyperaccumulators (Alyssum spp. and Viola calaminaris) and phytoextractors (Lupinus spp. and Hypericum perforatum) showed modest germination rates (6–10%) and limited shoot elongation (0.8–1.0 cm) in the contaminated soil, indicating a measurable but constrained metal-tolerance capacity that may require further optimisation. Notably, proso millet (Panicum miliaceum) did not germinate in either the contaminated or control soils (0% germination), being the only species to completely fail under our conditions. Aspect illustrated in Figure 14.
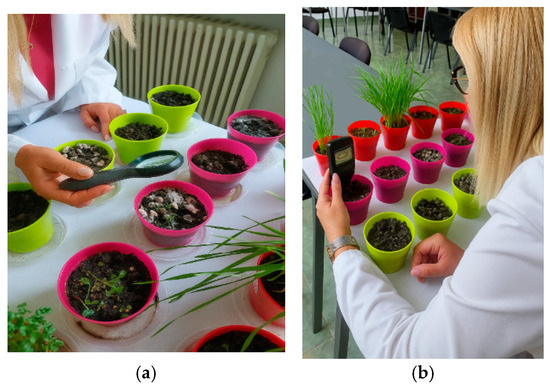
Figure 14.
Observation procedures for plant development: (a) close-up visual assessment of the soil surface and emerging seedlings; (b) quantitative chlorophyll measurement on leaves with a portable SPAD meter.
4. Discussion
The present study provides a multi-faceted evaluation of heavy-metal contamination within the Defor Petrila tailings dump, integrating geospatial mapping, contamination indices, ecological risk assessment, and phytoremediation trials. These findings extend prior research conducted in China, South Africa, and Brazil by offering a detailed site-specific analysis and actionable governance recommendations.
- ✓
- Spatial distribution and contamination hotspots
Consistent with reports from Chinese coalfields [39] and South African tailings [40], our heat map (Figure 3) highlights zinc (Zn) and nickel (Ni) as the predominant contaminants. Zn concentrations exceeded 200 mg kg−1 dry matter at central points (P7–P8), mirroring levels reported by [41] in Brazilian dumpsites. Unlike the broader distributions observed in those studies, Ni showed sharply localised peaks at P6 and P14, suggesting unique hydrological pathways in our site.
- ✓
- Contamination indices: Igeo and Cf
Our geo-accumulation index (Figure 4) findings align with Müller’s (1969) [30] classification and parallel patterns observed in Romanian post-mining areas [42]. Ni’s Igeo > 1 at three sampling points underscores moderate–severe pollution, analogous to levels reported in other Romanian post-mining sites, whereas the Cf values reaffirm Ni’s impact (Cf = 1.30 at P14), exceeding the CF thresholds reported by [43] for Eastern European coal-mining regions.
- ✓
- Ecological risk assessment (Er)
Hakanson’s Er index (Figure 8) places Ni and Cu in the mild–moderate risk categories, consistent with findings from Italian mining residues [44,45] (Rossi et al., 2017). However, our Er values for Cu (Er = 14.60) surpass those documented by [46] in Korean tailings, indicating potentially higher toxicity factors or site-specific bioavailability.
- ✓
- Statistical associations and mobilisation pathways
The positive correlations of Co–Pb (r = 0.45) and Zn–Pb (r = 0.39) parallel geochemical associations reported by [47] in Chinese smelting areas. The weak correlations among Cr, Ni, and other metals suggest distinct adsorption mechanisms, as similarly noted by [48] in arid tailings.
- ✓
- Phytoremediation potential of native metallophytes
Our laboratory studies confirm the suitability of Brassica spp., Triticum aestivum, and Calendula officinalis, echoing the hyperaccumulation capacities documented by [49,50] Salt et al. (1995) and recent field trials by [51]. However, the failure of Panicum miliaceum contrasts with results from temperate climates [52], highlighting species–site interactions that require further investigation.
- ✓
- Recommendations for environmental governance
- Targeted remediation zones: prioritise Ni- and Cu-rich areas (P6, P14, and P15) for in situ phytoremediation using identified hyperaccumulators, combined with soil amendments to optimise uptake;
- Regular monitoring programme: implement quarterly sampling and analysis of Igeo, Cf, and Er indices to track remediation progress;
- Stakeholder engagement: involve local communities and authorities through workshops, building capacity for the maintenance of green remediation measures;
- Regulatory integration: incorporate these site-specific thresholds into regional environmental guidelines and enforce buffer zones around high-risk sectors;
- Adaptive management: establish a feedback loop where monitoring data informs iterative adjustments to remediation strategies, ensuring responsiveness to changing site conditions.
5. Conclusions
The Defor Petrila tailings dump exhibits pronounced spatial heterogeneity in heavy-metal burdens, with Zn and Ni forming distinct contamination hotspots that exceed regulatory alert thresholds.
Geo-accumulation (Igeo) and contamination factor (Cf) indices converge to identify Ni as the most impactful pollutant, guiding the prioritisation of remedial efforts.
Integrated ecological risk assessment (Er) reveals that Ni and Cu pose the highest potential threats to local biota, reinforcing the need for focused mitigation strategies.
Correlation analyses underscore co-mobilisation pathways for specific metal pairs (e.g., Co–Pb and Zn–Pb), suggesting common source inputs and informing monitoring designs.
Pot-based phytoremediation assays demonstrate Brassica spp., Triticum aestivum, and Calendula officinalis as effective candidates for in situ applications while highlighting the limited tolerance of other taxa.
This combined methodological framework provides a replicable model for post-mining site assessment, enabling evidence-based governance actions and adaptive management plans.
Author Contributions
Conceptualization, M.-F.I.; Investigation, E.-C.D.; Resources, S.M.R. All authors have read and agreed to the published version of the manuscript.
Funding
This research was funded by the University of Petrosani via the institutional research fund (Grant No. CeSoH: 760005/30.12.2022, Project Code 2). The Article Processing Charge (APC) was also covered by this funding.
Data Availability Statement
The original contributions presented in the study are included in the article, further inquiries can be directed to the corresponding author.
Acknowledgments
This paper is based on the “CeSoH” research project, which received funding from the Research and Innovation Program, PNRR-III-C9-2022–I5, funded by the European Union–Next Generation EU, under grant no: 760005/30.12.2022, project code 2. The authors would like to thank all of the partners of the CeSoH project for their support and acknowledge the financial support from the funding program.
Conflicts of Interest
The authors declare no conflict of interest.
References
- Cai, L.; Xu, Z.; Ren, M.; Guo, Q.; Hu, X.; Hu, G. Source identification of eight hazardous heavy metals in agricultural soils of Huizhou, Guangdong Province, China. Ecotoxicol. Environ. Saf. 2012, 78, 2–8. [Google Scholar] [CrossRef] [PubMed]
- Micó, C.; Recatalá, L.; Peris, M.; Sánchez, J. Assessing heavy metal sources in agricultural soils of an European Mediterranean area by multivariate analysis. Chemosphere 2006, 65, 863–872. [Google Scholar] [CrossRef] [PubMed]
- Zhou, H.; Guo, X. Soil Heavy Metal Pollution Evaluation around Mine Area with Traditional and Ecological Assessment Methods. J. Geosci. Environ. Prot. 2015, 3, 28–33. [Google Scholar] [CrossRef]
- Grygar, T.M.; Opatrilova, J.; Poscik, P.; Rohanova, D.; Novakova, T. Exploratory functional data analysis of multivariate densities for the identification of agricultural soil contamination by risk elements. arXiv 2023, arXiv:2310.13761. [Google Scholar] [CrossRef]
- Lesley, M.N.-Y.O.; Tati, E.B.; Nguimbyt, J.D.; Ndinga, D.; Mbon, J. Determination of Organic Matter and Trace Metals Elements (As, Sb, Cd, Hg, Ni, Pb, Cr, Zn) in the Soils of the Banks of Watercourses in Brazzaville City (Republic of Congo). Open J. Soil Sci. 2025, 15, 156–172. [Google Scholar] [CrossRef]
- Wei, B.; Yang, L. A review of heavy metal contaminations in urban soils, urban road dusts and agricultural soils from China. Microchem. J. 2010, 94, 99–107. [Google Scholar] [CrossRef]
- Guo, G.; Wu, F.; Xie, F.; Zhang, R. Spatial distribution and pollution assessment of heavy metals in urban soils from southwest China. J. Environ. Sci. China 2012, 24, 410–418. [Google Scholar] [CrossRef] [PubMed]
- Chen, T.-B.; Zheng, Y.-M.; Lei, M.; Huang, Z.-C.; Wu, H.-T.; Chen, H.; Fan, K.-K.; Yu, K.; Wu, X.; Tian, Q.-Z. Assessment of heavy metal pollution in surface soils of urban parks in Beijing, China. Chemosphere 2005, 60, 542–551. [Google Scholar] [CrossRef] [PubMed]
- Hu, B.; Jia, X.; Hu, J.; Xu, D.; Xia, F.; Li, Y. Assessment of Heavy Metal Pollution and Health Risks in the Soil-Plant-Human System in the Yangtze River Delta, China. Int. J. Environ. Res. Public Health 2017, 14, 1042. [Google Scholar] [CrossRef] [PubMed]
- Sellami, S.; Zeghouan, O.; Dhahri, F.; Mechi, L.; Moussaoui, Y.; Kebabi, B. Assessment of Heavy Metal Pollution in Urban and Peri-Urban Soil of Setif City (High Plains, Eastern Algeria). Environ. Monit. Assess. 2022, 194, 126. [Google Scholar] [CrossRef] [PubMed]
- El Hamouri, B.; Bazzi, L.; El Hamdouni, R. Heavy Metal Contamination and Ecological Risk Assessment in Agricultural Soils Irrigated with Wastewater in Marrakech, Morocco. Environ. Sci. Pollut. Res. 2021, 28, 5723–5735. [Google Scholar]
- Cai, Q.-Y.; Mo, C.-H.; Li, Y.-H.; Zeng, Q.-Y.; Katsoyiannis, A.; Wu, Q.-T. Heavy metal contamination of urban soils and dusts in Guangzhou, South China. Environ. Monit. Assess. 2012, 185, 777–793. [Google Scholar] [CrossRef] [PubMed]
- Li, X.; Poon, C.; Liu, P.S. Heavy metal contamination of urban soils and street dusts in Hong Kong. Appl. Geochem. 2001, 16, 1361–1368. [Google Scholar] [CrossRef]
- Wei, B.; Jiang, F.; Li, X.; Mu, S. Multivariate analysis of heavy metal contamination in urban dusts of Xi’an, Central China. Sci. Total Environ. 2006, 355, 176–186. [Google Scholar] [CrossRef]
- Souza, D.C.; Guedes, A.C.; de Andrade, F.B.; Machado, W.; de Oliveira, E.C. Environmental Impacts of Dumpsites and Landfills in Brazil: A Comprehensive Review. Waste Manag. Res. 2022, 40, 3–17. [Google Scholar]
- Turer, D.G.; Maynard, B.J. Heavy metal contamination in highway soils. Comparison of Corpus Christi, Texas and Cincinnati, Ohio shows organic matter is key to mobility. Clean Technol. Environ. Policy 2003, 4, 235–245. [Google Scholar] [CrossRef]
- Yang, J.; Ma, S.; Zhou, J.; Song, Y.; Li, F. Heavy metal contamination in soils and vegetables and health risk assessment of inhabitants in Daye, China. J. Int. Med. Res. 2018, 46, 3510–3524. [Google Scholar] [CrossRef] [PubMed]
- Ribeiro, C.; Abreu, C.; Paz-González, A. Total trace element contents in natural soils by two methods. Commun. Soil Sci. Plant Anal. 2002, 33, 889–898. [Google Scholar] [CrossRef]
- Luo, C.L.; Liu, C.P.; Wang, Y.; Liu, X.; Li, F.B.; Qi, S.H. Heavy Metal Contamination in Soils and Vegetables Near an E-Waste Processing Site, South China. J. Hazard. Mater. 2011, 186, 481–490. [Google Scholar] [CrossRef] [PubMed]
- Smieja-Król, B.; Pawlyta, M.; Kądziołka-Gaweł, M.; Fiałkiewicz-Kozieł, B. Formation of Zn and Pb sulfides in a redox-sensitive modern system due to high atmospheric fallout. arXiv 2022, arXiv:2201.09552. [Google Scholar] [CrossRef]
- Rudmin, M.; Ruban, A.; Savichev, O.; Mazurov, A.; Dauletova, A.; Savinova, O. Authigenic and Detrital Minerals in Peat Environment of Vasyugan Swamp, Western Siberia. Minerals 2018, 8, 500. [Google Scholar] [CrossRef]
- Ioniţă, M.-F.; Radu, S.M.; Dunca, E.C. Research on the Identification of Inactive Mining Sites with the Potential for Soil Contamination in the Jiu Valley—Case Study Balomir Tailings Dump. Min. Rev. 2024, 30, 53–59. [Google Scholar] [CrossRef]
- Order No. 184/1997; Order for the Approval of the Procedure for Conducting Environmental Assessments. Ministry of Waters, Forests and Environmental Protection: Bucharest, Romania, 1997.
- Ioniţă, M.-F. Critical Analysis of Contaminated Sites Resulting from Mining Activities with Exemplification in the Closed Mine Perimeters of the Jiu Valley. Ph.D. Thesis, University of Petroșani, Petroșani, Romania, 2025. Unpublished. English Summary available online: https://www.upet.ro/doctorat/resource/doc/sustineri/2024%2009%2007%20IONITA%20Flavia/REZUMAT%20TEZ%C4%82%20ENG.pdf (accessed on 24 June 2025).
- Zhou, H.; Ouyang, T.; Guo, Y.; Peng, S.; He, C.; Zhu, Z. Assessment of Soil Heavy Metal Pollution and Its Ecological Risk for City Parks, Vicinity of a Landfill, and an Industrial Area within Guangzhou, South China. Appl. Sci. 2022, 12, 9345. [Google Scholar] [CrossRef]
- Lu, X.; Wang, L.; Lei, K.; Huang, J.; Zhai, Y. Contamination assessment of copper, lead, zinc, manganese and nickel in street dust of Baoji, NW China. J. Hazard. Mater. 2009, 161, 1058–1062. [Google Scholar] [CrossRef] [PubMed]
- Wang, Y.; Chen, C.; Wang, J.; Lu, X. Heavy Metal Contamination in Soils and Vegetables around a Coal Mining Area in Northern China: Concentrations, Health Risks, and Source Apportionment. Chemosphere 2021, 276, 130122. [Google Scholar] [CrossRef]
- Lamine, S.; Petropoulos, G.P.; Brewer, P.A.; Bachari, N.-E.-I.; Srivastava, P.K.; Manevski, K.; Kalaitzidis, C.; Macklin, M.G. Heavy Metal Soil Contamination Detection Using Combined Geochemistry and Field Spectroradiometry in the United Kingdom. Sensors 2019, 19, 762. [Google Scholar] [CrossRef] [PubMed]
- Order No. 756 of 3 November 1997. Portal Legislativ. Available online: https://legislatie.just.ro/Public/detaliidocument/13572 (accessed on 30 May 2025).
- Müller, G. Index of Geoaccumulation in Sediments of the Rhine River. GeoJournal 1969, 2, 108–118. [Google Scholar]
- Ioniţă, M.-F.; Radu, S.-M. Assessment of the Pollution Level and Determination of the Geo-Accumulation Index of Heavy Metals in the Soil from the Old Funicular Dump Area—Uricani. Min. Rev. 2024, 30 (Suppl. 1), 98–105. [Google Scholar] [CrossRef]
- Ioniţă, M.-F.; Radu, S.M.; Dunca, E.-C. Correlation Analysis of Heavy Metal Concentrations in the Tailing Dumps Branch 1 and 2 Lupeni Using Pearson Coefficient Matrix. Min. Rev. 2024, 30, 22–29. [Google Scholar] [CrossRef]
- Acharya, A.; Perez, E.; Maddox-Mandolini, M.; Fuente, H.D.L. The Status and Prospects of Phytoremediation of Heavy Metals. arXiv 2023, arXiv:2312.14288. [Google Scholar] [CrossRef]
- Facchinelli, A.; Sacchi, E.; Mallen, L. Multivariate Statistical and GIS-Based Approach to Identify Heavy Metal Sources in Soils. Environ. Pollut. 2001, 114, 313–324. [Google Scholar] [CrossRef] [PubMed]
- Ioniţă, M.-F.; Radu, S.M.; Dunca, E.C. Researches on the Mobility and Toxicity of Heavy Metals from Balomir Tailings Dump—Uricani Jiu Valley. Min. Rev. 2024, 30, 44–52. [Google Scholar] [CrossRef]
- Al-Khashman, O.A. Heavy Metal Distribution in Dust, Street Dust and Soils from the Work Place in Karak Industrial Estate, Jordan. Atmos. Environ. 2004, 38, 6803–6812. [Google Scholar] [CrossRef]
- Hakanson, L. Ecological risks index for aquatic pollution control sediment logical approaches. Water Res. 1980, 14, 975–1001. [Google Scholar] [CrossRef]
- Ionită, M.-F.; Radu, S.M.; Dunca, E.-C. Research on the Phytoremediation of Soil Contaminated with Heavy Metals from Mining Activity: Case Study Balomir–Uricani Tailings Dump. Sci. Study Res. Chem. Chem. Eng. Biotechnol. Food Ind. 2024, 25, 417–426. [Google Scholar] [CrossRef]
- Bu, Q.; Li, Q.; Zhang, H.; Xu, Y.; Chen, X.; Huang, X. Concentrations, Spatial Distributions, and Sources of Heavy Metals in Surface Soils of the Coal Mining City Wuhai, China. J. Chem. 2020, 2020, 4705954. [Google Scholar] [CrossRef]
- Mathee, A.; Haman, T.; Nkosi, V.; Naicker, N.; London, L. Elevated Soil and Blood Lead Levels with Increasing Residential Proximity to a Mine Tailings Facility in Soweto, South Africa. Sci. Total Environ. 2022, 851 Pt 1, 158158. [Google Scholar] [CrossRef] [PubMed]
- Turer, D.G.; Maynard, B.J.; Sansalone, J.J. Heavy Metal Contamination in Soils of Urban Highways: Comparison Between Runoff and Soil Concentrations at Cincinnati, Ohio. Water Air Soil Pollut. 2001, 132, 293–314. [Google Scholar] [CrossRef]
- Morita, A.; Bianco, C.I.; Anache, J.A.A.; Heller, L.; Saliba, R.; de Castro, M. Pollution Threat to Water and Soil Quality by Dumpsites and Non-Sanitary Landfills in Brazil: A Review. Waste Manag. 2021, 131, 163–176. [Google Scholar] [CrossRef] [PubMed]
- Popescu, I.V.; Radu, V.; Dincă, G.; Szabo, R.; Anghel, M.A. Spatial Distribution and Mobility of Potentially Toxic Elements in the Soils of Romania. In Recent Advances in Environmental Science from the Euro Mediterranean and Surrounding Regions (EMCEI 2021); Ksibi, M., Ed.; Advances in Science, Technology & Innovation; Springer: Cham, Switzerland, 2024; pp. 315–318. [Google Scholar] [CrossRef]
- Rossi, M.; Russo, C.; De Marco, R.; Fornaro, F. Assessment of Heavy Metal Contamination in Soils of a Former Mine Site: Application of Geoaccumulation and Enrichment Factor Indices. Environ. Monit. Assess. 2017, 189, 567. [Google Scholar] [CrossRef]
- Calmuc, M.; Grigoraș, G.; Tiron, O.; Roman, M.; Bîrțoiu, D.; Sava, D. Assessment of Heavy Metal Pollution Levels in Sediments and of Ecological Risk by Quality Indices, Applying a Case Study: The Lower Danube River, Romania. Water 2021, 13, 1801. [Google Scholar] [CrossRef]
- Baldini, E.; Benvenuti, M.; Corsini, F.; Di Benedetto, F.; Mascaro, I.; Terranova, F.; Parrini, P. Land contamination by toxic elements in abandoned mine areas in Tuscany (Italy). J. Soils Sediments 2015, 15, 1928–1942. [Google Scholar] [CrossRef]
- Kim, S.-D.; Lee, S.-J. Contamination of soil with heavy metals drained out from abandoned mines in the South-West region of Korea. Environ. Prot. Eng. 2015, 41, 61–72. [Google Scholar] [CrossRef]
- Zhao, P.; Adnan, M.; Xiao, P.–w.; Yang, X.f.; Wang, H.–y.; Xue, S.g. Characterization of Soil Heavy Metals at an Abandoned Smelting Site Based on Particle Size Fraction and Its Implications for Remediation Strategy. J. Cent. South Univ. 2024, 31, 1076–1091. [Google Scholar] [CrossRef]
- Salt, D.E.; Blaylock, M.; Kumar, N.P.B.A.; Dushenkov, V.; Ensley, B.D.; Chet, I.; Raskin, I. Phytoremediation: A Novel Strategy for the Removal of Toxic Metals from the Environment Using Plants. Bio/Technology 1995, 13, 468–474. [Google Scholar] [CrossRef] [PubMed]
- Root, R.A.; Hayes, S.M.; Hammond, C.M.; Maier, R.M.; Chorover, J. Toxic Metal(loid) Speciation during Weathering of Iron Sulfide Mine Tailings under Semi-Arid Climate. Appl. Geochem. 2015, 62, 131–149. [Google Scholar] [CrossRef] [PubMed]
- Martinez, J.; López, R.; Pérez, C.; García, M.; Torres, F. Field Trials of Native Metallophytes for Zinc and Nickel Phytoextraction in Mediterranean Mine Soils. Environ. Pollut. 2022, 307, 119467. [Google Scholar] [CrossRef]
- Johnson, T.; Ng, E.; González, L. Assessment of Proso Millet (Panicum miliaceum L.) for Phytoextraction Potential on Metal-Contaminated Soils in Temperate Climates. Plant Soil 2019, 441, 379–390. [Google Scholar]
Disclaimer/Publisher’s Note: The statements, opinions and data contained in all publications are solely those of the individual author(s) and contributor(s) and not of MDPI and/or the editor(s). MDPI and/or the editor(s) disclaim responsibility for any injury to people or property resulting from any ideas, methods, instructions or products referred to in the content. |
© 2025 by the authors. Licensee MDPI, Basel, Switzerland. This article is an open access article distributed under the terms and conditions of the Creative Commons Attribution (CC BY) license (https://creativecommons.org/licenses/by/4.0/).