
The Spatiotemporal Impact of Socio-Economic Factors on Carbon Sink Value: A Geographically and Temporally Weighted Regression Analysis at the County Level from 2000 to 2020 in China’s Fujian Province


Abstract
1. Introduction
2. Material and Methods
2.1. Study Area
2.2. Data Sources
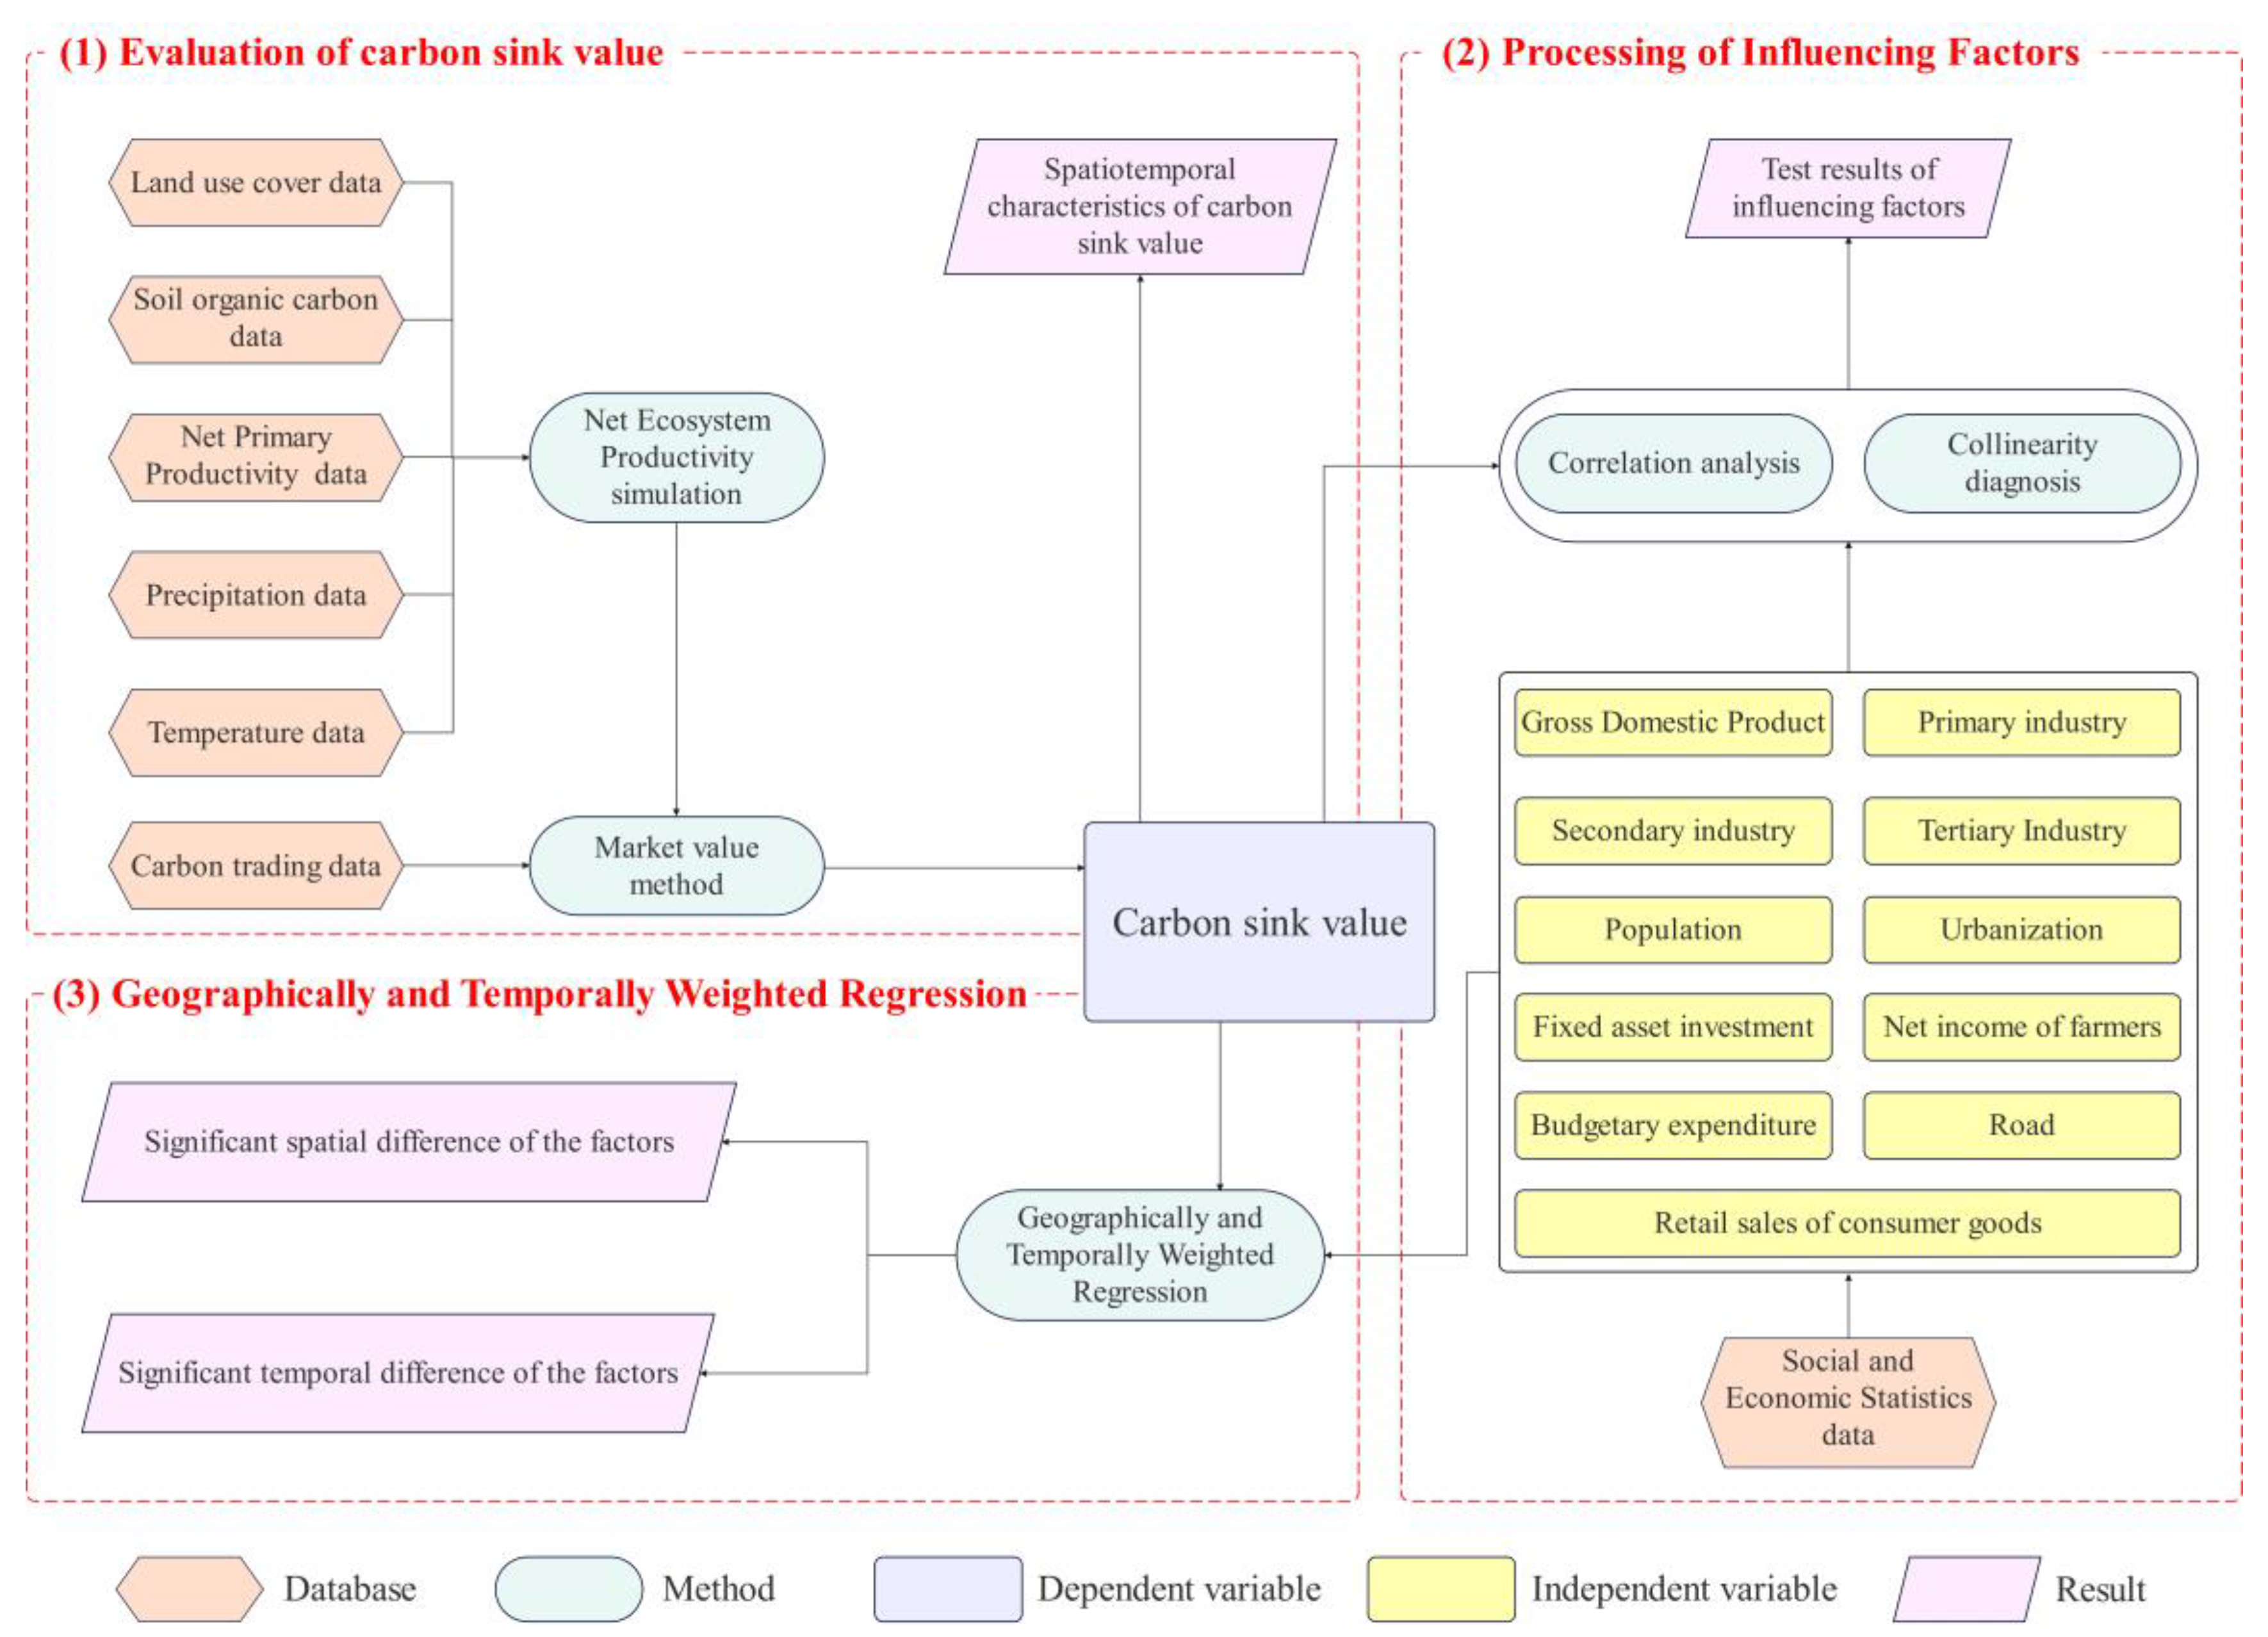
2.3. Research Methods
2.3.1. Evaluation of Carbon Sink Value
Net Ecosystem Productivity Simulation
Market Value Method
2.3.2. Processing of Influencing Factors
Definition of Variables
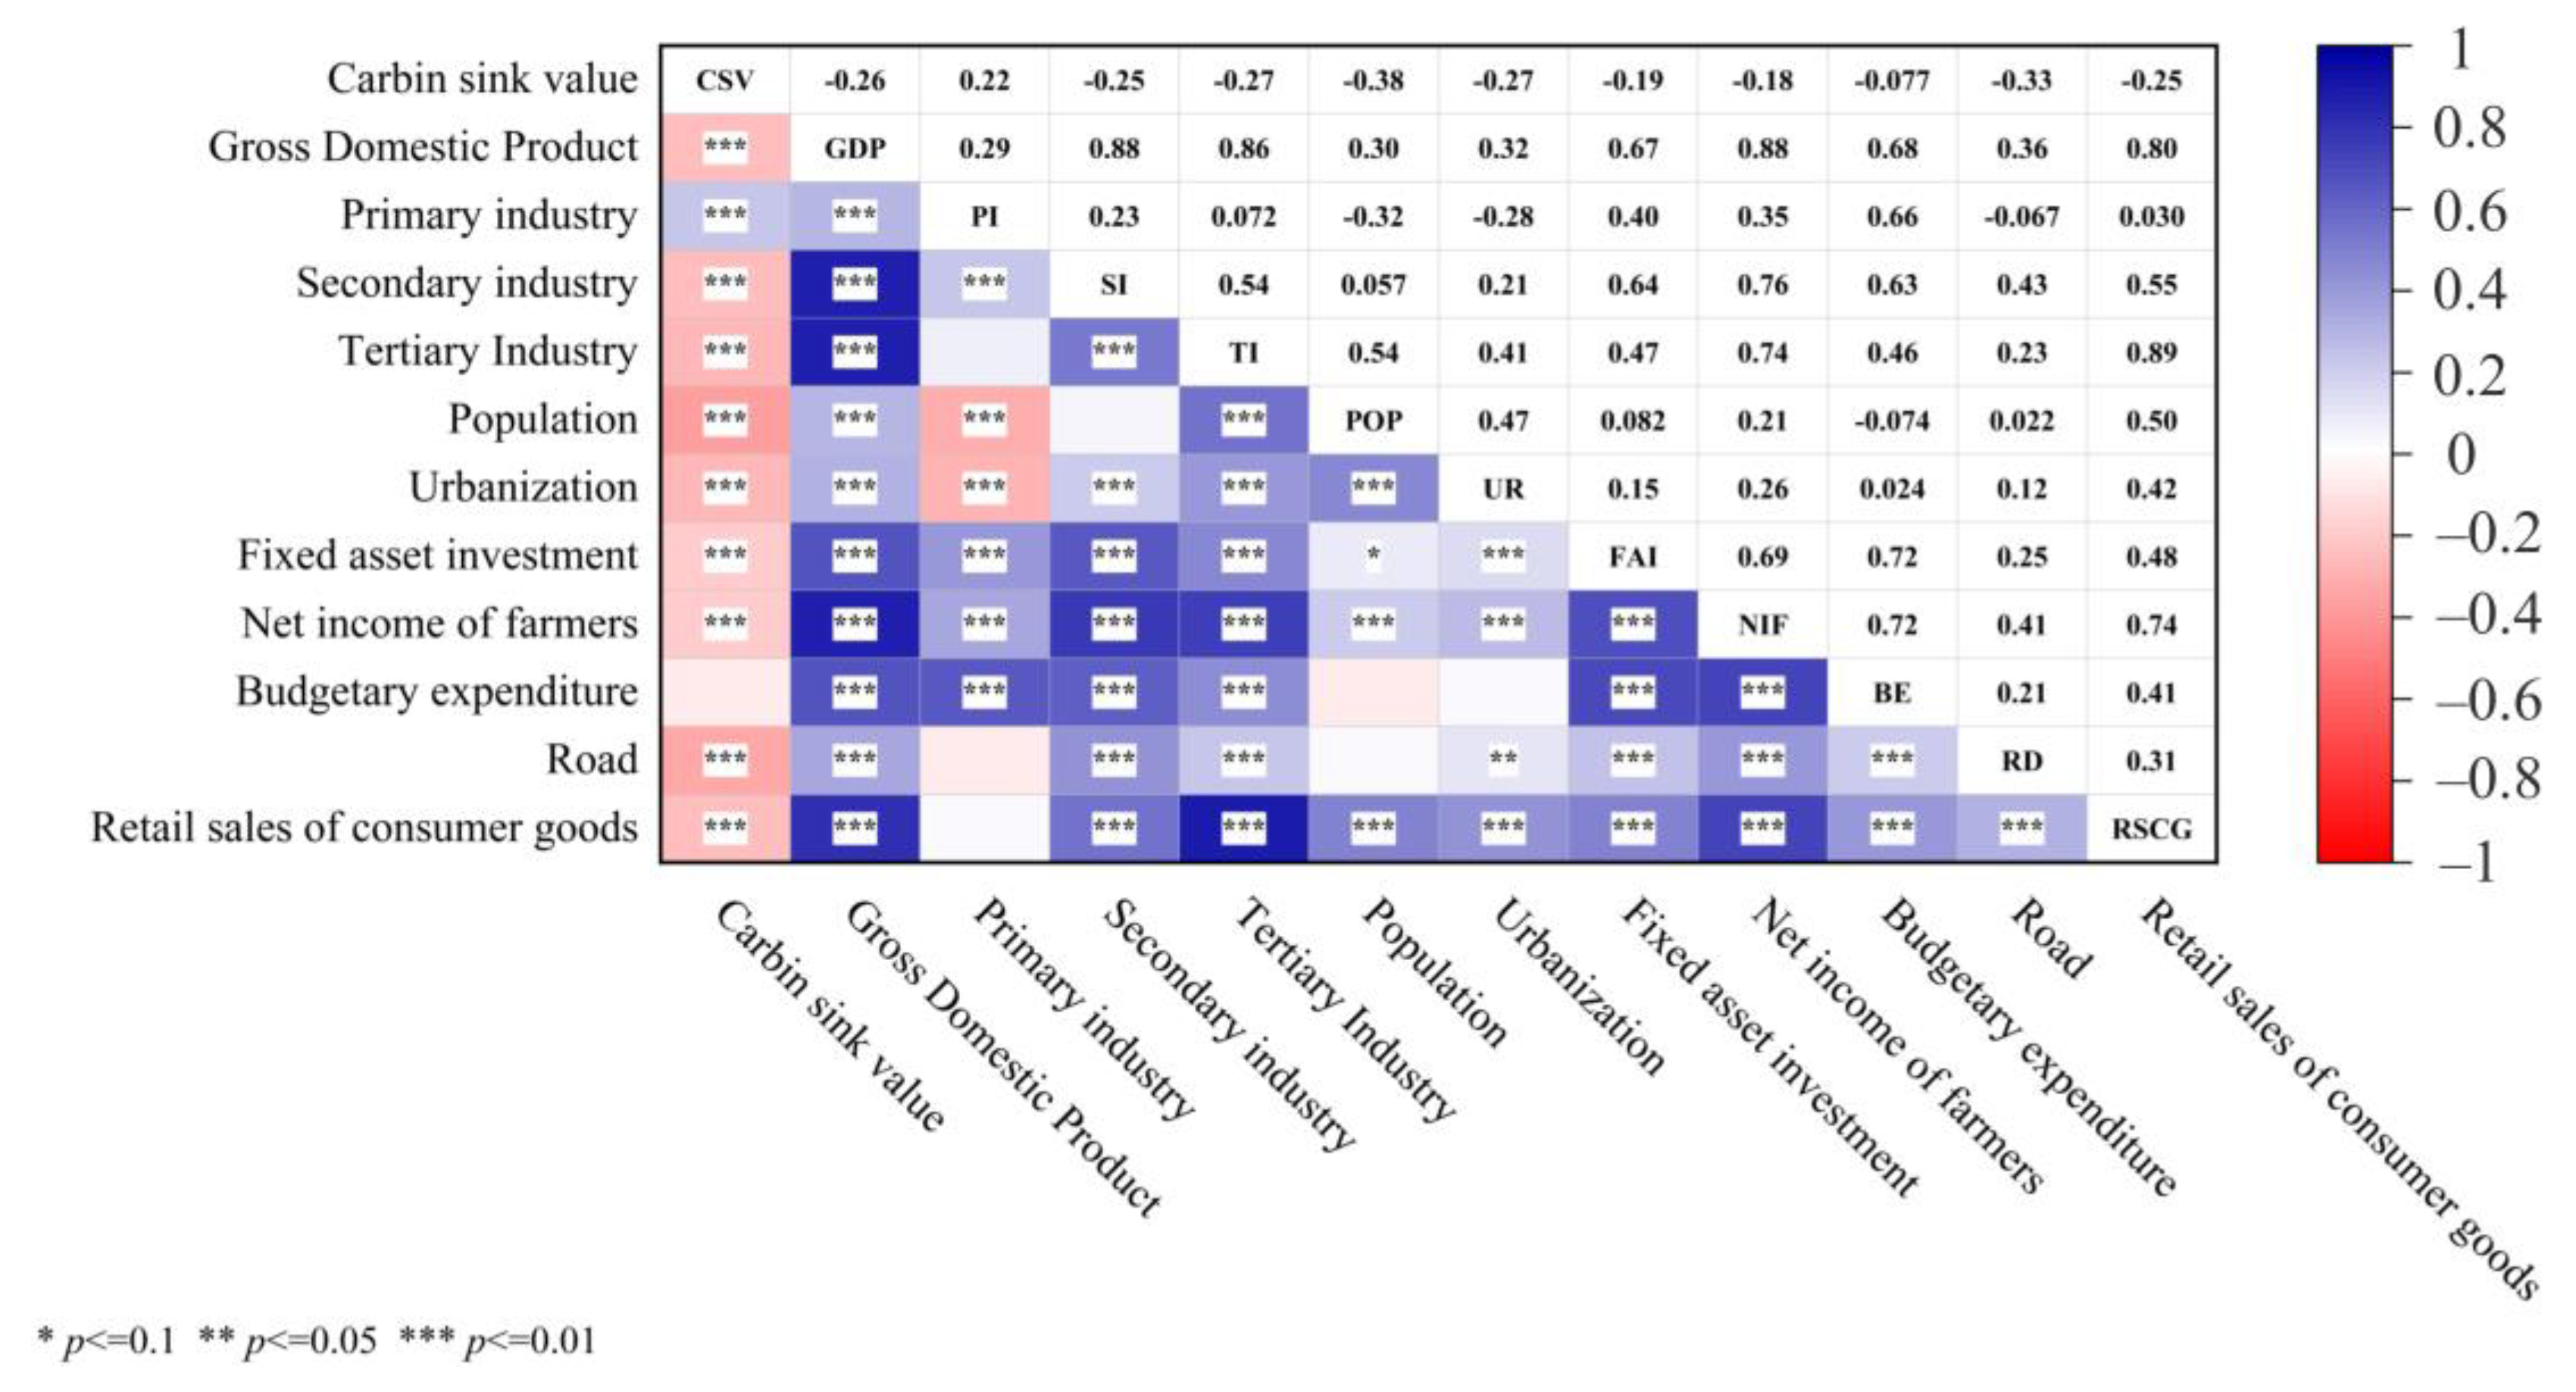
Correlation Analysis and Collinearity Diagnosis
2.3.3. Geographically and Temporally Weighted Regression
3. Results
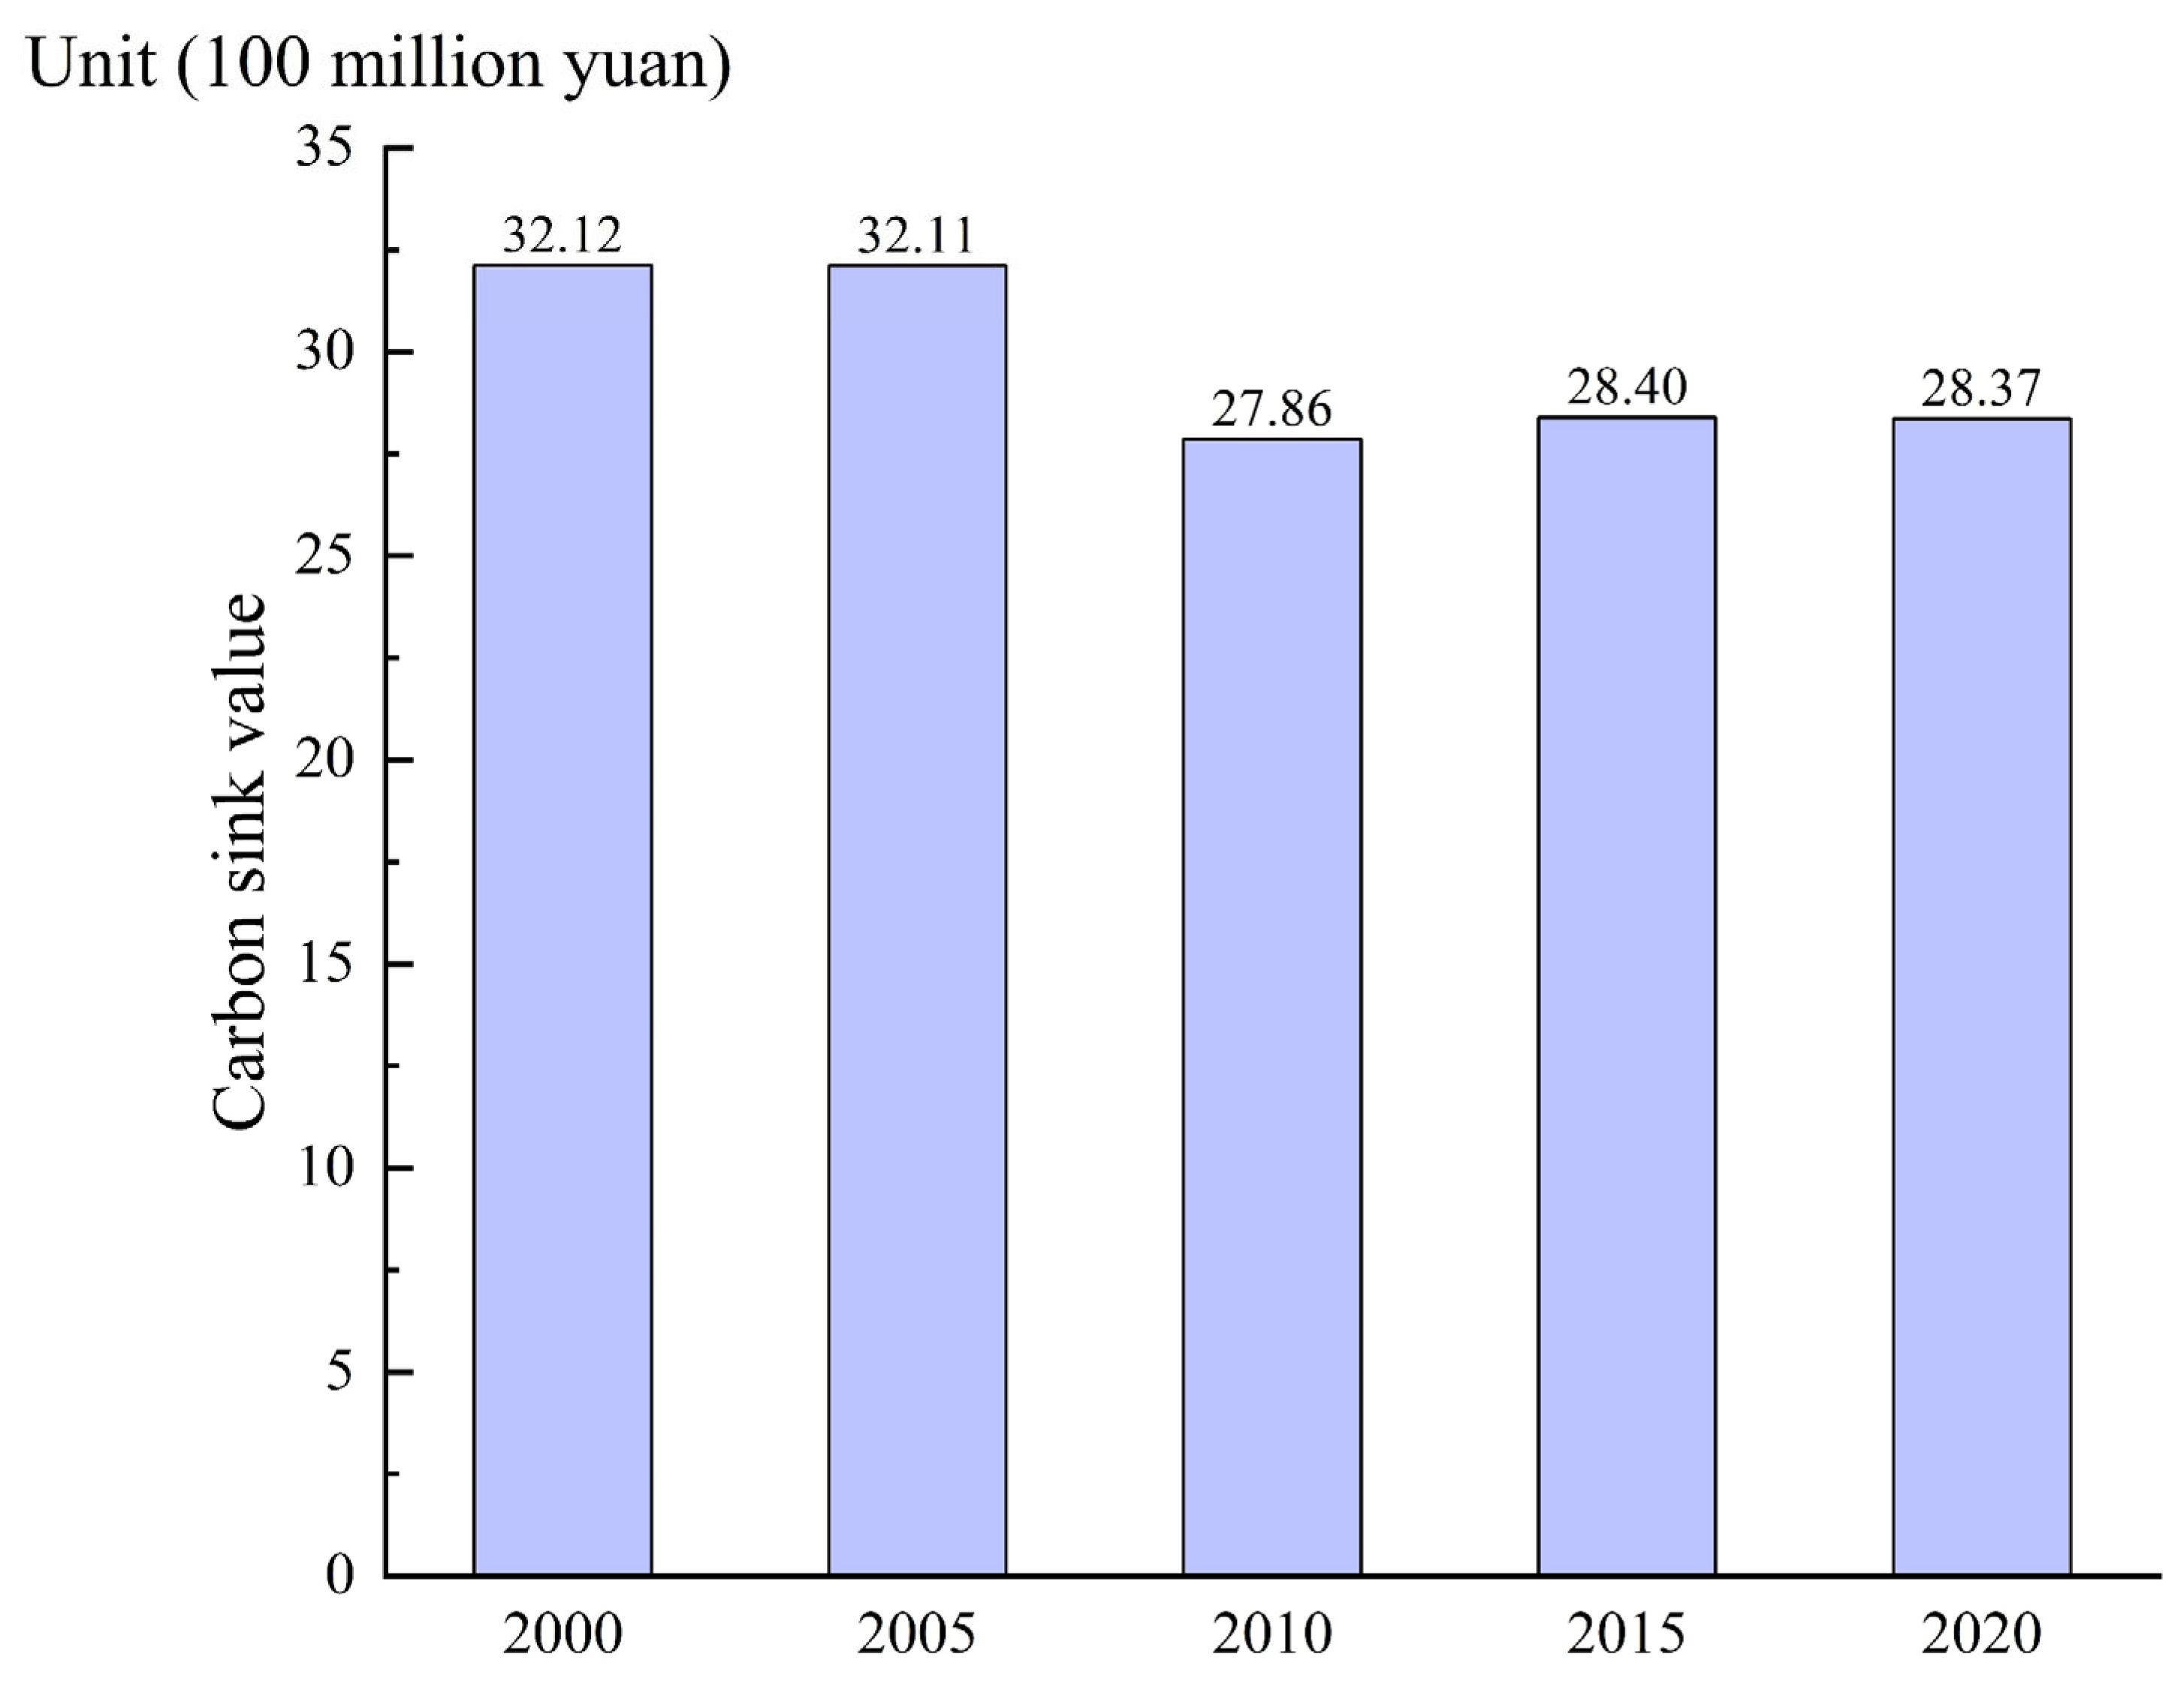
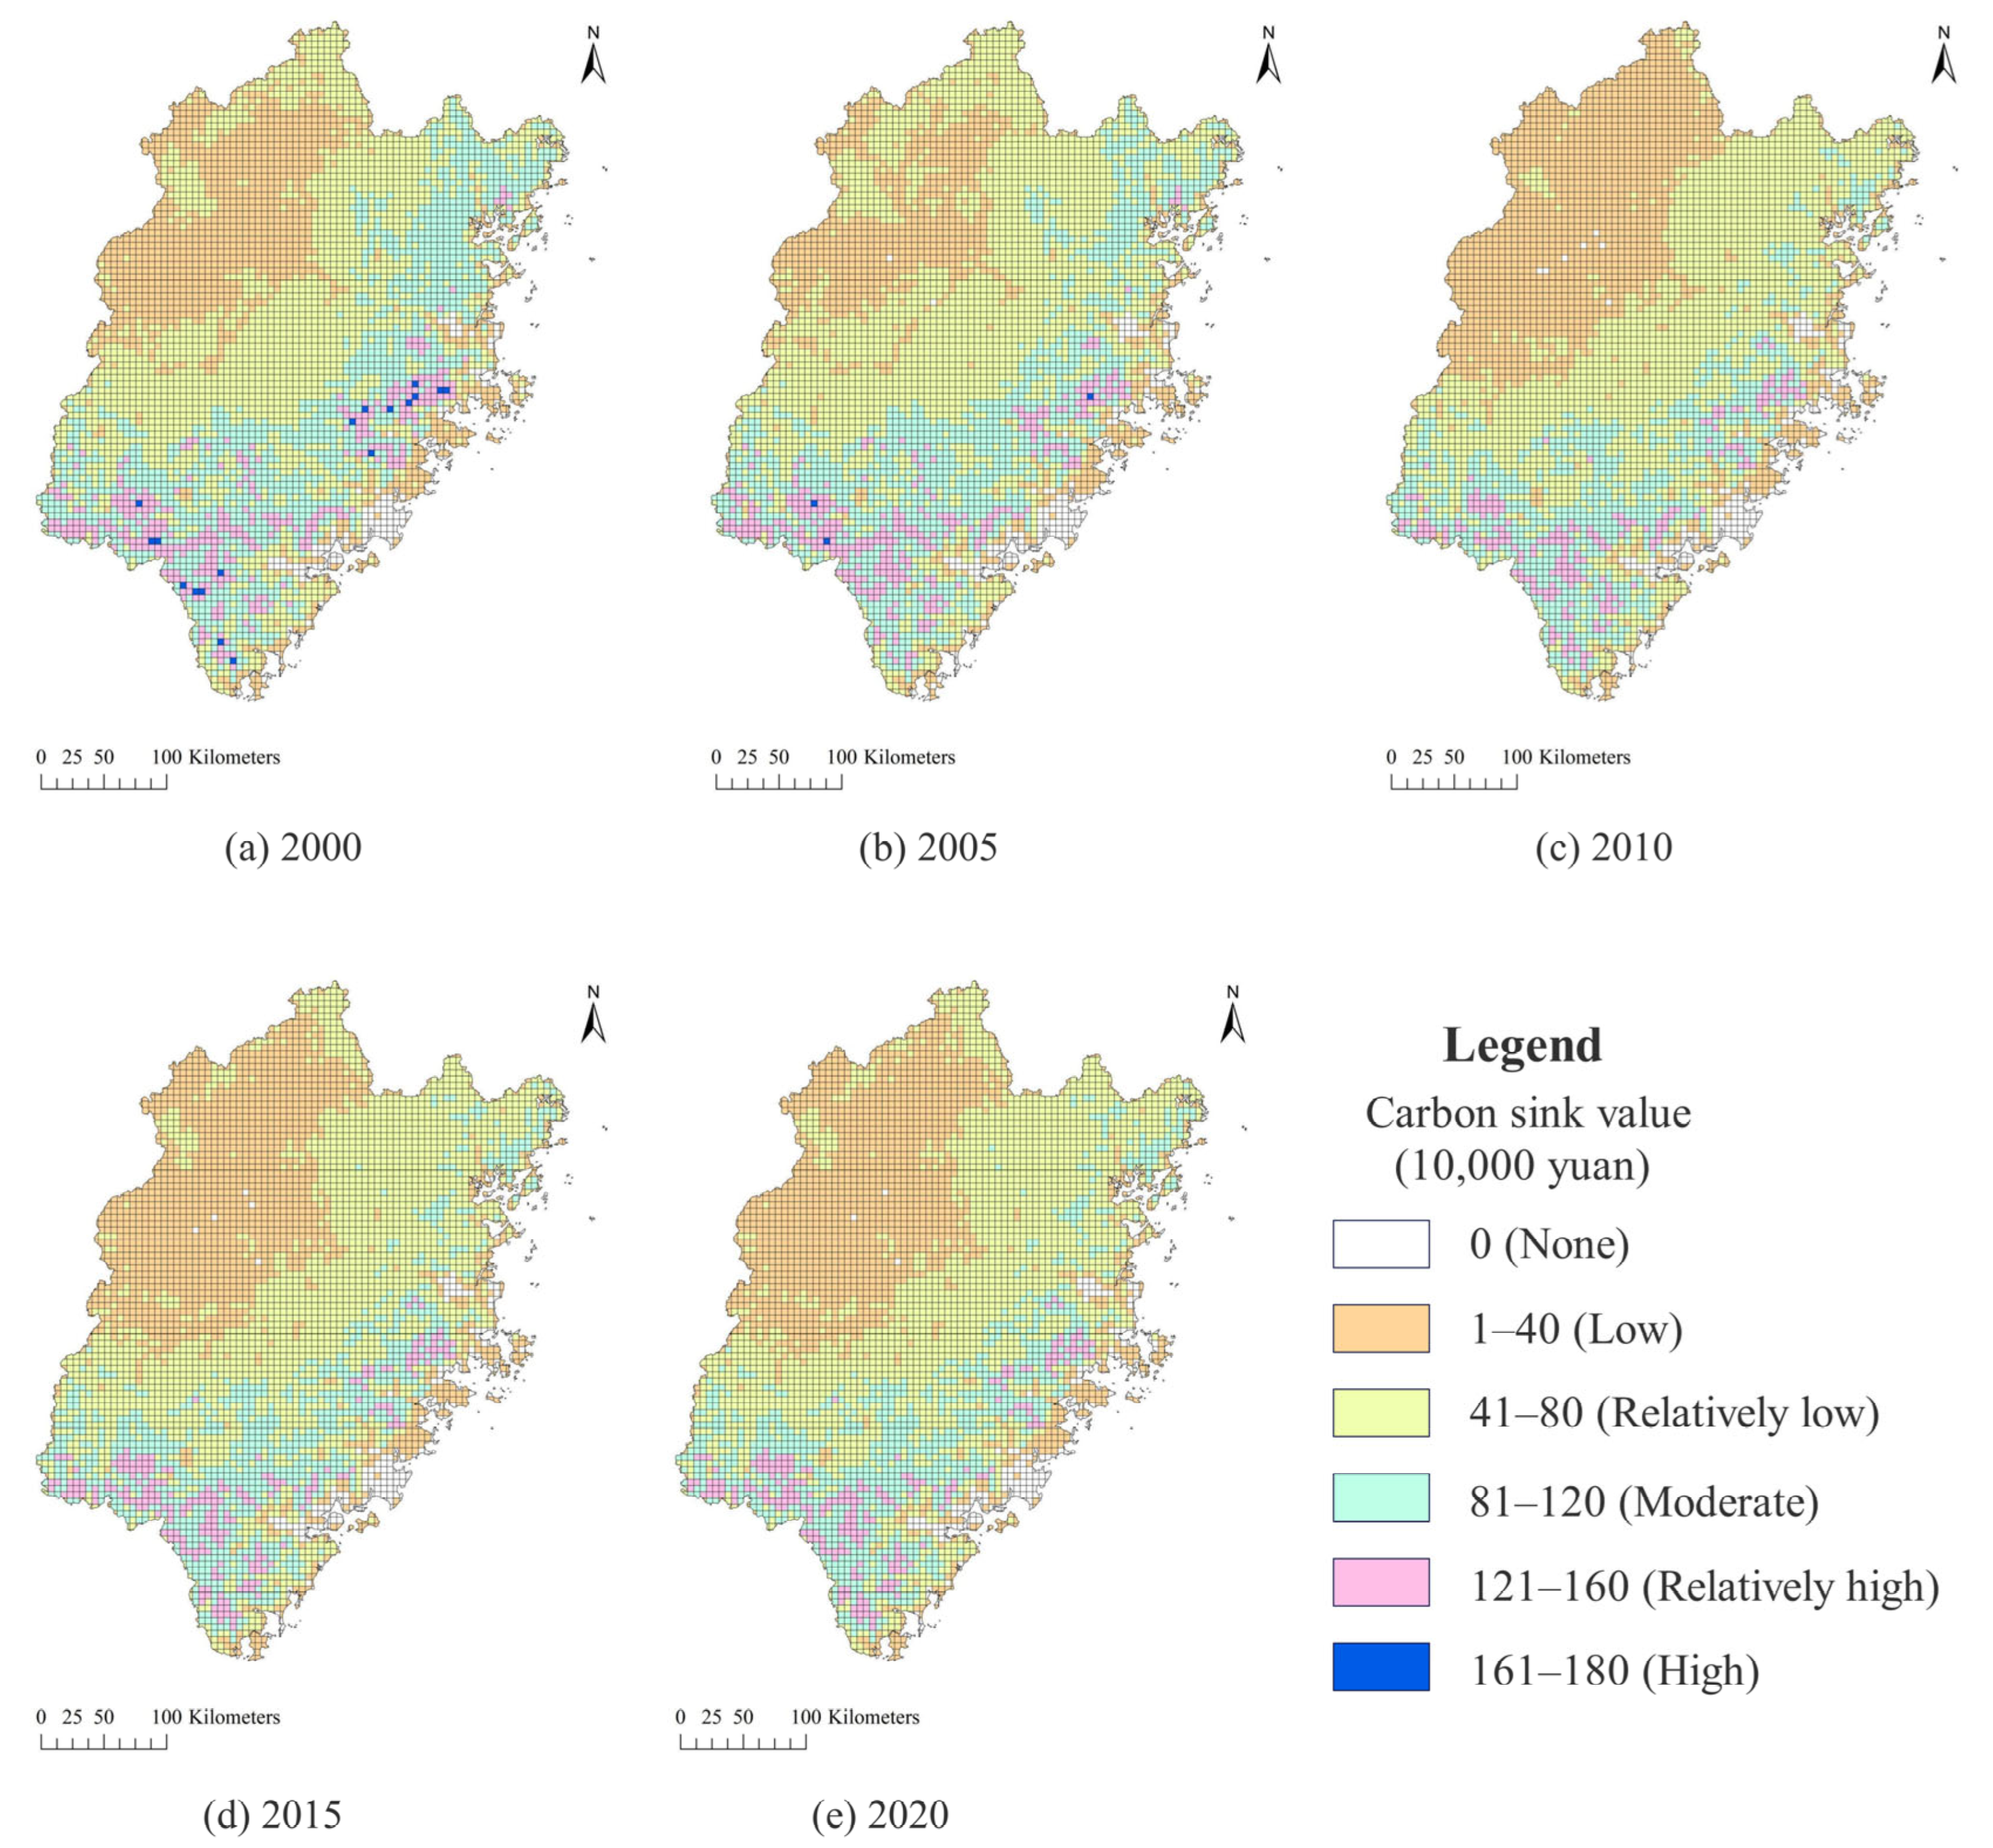
3.1. Spatiotemporal Characteristics of Carbon Sink Value
3.2. Test Results of Influencing Factors
3.3. Estimation Results of GTWR Model
3.3.1. Temporal Difference of the Factors
3.3.2. Spatial Difference of the Factors
4. Discussion
4.1. Comparison with International Findings on Carbon Sink Value
4.2. Spatio-Temporal Distribution Characteristics of Carbon Sink Value
4.3. Implications for Differentiated Policies
4.4. Uncertainty
5. Conclusions
Author Contributions
Funding
Data Availability Statement
Conflicts of Interest
Appendix A

| County | PI | SI | TI | P | U | FAI | NIF | R | RSCG |
|---|---|---|---|---|---|---|---|---|---|
| Anxi | 15.9835 | −5.7673 | −1.2651 | −0.0051 | −21.2941 | −2.1037 | 10.9893 | −14.0270 | 5.2536 |
| Cangshan | 8.8788 | −1.9835 | −1.1384 | −0.0017 | −29.0175 | −0.0188 | 10.3049 | −28.8745 | 0.6232 |
| Chengxiang | 20.0342 | −2.1125 | −0.0390 | −0.0023 | 18.4363 | −2.2427 | 7.9319 | −10.4282 | −0.4235 |
| Datian | −3.8477 | −8.8413 | 1.2828 | −0.0110 | −28.6159 | −1.8464 | 10.3711 | −2.4936 | 8.4232 |
| Dehua | 13.4107 | −4.5800 | −0.1686 | −0.0048 | 4.8074 | −3.1556 | 8.4121 | −13.0038 | 2.1451 |
| Dongshan | 5.0761 | −5.8513 | 7.4950 | −0.0084 | −23.9610 | 3.5304 | 11.4672 | −64.9250 | 2.1555 |
| Fengze | 11.2150 | −2.5918 | −1.3550 | −0.0030 | 9.5419 | −1.5021 | 10.5588 | −6.0279 | 0.5888 |
| Fuan | 3.6149 | −0.1216 | −4.4796 | −0.0019 | 10.1476 | −1.7602 | 19.6113 | −27.3902 | 0.4491 |
| Fuding | −6.5422 | 0.1979 | −9.2500 | 0.0344 | 8.0865 | −0.8461 | 36.9477 | −26.5257 | −3.4205 |
| Fuqing | 13.3989 | −0.7732 | −1.0263 | −0.0014 | −5.3436 | −0.8225 | 7.3752 | −14.9573 | 0.7975 |
| Gutian | 10.8123 | −1.7650 | −3.1211 | −0.0028 | −15.8005 | −1.3829 | 19.5899 | −52.5323 | 1.3747 |
| Guangze | 0.8108 | −9.4161 | −6.7397 | 0.2061 | 9.2886 | 0.2996 | 26.4849 | −25.3611 | 3.2549 |
| Haicang | 27.2940 | −3.9389 | −1.3549 | −0.0020 | −15.1728 | −0.5708 | 9.7382 | −11.2566 | 1.7532 |
| Hanjiang | 21.5382 | −1.6765 | −0.4132 | −0.0018 | 4.4943 | −1.5197 | 5.0720 | −12.3989 | 0.5073 |
| Huli | 28.6625 | −3.4724 | −1.2039 | −0.0018 | −10.0029 | −0.6424 | 8.9791 | −7.9062 | 1.2785 |
| Huaan | 13.6809 | −6.3855 | −2.1600 | −0.0060 | −25.9712 | −0.1420 | 13.0881 | −36.1001 | 7.2464 |
| Huian | 0.6042 | −1.9923 | −1.3053 | −0.0030 | 13.5705 | −1.3786 | 10.2117 | −6.0096 | 0.0800 |
| Jimei | 26.8871 | −4.0031 | −1.4885 | −0.0022 | −15.0372 | −0.8623 | 10.0563 | −9.4766 | 2.0621 |
| Jianning | 2.8362 | −3.1674 | −14.6309 | 0.2031 | −0.1744 | −1.1020 | 22.0334 | −1.6436 | 11.8220 |
| Jianou | −18.0136 | −6.4318 | −27.5936 | 0.0008 | 12.3906 | −2.6985 | 94.1063 | −42.8972 | −0.2384 |
| Jianyang | −7.6294 | −20.6415 | −36.9458 | 0.1613 | 17.7213 | −0.0977 | 116.6125 | −44.4926 | 2.4651 |
| Jiangle | 0.1786 | −4.0249 | −11.3893 | 0.0483 | 10.7043 | −0.6618 | 21.2068 | −15.8052 | 9.7711 |
| Jiaocheng | 6.5005 | −1.4329 | −1.8377 | −0.0022 | −6.7726 | −1.3153 | 16.5175 | −33.2570 | 0.0346 |
| Jinan | 6.5984 | −2.1421 | −1.3715 | −0.0019 | −33.4590 | −0.1567 | 12.8428 | −34.9172 | 0.6224 |
| Jinjiang | 19.9467 | −2.7332 | −1.1227 | −0.0022 | 3.6877 | −0.8670 | 8.9202 | −5.3283 | 0.6921 |
| Licheng | 15.8145 | −2.8844 | −1.3542 | −0.0029 | 7.3582 | −1.5053 | 10.5764 | −6.2045 | 0.8368 |
| Licheng | 15.8191 | −1.1498 | −0.0577 | −0.0019 | 15.2564 | −1.5740 | 5.1410 | −9.8433 | −0.0260 |
| Liancheng | −31.8773 | −4.3220 | 7.8831 | −0.0700 | 3.0263 | −1.8521 | −15.5766 | 99.8694 | 3.7051 |
| Lianjiang | 5.9563 | −2.0791 | −1.1380 | −0.0020 | −25.9351 | −0.1622 | 12.7255 | −33.8748 | 0.2822 |
| Longhai | 24.4829 | −4.5431 | −1.3205 | −0.0025 | −17.6674 | 0.4032 | 10.0577 | −22.4954 | 2.4910 |
| Longwen | 24.1939 | −4.9482 | −1.5757 | −0.0029 | −20.0591 | 0.1473 | 10.7507 | −23.0865 | 3.2122 |
| Luoyuan | 6.2674 | −1.9399 | −1.4290 | −0.0021 | −21.2059 | −0.6389 | 14.8537 | −35.9559 | 0.2597 |
| Luojiang | 14.3876 | −2.8777 | −1.5686 | −0.0036 | 17.5183 | −2.5359 | 13.3443 | −7.6264 | 0.1165 |
| Mawei | 6.9668 | −1.9977 | −1.0756 | −0.0018 | −28.1739 | 0.1083 | 10.9850 | −30.4082 | 0.4459 |
| Minhou | 9.3518 | −2.3502 | −1.4217 | −0.0020 | −35.2623 | −0.2477 | 12.2613 | −34.6093 | 0.7886 |
| Minqing | 15.0397 | −3.7658 | −0.6501 | −0.0022 | −29.3771 | 0.0064 | 8.1183 | −30.4012 | 0.3178 |
| Mingxi | −23.0039 | −0.8529 | −14.5784 | −0.0580 | −5.2053 | −1.0323 | 16.7737 | 27.0507 | 16.5909 |
| Nanan | 21.7802 | −3.7071 | −1.4066 | −0.0035 | 4.0494 | −2.0122 | 11.4684 | −7.5072 | 1.6034 |
| Nanjing | 15.2288 | −6.4448 | 0.7825 | −0.0078 | −23.5032 | 2.2457 | 6.2642 | −56.6368 | 7.0914 |
| Ninghua | −10.5000 | −3.3309 | −14.4794 | 0.1669 | 6.0106 | −1.4643 | 1.3143 | 54.1184 | 20.1179 |
| Pinghe | 18.5964 | −6.2333 | 6.9075 | −0.0092 | −21.8422 | 3.7642 | −2.6871 | −63.6388 | 4.0584 |
| Pingtan | 10.4525 | −0.9499 | −1.5337 | −0.0013 | −5.0219 | −0.5565 | 12.1137 | −17.4390 | 0.8790 |
| Pingnan | 8.4313 | −1.0697 | −5.5519 | −0.0027 | 2.5837 | −2.2154 | 26.4037 | −50.4884 | 1.9172 |
| Pucheng | −24.3845 | −17.6214 | −42.7575 | −0.0206 | 5.7070 | 0.2531 | 131.6210 | −55.9426 | 2.3173 |
| Qingliu | −26.5408 | −1.3609 | −15.8289 | −0.0274 | −1.8379 | −1.6829 | 4.5883 | 73.8125 | 20.3702 |
| Quangang | 8.6700 | −2.0773 | −0.9396 | −0.0028 | 18.5730 | −1.8944 | 10.3016 | −7.9788 | −0.3249 |
| Sanyuan | −25.5173 | −2.7965 | −10.6180 | −0.0855 | −9.8307 | −1.1238 | 25.6155 | 18.3518 | 11.0254 |
| Shaxian | −8.7242 | −4.3818 | −13.6242 | 0.0246 | −10.8210 | −1.1600 | 40.9681 | −1.5539 | 4.2562 |
| Shanghang | −26.5362 | 0.3799 | 17.3336 | −0.0582 | −34.5489 | −0.2164 | 0.1090 | −8.5871 | −11.4173 |
| Shaowu | 1.5683 | −8.5746 | −9.7489 | 0.1148 | 15.5562 | 0.0900 | 26.5249 | −30.4564 | 7.5602 |
| Shishi | 10.7804 | −2.2088 | −1.0441 | −0.0023 | 6.6847 | −0.8411 | 8.4767 | −4.9772 | 0.3999 |
| Shouning | 1.7816 | 1.1590 | −13.6201 | −0.0002 | 14.8781 | −2.0040 | 34.8969 | −31.9156 | 1.9322 |
| Shunchang | −3.9663 | −7.5184 | −28.2301 | 0.1487 | 13.6330 | −0.8177 | 76.3143 | −36.2856 | 5.3270 |
| Siming | 28.6986 | −3.3946 | −1.1185 | −0.0017 | −9.7850 | −0.5334 | 8.7474 | −8.3471 | 1.1029 |
| Songxi | −24.4696 | −5.3516 | −41.1911 | 0.0102 | 16.3446 | −1.8369 | 119.7730 | −51.1740 | 1.5911 |
| Taijiang | 8.5239 | −2.0626 | −1.1965 | −0.0018 | −31.0669 | −0.0425 | 10.8259 | −30.4142 | 0.6441 |
| Taining | 2.9268 | −3.9289 | −12.4313 | 0.0996 | 7.8697 | −0.6529 | 20.3418 | −16.4452 | 10.5275 |
| Tongan | 25.3661 | −4.1573 | −1.5752 | −0.0026 | −13.2786 | −1.1877 | 10.4935 | −8.1721 | 2.4291 |
| Wuping | −22.0098 | 5.7757 | 11.7330 | −0.0231 | −54.0756 | 0.3769 | 7.4760 | −69.2838 | −9.9003 |
| Wuyishan | −3.1201 | −30.1463 | −32.1573 | 0.0663 | 11.8937 | 0.8983 | 108.2856 | −52.9214 | 7.8438 |
| Xiapu | 2.6438 | −0.7260 | −3.5878 | −0.0020 | 10.0864 | −1.4939 | 20.6550 | −27.6305 | −0.3679 |
| Xianyou | 23.5510 | −3.4250 | −0.4356 | −0.0028 | 21.2699 | −3.3208 | 13.8602 | −11.5404 | −0.9080 |
| Xiangcheng | 21.9094 | −5.5884 | −1.7257 | −0.0038 | −21.6420 | 0.5666 | 11.1377 | −31.3730 | 4.6838 |
| Xiangan | 27.2147 | −3.5030 | −1.3106 | −0.0021 | −6.1582 | −0.8514 | 9.3777 | −6.4137 | 1.4563 |
| Xinluo | −10.8335 | −3.7299 | 3.0146 | −0.0199 | −21.2234 | −0.3040 | 14.9816 | −33.7534 | 0.2996 |
| Xiuyu | 8.7767 | −0.8465 | 0.0214 | −0.0019 | 16.3443 | −1.1580 | 5.0299 | −8.6935 | −0.2183 |
| Yanping | 7.2043 | −6.6162 | −8.9568 | −0.0011 | −11.1001 | −2.3276 | 32.9429 | −23.6696 | 2.3887 |
| Yongan | −25.9435 | −5.5793 | −10.4141 | −0.0747 | −10.9063 | −1.5680 | 21.1559 | 32.7433 | 16.4764 |
| Yongchun | 14.5084 | −5.3248 | −0.2097 | −0.0063 | −4.0425 | −2.8872 | 8.7405 | −12.2749 | 4.3721 |
| Yongtai | 22.0466 | −3.8467 | −0.1849 | −0.0021 | −8.5873 | −1.1718 | 5.5810 | −15.2251 | 0.2854 |
| Youxi | 11.1033 | −6.7803 | −0.6224 | −0.0017 | −30.2510 | −2.1009 | 9.0971 | −0.3129 | 0.2499 |
| Yunxiao | 15.1080 | −5.6282 | 5.7846 | −0.0078 | −19.6982 | 3.9461 | 3.0070 | −66.5510 | 4.7222 |
| Zhangping | −1.7381 | −6.8265 | 1.1870 | −0.0112 | −20.9779 | −0.8888 | 12.2294 | −28.6895 | 5.9364 |
| Zhangpu | 19.3500 | −4.8568 | −1.1677 | −0.0032 | −17.1030 | 1.7983 | 9.9953 | −37.2112 | 3.8912 |
| Changle | 8.5916 | −1.7102 | −1.0305 | −0.0016 | −20.7526 | 0.0836 | 10.1019 | −25.7139 | 0.4738 |
| Changtai | 22.9546 | −5.0117 | −1.8746 | −0.0031 | −22.4598 | −0.8272 | 11.5862 | −16.5333 | 3.6464 |
| Changting | 29.6196 | −10.9522 | 9.3002 | 0.4234 | −15.4957 | 0.1178 | −51.7748 | 65.1048 | 9.1367 |
| Zhaoan | 8.7088 | −6.5803 | 18.5141 | −0.0149 | −28.6439 | 3.5316 | −0.2910 | −66.7754 | −2.6343 |
| Zherong | 0.3971 | 0.8197 | −9.7115 | −0.0007 | 14.8247 | −1.5743 | 29.7526 | −30.1623 | 0.4705 |
| Zhenghe | −1.2476 | −0.4244 | −21.2517 | −0.0001 | 19.6837 | −2.8706 | 61.2792 | −49.4016 | 2.8838 |
| Zhouning | 5.5590 | −0.1925 | −5.5249 | −0.0021 | 8.2904 | −2.0338 | 22.2778 | −34.1989 | 1.4103 |
| Gulou | 8.1579 | −2.1120 | −1.2493 | −0.0018 | −32.2988 | −0.0584 | 11.3085 | −31.6739 | 0.6570 |
| Yongding | −4.5524 | −1.8789 | 16.7254 | −0.0272 | −38.9686 | 1.7607 | −13.0309 | −49.6323 | −5.0154 |
References
- Kwon, D.S.; Cho, J.H.; Sohn, S.Y. Comparison of technology efficiency for CO2 emissions reduction among European countries based on DEA with decomposed factors. J. Clean. Prod. 2017, 151, 109–120. [Google Scholar] [CrossRef]
- Xu, G.; Zang, L.; Schwarz, P.; Yang, H. Achieving China’s carbon neutrality goal by economic growth rate adjustment and low-carbon energy structure. Energy Policy 2023, 183, 113817. [Google Scholar] [CrossRef]
- Huang, Y.; Li, Z.; Shi, M. Prediction of plant carbon sink potential in Beijing-Tianjin-Hebei region of China. Environ. Dev. Sustain. 2022, 26, 3529–3556. [Google Scholar] [CrossRef]
- Yu, X.; Sun, F.; Zhao, H.; Dai, J.; Shu, Y.; Chen, X. Design and selection of carbon quota mechanisms from the perspective of carbon trading. Manag. Decis. Econ. 2023, 44, 4572–4588. [Google Scholar] [CrossRef]
- Zhang, Y.; Chen, J.; Hu, M.; Offer, A. Valuation of forest carbon sinks in China within the framework of the system of national accounts. J. For. Res. 2016, 27, 1321–1328. [Google Scholar] [CrossRef]
- Li, J.; Wang, H.; Fan, C. Regional Differences Dynamic Evolution and Convergence of Ecological Efficiency of Cultivated Land Use in China Under the Dual Carbon Target. J. Huazhong Agric. Univ. (Soc. Sci. Ed.) 2023, 5, 167–181. [Google Scholar] [CrossRef]
- Wang, X.; Wang, Y.; Shi, H.; Zheng, W.; Zhou, R. Discussion of carbon sequestration estimates in the island terrestrial ecosystems. Acta Ecol. Sinica. 2014, 34, 88–96. [Google Scholar] [CrossRef]
- Yu, Y.; Wang, X. Estimation of urban green space carbon sink for ecosystem service function. J. Xi’an Univ. Archit. Technol. (Nat. Sci. Ed.) 2021, 53, 95–102. [Google Scholar] [CrossRef]
- Zhao, D.; Cai, J.; Xu, Y.; Liu, Y.; Yao, M. Carbon sinks in urban public green spaces under carbon neutrality: A bibliometric analysis and systematic literature review. Urban For. Urban Green. 2023, 86, 128037. [Google Scholar] [CrossRef]
- Schiestl-Aalto, P.; Kulmala, L.; Mäkinen, H.; Nikinmaa, E.; Mäkelä, A. CASSIA—A dynamic model for predicting intra-annual sink demand and interannual growth variation in Scots pine. New Phytol. 2015, 206, 647–659. [Google Scholar] [CrossRef] [PubMed]
- Torres, A.B.; Marchant, R.; Lovett, J.C.; Smart, J.C.; Tipper, R. Analysis of the carbon sequestration costs of afforestation and reforestation agroforestry practices and the use of cost curves to evaluate their potential for implementation of climate change mitigation. Ecol. Econ. 2010, 69, 469–477. [Google Scholar] [CrossRef]
- Zang, Z. Analysis of intrinsic value and estimating losses of “blue carbon” in coastal wetlands: A case study of Yancheng, China. Ecosyst. Health Sustain. 2019, 5, 216–225. [Google Scholar] [CrossRef]
- Ge, J.; Zhang, Z.; Lin, B. Towards Carbon Neutrality: How Much Do For. Carbon Sink. Cost China? Environ. Impact Assess. Rev. 2022, 98, 106949. [Google Scholar] [CrossRef]
- Zhang, J.; Chen, Q. Study on economic value assessment of forest carbon sequestration—Taking Fujian province as an example. J. Southwest Univ. (Nat. Sci. Ed.) 2021, 43, 121–128. [Google Scholar] [CrossRef]
- Bherwani, H.; Banerji, T.; Menon, R. Role and value of urban forests in carbon sequestration: Review and assessment in Indian context. Environ. Dev. Sustain. 2022, 26, 603–626. [Google Scholar] [CrossRef]
- Pan, Y.; Zhang, H.; Wang, C.; Zhou, Y. Impact of land use change on regional carbon sink capacity: Evidence from Sanmenxia, China. Ecol. Indic. 2023, 156, 111189. [Google Scholar] [CrossRef]
- Houghton, R.A. Interactions Between Land-Use Change and Climate-Carbon Cycle Feedbacks. Curr. Clim. Change Rep. 2018, 4, 115–127. [Google Scholar] [CrossRef]
- Cao, X.; Li, X.; Breeze, T. Quantifying the Carbon Sequestration Costs for Pinus elliottii Afforestation Project of China Greenhouse Gases Voluntary Emission Reduction Program: A Case Study in Jiangxi Province. Forests 2020, 11, 928. [Google Scholar] [CrossRef]
- Jung, M. The role of forestry projects in the clean development mechanism. Environ. Sci. Policy 2005, 8, 87–104. [Google Scholar] [CrossRef]
- Twyman, C.; Smith, T.A.; Arnall, A. What is carbon? Conceptualising carbon and capabilities in the context of community sequestration projects in the global South. WIREs Clim. Change 2015, 6, 627–641. [Google Scholar] [CrossRef]
- Ba, F.; Liu, J.; Zhu, T.; Liu, Y.; Zhao, J. CDM forest carbon sequestration projects in western China: An analysis using actor-centered power theory. For. Policy Econ. 2020, 115, 102139. [Google Scholar] [CrossRef]
- Shi, X.; Wang, T.; Lu, S.; Chen, K.; He, D.; Xu, Z. Evaluation of China’s forest carbon sink service value. Environ. Sci. Pollut. Res. 2022, 29, 44668–44677. [Google Scholar] [CrossRef] [PubMed]
- Feng, B. Forest Carbon Sink Resource Asset Evaluation with Case Study of Fujian Province in China. Math. Probl. Eng. 2022, 2022, 7391473. [Google Scholar] [CrossRef]
- Wang, D.; Li, V.J.; Yu, H. Mass Appraisal Modeling of Real Estate in Urban Centers by Geographically and Temporally Weighted Regression: A Case Study of Beijing’s Core Area. Land 2020, 9, 143. [Google Scholar] [CrossRef]
- RESDC. Data Center for Resources and Environmental Sciences, Chinese Academy of Sciences. 2021. Available online: https://www.resdc.cn/ (accessed on 13 June 2023).
- Xu, L.; He, N.; Yu, G. A dataset of carbon density in Chinese terrestrial ecosystems (2010s). Sci. Data Bank 2018, 4, 86–92. [Google Scholar] [CrossRef]
- MODIS. Search Data Catalog. 2021. Available online: https://lpdaac.usgs.gov/product_search/?view=listhttps://lpdaac.usgs.gov/product_search/?view=list (accessed on 16 June 2023).
- David, T.; William, R.; Warren, C.; Stith, G.; Steve, R.; Zhao, M.; Costa, M.H.; Kirschbaum, A.A.; Ham, J.M.; Saleska, S.R.; et al. Evaluation of MODIS NPP and GPP products across multiple biomes. Remote Sens. Environ. 2006, 102, 282–292. [Google Scholar] [CrossRef]
- Muñoz, S.J. ERA5-Land Monthly Averaged Data from 1950 to Present. Copernicus Climate Change Service (C3S) Climate Data Store (CDS). 2019. Available online: https://cds.climate.copernicus.eu/datasets/reanalysis-era5-land-monthly-means?tab=overview (accessed on 13 June 2023).
- NCEI. Daily Temperature Data from National Centers for Environmental Information. 2021. Available online: https://www.ncei.noaa.gov/data/global-summary-of-the-day/archive/?C=D;O=D (accessed on 20 July 2023).
- Wind. Carbon Emissions Database. 2021. Available online: https://www.wind.com.cn/portal/zh/ESG/carbonIndex.html (accessed on 10 July 2023).
- Fujian Provincial Bureau of Statistics. 2021. Annual Data. Available online: https://tjj.fujian.gov.cn/xxgk/ndsj/ (accessed on 12 July 2023).
- Biswas, S.; Bala, S.; Mazumdar, A. Diurnal and seasonal carbon sequestration potential of seven broadleaved species in a mixed deciduous forest in India. Atmos. Environ. 2014, 89, 827–834. [Google Scholar] [CrossRef]
- Velasco, E.; Perrusquia, R.; Jiménez, E.; Hernández, F.; Camacho, P.; Rodríguez, S.; Retama, A.; Molina, L. Sources and sinks of carbon dioxide in a neighborhood of Mexico City. Atmos. Environ. 2014, 97, 226–238. [Google Scholar] [CrossRef]
- Xu, Q.; Yang, R.; Dong, Y.; Liu, Y.; Qiu, L. The influence of rapid urbanization and land use changes on terrestrial carbon sources/sinks in Guangzhou, China. Ecol. Indic. 2016, 70, 304–316. [Google Scholar] [CrossRef]
- Li, J.; Guo, X.; Chuai, X.; Xie, F.; Yang, F.; Gao, R.; Ji, X. Reexamine China’s terrestrial ecosystem carbon balance under land use-type and climate change. Land Use Policy 2021, 102, 105275. [Google Scholar] [CrossRef]
- Ye, X.; Chuai, X. Carbon sinks/sources’ spatiotemporal evolution in China and its response to built-up land expansion. J. Environ. Manag. 2022, 321, 115863. [Google Scholar] [CrossRef] [PubMed]
- Yu, G.; Zheng, Z.; Wang, Q.; Fu, Y.; Zhuang, J.; Sun, X.; Wang, Y. Spatiotemporal Pattern of Soil Respiration of Terrestrial Ecosystems in China: The Development of a Geostatistical Model and Its Simulation. Environ. Sci. Technol. 2010, 44, 6074–6080. [Google Scholar] [CrossRef] [PubMed]
- Qiao, W.; Guan, W.; Huang, X. Assessing the Potential Impact of Land Use on Carbon Storage Driven by Economic Growth: A Case Study in Yangtze River Delta Urban Agglomeration. Int. J. Environ. Res. Public Health 2021, 18, 11924. [Google Scholar] [CrossRef] [PubMed]
- Gong, W.; Duan, X.; Mao, M.; Hu, J.; Sun, Y.; Wu, G.; Zhang, Y.; Xie, Y.; Qiu, X.; Rao, X.; et al. Assessing the impact of land use and changes in land cover related to carbon storage by linking trajectory analysis and InVEST models in the Nandu River Basin on Hainan Island in China. Front. Environ. Sci. 2022, 10, 1038752. [Google Scholar] [CrossRef]
- Catherine, M.; Shem, K.; Mary, N.; Anne, K.; Ingrid, Ö.; Meine, N. Agroforestry’s contribution to livelihoods and carbon sequestration in East Africa: A systematic review. Trees For. People 2023, 14, 100432. [Google Scholar] [CrossRef]
- Hu, Q.; Zhang, J.; Xue, H.; Wang, J.; Li, A. Spatiotemporal Variations in Carbon Sources and Sinks in National Park Ecosystem and the Impact of Tourism. Sustainability 2024, 16, 7895. [Google Scholar] [CrossRef]
- Seto, K.C.; Güneralp, B.; Hutyra, L.R. Global forecasts of urban expansion to 2030 and direct impacts on biodiversity and carbon pools. Proc. Natl. Acad. Sci. USA 2012, 109, 16083–16088. [Google Scholar] [CrossRef] [PubMed]
- Knoke, T.; Bendix, J.; Pohle, P.; Hamer, U.; Hildebrandt, P.; Roos, K.; Gerique, A.; Sandoval, M.L.; Breuer, L.; Tischer, A.; et al. Afforestation or intense pasturing improve the ecological and economic value of abandoned tropical farmlands. Nat. Commun. 2014, 5, 5612. [Google Scholar] [CrossRef] [PubMed]
- Zhou, T.; Luo, X.; Hou, Y.; Xiang, Y.; Peng, S. Quantifying the effects of road width on roadside vegetation and soil conditions in forests. Landsc. Ecol. 2020, 35, 69–81. [Google Scholar] [CrossRef]
- Poor, E.E.; Jati, V.I.M.; Imron, M.A.; Kelly, M.J. The road to deforestation: Edge effects in an endemic ecosystem in Sumatra, Indonesia. PLoS ONE 2019, 14, e0217540. [Google Scholar] [CrossRef] [PubMed]
- Wang, D.; Xu, P.; An, B.; Guo, Q. Urban green infrastructure: Bridging biodiversity conservation and sustainable urban development through adaptive management approach. Front. Ecol. Evol. 2024, 12, 1440477. [Google Scholar] [CrossRef]
- Cui, J.; Chen, X.; Han, W.; Cui, X.; Ma, W.; Li, G. Estimation of Soil Salt Content at Different Depths Using UAV Multi-Spectral Remote Sensing Combined with Machine Learning Algorithms. Remote Sens. 2023, 15, 5254. [Google Scholar] [CrossRef]
- Zhao, F.; Miao, F.; Wu, Y.; Xiong, Y.; Gong, S.; Sun, D. Land subsidence susceptibility mapping in urban settlements using time-series PS-InSAR and random forest model. Gondwana Res. 2023, 125, 406–424. [Google Scholar] [CrossRef]
- Huang, B.; Wu, B.; Barry, M. Geographically and temporally weighted regression for modeling spatio-temporal variation in house prices. Int. J. Geogr. Inf. Sci. 2010, 24, 383–401. [Google Scholar] [CrossRef]
- Wang, Y.; Niu, Y.; Li, M.; Yu, Q.; Chen, W. Spatial structure and carbon emission of urban agglomerations: Spatiotemporal characteristics and driving forces. Sustain. Cities Soc. 2022, 78, 103600. [Google Scholar] [CrossRef]
- Pan, Y.; Birdsey, R.A.; Phillips, O.L.; Houghton, R.A.; Fang, J.; Kauppi, P.E.; Keith, H.; Kurz, W.A.; Ito, A.; Lewis, S.L.; et al. The enduring world forest carbon sink. Nature 2024, 631, 563–569. [Google Scholar] [CrossRef] [PubMed]
- Hutyra, L.R.; Duren, R.; Gurney, K.R.; Grimm, N.; Kort, E.A.; Larson, E.; Shrestha, G. Urbanization and the carbon cycle: Current capabilities and research outlook from the natural sciences perspective. Earth’s Future 2014, 2, 473–495. [Google Scholar] [CrossRef]
- Aitali, R.; Snoussi, M.; Kolker, A.S.; Oujidi, B.; Mhammdi, N. Effects of Land Use/Land Cover Changes on Carbon Storage in North African Coastal Wetlands. J. Mar. Sci. Eng. 2022, 10, 364. [Google Scholar] [CrossRef]
- Gloor, M.; Gatti, L.; Brienen, R.; Feldpausch, T.R.; Phillips, O.L.; Miller, J.; Ometto, J.P.; Rocha, H.; Baker, T.; De Jong, B.; et al. The carbon balance of South America: A review of the status, decadal trends and main determinants. Biogeosciences 2012, 9, 5407–5430. [Google Scholar] [CrossRef]
- Haight, R.G.; Bluffstone, R.; Kline, J.D.; Coulston, J.W.; Wear, D.N.; Zook, K. Estimating the Present Value of Carbon Sequestration in U.S. Forests, 2015–2050, for Evaluating Federal Climate Change Mitigation Policies. Agric. Resour. Econ. Rev. 2020, 49, 150–177. [Google Scholar] [CrossRef]
- Mackey, B.; Moomaw, W.; Lindenmayer, D.; Keith, H. Net carbon accounting and reporting are a barrier to understanding the mitigation value of forest protection in developed countries. Environ. Res. Lett. 2022, 17, 054028. [Google Scholar] [CrossRef]
- Cao, Y.; Xing, H.; Wang, Z. Factors Influencing Changes in Forestry Carbon Sinks Under the ‘Dual Carbon’ Framework in Southwest China: Evidence from Satellite Remote Sensing Data. Sustainability 2024, 16, 10889. [Google Scholar] [CrossRef]
- Xu, M.; Lin, B. Towards low-carbon economy by carbon label?: Survey evidence from first-tier cities in China. Environ. Impact Assess. Rev. 2022, 97, 106902. [Google Scholar] [CrossRef]
- Wu, B.; Zhang, Y.; Wang, Y.; Wu, S.; Wu, Y. Spatio-temporal variations of the land-use-related carbon budget in Southeast China: The evidence of Fujian province. Environ. Res. Commun. 2023, 5, 115015. [Google Scholar] [CrossRef]
- Cui, G.; Chen, Y.; Cao, Y. Temporal-Spatial Pattern of Carbon Stocks in Forest Ecosystems in Shaanxi, Northwest China. PLoS ONE 2015, 10, e0137452. [Google Scholar] [CrossRef] [PubMed]
- Li, N.; Duan, X.; Wang, H.; Mu, H.; Li, Y.; Yang, W. Influencing factors and prediction of net carbon sink in the primary sector of the coastal city in China. Environ. Sci. Pollut. Res. 2023, 30, 48168–48178. [Google Scholar] [CrossRef] [PubMed]
- Dong, M.; Liu, Z.; Ni, X.; Qi, Z.; Wang, J.; Zhang, Q. Re-Evaluating the Value of Ecosystem Based on Carbon Benefit: A Case Study in Chengdu, China. Land 2023, 12, 1605. [Google Scholar] [CrossRef]
- Zhou, S.; Dai, J.; Bu, J. City size distributions in China 1949 to 2010 and the impacts of government policies. Cities 2013, 32, S51–S57. [Google Scholar] [CrossRef]
- Deng, Y.; Liu, Y.; Fu, B. Urban growth simulation guided by ecological constraints in Beijing city: Methods and implications for spatial planning. J. Environ. Manag. 2019, 243, 402–410. [Google Scholar] [CrossRef] [PubMed]
- Chen, R.; Carruthers-Jones, J.; Carver, S.; Wu, J. Constructing urban ecological corridors to reflect local species diversity and conservation objectives. Sci. Total Environ. 2024, 907, 167987. [Google Scholar] [CrossRef] [PubMed]
- Canavari, M.; Coderoni, S. Consumer stated preferences for dairy products with carbon footprint labels in Italy. Agric. Food Econ. 2020, 8, 4. [Google Scholar] [CrossRef]


| Data | Source | Resolution |
|---|---|---|
| Land use cover | RESDC, 2021 [25] | 30 m × 30 m |
| Soil organic carbon | Xu et al., 2018 [26] | - |
| Net primary productivity | MODIS, 2021 [27] | 1 km × 1 km |
| Precipitation | Muñoz, 2019 [29] | 0.1° × 0.1° |
| Temperature | NCEI, 2021 [30] | - |
| Carbon trading | Wind Information Co., Ltd., 2021 [31] | - |
| Social and economic statistics | Fujian Provincial Bureau of Statistics, 2021 [32] | - |
| Variables | Description | Mean | Std. Dev | Min | Max |
|---|---|---|---|---|---|
| Gross Domestic Product | GDP per capita (CNY 10,000) | 4.78 | 4.12 | 0.16 | 30.76 |
| Primary Industry | Gross value of primary industry per capita (CNY 10,000) | 0.53 | 0.50 | 0.00 | 3.39 |
| Secondary Industry | Gross value of secondary industry per capita (CNY 10,000) | 2.30 | 2.24 | 0.09 | 16.54 |
| Tertiary Industry | Gross value of tertiary industry per capita (CNY 10,000) | 1.95 | 2.31 | 0.00 | 26.24 |
| Population | Population density (person/square kilometer) | 1447.49 | 3714.07 | 57.21 | 27,065.65 |
| Urbanization | Urbanization rate | 0.58 | 0.24 | 0.06 | 1.00 |
| Fixed Asset Investment | Fixed asset investment per capita (CNY 10,000 /person) | 2.59 | 2.76 | 0.01 | 12.97 |
| Net Income of Farmers | Per capita net income of farmers (CNY 10,000) | 1.03 | 0.69 | 0.21 | 3.28 |
| Budgetary Expenditure | Per capita budgetary expenditure (CNY 10,000/person) | 0.45 | 0.43 | 0.03 | 2.46 |
| Road | Highways density (km/square kilometer) | 0.86 | 0.63 | 0.00 | 4.64 |
| Retail Sales of Consumer Goods | Per capita retail sales of consumer goods (CNY 10,000/person) | 1.74 | 2.02 | 0.11 | 19.48 |
| Independent Variable | Collinearity Diagnosis (1) | Collinearity Diagnosis (2) | ||||
|---|---|---|---|---|---|---|
| Standard Error | Tolerance | VIF | Standard Error | Tolerance | VIF | |
| Constant term | 4.499 | - | - | 4.489 | - | - |
| Gross domestic product | 12.604 | 0.001 | 1668.399 | - | - | - |
| Primary industry | 12.515 | 0.041 | 24.208 | 7.240 | 0.552 | 1.818 |
| Secondary industry | 12.625 | 0.002 | 493.524 | −2.834 | 0.356 | 2.808 |
| Tertiary industry | 12.621 | 0.002 | 524.499 | −1.886 | 0.155 | 6.458 |
| Population | 0.000 | 0.505 | 1.980 | −0.003 | 0.505 | 1.980 |
| Urbanization | 6.447 | 0.677 | 1.476 | −5.262 | 0.678 | 1.475 |
| Fixed asset investment | 0.698 | 0.436 | 2.292 | −1.880 | 0.447 | 2.238 |
| Net income of farmers | 4.342 | 0.181 | 5.540 | 10.367 | 0.182 | 5.481 |
| Road | 2.406 | 0.707 | 1.415 | −14.365 | 0.707 | 1.415 |
| Retail sales of consumer goods | 1.501 | 0.175 | 5.715 | 2.647 | 0.175 | 5.715 |
| Independent Variable | Minimum | 1/4 Quantile | Median | 3/4 Quantile | Maximum | Mean |
|---|---|---|---|---|---|---|
| Primary industry | −49.5488 | −1.4441 | 7.3157 | 17.9365 | 69.9834 | 6.0898 |
| Secondary industry | −49.1867 | −5.2318 | −3.1118 | −1.4656 | 7.9933 | −4.1046 |
| Tertiary industry | −65.2613 | −6.8220 | −1.5396 | −0.4838 | 28.8074 | −4.4327 |
| Population | −0.1289 | −0.0047 | −0.0021 | −0.0013 | 0.5397 | 0.0126 |
| Urbanization | −70.3012 | −22.9614 | −3.0294 | 11.7660 | 27.8079 | −6.9772 |
| Fixed asset investment | −4.2803 | −1.7524 | −0.8884 | 0.0848 | 6.5773 | −0.7108 |
| Net income of farmers | −60.0863 | 6.5300 | 11.4480 | 22.3873 | 211.8266 | 19.2612 |
| Road | −109.4564 | −38.5274 | −19.5869 | −7.7354 | 151.2679 | −19.6275 |
| Retail sales of consumer goods | −16.9561 | 0.0122 | 1.1097 | 5.2346 | 23.7884 | 2.8191 |
| R2 | 0.8446 | |||||
| Adjust R2 | 0.8412 | |||||
| Bandwidth | 0.1147 | |||||
| AICc | 3568.0500 | |||||
Disclaimer/Publisher’s Note: The statements, opinions and data contained in all publications are solely those of the individual author(s) and contributor(s) and not of MDPI and/or the editor(s). MDPI and/or the editor(s) disclaim responsibility for any injury to people or property resulting from any ideas, methods, instructions or products referred to in the content. |
© 2025 by the authors. Licensee MDPI, Basel, Switzerland. This article is an open access article distributed under the terms and conditions of the Creative Commons Attribution (CC BY) license (https://creativecommons.org/licenses/by/4.0/).
Share and Cite
Wang, T.; Liang, Q. The Spatiotemporal Impact of Socio-Economic Factors on Carbon Sink Value: A Geographically and Temporally Weighted Regression Analysis at the County Level from 2000 to 2020 in China’s Fujian Province. Land 2025, 14, 1479. https://doi.org/10.3390/land14071479
Wang T, Liang Q. The Spatiotemporal Impact of Socio-Economic Factors on Carbon Sink Value: A Geographically and Temporally Weighted Regression Analysis at the County Level from 2000 to 2020 in China’s Fujian Province. Land. 2025; 14(7):1479. https://doi.org/10.3390/land14071479
Chicago/Turabian StyleWang, Tao, and Qi Liang. 2025. "The Spatiotemporal Impact of Socio-Economic Factors on Carbon Sink Value: A Geographically and Temporally Weighted Regression Analysis at the County Level from 2000 to 2020 in China’s Fujian Province" Land 14, no. 7: 1479. https://doi.org/10.3390/land14071479
APA StyleWang, T., & Liang, Q. (2025). The Spatiotemporal Impact of Socio-Economic Factors on Carbon Sink Value: A Geographically and Temporally Weighted Regression Analysis at the County Level from 2000 to 2020 in China’s Fujian Province. Land, 14(7), 1479. https://doi.org/10.3390/land14071479