Article

Balancing Urban Expansion and Food Security: A Spatiotemporal Assessment of Cropland Loss and Productivity Compensation in the Yangtze River Delta, China

1
School of Geography and Planning, Chizhou University, Chizhou 247000, China
2
Research Center for Agricultural Ecological Resources and Environment, Chizhou University, Chizhou 247000, China
3
Institute of Agricultural Resources and Regional Planning, Chinese Academy of Agricultural Sciences, Beijing 100081, China
*
Authors to whom correspondence should be addressed.
Land 2025, 14(7), 1476; https://doi.org/10.3390/land14071476
Submission received: 15 June 2025 / Revised: 14 July 2025 / Accepted: 15 July 2025 / Published: 16 July 2025
(This article belongs to the Special Issue Land Use Policy and Food Security: 2nd Edition)

Abstract

Cropland is a critical resource for safeguarding food security. Ensuring both the quantity and quality of cropland is essential for achieving zero hunger and promoting sustainable agriculture. However, whether urbanization-induced cropland loss poses a substantial threat to regional food security remains a key concern. This study examines the central region of the Yangtze River Delta (YRD) in China, integrating CLCD (China Land Cover Dataset) land use/cover data (2001–2023), MOD17A2H net primary productivity (NPP) data, and statistical records to evaluate the impacts of urban expansion on grain yield. The analysis focuses on three components: (1) grain yield loss due to cropland conversion, (2) compensatory yield from newly added cropland under the requisition–compensation policy, (3) yield increases from stable cropland driven by agricultural enhancement strategies. Using Sen’s slope analysis, the Mann–Kendall trend test, and hot/coldspot analysis, we revealed that urban expansion converted approximately 14,598 km2 of cropland, leading to a grain production loss of around 3.49 million tons, primarily in the economically developed cities of Yancheng, Nantong, Suzhou, and Shanghai. Meanwhile, 8278 km2 of new cropland was added through land reclamation, contributing only 1.43 million tons of grain—offsetting just 41% of the loss. In contrast, stable cropland (102,188 km2) contributed an increase of approximately 9.84 million tons, largely attributed to policy-driven productivity gains in areas such as Chuzhou, Hefei, and Ma’anshan. These findings suggest that while compensatory cropland alone is insufficient to mitigate the food security risks from urbanization, the combined strategy of “Safeguarding Grain in the Land and in Technology” can more than compensate for production losses. This study underscores the importance of optimizing land use policy, strengthening technological interventions, and promoting high-efficiency land management. It provides both theoretical insight and policy guidance for balancing urban development with regional food security and sustainable land use governance.

1. Introduction

Food is a fundamental necessity for human survival and the primary source of energy required by the human body [1,2,3]. Food security is directly related to national security and social stability [4]. Cropland, as a foundational resource for food production, plays a critical role in ensuring food security [5]. However, global urbanization is rapidly expanding at an average annual rate of approximately 2.42 × 10⁴ km2 [6], posing direct threats to both the quantity and quality of cropland [7]. Consequently, the conflict between urbanization and food security has intensified, significantly hindering the achievement of the Sustainable Development Goals (SDGs) such as zero hunger and poverty eradication by 2030 [8].
Globally, over 60% of irrigated cropland loss occurs in peri-urban areas, resulting in substantial losses of highly productive land [9]. Additionally, the migration of rural labor to urban centers reduces both the quantity and quality of food producers, intensifying the competition between agricultural and urban land uses [10]. This issue is particularly pronounced in areas with limited resilience, posing a further threat to food security [11]. China, as a major agricultural country, faces a severe shortage of per capita cropland resources with limited and unevenly distributed reserve lands, yet it manages to feed approximately 21% of the world’s population using only 9% of global cropland [12]. As living standards improve, food demand continues to rise [13]. However, approximately 74.36% of the land used for urban expansion in China originates from cropland, exacerbating the conflict between urbanization and cropland conservation [14].
Under China’s requisition–compensation balance policy, newly added cropland often comprises sloped and terraced land, with approximately 90.30% having an average slope of 6.98° [15], and about 69.15% of cropland experiencing productivity reduction due to urbanization [16]. Although China actively implements this balance policy, cropland lost to urban expansion is frequently replaced by lower-quality land [17]. Additionally, urbanization encroaches upon approximately 9.31% of highly stable cropland, threatening the quality and sustainability of local agricultural lands [18].
The reduction in cropland area due to urbanization inevitably leads to decreased food production [19]. Empirical studies have demonstrated a significant positive correlation between cropland area and food production, which is particularly pronounced in the major grain-producing regions [20]. In the Yangtze River Economic Belt, each 1 km2 reduction in cropland results in a net grain output loss of approximately 600 tons [21]. Cities experiencing significant losses in grain output, such as Hefei and Chuzhou in Anhui Province, Yancheng and Nantong in Jiangsu Province, Jiaxing in Zhejiang Province, and Shanghai, are predominantly concentrated in the central YRD [22]. The impact on grain yield varies significantly due to differences in temperature, precipitation, topography, and the level of urban development [23,24]. Higher-tier cities occupy more cropland and thus incur greater grain yield losses, a phenomenon particularly evident in the YRD [25]. Grain output remains relatively stable in moderately urbanized plains but is significantly inhibited in highly urbanized areas. The grain yield in mountainous regions declines with urbanization progress [26]. The central YRD is among China’s most economically vibrant regions, noted for its openness and innovation capabilities, and holds a strategic position in national modernization and global openness strategies [27,28,29]. Rich in cropland resources, this region is crucial for safeguarding national food security [30].
With these considerations in mind, we investigated the impact of cropland loss driven by urban expansion on regional food security using geospatial analysis techniques, Sen’s slope and Mann–Kendall trend tests, and hotspot–coldspot analysis. Specifically, we addressed the following research questions: (1) How much cropland was converted due to urbanization in the central YRD, how much grain production was consequently lost, and which cities experienced the most severe losses? (2) Under China’s cropland requisition–compensation policy, how much new cropland was established, what was the corresponding increase in grain output, and which cities significantly contributed to this gain? (3) What was the extent of stable cropland area, did grain production increase from 2001 to 2023 and by how much, and what were the spatial distributions of identified hotspots and coldspots?

2. Materials and Methods

2.1. Study Area

The central region of YRD is located in the lower reaches of the Yangtze River, forming an alluvial plain before the river enters the East China Sea (115°44′–122°58′ E, 27°01′–34°30′ N). The region features a subtropical monsoon climate, with annual average temperatures ranging from 15 °C to 17 °C and annual precipitation between 1000 mm and 1400 mm [31]. The main soil types include paddy soils, alluvial soils, and yellow-brown earth, characterized by deep profiles, high fertility, and rich organic matter. The terrain is predominantly flat with minor undulations, extensive river networks, and synchronized rainfall and heat periods. The cropping system typically involves two to three crops per year, with rice, wheat, and maize being the main food crops. In 2023, the total grain output of the central region of YRD reached approximately 41.7 million tons (https://www.stats.gov.cn/, accessed on 6 May 2025).

2.2. Data Sources

Land use/cover data were derived from the China Land Cover Dataset (CLCD), offering annual 30 m resolution data from 1985 to 2023 [32]. Land cover types include cropland, forest, grassland, water, barren, and construction land (Figure 1). For this study, data from 2001 to 2023 were used to construct land use transition matrices, identifying the spatial distributions of cropland converted to construction land, other land converted to cropland, and stable cropland. Net Primary Productivity (NPP) data were obtained from NASA’s MOD17A2H products via Google Earth Engine (GEE) [33], providing annual NPP data at a 500 m × 500 m resolution for 2001–2023. Grain yield (GY) statistics were collected from the official statistical yearbooks of Anhui, Jiangsu, Zhejiang, and Shanghai, covering the years 2001–2023. These statistics, combined with the spatial distribution of NPP, were used to estimate gridded grain yield data. All spatial data were standardized to a 500 m resolution and projected in Albers_WGS1984. Table 1 summarizes the data sources.

2.3. Methodology

NPP is defined as the net amount of organic carbon fixed by plants via photosynthesis, minus plant respiration, thus representing the amount of organic material accumulated per unit area and time [34]. Grain yield refers to the dry matter weight of the harvested edible portion, usually measured as total yield. NPP represents the total biomass production capacity of cropland ecosystems and serves as the fundamental basis for grain yield. Essentially, grain yield can be viewed as the portion of cropland NPP selectively harvested by humans. As a key parameter for assessing agricultural production potential, NPP provides a valuable proxy for estimating grain yield, particularly in regions lacking detailed field data [35]. Thus, this study first calculated the cumulative NPP of cropland at the pixel level throughout the study area. Subsequently, grain yield at the pixel scale was derived based on the ratio of each pixel’s cropland NPP to the cumulative NPP within the study region, combined with statistical grain yield data available for the study area. The calculation formula is as follows:
N P P t = j = 1 k N P P
G Y c = N P P N P P t × G Y t
where N P P t is the cumulative NPP of cropland pixels in the region, G Y c is the grain yield per pixel, and G Y t is the total reported grain yield for the region.
Hotspot and coldspot analyses surpass the mere depiction of high and low numerical values. By employing rigorous statistical testing, this approach precisely identifies and quantifies areas of statistically significant spatial clustering (hotspots and coldspots). Using the Getis–Ord G i * statistical method, this study identified spatial clusters of high and low grain yields from stable cropland at the municipal scale, thereby revealing the spatial distribution patterns and aggregation characteristics of grain production [36]. The Getis–Ord G i * statistic is computed as follows:
G i * = j = 1 n w i j x j X ¯ j = 1 n w i j S n j = 1 n w 2 i j ( j = 1 n w i j ) 2 n 1
X ¯ = 1 n j = 1 n x i
where x i and x j are grain yields for spatial units i and j, w i j is the spatial weight, n is the total number of units, and X ¯ and S are the mean and standard deviation, respectively. A positive G i * value indicates hotspots (significant yield increase), while a negative G i * value indicates coldspots (significant yield decrease).
The Sen’s slope estimator coupled with the Mann–Kendall test (Sen+MK method) constitutes a robust nonparametric statistical approach for detecting spatiotemporal trends in grain yields. This methodology is particularly advantageous for agricultural remote sensing or statistical datasets spanning long periods, exhibiting significant fluctuations, and not conforming to normal distributions [37]. In this study, the Sen+MK method was applied to characterize the spatiotemporal grain yield trends of stable cropland from 2001 to 2023. First, annual raster data of grain yield were used to calculate the grain yield trend (SGY) at the pixel level by employing the Theil–Sen median estimator. Next, the Mann–Kendall test was conducted to evaluate the statistical significance of these yield trends, yielding corresponding Z-values. Finally, the SGY values were combined with Z-values to categorize the grain yield trends into distinct classes [38]. Combined, they were used to classify trend types as shown in Table 2.

3. Results

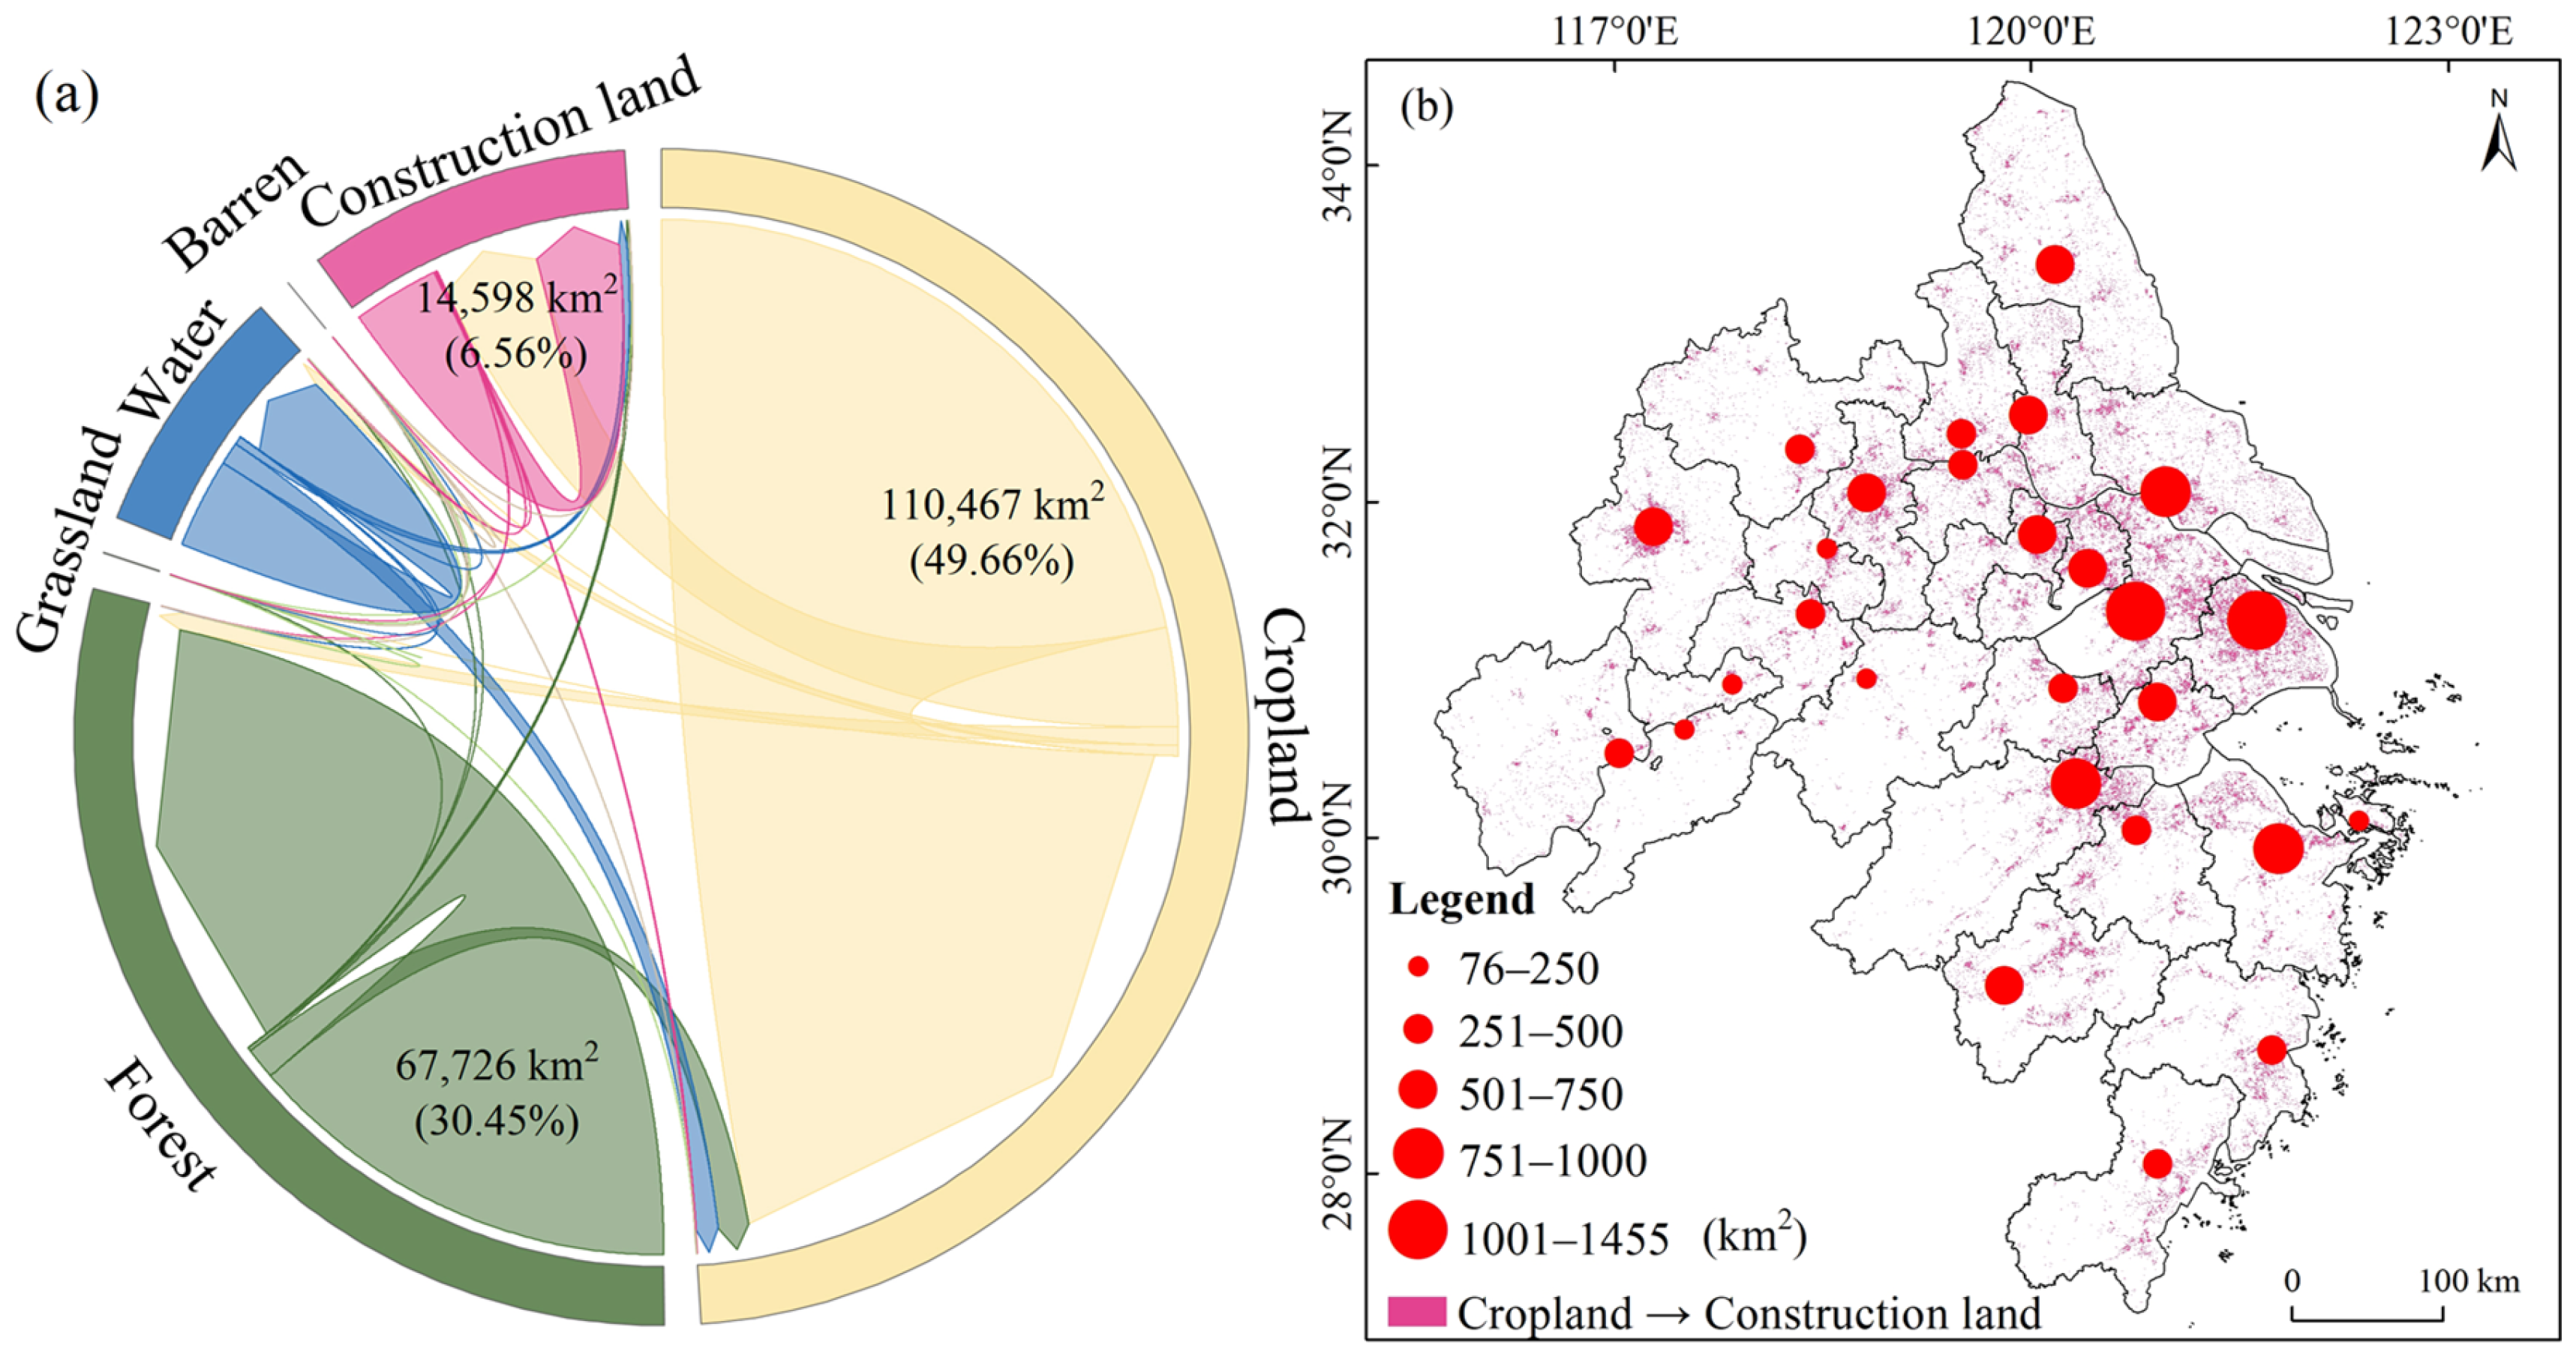
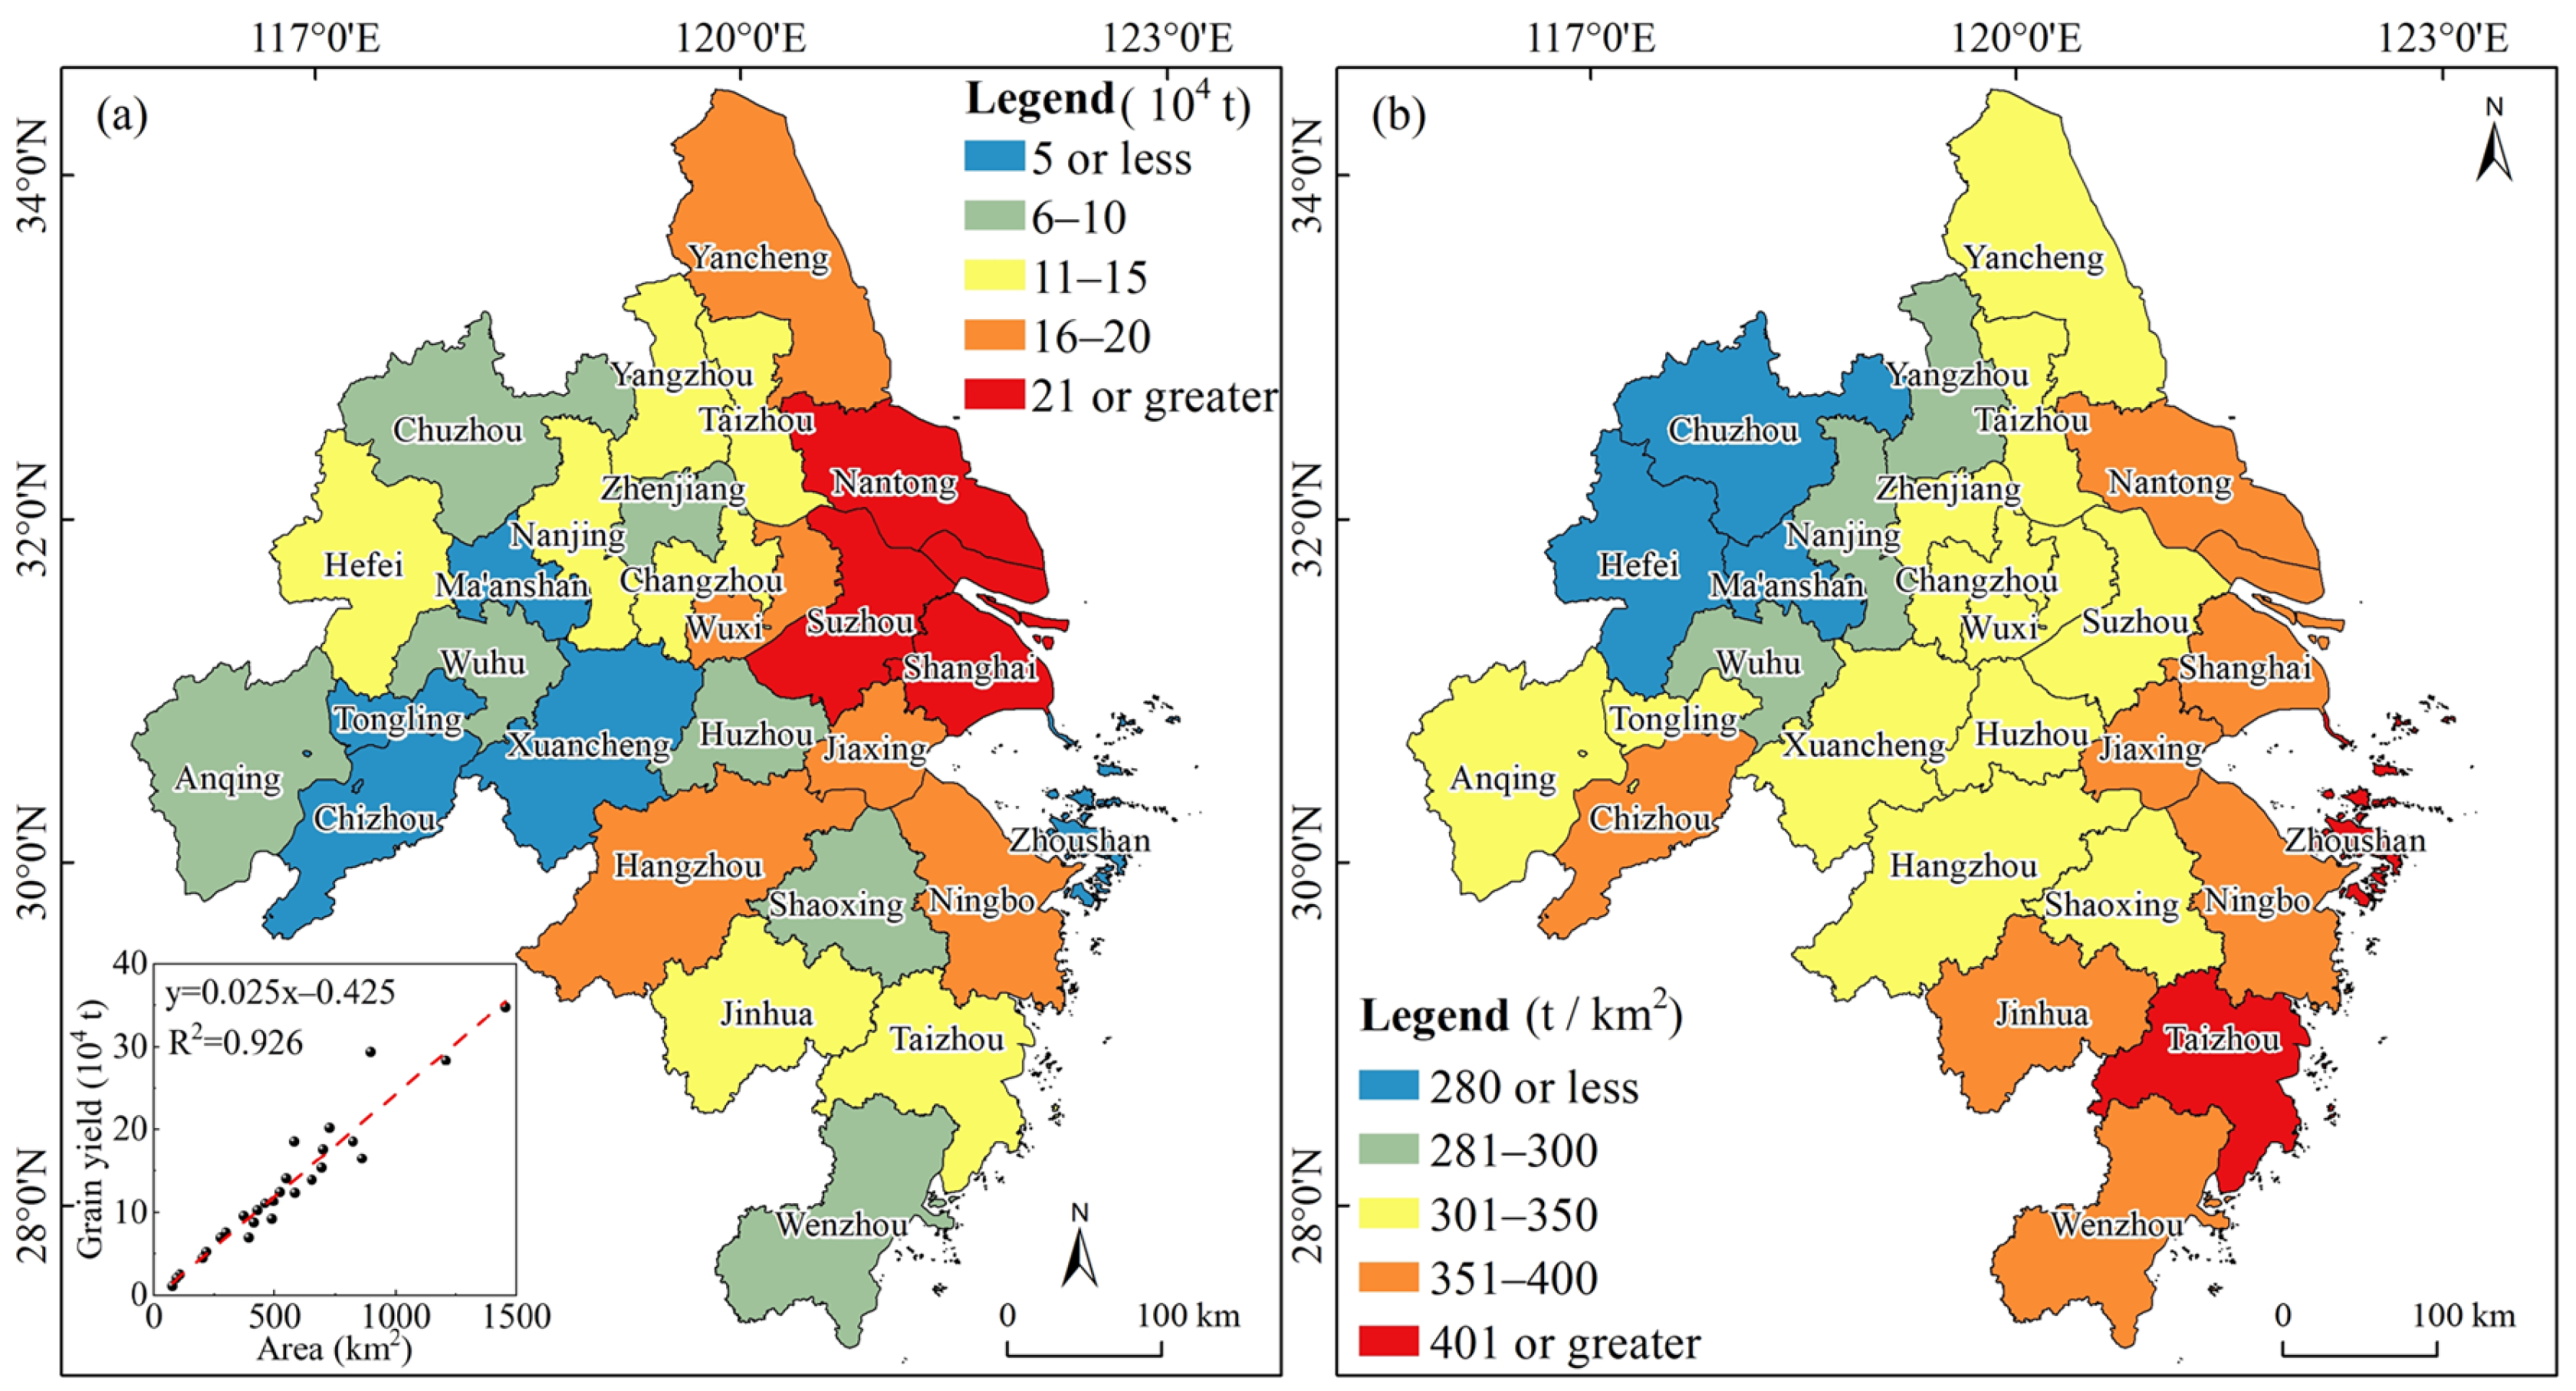
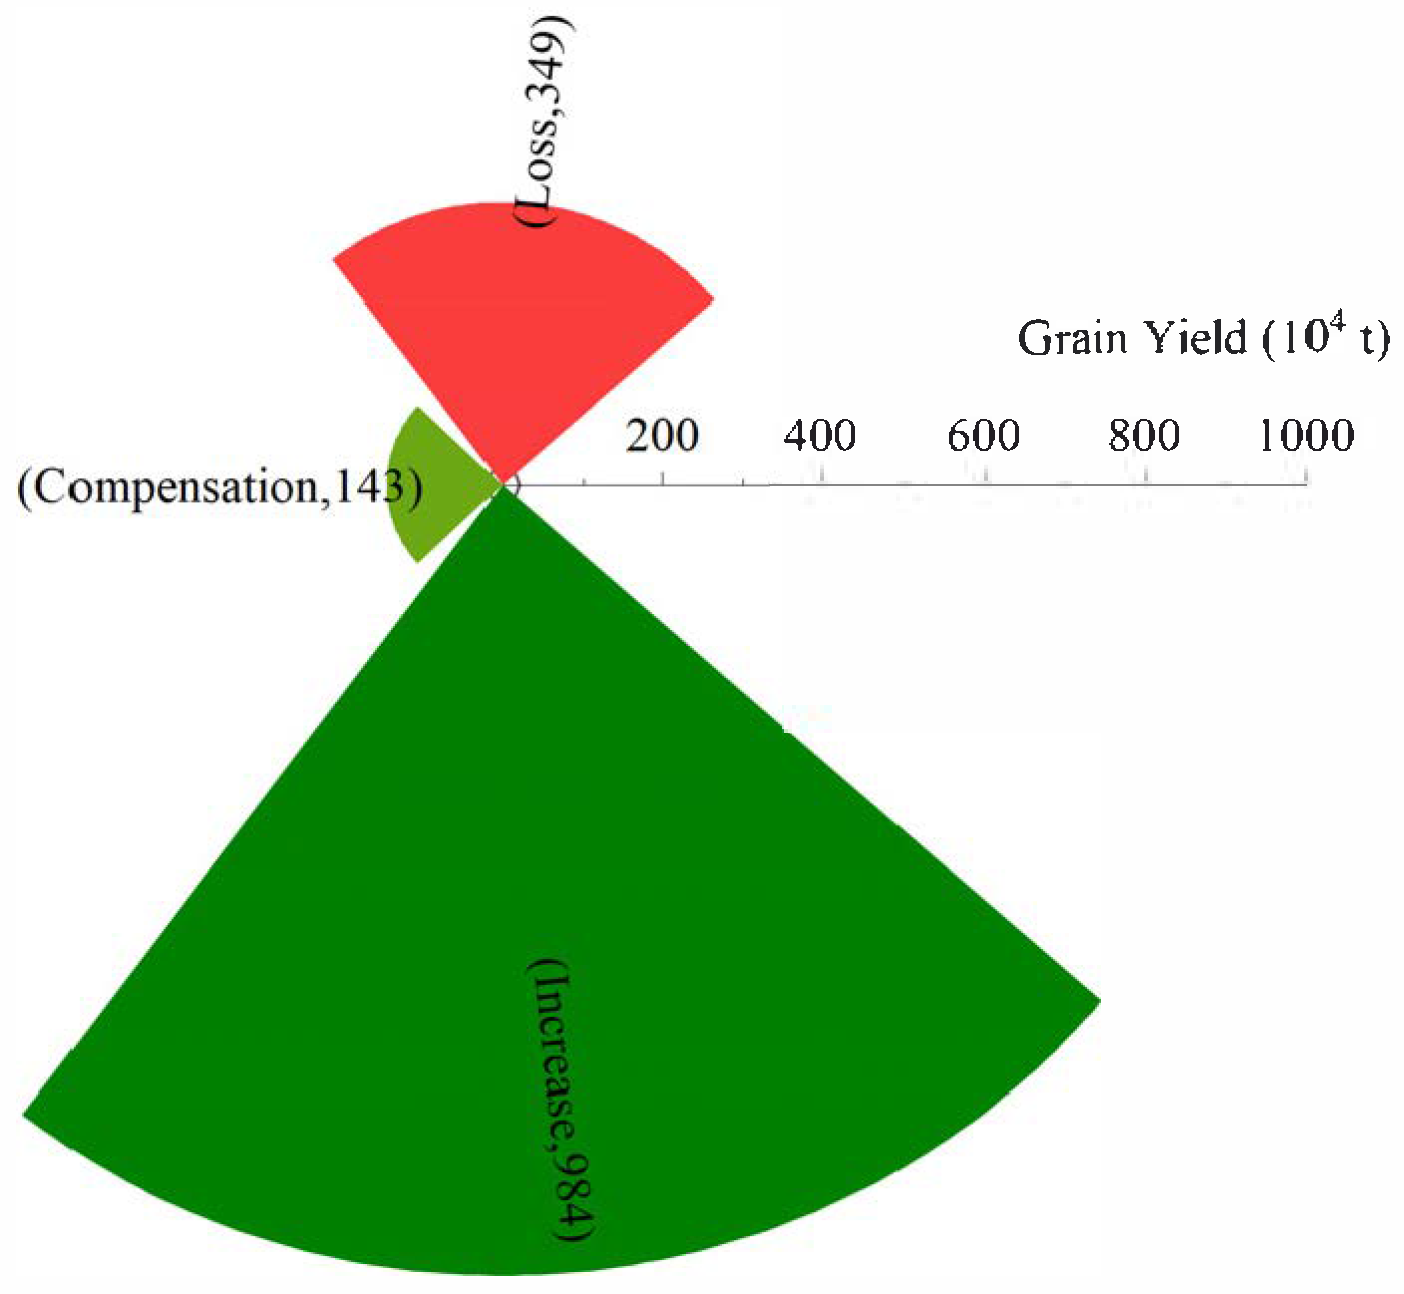
3.1. Grain Yield Losses Due to Cropland Conversion

Cropland (110,467 km2) and forest (67,726 km2) constitute the predominant land use types in the central region of the YRD, covering approximately 80.11% of the total area. Between 2001 and 2023, cropland exhibited the most significant conversion to construction land, totaling 14,598 km2, which represents 6.56% of the study region (Figure 2a). The spatial analysis of cropland conversion to construction land indicates that areas ranging from 1001 to 1455 km2 are primarily concentrated in Shanghai and Suzhou, regions characterized by rapid urbanization and substantial demand for land development due to their roles as the economic center of the YRD. Areas of 751 to 1000 km2 conversion are distributed around Nantong, Hangzhou, and Ningbo, typically located on alluvial plains, which experience pronounced land use transformation driven by urban expansion. Conversion areas of 501 to 750 km2 occur in Yancheng, Wuxi, Nanjing, Hefei, Jinhua, Jiaxing, Taizhou, and Changzhou; areas of 251 to 500 km2 are evident in Yangzhou, Shaoxing, Taizhou, Huzhou, Chuzhou, Wenzhou, Zhenjiang, Wuhu, and Anqing; whereas smaller conversions (76 to 250 km2) are scattered across Xuancheng, Ma’anshan, Chizhou, Tongling, and Zhoushan. The spatial variability in cropland loss closely aligns with regional economic development levels and urbanization intensity (Figure 2b).
The conversion of cropland to construction land reduces the land availability for agricultural production, resulting in an estimated grain yield loss of approximately 3.49 million tons (349 × 104 t) over the 23-year study period. On average, each km2 of cropland converted in the central region of the YRD results in a loss of approximately 250 tons of grain (R2 = 0.926). Spatially, the grain yield losses due to the varying levels of urbanization across 27 cities exhibit significant differentiation. High-loss regions (≥210,000 tons) concentrate along the Yancheng–Nantong–Suzhou–Shanghai corridor, a strategic axis reflecting the deepening integration of the YRD, especially as development shifts from the traditional southern Jiangsu area toward central and northern Jiangsu. This strategic axis shows a notable spatial correspondence with high grain loss areas. The regions with losses ranging between 160,000 and 200,000 tons are primarily in Nanjing, Wuxi, Hangzhou, Jiaxing, and Ningbo; those with losses between 110,000 and 150,000 tons include Hefei, Yangzhou, Jinhua, and Taizhou; losses from 60,000 to 100,000 tons are observed in Huzhou, Zhenjiang, Shaoxing, Chuzhou, Wuhu, Wenzhou, Anqing, and Xuancheng; and areas with losses ≤50,000 tons primarily cover Chizhou, Tongling, Ma’anshan, and Zhoushan (Figure 3a).
The analysis of grain losses per unit area reveals a clear spatial gradient from lower losses in the northwest to higher losses in the southeast (Figure 3b). The highest intensity losses (≥401 t/km2) occur predominantly in Zhoushan and Taizhou, attributed to their inherently limited cropland resources, resulting in pronounced marginal loss effects. The second-highest loss category (351–400 t/km2) manifests in two distinct spatial patterns: a continuous high-intensity belt centered around Shanghai near the Yangtze River estuary, encompassing northern Nantong and the Hangzhou Bay cities of Jiaxing and Ningbo; and a dispersed distribution involving inland-to-coastal transitional cities such as Chizhou, Jinhua, and Wenzhou. Medium–high loss regions (301–350 t/km2) primarily cover cities along the Wanjiang urban belt and the Taihu Lake region. Anqing and Tongling form an east–west alignment along the Wanjiang River, linked spatially to Xuancheng at the margins of the southern Anhui mountains, creating a southeastern Anhui spatial connectivity axis. Lakeside cities like Huzhou, Suzhou, Wuxi, and Changzhou cluster along the Taihu shoreline, forming dense urban agglomerations, while Zhenjiang and Taizhou extend this urbanized area across the Yangtze River. Additionally, Hangzhou and Shaoxing create a southeastern secondary distribution along the Qiantang River, corresponding spatially with Yancheng in the core Jiangsu plain. These cities and regions interconnect through major geographical features like the Yangtze River, Taihu Lake, and Qiantang River, forming an integrated spatial pattern characterized by intersecting points and axes. Low-intensity loss areas (≤300 t/km2) centered around Hefei expand in a fan shape along the Jianghuai watershed, benefiting from relatively abundant cropland resources, creating a stark spatial contrast with the high-intensity grain loss regions in the southeastern YRD.

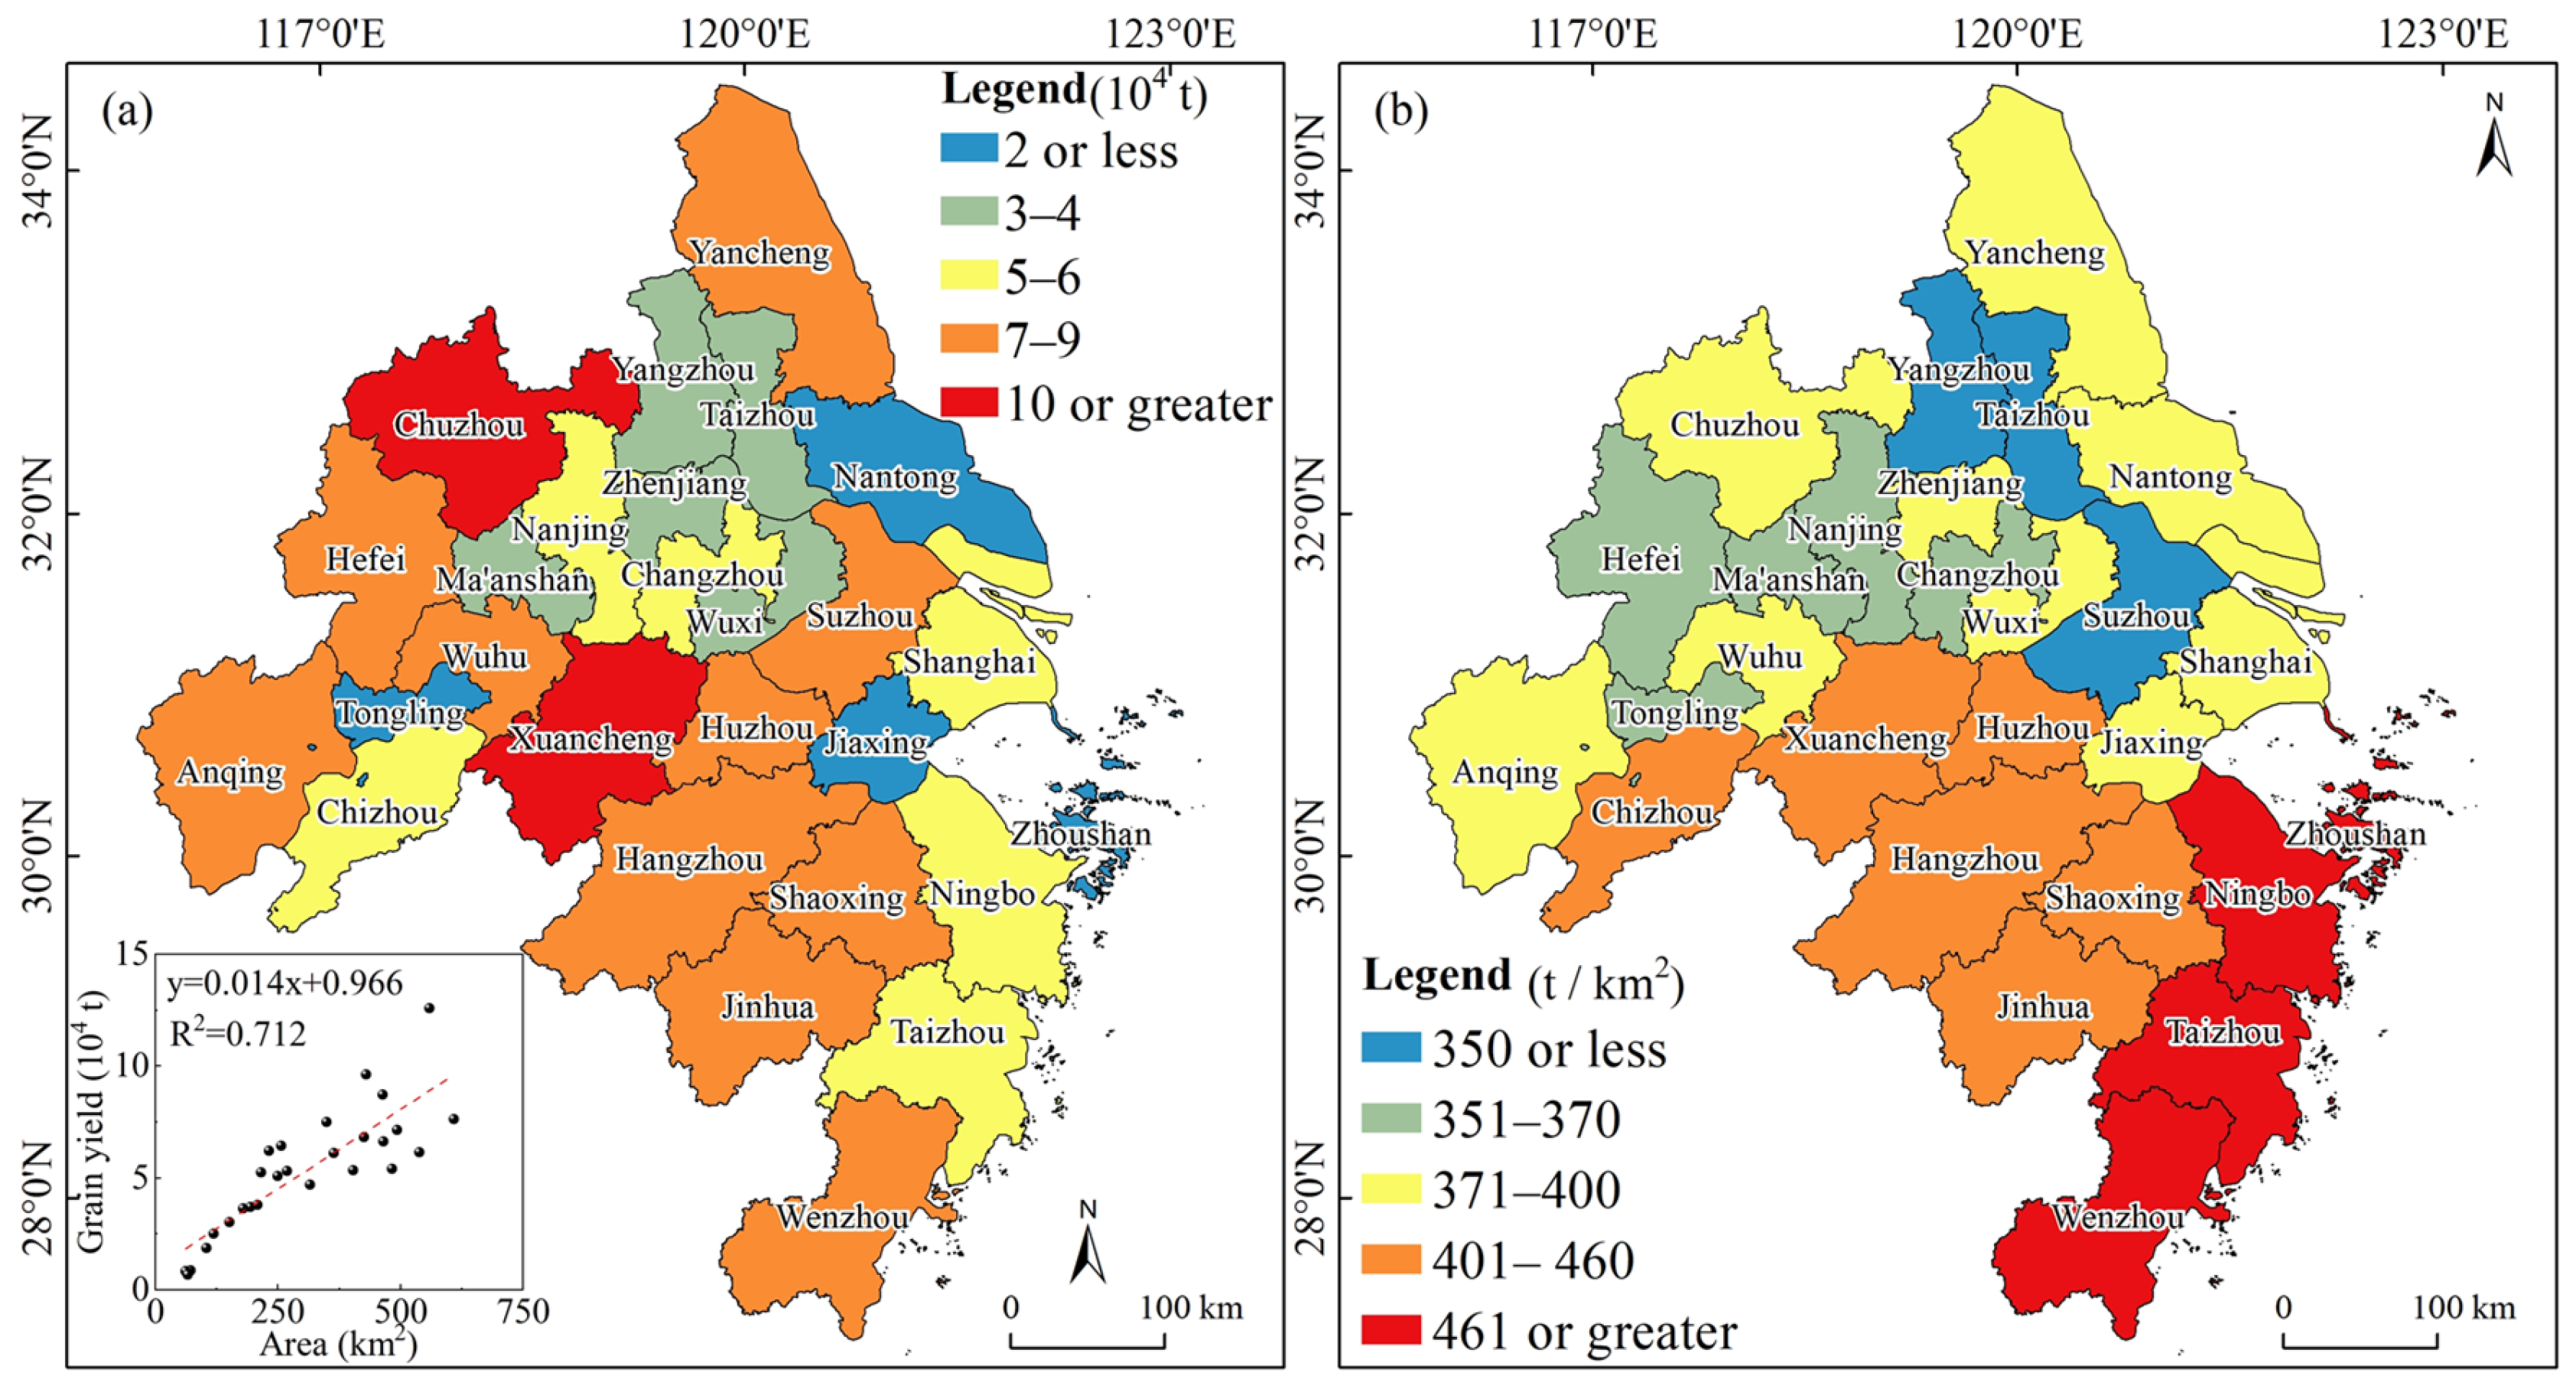
3.2. Estimated Grain Yield from Reclaimed Cropland

Under China’s requisition–compensation policy, the central region of the YRD experienced significant cropland replenishment between 2001 and 2023, totaling approximately 8278 km2. The primary sources of this reclaimed cropland were conversion from forest (4695 km2, 56.71%) and water management (3350 km2, 40.46%). These two categories were dominant due to the abundant forest resources and extensive water networks inherent to the region’s landscape. In contrast, contributions from other land types were minimal, with grassland contributing merely 15 km2 and unused land only 4 km2. This limited contribution reflects a scarcity of reserve cropland resources within the region. Notably, the conversion of construction land back to cropland accounted for only 214 km2 (2.59%), highlighting local governments’ preference for appropriating rural construction land for urban expansion over reclaiming underutilized urban construction land (Figure 4). Factors such as inadequate mechanisms for rural homestead withdrawal and the high costs associated with reclaiming abandoned industrial and mining sites have further restricted the full potential of urban land reuse.
The additional cropland provided an estimated grain yield increase of approximately 1.43 million tons (143 × 104 tons), with each km2 of reclaimed cropland contributing approximately 140 tons (R2 = 0.712). This contribution displayed notable spatial differentiation within the region (Figure 5a). The high-contribution areas (≥100,000 tons) centered around Chuzhou and Xuancheng, respectively, located in the northeastern and southeastern wings of the Wanjiang urban belt. The next highest contribution areas (70,000–90,000 tons) exhibited multiple interconnected centers: Hefei, Wuhu, and Anqing in central Anhui formed a linear distribution along Yangtze tributaries; Suzhou and Huzhou around Taihu Lake established a distinct grain yield enhancement belt; Yancheng in the northern Jiangsu plain stood out individually; and Hangzhou, Shaoxing, Jinhua, and Wenzhou extended southeastward along the Qiantang River and coastal hills. The medium-contribution transitional zones (50,000–60,000 tons) comprised cities like Nanjing and Changzhou arranged from west to east along the Yangtze River, forming a supportive axis for grain yield in the riverside urban belt, while Shanghai, Ningbo, and Taizhou formed coastal extensions along the East China Sea. Chizhou in the mountainous southern Anhui region was relatively isolated due to terrain, creating an independent grain yield node interconnected with coastal and riverside regions in a triangular spatial pattern. The areas of low grain yield (≤40,000 tons) consisted primarily of three main clusters: a triangular area formed by Tongling (south bank of Yangtze), Nantong (north bank), and Jiaxing (Hangzhou Bay), supplemented by secondary low-value belts along the Yangtze, with Yangzhou and Taizhou on the north bank and Ma’anshan coordinating with downstream Wuxi–Zhenjiang on the south bank.
Regarding grain yield per unit area, the central YRD exhibited a pronounced spatial gradient from higher values in the south to lower values in the north (Figure 5b). Specifically, the highest value zone (≥461 t/km2) was concentrated along the southeastern coast of Zhejiang, including Zhoushan, Ningbo, Taizhou, and Wenzhou, forming a continuous high-value coastal belt. The second-highest category (401–460 t/km2) originated from the central Zhejiang hills, forming an arc-shaped grain yield band extending from Chizhou and Xuancheng at the edge of southern Anhui, through Huzhou, towards southeastern cities like Hangzhou, Shaoxing, and Jinhua, spanning Zhejiang and Anhui provinces. The medium-value areas (371–400 t/km2) encompassed coastal central Jiangsu cities such as Yancheng and Nantong, alongside Wanjiang river cities like Anqing, Wuhu, and Chuzhou, and alluvial plain areas including Shanghai and Jiaxing, exhibiting dispersed distributions in the northern portion of the YRD. The lower–medium range (351–370 t/km2) stretched along the Yangtze River, with cities such as Tongling, Hefei, Ma’anshan, and Nanjing arranged from west to east. Finally, the low-value zones (≤350 t/km2) featured nodes at Yangzhou, Taizhou, and Suzhou, forming a continuous region of low grain yield. This spatial distribution closely aligns with regional topographical conditions, hydrological networks, and urbanization levels, reflecting significant geographic coupling.

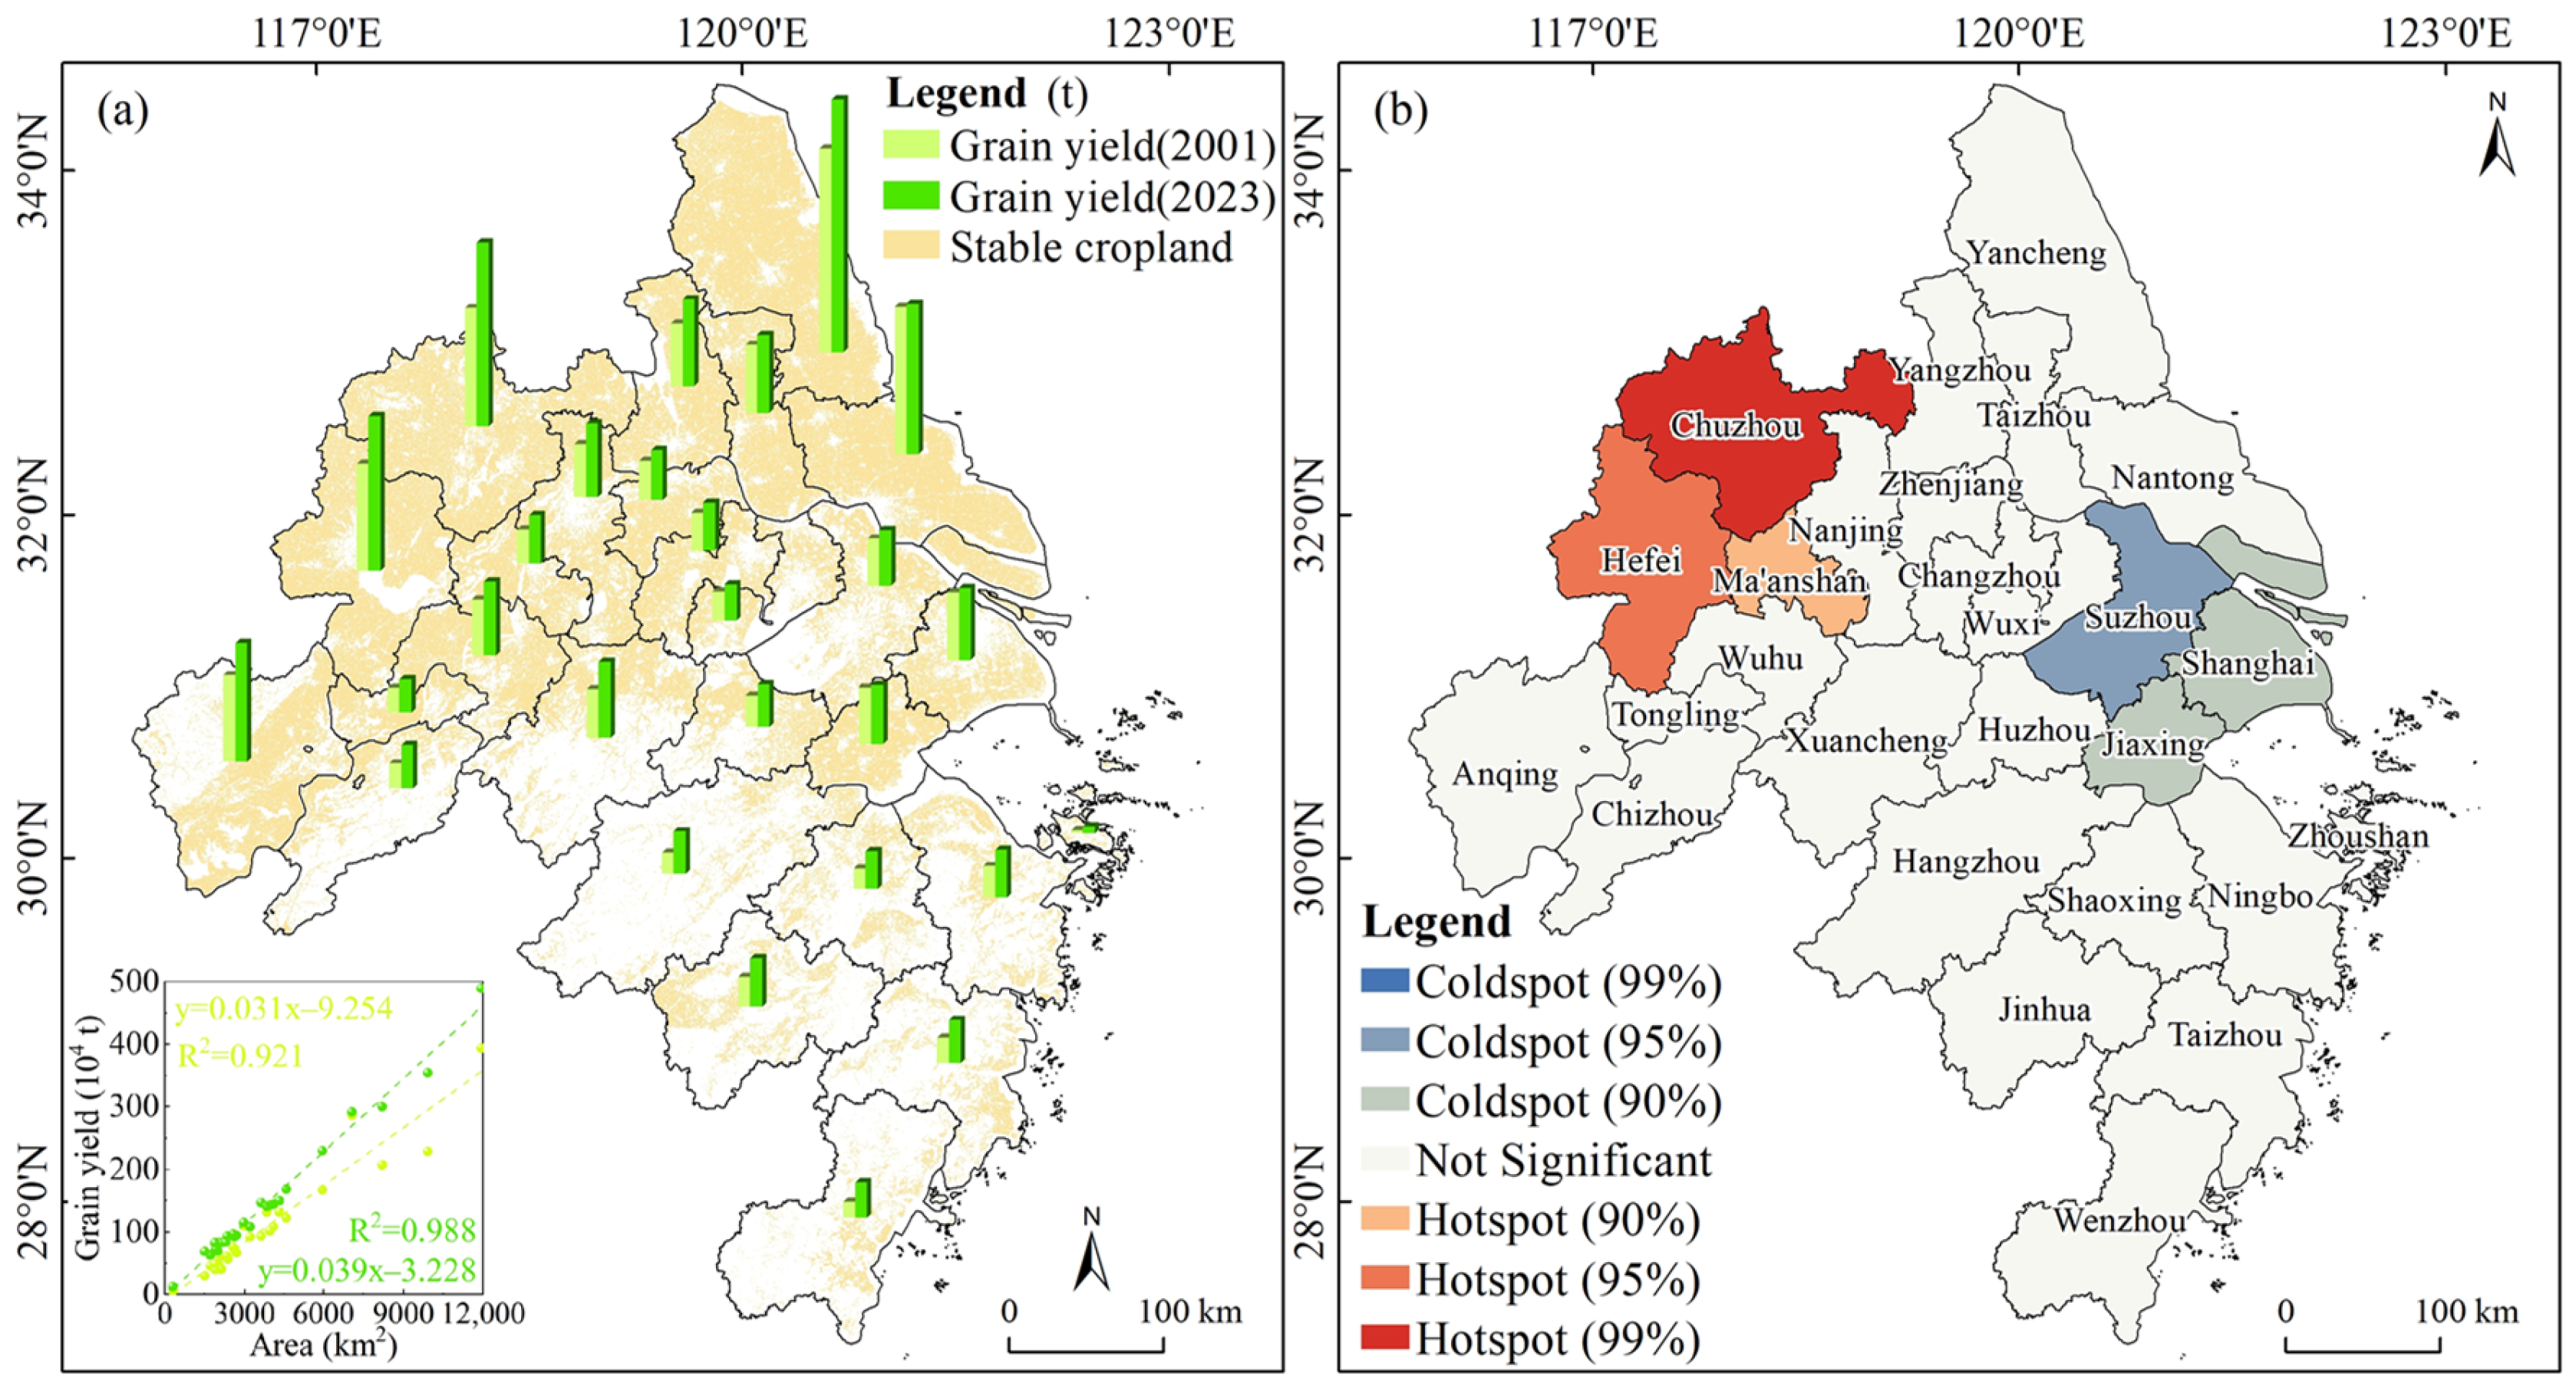
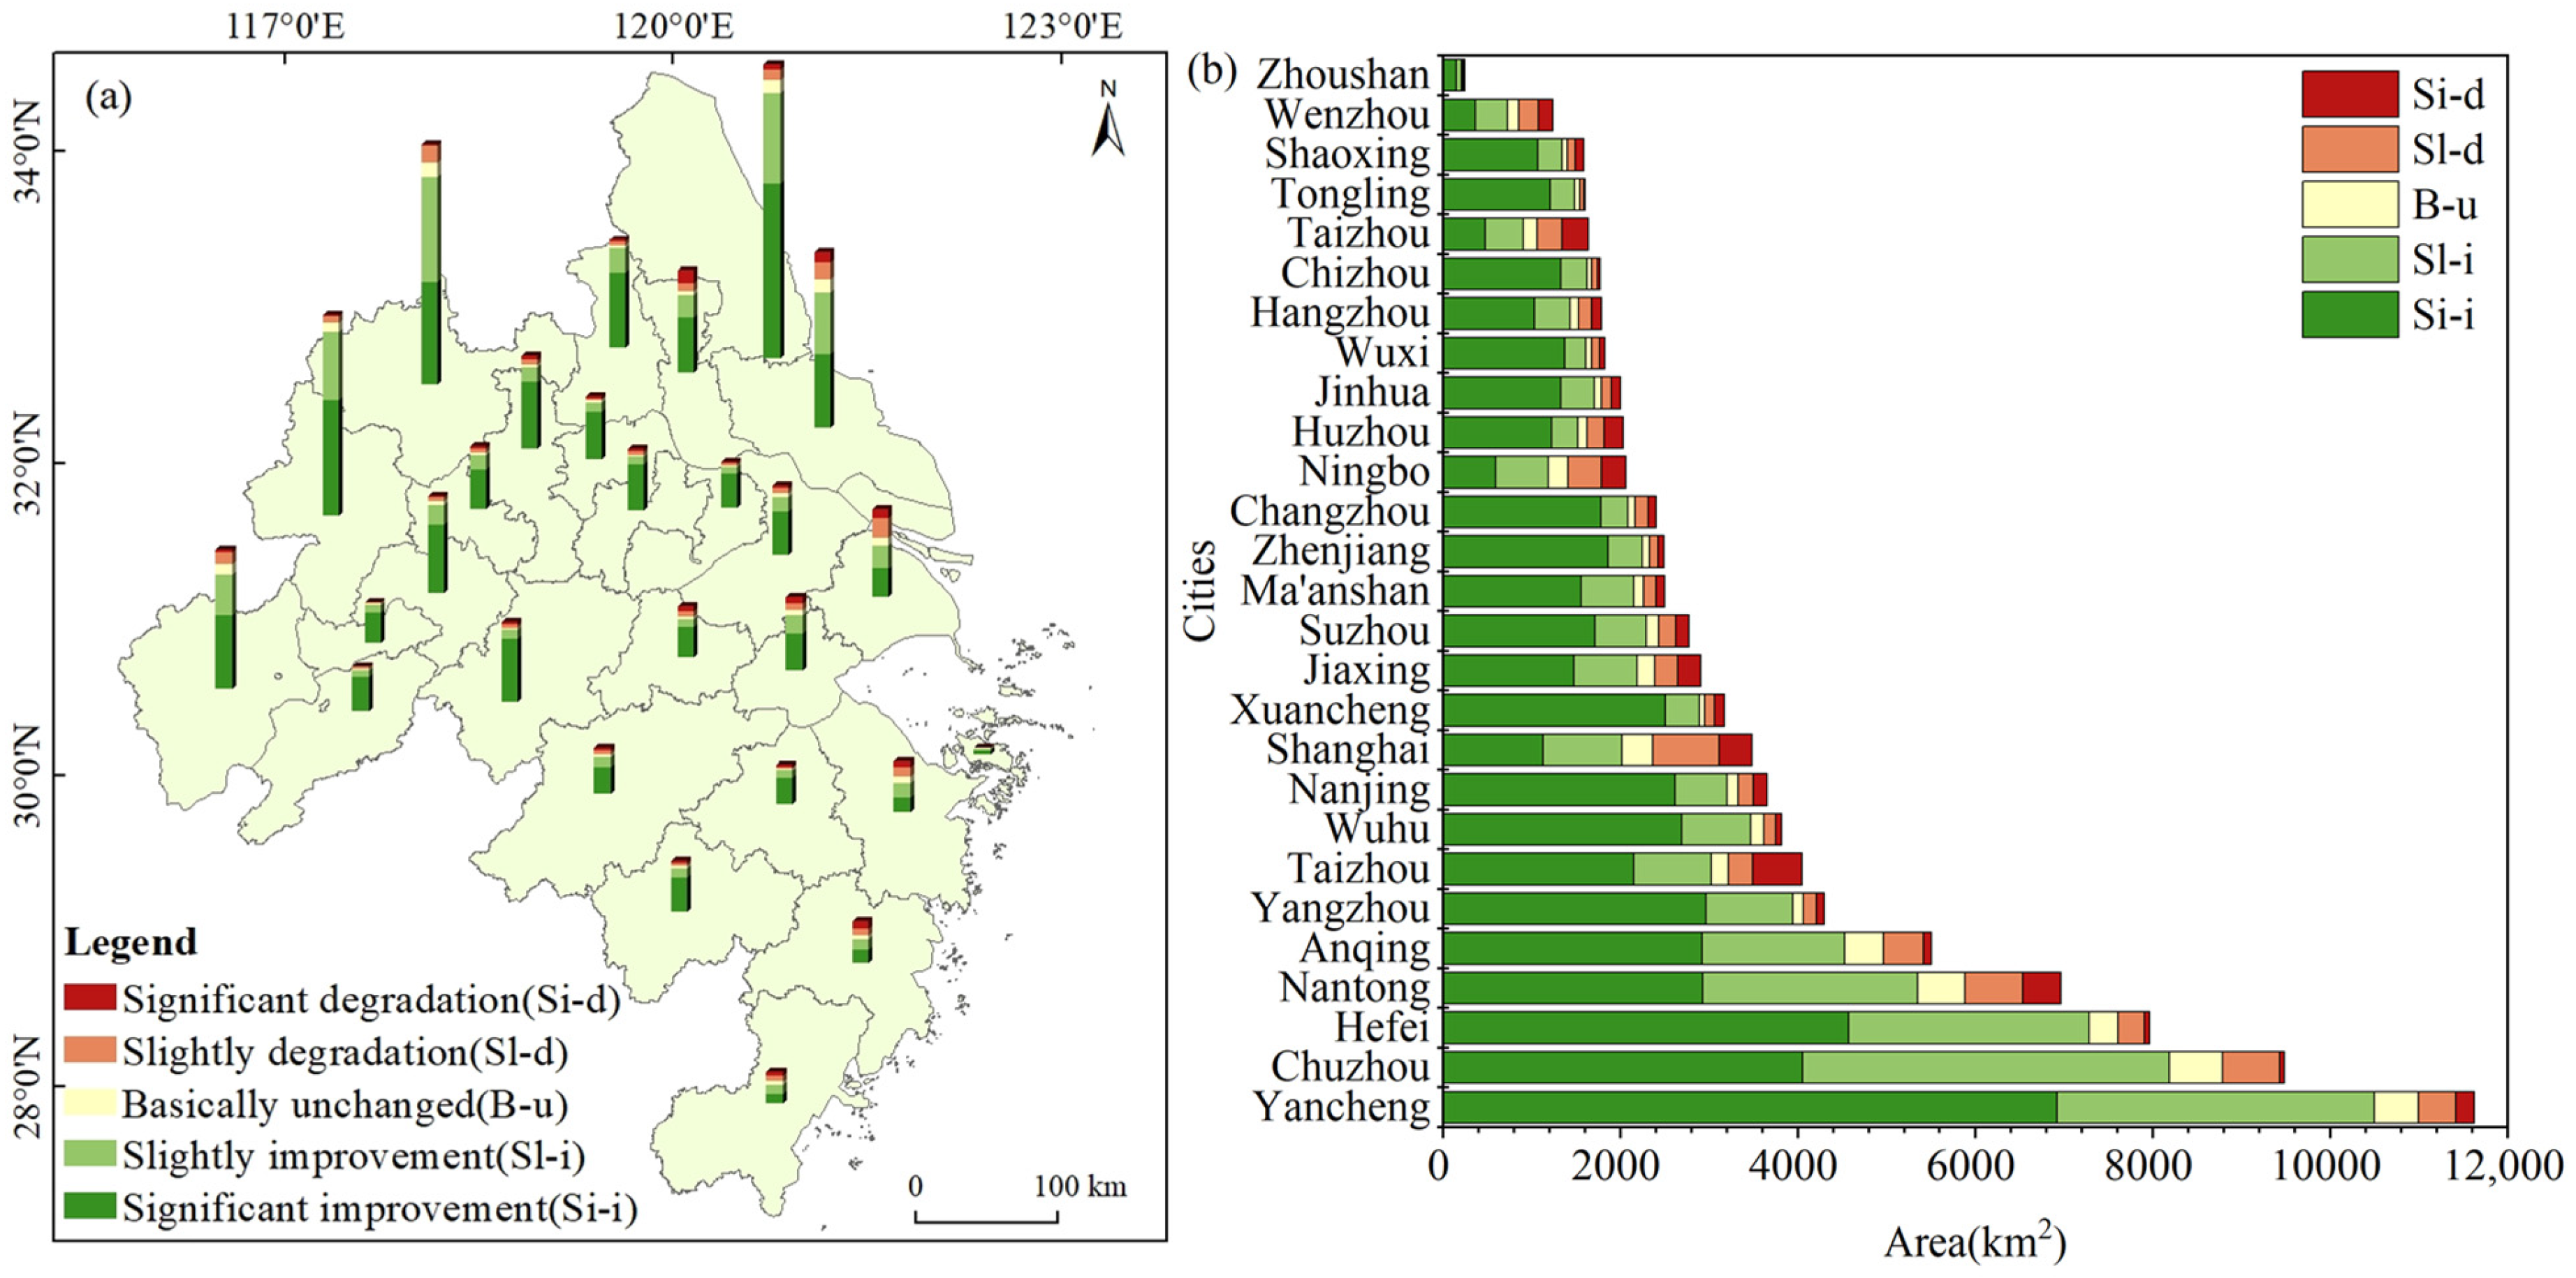
3.3. Grain Yield Changes on Stable Cropland

Between 2001 and 2023, stable cropland in the central region of the YRD covered approximately 102,188 km2, accounting for 45.94% of the total area. This stable cropland exhibited significant potential for increased grain yield, with an average yield improvement of 80 tons per km2 over the 23-year period. A spatial comparison of grain yield on stable cropland between 2001 and 2023 across 27 prefecture-level cities revealed a distinct north-to-south gradient, with a higher grain yield and greater yield increments predominantly in the northern regions (Figure 6a). Northern cities such as Chuzhou, Yancheng, and Hefei experienced substantial grain yield improvements due to favorable natural conditions (flat terrain and fertile soils), robust agricultural policies, a high proportion of agricultural economies, and advancements in agricultural technology. Conversely, southern regions were constrained by mountainous and hilly terrains, resulting in limited and fragmented cropland, thereby restricting grain yield. Additionally, cities such as Shanghai, Nantong, and Jiaxing experienced limited grain yield increases due to the reduction in grain cultivation areas in favor of high-value economic crops and ecological agriculture.
In total, the grain yield on stable cropland increased by approximately 9.84 million tons (984 × 104 t) from 2001 to 2023. The spatial pattern of grain yield increments revealed distinct east–west differentiation (Figure 6b). Western inland regions emerged as prominent grain yield hotspots, with Chuzhou as the central hotspot exhibiting the most significant increases, closely followed by Hefei, collectively forming a prominent grain yield improvement belt. In contrast, eastern coastal areas displayed notable coldspots for grain yield increases, centering around the Suzhou–Shanghai–Jiaxing axis. This distinct “west-hot, east-cold” spatial pattern corresponds significantly with regional urbanization stages, reflecting an emerging urbanization phase in the west and mature metropolitan development in the east.
The temporal and spatial trend analysis of grain yield on stable cropland from 2001 to 2023 indicated substantial improvements (Figure 7), with regions exhibiting significant increases accounting for 56.87% and moderately improved areas comprising an additional 26.50%. Together, these regions accounted for 83.37% of the stable cropland, predominantly benefiting from supportive agricultural policies, technological advancements, enhanced cropland protection measures, and ongoing high-standard farmland construction. Conversely, regions experiencing slight (6.90%) and severe declines (4.43%) demonstrated clear spatial clustering primarily concentrated in three distinct areas: a northern sector in Taizhou; cross-city areas between Ma’anshan, Wuhu, and Nanjing, and between Changzhou and Nanjing; and a coastal belt centered around Shanghai, Nantong, and Taizhou. These areas of decreased yield form a spatial pattern characterized by “one node and two belts,” clearly contrasting with the broader grain increase regions.
Significant spatial variations characterized the grain yield changes on stable cropland across the central region of the YRD (Figure 8a). Yancheng, Hefei, and Chuzhou formed the central areas of significant grain yield increases, followed closely by Yangzhou, Nantong, and Anqing, primarily due to improvements in agricultural infrastructure and the widespread adoption of high-yield crop varieties (Figure 8b). Conversely, notable declines were observed along the Yangtze River in Taizhou and Nantong, as well as within the Shanghai metropolitan area, influenced by factors such as crop structure adjustments, soil salinization, and hydrological and meteorological disasters. Notably, Nantong emerged as a unique “spatial paradox,” exhibiting an intricate mosaic pattern of significantly increasing and decreasing yield areas within its municipal boundaries. This interplay between declining and increasing grain yield areas highlights the complex spatial dynamics shaping grain yield changes across the central YRD.

4. Discussion

4.1. Impacts of Urbanization on Grain Yield from Cropland

Urban expansion within the central YRD significantly contributed to cropland loss, resulting in a grain production reduction of approximately 3.49 million tons. Taking the SSP1 scenario projection of per capita annual grain consumption at 502.61 kg by 2030 as a benchmark, this loss equates to the annual grain requirement for roughly 6.94 million people [39]. Between 2001 and 2023, each km2 of cropland conversion due to urbanization in this region led to a grain yield loss of about 240 tons. This represents a significant reduction compared with the 425 t/km2 loss recorded from 1992 to 2015 [40], suggesting that improved regional land use efficiency and advancements in agricultural technology partially mitigated urbanization’s adverse impacts. Notably, cropland loss resulting from rural settlement expansion was 1.2 times higher than urbanization-driven losses, with associated grain yield reductions being 1.5 times greater [41]. This disparity indicates significant inefficiencies related to uncontrolled rural land use expansion. However, some studies suggest that agricultural displacement resulting from urbanization may have a limited impact (<1%) on grain yield, albeit at the cost of a significant reduction in natural lands by 2050 [42]. In China, the implementation of inclusive urbanization strategies could potentially release up to 5.77 million hectares of farmland, increasing grain yield by approximately 60.23 million tons [43]. Furthermore, urbanization and cropland abandonment exhibited spatial–temporal coupling. Previous studies revealed that newly emerging large cities experienced the highest per capita cropland abandonment, with medium-sized cities exhibiting pronounced abandonment of high-quality cropland, primarily driven by urbanization [44]. In the YRD, farmland abandonment has been primarily driven by both economic urbanization and land urbanization, with the predominant driver shifting from economic urbanization to land urbanization around 2015, corresponding to different stages of urban development [45].

4.2. The Importance of “Safeguarding Grain in Land and Technology”

The replenishment of cropland contributed approximately 1.43 million tons of additional grain yield, offsetting merely 41% of the loss caused by urban expansion. In contrast, stable cropland productivity enhancements, due to the effective implementation of the policy of “storing grain in land and technology,” resulted in an increase of approximately 9.84 million tons since 2001, significantly surpassing the grain yield loss caused by urbanization (Figure 9).
Thus, the perceived threat of urban encroachment on cropland to food security may be overstated. Research suggests that approximately 77% of grain yield increases are attributed to improved productivity per unit area, 14% to expansion in cropland, and 9% to increased cropping intensity [46]. Human-driven agricultural intensification and policy implementations in regions such as the Loess Plateau notably increased grain yield, effectively mitigating potential urbanization-induced food crises [47]. Land consolidation has emerged as a critical strategy to enhance food security [45]. In China, around 86% of cropland is suitable for consolidation to form large-scale agricultural operations averaging over 16 hectares per parcel [7]. Urban expansion can also encourage farmers to adopt new agricultural technologies to offset labor shortages, positively influencing regional food security [48]. Reduced rural populations and land release due to urbanization decrease land fragmentation, facilitating larger-scale agriculture [49]. Additionally, intensified agricultural practices are increasingly clustering in regions significantly impacted by urban expansion [6].

4.3. Limitations

This study reveals the comprehensive impact of urbanization-induced cropland changes on grain production in the central region of the YRD, highlighting that productivity improvements in stable cropland far exceed the compensatory effects of land balance policies. The findings thus provide a novel theoretical perspective and empirical support for optimizing regional land use planning. Nevertheless, there are limitations to the generalizability of the findings due to region-specific urbanization patterns and agricultural policies. The applicability of the identified cropland loss–compensation relationships in arid or mountainous agricultural regions remains unverified. Additionally, the analysis did not fully account for quality differences between urbanized cropland (often high-yield farmland) and compensated cropland (often marginal land). Relying exclusively on area and total grain yield for evaluating compensation may overestimate the actual productivity of newly reclaimed cropland and underestimate the risks associated with “occupying superior land and compensating with inferior land.” Furthermore, the grain yield increment (9.84 million tons) on stable cropland over the past 23 years did not distinctly separate the contributions from climate change and technological advancements, potentially inflating the impact attributed solely to “storing grain in land” policies. The negative impacts of cropland reclamation (e.g., wetland conversion, hillside development) on ecosystem services, such as biodiversity and water retention, were not included in the analysis. Short-term productivity gains might conceal long-term ecological costs, indicating the necessity for multi-dimensional sustainability and cost–benefit assessments. Moreover, equating food security solely with total grain output overlooks critical aspects such as food diversity, equity in distribution, and supply chain resilience, thus not fully capturing systemic risks within the food system. Future research should employ historical trend analyses and scenario simulations (e.g., intensified climate extremes, adjusted cropland protection policies) to identify critical thresholds within loss–compensation systems, thereby enriching research outcomes.

5. Conclusions

Urban expansion significantly reduces grain yield by converting cropland, exhibiting notable spatial variability. During the study period, urbanization in the central region of the YRD converted 14,598 km2 of cropland, causing approximately 3.49 million tons of grain loss, which was primarily concentrated in economically advanced areas such as Yancheng, Nantong, Suzhou, and Shanghai. This underscores the impact of rapid urbanization on prime agricultural land. Cropland compensation via the requisition–compensation policy only partly offset these losses, reclaiming 8278 km2 and increasing grain yield by 1.43 million tons (41% of total losses). Cities like Chuzhou and Xuancheng in Anhui Province notably contributed to this compensatory production, highlighting uneven cropland resource allocation. Increasing the productivity of stable cropland (102,188 km2) significantly enhanced food security, yielding an additional 9.84 million tons, thus effectively offsetting the urbanization-induced losses by 271%. Chuzhou, Hefei, and Ma’anshan emerged as grain yield hotspots, while densely urbanized areas such as Suzhou, Shanghai, and Jiaxing experienced saturation-induced stagnation. Securing grain yield through coordinated land and technological strategies demonstrates that urbanization does not inherently threaten food security if supported by stringent cropland protection policies and agricultural innovation. Optimizing land compensation mechanisms, strengthening the quality control of reclaimed lands, and continuously enhancing stable cropland productivity through high-standard farmland development and smart agriculture are essential for synergizing urbanization and food security.

Author Contributions

Conceptualization, Q.L. and S.C.; methodology, Y.H.; software, J.S.; validation, J.Z., S.C. and Q.L.; formal analysis, Q.L.; investigation, J.S.; resources, J.Z.; data curation, S.C.; writing—original draft preparation, Q.L.; writing—review and editing, J.Z. and S.C.; visualization, Y.H. and J.S.; supervision, J.Z.; project administration, J.Z. and S.C.; funding acquisition, S.C. All authors have read and agreed to the published version of the manuscript.

Funding

This research was funded by Philosophy and Social Science Planning Project of Anhui Province, China (AHSKQ2021D172), and Major Natural Science Research Project of the Department of Education, Anhui Province (2024AH040199).

Data Availability Statement

The raw data supporting the conclusions of this article will be made available by the authors on request.

Conflicts of Interest

The authors declare no conflicts of interest.

References

  1. Qureshi, M.E.; Dixon, J.; Wood, M. Public Policies for Improving Food and Nutrition Security at Different Scales. Food Secur. 2015, 7, 393–403. [Google Scholar] [CrossRef]
  2. Andrews, E.; Sanderson Bellamy, A. Putting Food in the Driver’s Seat: Aligning Food-Systems Policy to Advance Sustainability, Health, and Security. Front. Sustain. Food Syst. 2023, 7, 1204194. [Google Scholar] [CrossRef]
  3. Qiao, J.; Cao, Q.; Zhang, Z.; Cao, Z.; Liu, H. Spatiotemporal Changes in the State of Food Security across Mainland China during 1990–2015: A Multi-Scale Analysis. Food Energy Secur. 2022, 11, e318. [Google Scholar] [CrossRef]
  4. Wang, S.; Wu, H.; Li, J.; Xiao, Q.; Li, J. Assessment of the Effect of the Main Grain-Producing Areas Policy on China’s Food Security. Foods 2024, 13, 654. [Google Scholar] [CrossRef] [PubMed]
  5. Lu, Y.; He, T.; Yue, W.; Li, M.; Shan, Z.; Zhang, M. Does Cropland Threaten Urban Land Use Efficiency in the Peri-Urban Area? Evidence from Metropolitan Areas in China. Appl. Geogr. 2023, 161, 103124. [Google Scholar] [CrossRef]
  6. Ma, C.; Li, M.; Jiang, P. The Multiscale Response of Global Cropland Cropping Intensity to Urban Expansion. Agric. Syst. 2024, 221, 104138. [Google Scholar] [CrossRef]
  7. Duan, J.; Ren, C.; Wang, S.; Zhang, X.; Reis, S.; Xu, J.; Gu, B. Consolidation of Agricultural Land Can Contribute to Agricultural Sustainability in China. Nat. Food 2021, 2, 1014–1022. [Google Scholar] [CrossRef]
  8. Liu, Y.; Zhou, Y. Reflections on China’s Food Security and Land Use Policy under Rapid Urbanization. Land Use Policy 2021, 109, 105699. [Google Scholar] [CrossRef]
  9. D’Amour, C.B.; Reitsma, F.; Baiocchi, G.; Barthel, S.; Güneralp, B.; Erb, K.H.; Haberl, H.; Creutzig, F.; Seto, K.C. Future Urban Land Expansion and Implications for Global Croplands. Proc. Natl. Acad. Sci. USA 2017, 114, 8939–8944. [Google Scholar] [CrossRef]
  10. Xie, Y.; Hunter, M.; Sorensen, A.; Nogeire-McRae, T.; Murphy, R.; Suraci, J.P.; Lischka, S.; Lark, T.J. U.S. Farmland under Threat of Urbanization: Future Development Scenarios to 2040. Land 2023, 12, 574. [Google Scholar] [CrossRef]
  11. Li, W.; Chen, Z.; Li, M.; Qiu, X.; Zhao, Q.Q.; Chen, Y. Spatial Conflict Identification and Scenario Coordination for Construction—Agricultural—Ecological Land Use. Environ. Dev. Sustain. 2025, 27, 1933–1961. [Google Scholar] [CrossRef]
  12. Potapov, P.; Turubanova, S.; Hansen, M.C.; Tyukavina, A.; Zalles, V.; Khan, A.; Song, X.P.; Pickens, A.; Shen, Q.; Cortez, J. Global Maps of Cropland Extent and Change Show Accelerated Cropland Expansion in the Twenty-First Century. Nat. Food 2022, 3, 19–28. [Google Scholar] [CrossRef]
  13. Han, J.; Bryan, B.A.; Zhang, Y. Strategic Cropland Reserves Can Strengthen China’s Food Security. Nat. Food 2024, 5, 535–538. [Google Scholar] [CrossRef] [PubMed]
  14. Tu, Y.; Chen, B.; Yu, L.; Xin, Q.; Gong, P.; Xu, B. How Does Urban Expansion Interact with Cropland Loss? A Comparison of 14 Chinese Cities from 1980 to 2015. Landsc. Ecol. 2021, 36, 243–263. [Google Scholar] [CrossRef]
  15. Chen, H.; Tan, Y.; Xiao, W.; Li, G.; Meng, F.; He, T.; Li, X. Urbanization in China Drives Farmland Uphill under the Constraint of the Requisition—Compensation Balance. Sci. Total Environ. 2022, 831, 154895. [Google Scholar] [CrossRef]
  16. Han, B.; Jin, X.; Yeting, F.; Chen, H.; Jin, J.; Xu, W.; Ren, J.; Zhou, Y. Trend and Spatial Pattern of Stable Cropland Productivity in China Based on Satellite Observations (2001–2020). Environ. Impact Assess. Rev. 2023, 101, 107136. [Google Scholar] [CrossRef]
  17. Li, C.; Chen, L.; Liu, D.; Wei, J.; He, J.; Duan, X. The Hidden Risk in China’s Cropland Conversion from the Perspective of Slope. Catena 2021, 206, 105536. [Google Scholar] [CrossRef]
  18. Liang, X.; Jin, X.; Dou, Y.; Zhang, X.; Li, H.; Wang, S.; Meng, F.; Tan, S.; Zhou, Y. Mapping Sustainability-Oriented China’s Cropland Use Stability. Comput. Electron. Agric. 2024, 219, 108823. [Google Scholar] [CrossRef]
  19. Abebe, M.G. Impacts of Urbanization on Food Security in Ethiopia. A Review with Empirical Evidence. J. Agric. Food Res. 2024, 15, 100997. [Google Scholar] [CrossRef]
  20. Wang, L.; Zhang, S.; Xiong, Q.; Liu, Y.; Liu, Y.; Liu, Y. Spatiotemporal Dynamics of Cropland Expansion and Its Driving Factors in the Yangtze River Economic Belt: A Nuanced Analysis at the County Scale. Land Use Policy 2022, 119, 106168. [Google Scholar] [CrossRef]
  21. Han, S.; Shao, Q.; Ning, J.; Jin, S. Spatio-Temporal Changes of Arable Land and Their Impacts on Grain Output in the Yangtze River Economic Belt from 1980 to 2020. Remote Sens. 2024, 16, 1672. [Google Scholar] [CrossRef]
  22. Ye, X.; Xiang, A.; Gao, R.; Chuai, X. The Impact of Spatiotemporal Change in Cropland Use on Local Urban Cereal Supply in China. Agric. Syst. 2025, 224, 104259. [Google Scholar] [CrossRef]
  23. Bedasa, Y.; Gemechu, A.; Bedemo, A.; Gebissa, B.; Xiuguang, B. Impacts of Climate and Non-Climate Factors on Cereal Crop Yield in East Africa: A Generalized Method of Moments (GMM) Panel Data Analysis. J. Agric. Food Res. 2025, 21, 101829. [Google Scholar] [CrossRef]
  24. Madolli, M.J.; Kanannavar, P.S.; Paul, N.C.; Gade, S.A.; Datta, A.; Himanshu, S.K. Assessing the Effects of Spatial Variability of Field Microtopography on Crop Yield, Soil Water, and Water Productivity Under Rainfed Sorghum Production System. Water Conserv. Sci. Eng. 2025, 10, 21. [Google Scholar] [CrossRef]
  25. Qiu, B.; Li, H.; Tang, Z.; Chen, C.; Berry, J. How Cropland Losses Shaped by Unbalanced Urbanization Process? Land Use Policy 2020, 96, 104715. [Google Scholar] [CrossRef]
  26. Shen, W.; Hu, Q.; Zhang, Z. Impacts of in Situ Urbanisation on Grain Production: Evidence from the Yangtze River Delta, China. Habitat Int. 2024, 143, 102989. [Google Scholar] [CrossRef]
  27. Shi, J.; Hua, W.; Duan, K.; Li, H. Evaluation of the Urban—Rural Integration Development Level in the Yangtze River Delta: A Hybrid Method. J. Urban Plan. Dev. 2023, 149, 04023026. [Google Scholar] [CrossRef]
  28. Zhen, Y.; Shi, D.; Lu, Y. The Impact of Regional Integration Strategies on the Formation of City Regions and Its Agglomeration Shadow: Evidence from the Yangtze River Delta, China. Land 2023, 12, 1053. [Google Scholar] [CrossRef]
  29. Han, G.; Yang, H.; Xie, H. Research on the Efficiency and Spatiotemporal Evolution Characteristics of Agricultural Green Development in Central Cities of the Yangtze River Delta. Front. Environ. Sci. 2024, 12, 1502824. [Google Scholar] [CrossRef]
  30. Tan, S.; Hu, B.; Kuang, B.; Zhou, M. Regional Differences and Dynamic Evolution of Urban Land Green Use Efficiency within the Yangtze River Delta, China. Land Use Policy 2021, 106, 105449. [Google Scholar] [CrossRef]
  31. Yang, Y.; Deng, Y.; Xie, X.; Wang, Y. Multiple Isotope Approach Elucidates the Calcium Enrichment of Groundwater in the Central Yangtze River Basin. Appl. Geochem. 2024, 166, 105979. [Google Scholar] [CrossRef]
  32. Yang, J.; Huang, X. The 30m Annual Land Cover Dataset and Its Dynamics in China from 1990 to 2019. Earth Syst. Sci. Data 2021, 13, 3907–3925. [Google Scholar] [CrossRef]
  33. Zhang, X.; Qiu, D.; Xie, Y.; Tu, J.; Lan, H.; Li, X.; Sha, Z. Diversified Responses of Vegetation Carbon Uptake to Urbanization: A National-Scale Analysis. Front. Ecol. Evol. 2023, 11, 1140455. [Google Scholar] [CrossRef]
  34. Huang, Q.; Liu, Z.; He, C.; Gou, S.; Bai, Y.; Wang, Y.; Shen, M. The Occupation of Cropland by Global Urban Expansion from 1992 to 2016 and Its Implications. Environ. Res. Lett. 2020, 15, 084037. [Google Scholar] [CrossRef]
  35. Shi, S.; Ye, Y.; Xiao, R. Evaluation of Food Security Based on Remote Sensing Data—Taking Egypt as an Example. Remote Sens. 2022, 14, 2876. [Google Scholar] [CrossRef]
  36. Gwal, S.; Sena, D.R.; Srivastava, P.K.; Srivastava, S.K. Identifying Conservation Priority Areas of Hydrological Ecosystem Service Using Hot and Cold Spot Analysis at Watershed Scale. Remote Sens. 2024, 16, 3409. [Google Scholar] [CrossRef]
  37. Igboeli, E.E.; Chukwuka, O.; Ochege, F.U.; Onyekwelu, C.A.; Ling, Q.; Ajaero, C.; Hamdi, R.; Rahman, M.; Kayiranga, A.; Luo, G. Combined Impacts of Land Change and Climate Variability on Ecosystem Net Primary Productivity in Arid Regions. Glob. Planet. Change 2025, 245, 104682. [Google Scholar] [CrossRef]
  38. Huang, Y.; Jin, Y.; Chen, S. The Spatiotemporal Dynamics of Vegetation Cover and Its Response to the Grain for Green Project in the Loess Plateau of China. Forests 2024, 15, 1949. [Google Scholar] [CrossRef]
  39. Liang, X.; Jin, X.; Xu, X.; Chen, H.; Liu, J.; Yang, X.; Xu, W.; Sun, R.; Han, B.; Zhou, Y. Uncertainty in China’s Food Self-Sufficiency: A Dynamic System Assessment. Sustain. Prod. Consum. 2023, 40, 135–146. [Google Scholar] [CrossRef]
  40. He, C.; Liu, Z.; Xu, M.; Ma, Q.; Dou, Y. Urban Expansion Brought Stress to Food Security in China: Evidence from Decreased Cropland Net Primary Productivity. Sci. Total Environ. 2017, 576, 660–670. [Google Scholar] [CrossRef]
  41. Liu, Y.; Ou, C.; Liu, Y.; Cao, Z.; Robinson, G.M.; Li, X. Unequal Impacts of Global Urban–Rural Settlement Construction on Cropland and Production over the Past Three Decades. Sci. Bull. 2025, 70, 1699–1709. [Google Scholar] [CrossRef]
  42. De Vos, K.; Janssens, C.; Jacobs, L.; Campforts, B.; Boere, E.; Kozicka, M.; Leclère, D.; Havlík, P.; Hemerijckx, L.M.; Van Rompaey, A.; et al. African Food System and Biodiversity Mainly Affected by Urbanization via Dietary Shifts. Nat. Sustain. 2024, 7, 869–878. [Google Scholar] [CrossRef]
  43. Hu, G.; Li, X.; Liu, X.; Wang, S.; Zhang, X.; Shi, X.; Bai, X.; Hubacek, K. Mitigating the Ripple Effects of Urbanization on Farmland Productivity and Ecological Security through Inclusive Urbanization Strategies. npj Urban Sustain. 2025, 5, 12. [Google Scholar] [CrossRef]
  44. Qiu, B.; Yang, X.; Tang, Z.; Chen, C.; Li, H.; Berry, J. Urban Expansion or Poor Productivity: Explaining Regional Differences in Cropland Abandonment in China during the Early 21st Century. Land Degrad. Dev. 2020, 31, 2540–2551. [Google Scholar] [CrossRef]
  45. Zheng, N.; Li, L.; Han, L.; Zhu, X.; Zhao, K.; Zhu, Z.; Ye, X. The Relationship between Farmland Abandonment and Urbanization Processes: A Case Study in Four Chinese Urban Agglomerations. Land 2024, 13, 664. [Google Scholar] [CrossRef]
  46. Zhou, B.B.; Aggarwal, R.; Wu, J.; Lv, L. Urbanization-Associated Farmland Loss: A Macro-Micro Comparative Study in China. Land Use Policy 2021, 101, 105228. [Google Scholar] [CrossRef]
  47. Li, S.; Ji, Q.; Liang, W.; Fu, B.; Lü, Y.; Yan, J.; Jin, Z.; Wang, Z.; Li, Y. Urbanization Does Not Endanger Food Security: Evidence from China’s Loess Plateau. Sci. Total Environ. 2023, 871, 162053. [Google Scholar] [CrossRef]
  48. Liu, X.; Xu, Y.; Engel, B.A.; Sun, S.; Zhao, X.; Wu, P.; Wang, Y. The Impact of Urbanization and Aging on Food Security in Developing Countries: The View from Northwest China. J. Clean. Prod. 2021, 292, 126067. [Google Scholar] [CrossRef]
  49. Wang, S.; Bai, X.; Zhang, X.; Reis, S.; Chen, D.; Xu, J.; Gu, B. Urbanization Can Benefit Agricultural Production with Large-Scale Farming in China. Nat. Food 2021, 2, 183–191. [Google Scholar] [CrossRef]
Figure 1. Location of the study area. (a) shows the location of the central area of YRD in China, while (b) illustrates the spatial distribution of land use types in the study area in 2023.
Land 14 01476 g001
Figure 2. Area and spatial distribution of cropland converted to construction land (2001–2023). (a) shows the area of land use type transfer in the central area of YRD, while (b) illustrates the spatial distribution of cropland converted to construction land.
Land 14 01476 g002
Figure 3. Spatial distribution of grain yield loss due to cropland conversion. (a) shows the spatial distribution of grain yield loss from the conversion of cropland to construction land, while (b) illustrates the spatial distribution of grain yield loss per unit area of cropland converted to construction land.
Land 14 01476 g003
Figure 4. Sources of supplementary cropland in the central region of the YRD.
Land 14 01476 g004
Figure 5. Spatial distribution of grain yield in supplementary cropland. (a) shows the spatial distribution of grain yield in supplementary cropland, while (b) illustrates the spatial distribution of grain yield per unit area of supplementary cropland.
Land 14 01476 g005
Figure 6. Potential increase in grain yield of stable cropland and hot/coldspot patterns. (a) shows the spatial distribution of grain yield in stable cropland in 2001 and 2023, while (b) illustrates the spatial pattern of hot/coldspot for increasing grain yield in stable cropland.
Land 14 01476 g006
Figure 7. Spatial and temporal trends in grain yield for stable cropland.
Land 14 01476 g007
Figure 8. Statistical analysis of types of trend changes in grain yield of stable cropland. (a) shows the spatial distribution of the trend changes in grain yield of stable cropland, while (b) illustrates the statistical analysis of the trend changes in grain yield of stable cropland.
Land 14 01476 g008
Figure 9. Quantitative relationships between grain yield loss, compensation, and increase in the central region of the YRD.
Land 14 01476 g009
Table 1. Data used in this study.
Data NameSpatial ResolutionData Usage Time RangeData Source
CLCD30 m × 30 m2001–2023Professors Yang Jie and Huang Xin from Wuhan University updated Earth System Science Data to cover the period from 1985 to 2023, which is now freely available for download (https://zenodo.org/records/12779975, accessed on 6 May 2025).
NPP500 m × 500 m2001–2023NPP is derived from the sum of all 8-day GPP Net Photosynthesis (PSN) products (MOD17A2H) from the given year.
(https://lpdaac.usgs.gov/products/mod17a3hgfv061/, accessed on 6 May 2025)
GYCity level2001–2023Statistical yearbooks (https://tjj.ah.gov.cn/, accessed on 7 May 2025. https://tj.jiangsu.gov.cn/, accessed on 7 May 2025. https://tjj.zj.gov.cn/, https://tjj.sh.gov.cn/, accessed on 8 May 2025)
Table 2. Classification of grain yield trend changes.
Trends in Grain YieldSGY (Change Rate)Z Value (Significance)
Significant improvement (Si-i)Improvement (≥0.0005)Significant (≥1.96)
Slight improvement (Sl-i)Improvement (≥0.0005)Non-significant (−1.96–1.96)
Basically unchanged (B-u)Stable (−0.0005–0.0005)Non-significant (−1.96–1.96)
Slight degradation (Sl-d)Degradation (<−0.0005)Non-significant (−1.96–1.96)
Significant degradation (Si-d)Degradation (<−0.0005)Significant (≤−1.96)
Disclaimer/Publisher’s Note: The statements, opinions and data contained in all publications are solely those of the individual author(s) and contributor(s) and not of MDPI and/or the editor(s). MDPI and/or the editor(s) disclaim responsibility for any injury to people or property resulting from any ideas, methods, instructions or products referred to in the content.

