
Land Use Changes and Their Impacts on Soil Erosion in a Fragile Ecosystem of the Ethiopian Highlands

 ,
, 
Abstract
1. Introduction
2. Materials and Methods
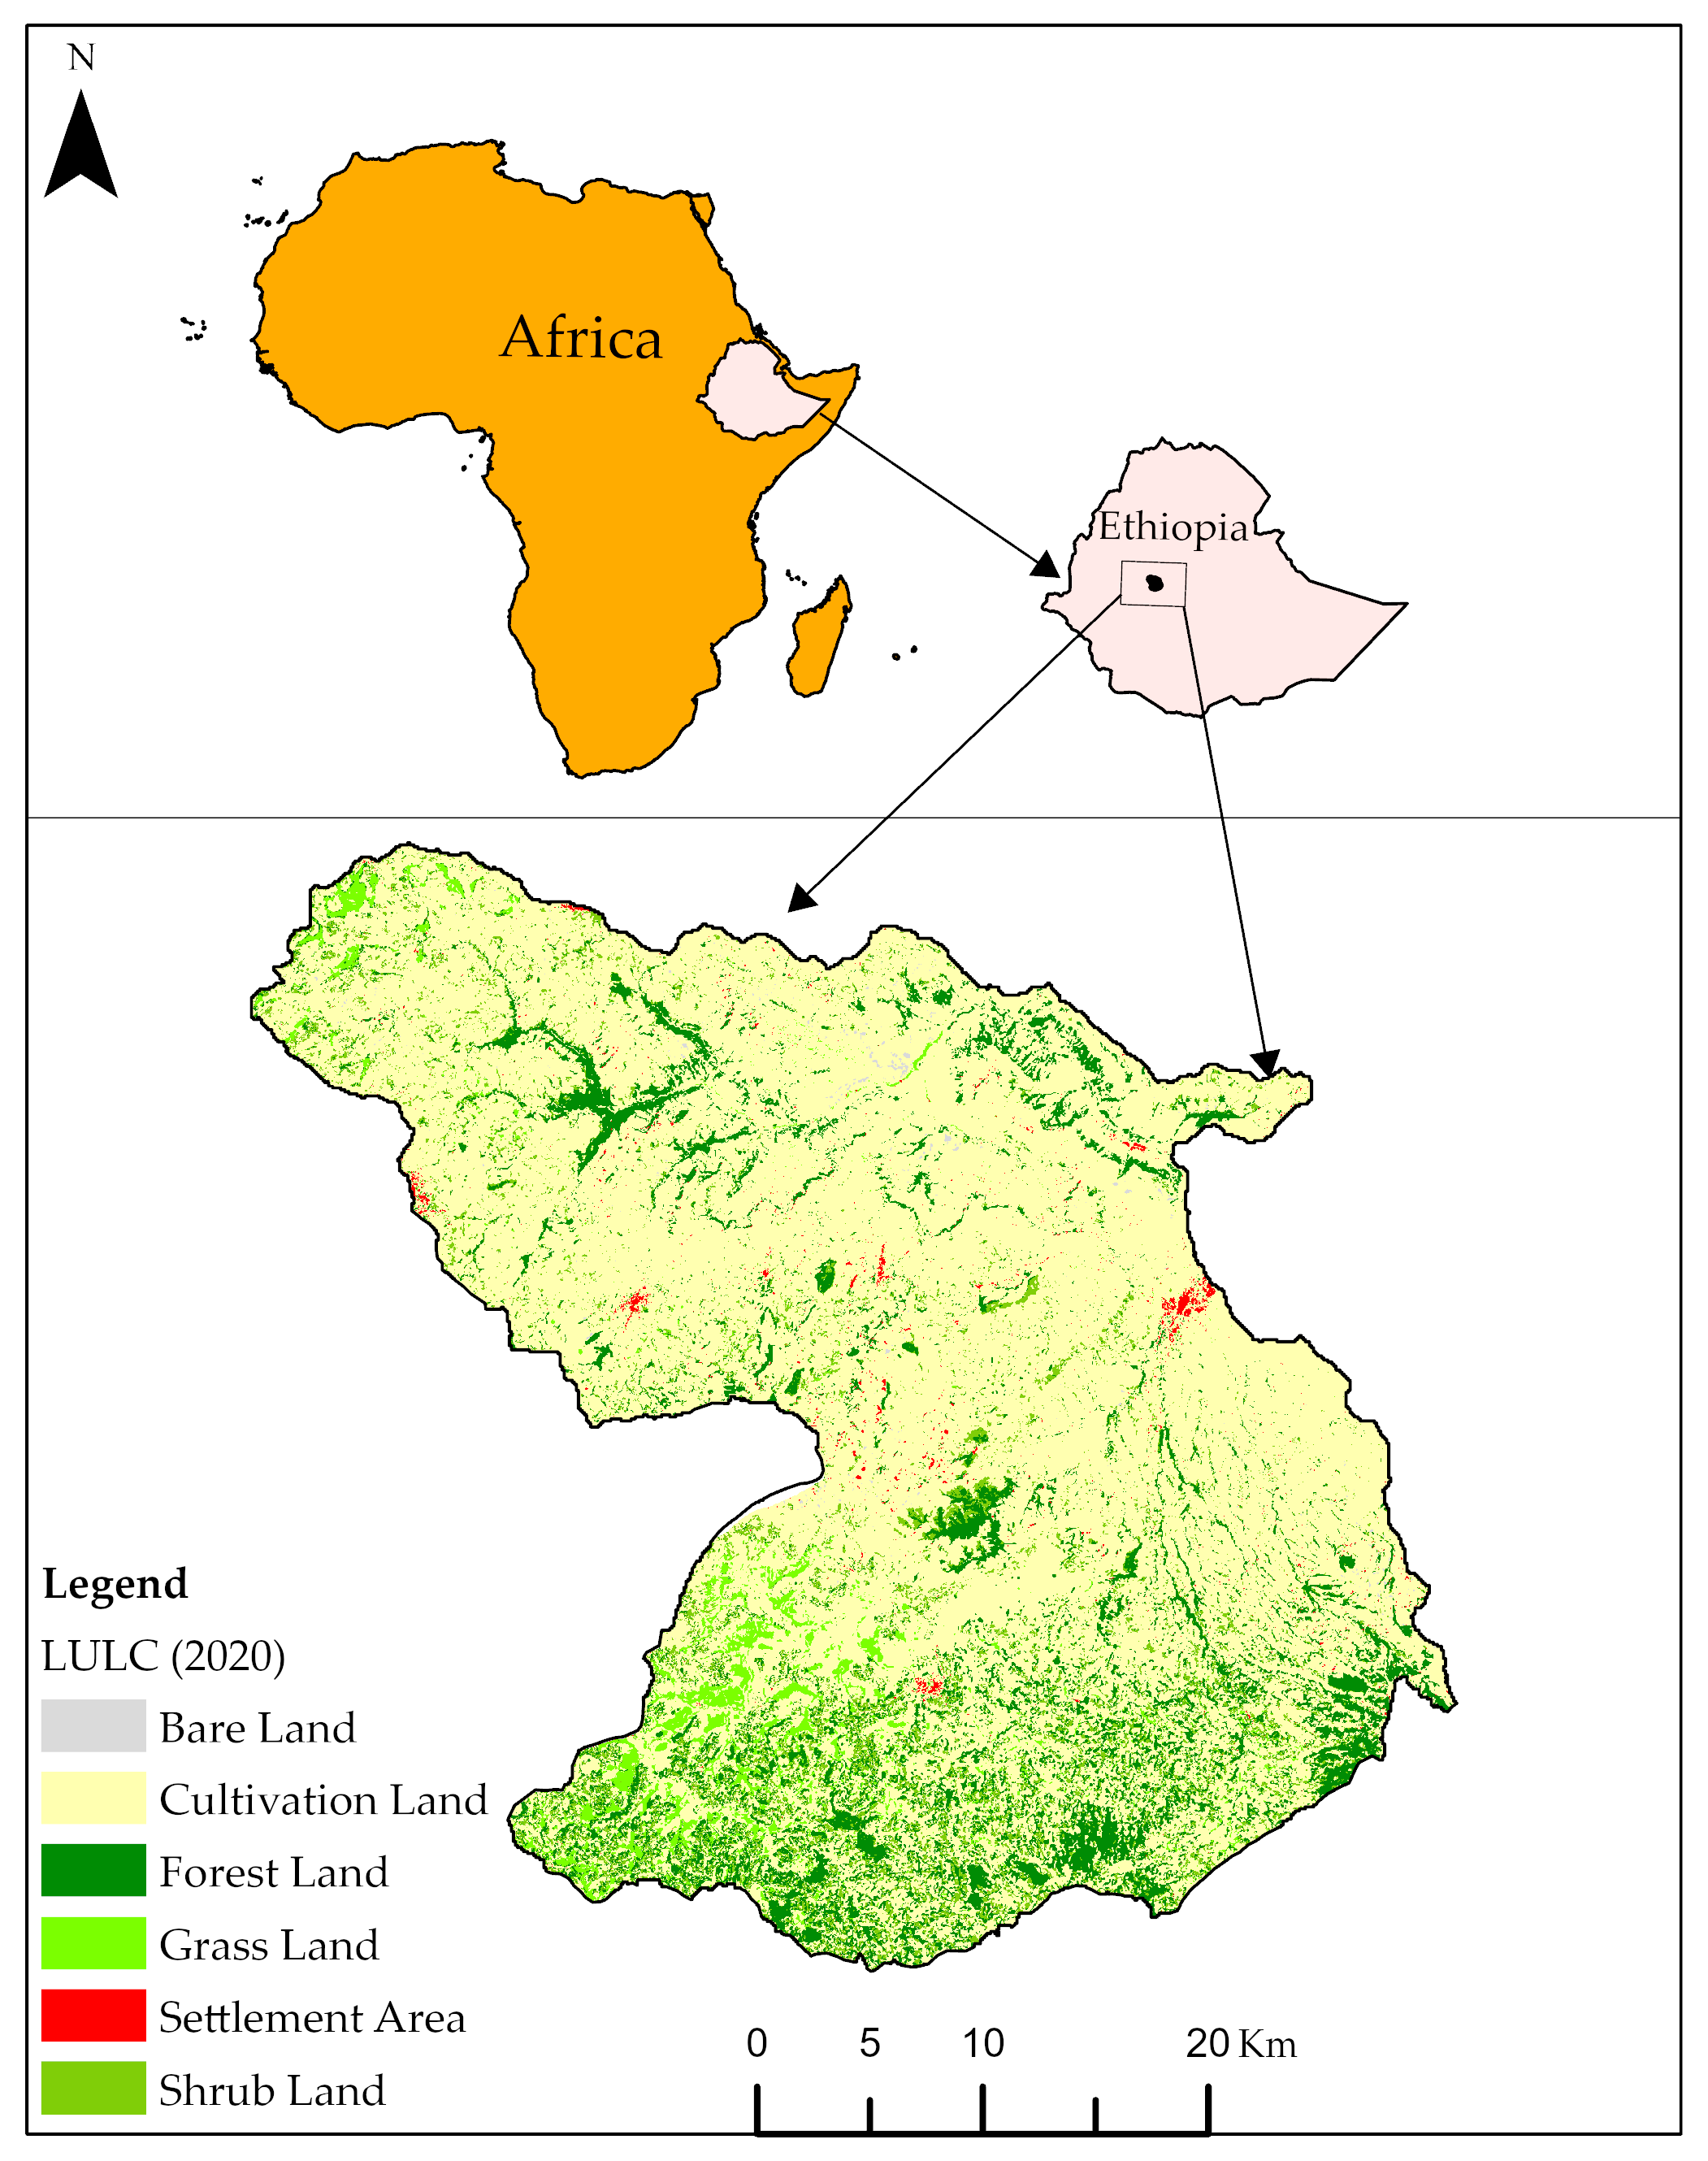
2.1. Study Site
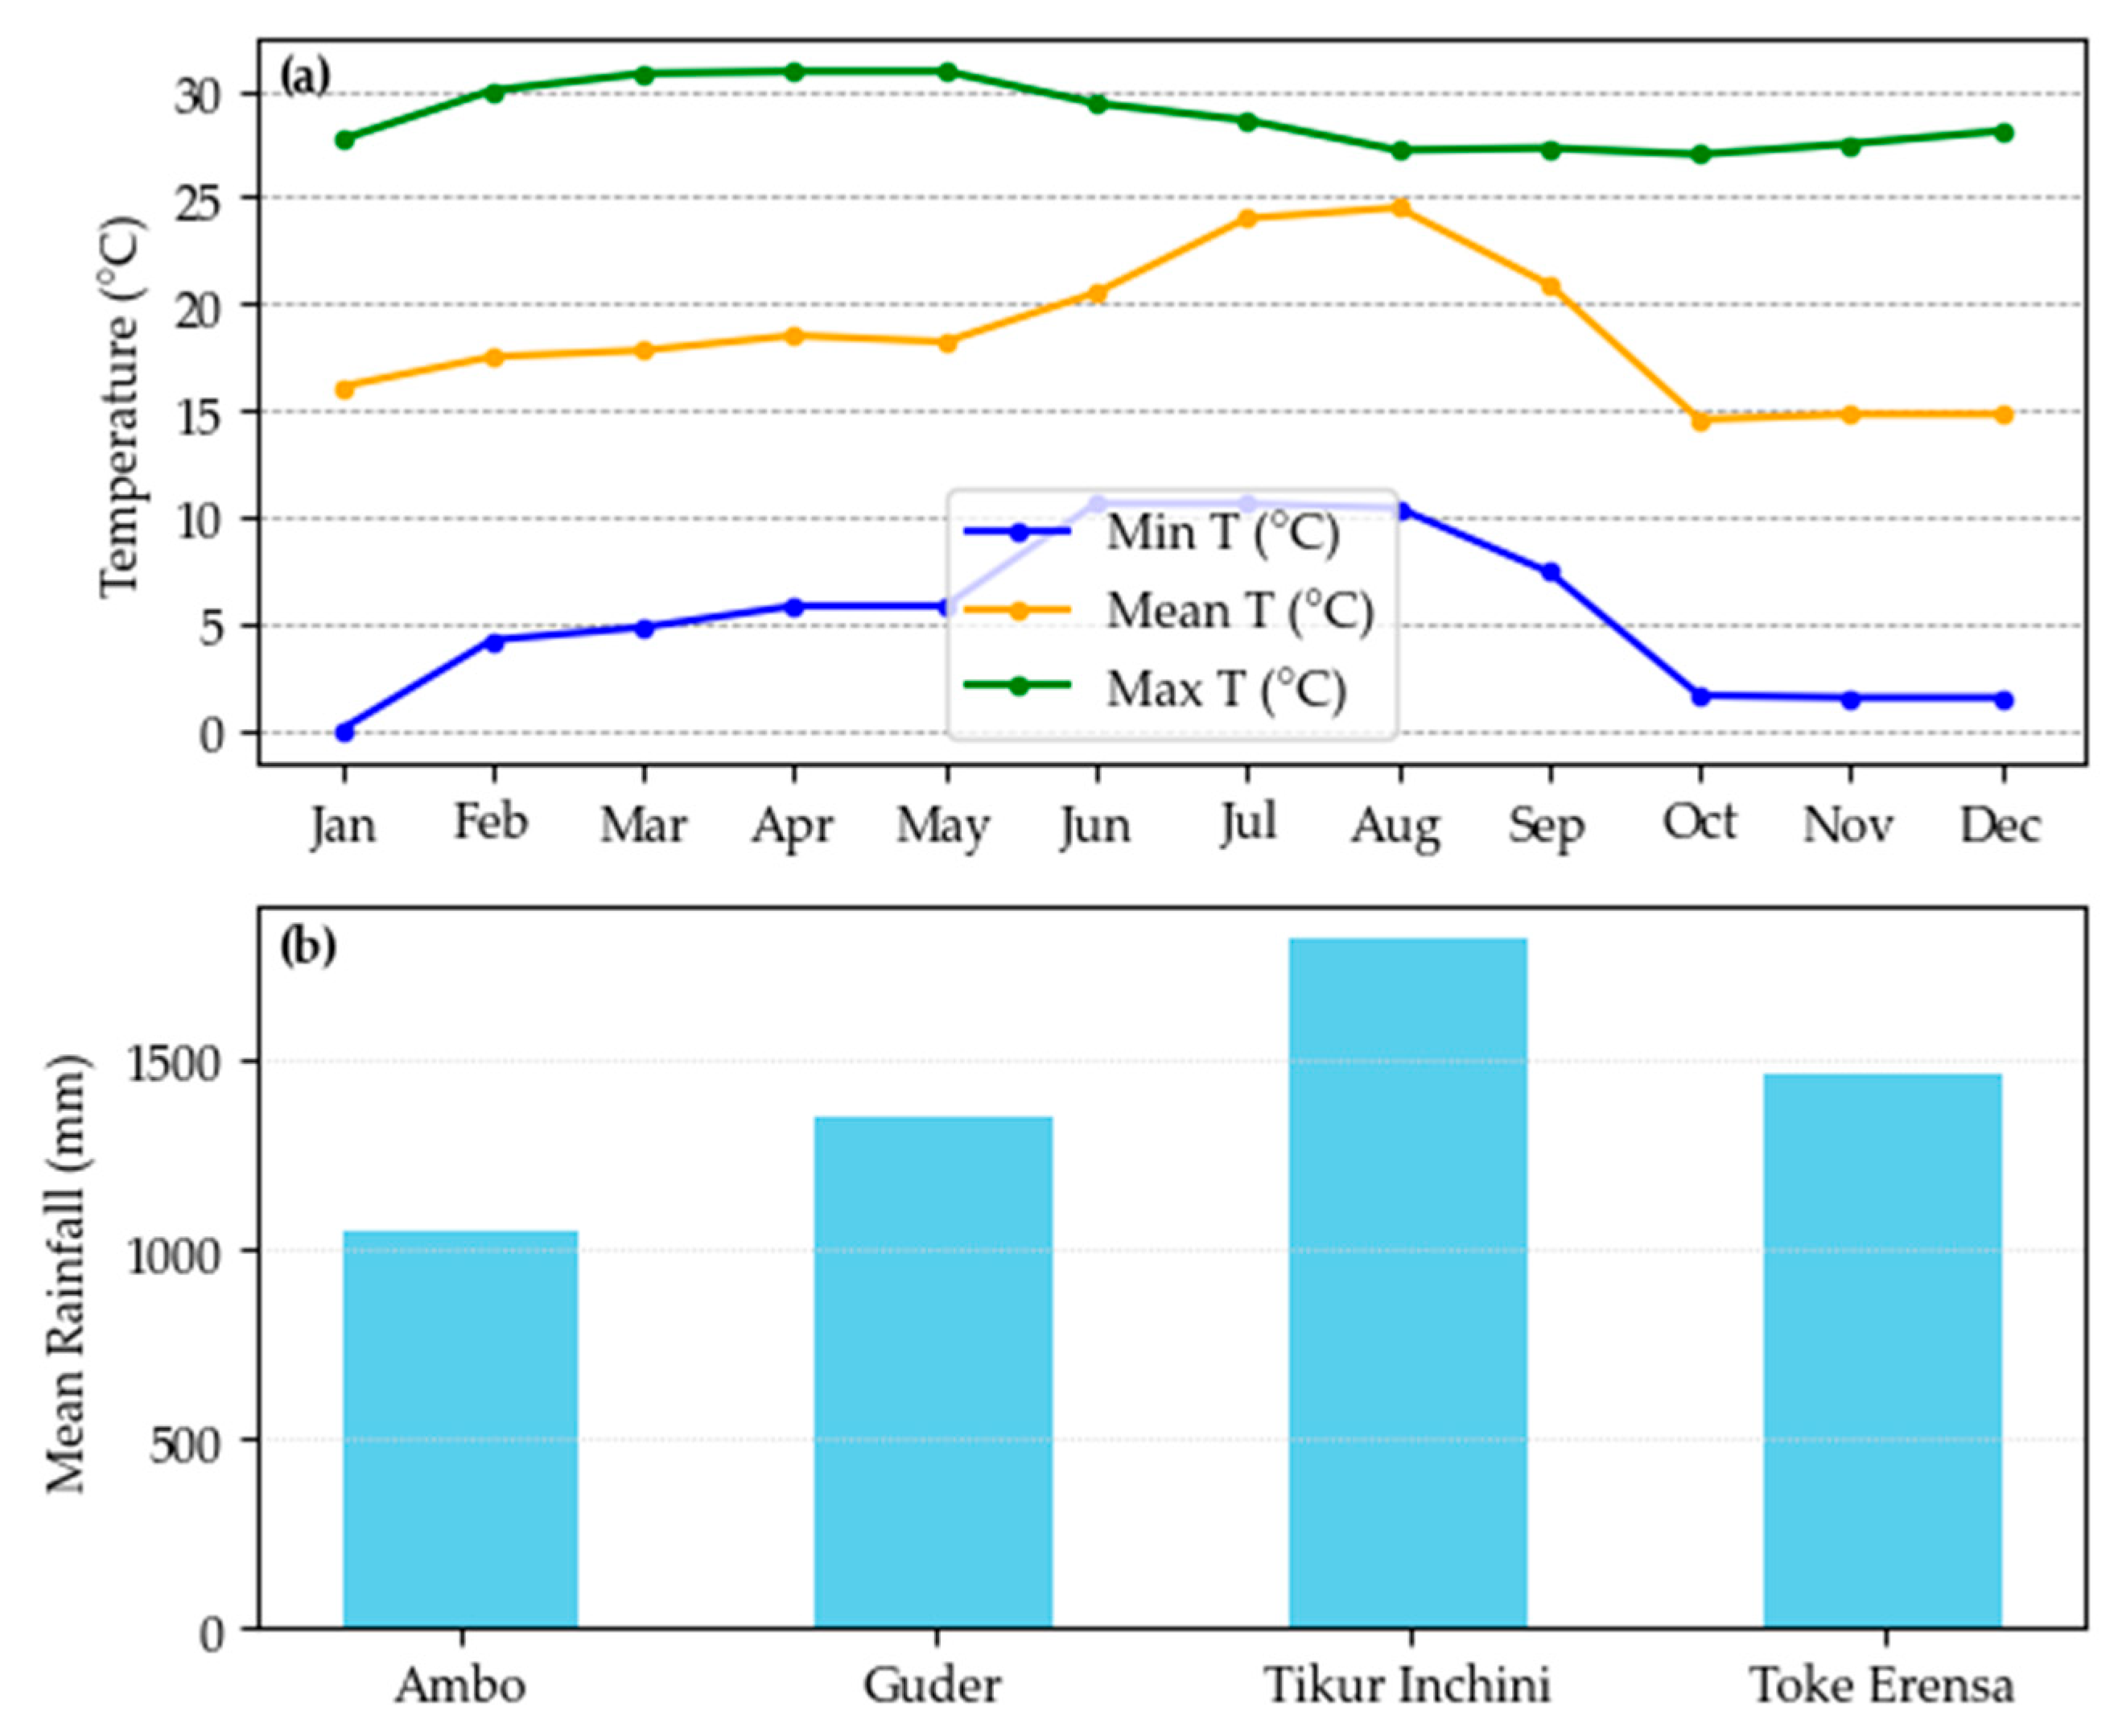
2.2. Dataset Collection and Source
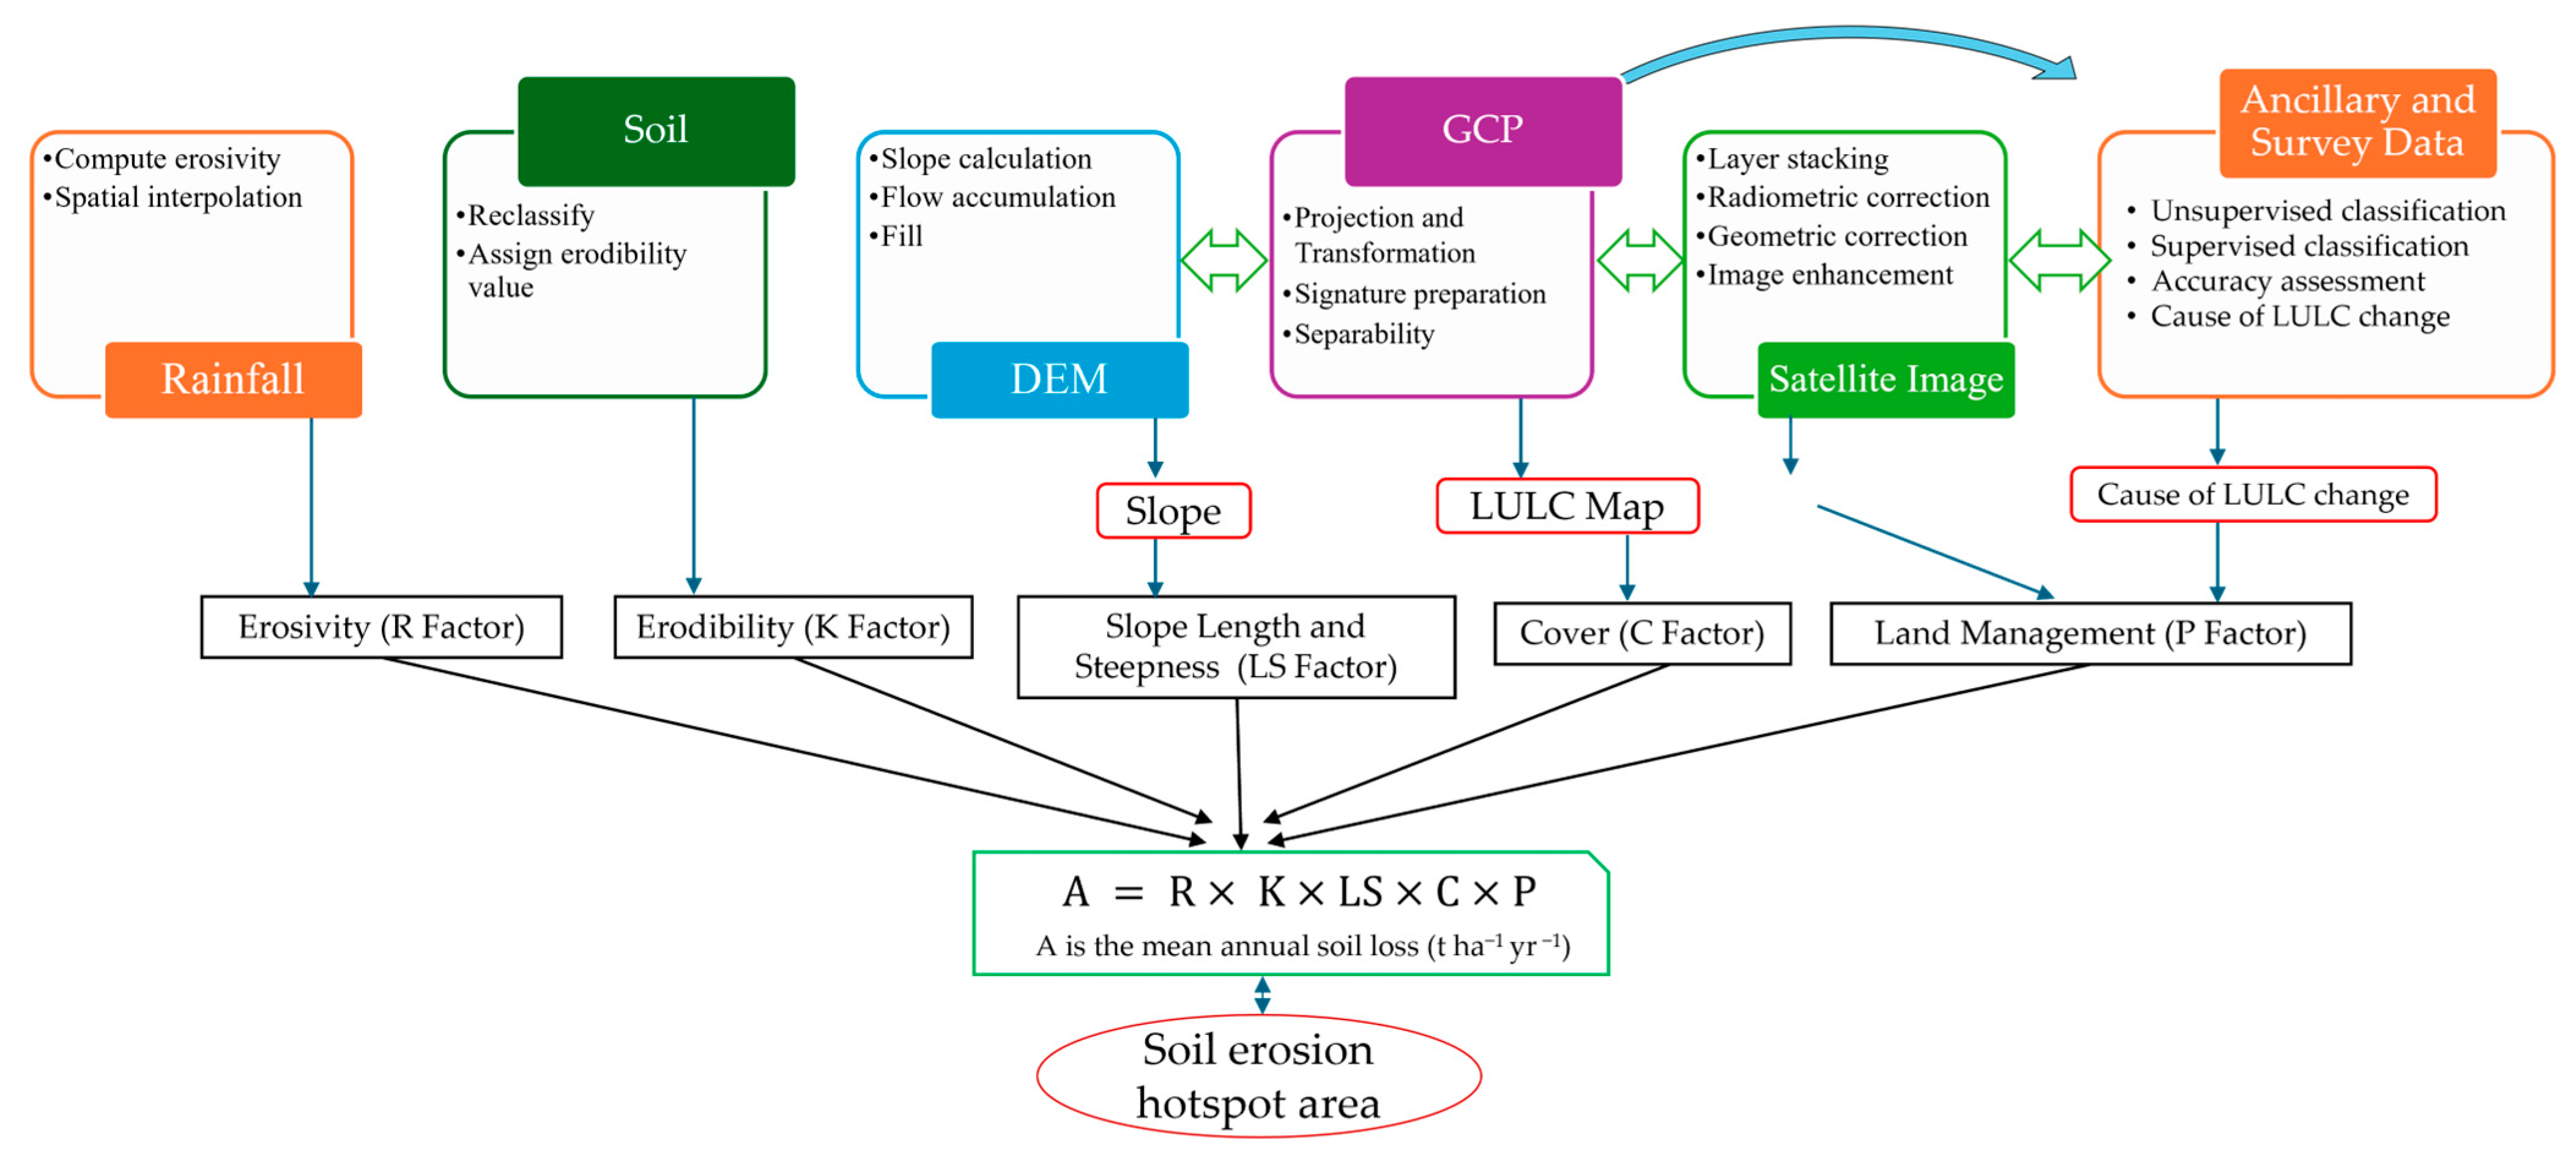
2.3. Data Analysis and Modeling
2.3.1. Image Preprocessing, Classification, and Post-Classification Analysis
2.3.2. RUSLE Model Parameterization and Analysis
- 1.
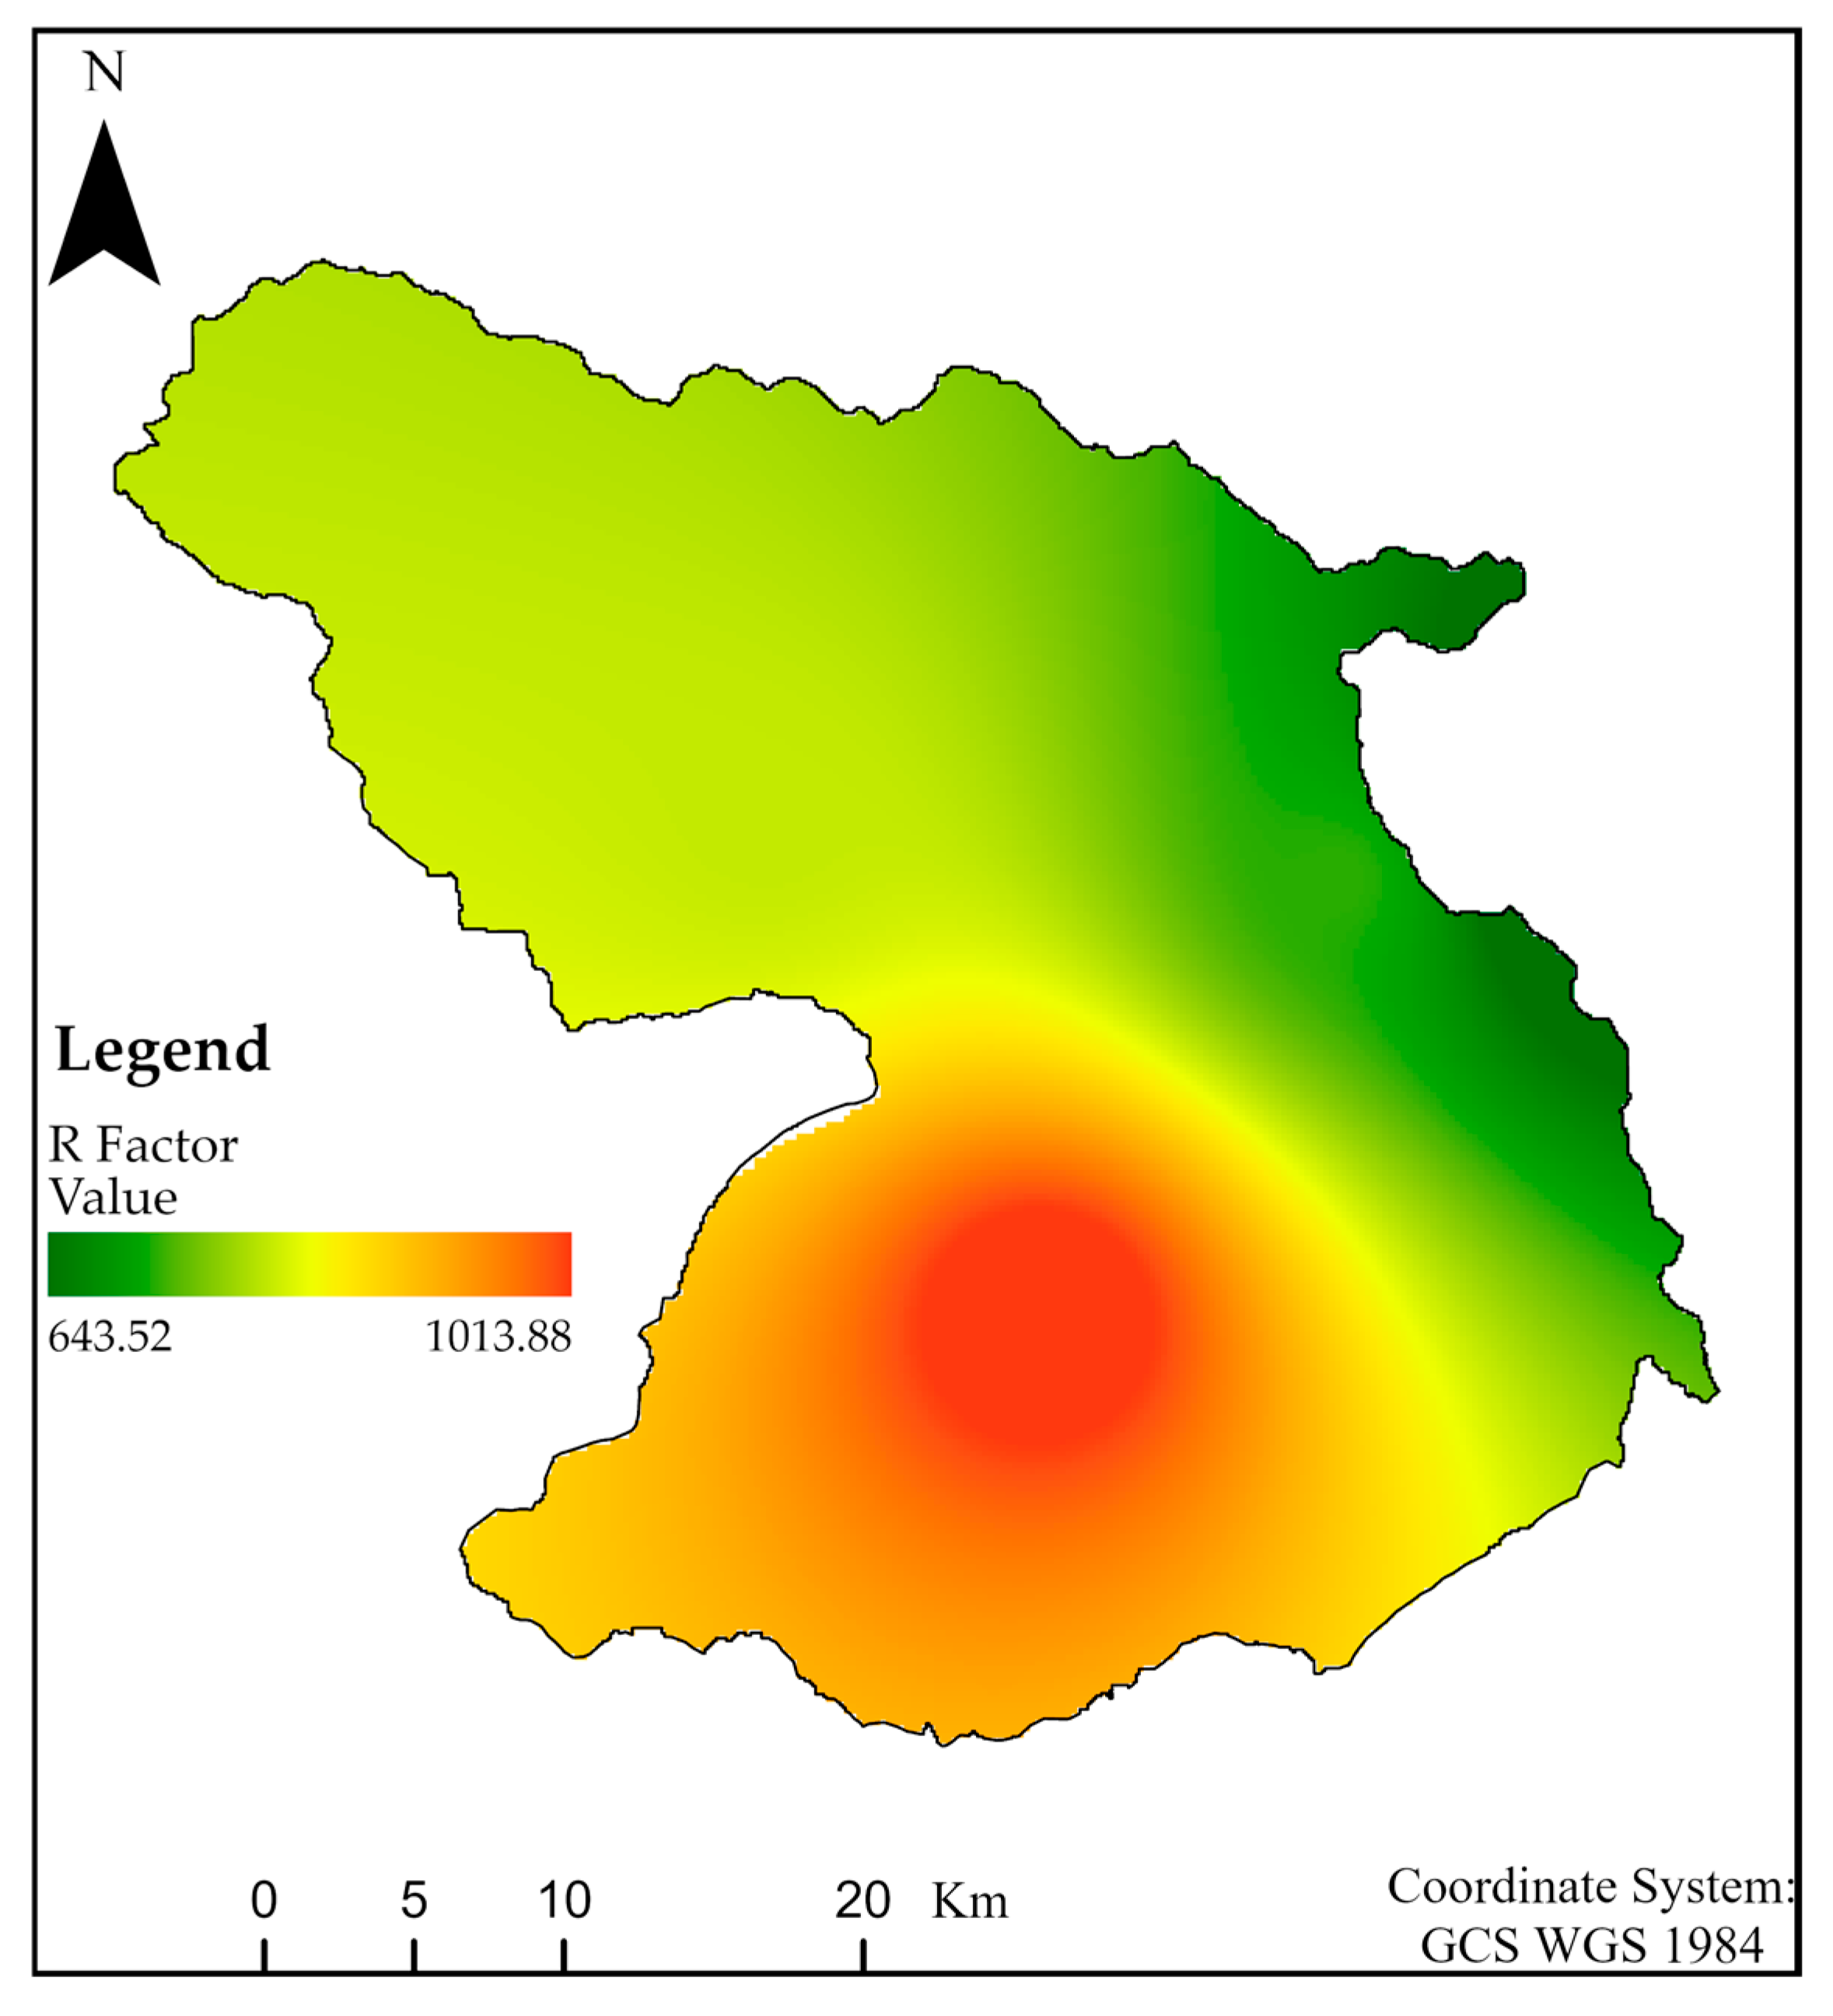
- Rainfall Erosivity (R-factor)
- 2.
- Soil Erodibility Factor (K-factor)
- 3.
- Slope Steepness and Flow Accumulation (LS-factor)
- 4.
- Management Factor (C-factor) and Conservation Practices (P-factor)
3. Result
3.1. Land Use Land Cover Change
3.2. Soil Loss Analysis and LULC Impact
4. Discussion
4.1. Trends and Drives of LULC Changes
4.2. Impacts of LULC Change on Soil Erosion
5. Conclusions
Supplementary Materials
Author Contributions
Funding
Data Availability Statement
Conflicts of Interest
References
- Foley, J.A.; DeFries, R.; Asner, G.P.; Barford, C.; Bonan, G.; Carpenter, S.R.; Chapin, F.S.; Coe, M.T.; Daily, G.C.; Gibbs, H.K. Global Consequences of Land Use. Science 2005, 309, 570–574. [Google Scholar] [CrossRef] [PubMed]
- Meyfroidt, P.; Lambin, E.F.; Erb, K.-H.; Hertel, T.W. Globalization of Land Use: Distant Drivers of Land Change and Geographic Displacement of Land Use. Curr. Opin. Environ. Sustain. 2013, 5, 438–444. [Google Scholar] [CrossRef]
- Turner, B.L.; Lambin, E.F.; Reenberg, A. The Emergence of Land Change Science for Global Environmental Change and Sustainability. Proc. Natl. Acad. Sci. USA 2007, 104, 20666–20671. [Google Scholar] [CrossRef]
- Smith, P.; House, J.I.; Bustamante, M.; Sobocká, J.; Harper, R.; Pan, G.; West, P.C.; Clark, J.M.; Adhya, T.; Rumpel, C. Global Change Pressures on Soils from Land Use and Management. Glob. Change Biol. 2016, 22, 1008–1028. [Google Scholar] [CrossRef]
- Tsegaye, B. Effect of Land Use and Land Cover Changes on Soil Erosion in Ethiopia. Int. J. Agric. Sci. Food Technol. 2019, 5, 026–034. [Google Scholar]
- Rodrigo-Comino, J. Five Decades of Soil Erosion Research in “Terroir”. State-Art. Earth-Sci. Rev. 2018, 179, 436–447. [Google Scholar] [CrossRef]
- Paz, D.B.; Henderson, K.; Loreau, M. Agricultural Land Use and the Sustainability of Social-Ecological Systems. Ecol. Model. 2020, 437, 109312. [Google Scholar]
- Mwanga, E.; Shaibu, A.-G.; Issaka, Z. Assessing the Impact of Land Use and Land Cover (LULC) Changes on the Surface Runoff Downstream of an Ungauged Bontanga Watershed in Northern Ghana. Water Pract. Technol. 2024, 19, 1348–1364. [Google Scholar] [CrossRef]
- Salman, A.; Haque, A.; Rahman, M.; Rabby, M.J.; Hossen, S.; Halder, P.; Evan, R.I. NDVI-Based Analysis of Green Space Decline and Air Quality in Dhaka: Implications for Sustainable Development Goals. Environ. Earth Sci. Res. J. 2023, 10, 73–83. [Google Scholar] [CrossRef]
- Siddik, M.S.; Tulip, S.S.; Rahman, A.; Islam, M.N.; Haghighi, A.T.; Mustafa, S.M.T. The Impact of Land Use and Land Cover Change on Groundwater Recharge in Northwestern Bangladesh. J. Environ. Manag. 2022, 315, 115130. [Google Scholar] [CrossRef]
- Tesfay, F.; Kibret, K.; Gebrekirstos, A.; Hadgu, K.M. Land Use and Land Cover Dynamics and Ecosystem Services Values in Kewet District in the Central Dry Lowlands of Ethiopia. Environ. Monit. Assess. 2022, 194, 801. [Google Scholar] [CrossRef] [PubMed]
- Ayele, A.; Tarekegn, K. The Impact of Urbanization Expansion on Agricultural Land in Ethiopia: A Review. Environ. Socio-Econ. Stud. 2020, 8, 73–80. [Google Scholar] [CrossRef]
- Garedew, E.; Sandewall, M.; Söderberg, U.; Campbell, B.M. Land-Use and Land-Cover Dynamics in the Central Rift Valley of Ethiopia. Environ. Manag. 2009, 44, 683–694. [Google Scholar] [CrossRef]
- Gebru, B.M.; Lee, W.-K.; Khamzina, A.; Lee, S.; Negash, E. Hydrological Response of Dry Afromontane Forest to Changes in Land Use and Land Cover in Northern Ethiopia. Remote Sens. 2019, 11, 1905. [Google Scholar] [CrossRef]
- Mathewos, M.; Wosoro, D.; Wondrade, N. Quantification of Soil Erosion and Sediment Yield Using the RUSLE Model in Boyo Watershed, Central Rift Valley Basin of Ethiopia. Heliyon 2024, 10, e31246. [Google Scholar] [CrossRef]
- Hartemink, A.E. Land Use Change in the Tropics and Its Effect on Soil Fertility; ISRIC—World Soil Information: Wageningen, The Netherlands, 2010; pp. 55–58. [Google Scholar]
- Tikuye, B.G.; Gill, L.; Rusnak, M.; Manjunatha, B.R. Modelling the Impacts of Changing Land Use and Climate on Sediment and Nutrient Retention in Lake Tana Basin, Upper Blue Nile River Basin, Ethiopia. Ecol. Model. 2023, 482, 110383. [Google Scholar] [CrossRef]
- Zeweld, W.; Van Huylenbroeck, G.; Tesfay, G.; Azadi, H.; Speelman, S. Sustainable Agricultural Practices, Environmental Risk Mitigation and Livelihood Improvements: Empirical Evidence from Northern Ethiopia. Land Use Policy 2020, 95, 103799. [Google Scholar] [CrossRef]
- Gashu, D.; Nalivata, P.C.; Amede, T.; Ander, E.L.; Bailey, E.H.; Botoman, L.; Chagumaira, C.; Gameda, S.; Haefele, S.M.; Hailu, K.; et al. The Nutritional Quality of Cereals Varies Geospatially in Ethiopia and Malawi. Nature 2021, 594, 71–76. [Google Scholar] [CrossRef]
- BCEOM. Abay River Basin Integrated Master Plan, Main Report; MOWR: Addis Ababa, Ethiopia, 1999; Volume 464, p. 5. [Google Scholar]
- Wulder, M.A.; Loveland, T.R.; Roy, D.P.; Crawford, C.J.; Masek, J.G.; Woodcock, C.E.; Allen, R.G.; Anderson, M.C.; Belward, A.S.; Cohen, W.B. Current Status of Landsat Program, Science, and Applications. Remote Sens. Environ. 2019, 225, 127–147. [Google Scholar] [CrossRef]
- Lillesand, T.; Kiefer, R.W.; Chipman, J. Remote Sensing and Image Interpretation; John Wiley & Sons: Hoboken, NJ, USA, 2015; ISBN 1-118-34328-X. [Google Scholar]
- Nery, T.; Sadler, R.; Solis-Aulestia, M.; White, B.; Polyakov, M.; Chalak, M. Comparing Supervised Algorithms in Land Use and Land Cover Classification of a Landsat Time-Series. In Proceedings of the 2016 IEEE International Geoscience and Remote Sensing Symposium (IGARSS), Beijing, China, 10–15 July 2016; pp. 5165–5168. [Google Scholar]
- Rientjes, T.H.M.; Haile, A.T.; Kebede, E.; Mannaerts, C.M.M.; Habib, E.; Steenhuis, T.S. Changes in Land Cover, Rainfall and Stream Flow in Upper Gilgel Abbay Catchment, Blue Nile Basin–Ethiopia. Hydrol. Earth Syst. Sci. 2011, 15, 1979–1989. [Google Scholar] [CrossRef]
- Loveland, T.R.; Dwyer, J.L. Landsat: Building a Strong Future. Remote Sens. Environ. 2012, 122, 22–29. [Google Scholar] [CrossRef]
- Renard, K.G. Predicting Soil Erosion by Water: A Guide to Conservation Planning with the Revised Universal Soil Loss Equation (RUSLE); US Department of Agriculture, Agricultural Research Service: Washington, DC, USA, 1997; ISBN 0-16-048938-5. [Google Scholar]
- Hurni, H. An Ecosystem Approach to Soil Conservation. Soil Eros. Conserv. 1985, 73, 759–771. [Google Scholar]
- Hurni, H.; Abate, S.; Bantider, A.; Debele, B.; Ludi, E.; Portner, B.; Yitaferu, B.; Zeleke, G. Land Degradation and Sustainable Land Management in the Highlands of Ethiopia. In Global Change and Sustainable Development: A Synthesis of Regional Experiences from Research; University of Bern: Bern, Switzerland, 2010. [Google Scholar]
- Kidane, M.; Bezie, A.; Kesete, N.; Tolessa, T. The Impact of Land Use and Land Cover (LULC) Dynamics on Soil Erosion and Sediment Yield in Ethiopia. Heliyon 2019, 5, e02981. [Google Scholar] [CrossRef] [PubMed]
- Zerihun, M.; Mohammedyasin, M.S.; Sewnet, D.; Adem, A.A.; Lakew, M. Assessment of Soil Erosion Using RUSLE, GIS and Remote Sensing in NW Ethiopia. Geoderma Reg. 2018, 12, 83–90. [Google Scholar] [CrossRef]
- Wischmeier, W.H.; Smith, D.D. Predicting Rainfall Erosion Losses: A Guide to Conservation Planning; Department of Agriculture, Science and Education Administration: Washington, DC, USA, 1978. [Google Scholar]
- Ogato, G.S.; Bantider, A.; Geneletti, D. Dynamics of Land Use and Land Cover Changes in Huluka Watershed of Oromia Regional State, Ethiopia. Environ. Syst. Res. 2021, 10, 10. [Google Scholar] [CrossRef]
- Deche, A.; Assen, M.; Damene, S.; Budds, J.; Kumsa, A. Dynamics and Drivers of Land Use and Land Cover Change in the Upper Awash Basin, Central Rift Valley of Ethiopia. Env. Manag. 2023, 72, 160–178. [Google Scholar] [CrossRef]
- Abdeta, D.; Begna, R.; Zerfu, H.; Alemayehu, A.; Ayana, A.N.; Tsegaye, N.T. Analyzing the Extent and Drivers of Land Use/Land Cover Change in Southwestern Ethiopia. Discov. Sustain. 2024, 5, 505. [Google Scholar] [CrossRef]
- Sisay, G.; Gesesse, B.; Fürst, C.; Kassie, M.; Kebede, B. Modeling of Land Use/Land Cover Dynamics Using Artificial Neural Network and Cellular Automata Markov Chain Algorithms in Goang Watershed, Ethiopia. Heliyon 2023, 9, e20088. [Google Scholar] [CrossRef]
- Ayele, G.K.; Addisie, M.B.; Langendoen, E.J.; Tegegne, N.H.; Tilahun, S.A.; Moges, M.A.; Nicholson, C.F.; Steenhuis, T.S. Evaluating Erosion Control Practices in an Actively Gullying Watershed in the Highlands of Ethiopia. Earth Surf. Process. Landf. 2018, 43, 2835–2843. [Google Scholar] [CrossRef]
- Firoozi, A.A.; Firoozi, A.A. Water Erosion Processes: Mechanisms, Impact, and Management Strategies. Results Eng. 2024, 24, 103237. [Google Scholar] [CrossRef]
- Lemma, B.; Kleja, D.B.; Nilsson, I.; Olsson, M. Soil Carbon Sequestration under Different Exotic Tree Species in the Southwestern Highlands of Ethiopia. Geoderma 2006, 136, 886–898. [Google Scholar] [CrossRef]
- Regasa, M.S.; Nones, M.; Adeba, D. A Review on Land Use and Land Cover Change in Ethiopian Basins. Land 2021, 10, 585. [Google Scholar] [CrossRef]
- Belachew, K.G.; Minale, W.K. Socioeconomic and Environmental Impacts of Eucalyptus Plantations in Ethiopia: An Evaluation of Benefits, Challenges, and Sustainable Practices. Sci. World J. 2025, 2025, 1780293. [Google Scholar] [CrossRef] [PubMed]
- Yimam, A.; Mekuriaw, A.; Assefa, D.; Bewket, W. Impact of Eucalyptus Plantations on Ecosystem Services in the Upper Blue Nile Basin of Ethiopia. Environ. Sustain. Indic. 2024, 22, 100393. [Google Scholar] [CrossRef]
- Mulatu, K.; Hundera, K.; Senbeta, F. Analysis of Land Use/ Land Cover Changes and Landscape Fragmentation in the Baro-Akobo Basin, Southwestern Ethiopia. Heliyon 2024, 10, e28378. [Google Scholar] [CrossRef] [PubMed]
- Moisa, M.B.; Gemeda, D.O. Analysis of Urban Expansion and Land Use/Land Cover Changes Using Geospatial Techniques: A Case of Addis Ababa City, Ethiopia. Appl. Geomat. 2021, 13, 853–861. [Google Scholar] [CrossRef]
- Arsiso, B.K.; Mengistu Tsidu, G.; Stoffberg, G.H.; Tadesse, T. Influence of Urbanization-Driven Land Use/Cover Change on Climate: The Case of Addis Ababa, Ethiopia. Phys. Chem. Earth Parts A/B/C 2018, 105, 212–223. [Google Scholar] [CrossRef]
- Winkler, K.; Fuchs, R.; Rounsevell, M.; Herold, M. Global Land Use Changes Are Four Times Greater than Previously Estimated. Nat. Commun. 2021, 12, 2501. [Google Scholar] [CrossRef]
- Fikadu, A.; Argaw, M. Impact of Exclosures on Woody Species Diversity in Degraded Lands: The Case of Lemo in Southwestern Ethiopia. Heliyon 2021, 7, e06898. [Google Scholar] [CrossRef]
- Belay, S.A.; Assefa, T.T.; Yimam, A.Y.; Prasad, P.V.V.; Reyes, M.R. The Cradles of Adoption: Perspectives from Conservation Agriculture in Ethiopia. Agronomy 2022, 12, 3019. [Google Scholar] [CrossRef]
- Belay, T.; Mengistu, D.A. Impacts of Land Use/Land Cover and Climate Changes on Soil Erosion in Muga Watershed, Upper Blue Nile Basin (Abay), Ethiopia. Ecol. Process. 2021, 10, 68. [Google Scholar] [CrossRef]
- Tesema, M.; Feyessa, F.F.; Kebede, A.B.; Geresu, B.A. Evaluation of Soil Erosion Rate Using Geospatial Techniques for Enhancing Soil Conservation Efforts. Environ. Syst. Res. 2024, 13, 35. [Google Scholar] [CrossRef]
- Dogiso, D.; Muluneh, A.; Ketema, A. Assessment of Soil Erosion and Sedimentation Dynamics in the Rift Valley Lakes Basin, Ethiopia. Agrosystems Geosci. Environ. 2025, 8, e70062. [Google Scholar] [CrossRef]
- Eshetu, S.B.; Kipkulei, H.K.; Koepke, J.; Kächele, H.; Sieber, S.; Löhr, K. Impact of Forest Landscape Restoration in Combating Soil Erosion in the Lake Abaya Catchment, Southern Ethiopia. Environ. Monit. Assess. 2024, 196, 228. [Google Scholar] [CrossRef]
- Bewket, W.; Teferi, E. Assessment of Soil Erosion Hazard and Prioritization for Treatment at the Watershed Level: Case Study in the Chemoga Watershed, Blue Nile Basin, Ethiopia. Land Degrad. Dev. 2009, 20, 609–622. [Google Scholar] [CrossRef]
- FAO. Ethiopian Highlands Reclamation Study, Ethiopia. In Final Report; Food and Agriculture Organization of the United Nations: Rome, Italy, 1986. [Google Scholar]
- Zeleke, G.; Hurni, H. Implications of Land Use and Land Cover Dynamics for Mountain Resource Degradation in the Northwestern Ethiopian Highlands. Mt. Res. Dev. 2001, 21, 184–191. [Google Scholar] [CrossRef]
- Teku, D.; Derbib, T. Uncovering the Drivers, Impacts, and Urgent Solutions to Soil Erosion in the Ethiopian Highlands: A Global Perspective on Local Challenges. Front. Environ. Sci. 2025, 12, 1521611. [Google Scholar] [CrossRef]
- Abidela Hussein, M.; Muche, H.; Schmitter, P.; Nakawuka, P.; Tilahun, S.A.; Langan, S.; Barron, J.; Steenhuis, T.S. Deep Tillage Improves Degraded Soils in the (Sub) Humid Ethiopian Highlands. Land 2019, 8, 159. [Google Scholar] [CrossRef]
- Assaye, Y.; Desta, G.; Molla, E.; Adimassu, Z. Effects of Land Management Practices on Runoff and Soil and Nutrient Losses in the Rainfed Agroecosystem of the Beles River Basin, Ethiopia. Int. J. Sediment Res. 2025, 40, 651–665. [Google Scholar] [CrossRef]
- Guder, A.C.; Kabeta, W.F. Evaluation of Future Land Use Change Impacts on Soil Erosion for Holota Watershed, Ethiopia. Sci. Rep. 2025, 15, 6782. [Google Scholar] [CrossRef]

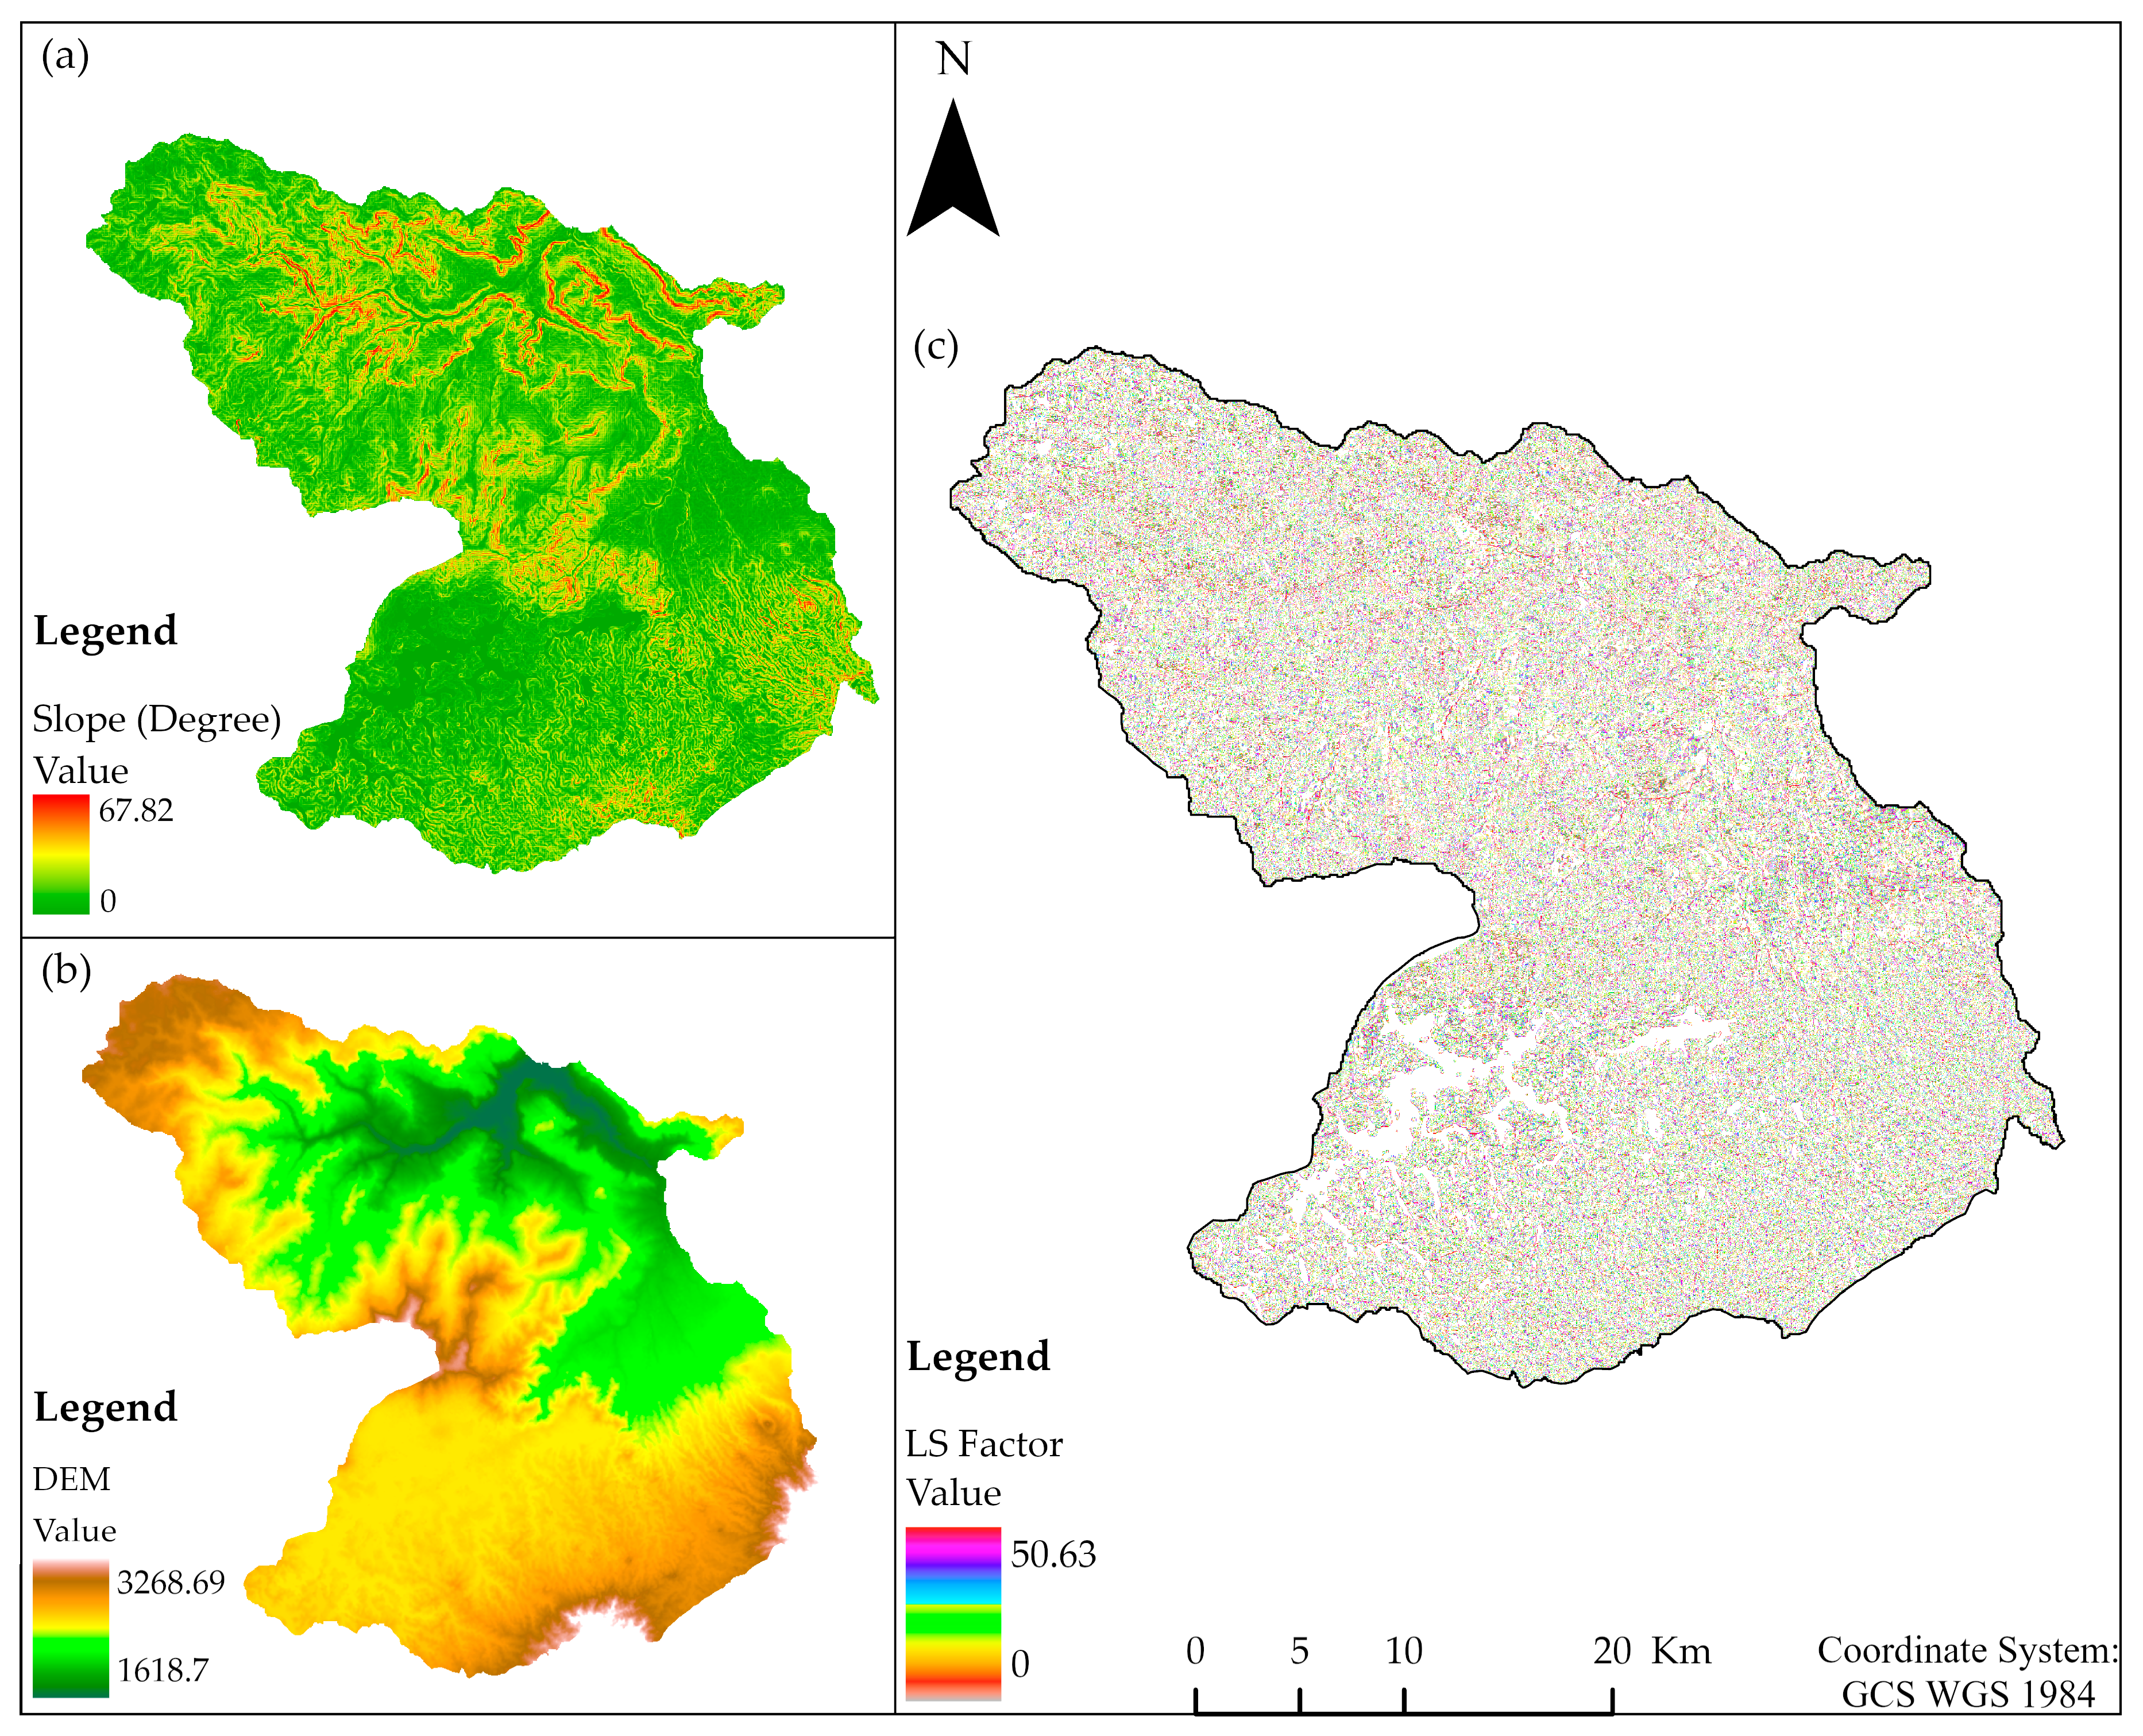
| S/N | Slope Range (Degree) | Area (ha) | Percentage (%) | Class Name |
|---|---|---|---|---|
| 1 | 0–2 | 16,672.72 | 11.37 | Gentle/Flat to almost flat terrain |
| 2 | 2.1–5 | 26,705.6 | 18.25 | Gently undulating to undulating |
| 3 | 5.1–8 | 29,276.3 | 20.01 | Rolling terrain/moderate |
| 4 | 8.1–15 | 30,330.2 | 20.73 | Steep/Hilly terrain |
| 5 | >15 | 43,659.2 | 29.84 | Steeply dissected mount |
| Total | 146,644.02 | 100 | ||
| S/N | Input Data Types | Sources | Details |
|---|---|---|---|
| 1 | Climate data | National Meteorological Agency (NMA) | Rainfall and temperature data (34 years) |
| 2 | Soil map dataset | Master Plan of Abay (2011), MOA | Digital soil maps |
| 3 | Satellite images (Landsat) | USGS Webpage | Path/Row: 169/54, 30 m resolution; Landsat-5 TM (1986, 4 bands), Landsat-7 ETM+ (2002, 7 bands), Landsat-8 OLI-TIRS (2020, 8 bands) |
| 4 | DEM (30 m) | USGS Webpage | 30 m resolution SRTM used for terrain analysis and LS-factor computation. |
| 5 | Ancillary/primary data | Observations, Questionnaires, GPS-based GCPs, Google Earth | 331 Ground Control Points (GCPs) across six land cover types; key informant interviews |
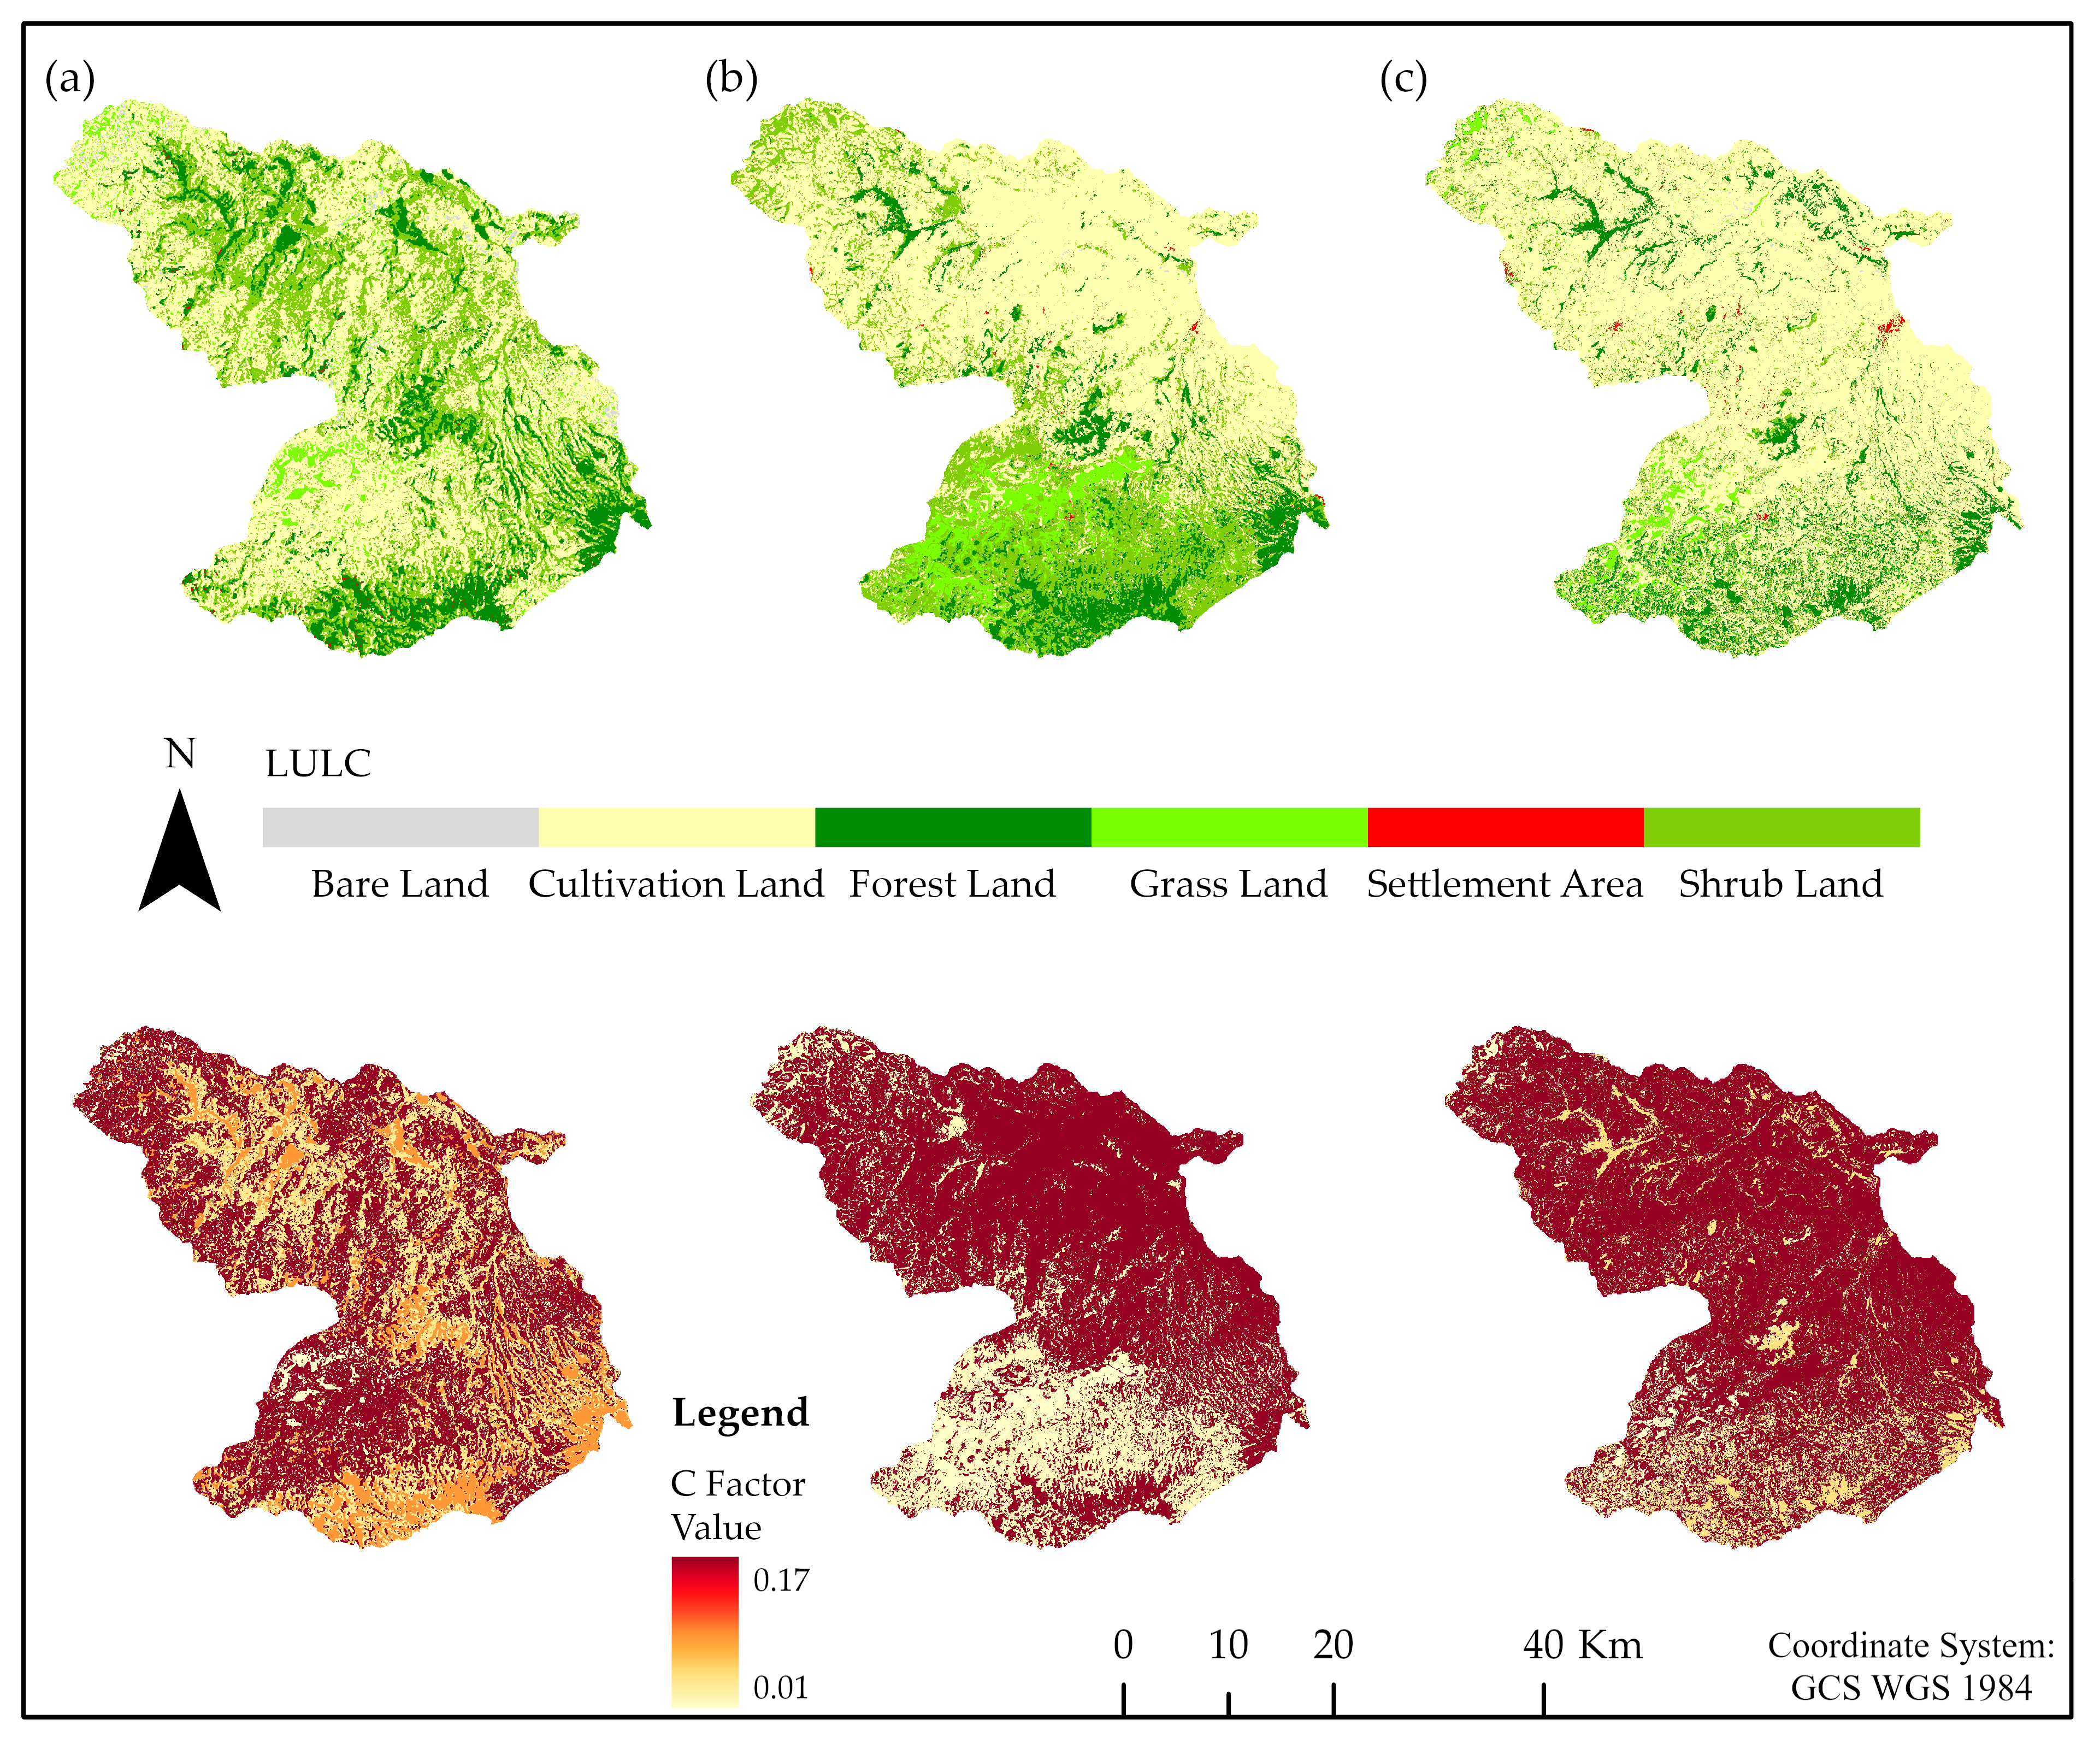
| S/N | Land Use Class | Descriptions |
|---|---|---|
| 1 | Bare Land | Land covered with quarries, degraded land, and roads. |
| 2 | Cultivation Land | This unit includes cropping areas, with characteristic patterns such as sharp edges between fields and houses. |
| 3 | Forest Land | Natural forests, woodlands, eucalyptus plantations, and roadside trees and fences. |
| 4 | Grass Land | Grass and herbs cover with scattered trees and shrubs, used for livestock grazing. |
| 5 | Settlement Area | Areas covered by towns, residential areas, and industries. |
| 6 | Shrub Land | Areas dominated by shrubs, bushes, and young tree species, mixed with herbaceous plants. |
| S/N | LULC Classes | GCP | Reference Data | Classified Data | Number Correct | Producer’s Accuracy | User’s Accuracy | Kappa |
|---|---|---|---|---|---|---|---|---|
| 1 | Bare Land | 15 | 17 | 15 | 12 | 70.59% | 80.00% | 0.7848 |
| 2 | Cultivation Land | 141 | 135 | 141 | 129 | 95.56% | 91.49% | 0.8065 |
| 3 | Forest Land | 35 | 35 | 35 | 32 | 91.43% | 91.43% | 0.8997 |
| 4 | Grass Land | 15 | 18 | 15 | 12 | 66.67% | 80.00% | 0.7839 |
| 5 | Settlement Area | 15 | 13 | 15 | 13 | 100.00% | 86.67% | 0.8591 |
| 6 | Shrub Land | 20 | 23 | 20 | 17 | 73.91% | 85.00% | 0.8342 |
| Total | 241 | 241 | 241 | 215 | Overall Accuracy | 89.21% | 0.839 | |
| S/N | Station | Longitude | Latitude | Elevation (m) | Mean Annual Rainfall (mm) | R-Factor (MJ mm ha−1 h−1 year−1) |
|---|---|---|---|---|---|---|
| 1 | Ambo | 37.839670 | 8.984667 | 2068 | 1044.93 | 579.13 |
| 2 | Guder | 37.757312 | 8.966980 | 2011 | 1347.98 | 749.44 |
| 3 | Tikur Inchini | 37.667700 | 8.836330 | 2467 | 1818.53 | 1013.89 |
| 4 | Toke Erensa | 37.583330 | 8.983330 | 2395 | 1462.63 | 813.87 |
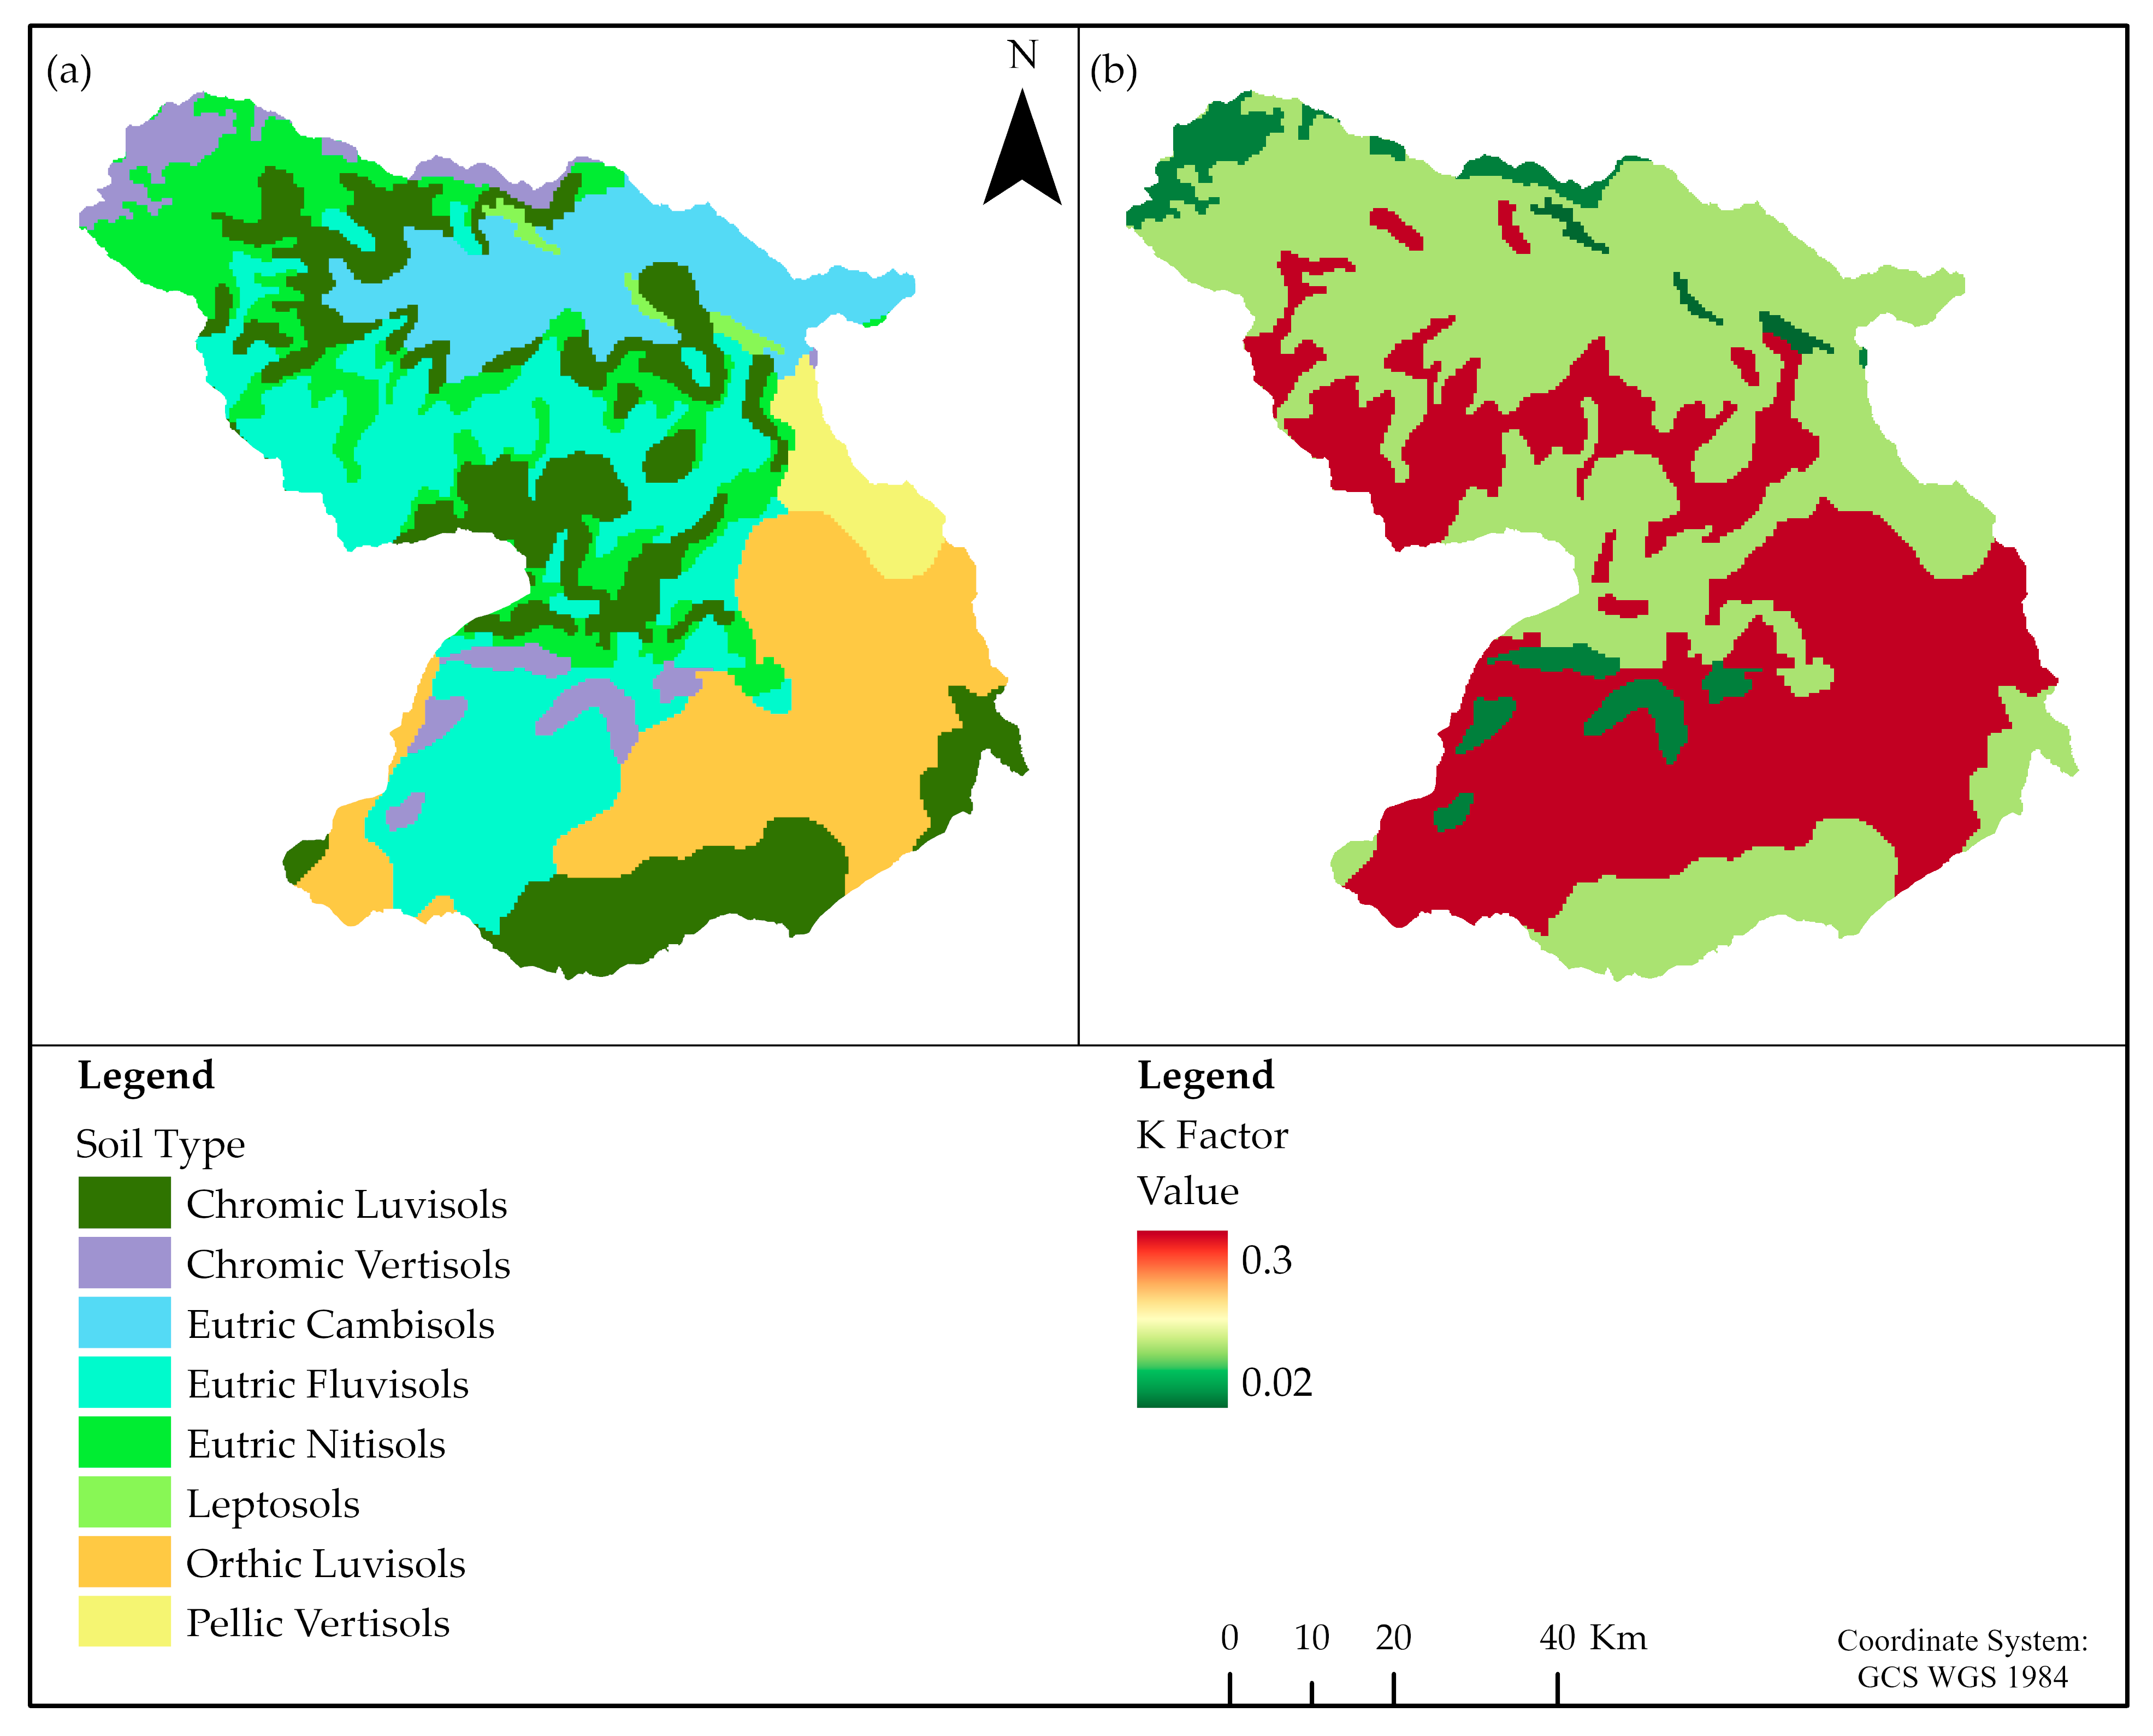
| S/N | Soil Type | Color | Area (ha) | % | K-Factor |
|---|---|---|---|---|---|
| 1 | Chromic Luvisols | Brown | 32,917.60 | 22.50 | 0.20 |
| 2 | Chromic Vertisols | Black | 7118.24 | 4.86 | 0.24 |
| 3 | Eutric Cambisols | Red | 16,272.00 | 11.23 | 0.25 |
| 4 | Eutric Fluvisols | Yellow | 34,873.20 | 23.83 | 0.30 |
| 5 | Eutric Nitisols | Darker | 19,494.60 | 13.32 | 0.20 |
| 6 | Leptosols | Red | 1339.16 | 0.91 | 0.25 |
| 7 | Orthic Luvisols | Brown | 29,786.20 | 20.36 | 0.20 |
| 8 | Pellic Vertisols | Black | 4843.02 | 3.31 | 0.24 |
| Total | 146,644.02 | 100 |
| LULC | Bare Land | Cultivated Land | Forest Land | Grazing Land | Settlement Area | Shrubs Land |
|---|---|---|---|---|---|---|
| C-Factor | 0.05 | 0.17 | 0.02 | 0.01 | 0.03 | 0.014 |
| Slope (%) | 0–7 | 7–11.3 | 11.3–17.6 | 17.6–26.8 | >28.8 | |
| P-Factor | 0.55 | 0.60 | 0.80 | 0.95 | 1.00 | |
| References | [27,28] | [27,29] | [27,29] | [27,28] | [15,30] | [31] |
| S/N | LULC Classes | 1986 | 2002 | 2020 | |||
|---|---|---|---|---|---|---|---|
| ha | % | ha | % | ha | % | ||
| 1 | Bare Land | 1456.47 | 0.99 | 85.23 | 0.06 | 266.94 | 0.18 |
| 2 | Cultivation Land | 76,094.8 | 51.89 | 84,519.4 | 57.64 | 114,964 | 78.4 |
| 3 | Forest Land | 19,944.0 | 13.6 | 16,469.1 | 11.23 | 16,486.6 | 11.24 |
| 4 | Grass Land | 6828.57 | 4.66 | 8067.87 | 5.5 | 4367.79 | 2.98 |
| 5 | Settlement Area | 339.75 | 0.23 | 392.67 | 0.27 | 871.38 | 0.59 |
| 6 | Shrub Land | 41,980.3 | 28.63 | 37,109.7 | 25.31 | 9686.61 | 6.61 |
| Total | 146,644.02 | 100 | 146,644.02 | 100 | 146,644.02 | 100 | |
| LULC Classes | 1986 (ha) | 2002 (ha) | 2020 (ha) | % Change | Rate of Change (ha/yr) | ||||
|---|---|---|---|---|---|---|---|---|---|
| 1986–2002 | 2002–2020 | 1986–2020 | 1986–2002 | 2002–2020 | 1986–2020 | ||||
| Bare Land | 1456.47 | 85.23 | 266.94 | −5.81 | +0.66 | −2.38 | −85.70 | +10.095 | −34.98 |
| Cultivation Land | 76,094.86 | 84,519.4 | 114,964.7 | +77.93 | +115 | +35.9 | +526.53 | +1691.40 | +1143.23 |
| Forest Land | 19,944.07 | 16,469.15 | 16,486.6 | −14.81 | +0.01 | −6.94 | −217.18 | +0.97 | −101.69 |
| Grass Land | 6828.57 | 8067.87 | 4367.79 | +5.20 | −14 | −4.94 | +77.45 | −205.50 | −72.37 |
| Settlement Area | 339.75 | 392.67 | 871.38 | +0.187 | +1.83 | +0.97 | +3.307 | +26.59 | +15.64 |
| Shrub Land | 41,980.3 | 37,109.7 | 9686.61 | −20.75 | −103.88 | −64.74 | −304.41 | −1523.50 | −949.81 |
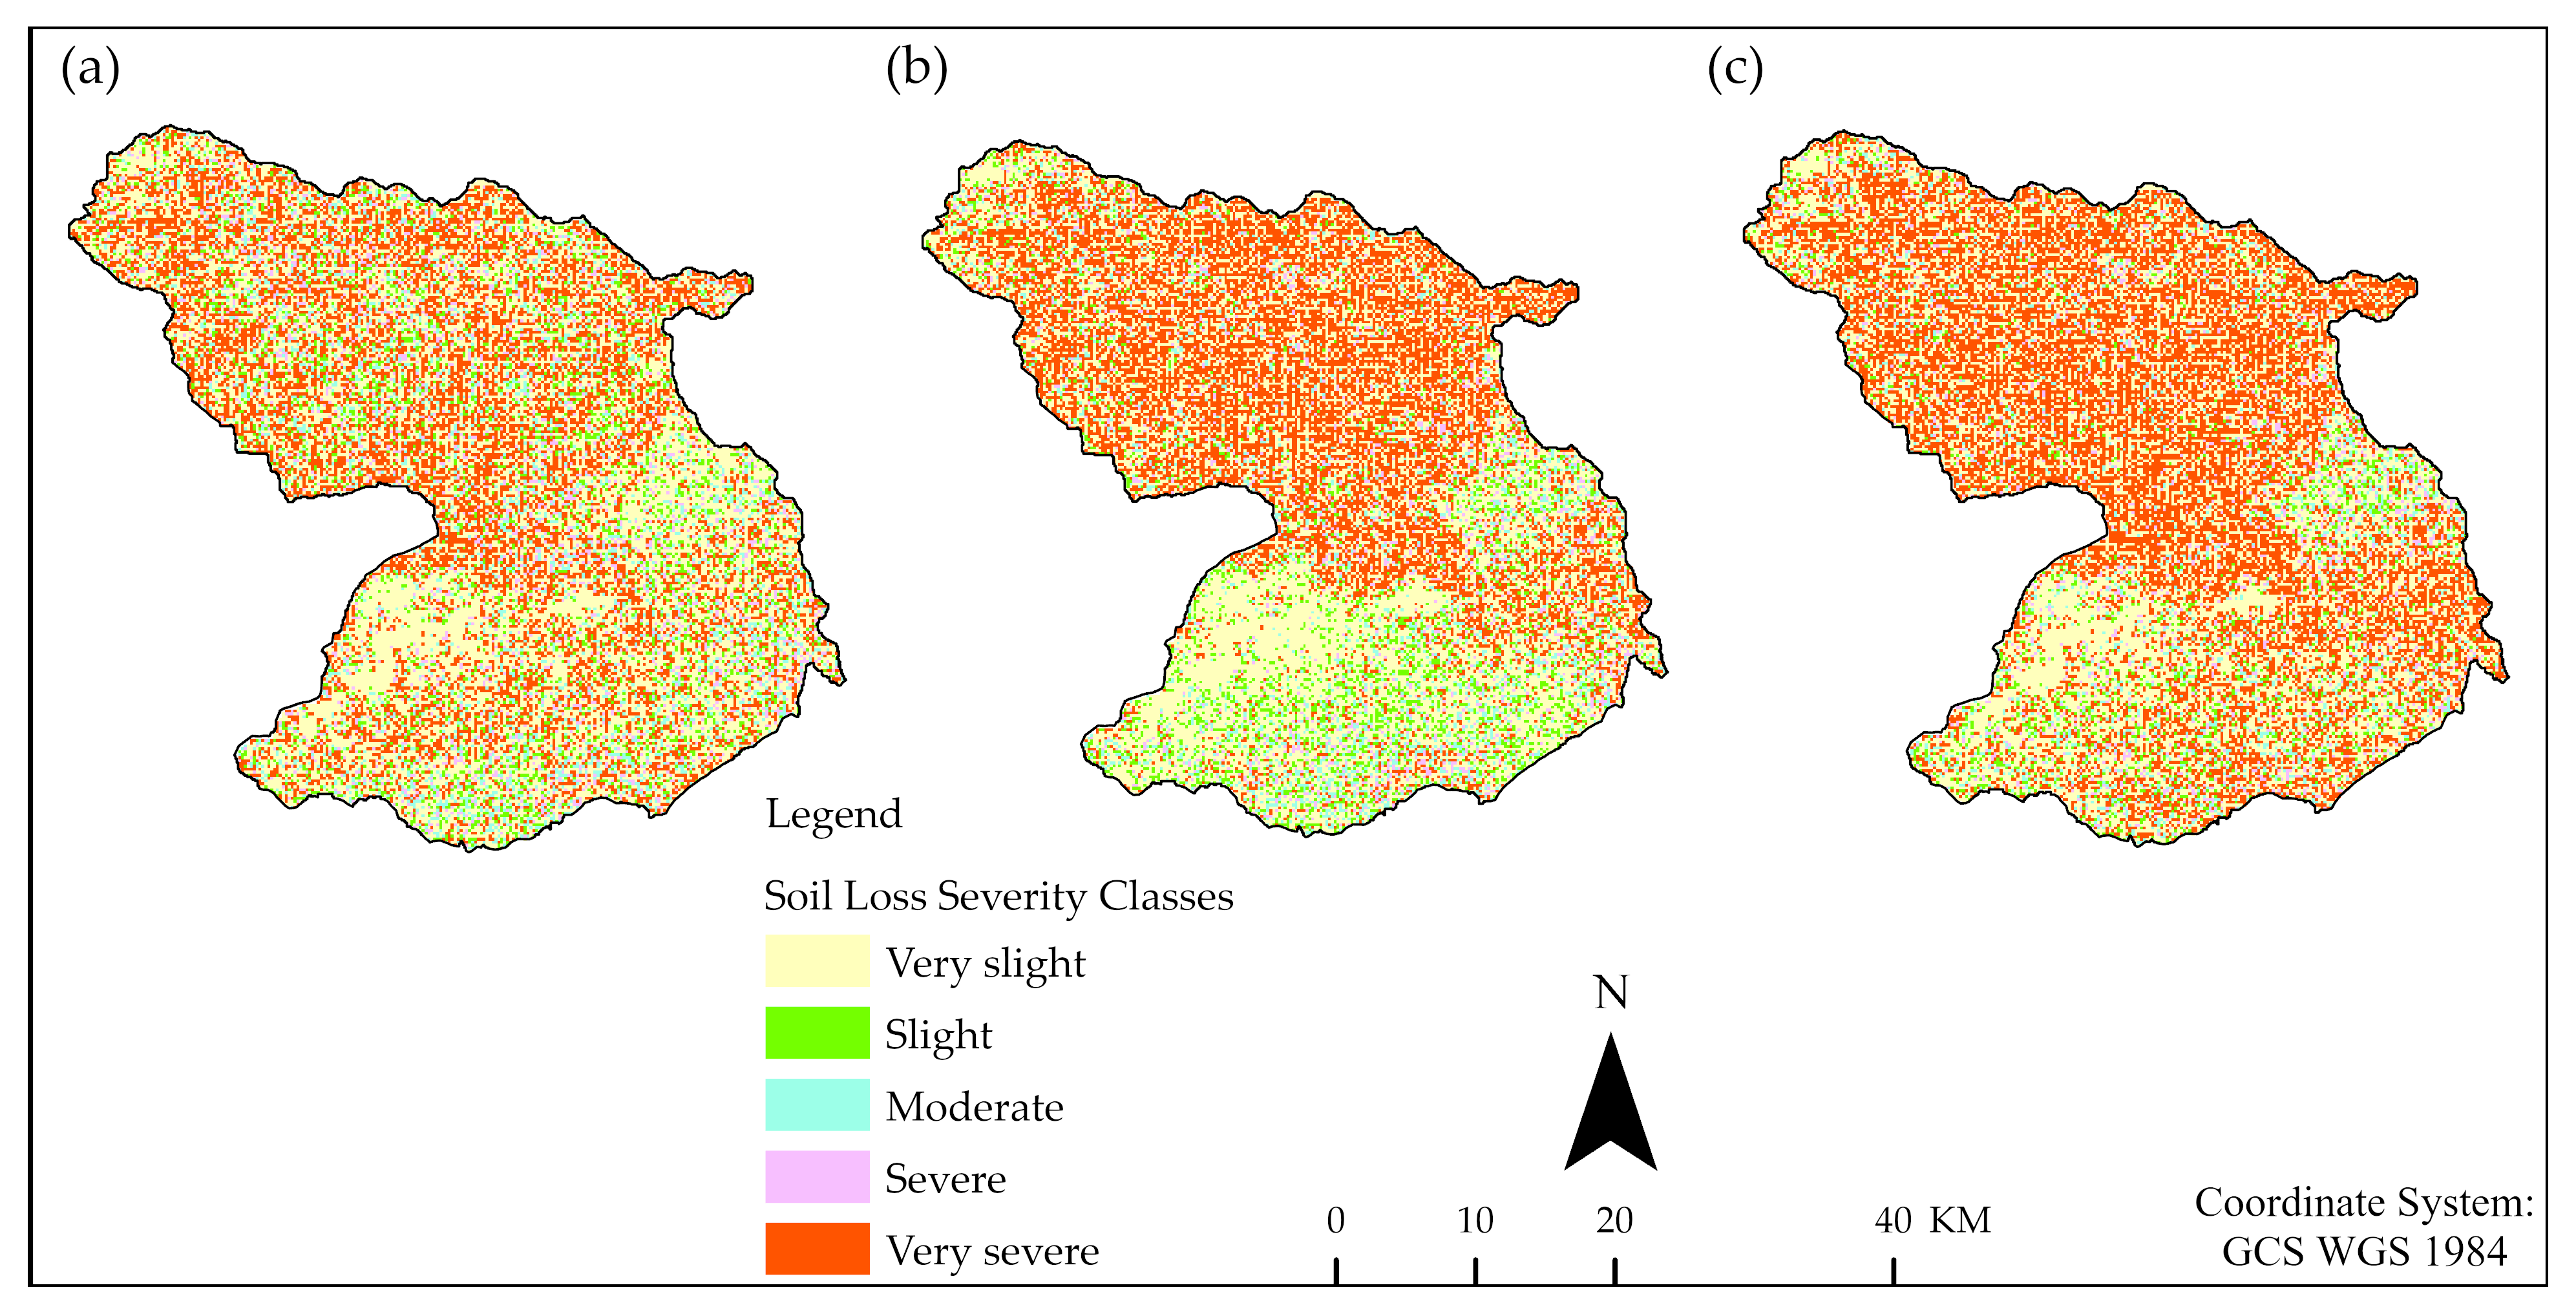
| S/N | Study Period | Mean Soil Loss (t/ha/yr) | Total Soil Loss (t/yr) |
|---|---|---|---|
| 1 | 1986 | 107.63 | 3.899 × 10⁶ |
| 2 | 2002 | 144.16 | 5.225 × 10⁶ |
| 3 | 2020 | 172.85 | 6.264 × 10⁶ |
| LULC Classes | 1986 (Mean t/ha/yr) | 2002 (Mean t/ha/yr) | 2020 (Mean t/ha/yr) | ||||||
|---|---|---|---|---|---|---|---|---|---|
| Min | Max | Mean | Min | Max | Mean | Min | Max | Mean | |
| Cultivation Land | 0.0 | 12,433.7 | 130.3 | 0.0 | 34,426.9 | 212.2 | 0.0 | 6273.9 | 199.5 |
| Forest Land | 0.0 | 12,433 | 78.7 | 0.0 | 6006.9 | 69.2 | 0.0 | 9847.1 | 34.4 |
| Shrub Land | 0.0 | 12,433.7 | 82.3 | 0.0 | 4350.6 | 80.9 | 0.0 | 13,132.5 | 120.1 |
| Grass Land | 0.0 | 9400.5 | 79.7 | 0.0 | 34,426.9 | 95.5 | 0.0 | 12,433.7 | 170.5 |
| Settlement Area | 0.0 | 4047.53 | 83.9 | 0.0 | 4350.61 | 90.7 | 0.0 | 12,433.7 | 170.5 |
| Bare Land | 0.0 | 5235.3 | 103.2 | 0.0 | 34,426.9 | 196.9 | 0.0 | 34,426.9 | 183.3 |
| S/N | Severity Classes | Severity Classes | 1986 (Mean t/ha/yr) | 2002 (Mean t/ha/yr) | 2020 (Mean t/ha/yr) |
|---|---|---|---|---|---|
| 1 | Very slight | 0–5 | 0.32 | 0.35 | 0.19 |
| 2 | Slight | 5–15 | 9.66 | 9.57 | 9.69 |
| 3 | Moderate | 15–30 | 21.85 | 21.64 | 22.09 |
| 4 | Severe | 30–50 | 34.31 | 38.21 | 39.64 |
| 5 | Very severe | > 50 | 323.3 | 399.3 | 393.4 |
Disclaimer/Publisher’s Note: The statements, opinions and data contained in all publications are solely those of the individual author(s) and contributor(s) and not of MDPI and/or the editor(s). MDPI and/or the editor(s) disclaim responsibility for any injury to people or property resulting from any ideas, methods, instructions or products referred to in the content. |
© 2025 by the authors. Licensee MDPI, Basel, Switzerland. This article is an open access article distributed under the terms and conditions of the Creative Commons Attribution (CC BY) license (https://creativecommons.org/licenses/by/4.0/).
Share and Cite
Biru, M.K.; Gadisa, C.W.; Dirbaba, N.B.; Nunes, M.R. Land Use Changes and Their Impacts on Soil Erosion in a Fragile Ecosystem of the Ethiopian Highlands. Land 2025, 14, 1473. https://doi.org/10.3390/land14071473
Biru MK, Gadisa CW, Dirbaba NB, Nunes MR. Land Use Changes and Their Impacts on Soil Erosion in a Fragile Ecosystem of the Ethiopian Highlands. Land. 2025; 14(7):1473. https://doi.org/10.3390/land14071473
Chicago/Turabian StyleBiru, Moges Kidane, Chala Wakuma Gadisa, Niguse Bekele Dirbaba, and Marcio R. Nunes. 2025. "Land Use Changes and Their Impacts on Soil Erosion in a Fragile Ecosystem of the Ethiopian Highlands" Land 14, no. 7: 1473. https://doi.org/10.3390/land14071473
APA StyleBiru, M. K., Gadisa, C. W., Dirbaba, N. B., & Nunes, M. R. (2025). Land Use Changes and Their Impacts on Soil Erosion in a Fragile Ecosystem of the Ethiopian Highlands. Land, 14(7), 1473. https://doi.org/10.3390/land14071473