Abstract
Understanding how people perceive urban streetscapes is essential for enhancing the visual quality of the urban environment and optimizing street space design. While perceptions are shaped by the interplay of multiple visual elements, existing studies often isolate single semantic features, overlooking their combinations. This study proposes a Landscape Element Combination Extraction Method (SLECEM), which integrates the UniSal saliency detection model and semantic segmentation to identify landscape combinations that play a dominant role in human perceptions of streetscapes. Using street view images (SVIs) from the central area of Futian District, Shenzhen, China, we further construct a multi-dimensional feature–perception coupling analysis framework. The key findings are as follows: 1. Both low-level visual features (e.g., color, contrast, fractal dimension) and high-level semantic features (e.g., tree, sky, and building proportions) significantly influence streetscape perceptions, with strong nonlinear effects from the latter. 2. K-Means clustering of salient landscape element combinations reveals six distinct streetscape types and perception patterns. 3. Combinations of landscape features better reflect holistic human perception than single variables. 4. Tailored urban design strategies are proposed for different streetscape perception goals (e.g., beauty, safety, and liveliness). Overall, this study deepens the understanding of streetscape perception mechanisms and proposes a highly operational quantitative framework, offering systematic theoretical guidance and methodological tools to enhance the responsiveness and sustainability of urban streetscapes.
1. Introduction
With the accelerating pace of global urbanization, enhancing the quality of the urban environment is not only essential for improving city competitiveness but also directly impacts residents’ daily experiences and overall well-being [1,2]. As the direct medium through which people experience urban space, streetscapes play a central role in shaping environmental quality [3]. Among various factors, visual perception serves as a primary channel through which people understand and evaluate streetscape environments [4]. Visual features presented in streetscapes, such as colors and natural elements, significantly influence people’s subjective feelings toward the environment [5,6], which in turn affect behavioral patterns such as cycling intention [7], walking activity [8], and running frequency [9].
Street view images (SVIs) have become an increasingly important tool in streetscape perception studies, as they authentically record the built environment from a human-eye perspective [10]. In recent years, research based on SVIs has deepened. For instance, Zhou et al. employed SVIs and GPS data to investigate how perceived park safety and beauty influence dwell time [11]; Ogawa et al. explored the relationships between 22 subjective perceptions and landscape features derived from SVIs [12]. These studies demonstrate that analyzing the fine-grained associations between streetscape features and subjective perceptions at the image level offers a valuable foundation for visual optimization and streetscape design.
However, existing studies often analyze streetscape features in isolation, focusing on single-variable effects [13,14]. In reality, people’s overall perception of a street environment is typically shaped by the synergistic interplay of multiple visual elements [15], and the same landscape element can evoke entirely different perceptual responses across various spatial contexts [16]. This suggests the existence of significant interactions and structural relationships among streetscape elements. For instance, higher pedestrian counts may co-occur with wider sidewalks, more infrastructure, and better accessibility, suggesting potential reverse causality in co-occurrence patterns [17]. Therefore, identifying and analyzing combinatorial patterns of visual elements is crucial for understanding streetscape perceptions.
Moreover, current studies lack a systematic framework to evaluate the contributions of multi-dimensional visual features to perception outcomes. Existing literature primarily focuses on high-level semantic analysis [14,18], using semantic segmentation to classify SVIs into components such as buildings, sky, vegetation, and vehicles, then assessing the perceptual influence of each [13,19]. However, low-level visual features—such as color diversity, grayscale contrast, and fractal dimension—also play a critical role in shaping human perception of streetscapes [20,21].
In addition, the acquisition of subjective perception data still faces challenges, such as sensitivity to landscape heterogeneity, making it difficult to support large-scale, fine-grained streetscape perception research. Traditional methods like interviews, surveys, and controlled experiments [22,23] are reliable but often limited by high costs and low efficiency [24]. Recently, convolutional neural networks (CNNs) trained on labeled data have shown strong capabilities in automatic perception prediction [19,25]. However, the predictive accuracy of such models heavily relies on the quality of the annotated training data [14,26]. The most widely used training dataset is PlacePulse 2.0 [27], which features high diversity and cross-cultural adaptability, making it a benchmark for streetscape perception modeling. Still, existing studies have pointed out that its perception labels and image samples lack full compatibility with Chinese urban contexts, necessitating localization or data augmentation to improve its effectiveness [26].
Lastly, the nonlinear relationships between image features and complex perceptions remain difficult to capture. Most studies still rely on Pearson correlation [28] or multiple linear regression analysis [28,29], which, while interpretable, are more suited to linear associations and insufficient for modeling potential nonlinear responses or interactive effects among features in perceptual processes [30,31].
To address these challenges, this study focuses on the central area of Futian District, Shenzhen, and proposes a multi-dimensional feature–perception coupling analysis framework based on SVI data. The framework incorporates high-level semantic features, low-level visual features, and landscape element combinations, aiming to systematically uncover the mechanisms linking image features to residents’ streetscape perceptions. The research explores data localization, model interpretability, and combines methods such as saliency detection, semantic segmentation, deep learning–based perception prediction, and interpretable machine learning in a multimodal and interdisciplinary approach.
The specific contributions of this study are as follows:
- A breakthrough in landscape element combination extraction: We propose a novel method—Salient Landscape Element Combination Extraction Method (SLECEM)—which integrates UniSal saliency detection and semantic segmentation to extract visually dominant landscape combinations, advancing perceptual modeling from isolated features to structural interactions.
- Localized perception modeling mechanism: By integrating the global PlacePulse 2.0 dataset with a locally annotated expert dataset, we train a two-stage deep neural network, achieving over 75% accuracy, enhancing adaptability to Chinese urban contexts.
- Advancement in interpretability analysis: Through the proposed multi-dimensional feature–perception coupling framework, we incorporate interpretable machine learning techniques (XGBoost + SHAP) to uncover both linear and nonlinear effects of visual features and apply K-Means clustering to reveal distinct perception patterns across streetscape types.
- Perception-oriented spatial strategy output: This study proposes targeted streetscape layout optimization strategies based on different perceptual goals (such as beauty, safety, and liveliness). These differentiated strategies offer practical and quantifiable guidance for urban design.
Through the multi-dimensional feature–perception coupling framework, this study makes several theoretical and practical advancements: First, it introduces a combinatorial perspective into streetscape feature modeling, addressing the traditional neglect of co-occurrence and structural influence. Second, it establishes a localized prediction pipeline by integrating cross-cultural data with local semantic contexts, tailored to Chinese urban characteristics. Third, it applies interpretable machine learning to address the “black-box” issue in deep models, enhancing both transparency and practical value. Lastly, it translates high-scoring perceptual feature combinations into quantifiable and actionable strategies for urban streetscape optimization, bridging the gap between perceptual research and real-world urban design.
2. Data and Methodology
2.1. Research Framework
To systematically reveal how visual elements in SVIs influence public streetscape perceptions, this study constructs a multi-dimensional feature–perception coupling analysis framework (Figure 1), which integrates key modules including data acquisition, perception modeling, feature extraction, and interpretability analysis. The first component is SVIs collection. We collected SVIs using the Baidu Street View API, providing the foundational dataset for subsequent perception evaluation and objective feature computation.
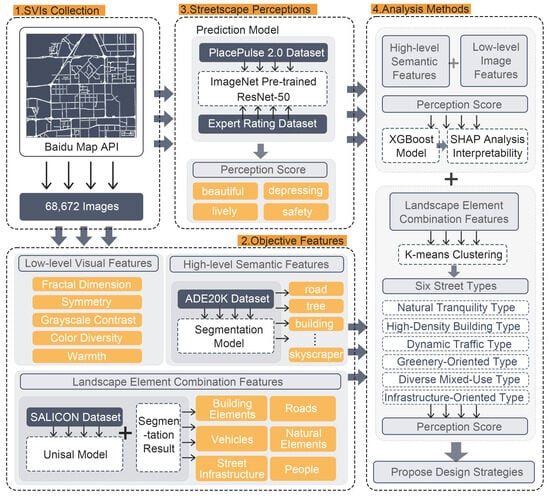
Figure 1.
Research Framework Diagram.
The second component involves the extraction of objective features from SVIs to support interpretability analysis of perception predictions. We include three categories of multi-level objective visual features: 1. Low-level visual features: Five core visual attributes—fractal dimension, symmetry, grayscale contrast, color diversity, and color warmth—are used to quantify the visual complexity of image structure and color, based on principles from visual psychology and computer vision. 2. High-level semantic features: Semantic information of 150 object categories is extracted using a semantic segmentation model trained on the ADE20K dataset, capturing the spatial distribution and composition of objects within each image. 3. Landscape element combination features: These features reflect the compositional patterns of six key landscape element categories in the street view—buildings, natural elements, roads, street facilities, pedestrians, and vehicles—capturing their spatial distribution and proportional relationships.
The third component is quantitative modeling of streetscape perceptions. Based on the publicly available PlacePulse 2.0 dataset, this study introduces a transfer learning approach that incorporates locally sampled SVIs from Shenzhen along with expert scoring results. Four perception dimensions—beauty, depression, liveliness, and safety—are modeled. Specifically, a ResNet50 convolutional neural network pretrained on ImageNet is first trained on PlacePulse 2.0 and then fine-tuned using the local dataset to improve model adaptability and generalization for regional perception preferences.
The fourth component is the analysis of the relationships between visual features and perception outcomes. We apply XGBoost combined with SHAP interpretability analysis to evaluate the influence of each visual feature on perception predictions, with both semantic and low-level features used as model inputs. In addition, K-Means clustering is employed to categorize salient landscape element combinations, revealing six typical compositional patterns. Based on these analytical results, we propose targeted urban design strategies for optimizing streetscape layouts, with all computational and data analysis procedures implemented in Python 3.10.
2.2. SVIs Collection and Perceptual Dimension Selection
2.2.1. SVIs Collection
This study selected the central district of Futian in Shenzhen, China, as the research area (Figure 2), bounded by Beihuan Avenue to the north, Xiangmihu Road to the east, Binhe Avenue to the south, and Hongling Middle Road to the west. This area represents a dense urban core characterized by intense population mobility and diverse urban functions, providing a representative sample for urban streetscape optimization and functional enhancement research.

Figure 2.
Map of the Study Area. The map shows sample points of the research object obtained from the Baidu API, along with sampling examples from various angles.
In determining the study area, point of interest (POI) data from the Baidu Map Open Platform were used to identify regions with high concentrations of human activities, including commercial, residential, dining, healthcare, educational, transportation, and governmental facilities. This approach ensures that the selected area exhibits functional diversity and spatial vitality. The land-use types within the study area encompass high-density residential zones, commercial and service areas, administrative offices, educational and research facilities, road infrastructure, and urban green spaces, providing a rich geographic context for analyzing urban spatial structure and perceptual characteristics.
To acquire fine-grained ground-level visual data for urban analysis, this study conducted large-scale SVI collection based on the Baidu Maps API. The complete road network within the study area was extracted from OpenStreetMap (OSM), and sampling points were automatically generated at 40 m intervals using ArcGIS 10.2, ensuring systematic and uniform spatial coverage. At each sampling point, SVIs were captured in four orientations (facing 0°, 90°, 180°, and 270°) to obtain a comprehensive panoramic representation of the street environment. To ensure temporal consistency and seasonal comparability across the dataset, only images taken during the summer months from 2020 to 2022 were selected for analysis. A total of 17,168 sampling points were established, resulting in 68,672 initial images. To ensure image quality, 3555 images that did not meet the required standards were manually excluded, leaving 65,117 images for experimental analysis. The specific exclusion criteria were as follows: 1. Severe occlusion: more than 40% of the image area was blocked by vehicles; 2. Overexposure: the overall brightness was excessively high, making street or building details unrecognizable; 3. Unstable capture: the image exhibited significant blurring, tilt, or visual distortion, affecting the interpretation of the main viewpoint.
2.2.2. Perceptual Dimension Selection
PlacePulse 2.0 remains the most widely used and extensive open-source dataset in perceptual environment research. It includes six perception dimensions: lively, depressing, boring, wealthy, safe, and beautiful. Based on established theoretical frameworks [32], this study focuses on four core dimensions: beautiful, depressing, lively, and safety.
Beauty and safety reflect fundamental environmental needs, directly influencing residents’ satisfaction and willingness to live in a city [33]. Depressing dimension reflects negative emotional responses to the urban environment and is closely linked to mental health [34]. Lively dimension relates to the social interaction dimension and reflects how built environments shape social behavior patterns [35,36]. The dimensions of boring and wealthy were excluded from this study due to their indirect or ambiguous influence on perceptual experiences compared to the selected four.
2.3. Data Collection and Processing Methods
2.3.1. Objective Features
- Individual Feature: Low-Level Visual Features (LLVFs);
In addition to the influence of semantically segmented high-level features on landscape perceptions, previous studies have demonstrated that LLVFs in streetscapes also play a crucial role in shaping perceptual experience. This study selected five representative LLVFs: fractal dimension, symmetry, grayscale contrast, color diversity, and warmth (warm–cool tendency). The selection rationale is as follows:
For instance, fractal characteristics have been widely associated with positive visual experiences [37,38], as fractal structures in built environments have been shown to evoke restorative effects and aesthetic appeal similar to those found in natural landscapes [39]. Symmetry, as a key component of aesthetic perception, contributes to a sense of spatial order [40] and enhances the overall attractiveness of the environment [41]. In terms of color, grayscale contrast, which captures the difference in brightness within an image, can strengthen visual impact and salience, thereby affecting spatial perception [42]. Furthermore, studies have found that richer color palettes in streetscapes significantly increase visual attention, prolonging gaze duration and triggering physiological arousal such as elevated heart rate [6]. Meanwhile, the warm–cool bias of color tones is closely related to emotional states: warm tones tend to be associated with higher arousal and pleasure, though excessive use may lead to stress and anxiety [43]; by contrast, cool tones are often linked with calmness, rationality, and restorative experiences [44,45].
The corresponding features were computed using standard image analysis techniques. Specifically, the fractal dimension was estimated through the box-counting method [46]. Symmetry was assessed by computing the Bhattacharyya distance between the grayscale histograms of the left and right halves of the image [20]; higher similarity indicated greater symmetry (Formula (1)). Let denote the image width, and the division point.
Grayscale contrast was quantified as the standard deviation of pixel intensity values, providing a measure of brightness variation [20]. Color diversity was assessed by considering both the variety and spatial complexity of color distributions [47]. In contrast, the warmth was assessed by comparing the dominance of the red, green, and blue color channels. The results of these computations are illustrated in the corresponding Figure 3.
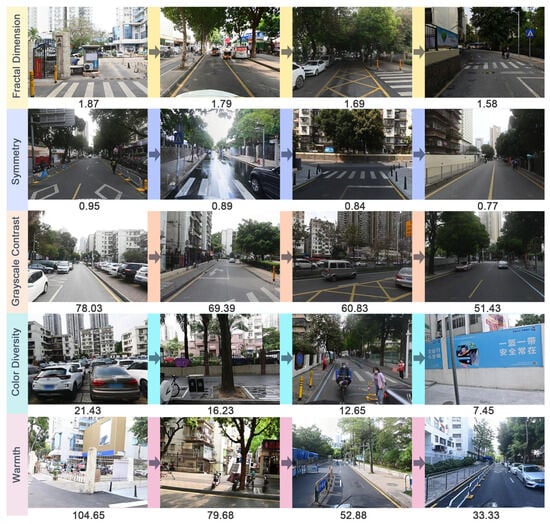
Figure 3.
Visualization of individual factors of LLVFs. The calculated results arranged from left to right in descending order.
- 2.
- Individual Feature: High-Level Semantic Features (HLSFs);
This study employs a deep learning–based semantic segmentation technique to quantify the spatial distribution proportions of various elements within SVIs. The segmentation model architecture is based on the network proposed by Zhou et al. [48,49], which uses ResNet50-dilated as the encoder and PPM_deepsup as the decoder. The model is trained on the ADE20K dataset, which includes 150 semantic categories and demonstrates strong scene parsing capabilities, making it well-suited for semantic recognition tasks in complex urban streetscapes.
The model achieves a Mean Intersection over Union (Mean IoU) of 42.14% and a Pixel Accuracy of 80.13% on the ADE20K validation set, balancing high segmentation accuracy with an acceptable inference speed of 2.6 frames per second (FPS). Therefore, this architecture is adopted in the present study for the automatic segmentation and quantitative identification of semantic elements in street scenes, such as buildings, natural features, and roadways.
- 3.
- Landscape Element Combination Features;
Landscape element combination features reflect the distribution patterns of various visual elements in SVIs. However, studies have shown that human visual attention is not evenly distributed [50], but instead highly concentrated in specific “salient regions” of an image. Therefore, directly extracting combination features from the entire image may introduce a large amount of irrelevant or low-impact information, such as the sky or large blank walls, which contribute minimally to streetscape perceptions and may even distort the analysis results.
To address this, we propose a Salient Landscape Element Combination Extraction Method (SLECEM), which leverages the UniSal model, trained on the SALICON dataset, to predict gaze areas [51] and identify key visual regions influencing perception. These fixation regions are then integrated with semantic segmentation results to classify salient landscape elements into six major categories, thereby constructing a landscape combination feature for each image.
Compared with traditional fixation prediction methods based on low-level visual cues (e.g., edges, brightness, and color), the UniSal model leverages the powerful feature extraction capabilities of convolutional neural networks (CNNs) to more accurately predict regions of human visual attention in complex urban environments [51]. The model was trained on the SALICON dataset, which contains a large number of natural and urban street images annotated through crowdsourced human gaze behavior, effectively simulating the spatial distribution of human visual attention [52]. During training, UniSal uses Stochastic Gradient Descent (SGD) as the optimizer and applies an exponential decay strategy (γ = 0.8) to dynamically adjust the learning rate. In addition, gradient clipping (threshold = 2.0) and weight decay regularization (1 × 10⁻⁵ for CNN layers, 1 × 10⁻⁴ for others) are employed to improve training stability and model generalization.
As shown in Figure 4, the original image undergoes both fixation point prediction and semantic segmentation. The saliency map predicted by UniSal is highlighted in white. After applying a threshold of 50 to binarize the saliency map, it is overlaid with the semantic segmentation result. A pixel-wise matching process is then performed between the salient regions and the segmented image to identify the specific landscape element types present within the salient areas.
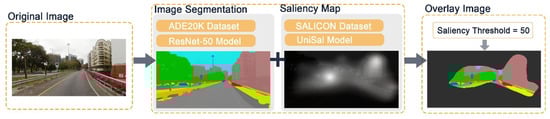
Figure 4.
Schematic of the SLECEM. The chart integrates semantic segmentation visualization with gaze area prediction.
To ensure the stability and representativeness of the analysis, we retained only the top 30 elements with the largest pixel area within the salient regions across all images. These elements were then grouped into six functional categories (Table 1).

Table 1.
Landscape Element Classification Table.
Notably, the “road” element was classified as a standalone category rather than being combined with “sidewalk”, which was instead grouped into the “street infrastructure” category along with guardrails and signboards. This distinction was based on pre-experimental findings, which showed that road and sidewalk had opposite influences on subjective perception, warranting their separation in the final classification.
2.3.2. Subjective Streetscape Perceptions
The PlacePulse 2.0 dataset is based on pairwise comparisons of images. Traditionally, researchers have used the TrueSkill algorithm to infer absolute perception scores for individual images, followed by training regression or classification models [53]. However, pairwise comparison is particularly effective for learning perceptual differences in image style [27]. Building upon this, we introduced an expert-labeled dataset containing absolute perception ratings (1–10 scale), allowing for direct perception score learning and significantly improving the model’s stability and accuracy in predicting perceptions of Chinese urban scenes.
From the study area, 2000 images were randomly selected and rated by 15 professionals and students in landscape architecture and urban planning. Evaluators assessed each image based on four perception dimensions—beautiful, depressing, lively, and safety—using a 1 to 10 scale (1 = lowest, 10 = highest). For each dimension, the highest and lowest scores were discarded to minimize outlier effects, and the remaining scores were rounded and averaged.
The entire machine learning model training process is divided into two stages (Figure 5): the first stage leverages a crowdsourced dataset for pairwise comparison training to learn relative perceptual differences between images; the second stage fine-tunes the model using an expert-scored dataset to optimize its ability to predict absolute perception scores, as illustrated in the figure.
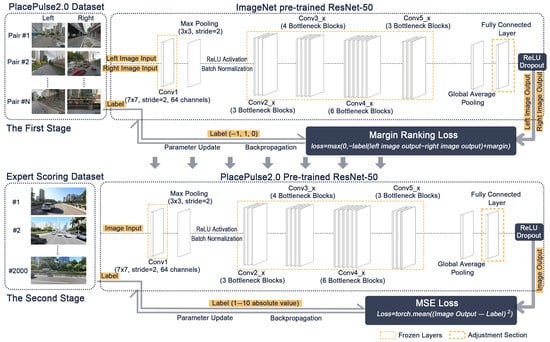
Figure 5.
Flowchart of the perception model training process. The upper part represents Stage 1, and the lower part represents Stage 2.
In the first stage, the model takes as input image pairs (Left–Right) from the PlacePulse 2.0 dataset, with each pair labeled by humans with relative perception preference annotations (e.g., left image preferred or right image preferred). The backbone of the model uses ResNet50 pretrained on ImageNet as the feature extractor [27]. To avoid overfitting and enhance generalization, the weights of the convolutional layers are frozen during training [54]. The extracted feature vectors are passed through fully connected layers, where ReLU activation functions are applied to introduce nonlinearity [55], thereby enhancing the model’s capability to represent complex visual features. Dropout is employed to randomly deactivate neurons, reducing overfitting and improving model robustness [56].
Additionally, the model uses a ranking loss function to optimize the learning process by comparing predicted rankings with ground-truth annotations, allowing the model to accurately distinguish perceptual differences between image pairs. Specifically, Margin Ranking Loss is used as the objective function in this stage, measuring the model’s ability to reflect human-consistent directional score differences between images. The training is conducted with a batch size of 32, a maximum of 10 epochs, and an initial learning rate of 0.001, using the Adam optimizer for parameter updates. Through extensive pairwise training, the model gradually learns to capture comparative visual differences and perceptual tendencies.
Upon completion of the first stage, the model is fine-tuned using the expert-rated dataset, where each image is assigned a perception score ranging from 1 to 10. In this stage, the model loads the parameters learned from stage one and continues to freeze the backbone, while only fine-tuning the fully connected layers. As shown in Figure 5, the objective function in this stage is Mean Squared Error (MSE) Loss, which aims to optimize the model’s ability to fit absolute perception scores. The batch size is set to 4, with a maximum of 20 training epochs and a learning rate of 0.001, to ensure training stability and consistency.
The batch size settings are adjusted according to the task nature and data volume. In the first stage, which involves a ranking task with a large number of image pairs, a larger batch size of 32 helps improve training efficiency and ranking stability. In contrast, the second stage involves regression on a smaller dataset with finer labels, so a smaller batch size of 4 is used to reduce gradient fluctuations, improve fitting precision, and minimize overfitting. This configuration has shown better loss convergence and predictive performance during actual training.
This two-stage training approach leverages both relative and absolute scoring advantages: first learning general perceptual patterns, then refining with precise expert judgment. The resulting models achieved high predictive accuracy, ranging from 75% to 82% across perception dimensions (Table 2). Despite overall robustness, variation in model performance across dimensions was observed, likely due to dataset imbalance and the inherent subjectivity of human perception.
Table 2.
The accuracy of each perception model.
2.4. Analysis Methods
This study establishes a multi-dimensional feature–perception coupling analysis framework to explore the relationships between various visual features of streetscapes—including high-level semantic features, low-level visual features, and landscape element combination features—and human perceptions (beauty, depressing, liveliness, and safety). By integrating XGBoost modeling, SHAP interpretability analysis, and K-means clustering, we examine both causal modeling and pattern recognition to gain deeper insights into the interpretability and influence mechanisms of human streetscape perception.
In terms of causal modeling, we reconstruct the perception prediction model using XGBoost, a widely used machine learning algorithm, to quantitatively assess the specific impact of various landscape features on perception scores. In earlier experiments, we trained a perceptual scoring model using ResNet-50. Although this deep learning model achieved high predictive accuracy, it functions as a typical black-box, offering limited interpretability. By contrast, XGBoost, which adopts an ensemble of decision trees [19], provides strong interpretability, as each decision node is based on clearly defined features. When integrated with SHAP analysis, XGBoost not only quantifies the marginal contribution of each environmental feature to the prediction outcome but also captures the complex, nonlinear interactions among features [57,58], enabling a more comprehensive understanding of how specific street view characteristics shape human perception.
From a pattern recognition perspective, this study goes beyond the limitations of analyzing isolated landscape elements. By applying K-means clustering [59], we identify recurring compositional patterns of salient landscape elements within SVIs. This allows for a nonlinear classification of street types and, in conjunction with perceptual scores, facilitates the evaluation of how different landscape compositions influence subjective environmental assessments.
By bridging micro-scale element combinations with macro-scale spatial configurations, this research offers an innovative technical pathway for the quantitative evaluation and design optimization of urban landscapes.
3. Experiments and Results
3.1. Data Distribution
3.1.1. Distribution of Objective Features
All objective feature values were normalized using MinMaxScaler from the Scikit-learn library (version 1.2.2) in Python 3.10, scaling them to a range between 0 and 1. Figure 6 presents the distribution of these features. LLVFs include fractal dimension, symmetry, grayscale contrast, color diversity, and warmth. Regarding HLSFs, we extracted 150 types of landscape elements from the semantic segmentation results. The figure shows the 10 categories with the highest average pixel proportions.
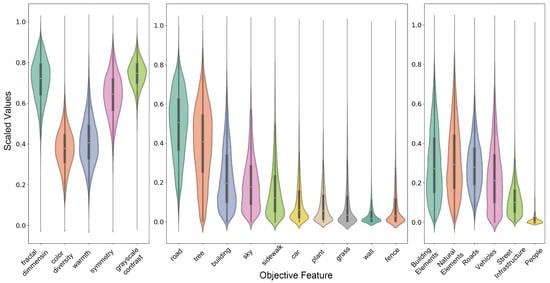
Figure 6.
Violin plots. The plots illustrate the data distribution for each perception dimension.
Additionally, the study extracted landscape combination features, which refer to the proportion and spatial arrangement of six key components in each SVI: building elements, natural elements, roads, street infrastructure, people, and vehicles.
3.1.2. Spatial Distribution of Subjective Streetscape Perceptions
Using the ResNet-50 deep learning model developed in this study, perceptual scores were predicted across four dimensions—beautiful, depressing, lively, and safety—and the average score for each sampling point was calculated. The spatial distribution patterns for each perception dimension are illustrated in Figure 7.
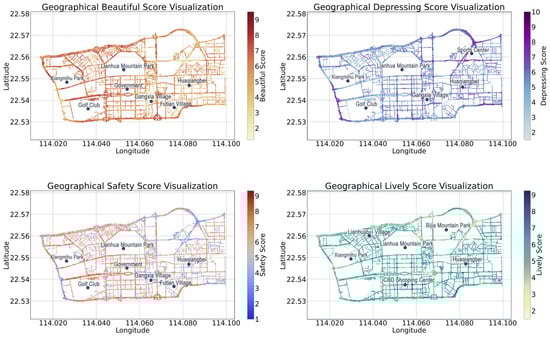
Figure 7.
Geographical distribution map of each perception dimension. The colors correspond to different scores.
The beautiful and safety dimensions exhibit similar spatial distribution patterns. High-scoring areas are mainly concentrated along major roads, commercial centers, and surrounding parks in the Futian District, such as Lianhua Mountain Park, Xiangmi Park, and their nearby areas, including the Shenzhen Municipal Government and the core area of the Futian CBD. These locations typically feature abundant greenery and pedestrian-friendly environments. In contrast, low-scoring areas are mostly found in high-density residential zones and urban villages, such as Gangxia Village and Futian Village. Although Huaqiangbei is one of Shenzhen’s most iconic commercial districts, certain streets may score lower in terms of beauty and safety due to issues such as overcrowding, aging buildings, and visually cluttered signage.
The depressing dimension tends to show an opposite pattern compared to the beautiful and safety dimensions. Areas with high depressive scores are often located in dense urban environments with compact road networks, high building density, and enclosed spatial configurations, for instance, urban villages near the Sports Center, Gangxia Village, and parts of Huaqiangbei. Conversely, areas with low depressive scores are typically associated with urban green spaces and open environments, such as Lianhua Mountain Park, Xiangmi Park, and the nearby golf course.
In terms of lively dimension, high-scoring areas are generally concentrated in commercial and residential neighborhoods with dense human activity, including Lianhua North Village, the commercial center of Futian CBD, and the Huaqiangbei shopping district. Areas with lower liveliness scores are often dominated by natural landscapes such as parks and lakes, or located in quieter residential areas, for example, around Bijia Mountain Park and Xiangmi Lake Park.
3.2. SHAP-Based Interpretation of the Black Box in Perception Modeling
3.2.1. XGBoost Model Construction
In the construction of the XGBoost machine learning model, the input features include LLVFs and HLSFs. To balance information richness and computational efficiency, the model selects the top 30 semantic categories by pixel proportion per image (e.g., trees, buildings, roads). The output labels are the perception scores predicted by the ResNet50 model, ranging from 1 to 10.
To ensure strong nonlinear representation while effectively mitigating overfitting, we adopt a “deep tree + low learning rate” strategy. Additionally, early stopping and cross-validation are employed to fine-tune hyperparameters iteratively. The final settings include a learning rate of 0.02 and a maximum tree depth of 10. The model is trained using squared error as the objective function, with 5000 boosting rounds. To further control model complexity, the minimum child weight (minimum sum of instance weight needed in a child) is set to 6. All experiments are conducted with a fixed random seed to ensure the reproducibility of results.
Model performance was evaluated using Mean Absolute Error (MAE) and the coefficient of determination (R2). The results show that XGBoost achieved strong predictive performance across all perception dimensions (Table 3). The high R2 values especially highlight the model’s ability to generalize well, indicating that the selected features offer a comprehensive representation of the underlying perceptual mechanisms. This confirms the role of both LLVFs and HLSFs in shaping streetscape perception, while also demonstrating the robustness of the ResNet-50-based perceptual prediction model.
Table 3.
The fitting performance of the XGBoost model.
However, prediction performance was relatively lower for the safety (R2 = 0.49) and depressing (R2 = 0.44) dimensions, which may be attributed to the ResNet-50 model’s limited accuracy in these aspects. Compared to beautiful and lively, safety, and depressing perceptions may be more heavily influenced by subjective or contextual factors that are difficult to capture solely through image features. Future research may consider incorporating additional variables such as socioeconomic context, behavioral patterns, or cultural factors to enhance the predictive modeling of these perceptual dimensions.
3.2.2. Feature Contribution Analysis
To investigate how objective SVI features influence streetscape perceptions—namely, beautiful, depressing, lively, and safety—we used SHAP (Shapley Additive exPlanations) to interpret XGBoost models [60].
The SHAP summary plot (Figure 8) ranks the top 15 most influential features, while the dependence plots (Figure 9) illustrate how selected semantic features affect perception scores.
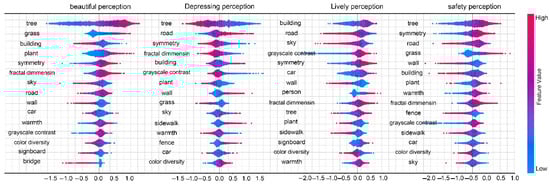
Figure 8.
SHAP contribution plots. The plots illustrate the importance and distribution of each semantic feature in relation to the model output. The x-axis represents the SHAP value (feature contribution), and the color indicates the magnitude of the corresponding feature value.
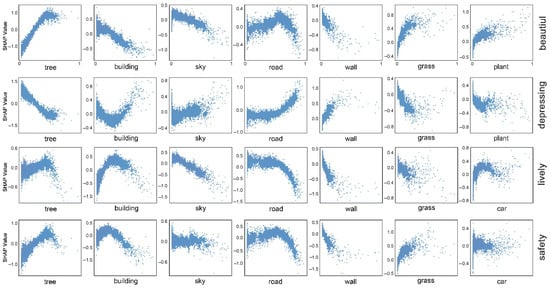
Figure 9.
SHAP dependence plots. The plots visualize the relationship between a single semantic feature and the model prediction.
(1) In terms of LLVFs, as shown in the summary plot, fractal dimension, symmetry, grayscale contrast, and color warmth contribute positively to perception, while color diversity has the opposite effect.
Previous literature suggests that structures with moderate complexity are often more appealing to people [61] and can offer restorative benefits [39]. Fractal dimension, as a measure of structural complexity, helps avoid monotony while providing sufficient visual stimulation.
Symmetry consistently exerted a positive effect across perception dimensions. This is closely related to Kaplan’s notion of “coherence”, which reflects the human tendency to prefer orderly and logically structured visual environments [62]. High symmetry is often perceived as a symbol of order and beauty [63,64], reaffirming the importance of orderliness in city design.
As for grayscale contrast, its positive effect likely stems from enhanced visual clarity and sharper object boundary recognition, which improve visual focus and environmental legibility.
Additionally, this study found that warmer-toned streetscapes tend to receive more favorable evaluations, especially in terms of perceived safety. This differs from studies suggesting cool colors evoke tranquility and aesthetic appeal [43]. The discrepancy may be attributed to the moderate and natural appearance of warm tones in the image dataset, where warmth is often associated with good lighting rather than oversaturation or visual discomfort.
In contrast to the above features, color diversity was found to harm perception. This may be due to the fact that colorful streetscapes in the study area are often located in urban villages or informal districts, where visual diversity comes with excessive signage, illegal advertising boards, and cluttered elements.
(2) The influence of HLSFs on subjective perception is more complex. Natural elements, such as trees, grass, and vegetation, have a significantly positive impact on perceptions. These findings align with the Biophilia Hypothesis [65] and theories of restoration [66]. Greenery not only enhances visual comfort and harmony but also fosters psychological relaxation and positive emotions [67]. Therefore, green elements should be prioritized as core components in urban street design.
Surprisingly, sky coverage shows a negative correlation with beauty and liveliness, but a slight positive correlation with the sense of depression. A detailed analysis will be provided in Section 4.2.1.
Artificial structures such as buildings, roads, and walls showed more complex effects on perception. As shown in Figure 9, the presence of buildings exhibited an inverted U-shaped relationship with vibrancy and safety, yet exerted a negative impact on perceived beauty, findings that are in alignment with those of Alkhresheh [68]. Excessively tall or dense buildings can heighten feelings of oppression [69]; thus, a moderate building proportion appears optimal.
The role of roads in contributing to beauty and liveliness follows an inverted U-shape (Figure 9). Moderate road coverage was found to improve perceptions of beauty and safety. Street design should embrace human-centered principles to balance aesthetics, vibrancy, and safety.
Walls and fences generally had a negative perceptual impact. These elements can obstruct views, limit sunlight, and create a sense of enclosure or confinement [70]. Designers should reduce the use of tall, opaque barriers in favor of transparent fencing, green walls, or public art installations, which can enhance both safety and visual openness.
Finally, human and vehicular flow enhanced vibrancy, contributing to a lively urban atmosphere, consistent with Jin et al.’s conclusions [26]. Proper traffic management and walkability improvements are, therefore, essential to creating streetscapes that are both dynamic and livable.
3.3. SLECEM-Based Exploration of Landscape Element Combination
3.3.1. K-Means Clustering of Landscape Element Combination
K-means is a distance-based unsupervised clustering algorithm that identifies patterns of similarity and divides data into distinct groups [71]. Based on the SLECEM, this study obtained the salient landscape element combination features for each image within the study area. These features encompass six categories: building elements, natural elements, roads, street infrastructure, people, and vehicles.
Subsequently, we conducted unsupervised clustering analysis on the proportions of these six salient landscape elements across all street view images. During the clustering process, Euclidean distance was used as the similarity metric, and the k-means++ initialization strategy was adopted to improve the representativeness of the initial centroids and reduce the risk of falling into local optima.
The optimal number of clusters was determined using the Elbow Method. As shown in Figure 10, when the number of clusters reaches six, the sum of squared errors (SSE) curve exhibits a noticeable inflection point, indicating that the landscape element combinations can be effectively categorized into six distinct types.
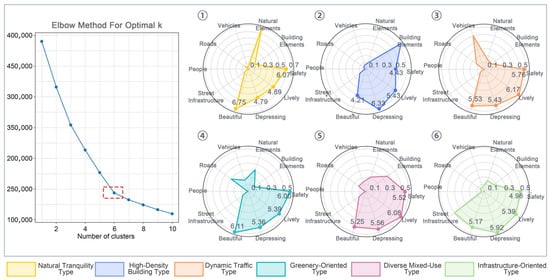
Figure 10.
K-means visualization. The left panel shows the elbow plot used to determine the optimal number of clusters, while the right panel presents radar charts of feature distributions for each cluster after clustering. Each color represents a different cluster.
To facilitate visualization, perceptual scores were scaled by a factor of 0.1, so that both perceptual and compositional features fall within the same 0–1 range. The radar plots in Figure 10 display the feature and perception distributions across clusters. Notably, the clusters show substantial differences in the proportions of natural elements, architectural elements, street infrastructure, and vehicles, revealing distinct landscape combination patterns for each group (Figure 11), the six clusters were labeled as follows: Natural Tranquility Type, High-Density Building Type, Dynamic Traffic Type, Greenery-Oriented Type, Diverse Mixed-Use Type, and Infrastructure-Oriented Type.

Figure 11.
Typical SVIs for each cluster.
The “Natural Tranquility Type” is characterized by a high proportion of natural elements and minimal presence of other features. It exhibits relatively high scores in beauty (6.75) and safety (6.07), and the lowest score in depression (4.79), indicating a peaceful and pleasant environment often found in city parks, suburban green spaces, and residential areas adjacent to parks.
The “High-Density Building Type” shows the highest proportion of built elements, particularly buildings, while natural elements are largely absent, and public street spaces are limited. This type is associated with the highest depressive score (6.33), along with very low beauty and safety ratings, reflecting a strong sense of enclosure and insecurity typically found in old commercial districts or high-density urban villages.
The “Dynamic Traffic Type” is dominated by vehicular and road elements and records the highest liveliness score (6.17). Other perceptual dimensions, including beauty, safety, and depression, are more balanced, without any extremes. This type is commonly observed on major roads, commercial streets, and urban transportation hubs.
The “Greenery-Oriented Type” displays a balanced composition of natural and road elements, with moderate levels of street infrastructure and pedestrian presence. It ranks high in beauty (6.11) and safety (6.00), while showing lower levels of depression and moderate liveliness, reflecting a friendly and livable urban environment commonly found along streets near parks, well-greened residential areas, or pedestrian pathways.
The “Diverse Mixed-Use Type” exhibits a high proportion of built elements along with considerable shares of natural features, vehicles, and infrastructure. It scores the highest in liveliness (6.08), while maintaining balanced scores in other perceptual dimensions, suggesting spatial versatility and multifunctionality. This cluster is often found around commercial complexes, modern mixed-use neighborhoods, and urban areas with abundant shared public spaces.
The “Infrastructure-Oriented Type” is defined by a dominant presence of street infrastructure and relatively low proportions of other landscape elements. It presents a relatively high depressive score (5.92) and the lowest safety rating (4.98), suggesting that infrastructure-intensive environments may negatively affect perceived safety and comfort. Such landscapes are often located near metro stations or construction zones.
3.3.2. Weighting Perception Dimensions for Different Urban Scenarios
In different everyday contexts, people’s perceptual needs may vary. Therefore, it is necessary to allocate reasonable weights to the perceptual dimensions based on different orientation demands. Drawing from interdisciplinary knowledge in environmental psychology, urban design, and visual perception, our research team conducted multiple rounds of discussions and Delphi-style consensus refinement [72]. The final weighting scheme not only reflects theoretical foundations such as Maslow’s hierarchy of needs [34] but also reflects the context-specific priorities associated with different urban environments (Table 4).
Table 4.
Allocation of Perceptual Weights.
For beauty-oriented streetscapes, visual aesthetic experience is the priority, especially in tourist areas and landmark parks, where enhancing visual recognition is crucial [73]. Therefore, beauty is assigned the highest weight (40%). Safety (25%) is considered a fundamental psychological requirement to ensure the comfort and reliability of the environment, in line with Maslow’s hierarchy of needs [34]. Liveliness (20%) helps to enrich the space and avoid monotony, while depressing (15%) is used as a negative regulating factor to prevent the deterioration of aesthetic experience caused by an unfavorable spatial atmosphere.
In safety-oriented streetscapes, such as those near residential areas, hospitals, and schools, environmental reliability and a sense of psychological protection become crucial [74,75]. Therefore, safety perception is given the highest weight (40%). Beauty (25%) provides additional aesthetic value and supports the livability of the city. A moderate emphasis on liveliness (20%) ensures that safety does not come at the expense of liveliness, avoiding overly enclosed or lifeless environments. The use of depressing (15%) in reverse regulation helps to prevent an oppressive spatial atmosphere that might counteract the sense of safety.
Lively-oriented streetscapes aim to create vibrant and attractive public spaces, particularly in commercial centers, cultural districts, and entertainment areas. Therefore, liveliness is assigned the highest weight (40%), while safety (30%) ensures that high-energy environments still provide a baseline of psychological comfort. Beauty (20%) enhances the attractiveness and visual identity of these active spaces. A smaller weight for depressing (10%) is introduced in reverse regulation to mitigate excessive stimulation, preventing visual fatigue or discomfort.
3.3.3. Perception-Oriented Streetscape Configuration Strategies
This study explores streetscape design strategies oriented toward three perceptual goals—beauty, safety, and liveliness—based on the results of clustering and SHAP interpretability analysis. Proposing adaptable landscape combination schemes tailored to each perceptual goal. Using the differentiated weighting schemes developed earlier, the study calculated the perceptual scores for each SVI in terms of the three orientations. The relationship between clustered streetscape types and perception-oriented scores is visualized through scatter matrix plots (Figure 12) and radar charts (Figure 13).
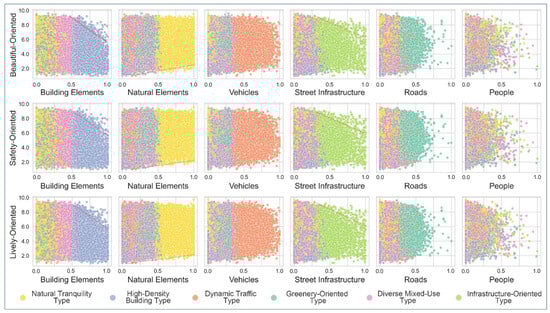
Figure 12.
Scatterplot matrix. The x-axis represents the pixel proportion of various landscape features, and the y-axis shows the perception scores under different orientation demands. The color of each point corresponds to the clustered street view type.
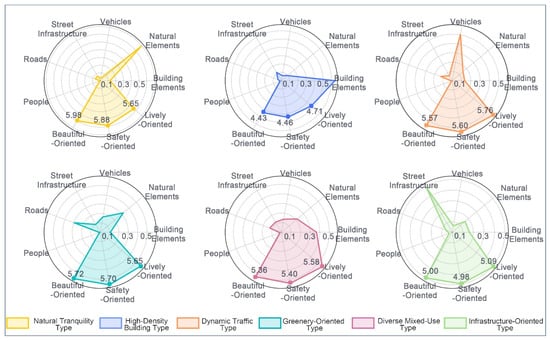
Figure 13.
Perception-oriented radar charts. The charts illustrate the perception scores of different street view types under various orientation demands.
As indicated by the trends in the scatter plots, natural elements consistently exert a positive influence across all three perceptual goals. Conversely, excessive proportions of building elements and street infrastructure are associated with lower perceptual ratings. While the impact of vehicles, roads, and people does not follow a clear linear trend in the scatter plots, the SHAP (Section 3.2.2) analysis reveals that these features influence perception through complex, nonlinear interactions with other features.
For the beauty-oriented streetscape, the radar charts show that the “Natural Tranquility Type” achieves the highest score (5.98), followed by the “Greenery-Oriented Type” (5.72). Both types are characterized by a high proportion of natural elements, low proportions of built elements, and a relatively balanced presence of other components. According to the SHAP analysis in Section 3.2.2, a moderate proportion of road elements also contributes significantly to beauty perception. Accordingly, an optimal configuration for enhancing beauty perception would involve “High Nature + Low Building + Moderate Road”. We recommend maintaining a high percentage of natural elements [76] to ensure visual appeal while avoiding excessive occupation of urban functional space. Natural elements can also partially screen buildings, reducing their visual dominance. The proportion of built elements should be kept low to ensure visual depth and spatial openness, and road coverage should be maintained within 20–30% to enhance visual order and ensure mobility. This layout strategy supports both the aesthetic and functional dimensions of street environments.
For the safety-oriented streetscape, radar charts again show the “Natural Tranquility Type” with the highest score (5.88), followed closely by the “Greenery-Oriented Type” (5.70), indicating a strong overlap with beauty-oriented environments. High proportions of natural elements and low proportions of buildings are positively associated with perceived safety. However, SHAP analysis in Section 3.2.2 reveals an inverted-U relationship between building proportion and safety perception, suggesting that extremely high building density may lead to a sense of enclosure and discomfort, whereas overly low density may lack spatial definition and structural clarity. Additionally, a moderate presence of street infrastructure is essential for providing safety cues and navigational support [77]. Therefore, we recommend a configuration of “High Nature + Moderate Building + Low Infrastructure”. Natural elements should remain prominent to offer a green visual field and enhance comfort and openness. Buildings should occupy a moderate share, sufficient to define space without creating excessive enclosure. Street infrastructure should be moderately reduced to minimize environmental clutter, though basic safety facilities must be retained to ensure a secure and comfortable street environment.
Under the lively-oriented configuration, the “Dynamic Traffic Type” achieved the highest score (5.76), primarily characterized by a high presence of vehicles. This suggests that streets perceived as lively often include dynamic elements such as pedestrian and vehicular flows, which contribute to a rich urban atmosphere. SHAP analysis further reveals that a moderate proportion of buildings also significantly enhances liveliness, while the role of natural elements is more complex—excessive greenery may actually suppress the perception of liveliness. As such, an optimal layout strategy would include “High Flow + Moderate Building + Moderate Nature”. Built elements contribute both spatial structure and functionality, attracting human activity and stimulating street vitality. Natural elements, while secondary, still play a vital role in maintaining visual comfort and environmental balance, ensuring that dynamic, vibrant streetscapes are also pleasant and not overly hardened or oppressive.
4. Discussion
4.1. Characteristics of Streetscape Perceptual Distribution
A novel perceptual evaluation model was developed in this study, employing a two-stage training strategy. According to model predictions, the spatial distribution of beauty and safety scores largely overlaps, with high-scoring areas located along major urban roads, in central business districts (CBDs), and around city parks. This may be attributed to a psychological tendency for people to associate visually pleasing environments with a greater sense of safety [78]. In contrast, areas with high depressive scores are concentrated in urban villages and older commercial zones, which typically feature dense buildings, narrow streets, and poor lighting, conditions that intensify spatial oppression and elicit negative emotional responses.
Furthermore, prior research has shown that highly accessible areas are more likely to foster a sense of liveliness [79], a finding echoed in the present study. In the study area, high liveliness scores were concentrated in commercial-residential mixed-use zones with heavy pedestrian flows. Notably, perceived liveliness appears to depend more on the frequency and intensity of space usage—such as traffic volumes and commercial activity—than on the physical condition of the space, including the age of buildings or the modernization level of infrastructure. This suggests that liveliness is a dynamic and experiential dimension of perception, rather than a purely static physical attribute.
4.2. Multi-Dimensional Feature-Based Interpretability Analysis of Perceptions
4.2.1. Analysis of LLVFs and HLSFs
During the modeling stage of the feature–perception relationship, the use of XGBoost improved the interpretability of the relationship between features and perceptions and helped to partially uncover the “black box” nature of the ResNet50 deep learning model. This lays a foundation for developing future perceptual assessment models that are more transparent, generalizable, and explainable. In addition, the model’s high predictive performance indirectly validates the comprehensiveness of the selected image features, indicating they can effectively capture the key factors influencing human perception.
Previous studies have mostly employed LLVFs such as fractal dimension, symmetry, grayscale contrast, color diversity, and warmth to investigate the relationship between visual complexity and perceived visual quality [61,80]. However, few have thoroughly explored how these features relate to subjective human perception. This study integrates such features into the perceptual modeling framework (see Section 3.2.2). As illustrated in Figure 14, fractal dimension, symmetry, grayscale contrast, and warmth all show strong positive associations with the perceptions of beauty, vibrancy, and safety. These findings confirm human preference for environments with order and layered complexity, offering new empirical evidence on how LLVFs shape subjective experiences.
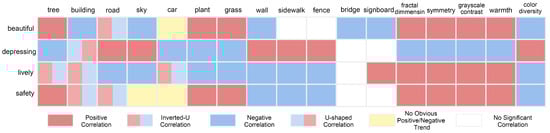
Figure 14.
Visualization of the relationship between features and perceptions.
Green elements generally have a positive impact on perception, while the influence of built structures is more complex. Roads and buildings, in moderation, tend to produce positive effects, whereas walls and fences often have a negative contribution. Flowing elements can enhance the sense of vitality to some extent.
Surprisingly, in this study, the sky exerts a negative influence on perception, which stands in contrast to some existing research findings [81]. As shown in Figure 15, trees, buildings, and grayscale contrast were the most prominent features associated with sky ratio across different perception models. For beauty, a higher sky ratio typically indicates a lower presence of natural elements like trees, which are key contributors to positive perception. For depression, scatter points where the sky had a positive contribution often also had a higher proportion of buildings, an element known to increase oppressive feelings. In vibrancy, a higher sky ratio was linked to increased grayscale contrast, potentially making the sky appear overly sharp or exposed, an effect previously shown to provoke negative responses [82]. Additionally, expansive sky views may reduce spatial layering and focal points, leading to a diminished sense of vibrancy.

Figure 15.
Dependency plots for sky elements in each perception model. The x-axis represents the proportion of sky elements, and the y-axis represents the corresponding contribution score. The color indicates the value of the most relevant feature (red for the highest value and blue for the lowest value).
4.2.2. Analysis of Landscape Element Combination Features
This study introduces the concept of combination landscape elements features and proposes an innovative SLECEM to quantify them. Based on clustering results, six dominant street types were identified within the study. Compared to XGBoost’s analysis of individual features, K-Means clustering breaks the limitation of single-variable models by integrating multiple co-occurring elements within salient visual regions. This approach better reflects the holistic way humans perceive streetscapes. For instance, XGBoost showed that higher road coverage is associated with stronger feelings of oppression. However, in the Greenery-Oriented Type, despite a relatively high road ratio, perceived depression was low, suggesting that greenery may effectively buffer the negative impacts of roads.
These six typologies offer valuable insights for urban design. The Natural Tranquility type achieved the highest scores for beauty and safety but may lack functional urban features due to its high proportion of natural elements. It is more suitable for quiet communities or urban edges rather than dense commercial areas. In contrast, Green Neighborhood and Mixed-Use streets showed well-balanced performance across all perceptual dimensions, suggesting they are the most adaptable and promising models for future street renovation and human-centered design.
While the Dynamic Traffic type scored highly in vibrancy, it performed less favorably in beauty and safety. Incorporating more regulating elements, such as greenery, could help balance its perceptual qualities. On the other hand, the High-Density Building and Infrastructure-Oriented types tended to score poorly across perception metrics, likely due to an overemphasis on functionality at the expense of human experience.
4.3. Layout Strategies for Optimizing Streetscape Visual Quality
This study further explores urban landscape element configuration strategies for three types of perception-oriented streetscapes: beauty-oriented, safety-oriented, and lively-oriented. By integrating clustering analysis and XGBoost model results, targeted optimization schemes are proposed to address different perceptual demands.
For beauty-oriented street design (Figure 16), the study proposes an optimization strategy of “High Nature + Low Building + Moderate Road ”. This type of streetscape is commonly applied in areas with display or leisure-recreation functions, with typical examples including the surroundings of Lianhua Mountain Park, Xiangmi Lake Park, Bijia Mountain Park, and nearby golf courses. As shown in the high-scoring examples, residents tend to perceive higher beauty ratings in streetscapes with abundant greenery and open views, reflecting a strong sense of visual pleasure and environmental harmony.
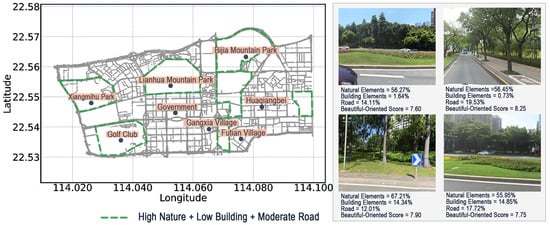
Figure 16.
Beauty-Oriented Streetscapes. The left map shows the geographic distribution of beauty-oriented streets in the central area of Futian District, Shenzhen, China; the right panel presents high-scoring exemplary cases.
For safety-oriented street design (Figure 17), the proposed strategy is “High Nature + Moderate Building + Low Infrastructure”. This is relevant to functional areas requiring a high sense of safety, such as schools and hospitals. In the Futian District of Shenzhen, for instance, many educational and medical facilities are located, and the surrounding streets demand a heightened sense of security. In high-scoring safety-oriented samples, a higher proportion of natural elements is observed, along with moderate building coverage and minimal street infrastructure. The design should emphasize clear visibility and spatial order by creating open sightlines and simple street interfaces to avoid visual obstruction and psychological discomfort caused by excessive facilities or building blockage.
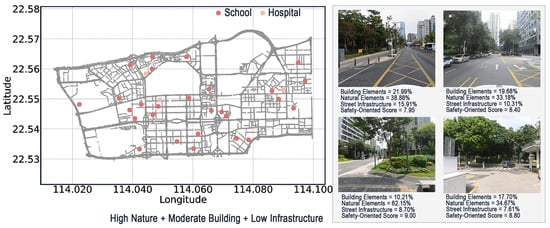
Figure 17.
Safety-Oriented Streetscapes. The left map shows the geographic distribution of safety-oriented streets in the central area of Futian District, Shenzhen, China; the right panel presents high-scoring exemplary cases.
For lively-oriented streetscapes—such as business districts, shopping centers, and metro station entrances—this study recommends a layout strategy of “High Flow + Moderate Building + Moderate Nature” to create a balanced yet dynamic perceptual atmosphere (Figure 18). These areas include the vicinity of Civic Center, Shopping Park, and Huaqiangbei. High-scoring examples show that moderately dense building layouts support diverse urban functions and activate spatial vitality, while the inclusion of a suitable amount of greenery ensures ecological comfort.
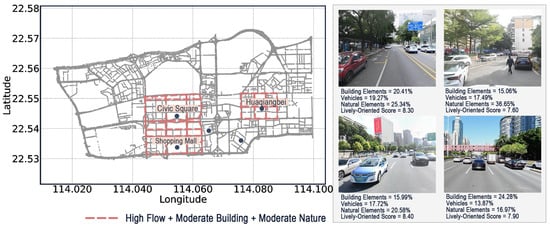
Figure 18.
Lively-Oriented Streetscapes. The left map shows the geographic distribution of lively-oriented streets in the central area of Futian District, Shenzhen, China; the right panel presents high-scoring exemplary cases.
In addition to compositional strategies, visual features such as fractal dimension, symmetry, grayscale contrast, and color warmth should be considered. First, avoid monotonous designs by incorporating fine-grained details that increase fractal dimension and enrich visual complexity. Second, enhance facade symmetry to create orderly and stable visual impressions, contributing to both beauty and perceived safety. Third, grayscale contrast can be improved by emphasizing the contrast between pedestrian and vehicular zones (e.g., dark paving for sidewalks vs. light roads), thereby enhancing spatial clarity and legibility. Finally, incorporating warm color tones not only improves aesthetic appeal but also fosters a sense of vibrancy and safety, contributing to a welcoming urban atmosphere.
4.4. Limitations and Future Research
Despite achieving meaningful progress in streetscape perception analysis, this study has several limitations that warrant attention.
First, the research primarily relies on daytime street imagery, while perceptual responses to urban environments can vary significantly across different times of day [26,83]. This is especially critical in safety perception assessments, where nighttime factors such as lighting intensity, uniformity, fixture distribution, and shadowed areas directly influence subjective evaluations. Future studies could expand to include all-day street view data collection and analysis. Techniques such as 3D modeling and lighting simulation could be used to examine how different lighting layouts affect perceived safety, in conjunction with subjective evaluations, to conduct systematic lighting-perception analyses and offer data-driven guidance for nighttime urban lighting optimization.
Second, the two-stage training strategy in this study integrates the public PlacePulse 2.0 dataset with a locally curated subset of streetscape images and expert ratings from Shenzhen’s Futian District. While this helps mitigate geographic bias and improves the model’s adaptability to the local context, it cannot fully eliminate the influence of cultural and regional backgrounds on perceptual evaluation. Since perception is inherently subjective—shaped by cultural values, lifestyles, and stages of urban development—future research should design cross-regional and cross-cultural experiments. By constructing a more diverse training dataset across multiple representative cities (e.g., in East Asia, North America, and Europe) and comparing how different cultural groups perceive the same scenes, researchers can better distinguish between universally appreciated landscape elements and culturally sensitive ones.
Third, while the study investigates the relationship between visual features and perception, the perception scores are derived from deep learning model predictions, and low-level visual features are susceptible to lighting conditions during image capture. Consequently, a certain degree of error is unavoidable, and fine-grained feature–perception correlations remain underexplored. Future work could employ computer-aided generation techniques and virtual reality (VR) environments [84] (e.g., built with Unity or Unreal Engine) to simulate and systematically manipulate streetscape element combinations. These virtual settings could be paired with participants’ subjective feedback and physiological responses (e.g., eye-tracking, electrodermal activity), allowing for deeper exploration of causal relationships between features and perception.
Finally, this study focuses solely on the visual dimension of perception derived from street view images. While this allows for large-scale data acquisition, real-world streetscape perception is not limited to visual stimuli. Human environmental perception is shaped by multiple senses, including auditory [85] and olfactory [86] inputs. Moreover, personal factors such as education level, mental health status, and age also significantly influence perception [14]. Future research could develop a multimodal perceptual modeling framework that integrates visual, auditory, and olfactory information. Incorporating population heterogeneity into the modeling process could further enable the development of individualized streetscape perception prediction systems.
5. Conclusions
This study develops a multi-dimensional feature–perception coupling analysis framework to uncover the factors influencing subjective experiences of urban streetscapes from multiple perspectives.
First, the study introduces a novel computational method—the Salient Landscape Combination Feature Extraction Method—to analyze the impact of overall landscape structure on perception. This method integrates a UniSal saliency prediction model trained on the SALICON dataset with a semantic segmentation model trained on the ADE20K dataset to automatically identify salient landscape combinations within street view images. By doing so, the research expands the analytical dimensions of streetscape perception and provides a replicable methodology for future studies.
Second, the study combines the large-scale global Place Pulse 2.0 dataset with a smaller, localized dataset from the central urban area of Futian District, Shenzhen. The large dataset enhances the model’s generalizability, while the localized dataset improves the model’s sensitivity to local environmental characteristics and cultural nuances. This data integration enables the model to better capture the unique features and perception patterns of the study area, enhancing the applicability of the research findings.
Third, to comprehensively quantify street visual features, the study evaluates both low-level and high-level elements. LLVFs include fractal dimension, symmetry, grayscale contrast, color diversity, and warmth, which capture the basic visual properties that influence first impressions. HLSFs involve 30 semantic elements that reflect functional and ecological attributes. At the compositional level, six prototypical streetscape patterns are identified—Natural Tranquility Type, High-Density Building Type, Dynamic Traffic Type, Greenery-Oriented Type, Diverse Mixed-Use Type, and Infrastructure-Oriented Type—to illustrate how element combinations affect perception holistically.
Fourth, in terms of data analysis, the results reveal that both visual attributes and landscape combination patterns significantly influence perception. Moreover, the findings highlight that optimizing a single feature is insufficient to enhance specific perceptual outcomes—what truly matters is the coordinated configuration of multiple landscape elements.
These insights contribute new analytical perspectives and technical tools to urban design. It is hoped that the findings will lay a foundation for future advancements in urban environment optimization and perceptual research, while also offering scientific, data-driven guidance for urban planners and landscape designers to more precisely shape urban spaces.
Author Contributions
Conceptualization, W.S. and J.Z.; methodology, W.S. and J.Z.; software, W.S. and J.Z.; validation, W.S. and J.Z.; formal analysis, W.S. and J.Z.; investigation, W.S.; resources, W.S. and J.Z.; data curation, W.S.; writing—original draft preparation, W.S.; writing—review and editing, W.S. and J.Z.; visualization, W.S. and J.Z.; supervision, J.Z.; project administration, J.Z. All authors have read and agreed to the published version of the manuscript.
Funding
This research was supported by the National Natural Science Foundation of China (Grant No. 52108059).
Data Availability Statement
The original contributions presented in the study are included in the article; further inquiries can be directed to the corresponding author.
Conflicts of Interest
The authors declare no conflicts of interest.
References
- Xu, J.; Liu, N.; Polemiti, E.; Garcia-Mondragon, L.; Tang, J.; Liu, X.; Lett, T.; Yu, L.; Nöthen, M.M.; Feng, J.; et al. Effects of urban living environments on mental health in adults. Nat. Med. 2023, 29, 1456–1467. [Google Scholar] [CrossRef]
- Harmaakorpi, V.; Kari, K.; Parjanen, S. City design management as a local competitiveness factor. Place Brand. Public Dipl. 2008, 4, 169–181. [Google Scholar] [CrossRef]
- Appleyard, D.; Lintell, M. The environmental quality of city streets: The residents’ viewpoint. J. Am. Inst. Planners 1972, 38, 84–101. [Google Scholar] [CrossRef]
- Cheng, L.; Chu, S.; Zong, W.; Li, S.; Wu, J.; Li, M. Use of tencent street view imagery for visual perception of streets. ISPRS Int. J. Geo-Inf. 2017, 6, 265. [Google Scholar] [CrossRef]
- Callaghan, A.; McCombe, G.; Harrold, A.; McMeel, C.; Mills, G.; Moore-Cherry, N.; Cullen, W. The impact of green spaces on mental health in urban settings: A scoping review. J. Ment. Health 2020, 30, 179–193. [Google Scholar] [CrossRef]
- Batistatou, A.; Vandeville, F.; Delevoye-Turrell, Y.N. Virtual reality to evaluate the impact of colorful interventions and nature elements on spontaneous walking, gaze, and emotion. Front. Virtual Real. 2022, 3, 819597. [Google Scholar] [CrossRef]
- Zhang, Y.; Fu, X.; Lv, C.; Li, S. The premium of public perceived greenery: A framework using multiscale GWR and deep learning. Int. J. Environ. Res. Public Health 2021, 18, 6809. [Google Scholar] [CrossRef]
- Zhang, Z.; Fisher, T.; Wang, H. Campus environmental quality and streetscape features related to walking activity. J. Asian Arch. Build. Eng. 2023, 23, 405–423. [Google Scholar] [CrossRef]
- Dong, L.; Jiang, H.; Li, W.; Qiu, B.; Wang, H.; Qiu, W. Assessing impacts of objective features and subjective perceptions of street environment on running amount: A case study of Boston. Landsc. Urban Plan. 2023, 235, 104756. [Google Scholar] [CrossRef]
- He, N.; Li, G. Urban neighbourhood environment assessment based on street view image processing: A review of research trends. Environ. Challeng. 2021, 4, 100090. [Google Scholar] [CrossRef]
- Zhou, H.; Wang, J.; Wilson, K. Impacts of perceived safety and beauty of park environments on time spent in parks: Examining the potential of street view imagery and phone-based GPS data. Int. J. Appl. Earth Obs. Geoinf. 2022, 115, 103078. [Google Scholar] [CrossRef]
- Ogawa, Y.; Oki, T.; Zhao, C.; Sekimoto, Y.; Shimizu, C. Evaluating the subjective perceptions of streetscapes using street-view images. Landsc. Urban Plan. 2024, 247, 105073. [Google Scholar] [CrossRef]
- Zeng, Q.; Gong, Z.; Wu, S.; Zhuang, C.; Li, S. Measuring cyclists’ subjective perceptions of the street riding environment using K-means SMOTE-RF model and street view imagery. Int. J. Appl. Earth Obs. Geoinf. 2024, 128, 103739. [Google Scholar] [CrossRef]
- Qiu, W.; Li, W.; Liu, X.; Huang, X. Subjectively measured streetscape perceptions to inform urban design strategies for Shanghai. ISPRS Int. J. Geo-Inf. 2021, 10, 493. [Google Scholar] [CrossRef]
- Ewing, R.; Handy, S. Measuring the unmeasurable: Urban design qualities related to walkability. J. Urban Des. 2009, 14, 65–84. [Google Scholar] [CrossRef]
- Filova, L.; Vojar, J.; Svobodova, K.; Sklenicka, P. The effect of landscape type and landscape elements on public visual preferences: Ways to use knowledge in the context of landscape planning. J. Environ. Plan. Manag. 2014, 58, 2037–2055. [Google Scholar] [CrossRef]
- Sung, H.; Go, D.; Choi, C.-G.; Cheon, S.; Park, S. Effects of street-level physical environment and zoning on walking activity in Seoul, Korea. Land Use Policy 2015, 49, 152–160. [Google Scholar] [CrossRef]
- Tang, F.; Zeng, P.; Wang, L.; Zhang, L.; Xu, W. Urban perception evaluation and street refinement governance supported by street view visual elements analysis. Remot. Sens. 2024, 16, 3661. [Google Scholar] [CrossRef]
- Rui, J.; Xu, Y. Beyond built environment: Unveiling the interplay of streetscape perceptions and cycling behavior. Sustain. Cities Soc. 2024, 109, 105525. [Google Scholar] [CrossRef]
- Zhao, J.; Suo, W. Research on the Construction and Application of a SVM-Based Quantification Model for Streetscape Visual Complexity. Land 2024, 13, 1953. [Google Scholar] [CrossRef]
- Zhu, Y.; Su, F.; Han, X.; Fu, Q.; Liu, J. Uncovering the drivers of gender inequality in perceptions of safety: An interdisciplinary approach combining street view imagery, socio-economic data and spatial statistical modelling. Int. J. Appl. Earth Obs. Geoinf. 2024, 134, 104230. [Google Scholar] [CrossRef]
- Gehl, J. Cities for People; Island Press: Washington, DC, USA, 2010. [Google Scholar]
- Lin, L.; Moudon, A.V. Objective versus subjective measures of the built environment, which are most effective in capturing associations with walking? Health Place 2010, 16, 339–348. [Google Scholar] [CrossRef]
- Zhou, H.; He, S.; Cai, Y.; Wang, M.; Su, S. Social inequalities in neighborhood visual walkability: Using street view imagery and deep learning technologies to facilitate healthy city planning. Sustain. Cities Soc. 2019, 50, 101605. [Google Scholar] [CrossRef]
- Wang, R.; Liu, Y.; Lu, Y.; Zhang, J.; Liu, P.; Yao, Y.; Grekousis, G. Perceptions of built environment and health outcomes for older Chinese in Beijing: A big data approach with street view images and deep learning technique. Comput. Environ. Urban Syst. 2019, 78, 101386. [Google Scholar] [CrossRef]
- Rui, J.; Cai, C. Plausible or misleading? Evaluating the adaption of the place pulse 2.0 dataset for predicting subjective perception in Chinese urban landscapes. Habitat Int. 2025, 157, 103333. [Google Scholar] [CrossRef]
- Dubey, A.; Naik, N.; Parikh, D.; Raskar, R.; Hidalgo, C.A. Deep learning the city: Quantifying Urban perception at a global scale. In Proceedings of the European Conference on Computer Vision, Amsterdam, The Netherlands, 11–14 October 2016; pp. 196–212. [Google Scholar] [CrossRef]
- Zhang, F.; Zhou, B.; Liu, L.; Liu, Y.; Fung, H.H.; Lin, H.; Ratti, C. Measuring human perceptions of a large-scale urban region using machine learning. Landsc. Urban Plan. 2018, 180, 148–160. [Google Scholar] [CrossRef]
- Wang, L.; Han, X.; He, J.; Jung, T. Measuring residents’ perceptions of city streets to inform better street planning through deep learning and space syntax. ISPRS J. Photogramm. Remote. Sens. 2022, 190, 215–230. [Google Scholar] [CrossRef]
- Huang, B.; Zhou, Y.; Li, Z.; Song, Y.; Cai, J.; Tu, W. Evaluating and characterizing urban vibrancy using spatial big data: Shanghai as a case study. Environ. Plan. B Urban Anal. City Sci. 2019, 47, 1543–1559. [Google Scholar] [CrossRef]
- Ye, Y.; Li, D.; Liu, X. How block density and typology affect urban vitality: An exploratory analysis in Shenzhen, China. Urban Geogr. 2018, 39, 631–652. [Google Scholar] [CrossRef]
- Wei, J.; Yue, W.; Li, M.; Gao, J. Mapping human perception of urban landscape from street-view images: A deep-learning approach. Int. J. Appl. Earth Obs. Geoinf. 2022, 112, 102886. [Google Scholar] [CrossRef]
- McLeod, S. Maslow’s Hierarchy of Needs. Simply Psychol. 2007, 1, 1–18. Available online: https://www.simplypsychology.org/maslow.html?ez_vid=2cae626a2fe896279da43d587baa3eb663083817 (accessed on 13 April 2025).
- Lederbogen, F.; Kirsch, P.; Haddad, L.; Streit, F.; Tost, H.; Schuch, P.; Wüst, S.; Pruessner, J.C.; Rietschel, M.; Deuschle, M.; et al. City living and urban upbringing affect neural social stress processing in humans. Nature 2011, 474, 498–501. [Google Scholar] [CrossRef]
- Mehta, V.; Bosson, J.K. Revisiting Lively streets: Social interactions in public space. J. Plan. Educ. Res. 2018, 41, 160–172. [Google Scholar] [CrossRef]
- Wang, Y.; Qiu, W.; Jiang, Q.; Li, W.; Ji, T.; Dong, L. Drivers or pedestrians, whose dynamic perceptions are more effective to explain street vitality? A case study in Guangzhou. Remot. Sens. 2023, 15, 568. [Google Scholar] [CrossRef]
- Jin, X.; Wang, J. Assessing Linear Urban Landscape from dynamic visual perception based on urban morphology. Front. Arch. Res. 2021, 10, 202–219. [Google Scholar] [CrossRef]
- Stamps, A.E. Fractals, skylines, nature and beauty. Landsc. Urban Plan. 2002, 60, 163–184. [Google Scholar] [CrossRef]
- Berg, A.E.V.D.; Joye, Y.; Koole, S.L. Why viewing nature is more fascinating and restorative than viewing buildings: A closer look at perceived complexity. Urban For. Urban Green. 2016, 20, 397–401. [Google Scholar] [CrossRef]
- Sigaki, H.Y.D.; Perc, M.; Ribeiro, H.V. History of art paintings through the lens of entropy and complexity. Proc. Natl. Acad. Sci. USA 2018, 115, E8585–E8594. [Google Scholar] [CrossRef]
- Bertamini, M.; Rampone, G.; Makin, A.D.; Jessop, A. Symmetry preference in shapes, faces, flowers and landscapes. PeerJ 2019, 7, e7078. [Google Scholar] [CrossRef]
- Lang, C.; Nguyen, T.V.; Katti, H.; Yadati, K.; Kankanhalli, M.; Yan, S. Depth matters: Influence of depth cues on visual saliency. In Proceedings of the Computer Vision–ECCV 2012: 12th European Conference on Computer Vision, Florence, Italy, 7–13 October 2012. Proceedings, Part II 12. [Google Scholar] [CrossRef]
- Yildirim, K.; Hidayetoglu, M.L.; Capanoglu, A. Effects of interior colors on mood and preference: Comparisons of two living rooms. Percept. Mot. Ski. 2011, 112, 509–524. [Google Scholar] [CrossRef]
- Gu, L.; Dimitrov-Discher, A.; Knöll, M.; Roe, J. Cool colors promote a restorative sidewalk experience: A study on effects of color and pattern design of ground murals on mood states and perceived restorativeness using 2D street view images. Environ. Plan. B Urban Anal. City Sci. 2024, 52, 1055–1070. [Google Scholar] [CrossRef]
- Gu, L.; Batistatou, A.; Delevoye, Y.; Roe, J.; Knöll, M. Using Artificial Ground Color to Promote a Restorative Sidewalk Experience: An Experimental Study Based on Manipulated Street View Images. 2021. Available online: https://lilloa.univ-lille.fr/bitstream/handle/20.500.12210/58758.1/Gu2021.pdf?sequence=1&isAllowed=y (accessed on 15 May 2025).
- Jahanmiri, F.; Parker, D.C. An Overview of Fractal Geometry Applied to Urban Planning. Land 2022, 11, 475. [Google Scholar] [CrossRef]
- Zhou, B.; Xu, S.; Yang, X.-X. Computing the color complexity of images. In Proceedings of the 2015 12th International Conference on Fuzzy Systems and Knowledge Discovery (FSKD), Zhangjiajie, China, 15–17 August 2015. [Google Scholar] [CrossRef]
- Zhou, B.; Zhao, H.; Puig, X.; Fidler, S.; Barriuso, A.; Torralba, A. Scene Parsing through ADE20K Dataset. In Proceedings of the IEEE Conference on Computer Vision and Pattern Recognition, Honolulu, HI, USA, 21–26 July 2017. [Google Scholar] [CrossRef]
- Zhou, B.; Zhao, H.; Puig, X.; Xiao, T.; Fidler, S.; Barriuso, A.; Torralba, A. Semantic Understanding of Scenes Through the ADE20K Dataset. Int. J. Comput. Vis. 2018, 127, 302–321. [Google Scholar] [CrossRef]
- Eriksen, C.W.; James, J.D.S. Visual attention within and around the field of focal attention: A zoom lens model. Percept. Psychophys. 1986, 40, 225–240. [Google Scholar] [CrossRef]
- Droste, R.; Jiao, J.; Noble, J.A. Unified image and video saliency modeling. In Proceedings of the Computer Vision–ECCV 2020: 16th European Conference, Glasgow, UK, 23–28 August 2020. Proceedings, Part V 16, 2020. [Google Scholar] [CrossRef]
- Jiang, M.; Huang, S.; Duan, J.; Zhao, Q. SALICON: Saliency in Context. In Proceedings of the 2015 IEEE Conference on Computer Vision and Pattern Recognition (CVPR), Boston, MA, USA, 7–12 June 2015. [Google Scholar] [CrossRef]
- Larkin, A.; Gu, X.; Chen, L.; Hystad, P. Predicting perceptions of the built environment using GIS, satellite and street view image approaches. Landsc. Urban Plan. 2021, 216, 104257. [Google Scholar] [CrossRef]
- Kruithof, M.C.; Bouma, H.; Fischer, N.M.; Schutte, K.; Burgess, D.; Owen, G.; Carlysle-Davies, F.; Stokes, R.J.; Yitzhaky, Y. Object recognition using deep convolutional neural networks with complete transfer and partial frozen layers. In Proceedings of the Optics and Photonics for Counterterrorism, Crime Fighting, and Defence XII, Edinburgh, UK, 26–27 September 2016. [Google Scholar] [CrossRef]
- Ding, B.; Qian, H.; Zhou, J. Activation functions and their characteristics in deep neural networks. In Proceedings of the 2018 Chinese Control and Decision Conference (CCDC), Shenyang, China, 9–11 June 2018; pp. 1836–1841. [Google Scholar] [CrossRef]
- Wu, H.; Gu, X. Towards dropout training for convolutional neural networks. Neural Networks 2015, 71, 1–10. [Google Scholar] [CrossRef]
- Yue, H. Investigating the influence of streetscape environmental characteristics on pedestrian crashes at intersections using street view images and explainable machine learning. Accid. Anal. Prev. 2024, 205, 107693. [Google Scholar] [CrossRef]
- Li, H.; Miao, L. A Study of the Non-Linear Relationship Between Urban Morphology and Vitality in Heritage Areas Based on Multi-Source Data and Machine Learning: A Case Study of Dalian. ISPRS Int. J. Geo-Inf. 2025, 14, 177. [Google Scholar] [CrossRef]
- Ji, D.; Tian, J.; Zhang, J.; Zeng, J.; Namaiti, A. Identification and Spatiotemporal Evolution Analysis of the Urban–Rural Fringe in Polycentric Cities Based on K-Means Clustering and Multi-Source Data: A Case Study of Chengdu City. Land 2024, 13, 1727. [Google Scholar] [CrossRef]
- Li, C.; Managi, S. Impacts of community attachment and community livability on environmental activity according to XGBoost and SHAP. Cities 2024, 156, 105559. [Google Scholar] [CrossRef]
- Kawshalya, L.W.G.; Weerasinghe, U.G.D.; Chandrasekara, D.P.; Singh, K.K. The impact of visual complexity on perceived safety and comfort of the users: A study on urban streetscape of Sri Lanka. PLoS ONE 2022, 17, e0272074. [Google Scholar] [CrossRef]
- Shayestefar, M.; Pazhouhanfar, M.; van Oel, C.; Grahn, P. Exploring the influence of the visual attributes of kaplan’s preference matrix in the assessment of urban parks: A discrete choice analysis. Sustainability 2022, 14, 7357. [Google Scholar] [CrossRef]
- Che, J.; Sun, X.; Gallardo, V.; Nadal, M. Cross-cultural empirical aesthetics. Prog. Brain Res. 2018, 237, 77–103. [Google Scholar] [CrossRef]
- Weber, R.; Schnier, J.; Jacobsen, T. Aesthetics of streetscapes: Influence of fundamental properties on aesthetic judgments of urban space. Percept. Mot. Ski. 2008, 106, 128–146. [Google Scholar] [CrossRef]
- Gaekwad, J.S.; Moslehian, A.S.; Roös, P.B.; Walker, A. A meta-analysis of emotional evidence for the biophilia hypothesis and implications for biophilic Design. Front. Psychol. 2022, 13, 750245. [Google Scholar] [CrossRef]
- Lindal, P.J.; Hartig, T. Effects of urban street vegetation on judgments of restoration likelihood. Urban For. Urban Green. 2015, 14, 200–209. [Google Scholar] [CrossRef]
- Zhang, Z.; Zhuo, K.; Wei, W.; Li, F.; Yin, J.; Xu, L. Emotional responses to the visual patterns of urban streets: Evidence from physiological and subjective indicators. Int. J. Environ. Res. Public Health 2021, 18, 9677. [Google Scholar] [CrossRef]
- Alkhresheh, M.M. Enclosure as a Function of Height-To-Width Ratio and Scale: Its Influence on User’s Sense of Comfort and Safety in Urban Street Space University of Florida Gainesville, FL. 2007. Available online: https://www.researchgate.net/profile/Majdi-Alkhresheh/publication/267307437_ENCLOSURE_AS_A_FUNCTION_OF_HEIGHT-TO-WIDTH_RATIO_AND_SCALE_ITS_INFLUENCE_ON_USER%27S_SENSE_OF_COMFORT_AND_SAFETY_IN_URBAN_STREET_SPACE/links/5551115408ae956a5d25ddf0/ENCLOSURE-AS-A-FUNCTION-OF-HEIGHT-TO-WIDTH-RATIO-AND-SCALE-ITS-INFLUENCE-ON-USERS-SENSE-OF-COMFORT-AND-SAFETY-IN-URBAN-STREET-SPACE.pdf (accessed on 15 April 2025).
- Lindal, P.J.; Hartig, T. Architectural variation, building height, and the restorative quality of urban residential streetscapes. J. Environ. Psychol. 2013, 33, 26–36. [Google Scholar] [CrossRef]
- Wong, M.S.; Nichol, J.; Ng, E. A study of the “wall effect” caused by proliferation of high-rise buildings using GIS techniques. Landsc. Urban Plan. 2011, 102, 245–253. [Google Scholar] [CrossRef]
- Lee, S.; Lee, J.; Mastrigt, S.H.-V.; Kim, E. What cities have is how people travel: Conceptualizing a data-mining-driven modal split framework. Cities 2022, 131, 103902. [Google Scholar] [CrossRef]
- Jandhyala, R. Delphi, non-RAND modified Delphi, RAND/UCLA appropriateness method and a novel group awareness and consensus methodology for consensus measurement: A systematic literature review. Curr. Med. Res. Opin. 2020, 36, 1873–1887. [Google Scholar] [CrossRef]
- Zhang, S.; Xiong, K.; Fei, G.; Zhang, H.; Chen, Y. Aesthetic value protection and tourism development of the world natural heritage sites: A literature review and implications for the world heritage karst sites. Heritage Sci. 2023, 11, 30. [Google Scholar] [CrossRef]
- Arefi, M.F.; Poursadeqiyan, M. Health, safety, and environmental status of Iranian school: A systematic review. J. Educ. Health Promot. 2020, 9, 297. [Google Scholar] [CrossRef]
- Gao, M.; Zhu, X.; Cheng, X. Safety—Premise for play: Exploring how characteristics of outdoor play spaces in urban residential areas influence children’s perceived safety. Cities 2024, 152, 105236. [Google Scholar] [CrossRef]
- Jiang, B.; Larsen, L.; Deal, B.; Sullivan, W.C. A dose–response curve describing the relationship between tree cover density and landscape preference. Landsc. Urban Plan. 2015, 139, 16–25. [Google Scholar] [CrossRef]
- Iamtrakul, P.; Chayphong, S.; Kantavat, P.; Nakamura, K.; Hayashi, Y.; Kijsirikul, B.; Iwahori, Y. Assessing Subjective and Objective Road Environment Perception in the Bangkok Metropolitan Region, Thailand: A Deep Learning Approach Utilizing Street Images. Sustainability 2024, 16, 1494. [Google Scholar] [CrossRef]
- Quercia, D.; Schifanella, R.; Aiello, L.M. The shortest path to happiness: Recommending beautiful, quiet, and happy routes in the city. In Proceedings of the 25th ACM Conference on Hypertext and Social Media; Association for Computing Machinery: New York, NY, USA, 2014. [Google Scholar] [CrossRef]
- Jiang, Y.; Han, Y.; Liu, M.; Ye, Y. Street vitality and built environment features: A data-informed approach from fourteen Chinese cities. Sustain. Cities Soc. 2022, 79, 103724. [Google Scholar] [CrossRef]
- Cooper, J.; Su, M.-L.; Oskrochi, R. The influence of fractal dimension and vegetation on the perceptions of streetscape quality in Taipei: With comparative comments made in relation to two british case studies. Environ. Plan. B Plan. Des. 2013, 40, 43–62. [Google Scholar] [CrossRef]
- Asgarzadeh, M.; Koga, T.; Hirate, K.; Farvid, M.; Lusk, A. Investigating oppressiveness and spaciousness in relation to building, trees, sky and ground surface: A study in Tokyo. Landsc. Urban Plan. 2014, 131, 36–41. [Google Scholar] [CrossRef]
- Liang, X.; Chang, J.H.; Gao, S.; Zhao, T.; Biljecki, F. Evaluating human perception of building exteriors using street view imagery. Build. Environ. 2024, 263, 111875. [Google Scholar] [CrossRef]
- Wu, C.; Ye, Y.; Gao, F.; Ye, X. Using street view images to examine the association between human perceptions of locale and urban vitality in Shenzhen, China. Sustain. Cities Soc. 2022, 88, 104291. [Google Scholar] [CrossRef]
- Xu, C.; Oberman, T.; Aletta, F.; Tong, H.; Kang, J. Ecological validity of immersive virtual reality (IVR) techniques for the perception of urban sound environments. Acoustics 2020, 3, 11–24. [Google Scholar] [CrossRef]
- Le, Q.H.; Moon, H.; Ho, J.; Ahn, Y. From seeing to hearing: A feasibility study on utilizing regenerated sounds from street view images to assess place perceptions. Build. Environ. 2024, 269, 112468. [Google Scholar] [CrossRef]
- Abbassy, N.; El-Husseiny, M.; Shaker, S. Smell-waking as a cognitive mapping tool: Investigating the smellscape of Syrian food for placemaking in Cairo’s outskirts. Urban Des. Int. 2025, 30, 3–20. [Google Scholar] [CrossRef]

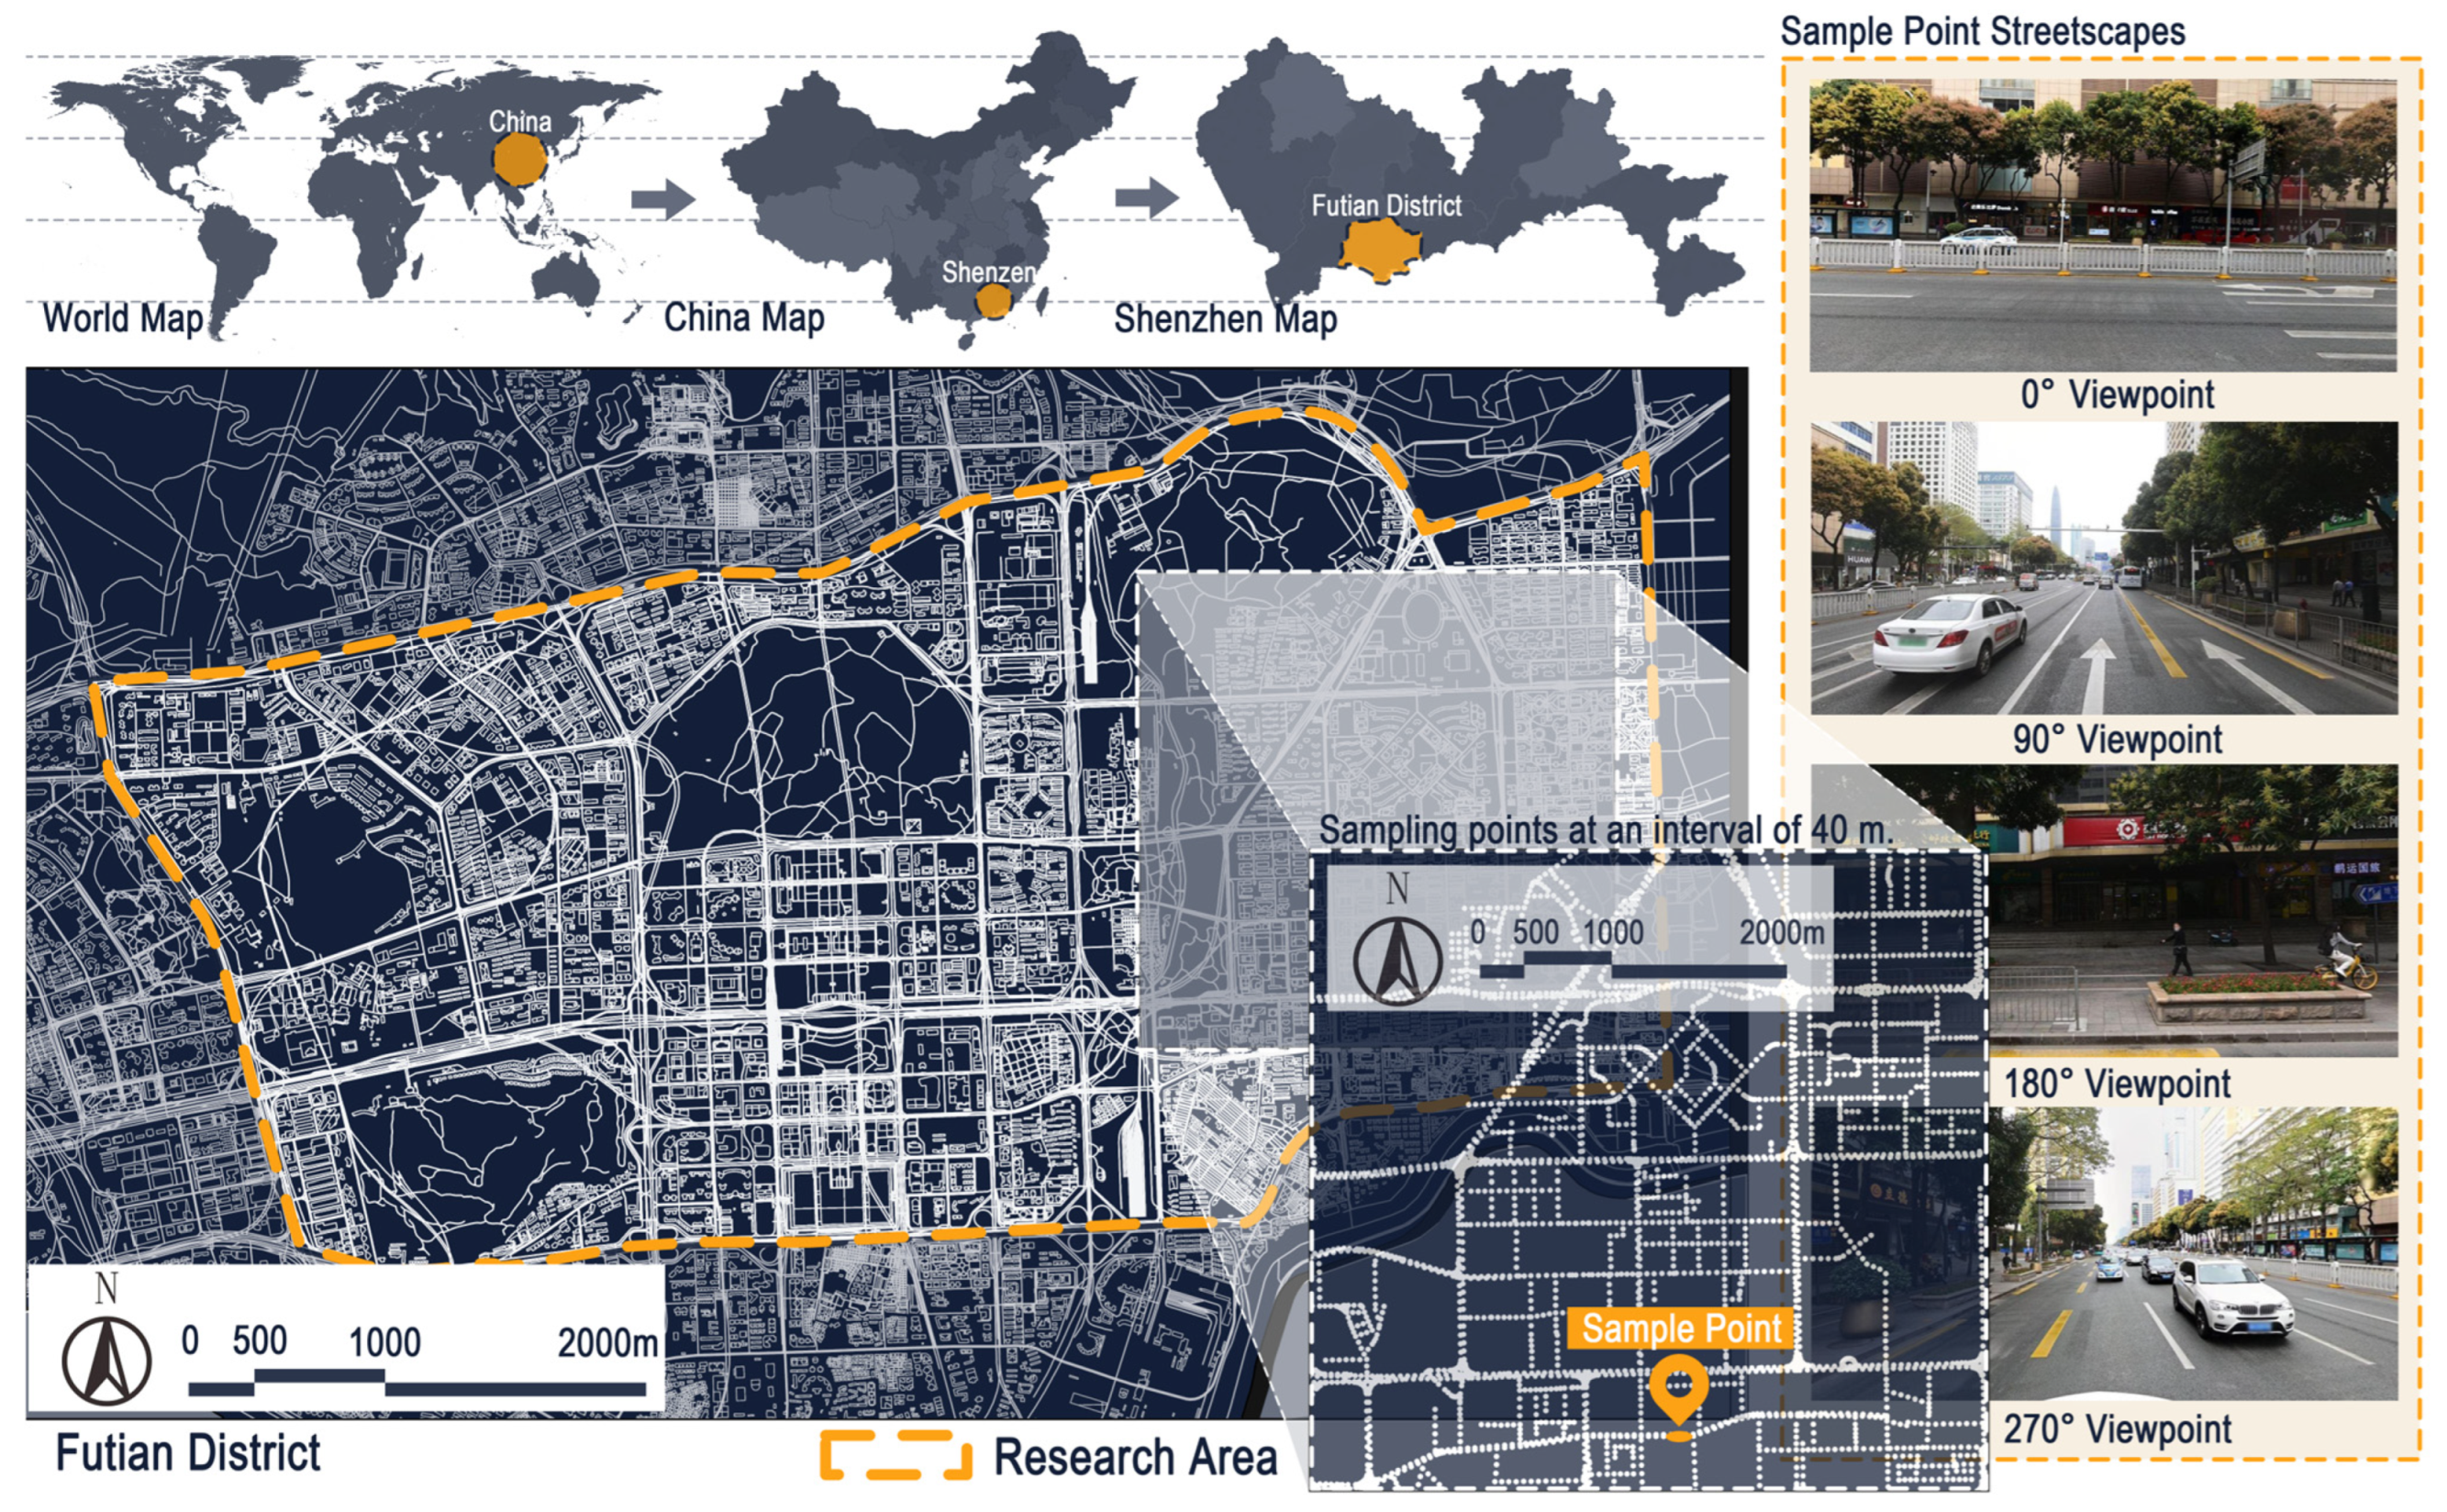
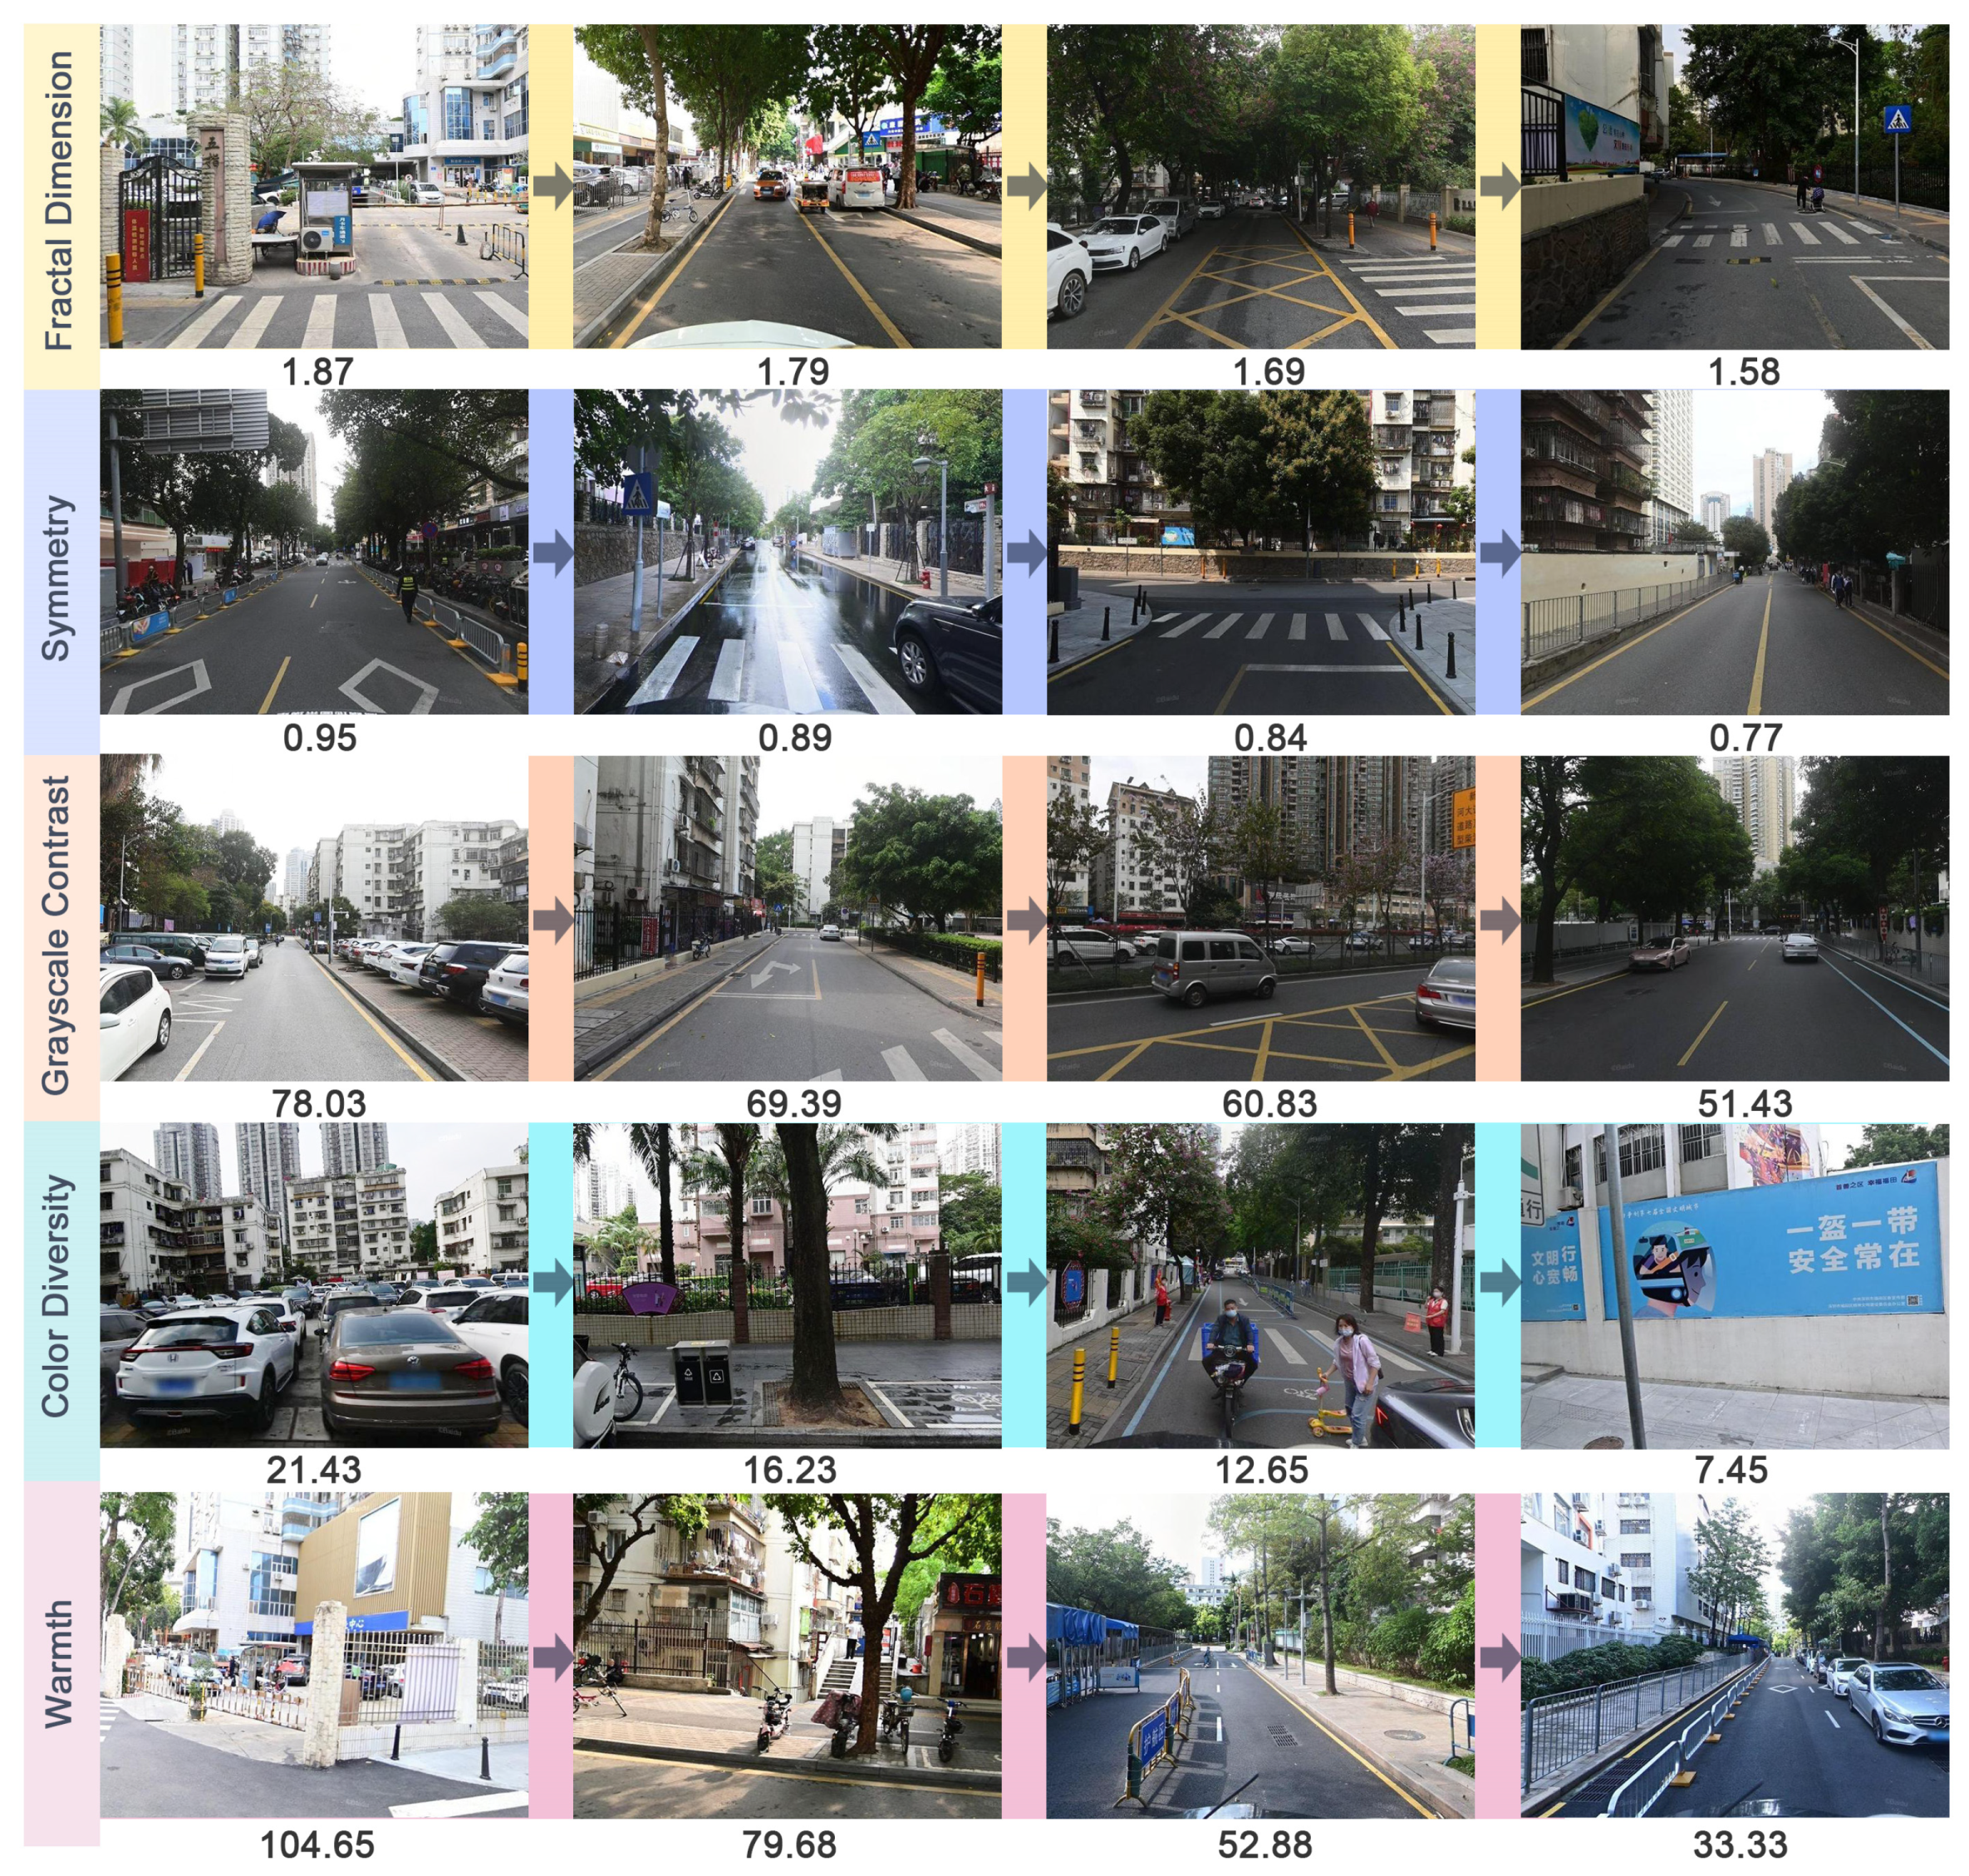
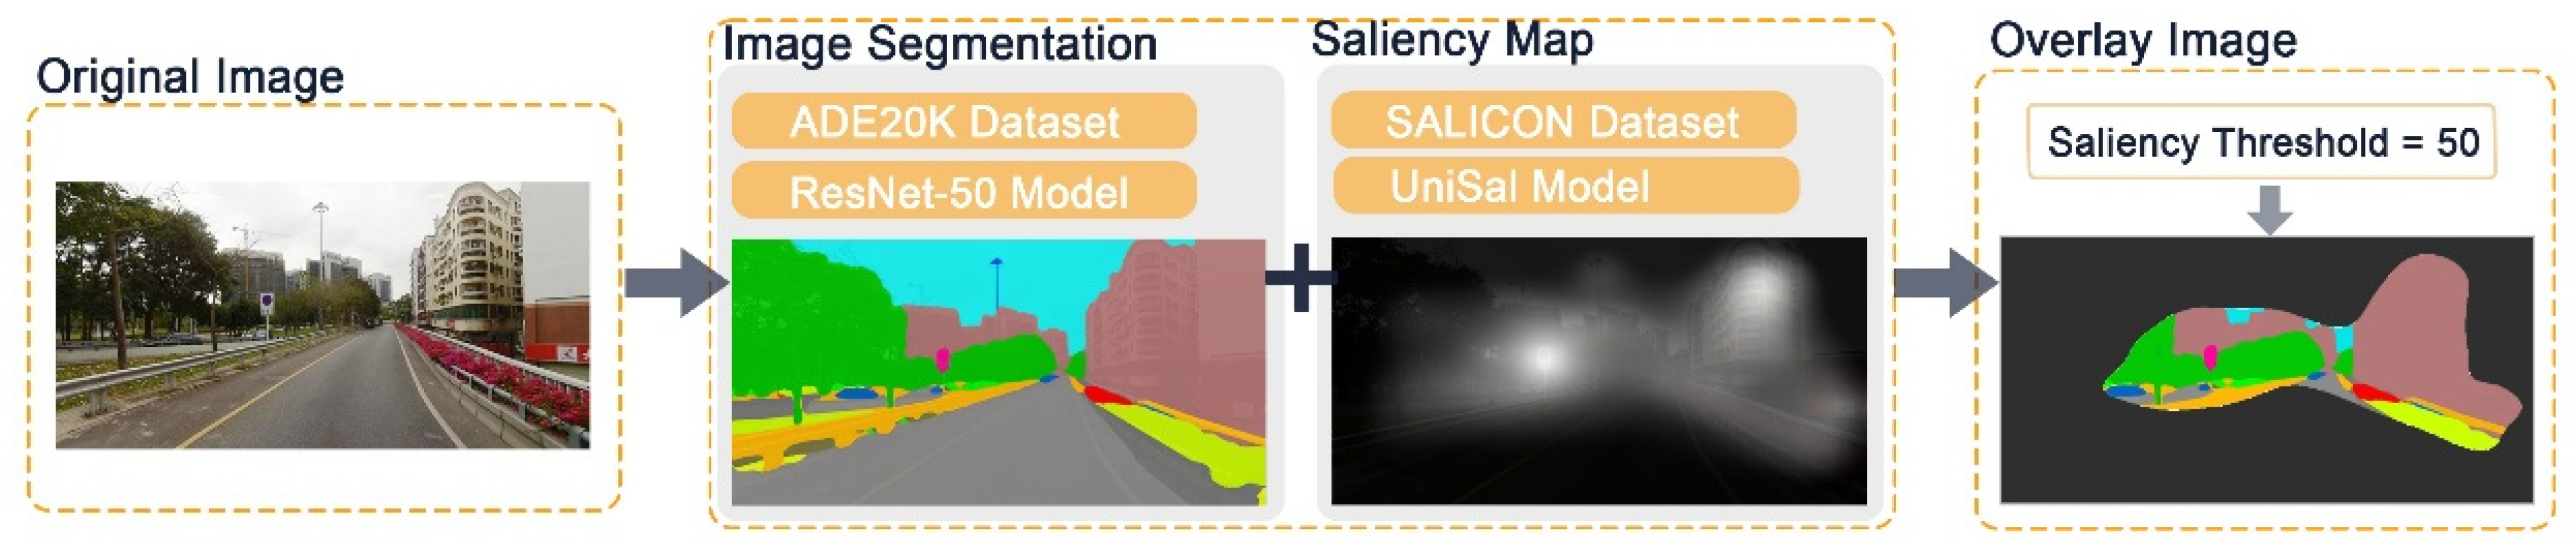
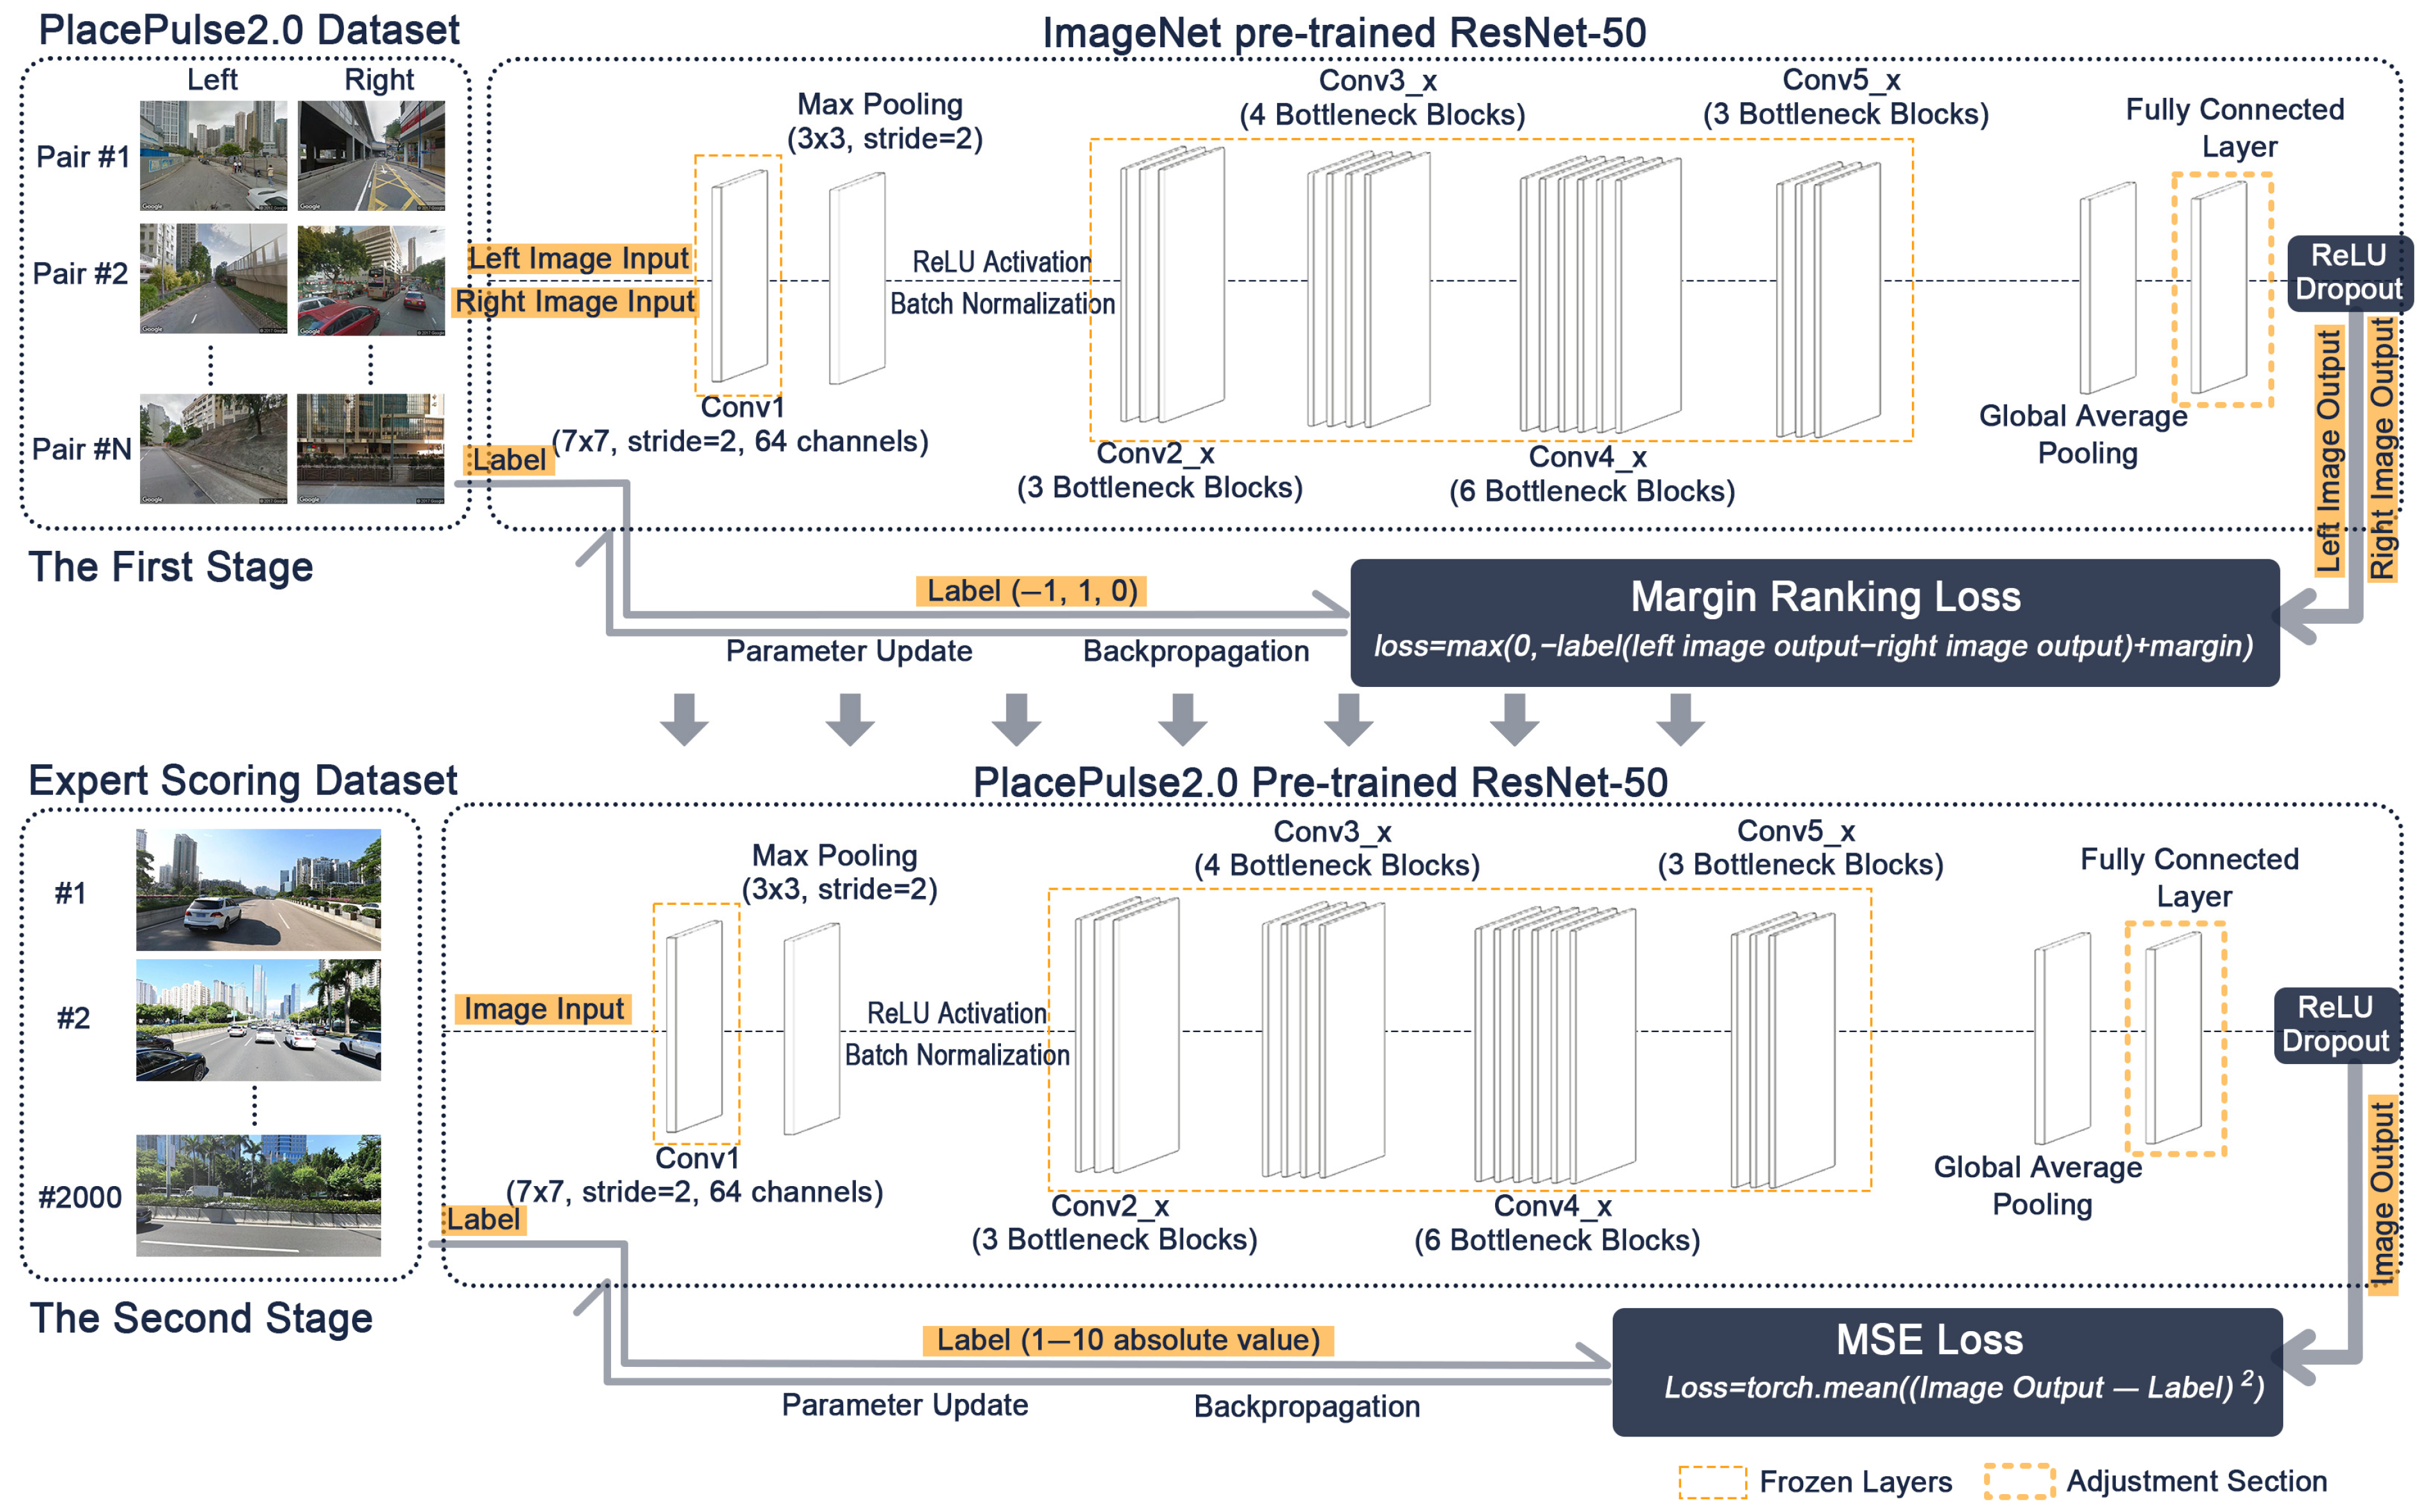
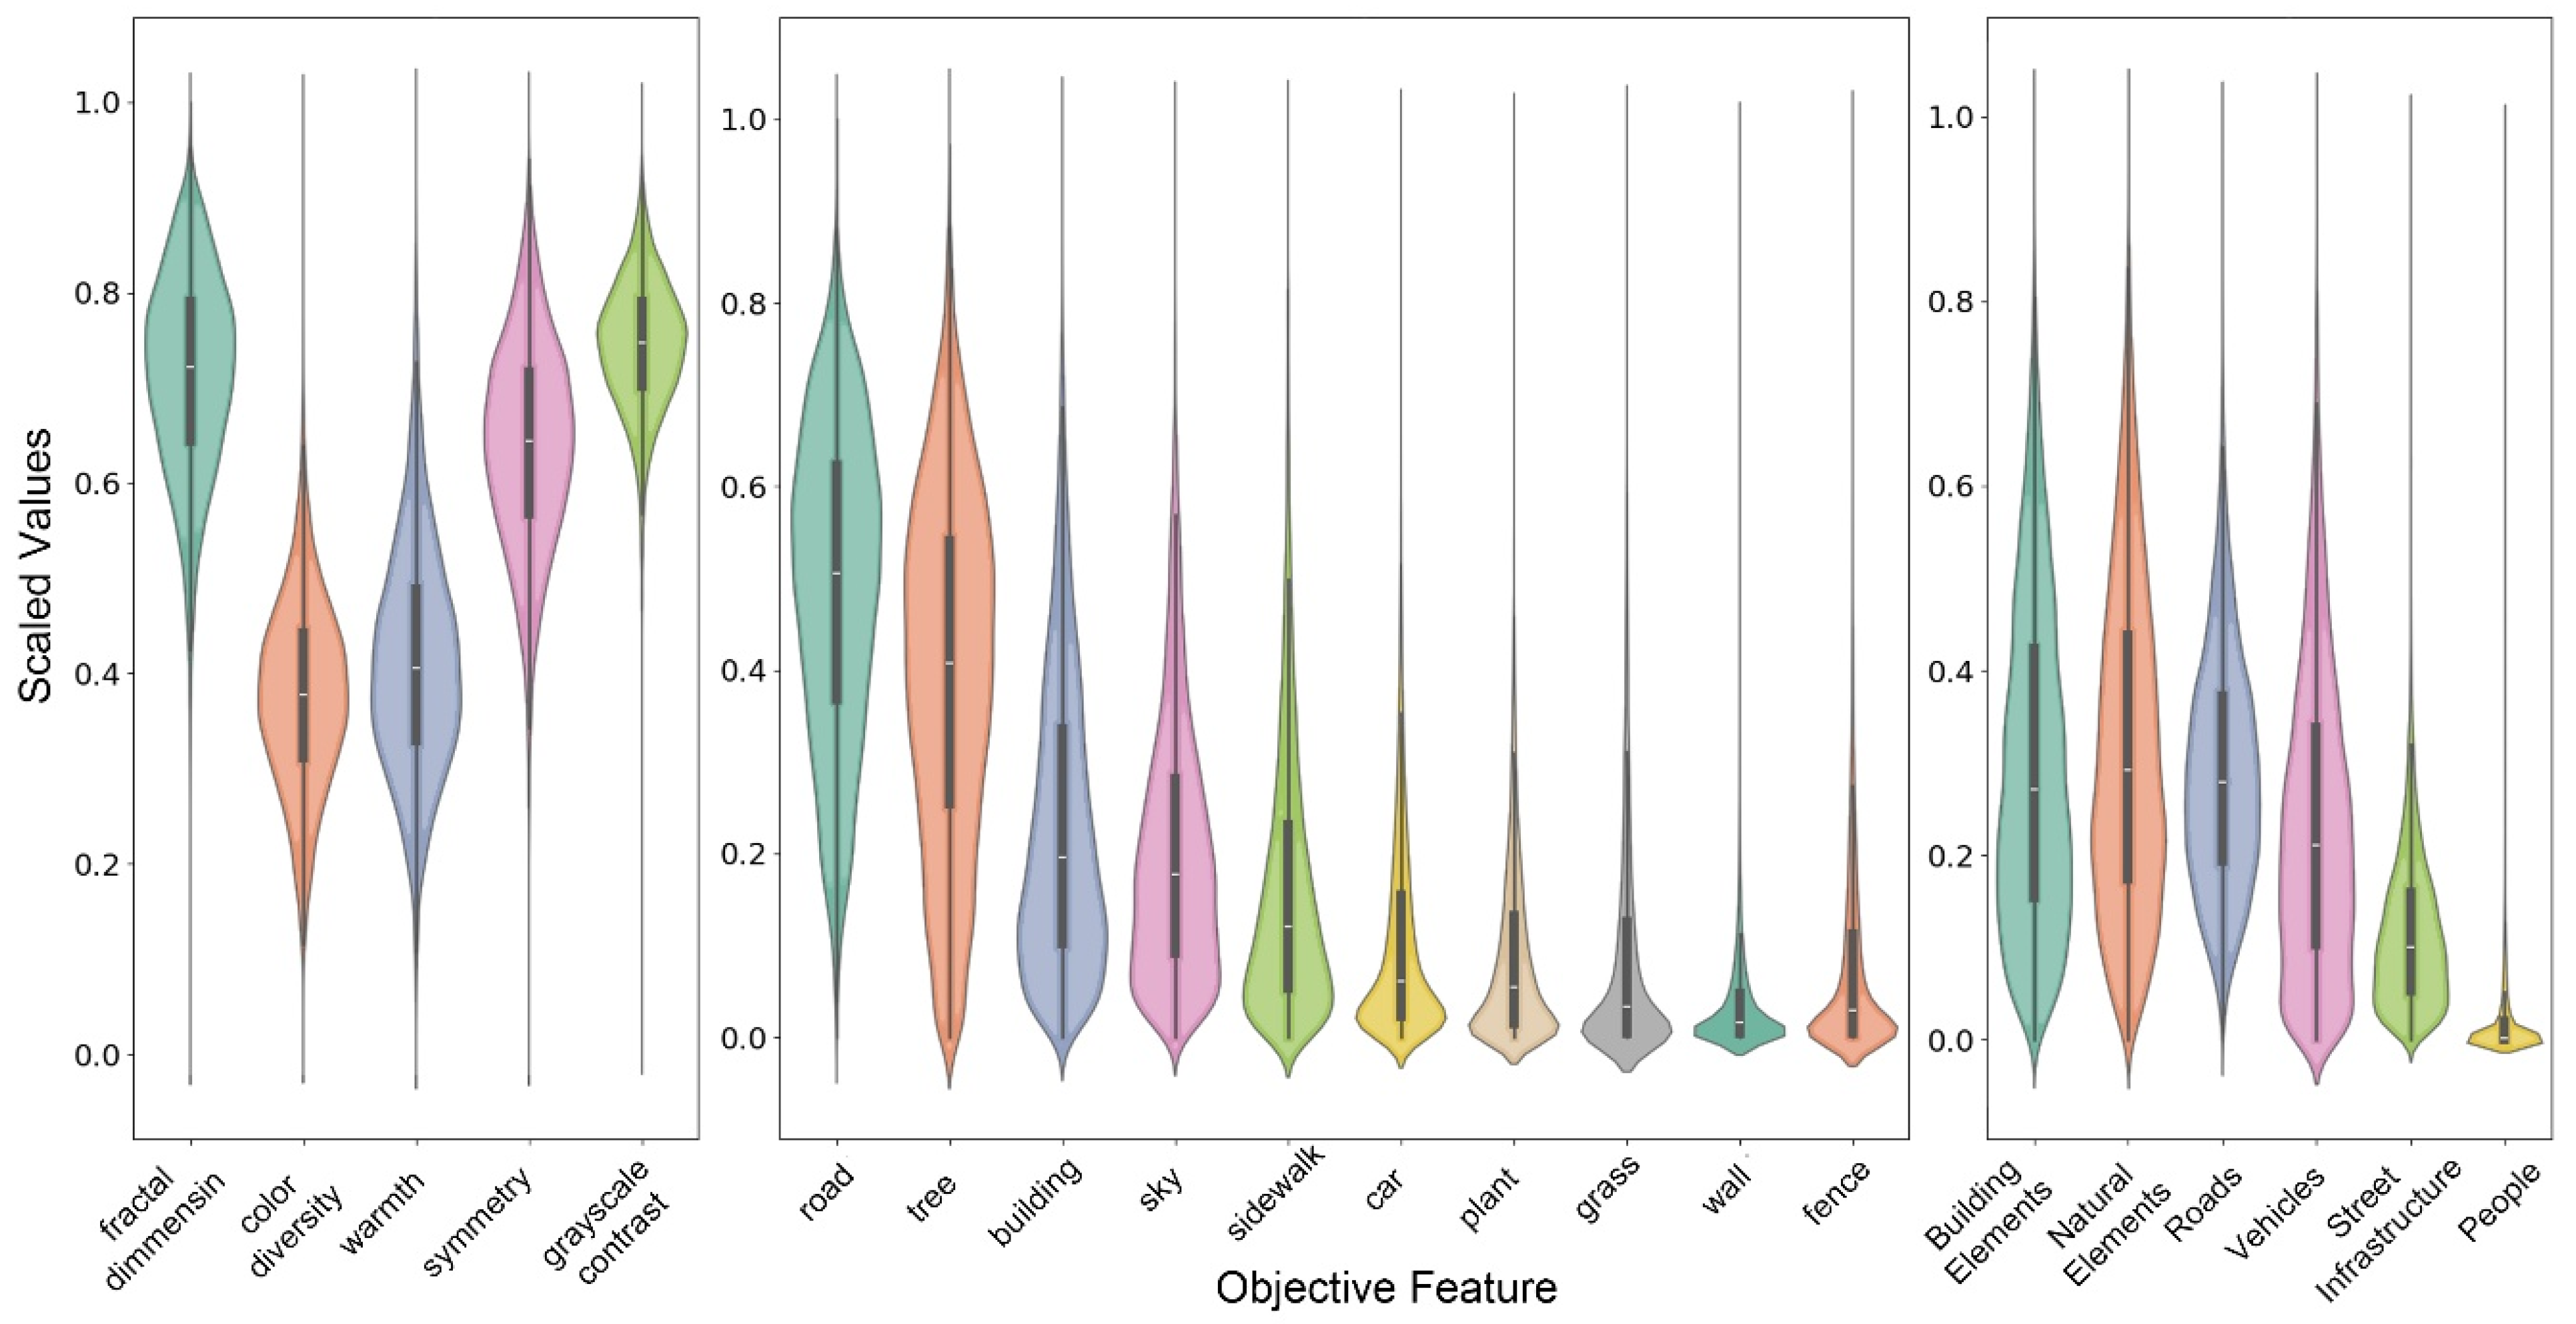
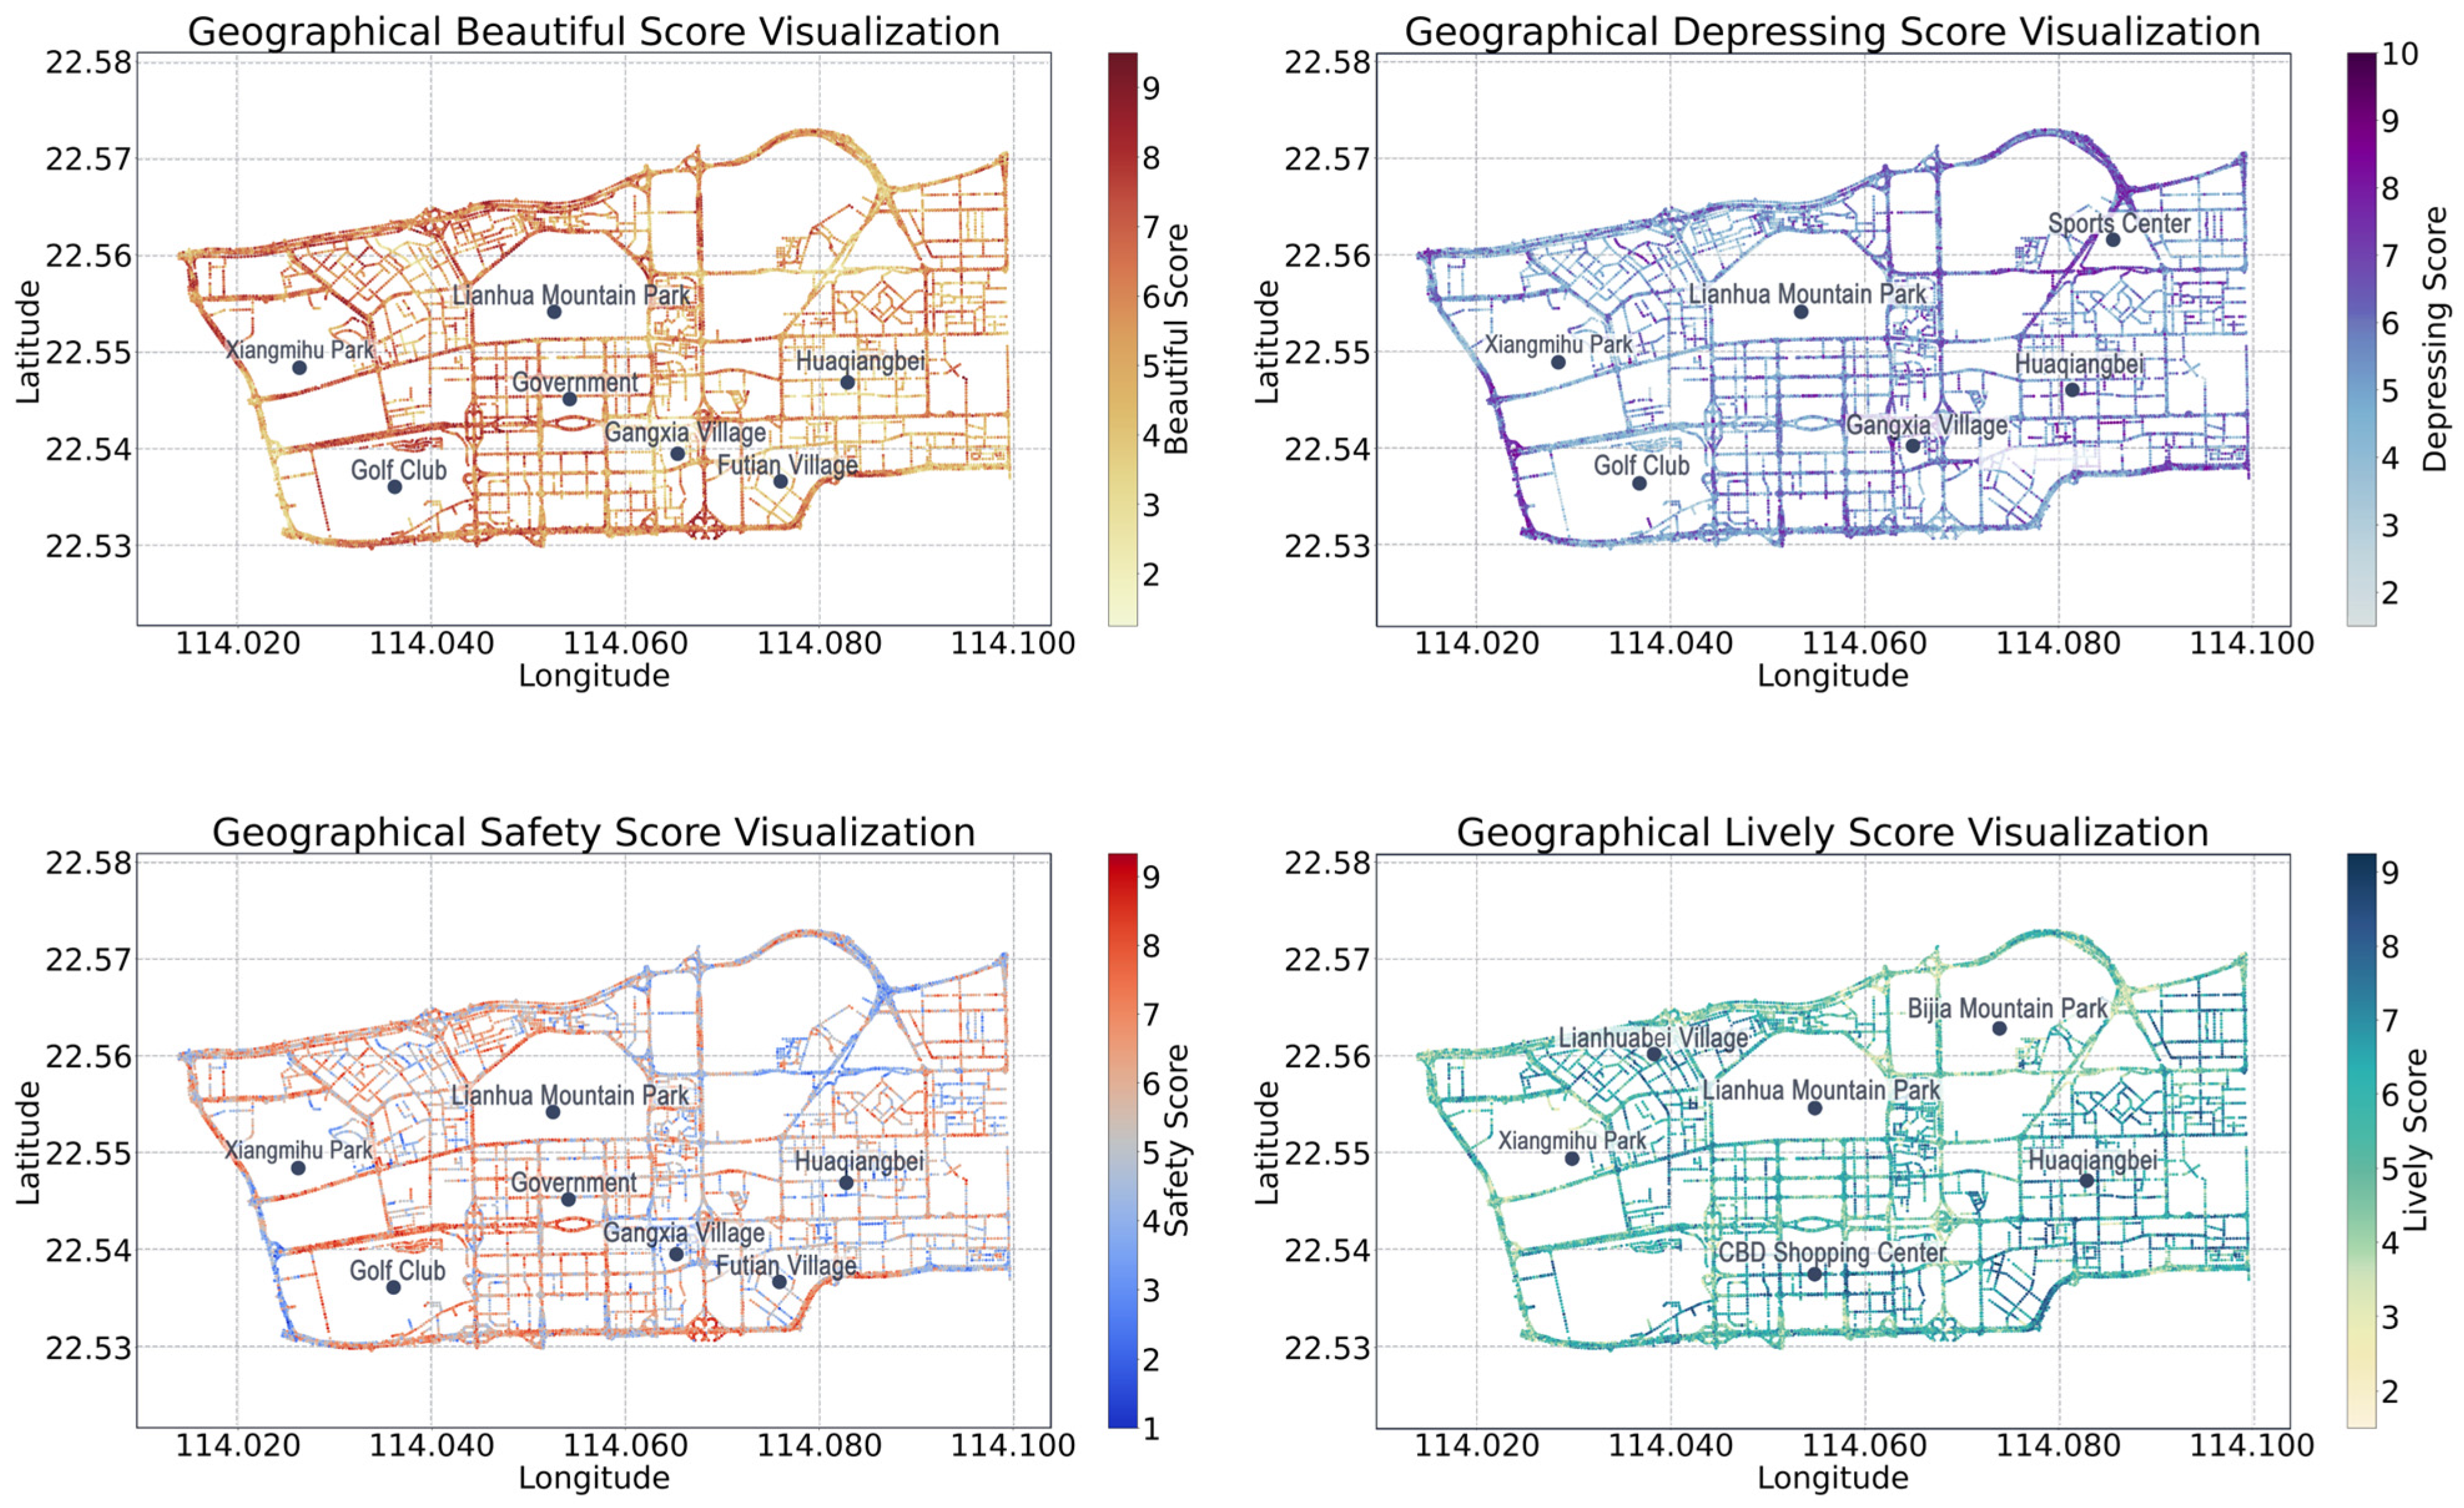
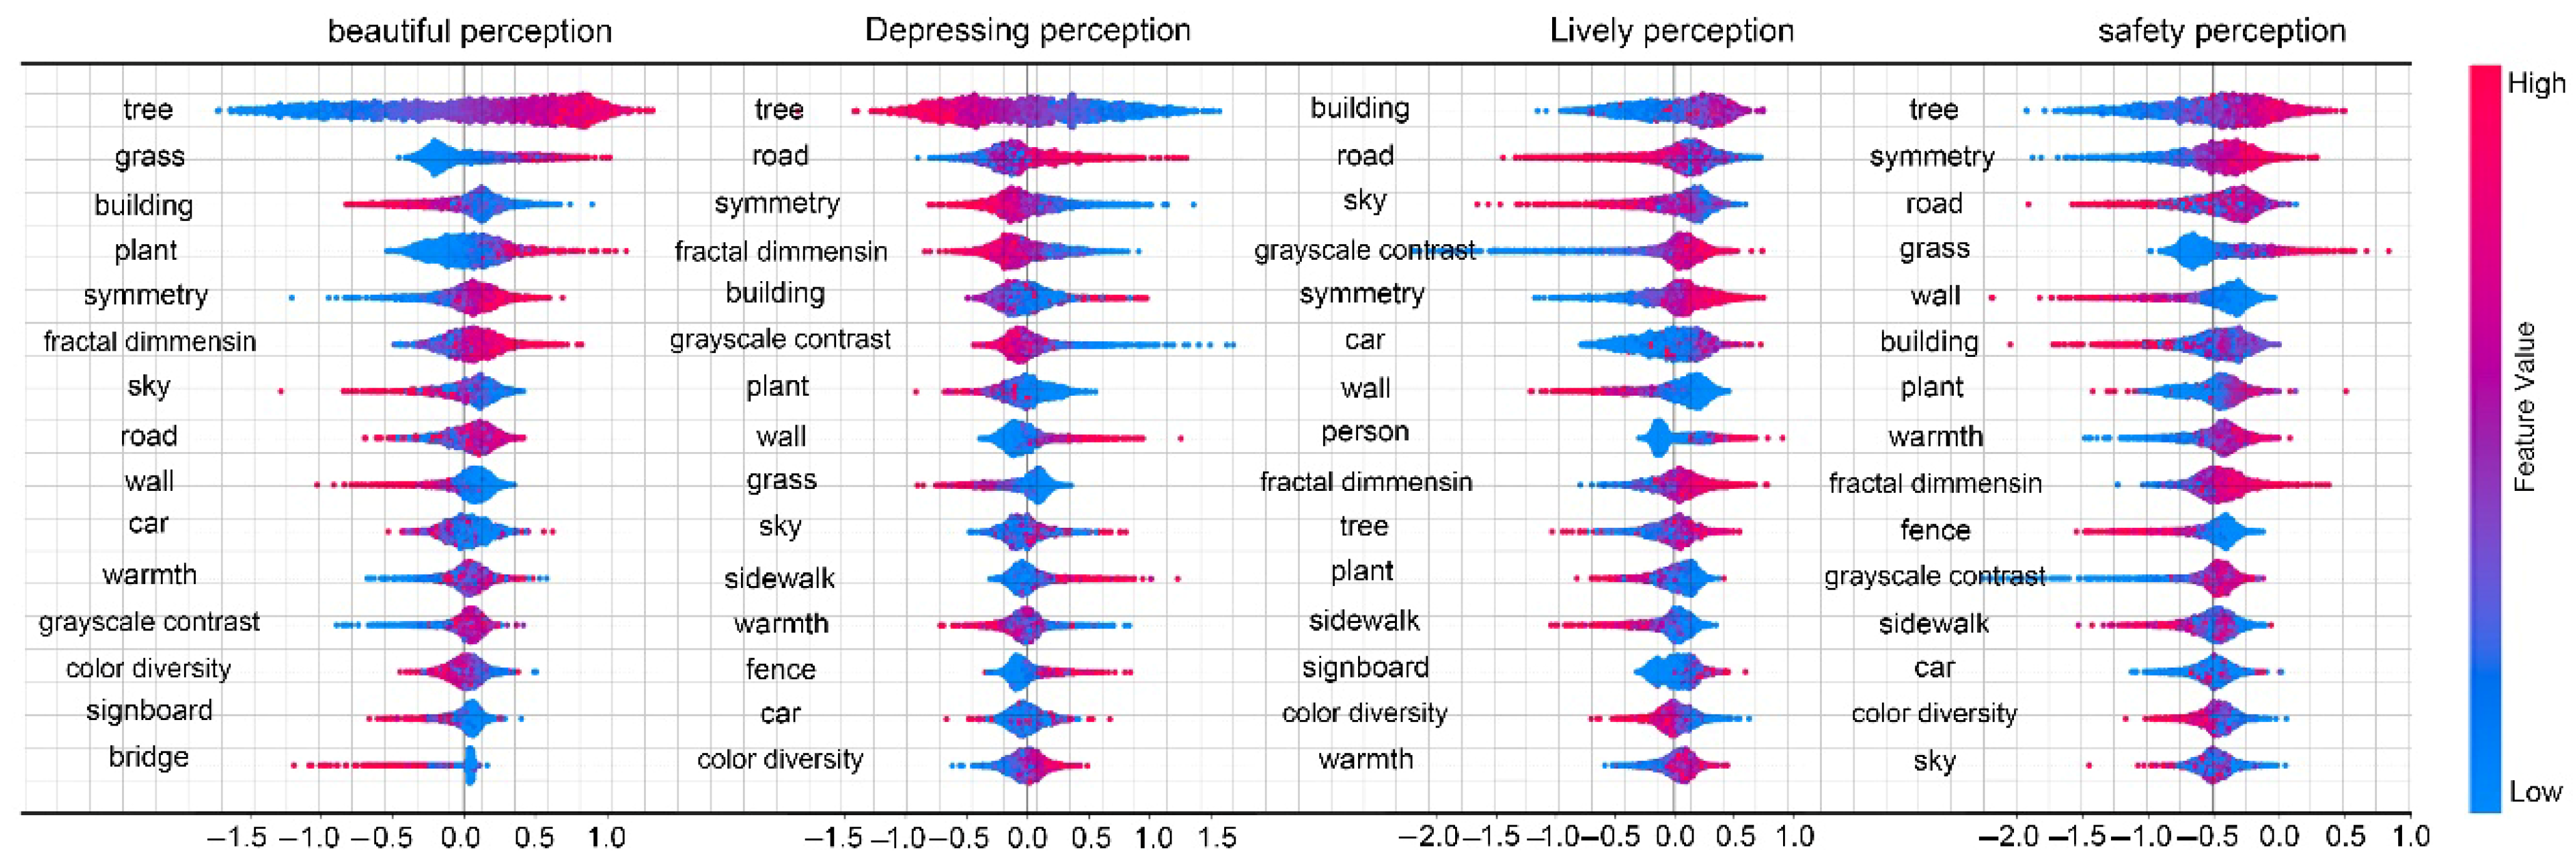
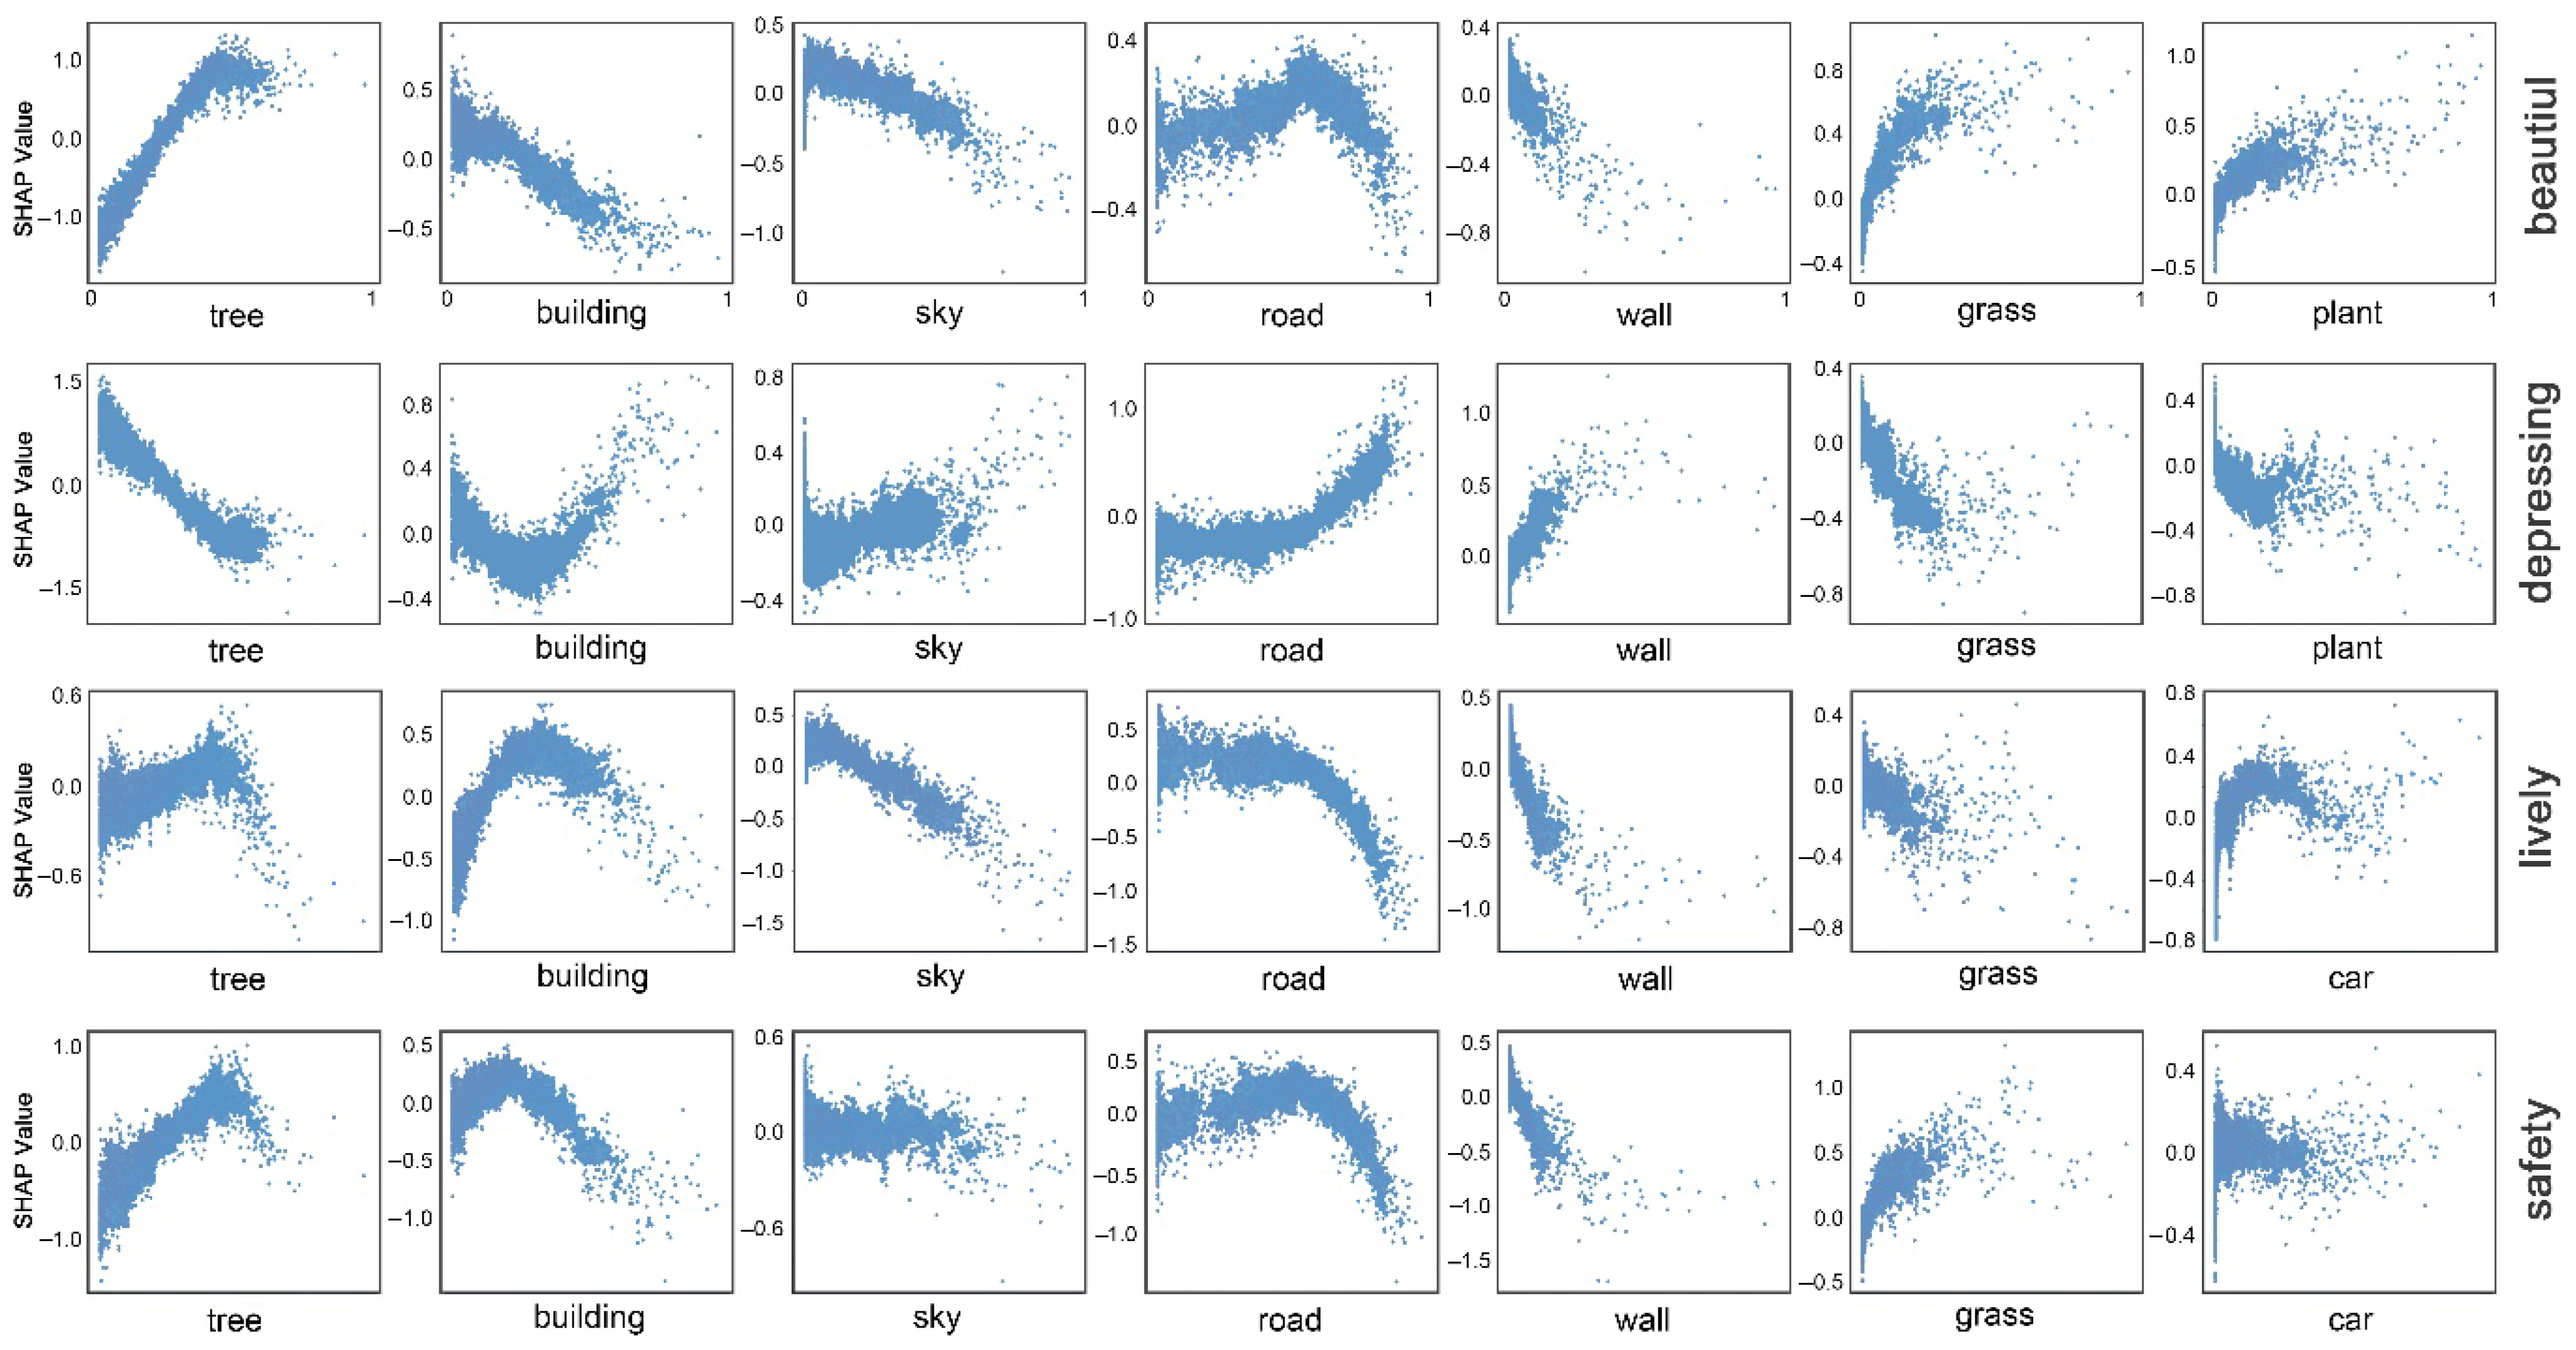
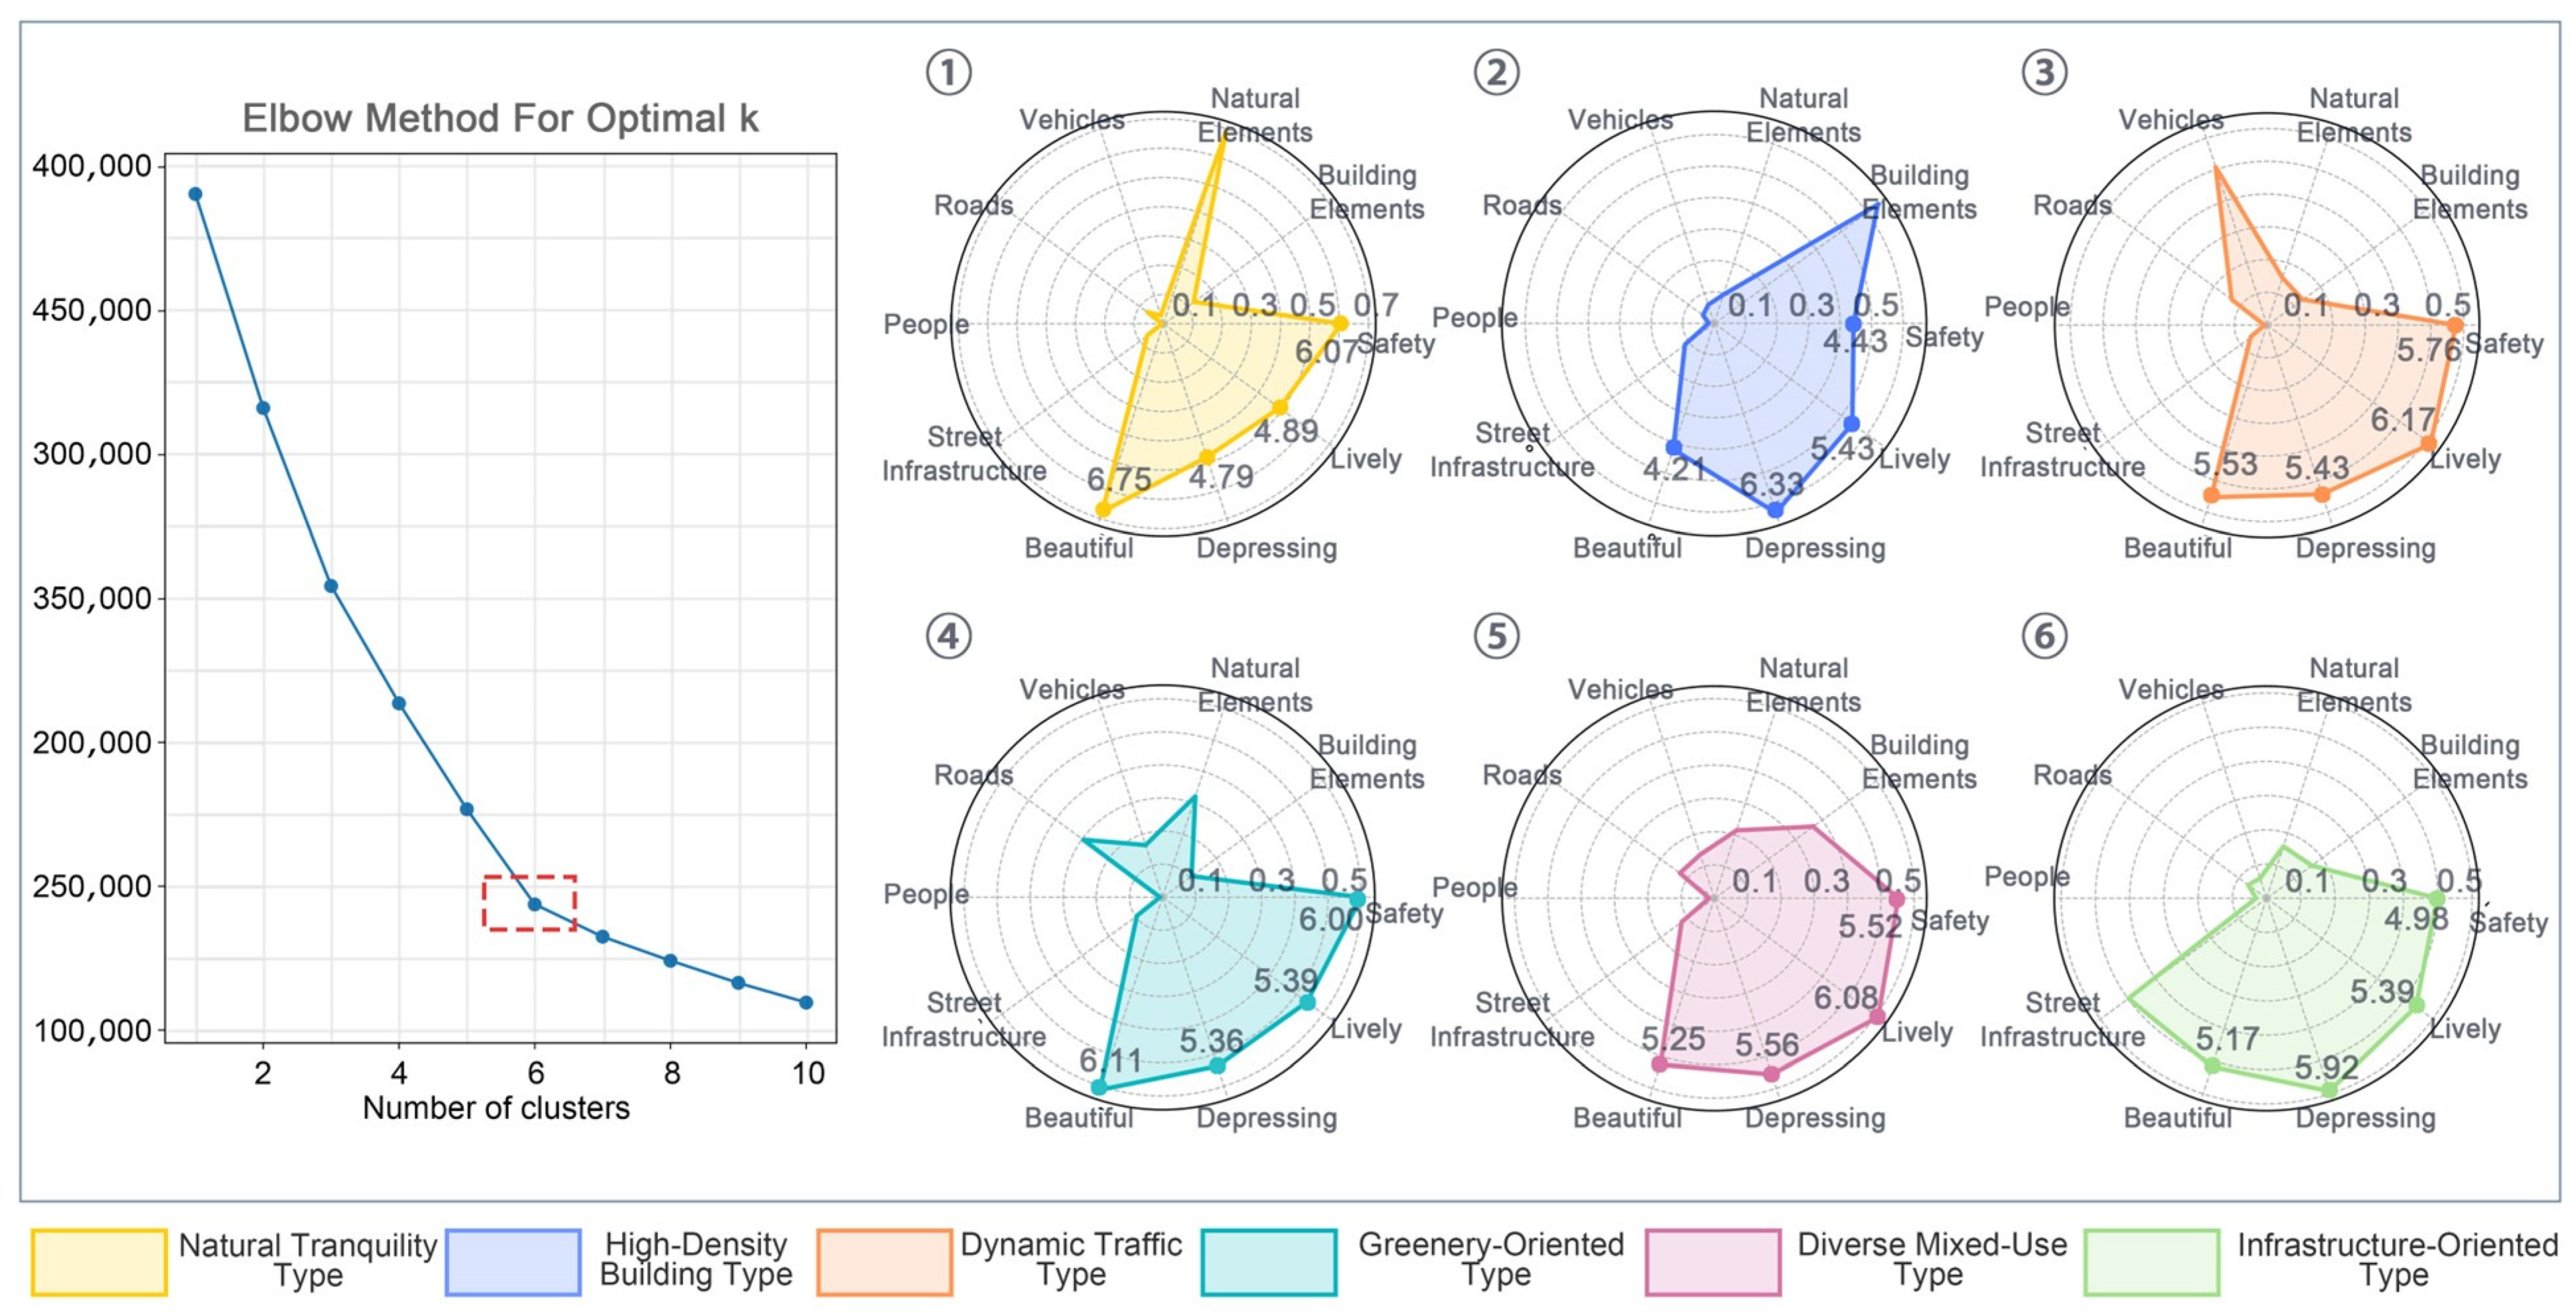
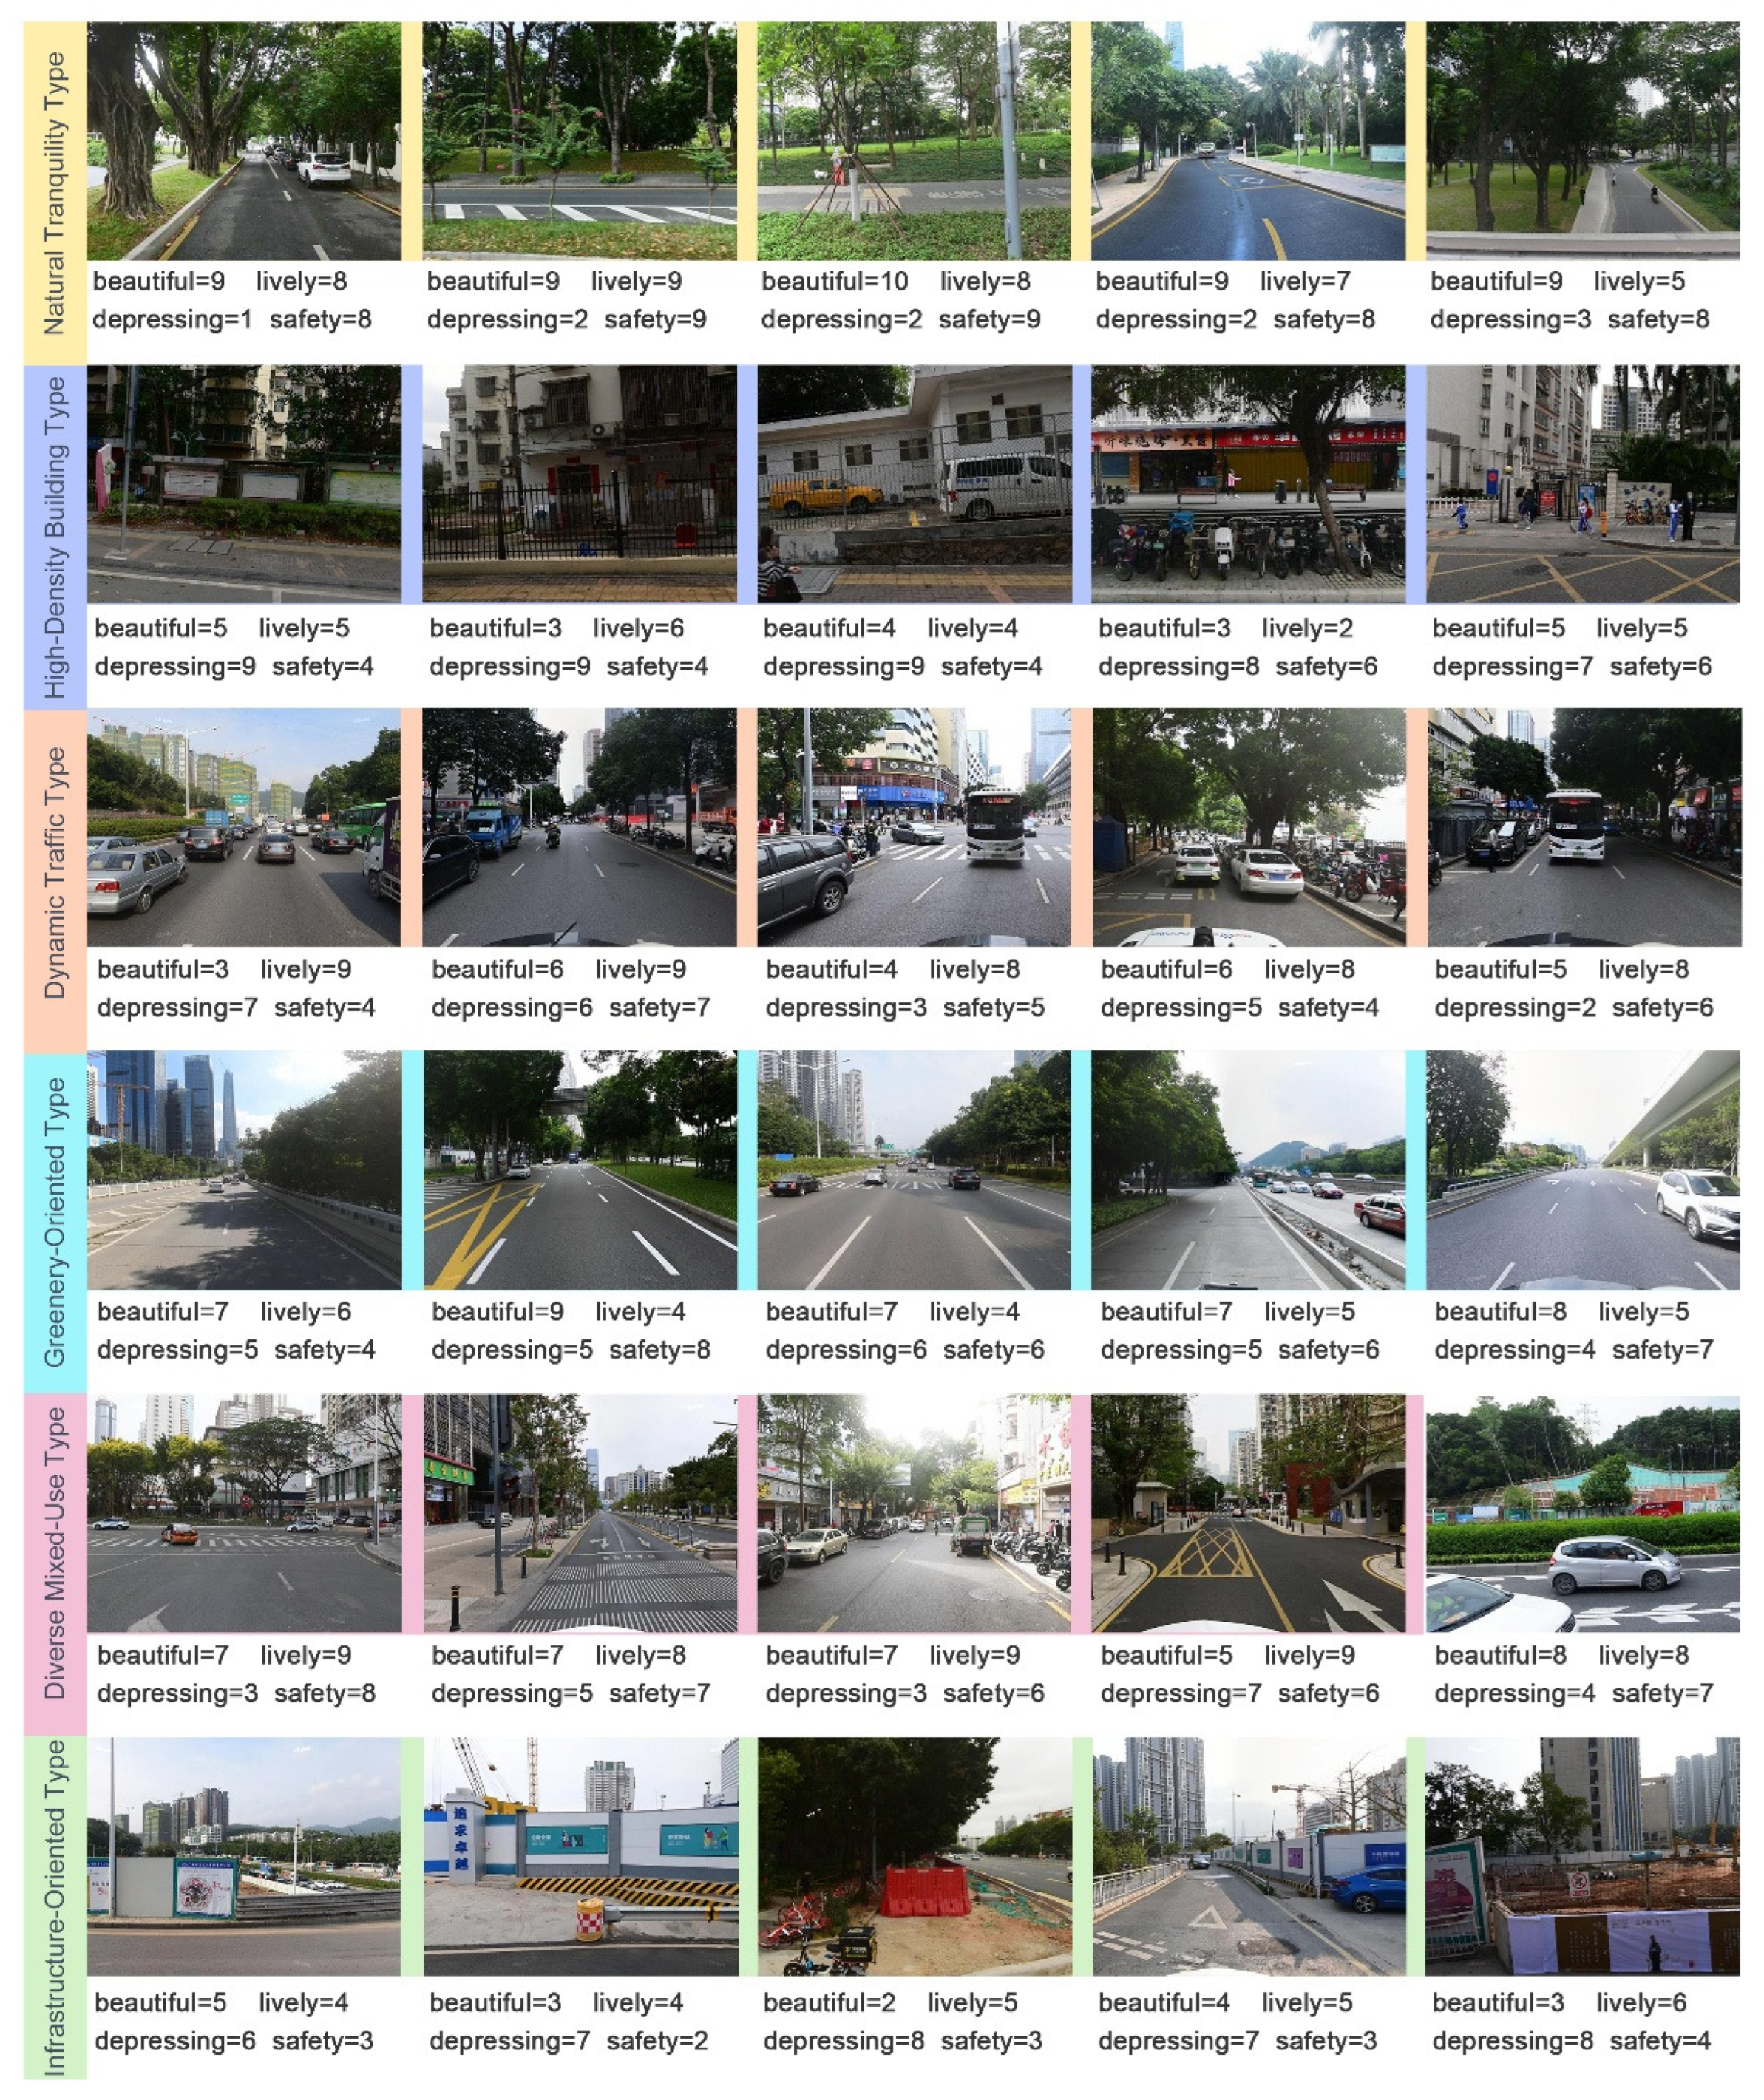
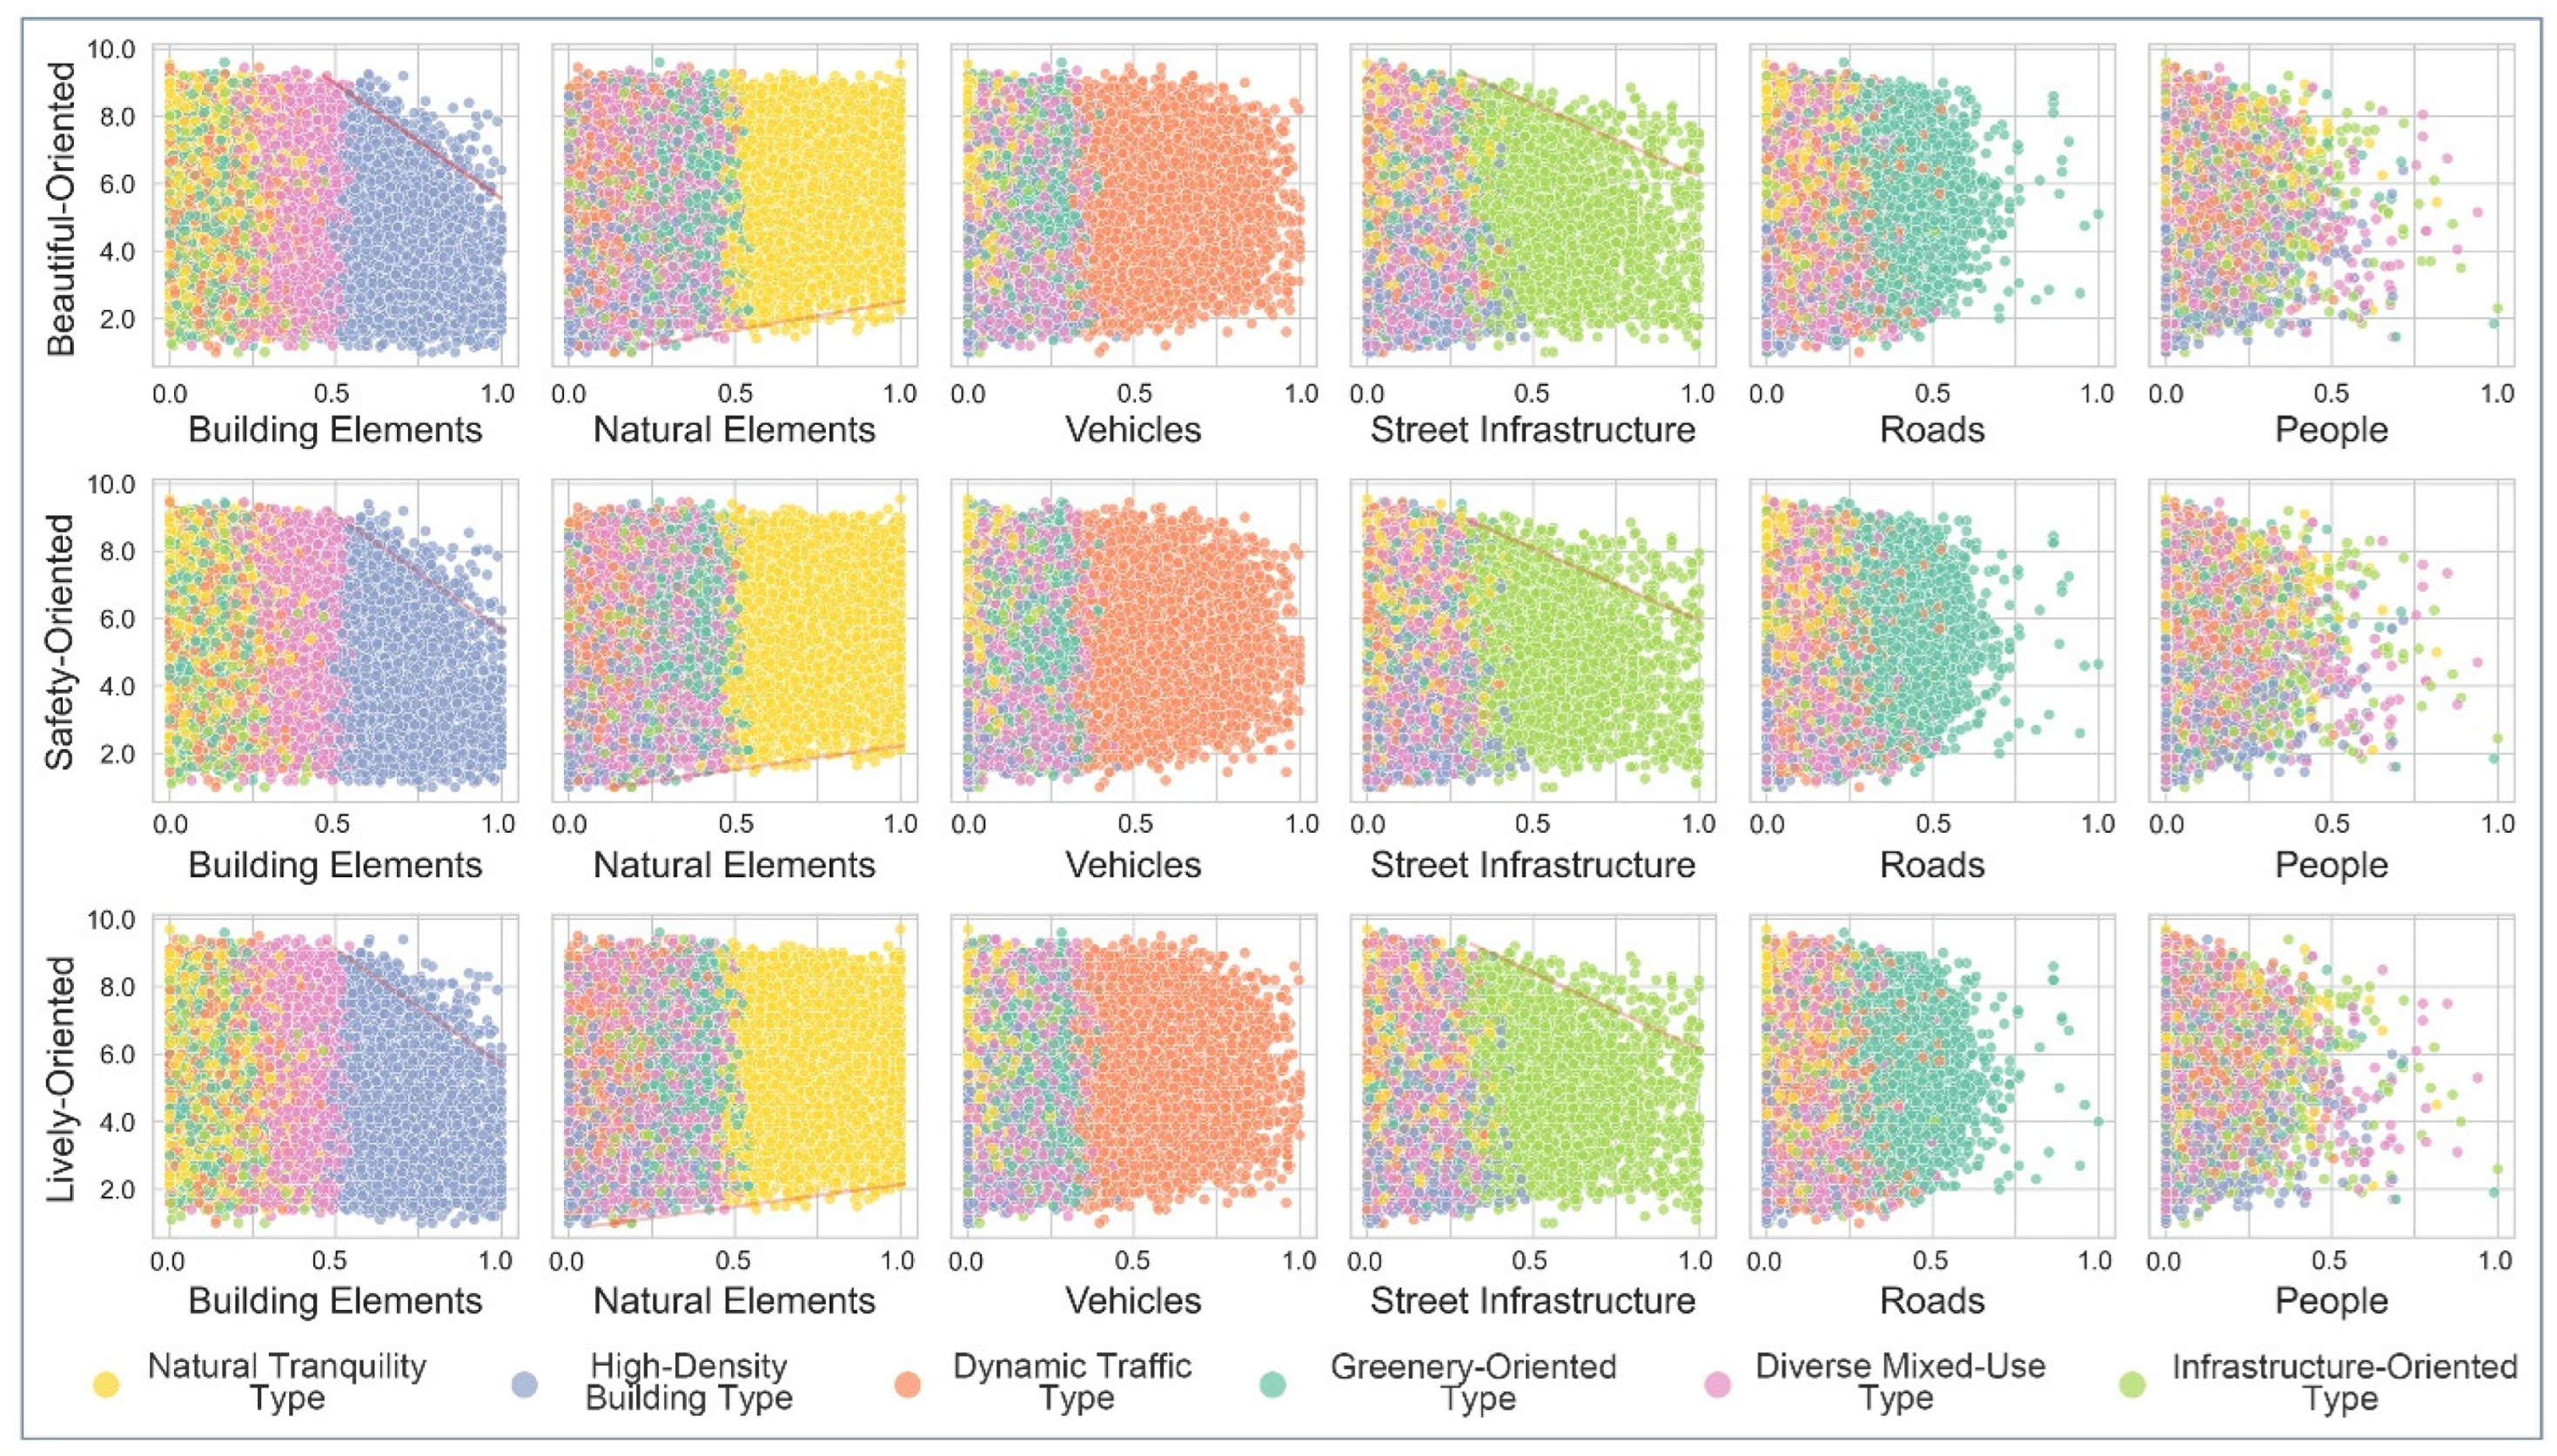
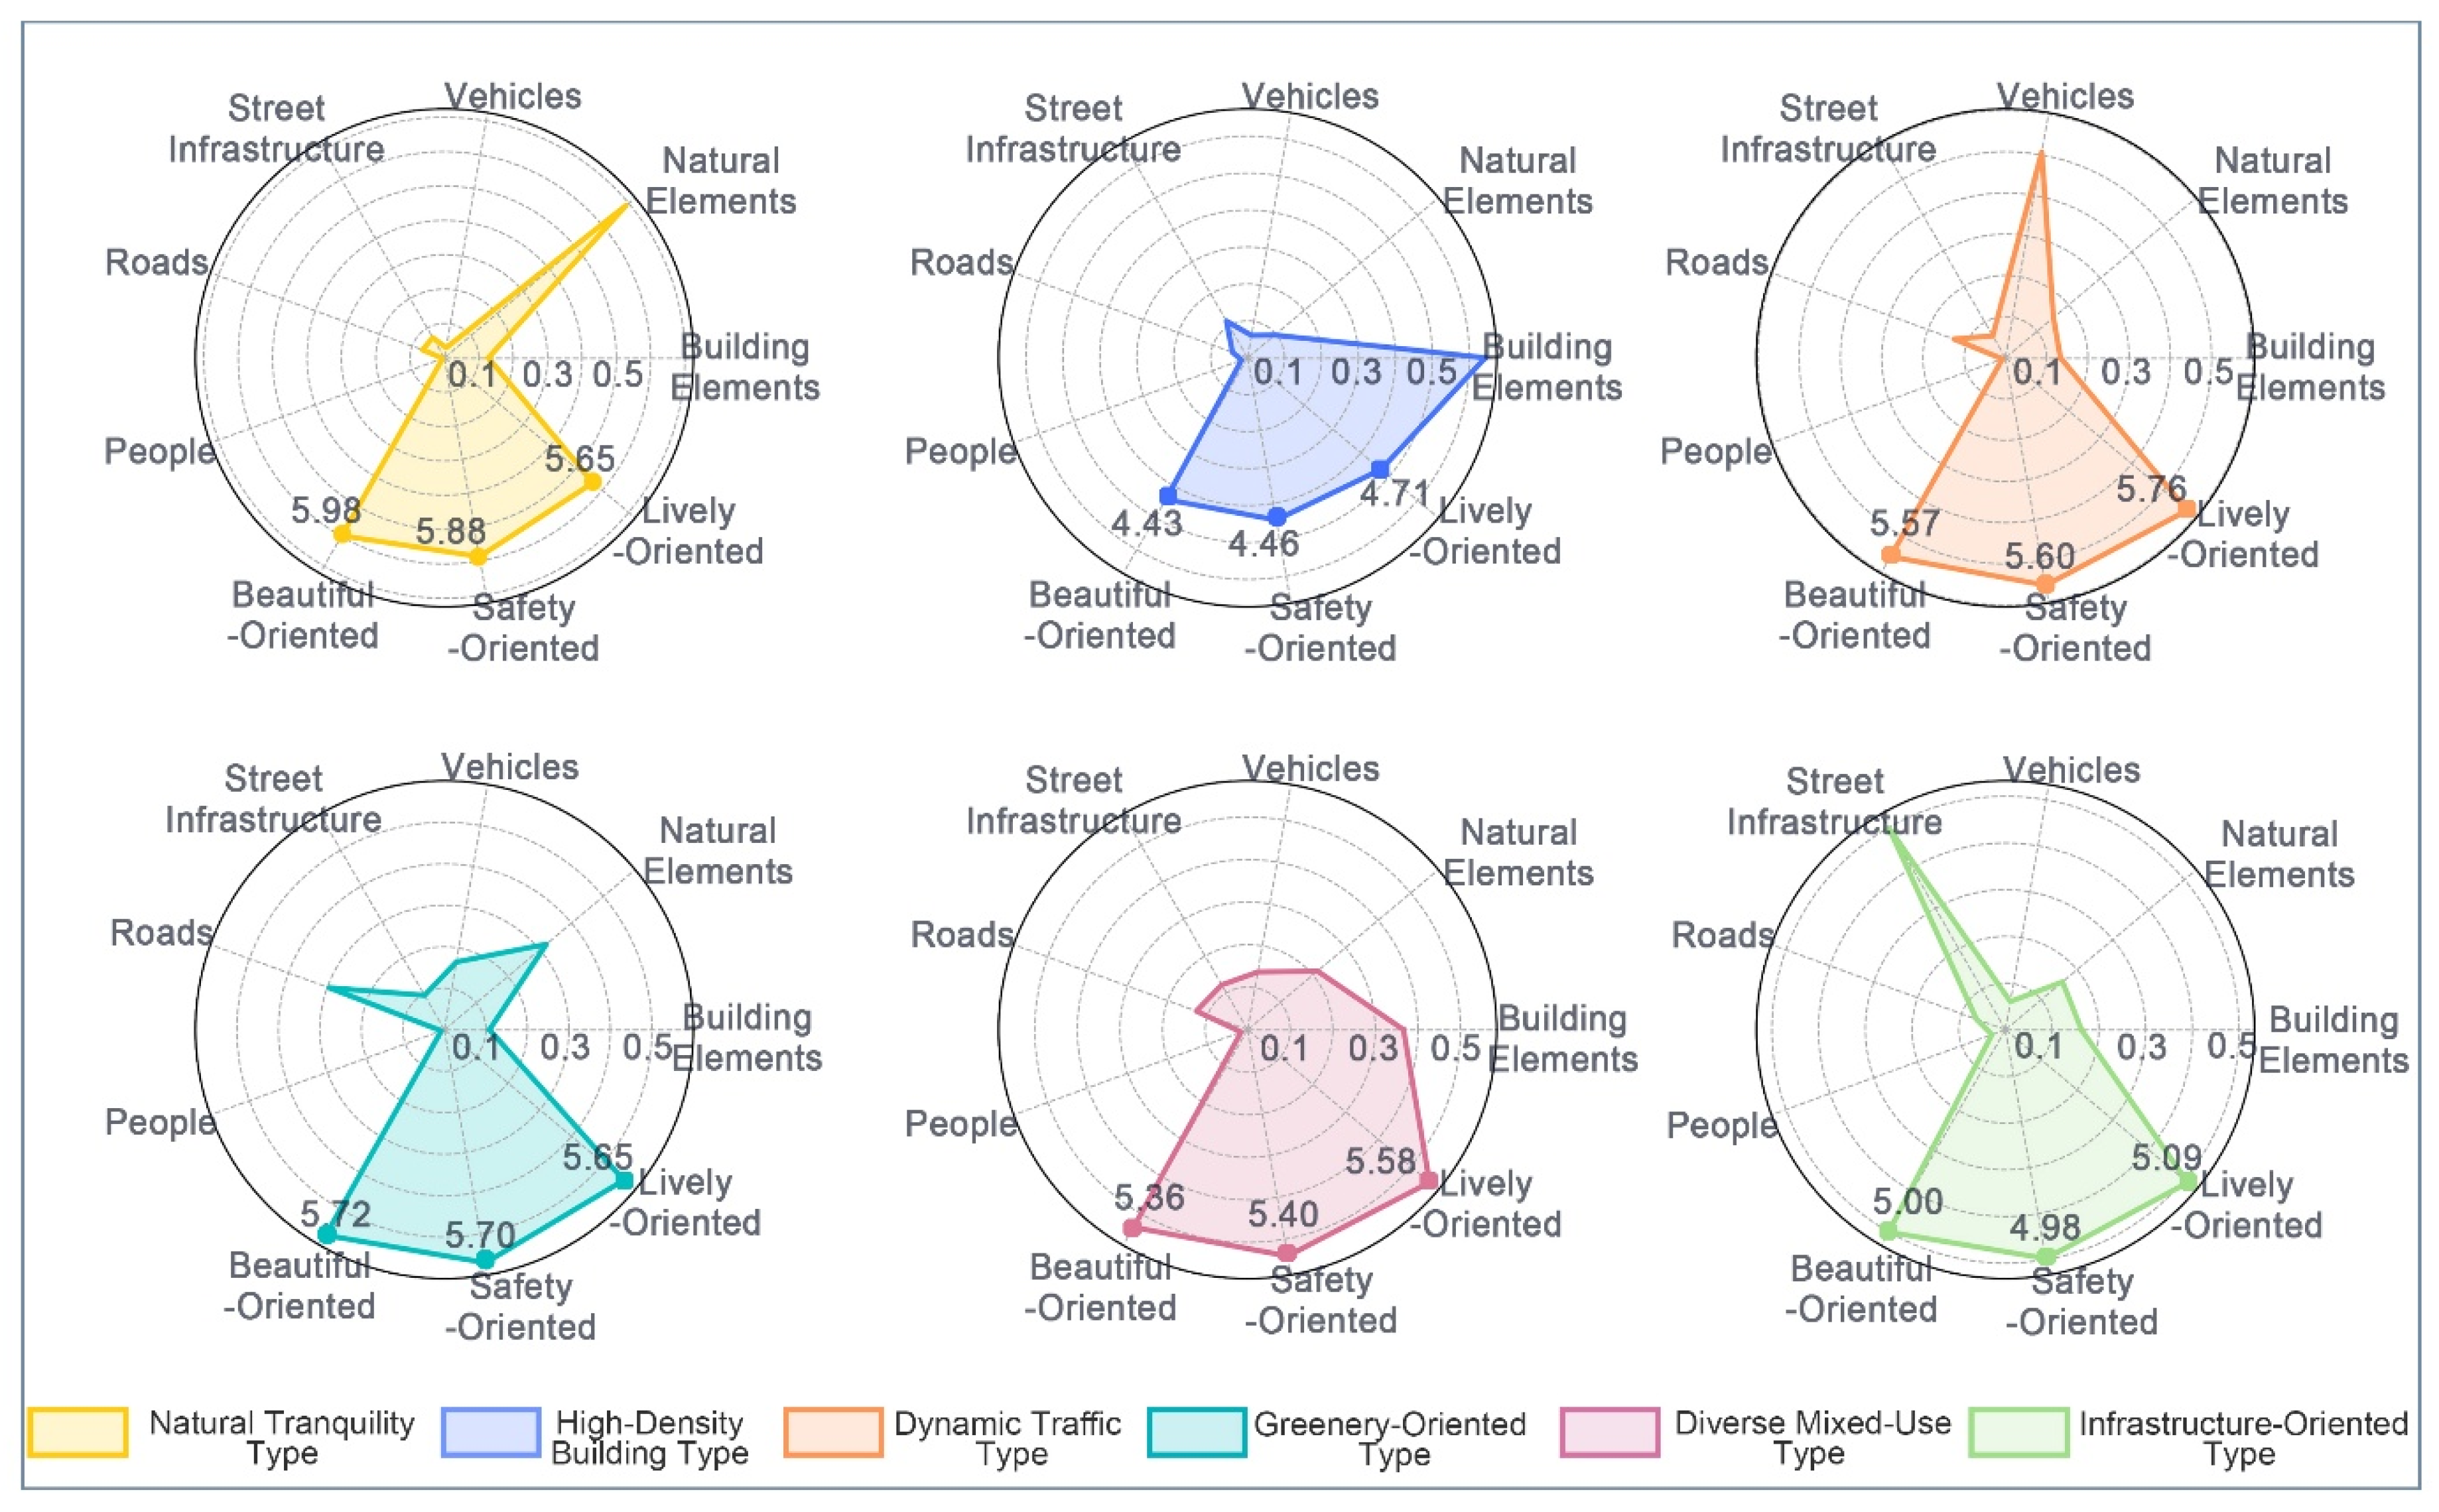
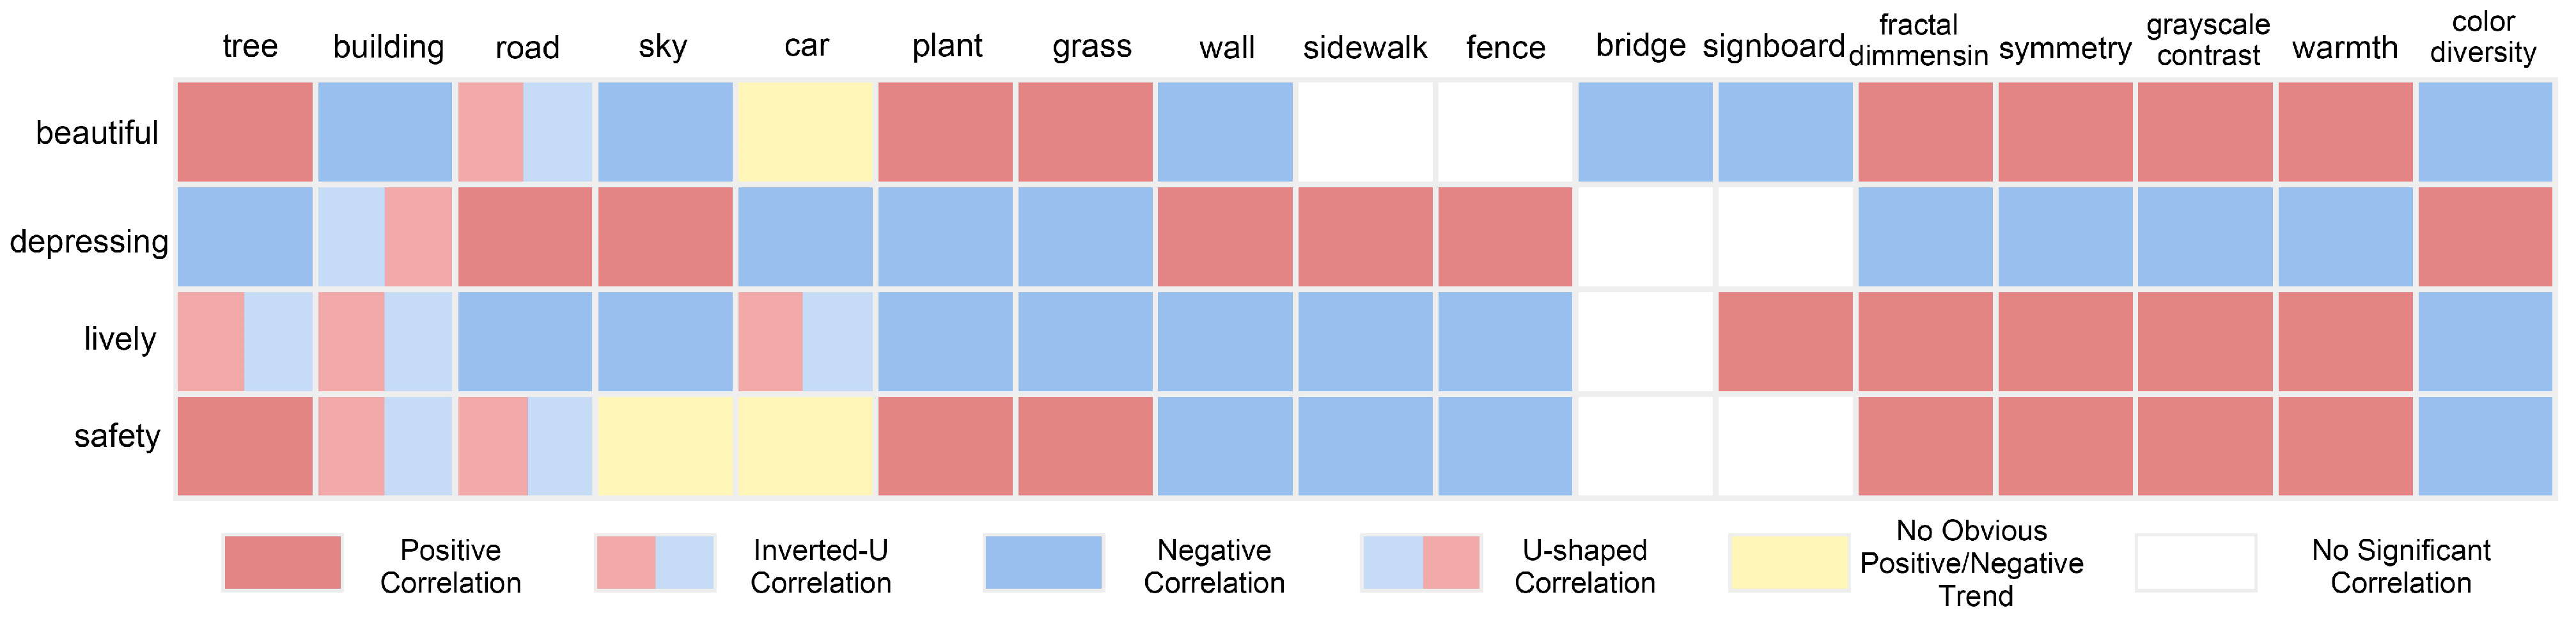
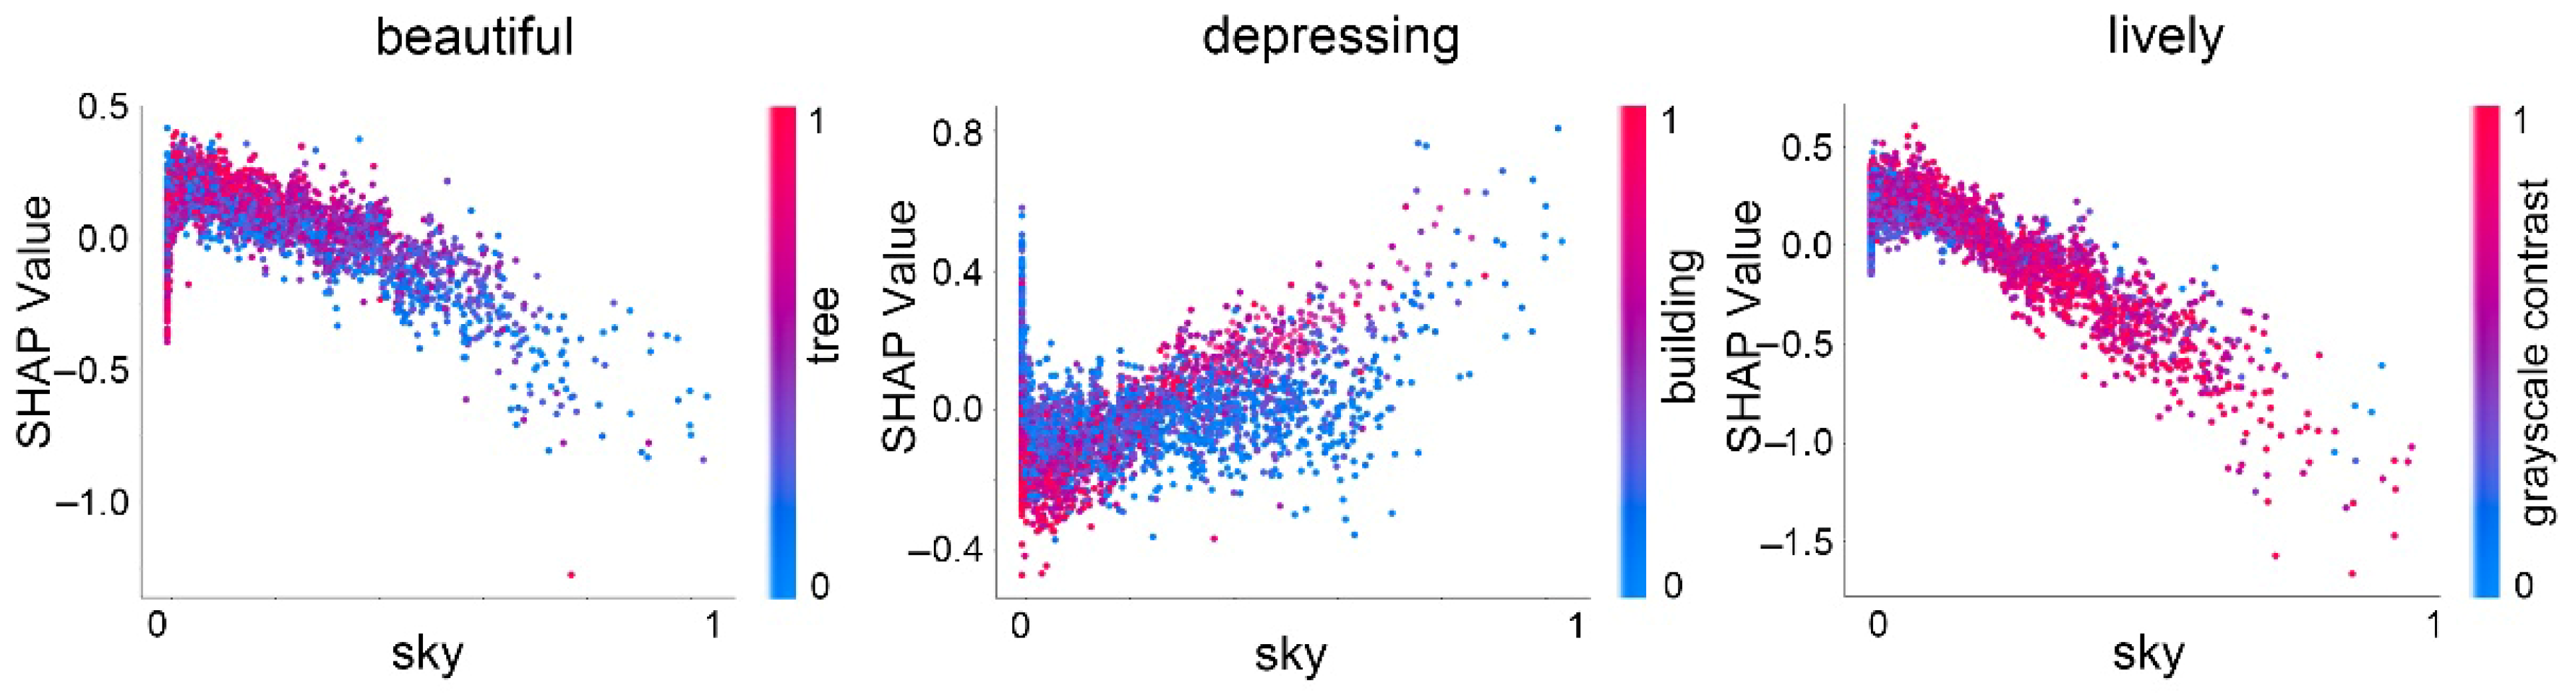
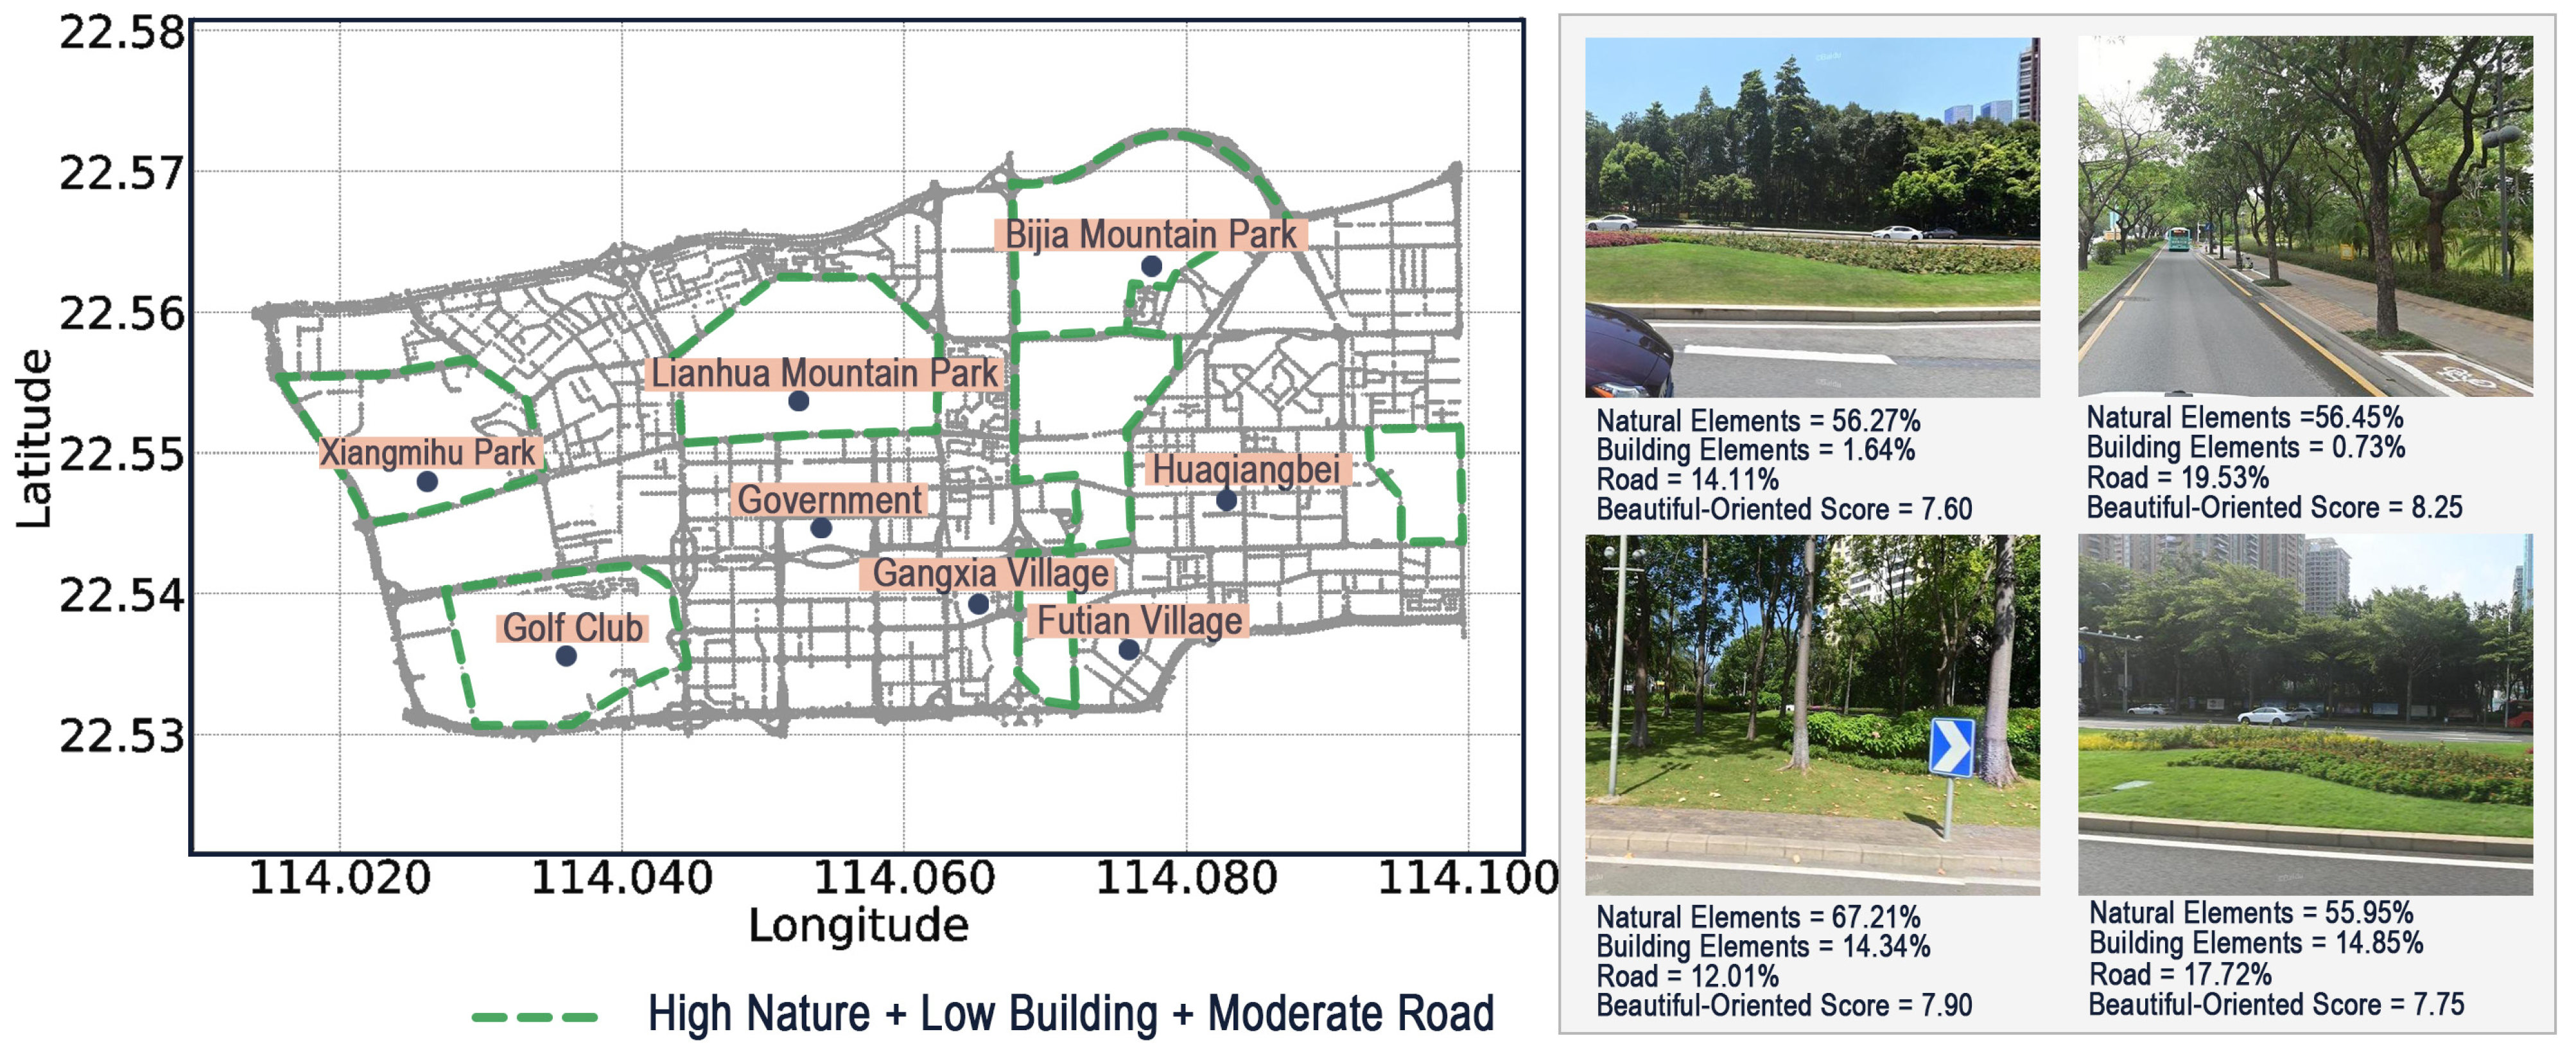
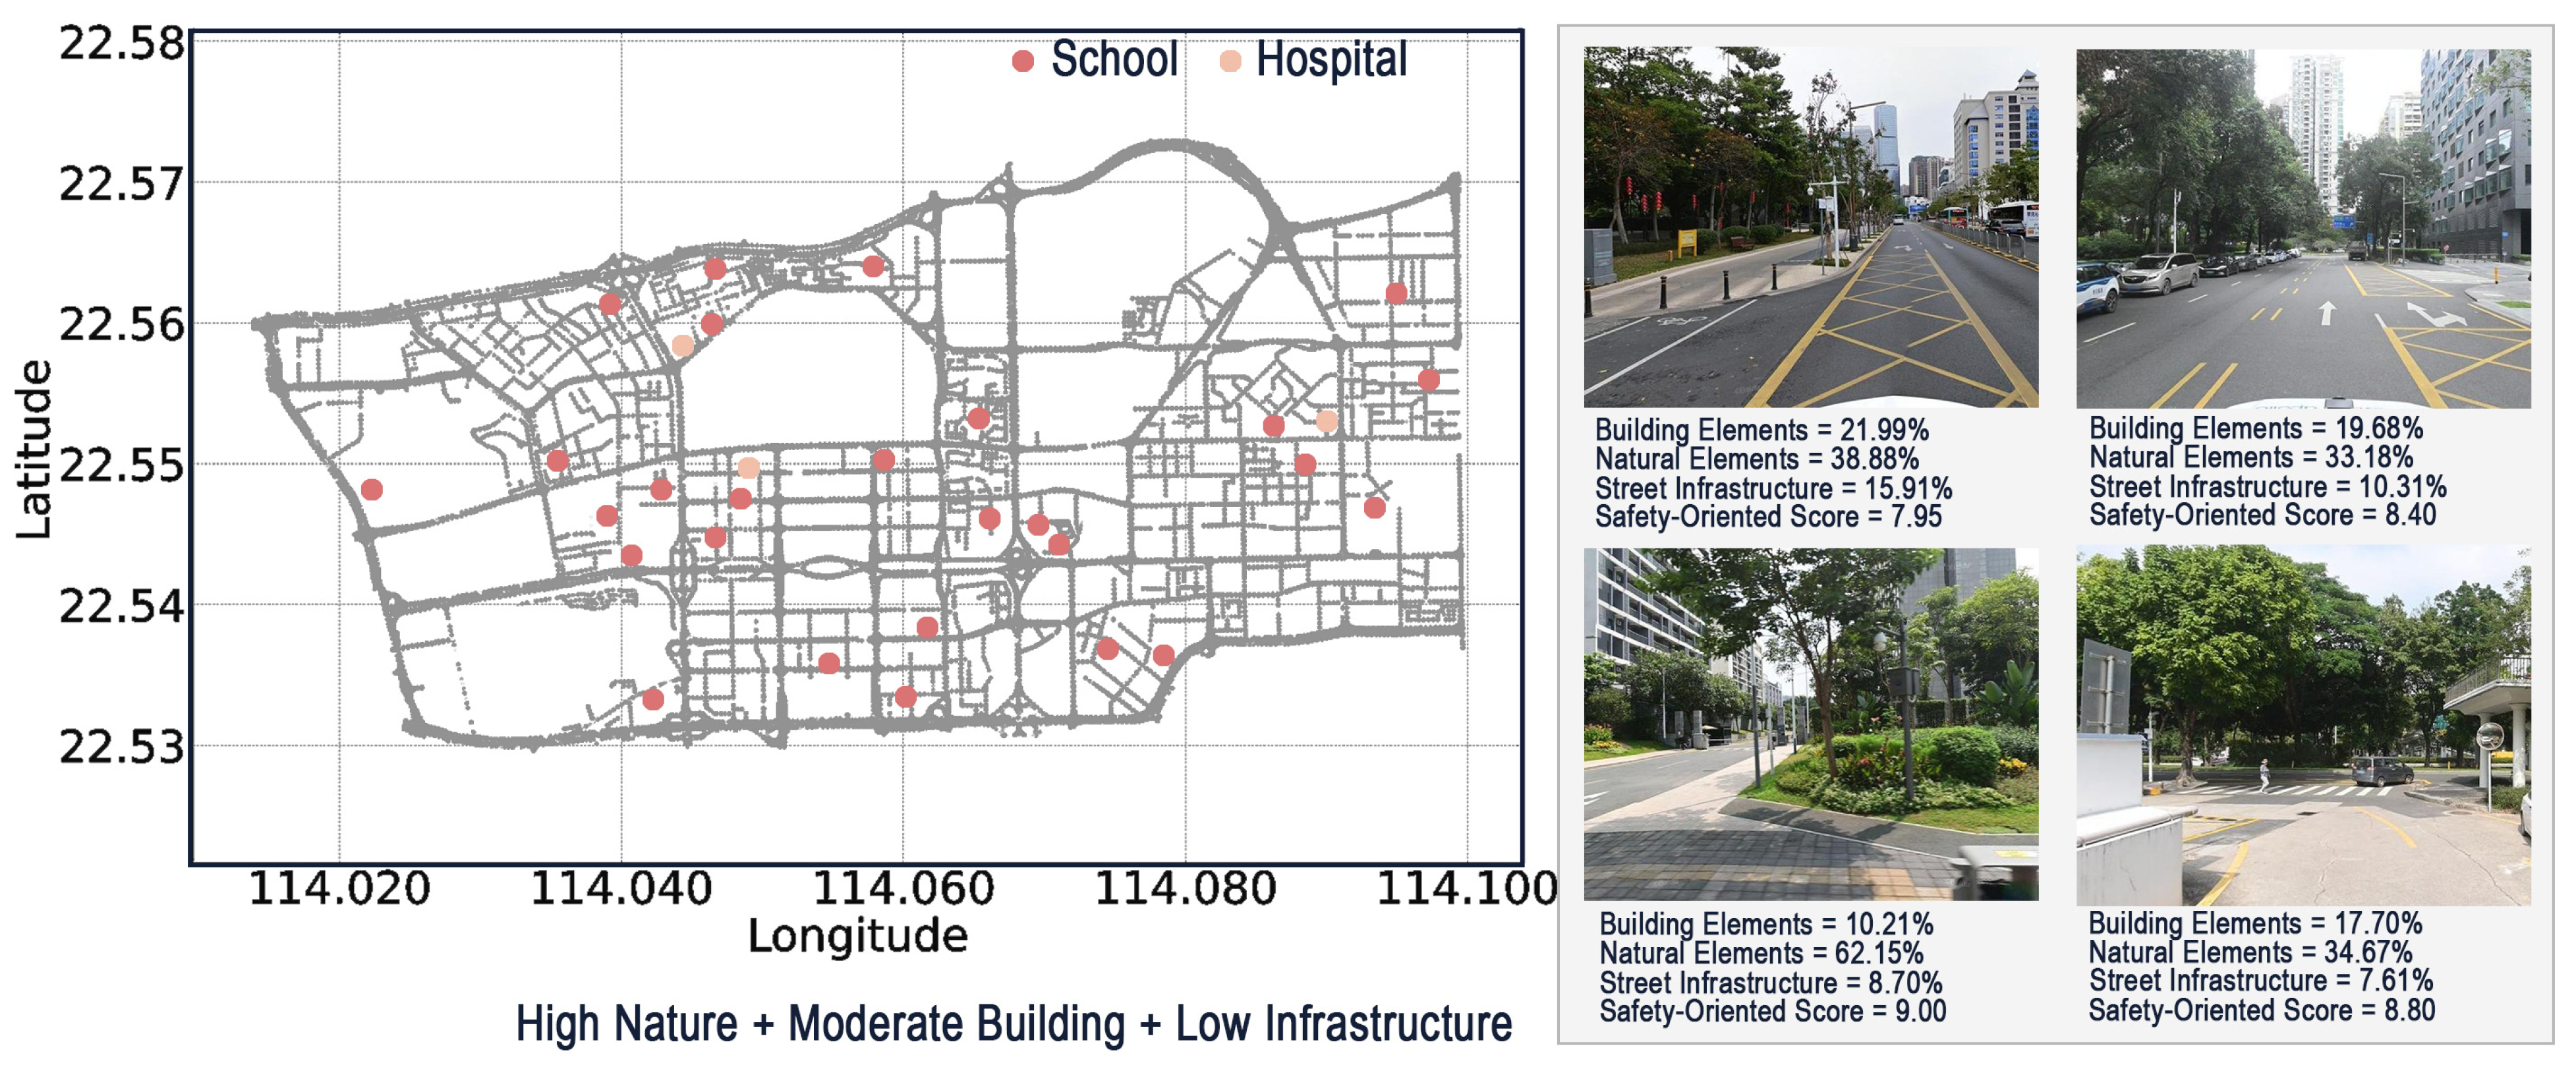
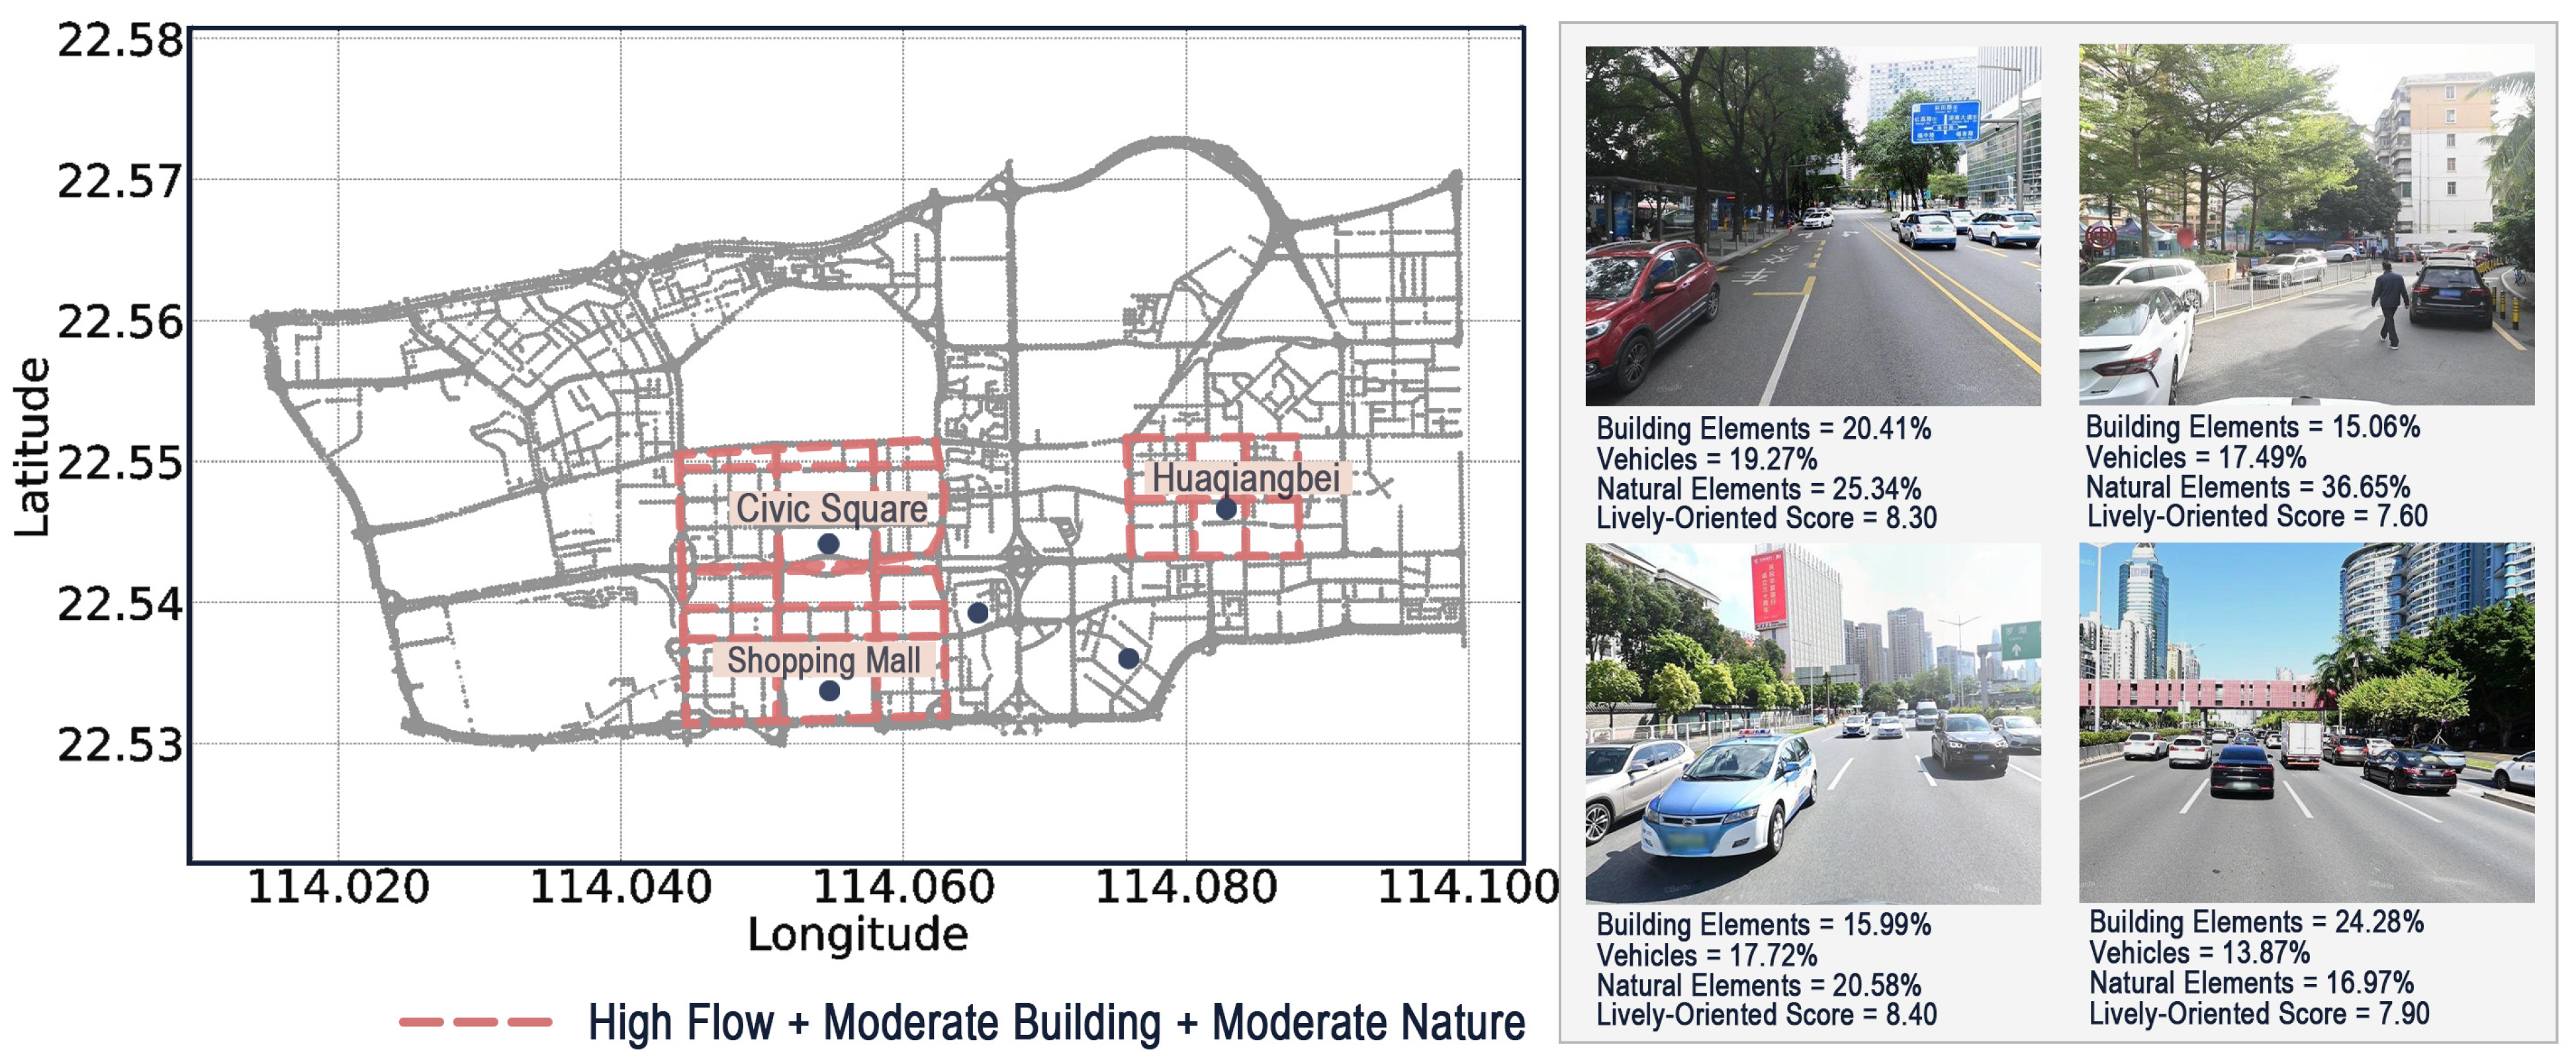
Disclaimer/Publisher’s Note: The statements, opinions and data contained in all publications are solely those of the individual author(s) and contributor(s) and not of MDPI and/or the editor(s). MDPI and/or the editor(s) disclaim responsibility for any injury to people or property resulting from any ideas, methods, instructions or products referred to in the content. |
© 2025 by the authors. Licensee MDPI, Basel, Switzerland. This article is an open access article distributed under the terms and conditions of the Creative Commons Attribution (CC BY) license (https://creativecommons.org/licenses/by/4.0/).