Article

Assessment of Farm Vulnerability to Climate Change in Southern France

by
Abderraouf Zaatra
1,2,
Mélanie Requier-Desjardins
1,3,*,
Hélène Rey-Valette
2,4,
Thierry Blayac
2,4 and
Hatem Belhouchette
1,5
1
CIHEAM-IAMM, Univ Montpellier, 34090 Montpellier, France
2
University of Montpellier, 34960 Montpellier, France
3
SENS, Univ Montpellier, CIRAD, IRD, Univ Paul Valery Montpellier 3, 34960 Montpellier, France
4
CEE-M, Univ Montpellier, CNRS, INRAE, Institut Agro, 34960 Montpellier, France
5
ABSys, Univ Montpellier, CIHEAM-IAMM, CIRAD, INRAE, Institut Agro, 34090 Montpellier, France
*
Author to whom correspondence should be addressed.
Land 2025, 14(7), 1388; https://doi.org/10.3390/land14071388
Submission received: 13 May 2025 / Revised: 20 June 2025 / Accepted: 24 June 2025 / Published: 1 July 2025

Abstract

Climate change (CC) is a major threat to agriculture, the sector that supports the territorial economy in the Pays Haut Languedoc et Vignoble (PHLV) region (south France). In this region, farms have been facing the negative effects of CC for several decades. The implementation of agriculture adaptation policies requires a coherent and integrated tool that mobilizes approaches for territorial development, vulnerability assessments, and feasibility. The purpose of this research is to provide a multi-criteria assessment of farm vulnerability to CC in the PHLV region. An index of farm vulnerability was developed based on the classic model of vulnerability, which is the product of exposure and sensitivity divided by adaptive capacity. This assessment was conducted at the farm level, by combining biophysical variables (such as soil type and irrigation) and socioeconomic variables (such as agricultural experience and crop insurance), selected based on a literature review and interviews with local stakeholders and local experts. To solve the weighting problem, we differentiated between a “calculated vulnerability”, without any specific weighting of the vulnerability variables, and a “declared vulnerability” that integrates the scores assigned to the importance of each variable for each farmer surveyed, based on their awareness. Afterward, a discriminant analysis was used to identify the factors that determine the vulnerability classes. Our results show that (i) the majority of the surveyed farms have a relatively high vulnerability index, but wine farms and cereal farms are the most vulnerable; (ii) for all farms the “declared vulnerability” is lower than the “calculated vulnerability”, showing that farmers underestimate their vulnerability; (iii) there is an interesting link between the low level of vulnerability and the adaptation efforts already made over the past ten years by certain farms that have changed or introduced crops and improved their agricultural practices.

Graphical Abstract

1. Introduction

At the local level, CC can cause severe disruption to the functioning of societies and ecosystems, resulting in significant human, material, economic, or environmental losses and impacts that exceed the systems’ capacity to cope with them using their own resources [1,2,3]. It affects territories in different ways based on their specific context related to the geography, local socioeconomic conditions, and historical aspects [4] and amplifies disparities between poor and rich territories [5,6]. It is therefore important to adopt a contextual approach to CC [4]. In this way, the CLIMATOR project has provided robust and representative local data on the impacts of CC in France on local agro-ecosystems. Various studies have highlighted the importance of integrating these data into territorial development policies and developing specific multidisciplinary research [6,7,8].
The effects of CC are expected to impact the entirety of functions and operations of the agricultural sector. The main effects are predicted to affect production quantity and quality, increased crop diseases and pests, and modifications to biophysical conditions, such as soil and water quality and quantity, etc. Beyond the sectoral effects, these transformations are also regarded as impacting the ecosystem services provided by agriculture mainly in terms of the biodiversity, landscape, and others [9,10,11,12,13,14]. Although the agricultural sector is recognized as particularly vulnerable to the effects of CC [15,16,17,18], territorial public policies are yet oriented towards energy-based approaches in terms of energy saving or establishing territorial energy autonomy (e.g., PCAET: Territorial Climate-Air-Energy Plan) [19,20]. The main focus is on mitigating without compromising the need to adapt measures for the agricultural sector and rural territories [21,22,23,24]. Indeed, the main advanced options for agriculture and the rural territories usually relate to the production of renewable energy from biomass and energy crops, as well as to monitoring and intensifying carbon sequestration [22,25,26,27]. Faced with these challenges, studying adaptation measures for agriculture, especially for vulnerable farms, remains a major difficulty for local authorities and societies. This challenge requires an integrated approach involving territorial development, vulnerability assessments, and the feasibility and acceptability of adaptation measures.
The growing CC awareness and its potential impacts on the agricultural sector have been increasingly encouraging scientists to focus on vulnerability studies and adaptation measures. The majority of these publication focus on exploring vulnerability with a wide range of approaches [28,29,30,31,32,33,34,35,36,37,38]. Two concepts of vulnerability have been developed by the IPCC [39,40]. The main objective of the first concept is to calculate and provide information on the level of vulnerabilities in countries and regions, while in the second concept, vulnerability is a primary factor in climate risk.
Identifying particularly vulnerable farms provides crucial information for agricultural and territorial stakeholders to understand and address processes in order to improve agriculture’s ability to adapt [41]. The importance of stakeholder engagement and awareness-raising requires an understanding of how well farmers know the vulnerability of their farms (or even their broader territory) and the contributing factors [41,42,43,44,45,46]. Some approaches have explored these aspects using sociological or economic approaches, particularly focusing on risk perception [47,48,49]. As a result, specific frameworks related to adaptation perceptions have been developed [41,44,50,51,52], some of which argue that integrating perceptions is necessary due to their significant impact on behavior [43,53,54]. Asrat and Simane (2018) and Deressa et al. (2009) [42,55] point out that farm adaptation involves two crucial phases: the first being the perception of risks and the second being the choice to implement adaptation measures. Indeed, incentives for adaptation are closely linked to how risks (more generally, vulnerability) are perceived [41,45,53], which are a crucial factor in farmers’ involvement in adaptation actions [41], to avoid any obstacles that may be caused by a lack of awareness or, more generally, constraints on innovation [42,46,56].
Farms’ vulnerability levels have a direct impact on adaptation choices, and taking into account farmers’ perceptions can improve vulnerability assessments by considering cognitive biases. Recognizing these interactions is an innovative way to enhance public decision-making. In this study, we adopted a combined approach that integrates a farm vulnerability assessment (using physical, economic, and social indicators) with an evaluation of how farmers perceive the importance of these various contributing factors. Our contribution is to provide an assessment of territorial vulnerability, exploring and discussing the two vulnerability definitions provided by IPCC and linking formal calculations to actors’ perceptions: in the case of the territory of “Pays Haut Languedoc et Vignoble (PHLV)”, farm vulnerability assessments intervene in a specific territorial context due to the area’s marked rural character and significant climate challenges. This article aims to assess the vulnerability of different farms types in that specific territory while taking into account the farmers’ perception of the vulnerability components.

2. Theoretical Background

2.1. Definition of Vulnerability

Vulnerability is a concept mostly used in literature relating to natural disasters, food security and poverty [57,58], and several other disciplines. The most widely used definition originates from the fourth IPCC report [39], which defines vulnerability as “the degree to which a system is susceptible to, and unable to cope with, adverse effects of CC, including climate variability and extremes. Vulnerability is a function of the character, magnitude, and rate of CC and variation to which a system is exposed, of its sensitivity, and of its adaptive capacity”.
There are significant differences and new aspects in the IPCC’s Fifth Assessment Report (AR5) concept compared to the IPCC’s Fourth Assessment Report (AR4). The final outcome of both AR4 and AR5 is determined by the combination of all components, including vulnerability in AR4 and risk in AR5 (Figure 1). In the AR4, vulnerability is viewed as a function of the exposure, sensitivity, and adaptive capacity. However, in the AR5, the IPCC has changed its approach to an assessment framework that focuses on risk, with risk being defined as a result of hazard, exposure, and vulnerability. Due to the review and separation of exposure in the AR5 report, vulnerability was reconceived as a function of sensitivity and capacity to cope and adapt. The IPCC AR4 and AR5 concepts often include identifying components that lead to negative consequences caused by CC and climate-related extremes on natural or social systems. Both concepts make it clear that external climate-related causes (in AR4 ‘exposure’ and in AR5 ‘hazard’) and system attributes are distinct.
Several studies have noted that the revised vulnerability concept (AR5) has received little attention, while the classic vulnerability concept (AR4) continues to dominate and be used across vulnerability studies [59,60,61,62,63]. In particular, Estoque et al. [60] have conducted a systematic review of climate-related vulnerability studies published between January 2017 and December 2020, and they have shown that the revised vulnerability concept has not been extensively used in climate-related vulnerability studies in most sectors worldwide, and its effect in the field of climate-related assessment has been minimal. Out of the 464 research articles reviewed, 43% employed the AR4 vulnerability concept, 24% employed other vulnerability concepts, and only 3% employed the AR5 vulnerability concept [60].
The majority of vulnerability studies did not provide an explanation for why a specific vulnerability concept or model was chosen and implemented [60,64,65]. Many related studies in the agriculture, ecological, forestry, and fisheries contexts have adopted the classical vulnerability concept (AR4) [66,67]. They have employed a wide range of methods based on IPCC-contributing factors exposure, sensitivity, and adaptive capacity to quantitatively assess vulnerability at different scales. Similarly, in this research, we have used the classic vulnerability concept and keep the exposure in mind to contextualize and treat vulnerability in detail.
Figure 1. (a,b) Comparison of the components of CC vulnerability (AR4) and climate risk (AR5). The figure is derived from the research conducted by Das et al. (2020) and Zebisch et al. (2021) [64,65].
Land 14 01388 g001

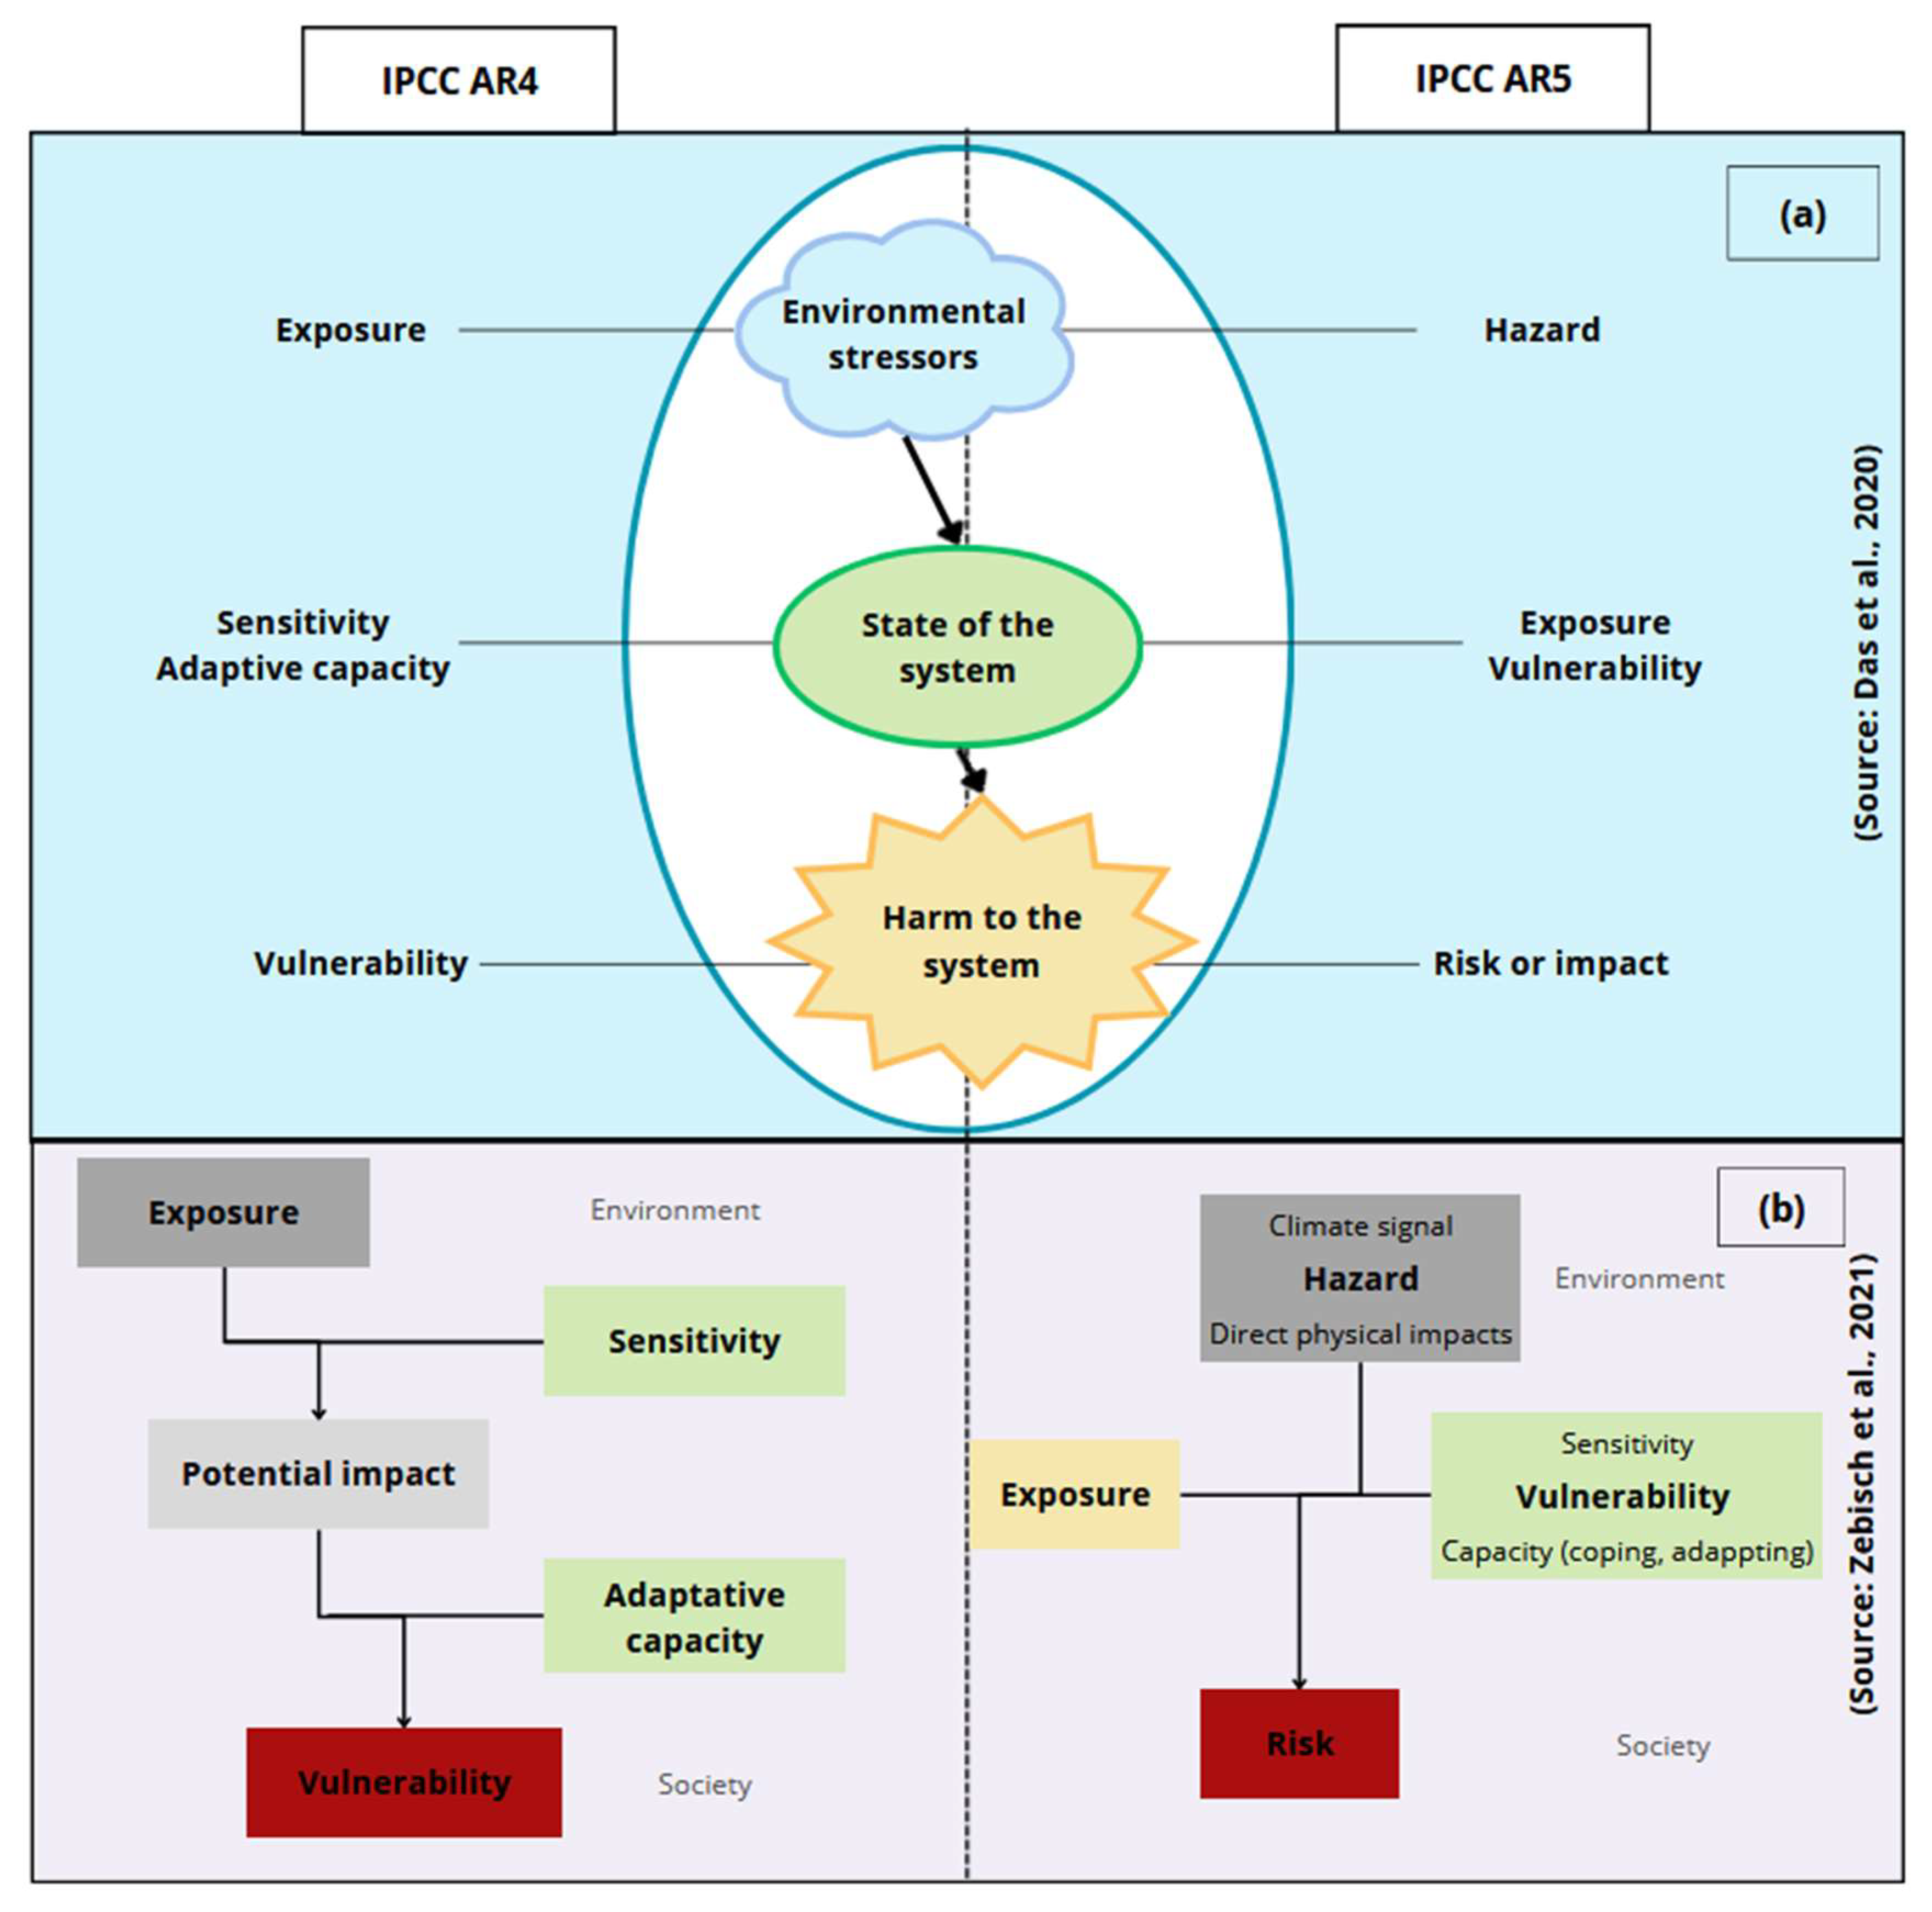
2.2. The Components of Vulnerability

In most of the research articles assessing vulnerability, vulnerability to CC is defined as a function of the system’s exposure to CC, its sensitivity, and its adaptive capacity [29,31,37,38,39,40,58,68,69,70,71]. Exposure usually depends on external hazards, while sensitivity and adaptive capacity depend on internal factors [40]. Exposure is defined with respect to susceptible hazards that can cause damage to people, species or ecosystems, resources or environmental services, infrastructure or economies, or social or cultural goods [40]. It is closely linked to climatic parameters. The sensitivity in turn refers to a system’s intrinsic characteristics, which make it particularly vulnerable, hence referring to its reactivity to climatic hazards. Sensitivity usually results in a propensity to be affected, favorably or unfavorably, by a hazard. The more sensitive a system is, the higher the rate of damage [35,40], knowing that sensitivity can also vary considerably across systems. Finally, adaptive capacity refers to a system’s capacity to evolve to better manage its exposure and/or sensitivity to CC. The 2014 IPCC report [40] provides a similar conceptual definition of vulnerability as in the 2007 IPCC report, where vulnerability is “The propensity or predisposition to be adversely affected” and “Vulnerability encompasses a variety of concepts including sensitivity or susceptibility to harm and lack of capacity to cope and adapt”. Still, the purpose is to inform on climate risk and impacts more than on vulnerability per se, and the concept of vulnerability shows significant evolution as it is integrating the adaptative capacity and the sensitivity as its two main components, leaving apart exposure as another component of climate risk.
In the majority of vulnerability studies, adaptive capacity is always considered as a set of factors that determines the ability of a system to generate and implement adaptation measures. It is worth noting that in most of empirical studies [28,29,55,72,73,74], the authors have differentiated between the biophysical and socio-economic components of vulnerability to allow for a measurable assessment, often the calculation of a multidimensional vulnerability index of the vulnerability, rather than exploring the multidimensionality of both sensitivity and adaptative capacity. They all rely on the identification of the relevant indicators of the components of vulnerability. The main approaches used also mobilize spatialization, perceptions of vulnerability components through scoring, or modeling.
Vulnerability components, including exposure, sensitivity, and adaptive capacity, are often overlooked and inadequately integrated into farm vulnerability assessments. While many studies focus on exposures such as climate variability or market shocks, they often neglect how specific farm characteristics (like crop diversity, soil quality, labor availability) affect sensitivity to these stressors. Similarly, adaptive capacity is often superficially considered, with little attention paid to social capital, technology, institutional support, or farm experience, which impact farmers’ ability to adapt. The inability to address the interactions between the different components of vulnerability is another commonly observed limitation in vulnerability [29,41,55,75]. To address these shortcomings, it is necessary to have a balanced approach that gives equal attention to all vulnerability components and includes both quantitative and qualitative data that reflect the lived experiences of farmers.

2.3. Vulnerability Factors

Vulnerability to CC is multidimensional and is determined by a complex interrelation between multiple biophysical and socio-economic factors [76]. The choice of variables generally depends on the literature, context, and availability of data [28,29,31,55,72,73,74]. In practice, the selection of indicators is an iterative process that progressively reduces a reference list according to the context and data. Several studies provide interesting classifications of vulnerability factors [30,77,78], of which the United Nations (2004) [78], for example, distinguish four groups of vulnerability factors including the following: (i) physical factors that describe the exposure of vulnerable elements, (ii) economic factors that describe the economic resources of individuals, population groups, and communities, (iii) social factors that determine the wellness of individuals, population groups, and communities, such as the education level, security, fundamental human rights, and good governance, and (iv) environmental factors, which depend on the state of the environment in a specific region.
The agricultural sector’s vulnerability concepts have been criticized due to their limitations, applicability, usefulness, and political implications [41,52,75,79,80]. The limitations are specifically linked to the spatial extent of the data, the selection and quantification of variables, and the incorporation of vulnerability into agricultural policies [37,81,82,83]. A risk of redundancy and collinearity can be created by the variety of variables considered. Finally, as with any multi-criteria approach, the issue of identifying relevant variable thresholds is always a complicated task. In truth, setting thresholds is a crucial factor in determining the validity of outcomes [75], and it is important to adjust both the variables and their thresholds to the specific challenges and scale of the study [82,84,85]. In order to address these methodological weaknesses, it is important to use interdisciplinary approaches, participatory methods, and more rigorous data integration to guarantee that vulnerability assessments are both comprehensive and contextually sensitive.

2.4. Approaches and Methods for Assessing Vulnerability

Three main conceptual approaches exist in literature: a socio-economic approach [30,31,57,68,86,87], which focuses on social, economic, and political aspects, where vulnerability is studied mainly on the basis of socio-economic variables (education, gender, wealth, health status, access to credit, access to information, and technology, etc.); a biophysical approach [38,74,88,89,90] that studies physical damage from biophysical variables. The latter approach relates to how impacts are most often estimated based on climate predictions or sensitivity indicators. These may practically apply to effects on yields, for example, which can be analyzed by modeling the relationship between crop yields and climate variables [29,37,55,76], an approach used by O’Brien et al. [76], for instance to map agriculture vulnerability. While the limits of the first two approaches stem from the fact that they focus on only one aspect of vulnerability, another integrated approach emerges from the integration of both biophysical and socioeconomic variables.
This diversity of methods for assessing vulnerability to CC is also due to the metrics used, which most often incorporate econometric and multi-criteria approaches based on indicators [31,55]. Indeed, the econometric method is based on the reconstruction of an economic model for a given system (as a household, country, region, etc.). It allows for an assessment of the expected and observed effects of a particular issue (as CC). Several studies, for example, show how vulnerability may be understood as the probability of a person becoming poor if he/she is not currently poor versus the probability of a person’s ongoing poverty if he/she is already poor [91,92]. The multi-criteria approach based on indicators thus allows for quantification of the vulnerability by selecting certain indicators for which their combination help to determine the respective vulnerability indices [55,57,76,87,93,94]. Two cases are therefore possible depending on whether or not the various indicators are weighted, knowing that the choice of weights is a delicate step for which, for example, Deressa et al. [55] proposes to use the results of a principal component analysis.
A vulnerability assessment is considered a key tool in guiding adaptation needs by supporting the identification and the selection of specific adaptation strategies [35]. It plays a fundamental role in adaptive decision-making by identifying the characteristics of the vulnerable system, establishing priorities, evaluating alternatives decisions, and effectively implementing a particular adaptation policy or measure.
Various assessment methods are now frequently used to measure the vulnerability levels of various studied systems. While numerous techniques exist, it is important to remember that their specificities and assumptions strongly influence the results. Most approaches aim to identify several classes of vulnerability and to perform comparisons between systems or regions based on vulnerability levels. However, the quantitative nature of these assessments can make their configuration difficult and can quickly lead to analytical complexity. However, these quantitative assessments can make their configuration difficult and can quickly lead to analytical complexity. An effective assessment thus requires a deep understanding of the relationships between different explanatory variables (qualitative and quantitative) and the various components of vulnerability.
This research aligns with such approaches by proposing a detailed and a multi-criteria farm-scale (within a given territory) vulnerability assessment that combines quantitative and qualitative dimensions. The objective is not only to evaluate vulnerability levels but also to propose a methodological framework that incorporates farmers’ risk perception. The motivation for combining these two concepts lies in the significant influence that perceptions exert on farmers’ behavior and on the acceptability of adaptation policies, particularly in the domain of risk management, where numerous studies have highlighted this effect [95,96]. Accordingly, the combined vulnerability assessment seeks to uncover any potential cognitive biases among farmers in their response to risks induced by CC [97].

3. Materials and Methods

3.1. Description of the Study Area

The Pays Haut Languedoc et Vignobles (PHLV) territory is located west of the Hérault department in south France (Figure 2). PHLV comprises 102 municipalities divided into 4 communes, a total population of 79,000 [98], and a surface area of 1912 km2. It is characterized by a privileged and diversified natural geographic heritage including rivers, mountains, and plains. The PHLV territory is highly rural with 63% of the territory occupied by forests against 34% dedicated for agricultural land. It is also noted that the agricultural sector accounts for 12% of the total employment, equivalent to four-fold more than the department average [98]. PHLV’s agricultural sector is characterized by small farm sizes averaging less than 15 ha in monoculture. Historically, it is wine grapes that constitute the main cultivated crop with an area of 22,135 ha covered, equal to 53% of Utilized Agricultural Areas (UAAs). However, the number of farms has greatly decreased by 60% between the years 1988 and 2010 from 6625 to 2628, coupled with a similarly sharp drop in total UAA from 53,684 ha to 43,028 ha. This decline therefore generates challenges relating to the abandonment of agricultural land, as well as to land access for new farmers. This is mainly embodied through wasteland, which gradually gets overtaken by the forest. In addition, this territory has a low proportion of irrigated areas due to its difficult topography, which itself makes it subject to several natural hazards, such as floods, drought, spring frost, and hail.
CC has caused a 0.5 °C increase in temperature in the PHLV territory every 10 years, and there is a significant annual and interannual variation in rainfall [99]. In this Mediterranean climate, adaptation to CC poses a real challenge for the territory and must be taken into account in the context of local development.
The PHLV territory’s economy is based on the valorization of natural resource agricultural activity [100,101]. In this region, agriculture is a particularly vital sector, in terms of food, income, and regional development [102,103]. It is particularly vulnerable to CC, water stress, and agroecosystem degradation (viticulture, arboriculture, livestock farming, cereal crops, etc.) and has been exacerbated by CC in this region, which has also led to an increase in the frequency of extreme climatic events, particularly droughts and floods [104,105]. The social consequences of CC will be significant, as the population’s income is highly dependent on agricultural activities and the exploitation of natural resources [1,68,89].
Agriculture’s ability to improve its productivity and ensure sufficient income in an uncertain climate will depend on its territorial embeddedness and its capacity to adapt. This research is conducted in a rural region where agriculture is confronted with the issues of CC. Our research was carried out in close collaboration with local stakeholders who are faced with significant challenges in adapting agriculture to this type of territory, as they need accurate and relevant information about the factors contributing to vulnerability and the link between potential adaptation options and decision-making processes.

3.2. Estimation of Integrated Vulnerability Index and Vulnerability Calculation Methods

Vulnerability is usually understood as a concept that focuses on assessing the impact of climate events on agricultural production under human intervention. The agricultural vulnerability index is usually expressed as the positive function of exposure and sensitivity index but the negative function of the adaptive capacity. The aim is to compare both the potential impact (exposure and sensitivity) and the adaptive capacity. The vulnerability index calculation formula does not have a standard form (Table 1), and the majority of studies did not support its decision. It is possible that this is because the goal of this integrated index is to identify the factors that contribute to vulnerability.
In this research, we have adopted the classic vulnerability concept (AR4). The Farm Vulnerability Index (VI) was determined as a functional relationship among exposure (E), sensitivity (S), and adaptive capacity (AC) indices.
V I = f E , S , A C = E × S A C
where V is vulnerability, E is exposure, S is sensitivity, and AC is adaptive capacity.
Each component’s determining variables were measured using the survey’s results. To create a standardized scale (0 to 1), quantitative variables were normalized with the min-max method and qualitative variables were normalized with the categorical scale’s method. The rating of each variable increases from negative to positive values. Furthermore, farmers were asked to rate each variable on a scale of 0 to 10, based on their experience and knowledge and how each variable affects their farm’s vulnerability.
A simple linear model was used to model the interactions between variables in each vulnerability component, with two options for assessing calculated and declared vulnerability. In the first case, the farm’s vulnerability is determined based on a simple average of all the variables, which all have the same weight, and each component is calculated based on the average of the variables. The equation for an X component is as follows:
X c a l c u l a t e d = i = 1 n y i n
with yi representing the calculated value of variable i and n representing the number of variables.
In contrast, the declared vulnerability involves assigning different weights that vary according to the scores given by each farmer regarding their importance in their farm’s vulnerability. In this case, the equation for an X component is as follows:
X d e c l a r e d = i = 1 n n t i y i i = 1 n n t i
with yi representing the calculated value of variable i, n representing the number of variables, and nti representing the score given to variable i by the farmer.
Incorporating farmers’ perceptions into vulnerability assessments is crucial to understand how climate variability and extreme events are affecting agricultural livelihoods and the nuanced and localized impacts of CC on agricultural systems. Farmers possess experimental knowledge and are often the first to notice shifts in rainfall patterns, temperature fluctuations, or changes in pest and disease outbreaks, which directly impact agricultural production. Incorporating these perceptions into assessments can make them more informed, context-specific, and responsive to the real risks faced by farmers, making adaptation strategies more appropriate. This participatory approach can also improve the relevance and acceptability of proposed adaptation strategies.
Despite the value of farmers’ perceptions in local knowledge, using them in vulnerability assessments presents several challenges. One major issue is the subjective nature and variability of perceptions, which can be influenced by recent experiences, cultural beliefs, and limited access to scientific information and can result in biased or inconsistent data. Additionally, the way climate impacts are perceived and reported can be influenced by differences in education levels, socioeconomic status, and gender, leading to biased or incomplete assessments. Moreover, there can be a discrepancy between perceptions and scientific data, which can complicate vulnerability assessments. In some cases, farmers may attribute climatic changes to non-climatic factors, making it difficult to differentiate climate-specific vulnerabilities.
In order to overcome these challenges, it is necessary to have a comprehensive and interdisciplinary approach that combines local insights with scientific data to obtain a better understanding of vulnerability. Integrating farmers’ perceptions into vulnerability assessments is a challenge, but they offer valuable insights. However, this approach needs to be carefully designed to take account of potential biases and ensure the involvement of diverse farms, particularly those of smallholders, and marginalized groups.

4. Variable Identification and Data Collection

The elaboration of the approach was carried out by crossing bibliographic references and available databases for the study area with an exploratory initial survey of a sample of farmers and stakeholders in the study area. The survey aimed to identify the most important vulnerability factors and expert perspectives per crop type. On one hand, the collected data allowed for an identification of the main characteristics of the territory (demography, employment, agriculture, resources), the potential of agriculture in territorial development, the variation in climatic parameters, and the corresponding impact on agriculture (variation in rainfall, variation in temperature, severe weather events, damage, etc.). On the other hand, the data also helped adapt the study methodology and the validation of farm vulnerability variables.
To complete the vulnerability assessment, several data sources were consulted, including large-scale secondary and generic data, as well as specific farm-level data. The initial step was to conduct preliminary surveys with key stakeholders in multiple municipalities within the PHLV territory. Afterward, experts were interviewed to obtain their opinions on our methodological approach and confirm certain choices. In the end, a detailed questionnaire was completed by 90 farmers.

4.1. Scoping Interviews with Local Stakeholders

This step, which was carried out over a period of 2 months within the PHLV’s mixed syndicate (a public institution that functions as a development agency for the territory of PHLV), focused primarily on collecting available data for the study area (statistics, maps, reports) and on interviews with resource stakeholders in the PHLV territory (local elected representatives, development officers, park managers, etc.). The main objectives of this initial data collection were to
  • Understand the main characteristics of the area (demographics, employment, agriculture, resources) and identify the main challenges and development opportunities;
  • Know how the territory is affected by CC and to understand how this climatic variation has impacted the agricultural sector;
  • Study the role of agriculture in territorial development;
  • Understand the priorities of different stakeholders regarding CC adaptation, depending on their professions and level of involvement in local development;
  • Know how the climatic issues are integrated in the design of the territory’s development strategies and actions, and to know the territory’s future outlook for adaptation;
  • To investigate if local public policies aim to support the agricultural sector in territorial development by reducing its vulnerability and creating new opportunities for adaptation.
To address these different points, we have developed an interview guide outlining the key topics to be covered during our exchanges. Some questions were explored in more detail, depending on the function of the respondent. Following these interviews, the research question was clarified. To develop the vulnerability assessment methodology, it was necessary to consult experts.

4.2. Expert Consultations

During this phase, semi-directive interviews were conducted with experts specializing in the crops present in the study area. These interviews were structured around several themes: approaches to evaluating vulnerability in agriculture; key vulnerability factors for agriculture and main adaptation strategies in the study area; the relevance and feasibility of our methodological framework and the selected variables for evaluation. It is crucial because it leads to the selection and validation of variables that form the basis of the vulnerability assessment protocol, which is a key part of the methodology.

4.3. Farmer Questionnaire

The interviews conducted with local stakeholders and experts helped to appropriately design the survey conducted with farmers and establish a representative sample of the farms. Designed as a questionnaire, this survey aimed to collect specific data on the vulnerability factors of agricultural operations and the farmers’ adaptation preferences. These surveys were conducted face-to-face with 90 farmers representing the production systems of the territory. The farmers were randomly selected and differentiated according to the orientation of their production and their location, either plain or mountain.
The questionnaire was organized into several modules, covering general characteristics of the farmers (age, education level, experience, etc.) and the farms (cultivated area, soil type, etc.), farming practices (soil preparation, weeding, irrigation, etc.), perceptions of CC, and farmers’ views on the importance of vulnerability factors. The survey took approximately two hours.
A sampling plan (Table 2) for the farm vulnerability survey was next formulated based on the above elements. A total of 90 farmers were surveyed after being randomly selected from the different strata defined in the area (mountain, plain) and crop types.
Variables (Table 3) were identified following an integrated approach combining socio-economic variables (age, training, crop insurance, etc.) and biophysical variables (soil type, tillage, irrigation, etc.). Selected variables were validated according to literature, expert opinions, and available data of the study area (diagnosis, preliminary interviews). Two types of variables were identified, those which are simple and directly measured (as age, experience, etc.) and composite variables, which are measured from the average of other sub-variables. The latter includes variables as the soil management of perennial crops, for example, which is estimated by soil cover, tillage, and amendment. Additionally, certain variables differed according to their scale of measurement whereby some are measured at the farm scale while others are measured at the crop scale mainly for sensitivity and technical adaptive capacity. Measurements at the crop scale would then be extrapolated to the farm scale according to the proportion of each culture in the whole farm UAA. Table 3 presents the variables retained for each component of vulnerability.

4.4. Farm Exposure to CC

Historical studies and climatic variables in the area were used to identify climactic hazards with local stakeholders, leading to the identification of four hazards: drought, flood, hail, and spring frost. They were calculated based on the average annual number of climatic events from 2009–2018.
Droughts and floods were quantified from the annual number of natural disasters decrees acquired from the CCR database [130], while hail and frost episodes were quantified from climatological and hydrological records acquired from the Departmental Council of Hérault database [131]. Due to the lack of historical data on the farm scale, the study assumed that the farms were under the same climatic conditions as the PHLV territory scale.
Exposure is determined by the principle that farms are more likely to be exposed to a hazard if it has a higher average annual event between 2009 and 2018, leading to a high level of exposure.

4.5. Farm Sensitivity to CC

Sensitivity refers to constraints within farms that are linked to climatic variations. In general, it refers to variables that change little over time, like the soil type. Here, sensitivity was assessed at the crop scale using biophysical variables specific to each crop type. According to the production cycle, for perennial crops, it is evaluated based on the soil type, plot orientation, tree’s age, varietal diversity, and crop diversity. For annual crops, it is only evaluated according to the soil type, varietal diversity, and crop diversity.
The farm-level sensitivity was then determined based on the amount of each crop in the total UAA.

4.6. Farm Adaptive Capacity to CC

To be clear, adaptive capacity is the term used to describe how a system can evolve to manage its exposure and/or sensitivity to CC [41,132]. Most vulnerability studies refer to adaptive capacity as a set of factors that impact a system’s ability to design and implement adaptation measures.
Therefore, farm adaptive capacity is usually measured in terms of resource availability, which was defined in the study as the set of livelihood factors that each farmer has to cope with for CC [133,134]. Three types of capital (human, technical, and economic) were distinguished and measured. Human and economic capitals were measured at the farm scale, and technical capital was measured at the crop scale. The overall adaptive capacity was therefore determined from the average of the adaptive capacities of different capitals.

4.6.1. Adaptive Capacity Linked to Human Capital

Human capital is made up of knowledge (training, experience, etc.), skills, and health status (age) characterizing individuals [135,136]. On the basis of this definition, three variables were selected for the study: farmer training level, age, and agricultural experience. The agricultural network variable was selected for social capital, which is usually the most difficult to measure [136].

4.6.2. Adaptive Capacity Linked to Economic Capital

Always, economic capital refers to all the economic resources of a company. The adaptive capacity linked to economic capital was defined as a set of resources, strategies, and decisions used to guarantee and improve a farm’s income. Five variables were thus defined: product marketing, off-farm income, legal status, land status, and crop insurance.

4.6.3. Adaptive Capacity Linked to Technical Capital

Technical capital is defined as the set of farming practices and facilities (tillage, irrigation, etc.) that allow for the managing of crops. Irrigation, agro-ecological infrastructure, soil management, and plant management were chosen as variables to assess this capital.

5. Data Analysis and Characterization of the Different Farm Vulnerability Groups

After identifying the indicators for each component, we have analyzed the data through descriptive and inferential statistics. The farm’s exposure to current climate variability and extreme events, as well as its sensitivity, capacity to adapt to climate variability, and vulnerability, were measured by calculating minimum, median, mean, and maximum values. In addition, comparisons between indicators and groups were performed. Three farm vulnerability groups (low, medium, and high) were created with a minimal variance in each category.
The Discriminant Analysis (DA) method was then conducted using the statistical software SAS (9.4 version) to study the relationships between the groups and a set of explanatory variables (vulnerability assessment variables and others). The aim of this method is to study the difference between groups taking into account multiple variables simultaneously. The DA minimizes the number of important indicators and highlights the most relevant elements among a large number of associated sub-components within a collection of uncorrelated variables.

6. Results

This research made it possible to establish a framework for assessing the agricultural vulnerability to CC and to validate it through a survey of a representative sample reflecting the diversity of farms in the PHLV territory. By creating a synthetic vulnerability index using discriminant analysis, it was possible to identify the main factors of vulnerability and determine three categories of increasing vulnerability (low, medium, and high). This is a multi-criteria approach that aims to develop relevant adaptation measures but more generally should help to inform territorial projects in the sense that adaptation to CC and sustainable development are increasingly interrelated. The results show that this assessment framework is operational and can be applied to different systems and contexts.

6.1. The Importance of Vulnerability Variables According to Farmers’ Declarations

The importance of different vulnerability variables can be assessed through farmers’ declarations, depending on their experience and knowledge. Table 4 shows the scores allocated for the different vulnerability variables by the interviewed farmers. For each variable, this score is equal to the sum of the ratings assigned divided by the maximum ratings possible. According to the variables and for all farms, this indicator varies from a minimum of 0.147 for floods to a maximum of 0.844 for product marketing. Drought is ranked as the most significant climatic issue for the exposure component with a score of 0.749. The next two events are hail and spring frost, which each score 0.394 and 0.299, respectively. However, flooding is the lowest overall score (0.147) despite having a 34% frequency for climatic events [131]. By incorporating farmers’ declarations, we can assess the distinct impact on the production of different hazards, not just their recurrence. Farmers point out that drought is the most vulnerable event because it affects the whole farm and it can last for days, while other hazards can be more specific and/or limited (like hail that can impact only one plot).
The varietal diversification variable has been identified as the most important variable (average score of 0.765) for all farms in terms of sensitivity. The results of other sensitivity variables vary depending on the farm type, with the importance of crop diversification scoring high in vegetable farms (0.890) and low in wine farms (0.416).
For AC related to human capital, scores are very homogeneous across all farms. The training and age variables have average indices of 0.504 and 0.444, respectively, while those relating to agricultural experience and the agricultural network reach higher values of 0.838 and 0.707, respectively. AC related to economic capital is closely linked to product marketing (0.844), off-farm income (0.696), and land status (0.566), while the scores for legal status and insurance are very low (0.281 and 0.271, respectively). Finally, for the technical dimension, the scores for soil management (0.790), plant management (0.740), and agro-ecological infrastructures (0.1388) are all extremely homogenous across all crops. However, the role of irrigation in the farm vulnerability varies according to the farm type, as low for field crop farms (0.166), medium for wine and mixed-crop farms (0.542 and 0.616 respectively), and high for fruit tree farms (0.720) and vegetable farms (0.880).

6.2. Assessment of Calculated and Declared Farm Vulnerability

The farms’ calculated vulnerability varies globally between 0.167 and 1.232, with an average of 0.636, while the declared vulnerability varies between 0.178 and 1.275, with an average of 0.601 (Table 5). This difference reflects an underestimation of sensitivity and an overestimation of adaptive capacity by farmers. For declared vulnerability (similarly to the calculated vulnerability), it is the wine farms that have the highest vulnerability level (0.712), ahead of field crop farms (0.646), followed by fruit tree farms (0.487), mixed-crop farms (0.474), and finally vegetable farms with the lowest recorded vulnerability (0.263). The calculated exposure showed no differences due to its calculation at the territory scale, while declared exposure varies from 0.511 to 0.778, with an average of 0.628. Moreover, farms that cultivate annual crops are less sensitive than those cultivating perennial crops regardless of the calculation method. This difference is explained by the fact that it is very difficult to modify the sensitivity variables of perennial crops, which involve a heavy investment in resources and time. It is the vegetable farms that are the least sensitive with an average declared sensitivity of 0.223. This can be explained by important crop and variety diversification, as well as due to their size characteristics, being small areas benefiting good soil quality and being less sensitive. While field crops, mixed-crop, and fruit tree farms have a medium sensitivity level, it is the wine farms that have the highest sensitivity levels (0.558), mainly due to low diversification and having poor and dry soils (schist and sandstone). Finally, results show that fruit tree farms have the highest recorded level of adaptive capacity (0.555), followed by mixed-crop farms (0.529) and wine and vegetable farms (0.504), whereas field crop farms reflect the lowest adaptive capacity (0.407).

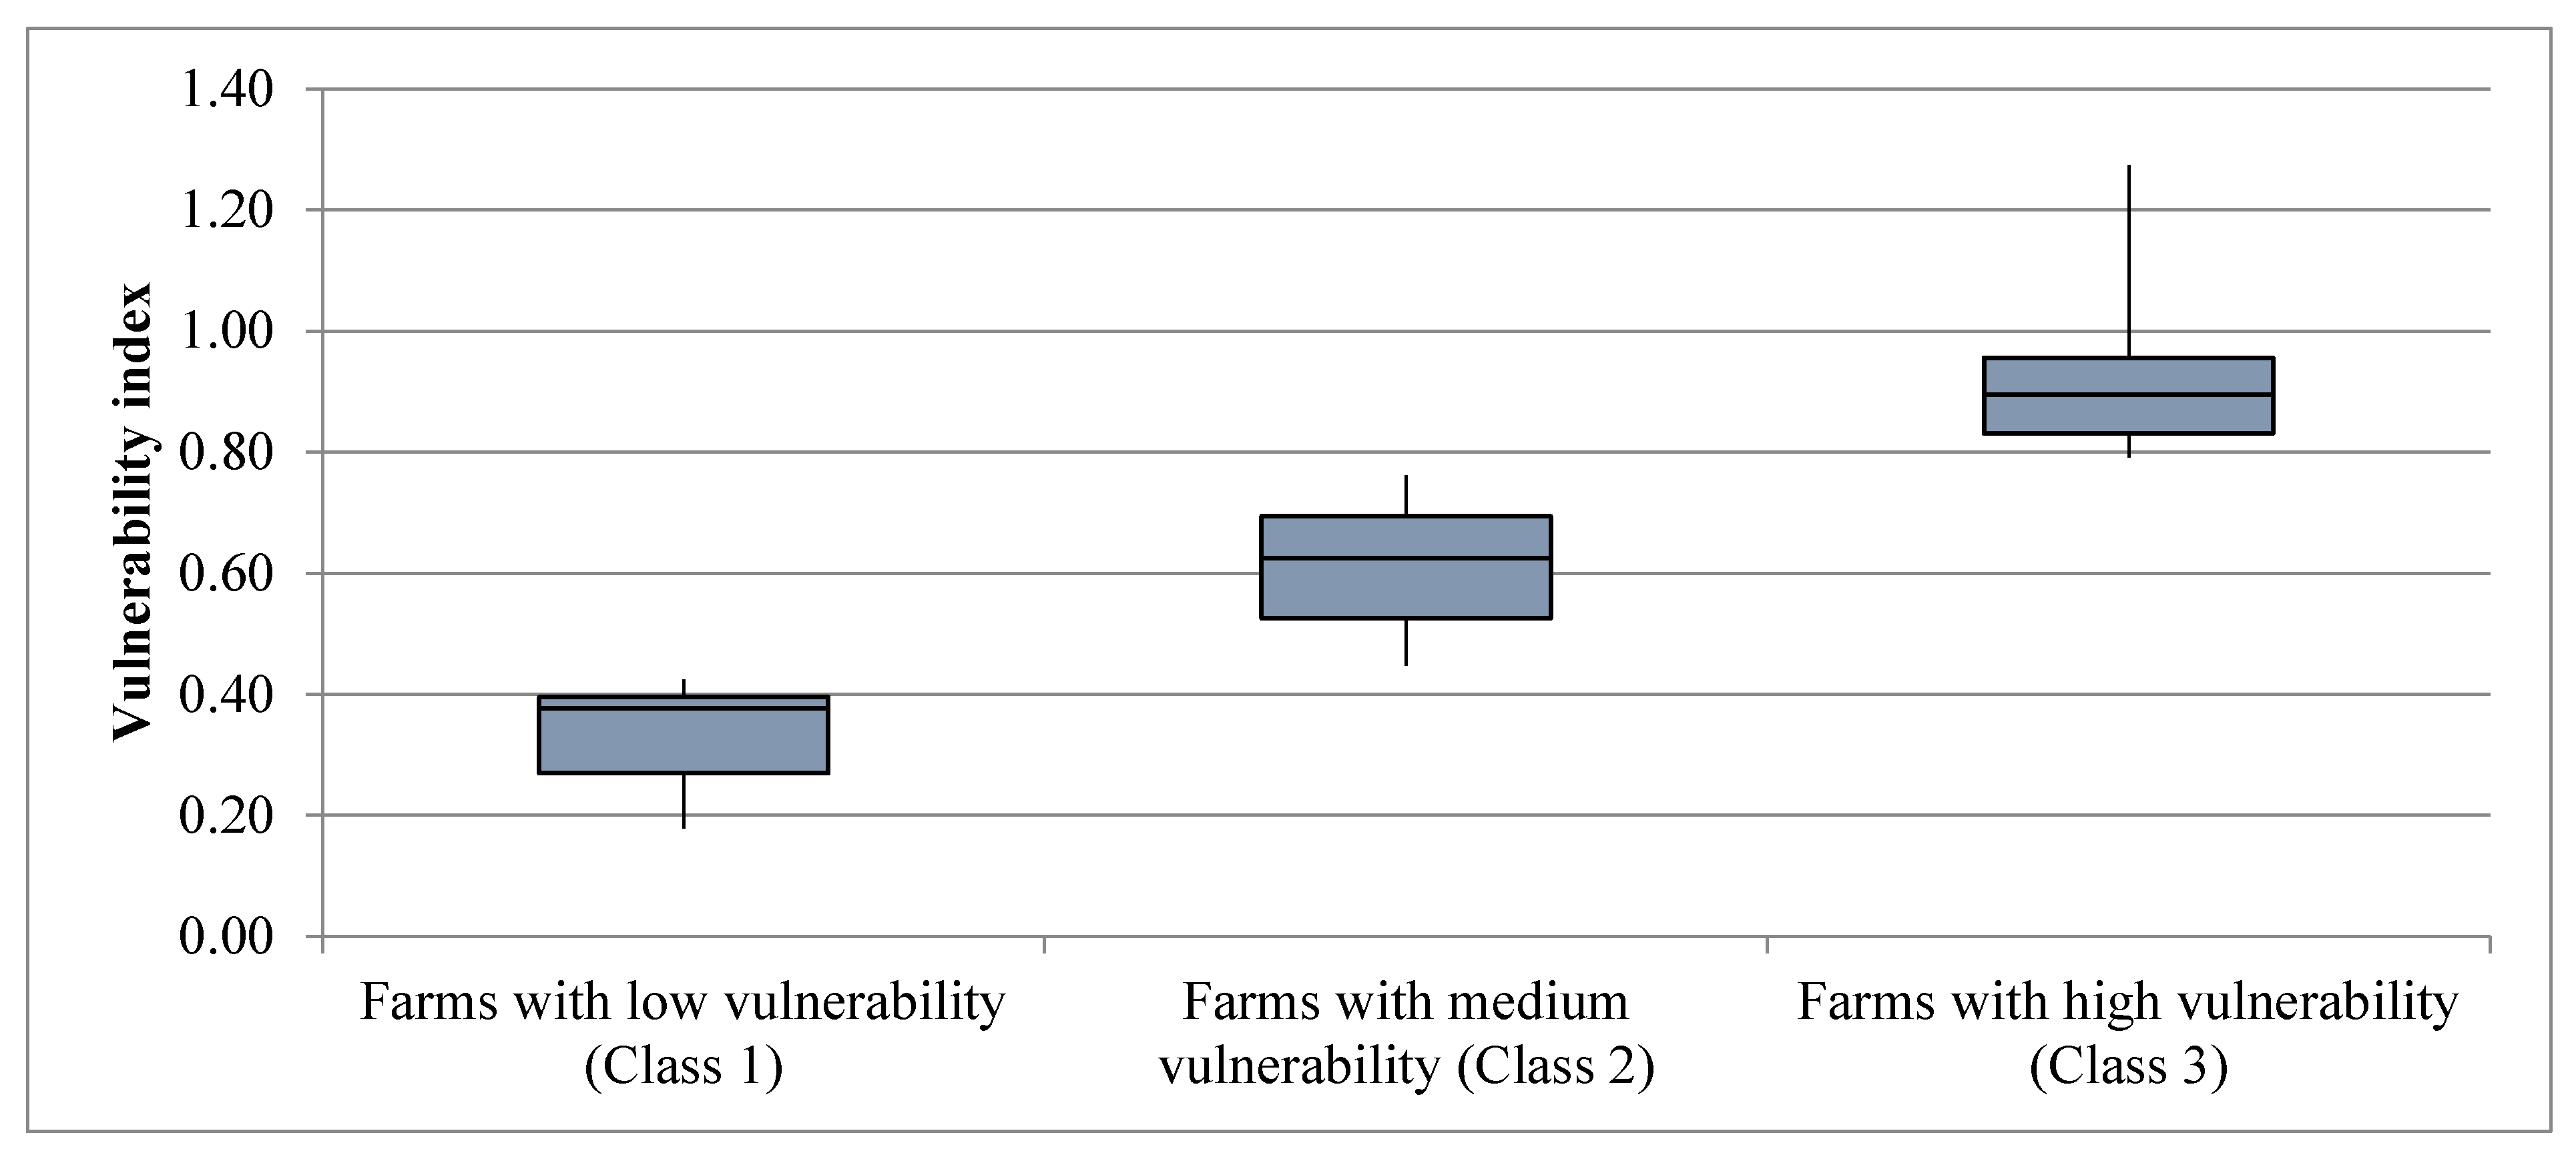
6.3. Creation of a Farm Typology Based on the Vulnerability Index

Based on the declared vulnerability index and minimizing the within-class variance, three vulnerability classes can be defined: low (average declared vulnerability = 0.332), with 24% of farms, medium (average declared vulnerability = 0.612), with 57% of farms, and high (average declared vulnerability = 0.919), with 19% of farms (Figure 3).
The analysis (Appendix A) identifies 16 significant discriminating variables out of a total of 31 variables tested with a margin of error of less than 5%. Table 6 shows a comparison between the different classes in relation to all significant discriminating variables. We note that the whole set of sensitivity variables are significant, with a rather low sensitivity level for class 1 (0.318), medium for class 2 (0.524), and high for class 3 (0.670). However, only three variables of adaptive capacity are significant (legal status, irrigation, and soil management). Overall, they are high for class 1, medium for class 2, and low for class 3. The other variables allow for a better characterization of the different classes. Class 1 is overall constituted by vegetable and mixed-crop farms (80% of farms), whereas the other classes are characterized by the dominance of wine farms, especially in class 3 (94% of farms). Most plain farms are moderately vulnerable with significant UAA (class 2), while mountain farms are characterized by a small UAA. The latter may be either slightly vulnerable (class 1) or very vulnerable (class 3). Thus, it is noted that the geographical location and farm size have distinct effects on vulnerability. Finally, it is noted that the least vulnerable farms have recorded active changes over the last 10 years, with adaptation measures implemented by the majority of farms in class 1 “low vulnerability” (96%, against 57% for class 2 and 24% for class 3). Similarly, the majority of farms in class 1 have actively changed their crops in the last 10 years by either introducing new crops or abandoning others coupled with an increase in labor needs. The latter factors are, however, stable for most farms in the other classes, especially those in class 3. This is why class 1 demonstrated a positive dynamic adaptation to CC based on crop changes and improved crop practices (increased labor needs).

7. Discussion and Policy Implication

Our study was aimed at assessing farm vulnerability in a specific territory and identifying different farm types [67,106,107,110]. Most vulnerability assessment studies, like this one, involve the development of synthetic vulnerability indicators [37,41,55,72,137,138]. They usually rely on a selection of the most relevant variables that reflect the factors involved in sensitivity, exposure, and adaptive capacity; using the principal component analysis method, expert scoring and then hierarchical classification, they determine the weight of each variable and finally calculate the level of vulnerability [37,55,138]. Their operational scales range from farm household [37], to village [139] and region [55]. Our study calculates the level of vulnerability of the farm households surveyed, as well as that of each production system in a specific territory. In the end, and compared to most available studies, vulnerability appears to always be contextual to the area studied, making it difficult to draw comparisons between areas. The choice of indicators must be sufficiently comprehensive to allow for replication from one area to another and sufficiently sensitive to the different and contextual impacts on harvests and production. Thus, from one study to another, some indicators are absent or weighted differently, while others remain present such as yields in particular.
Our second intention was to compare between a calculated vulnerability level (objective) and a declared one (subjective), in line with work showing the importance of risk perception for the acceptability of adaptation policies [95]. Thus, this joint assessment of measured and perceived vulnerability aimed to identify farmers’ possible cognitive biases in the face of the risks generated by CC [97]. It is worth noting that most studies rely on either an assessment based on indicators [37,55] or on the perceptions of stakeholders both to enrich and adapt vulnerability component indicators and to qualitatively assess them [41].
From our results, on the one hand, there is a fairly small difference between the average indices derived from the two approaches to vulnerability, and on the other, there is a correspondence between the classes of measured and perceived vulnerability. There is therefore a good match between vulnerability measurements based on farm characteristics and practices and those that incorporate farmers’ perceptions. This finding is remarkable, compared to the frequent discrepancies commonly observed [95], which generally lead to an underestimation of vulnerability by the most exposed populations and which stem from the existence of a bias described as optimism by risk psychologists [96,140]. This small gap reflects a good local knowledge of the situation in the area and the limits and constraints associated with the choice of technical itineraries. It argues in favor of taking farmers’ local knowledge into account, as recommended by a growing body of work linked to the need to both contextualize and facilitate the acceptability of implemented measures [53,141,142].
A more detailed analysis of the differences between the two assessment methods according to the components of vulnerability shows that, for all farmers regardless of the crop type, they tend to overestimate their ability to adapt and underestimate their sensitivity. Although the differences are not significant, the result is that perceived vulnerability is systematically lower than measured vulnerability. The variables for which perceptions diverged the most mainly concerned farmers’ legal status, insurance, and age, in the case of adaptive capacity, and sunshine and crop diversification, in the case of sensitivity. By carrying out these two types of assessment, we can identify the themes that are over- or under-valued by farmers and thus identify the training and awareness-raising needs that need to be put in place to support regional policies in favor of agricultural adaptation.
The last originality of our approach is to detail the components of adaptive capacity according to the different types of capital characterizing farms, in line with the theory of multiple capitals showing the multi-dimensionality of development factors [136]. However, this type of assessment, which identifies the weight of each type of capital based on farm vulnerability, does not address the issue of interactions between capitals, which is a limitation. Indeed, it is also through the interactions between different types of capital that the overall characteristics of a farm’s capital are defined, as well as its potential for development and, consequently, adaptation [143]. Finally, we have not considered the specificity of social capital, which has been integrated with human capital, as is often the case, following the example of the World Bank in its assessment of the wealth of nations and their components, which in fact includes all intangible capital [144,145]. Nevertheless, inclusion in networks and more generally the influence of social capital is a determining factor in the appropriation of adaptation principles, knowledge of the behaviors of loved ones within the profession, and the changes in representation that are necessary to adopt a logic of resilience in line with transformational adaptation frames of reference [4,146,147].
The vulnerability analysis by farm type and the classification of the sample into three vulnerability classes highlight the strong distributional impacts of CC. As vulnerability is unequally distributed and generally greater for disadvantaged farms, these aspects need to be taken into account when designing adaptation policies and interventions. The social consequences for the different vulnerability groups should be taken into account during adaptation planning in order to produce more equitable interventions or to identify specific measures targeting the most disadvantaged farms [148,149]. For example, the World Bank has used risk and vulnerability indices to justify development aid priorities in certain countries [150]. Nevertheless, very few adaptation studies examine and consider distributional impacts in the design of adaptation policies at the territorial level [148,149], despite the existence of such work at the international level between developed and developing countries. According to Watkiss and Cimato (2016) [148], this issue has been acknowledged but has not been integrated into adaptation plans. In the PHLV region, considerations related to distribution could be integrated through the use of “distributive weightings” [148] based on vulnerability classes or farming systems, so that the most vulnerable systems or farms receive greater attention in policy design. This approach helps improve social utility [148], particularly for highly vulnerable farms, and supports the development of more inclusive policies.

8. Conclusions

The main objectives of this research were to assess the current state of knowledge regarding farm vulnerability, to identify key issues that need further study, and to raise awareness among farmers, local stakeholders, and policymakers about the challenges of adaptation and new ways of designing adaptation policies. On an operational level, the aim of this research is to design a decision-support tool for agricultural chambers and local policymakers, enabling them to assess the farm vulnerability to CC and to anticipate the adaptation measures to be implemented. It provides a means of identifying the most vulnerable agricultural areas and systems, an essential step for estimating financial support needs and for defining and calibrating adaptation measures. The results enable strategic thinking at the territorial level, allowing for precise targeting of the area and farm type to be supported as a priority. Finally, the analytical framework developed and validated for this region was designed to be easily transferable to other agricultural systems and rural territories.
As observed, the territory is particularly exposed to drought. The sensitivity of farms is mainly linked to relatively poor soils and low levels of varietal and crop diversification. The high vulnerability of farms can be linked to limited resources, according to existing literature regarding AC, and practically, the weakness of human capital is primarily due to an underdeveloped agricultural network and a low level of training. The agricultural network’s significance as a factor of vulnerability is particularly significant for farmers in the sample. A low level of economic capital is also associated with the dominance of individual legal status, the lack of off-farm income, and the absence of crop insurance. Finally, poor soil management and limited irrigation use are directly related to the low level of technical capital.
The analysis of vulnerability levels reveals differences across farm types. According to both assessment methods (declared and calculated vulnerability), wine farms and field crop farms are the most vulnerable, followed by fruit tree farms and mixed-crop farms. Due to their low sensitivity, vegetable farms have the lowest vulnerability scores, while vineyards have the highest. The highest adaptive capacity is found in fruit tree farms and mixed-crop farms, while field crop farms show the lowest adaptive capacity.
The farm-level assessment results align with the broader territorial diagnosis conducted through the stakeholder survey on recent agricultural changes in the area. In this territory, the number of farms dropped from 4325 to 2583 between 2000 and 2010. Only vegetable farms saw an increase during that same period. Given that CC is a major issue in this region, this decline could intensify in the coming decades due to its impacts. Wine farms and field crop farms are the most vulnerable to CC, as they are generally established on poor soils and have limited access to irrigation. These findings are consistent with the high vulnerability observed for wine farms and field crop farms. Our results for the PHLV, also confirm the perspectives of local stakeholders, who linked vineyard vulnerability to delays in varietal changes, limited water resources for irrigation-based solutions, and soil management practices.
The farm typology also shows that the least vulnerable farms have actively implemented adaptation measures such as irrigation, diversification, sustainable land management, etc. Since the study results have validated the vulnerability assessment framework, it is therefore possible to apply the approach to other types of agricultural systems operating under different contexts. Conversely, this typology shows that the most vulnerable farms have not taken any adaptation measures. In the case of the territory studied, we note that it is rather the farms located in the more difficult mountain areas, which are already involved in a logic and a process of adaptation to CC. However, while these practices are positive in the sense that they help to legitimize changes in favor of adaptation, it should be stressed that in the cases observed, these changes have resulted in an increase in production costs, notably in labor requirements, which is a major constraint for implementing adaptation policies.

Author Contributions

Conceptualization, A.Z., M.R.-D. and H.R.-V.; Methodology, A.Z., M.R.-D. and H.R.-V.; Software, A.Z.; Formal analysis, A.Z.; Investigation, A.Z.; Data curation, A.Z. and T.B.; Writing—original draft, A.Z., M.R.-D. and H.R.-V.; Writing—review & editing, A.Z., M.R.-D. and H.B.; Supervision, M.R.-D. and H.R.-V.; Funding acquisition, H.B. All authors have read and agreed to the published version of the manuscript.

Funding

This research was funded by CIHEAM-IAMM, PhD grant.

Data Availability Statement

The original contributions presented in this study are included in the article. Further inquiries can be directed to the corresponding author.

Conflicts of Interest

The authors declare no conflict of interest.

Appendix A. Discriminant Analysis Output (SAS)

The DISCRIM Procedure
Total Sample Size90DF Total89
Variables31DF Within Classes87
Classes3DF Between Classes2
Number of Observations Read90
Number of Observations Used90
Average R-Square
Unweighted0.1329693
Weighted by Variance0.0794961
Univariate Test Statistics
F Statistics, Num DF = 2, Den DF = 87
VariableTotal Standard DeviationPooled Standard DeviationBetween Standard DeviationR-SquareR-Square/(1-RSq)F ValuePr > F
Overall vulnerability score assigned by farmers1.65071.57240.67570.11300.12735.540.0054
Farm income0.99690.98770.24460.04060.04231.840.1650
Farm Type 1.44911.16671.06830.36640.578225.15<0.0001
Geographical location0.50270.47980.20270.10960.12315.350.0064
S (soil type)0.21470.18690.13310.25910.349815.22<0.0001
S (varietal diversification)0.29910.21900.25140.47620.909239.55<0.0001
S (crop diversification)0.18280.15510.12110.29600.420418.29<0.0001
S (trees age of perennial crops)0.23020.21240.11500.16810.20208.790.0003
S (plots orientation)0.33310.29290.20040.24400.322714.04<0.0001
AC(age of the farmer)0.23190.22830.06440.05210.05492.390.0977
AC (training)0.17030.17130.02120.01050.01060.460.6320
AC (agricultural experience)0.21600.21580.04110.02440.02501.090.3415
AC (agricultural network)0.12940.13060.0097150.00380.00380.170.8474
CA (legal status)0.25510.24460.09900.10160.11304.920.0095
CA (land status)0.25960.26020.04320.01860.01900.830.4411
AC (product marketing)0.17070.17030.03360.02610.02691.170.3158
CA (crop insurance)0.25250.25240.04730.02360.02421.050.3532
AC (off-farm income)0.15740.15700.03230.02830.02911.270.2868
CA (soil management)0.14860.13040.09010.24760.329114.32<0.0001
CA (plant management)0.16130.16160.02770.01980.02020.880.4188
CA (irrigation)0.27680.22980.19260.32620.484121.06<0.0001
CA (agro-ecological infrastructure)0.25040.24640.07050.05340.05642.450.0919
UAA27.516026.71999.37270.07820.08493.690.0289
Variation in farm size0.65160.65340.10390.01710.01740.760.4712
Labor type 0.51560.51280.11420.03310.03421.490.2316
Labor need0.49830.47150.21430.12470.14256.200.0030
Current adaptation measures0.49260.43580.29090.23500.307313.37<0.0001
Future land project0.47880.48200.05570.00910.00920.400.6712
Crops introduced during the last 10 years0.48140.44820.22890.15240.17997.820.0008
Crops abandoned during the last 10 years0.44470.40820.22750.17640.21429.320.0002
Adaptation policies should be favored by public policies0.97380.83180.63520.28690.402317.50<0.0001
Multivariate Statistics and F Approximations
S = 2 M = 14 N = 27.5
StatisticValueF Value DDL Num.DDL Res.Pr > F
Wilks’ Lambda0.095918174.1062114<0.0001
Pillai’s Trace1.279832963.3262116<0.0001
Hotelling–Lawley Trace5.508139924.9862102.22<0.0001
Roy’s Greatest Root4.669138608.743158<0.0001
NOTE: F statistic for Roy’s Greatest Root is an upper bound
NOTE: F statistic for Wilks’ Lambda is exact.

References

  1. Villegas-González, P.A.; Ramos-Cañón, A.M.; González-Méndez, M.; González-Salazar, R.E.; De Plaza-Solórzano, J.S. Territorial Vulnerability Assessment Frame in Colombia: Disaster Risk Management. Int. J. Disaster Risk Reduct. 2017, 21, 384–395. [Google Scholar] [CrossRef]
  2. Neil Adger, W.; Arnell, N.W.; Tompkins, E.L. Successful Adaptation to Climate Change across Scales. Glob. Environ. Change 2005, 15, 77–86. [Google Scholar] [CrossRef]
  3. Fedele, G.; Donatti, C.I.; Harvey, C.A.; Hannah, L.; Hole, D.G. Transformative Adaptation to Climate Change for Sustainable Social-Ecological Systems. Environ. Sci. Policy 2019, 101, 116–125. [Google Scholar] [CrossRef]
  4. Simonet, G. De l’ajustement à La Transformation: Vers Un Essor de l’adaptation? Développement Durable Territ. 2016, 7, 1–17. [Google Scholar] [CrossRef]
  5. Rebotier, J. Adaptations Aux Changements Environnementaux et Territoires. Questions de (Science En) Société: Avant-Propos. Sud-Ouest Eur. 2014, 5–12. [Google Scholar] [CrossRef]
  6. Villalba, B.; Petit, O. Quinze Ans de Recherches Sur l’interface Entre Développement Durable et Territoires. Un Bilan Réflexif. Développement Durable Territ. 2014, 5, 10487. [Google Scholar] [CrossRef]
  7. François, A.; Gauché, E.; Génin, A. L’adaptation Des Territoires Aux Changements Climatiques Dans l’Oriental Marocain: La Vulnérabilité Entre Action et Perceptions. Vertigo 2016, 16, 17177. [Google Scholar] [CrossRef]
  8. Richard, D.; George-Marcelpoil, E.; Boudières, V. Changement Climatique et Développement Des Territoires de Montagne: Quelles Connaissances Pour Quelles Pistes d’action? J. Alp. Res. 2010, 98, 1322. [Google Scholar] [CrossRef]
  9. Baccour, S.; Albiac, J.; Ward, F.; Kahil, T.; Esteban, E.; Uche, J.; Calvo, E.; Crespo, D. Managing Climate Risks: New Evidence from Integrated Analysis at the Basin Scale. Int. J. Water Resour. Dev. 2024, 40, 915–939. [Google Scholar] [CrossRef]
  10. Ingrao, C.; Strippoli, R.; Lagioia, G.; Huisingh, D. Water Scarcity in Agriculture: An Overview of Causes, Impacts and Approaches for Reducing the Risks. Heliyon 2023, 9, e18507. [Google Scholar] [CrossRef]
  11. Longo, M.; Dal Ferro, N.; Lazzaro, B.; Morari, F. Trade-Offs among Ecosystem Services Advance the Case for Improved Spatial Targeting of Agri-Environmental Measures. J. Environ. Manag. 2021, 285, 112131. [Google Scholar] [CrossRef]
  12. Seguin, B. Climate Change and Its Impact on Agricultural Production, with a Focus on the Mediterranean Area. In Economics of Drought and Drought Preparedness in a Climate Change Context; Lopez-François, A., Ed.; Options Méditerranéennes: Série A. Séminaires Méditerranéens; CIHEAM-IAMZ: Zaragoza, Spain, 2010; pp. 9–18. [Google Scholar]
  13. Skoufias, E. Economic Crises and Natural Disasters: Coping Strategies and Policy Implications. World Dev. 2003, 31, 1087–1102. [Google Scholar] [CrossRef]
  14. Weiskopf, S.R.; Rubenstein, M.A.; Crozier, L.G.; Gaichas, S.; Griffis, R.; Halofsky, J.E.; Hyde, K.J.W.; Morelli, T.L.; Morisette, J.T.; Muñoz, R.C.; et al. Climate Change Effects on Biodiversity, Ecosystems, Ecosystem Services, and Natural Resource Management in the United States. Sci. Total Environ. 2020, 733, 137782. [Google Scholar] [CrossRef] [PubMed]
  15. Bhattacharya, A. Global Climate Change and Its Impact on Agriculture. In Changing Climate and Resource Use Efficiency in Plants; Academic Press: London, UK, 2019; pp. 1–50. ISBN 978-0-12-816209-5. [Google Scholar]
  16. Giannakopoulos, C.; Le Sager, P.; Bindi, M.; Moriondo, M.; Kostopoulou, E.; Goodess, C.M. Climatic Changes and Associated Impacts in the Mediterranean Resulting from a 2 °C Global Warming. Glob. Planet. Change 2009, 68, 209–224. [Google Scholar] [CrossRef]
  17. Giorgi, F.; Lionello, P. Climate Change Projections for the Mediterranean Region. Glob. Planet. Change 2008, 63, 90–104. [Google Scholar] [CrossRef]
  18. Lelieveld, J.; Hadjinicolaou, P.; Kostopoulou, E.; Chenoweth, J.; El Maayar, M.; Giannakopoulos, C.; Hannides, C.; Lange, M.A.; Tanarhte, M.; Tyrlis, E.; et al. Climate Change and Impacts in the Eastern Mediterranean and the Middle East. Clim. Change 2012, 114, 667–687. [Google Scholar] [CrossRef] [PubMed]
  19. Perrin, J.-A.; Bouisset, C. Emerging Local Public Action in Renewable Energy Production. Discussion of the Territorial Dimension of the Energy Transition Based on the Cases of Four Intermunicipal Cooperation Entities in France. Energy Policy 2022, 168, 113143. [Google Scholar] [CrossRef]
  20. Radtke, J.; Renn, O. Participation in Energy Transitions: A Comparison of Policy Styles. Energy Res. Soc. Sci. 2024, 118, 103743. [Google Scholar] [CrossRef]
  21. OECD Agricultural Policy Monitoring and Evaluation 2023: Adapting Agriculture to Climate Change; Agricultural Policy Monitoring and Evaluation; OECD: Paris, France, 2023; ISBN 978-92-64-82624-3.
  22. Rosenzweig, C.; Tubiello, F.N. Adaptation and Mitigation Strategies in Agriculture: An Analysis of Potential Synergies. Mitig. Adapt. Strat. Glob. Change 2007, 12, 855–873. [Google Scholar] [CrossRef]
  23. Smith, P.; Martino, D.; Cai, Z.; Gwary, D.; Janzen, H.; Kumar, P.; McCarl, B.; Ogle, S.; O’Mara, F.; Rice, C. Policy and Technological Constraints to Implementation of Greenhouse Gas Mitigation Options in Agriculture. Agric. Ecosyst. Environ. 2007, 118, 6–28. [Google Scholar] [CrossRef]
  24. Howden, S.M.; Soussana, J.-F.; Tubiello, F.N.; Chhetri, N.; Dunlop, M.; Meinke, H. Adapting Agriculture to Climate Change. Proc. Natl. Acad. Sci. USA 2007, 104, 19691–19696. [Google Scholar] [CrossRef] [PubMed]
  25. Saleem, M. Possibility of Utilizing Agriculture Biomass as a Renewable and Sustainable Future Energy Source. Heliyon 2022, 8, e08905. [Google Scholar] [CrossRef] [PubMed]
  26. Pari, L. (Ed.) Renewable Energy Production from Energy Crops and Agricultural Residues; MDPI: Basel, Switerland, 2021; ISBN 978-3-0365-0107-9. [Google Scholar]
  27. Don, A.; Seidel, F.; Leifeld, J.; Kätterer, T.; Martin, M.; Pellerin, S.; Emde, D.; Seitz, D.; Chenu, C. Reply Letter to Munoz et al. ‘on the Importance of Time in Carbon Sequestration in Soils and Climate Change Mitigation’—Keep Carbon Sequestration Terminologies Consistent and Functional. Glob. Change Biol. 2024, 30, e17230. [Google Scholar] [CrossRef]
  28. European Environment Agency (EEA). Climate Change, Impacts and Vulnerability in Europe 2016. An Indicator-Based Report; EEA Report; Publications Office of the European: Luxembourg, 2017; Volume 1. [Google Scholar]
  29. Fatemi, F.; Ardalan, A.; Aguirre, B.; Mansouri, N.; Mohammadfam, I. Social Vulnerability Indicators in Disasters: Findings from a Systematic Review. Int. J. Disaster Risk Reduct. 2017, 22, 219–227. [Google Scholar] [CrossRef]
  30. Füssel, H.-M. Vulnerability: A Generally Applicable Conceptual Framework for Climate Change Research. Glob. Environ. Change 2007, 17, 155–167. [Google Scholar] [CrossRef]
  31. Maiti, S.; Jha, S.K.; Garai, S.; Nag, A.; Bera, A.K.; Paul, V.; Upadhaya, R.C.; Deb, S.M. An Assessment of Social Vulnerability to Climate Change among the Districts of Arunachal Pradesh, India. Ecol. Indic. 2017, 77, 105–113. [Google Scholar] [CrossRef]
  32. Murphy, E.; Scott, M. Household Vulnerability in Rural Areas: Results of an Index Applied during a Housing Crash, Economic Crisis and under Austerity Conditions. Geoforum 2014, 51, 75–86. [Google Scholar] [CrossRef]
  33. Nelson, R.; Kokic, P.; Crimp, S.; Martin, P.; Meinke, H.; Howden, S.M.; de Voil, P.; Nidumolu, U. The Vulnerability of Australian Rural Communities to Climate Variability and Change: Part II—Integrating Impacts with Adaptive Capacity. Environ. Sci. Policy 2010, 13, 18–27. [Google Scholar] [CrossRef]
  34. Pandey, R.; Jha, S.K.; Alatalo, J.M.; Archie, K.M.; Gupta, A.K. Sustainable Livelihood Framework-Based Indicators for Assessing Climate Change Vulnerability and Adaptation for Himalayan Communities. Ecol. Indic. 2017, 79, 338–346. [Google Scholar] [CrossRef]
  35. Preston, B.; Stafford-Smith, M. Framing Vulnerability and Adaptive Capacity Assessment: Discussion Paper; Climate Adaptation Flagship Working Paper; CSIRO: Aspendale, VIC, Australia, 2009. [Google Scholar]
  36. Stânga, I.C.; Grozavu, A. Quantifying Human Vulnerability in Rural Areas: Case Study of Tutova Hills (Eastern Romania). Nat. Hazards Earth Syst. Sci. 2012, 12, 1987. [Google Scholar] [CrossRef]
  37. Tesso, G. Individual Level Vulnerability to Climate Change Impact among Crop Dependent Communities of Western Ethiopia. J. Agric. Econ. Dev. 2013, 2, 356–370. [Google Scholar]
  38. Tzilivakis, J.; Warner, D.J.; Green, A.; Lewis, K.A. Adapting to Climate Change: Assessing the Vulnerability of Ecosystem Services in Europe in the Context of Rural Development. Mitig. Adapt. Strateg. Glob. Change 2015, 20, 547–572. [Google Scholar] [CrossRef]
  39. IPCC Climate Change 2007: Impacts, Adaptation and Vulnerability. Contribution of Working Group II to the Fourth Assessment Report of the Intergovernmental Panel on Climate Change; Parry, M.L., Canziani, O.F., Palutikof, J.P., van der Linden, P.J., Hanson, C.E., Eds.; Cambridge University Press: Cambridge, UK, 2007. [Google Scholar]
  40. IPCC. IPCC Climate Change 2014: Synthesis Report. Contribution of Working Groups I, II and III to the Fifth Assessment Report of the Intergovernmental Panel on Climate Change; Core Writing Team, Pachauri, R.K., Meyer, L.A., Eds.; IPCC: Geneva, Switzerland, 2014. [Google Scholar]
  41. Neset, T.-S.; Wiréhn, L.; Opach, T.; Glaas, E.; Linnér, B.-O. Evaluation of Indicators for Agricultural Vulnerability to Climate Change: The Case of Swedish Agriculture. Ecol. Indic. 2019, 105, 571–580. [Google Scholar] [CrossRef]
  42. Asrat, P.; Simane, B. Farmers’ Perception of Climate Change and Adaptation Strategies in the Dabus Watershed, North-West Ethiopia. Ecol. Process 2018, 7, 7. [Google Scholar] [CrossRef]
  43. Wise, R.M.; Fazey, I.; Stafford Smith, M.; Park, S.E.; Eakin, H.C.; Archer Van Garderen, E.R.M.; Campbell, B. Reconceptualising Adaptation to Climate Change as Part of Pathways of Change and Response. Glob. Environ. Change 2014, 28, 325–336. [Google Scholar] [CrossRef]
  44. Jha, C.K.; Gupta, V. Farmer’s Perception and Factors Determining the Adaptation Decisions to Cope with Climate Change: An Evidence from Rural India. Environ. Sustain. Indic. 2021, 10, 100112. [Google Scholar] [CrossRef]
  45. Bryan, E.; Ringler, C.; Okoba, B.; Roncoli, C.; Silvestri, S.; Herrero, M. Adapting Agriculture to Climate Change in Kenya: Household Strategies and Determinants. J. Environ. Manag. 2013, 114, 26–35. [Google Scholar] [CrossRef]
  46. Vautier, C.; Roggero, P.; Adreit, F.; Sibertin-Blanc, C. Evaluation by Simulation of the Social Acceptability of Agricultural Policies for Water Quality. In Information Technologies in Environmental Engineering; Athanasiadis, I.N., Rizzoli, A.E., Mitkas, P.A., Gómez, J.M., Eds.; Environmental Science and Engineering; Springer: Berlin/Heidelberg, Germany, 2009; pp. 478–490. ISBN 978-3-540-88350-0. [Google Scholar]
  47. Bhave, A.G.; Mishra, A.; Raghuwanshi, N.S. A Combined Bottom-up and Top-down Approach for Assessment of Climate Change Adaptation Options. J. Hydrol. 2014, 518, 150–161. [Google Scholar] [CrossRef]
  48. Smit, B.; Burton, I.; Klein, R.J.T.; Wandel, J. An Anatomy of Adaptation to Climate Change and Variability. Clim. Change 2000, 45, 223–251. [Google Scholar] [CrossRef]
  49. Smit, B.; Wandel, J. Adaptation, Adaptive Capacity and Vulnerability. Glob. Environ. Change 2006, 16, 282–292. [Google Scholar] [CrossRef]
  50. Sanyé-Mengual, E.; Specht, K.; Krikser, T.; Vanni, C.; Pennisi, G.; Orsini, F.; Gianquinto, G.P. Social Acceptance and Perceived Ecosystem Services of Urban Agriculture in Southern Europe: The Case of Bologna, Italy. PLoS ONE 2018, 13, e0200993. [Google Scholar] [CrossRef]
  51. Vy, D.; Mh, S.; Nm, D. Assessing the Social Acceptance of Agricultural Drought Adaptation Measures in Chaharmahal and Bakhtiari Province, Iran. J. Geogr. Nat. Disast 2018, 6, 234. [Google Scholar] [CrossRef]
  52. Jones, B.; Andrey, J. Vulnerability Index Construction: Methodological Choices and Their Influence on Identifying Vulnerable Neighbourhoods. Int. J. Emerg. Manag. 2007, 4, 269. [Google Scholar] [CrossRef]
  53. Wolf, J.; Moser, S.C. Individual Understandings, Perceptions, and Engagement with Climate Change: Insights from in-Depth Studies across the World. WIREs Clim. Change 2011, 2, 547–569. [Google Scholar] [CrossRef]
  54. Pelling, M. Adaptation to Climate Change: From Resilience to Transformation; Routledge: Oxford, UK; New York, NY, USA, 2011; ISBN 978-0-415-47750-5. [Google Scholar]
  55. Deressa, T.; Hassan, R.M.; Ringler, C. Measuring Ethiopian Farmers’ Vulnerability to Climate Change Across Regional States; IFPRI Discussion Paper; International Food Policy Research Institute (IFPRI): Washington, DC, USA, 2008. [Google Scholar]
  56. Uddin, M.; Bokelmann, W.; Entsminger, J. Factors Affecting Farmers’ Adaptation Strategies to Environmental Degradation and Climate Change Effects: A Farm Level Study in Bangladesh. Climate 2014, 2, 223–241. [Google Scholar] [CrossRef]
  57. Adger, W.N. Social Vulnerability to Climate Change and Extremes in Coastal Vietnam. World Dev. 1999, 27, 249–269. [Google Scholar] [CrossRef]
  58. Polsky, C.; Neff, R.; Yarnal, B. Building Comparable Global Change Vulnerability Assessments: The Vulnerability Scoping Diagram. Glob. Environ. Change 2007, 17, 472–485. [Google Scholar] [CrossRef]
  59. Borges, F.J.A.; Ribeiro, B.R.; Lopes, L.E.; Loyola, R. Bird Vulnerability to Climate and Land Use Changes in the Brazilian Cerrado. Biol. Conserv. 2019, 236, 347–355. [Google Scholar] [CrossRef]
  60. Estoque, R.C.; Ishtiaque, A.; Parajuli, J.; Athukorala, D.; Rabby, Y.W.; Ooba, M. Has the IPCC’s Revised Vulnerability Concept Been Well Adopted? Ambio 2023, 52, 376–389. [Google Scholar] [CrossRef]
  61. Foden, W.B.; Young, B.E.; Akçakaya, H.R.; Garcia, R.A.; Hoffmann, A.A.; Stein, B.A.; Thomas, C.D.; Wheatley, C.J.; Bickford, D.; Carr, J.A.; et al. Climate Change Vulnerability Assessment of Species. WIREs Clim. Change 2019, 10, e551. [Google Scholar] [CrossRef]
  62. Nguyen, T.T.X.; Bonetti, J.; Rogers, K.; Woodroffe, C.D. Indicator-Based Assessment of Climate-Change Impacts on Coasts: A Review of Concepts, Methodological Approaches and Vulnerability Indices. Ocean. Coast. Manag. 2016, 123, 18–43. [Google Scholar] [CrossRef]
  63. Timberlake, T.J.; Schultz, C.A. Climate Change Vulnerability Assessment for Forest Management: The Case of the U.S. Forest Service. Forests 2019, 10, 1030. [Google Scholar] [CrossRef]
  64. Das, S.; Ghosh, A.; Hazra, S.; Ghosh, T.; Safra De Campos, R.; Samanta, S. Linking IPCC AR4 & AR5 Frameworks for Assessing Vulnerability and Risk to Climate Change in the Indian Bengal Delta. Prog. Disaster Sci. 2020, 7, 100110. [Google Scholar] [CrossRef]
  65. Zebisch, M.; Schneiderbauer, S.; Fritzsche, K.; Bubeck, P.; Kienberger, S.; Kahlenborn, W.; Schwan, S.; Below, T. The Vulnerability Sourcebook and Climate Impact Chains—A Standardised Framework for a Climate Vulnerability and Risk Assessment. Int. J. Clim. Change Strateg. Manag. 2021, 13, 35–59. [Google Scholar] [CrossRef]
  66. Cheng, W.; Li, Y.; Zuo, W.; Du, G.; Stanny, M. Spatio-Temporal Detection of Agricultural Disaster Vulnerability in the World and Implications for Developing Climate-Resilient Agriculture. Sci. Total Environ. 2024, 928, 172412. [Google Scholar] [CrossRef]
  67. Oyarzo, C.; Kaulen, S.; Marchant, C.; Rodríguez, P.; Caviedes, J.; Miranda, M.D.; Schlicht, G.; Ibarra, J.T. Vulnerability of Small-Scale Farming Livelihoods under Climate Variability in a Globally Important Archipelago of the Global South. Environ. Sustain. Indic. 2024, 24, 100540. [Google Scholar] [CrossRef]
  68. Adger, W.N. Vulnerability. Glob. Environ. Change 2006, 16, 268–281. [Google Scholar] [CrossRef]
  69. Brooks, N.; Adger, W.N.; Kelly, P.M. The Determinants of Vulnerability and Adaptive Capacity at the National Level and the Implications for Adaptation. Glob. Environ. Change 2005, 15, 151–163. [Google Scholar] [CrossRef]
  70. IPCC. Climate Change 2001: Impacts, Adaptation, and Vulnerability. Contribution of Working Group II to the Third Assessment Report of the Intergovernmental Panel on Climate Change; McCarthy, J.J., Canziani, O.F., Leary, N.A., Dokken, D.J., White, K.S., Eds.; Cambridge University Press: Cambridge, UK, 2001; ISBN 0-521-01500-6. [Google Scholar]
  71. Rana, I.A.; Routray, J.K. Actual Vis-à-Vis Perceived Risk of Flood Prone Urban Communities in Pakistan. Int. J. Disaster Risk Reduct. 2016, 19, 366–378. [Google Scholar] [CrossRef]
  72. Berry, P.M.; Rounsevell, M.D.A.; Harrison, P.A.; Audsley, E. Assessing the Vulnerability of Agricultural Land Use and Species to Climate Change and the Role of Policy in Facilitating Adaptation. Environ. Sci. Policy 2006, 9, 189–204. [Google Scholar] [CrossRef]
  73. Downing, T.E. Assessing Socioeconomic Vulnerability to Famine: Frameworks, Concepts, and Applications; FEWS Working Paper; U.S. Agency for International Development: Washington, DC, USA, 1990. [Google Scholar]
  74. Füssel, H.-M.; Klein, R.J. Climate Change Vulnerability Assessments: An Evolution of Conceptual Thinking. Clim. Change 2006, 75, 301–329. [Google Scholar] [CrossRef]
  75. Hinkel, J. “Indicators of Vulnerability and Adaptive Capacity”: Towards a Clarification of the Science–Policy Interface. Glob. Environ. Change 2011, 21, 198–208. [Google Scholar] [CrossRef]
  76. O’Brien, K.; Leichenko, R.; Kelkar, U.; Venema, H.; Aandahl, G.; Tompkins, H.; Javed, A.; Bhadwal, S.; Barg, S.; Nygaard, L.; et al. Mapping Vulnerability to Multiple Stressors: Climate Change and Globalization in India. Glob. Environ. Change 2004, 14, 303–313. [Google Scholar] [CrossRef]
  77. Moss, R.H.; Brenkert, A.L.; Malone, E.L. Vulnerability to Climate Change: A Quantitative Approach; Pacific Northwest National Laboratories: Richland, WA, USA, 2001. [Google Scholar]
  78. UN/ISDR. Living with Risk: A Global Review of Disaster Reduction Initiatives; United Nations: Geneva, Switzerland, 2004; ISBN 978-92-1-101064-0. [Google Scholar]
  79. Vogel, E.; Meyer, R. Climate Change, Climate Extremes, and Global Food Production-Adaptation in the Agricultural Sector. In Resilience: The Science of Adaptation to Climate Change; Zommers, Z., Alverson, K., Eds.; Elsevier: Amsterdam, The Netherlands, 2018; pp. 31–49. ISBN 978-0-12-811891-7. [Google Scholar]
  80. Moser, S.C. Entering the Period of Consequences: The Explosive US Awakening to the Need for Adaptation. In Climate Change Adaptation in Developed Nations; Ford, J.D., Berrang-Ford, L., Eds.; Advances in Global Change Research; Springer Netherlands: Dordrecht, The Netherlands, 2011; Volume 42, pp. 33–49. ISBN 978-94-007-0566-1. [Google Scholar]
  81. Vincent, K. Creating an Index of Social Vulnerability to Climate Change in Africa; Working Paper; Tyndall Centre for Climate Change Research: Norwich, UK, 2004. [Google Scholar]
  82. Birkmann, J. Risk and Vulnerability Indicators at Different Scales: Applicability, Usefulness and Policy Implications. Environ. Hazards 2007, 7, 20–31. [Google Scholar] [CrossRef]
  83. Tate, E. Social Vulnerability Indices: A Comparative Assessment Using Uncertainty and Sensitivity Analysis. Nat. Hazards 2012, 63, 325–347. [Google Scholar] [CrossRef]
  84. Hagenlocher, M.; Hölbling, D.; Kienberger, S.; Vanhuysse, S.; Zeil, P. Spatial Assessment of Social Vulnerability in the Context of Landmines and Explosive Remnants of War in Battambang Province, Cambodia. Int. J. Disaster Risk Reduct. 2016, 15, 148–161. [Google Scholar] [CrossRef]
  85. Fellmann, T. The Assessment of Climate Change-Related Vulnerability in the Agricultural Sector: Reviewing Conceptual Frameworks. In Proceedings of the Building Resilience for Adaptation to Climate Change in the Agriculture Sector—Proceedings of a Joint FAO/OECD Workshop, Rome, Italy, 23–24 April 2012; Meybeck, A., Lankoski, J., Redfern, S., Azzu, N., Gitz, V., Eds.; FAO: Roma, Italy, 2012; pp. 37–61, ISBN 978-92-5-107373-5. [Google Scholar]
  86. Allen, K. Vulnerability Reduction and the Community-Based Approach. In Natural Disasters and Development in a Globalizing World; Pelling, M., Ed.; Routledge: London, UK, 2003; pp. 170–185. ISBN 0-415-27958-5. [Google Scholar]
  87. André, G. Cartographie Du Risque Naturel Dans Le Monde. Etude Comparative Entre Une Approche d’ordre Social et Une Approche d’ordre Économique de La Vulnérabilité. Cybergeo Eur. J. Geogr. 2004, 286, 1–12. [Google Scholar] [CrossRef]
  88. Adams, R.M. Global Climate Change and Agriculture: An Economic Perspective. Am. J. Agric. Econ. 1989, 71, 1272–1279. [Google Scholar] [CrossRef]
  89. Cutter, S.L.; Mitchell, J.T.; Scott, M.S. Revealing the Vulnerability of People and Places: A Case Study of Georgetown County, South Carolina. Ann. Assoc. Am. Geogr. 2000, 90, 713–737. [Google Scholar] [CrossRef]
  90. Sehgal, V.K.; Dhakar, R. Geospatial Approach for Assessment of Biophysical Vulnerability to Agricultural Drought and Its Intra-Seasonal Variations. Environ. Monit. Assess. 2016, 188, 197. [Google Scholar] [CrossRef]
  91. Chaudhuri, S.; Jalan, J.; Suryahadi, A. Assessing Household Vulnerability to Poverty from Cross-Sectional Data: A Methodology and Estimates from Indonesia; Columbia University: New York, NY, USA, 2011. [Google Scholar]
  92. Christiaensen, L.; Subbarao, K. Towards an Understanding of Household Vulnerability in Rural Kenya. J. Afr. Econ. 2005, 14, 520–558. [Google Scholar] [CrossRef]
  93. Brooks, N. Vulnerability, Risk and Adaptation: A Conceptual Framework; Working Paper; Tyndall Centre for Climate Change Research: Norwich, UK, 2003. [Google Scholar]
  94. D’Ercole, R.; Metzger, P. Territorial Vulnerability: A New Approach of Risks in Urban Areas. Cybergeo Eur. J. Geogr. Doss. Vulnérabilités Urbaines Au Sud. 2009, 447, 11–16. [Google Scholar] [CrossRef]
  95. Kahneman, D.; Frederick, S. Representativeness Revisited: Attribute Substitution in Intuitive Judgment. In Heuristics and Biases: The Psychology of Intuitive Judgment; Gilovich, T., Griffin, D., Kahneman, D., Eds.; Cambridge University Press: Cambridge, UK, 2002; pp. 49–81. [Google Scholar]
  96. Kahneman, D.; Tversky, A. Prospect Theory: An Analysis of Decision under Risk. In Handbook of the Fundamentals of Financial Decision Making; MacLean, L.C., Ziemba, W.T., Eds.; World scientific handbook in financial economics series; World Scientific: Londres, UK, 2013; pp. 99–127. ISBN 978-981-4417-34-1. [Google Scholar]
  97. Kahneman, D.; Tversky, A. On the Reality of Cognitive Illusions. Psychol. Rev. 1996, 103, 582–591. [Google Scholar] [CrossRef]
  98. INSEE (France) Recensement 2015: Résultats Sur Un Territoire, Bases de Données et Fichiers Détail. Available online: https://www.insee.fr/fr/information/3561862 (accessed on 12 May 2025).
  99. Conseil Départemental de l’Hérault Climatologie. Available online: https://odee.herault.fr/index.php/thematiques/climatologie (accessed on 13 May 2018).
  100. Perrier-Cornet, P. Repenser les Campagnes; Bibliothèque des Territoires; Editions de l’Aube; La Tour d’Aigues; DATAR: Paris, France, 2002; ISBN 978-2-87678-706-3. [Google Scholar]
  101. Vernières, M. Les inégalités territoriales: Le cas des territoires ruraux. In Proceedings of the Colloque International Inégalités et Développement Dans les Pays Méditerranéens, Istanbul, Turkey, 21–23 May 2009. [Google Scholar]
  102. Hervieu, B. MediTerra 2008: Les Futurs Agricoles et Alimentaires en Méditerranée; Presses de Sciences Po: Paris, France, 2008; p. 376. [Google Scholar]
  103. Del Pozo, A.; Brunel-Saldias, N.; Engler, A.; Ortega-Farias, S.; Acevedo-Opazo, C.; Lobos, G.A.; Jara-Rojas, R.; Molina-Montenegro, M.A. Climate Change Impacts and Adaptation Strategies of Agriculture in Mediterranean-Climate Regions (MCRs). Sustainability 2019, 11, 2769. [Google Scholar] [CrossRef]
  104. Reseau Action Climat-France. Changement Climatiques: Comprendre et Réagir; Reseau Action Climat-France: Montreuil, France, 2011. [Google Scholar]
  105. Metayer, N. Life AgriAdapt: Caractérisation de la Vulnérabilité au Changement Climatique des Exploitations Agricoles; ADEME; L’Harmattan: Paris, France, 2019; p. 44. [Google Scholar]
  106. Loi, D.T.; Huong, L.V.; Tuan, P.A.; Hong Nhung, N.T.; Quynh Huong, T.T.; Hoa Man, B.T. An Assessment of Agricultural Vulnerability in the Context of Global Climate Change: A Case Study in Ha Tinh Province, Vietnam. Sustainability 2022, 14, 1282. [Google Scholar] [CrossRef]
  107. Berhanu, A.A.; Ayele, Z.B.; Dagnew, D.C.; Melese, T.; Fenta, A.B.; Kassie, K.E. Smallholder Farmers’ Vulnerability to Climate Change and Variability: Evidence from Three Agroecologies in the Upper Blue Nile, Ethiopia. Heliyon 2024, 10, e28277. [Google Scholar] [CrossRef]
  108. Snaibi, W.; Mezrhab, A.; Laaboudi, M. Evaluation de la vulnérabilité des éleveurs des parcours arides du Maroc à l’égard du changement climatique à l’aide de l’indice de vulnérabilité des moyens de subsistance des ménages ruraux-Cas de la zone des hauts plateaux de l’Oriental. Afr. Mediterr. Agric. J.-Al Awamia 2024, 247–261. [Google Scholar] [CrossRef]
  109. Das, S.; Majumder, S.; Sharma, K.K. Assessing Integrated Agricultural Livelihood Vulnerability to Climate Change in the Coastal Region of West Bengal: Implication for Spatial Adaptation Planning. Reg. Stud. Mar. Sci. 2023, 57, 102748. [Google Scholar] [CrossRef]
  110. Derbile, E.K.; Bonye, S.Z.; Yiridomoh, G.Y. Mapping Vulnerability of Smallholder Agriculture in Africa: Vulnerability Assessment of Food Crop Farming and Climate Change Adaptation in Ghana. Environ. Chall. 2022, 8, 100537. [Google Scholar] [CrossRef]
  111. Hoque, M.Z.; Haque, M.E.; Islam, M.S. Mapping Integrated Vulnerability of Coastal Agricultural Livelihood to Climate Change in Bangladesh: Implications for Spatial Adaptation Planning. Phys. Chem. Earth Parts A/B/C 2022, 125, 103080. [Google Scholar] [CrossRef]
  112. Krishnan, P.; Ananthan, P.S.; Purvaja, R.; Joyson Joe Jeevamani, J.; Amali Infantina, J.; Srinivasa Rao, C.; Anand, A.; Mahendra, R.S.; Sekar, I.; Kareemulla, K.; et al. Framework for Mapping the Drivers of Coastal Vulnerability and Spatial Decision Making for Climate-Change Adaptation: A Case Study from Maharashtra, India. Ambio 2019, 48, 192–212. [Google Scholar] [CrossRef] [PubMed]
  113. Seguin, G. ‘Terroirs’ and Pedology of Wine Growing. Experientia 1986, 42, 861–873. [Google Scholar] [CrossRef]
  114. Meynard, J.-M. L’agroécologie, Un Nouveau Rapport Aux Savoirs et à l’innovation. OCL Oilseeds Fats Crops Lipids 2017, 24, 9. [Google Scholar] [CrossRef]
  115. Droy, I.; Rasolofo, P. Les Approches de la Vulnérabilité Alimentaire Dans le sud de Madagascar; Document de travail; CED: Pessac, France, 2004. [Google Scholar]
  116. Cutter, S.L. Social Science Perspectives on Hazards and Vulnerability Science. In Geophysical Hazards: Minimizing Risk, Maximizing Awareness; Beer, T., Ed.; Springer Netherlands: Dordrecht, The Netherlands, 2010; pp. 17–30. ISBN 978-90-481-3236-2. [Google Scholar]
  117. Cutter, S.L.; Boruff, B.J.; Shirley, W.L. Social Vulnerability to Environmental Hazards. Soc. Sci. Q. 2003, 84, 242–261. [Google Scholar] [CrossRef]
  118. Maréchal, G.; Noël, J.; Wallet, F. Les Projets Alimentaires Territoriaux (PAT): Entre Rupture, Transition et Immobilisme? Pour 2018, 234–235, 261–270. [Google Scholar] [CrossRef]
  119. Owen, G. What Makes Climate Change Adaptation Effective? A Systematic Review of the Literature. Glob. Environ. Change 2020, 62, 102071. [Google Scholar] [CrossRef]
  120. Butault, J.-P.; Delame, N.; Lerouvillois, P. Activité Extérieure et Revenus Des Ménages Agricoles. Économie Rural. 2005, 75–90. [Google Scholar] [CrossRef]
  121. Jetté-Nantel, S.; Freshwater, D.; Beaulieu, M.; Katchova, A. Variabilité du Revenu Agricole et Diversification hors Ferme Dans l’agriculture Canadienne; Document de Recherche; Statistiques Canada: Ottawa, ON, Canada, 2011. [Google Scholar]
  122. Mishra, A.K.; Sandretto, C.L. Stability of Farm Income and the Role of Nonfarm Income in US Agriculture. Rev. Agric. Econ. 2002, 24, 208–221. [Google Scholar] [CrossRef]
  123. Razafimahatratra, H.M.; Raharison, T.; Bélières, J.-F.; Autfray, P.; Salgado, P.; Rakotofiringa, H.Z. Systèmes de Production, Pratiques, Performances et Moyens d’existence des Exploitations Agricoles du Moyen-Ouest du Vakinankaratra; SPAD: Antananarivo, Madagascar, 2017. [Google Scholar]
  124. Howden, M.S.; Ash, A.; Barlow, S.; Booth, T.; Charles, S.; Cechet, B.; Crimp, S.; Gifford, R.; Hennessy, K.; Jones, R.; et al. An Overview of the Adaptive Capacity of the Australian Agricultural Sector to Climate Change: Options, Costs and Benefits; CSIRO: Canberra, Australia, 2003. [Google Scholar]
  125. ADEME Sols et Changement Climatique. Available online: https://www.ademe.fr/expertises/produire-autrement/production-agricole/chiffres-cles-observations/dossier/qualite-sols/sols-changement-climatique (accessed on 15 June 2025).
  126. Chenu, C.; Chevallier, T. Les Sols Au Coeur Des Effets Du Changement Climatique. Biofutur 2015, 34, 27–28. [Google Scholar]
  127. Boutin, F.; Payan, J.C. Viticulture et Changement Climatique: Adaptation de La Conduite Du Vignoble Méditerranéen. Innov. Agron. 2012, 25, 193–203. [Google Scholar]
  128. Weiss, K.; Moser, G.; Germann, C. Perception de l’environnement, Conceptions Du Métier et Pratiques Culturales Des Agriculteurs Face Au Développement Durable. Eur. Rev. Appl. Psychol. 2006, 56, 73–81. [Google Scholar] [CrossRef]
  129. Wezel, A.; Casagrande, M.; Celette, F.; Vian, J.-F.; Ferrer, A.; Peigné, J. Agroecological Practices for Sustainable Agriculture. A Review. Agron. Sustain. Dev. 2014, 34, 1–20. [Google Scholar] [CrossRef]
  130. CCR (Caisse Centrale de Réassurance, France). Arrêtés de Catastrophe Naturelle. Available online: https://catastrophes-naturelles.ccr.fr/les-arretes (accessed on 12 May 2025).
  131. Conseil Départemental de l’Hérault Annales Climatologiques et Hydrologiques. Available online: https://odee.herault.fr/index.php/thematiques/climatologie/40-annales-climatologiques-et-hydrologiques (accessed on 10 May 2019).
  132. Engle, N.L. Adaptive Capacity and Its Assessment. Glob. Environ. Change 2011, 21, 647–656. [Google Scholar] [CrossRef]
  133. Dubois, J.-L.; Rousseau, S. Reinforcing Households’ Capabilities as a Way to Reduce Vulnerability and Prevent Poverty in Equitable Terms. In The Capability Approach: Concepts, Measures and Applications; Comim, F., Qizilbash, M., Alkire, S., Eds.; Cambridge University Press: Cambridge, UK, 2008; pp. 421–436. ISBN 978-0-521-86287-5. [Google Scholar]
  134. Ellis, F. Rural Livelihoods and Diversity in Developing Countries; Oxford University Press: Oxford, UK, 2000; ISBN 978-0-19-829696-6. [Google Scholar]
  135. Ducos, G.; Barreau, B. Quels Indicateurs Pour Mesurer la Qualité de la Croissance? La note d’analyse; France stratégie: Paris, France, 2014. [Google Scholar]
  136. Garrabé, M. Modèle à Capitaux Multiples et Analyse Sociale du Cycle de vie des Capacités: Méthodologie Générale; Université Montpellier 1: Montpellier, France, 2012. [Google Scholar]
  137. Dong, Z.; Pan, Z.; An, P.; Wang, L.; Zhang, J.; He, D.; Han, H.; Pan, X. A Novel Method for Quantitatively Evaluating Agricultural Vulnerability to Climate Change. Ecol. Indic. 2015, 48, 49–54. [Google Scholar] [CrossRef]
  138. Shukla, R.; Sachdeva, K.; Joshi, P.K. Inherent Vulnerability of Agricultural Communities in Himalaya: A Village-Level Hotspot Analysis in the Uttarakhand State of India. Appl. Geogr. 2016, 74, 182–198. [Google Scholar] [CrossRef]
  139. Shukla, P.R.; Skea, J.; Calvo Buendia, E.; Masson-Delmotte, V.; Pörtner, H.-O.; Roberts, D.C.; Zhai, P.; Slade, R.; Connors, S.; van Diemen, R.; et al. Climate Change and Land. An IPCC Special Report on Climate Change, Desertification, Land Degradation, Sustainable Land Management, Food Security, and Greenhouse Gas Fluxes in Terrestrial Ecosystems; Intergovernmental Panel on Climate Change: Genève, Switzerland, 2019. [Google Scholar]
  140. Dachary-Bernard, J.; Rey-Valette, H.; Rulleau, B. Preferences among Coastal and Inland Residents Relating to Managed Retreat: Influence of Risk Perception in Acceptability of Relocation Strategies. J. Environ. Manag. 2019, 232, 772–780. [Google Scholar] [CrossRef]
  141. Brooks, N.; Anderson, S.; Burton, I.; Fisher, S.; Rai, N.; Tellam, I. An Operational Framework for Tracking Adaptation and Measuring Development (TAMD); Climate Change Working Paper; IED: London, UK, 2013. [Google Scholar]
  142. Van Der Wolf, J.; Jassogne, L.; Gram, G.I.L.; Vaast, P. Turning Local Knowledge on Agroforestry into an Online Decision-Support Tool for Tree Selection in Smallholders’ Farms. Exp. Agric. 2019, 55, 50–66. [Google Scholar] [CrossRef]
  143. Ekins, P.; Dresner, S.; Dahlström, K. The Four Capital Method of Sustainable Development Evaluation. Eur. Environ. 2008, 18, 63–80. [Google Scholar] [CrossRef]
  144. Banque Mondiale (Washington, USA). In D’où vient la Richesse des Nations? Economica: Paris, France, 2007; ISBN 978-2-7178-5322-3.
  145. Stiglitz, J.; Sen, A.; Fitoussi, J.-P. Richesse des Nations et Bien-être des Individus: Performances Économiques et Progrès Social; Odile Jacob: Paris, France, 2009; ISBN 2-7381-9381-1. [Google Scholar]
  146. Noble, I.R.; Huq, S.; Anokhin, Y.A.; Carmin, J.; Goudou, D.; Lansigan, F.P.; Osman-Elasha, B.; Villamizar, A. Adaptation Needs and Options. In Climate Change 2014: Impacts, Adaptation, and Vulnerability. Part A: Global and Sectoral Aspects. Contribution of Working Group II to the Fifth Assessment Report of the Intergovernmental Panel on Climate Change; Field, C.B., Barros, V.R., Dokken, D.J., Mach, K.J., Mastrandrea, M.D., Bilir, T.E., Chatterjee, M., Ebi, K.L., Estrada, Y.O., Genova, R.C., et al., Eds.; Cambridge University Press: Cambridge, UK, 2014; pp. 833–868. [Google Scholar]
  147. Rickards, L.; Howden, S.M. Transformational Adaptation: Agriculture and Climate Change. Crop Pasture Sci. 2012, 63, 240–250. [Google Scholar] [CrossRef]
  148. Watkiss, P.; Cimato, F. The Economics of Adaptation and Climate-Resilient Development: Lessons from Projects for Key Adaptation Challenges; Centre for Climate Change Economics and Policy: Leeds, UK, 2016. [Google Scholar]
  149. Rios, A.A.; Espinosa, D.M.; Revollo, D.A. Present and Future of the Water Deposits in Calakmul, Mexico: Analysis of the Behaviour of Inhabitants Facing Climate Change; Working Papers, n. 201470; Latin American and Caribbean Environmental Economics Program: San José, Costa Rica, 2014; 46p. [Google Scholar]
  150. Guillaumont, P.; Guillaumont-Jeanneney, S.; Wagner, L. Mesurer les Vulnérabilités Pour Allouer l’aide au Développement, en Particulier en Afrique; FERDI: Clermont-Ferrand, France, 2020; ISBN 978-2-9550779-7-9. [Google Scholar]
Figure 2. Presentation of the study area (PHLV territory) and the locations of farmers surveyed.
Land 14 01388 g002
Figure 3. Different farm types based on their vulnerability level to CC.
Land 14 01388 g003
Table 1. Formulas that can be used to calculate the vulnerability index.
FormulaReferences
V = 1/3 (E + S + 1 − AC) [106]
V = (E − AC) × S[107,108]
V = (E * S)/AC[66,109,110,111,112]
V = E + S − AC[67]
Where, V is vulnerability, E is exposure, S is sensitivity, and AC is adaptive capacity.
Table 2. Sampling plan of surveyed farms per crop type and geography.
Main Farmed
Crop
Wine FarmsFruit Tree FarmsField Crop FarmsVegetable FarmsMixed-Crop FarmsTotal
GeographyNo.%No.%No.%No.%No.%No.%
Mountain2754%445%222%660%542%4449%
Plain2346%555%778%440%758%4651%
Total50100%9100%9100%10100%12100%90100%
Table 3. The main vulnerability variables retained for each vulnerability component with references.
VariablesReferences
Exposure
Number of average annual climatic events (flood, spring frost, hail, and drought) over the period 2009–2018 [31,55]
Sensitivity
Soil type [37,38,113]
Trees age (for perennial crops)(Agricultural cooperative technicians)
Plot orientation (for perennial crops)(Agricultural cooperative technicians)
Crop diversification [37,41,114]
Varietal diversification (varieties, rootstocks) [37,41,114]
Adaptive capacity linked to human capital
Training [37,115]
Agricultural experience [37]
Age of farmer[116,117]
Agricultural Network [29,33]
Adaptive capacity linked to economic capital
Product marketing [118,119]
Off-farm income [120,121,122]
Legal status(Chambre d’agriculture)
Land status [123]
Crop insurance [49,119,124]
Adaptive capacity linked to technical capital
Soil management [125,126]
Irrigation [119,127]
Plant management [114,128]
Agro-ecological infrastructure [129]
Table 4. Scores of different vulnerability variables according to farmers’ declarations and depending on vulnerability components and farm types.
ComponentVariablesWine
Farms
Fruit Tree
Farms
Field Crop
Farms
Vegetable
Farms
Mixed-Crop
Farms
All
Farms
ExposureDrought0.7660.7330.7780.6900.7170.749
Floods0.1340.2110.1890.1900.0830.147
Spring frost0.3000.2890.3110.3700.2330.299
Hail0.4120.4330.3220.3800.3580.394
SensitivitySoil type0.7820.7770.7550.730.720.758
Trees age of perennial crops0.7080.766------0.6460.704
Plots orientation0.5620.267------0.2770.423
Crop diversification0.4160.6890.6440.8900.7330.561
Varietal diversification0.7580.80.7330.9400.7440.765
Adaptive

capacity
HumanTraining0.5460.5440.4220.4500.4080.504
Agricultural experience 0.8440.8670.7780.8700.8080.838
Age of the farmer0.4820.3220.3890.4700.4000.444
Agricultural network 0.7200.7220.6220.7400.6500.703
Economicproduct marketing 0.8460.8670.7780.8900.8330.844
Off-farm income0.6880.7330.8220.7700.5420.696
Legal status0.3020.2110.2440.2600.2920.281
Land status0.6060.7000.2000.5500.5830.566
Crop insurance0.3420.2330.1330.2800.1170.273
TechnicalSoil management0.7960.8100.7300.9000.7400.790
Irrigation0.5420.7200.1660.8800.6160.575
Plant management0.7380.7440.7000.7700.7480.740
Agro-ecological infrastructure0.4120.4000.3330.5100.3080.388
Table 5. Index (declared and calculated) of vulnerability and its various components on different farms type.
Wine
Farms
Fruit Tree
Farms
Field Crops
Farms
Vegetable
Farms
Mixed-Crop
Farms
All
Farms
Calculated
assessment
Exposure0.5800.5800.5800.5800.5800.580
Sensitivity0.5880.4570.4450.2310.4410.501
Human AC0.5060.4480.3970.4720.4950.484
Economic AC0.4900.4680.3460.3650.4600.456
Technical AC0.4250.6500.3310.6010.5450.473
Global AC0.4740.5220.3580.4790.5000.471
VulnerabilityAverage0.7420.5060.7300.2810.5180.636
Maximum1.2320.6210.8660.4890.7631.232
Minimum0.4160.3470.4930.1670.2940.167
Declared
assessment
Exposure0.6290.6290.6370.6070.6340.628
Sensitivity0.5580.4290.4030.2230.3940.470
Human AC0.5190.4510.4030.4630.4890.490
Economic AC0.5410.5580.4440.4330.5380.521
Technical AC0.4510.6560.3760.6190.5610.498
Global AC0.5040.5550.4070.5050.5290.503
VulnerabilityAverage0.7120.4870.6460.2630.4740.601
Maximum1.2750.5960.8480.4250.7361.275
Minimum0.3860.3920.4020.1780.3190.178
Table 6. Characteristics of different farm classes and major factors of heterogeneous farm vulnerability.
VariablesClass 1Class 2Class3
Average declared vulnerability0.3330.6120.919
Number of farms225117
Percentage24%57%19%
Vulnerability variables
S (soil type)0.3500.4280.670
S (varietal diversification)0.2910.4730.583
S (crop diversification)0.2560.6930.810
S (trees age of perennial crops)0.2290.4250.486
S (plot orientation)0.2410.4660.742
AC (legal status)0.3310.3800.165
AC (irrigation)0.6460.3440.191
AC (soil management)0.5940.4350.398
Other variables
Overall vulnerability score assigned by farmers0.5270.6310.688
UAA133017
Farm types80% of vegetable and mixed-crop farms61% wine farms94% wine farms
Geographical location60% of farms in the mountain65% of farms in the plain77% of farms in the mountain
Current adaptation measures96% of farmers have taken adaptation measures57% of farmers have taken adaptation measures24% of farmers have taken adaptation measures
Labor need The labor need has increased for 73% of farmsThe labor need has increased for 37% of farmsThe labor need has increased for 24% of farms
Crops introduced during the last 10 years68% of farms have introduced new crops 24% of farms have introduced new crops 24% of farms have introduced new crops
Crops abandoned during the last 10 years59% of farms have abandoned crops 16% of farms have abandoned crops 12% of farms have abandoned crops
Adaptation policies should be favored by public policies77% of farmers have chosen policies that promote crop diversification69% of farmers have chosen policies that promote varietal diversification and irrigation82% of farmers have chosen policies that promote varietal diversification
Disclaimer/Publisher’s Note: The statements, opinions and data contained in all publications are solely those of the individual author(s) and contributor(s) and not of MDPI and/or the editor(s). MDPI and/or the editor(s) disclaim responsibility for any injury to people or property resulting from any ideas, methods, instructions or products referred to in the content.

