Article

An Exploration of the Association Between Residents’ Sentiments and Street Functions During Heat Waves—Taking the Five Core Urban Areas of Chengdu City as an Example

School of Architecture, Southwest Jiaotong University, Chengdu 610032, China
*
Author to whom correspondence should be addressed.
Land 2025, 14(7), 1377; https://doi.org/10.3390/land14071377
Submission received: 22 May 2025 / Revised: 13 June 2025 / Accepted: 27 June 2025 / Published: 30 June 2025

Abstract

Due to global warming, the impact of heat waves on the sentimental health of urban residents has significantly intensified. However, the associative mechanism between diverse urban functional layouts and residents’ emotions at the street scale remains underexplored. Taking the five core urban areas of Chengdu as an example, this study used natural language processing technology to quantify the sentiments in social media texts and combined traditional geographical information for spatial analysis and correlation analysis, to explore the spatial distribution pattern of sentiments during heat waves (SDHW), as well as the correlation between SDHW and the functional categories of streets (FCS). The findings are as follows: (1) There are significant differences in the spatial distribution pattern of residents’ sentiments in the five core urban areas, and positive emotions within the Second Ring Road exhibit a higher proportion than those of peripheral areas, while negative sentiments are more gathered in the eastern area. (2) The street categories of green space, park, and public show a significant promoting role on residents’ positive sentiments. (3) There is an association between the industrial and commercial categories and negative sentiments, and the impact of the traffic category on residents’ sentiments shows spatial differences. (4) The combination of the residential category and other functional categories has a strong correlation with sentiments, indicating that a reasonable functional combination within residential areas plays a crucial role in promoting residents’ positive sentiments. The current study revealed the influence mechanism of the functional categories of streets on residents’ sentiments during heat waves, providing a scientific basis from the sentimental dimension for the optimization of street functional categories, heat wave emergency management, and the construction of resilient cities.

1. Introduction

1.1. Studies on Heat Waves and Healthy City Construction

The global temperature rise has become an indisputable fact. Under the overarching trend of global warming, the frequency of heat wave disasters has increased significantly, and it has also given rise to a greater variety of extreme climate events. Unlike natural disasters that directly damage infrastructure, urban heat waves not only lead to a strain on urban resources and ecological degradation, but also pose a direct threat to the safety and health of residents. For example, they have an impact on relevant human mental health indicators, such as sentiments and behavioral disorders, and are significantly correlated with rates of severe depression and psychiatric consultations [1]. The State of the Global Climate 2022, released by the World Meteorological Organization, indicates that the current global average temperature has increased by approximately 1.11(±0.13) °C compared to the pre-industrial level. Even in countries with relatively cooler climates originally, such as the United Kingdom, Germany, and France, abnormally high temperatures were recorded in the summer of 2022 compared to those of the same period in previous years.
It is likely that most regions in China have also been severely affected by heat waves. Since 8 July 2022, persistent high-temperature weather has occurred in areas including the Jiangnan region and the south of China, as well as the eastern region of the Sichuan Basin [2]. According to the monitoring and assessment conducted by the National Climate Center of China, the comprehensive intensity of the regional high-temperature event from June 13 to the end of August in 2022 was the highest since the first complete meteorological observation records in 1961. However, regarding the current situation of domestic research, most studies have focused on cities like Fuzhou and Xi’an, which are exposed to high-temperature heat waves year after year [3,4], yet relatively little attention has been paid to cities like Chengdu, which originally had a mild climate but has entered the category of extremely high temperatures in recent years. According to statistics from the Sichuan Daily (https://3g.china.com/act/news/10000169/20250521/48364502.html) (accessed on 1 March 2025), there were only two high-temperature days (35 °C and above) in 2015. However, the number of high-temperature days in Chengdu has entered double digits since 2022 (Figure 1), with 27 days in 2022, 11 days in 2023, and 21 days in 2024. This data from Chengdu is growing rapidly, with high-temperature weather becoming increasingly frequent. Also, previous studies lack comprehensive research on how cities with different climate characteristics cope with high-temperature heat waves. Therefore, expansion is of great significance for promoting the construction of healthy cities, laying a solid theoretical foundation for urban emergency management, and providing relevant technical support.

1.2. Urban Resilience and Residents’ Sentiments

A resilient city refers to one exposed to hazards to resist, absorb, accommodate to, and recover from the effects of a hazard in a timely and efficient manner [5]. The City Resilience Index (Figure 2), developed by Arup with support from the Rockefeller Foundation, has proposed a holistic articulation of urban resilience structured around four dimensions: health and well-being, economy and society, infrastructure and ecosystems, and leadership and strategy [6]. Among them, infrastructure and ecosystems are the material foundation of urban resilience. The previous studies on urban infrastructure and ecosystems have focused on the resistance and resilience to climate change and geological hazards, such as floods and earthquakes [7,8].
Recent studies have gradually shifted towards the exploration of people-oriented resilience in the field of urban resilience research. Individuals have different reactions to the same negative event, which poses challenges to the formulation of targeted and efficient strategies and actions in emergency management. Sentiment, as the result of an individual’s comprehensive perception of external stimuli, provides an important indicator for resilience assessment by analyzing the patterns of sentiment distribution during disasters. In addition, urban sentiment evaluated based on big data can weaken the influence of individual factors, as well as reveal the supporting role of urban space as an overall system [9].

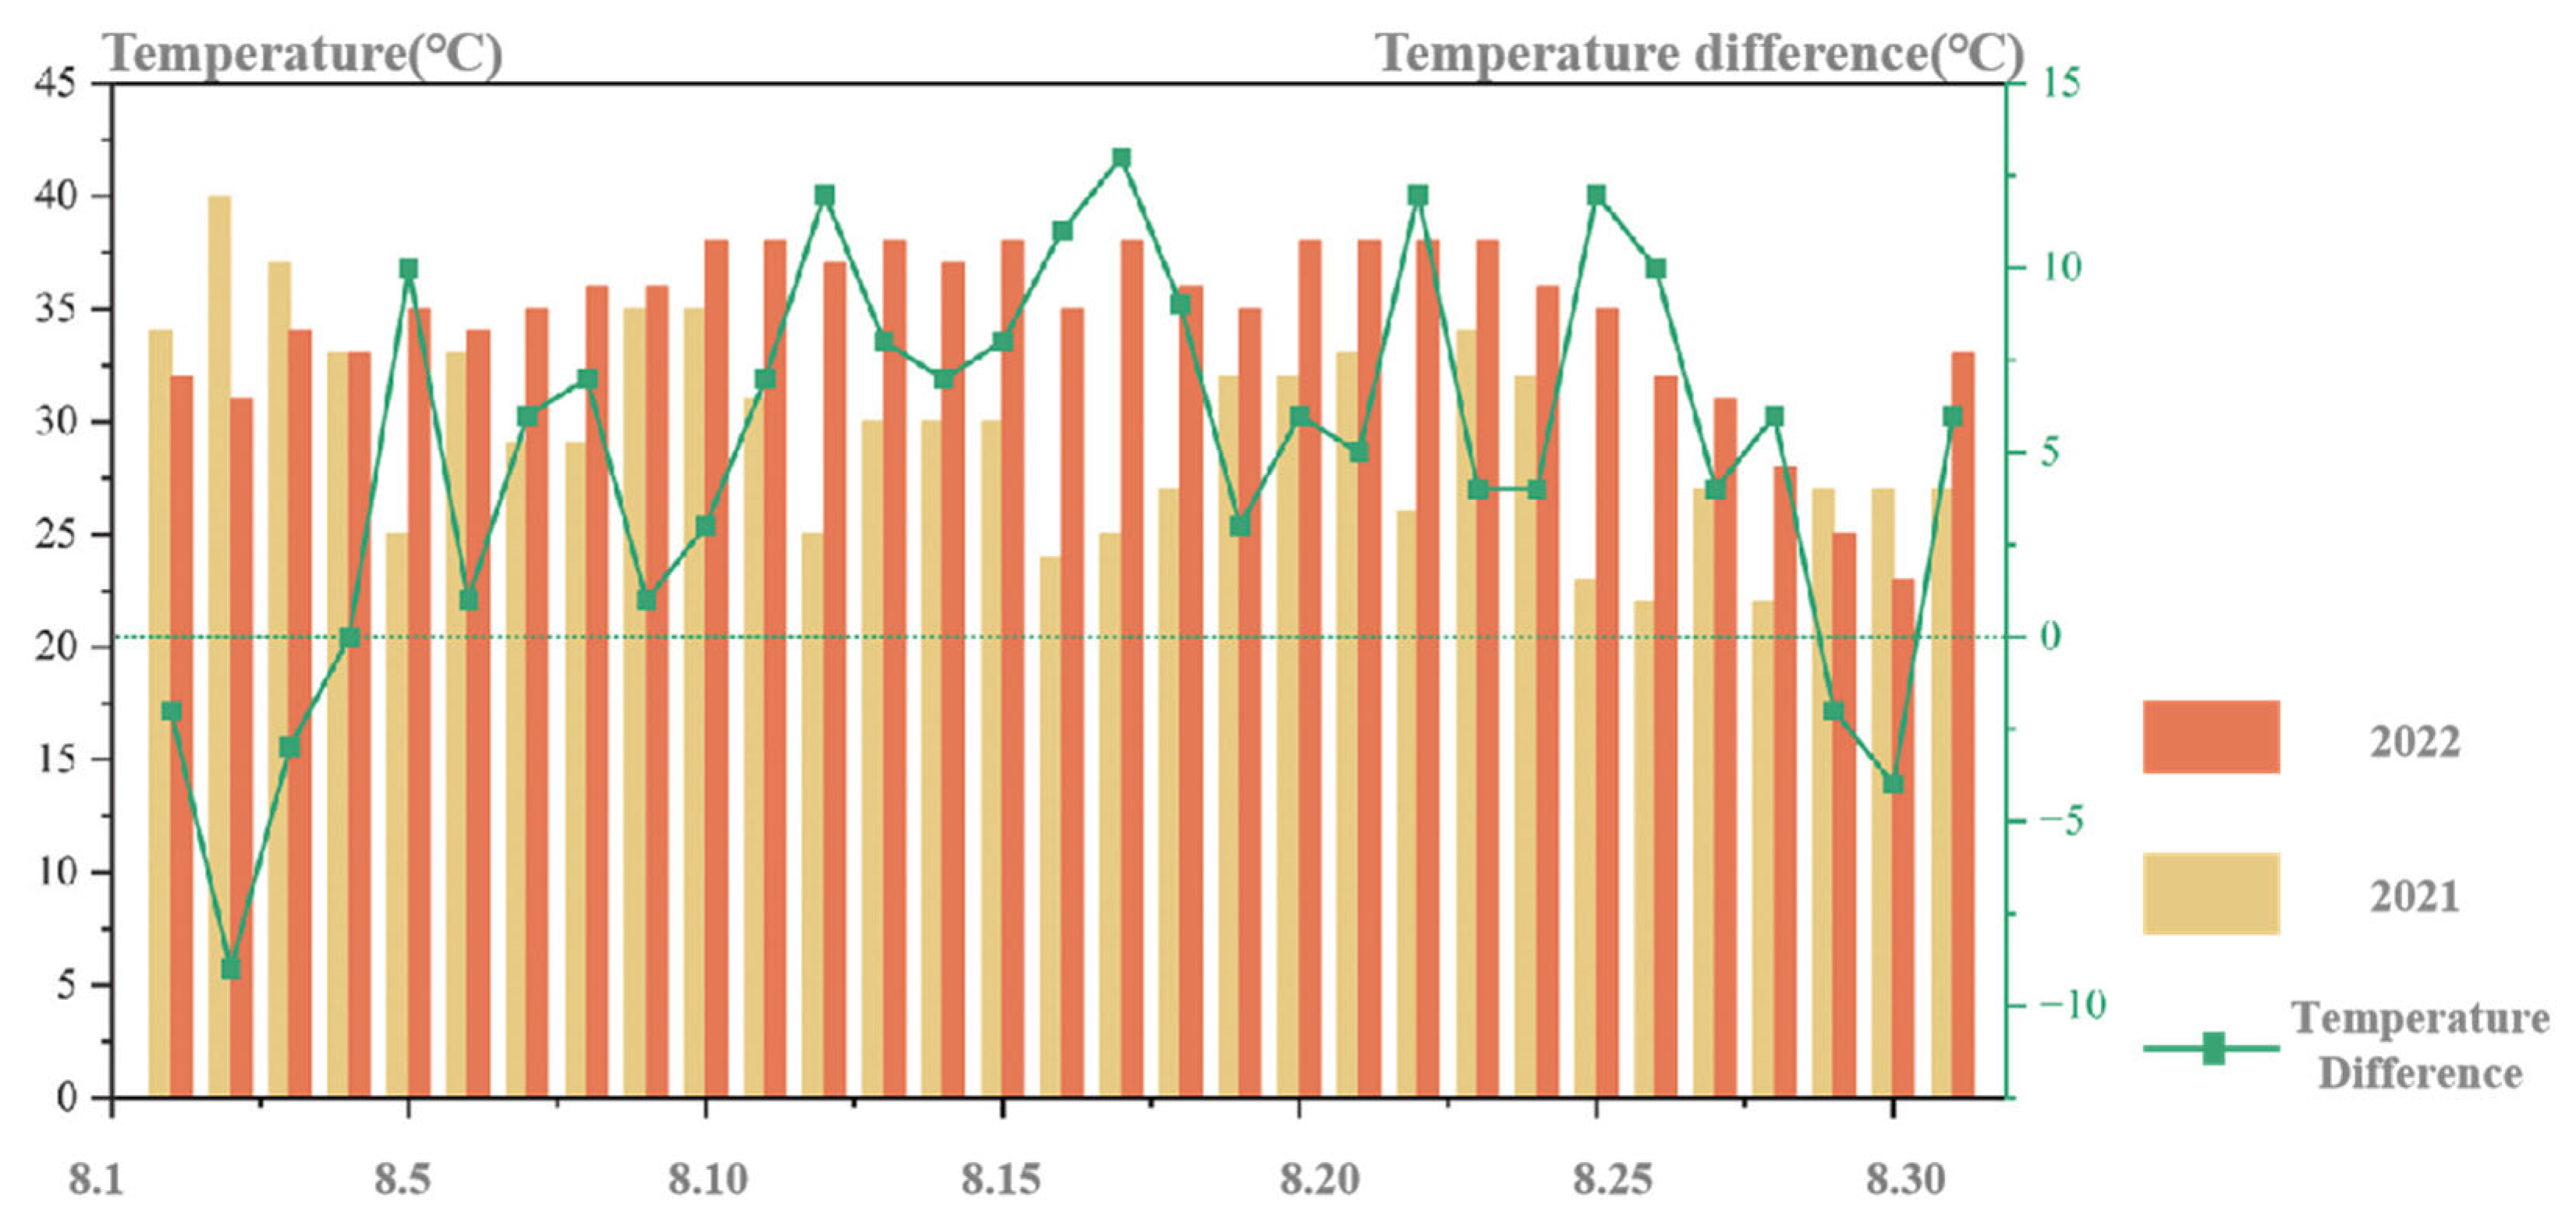
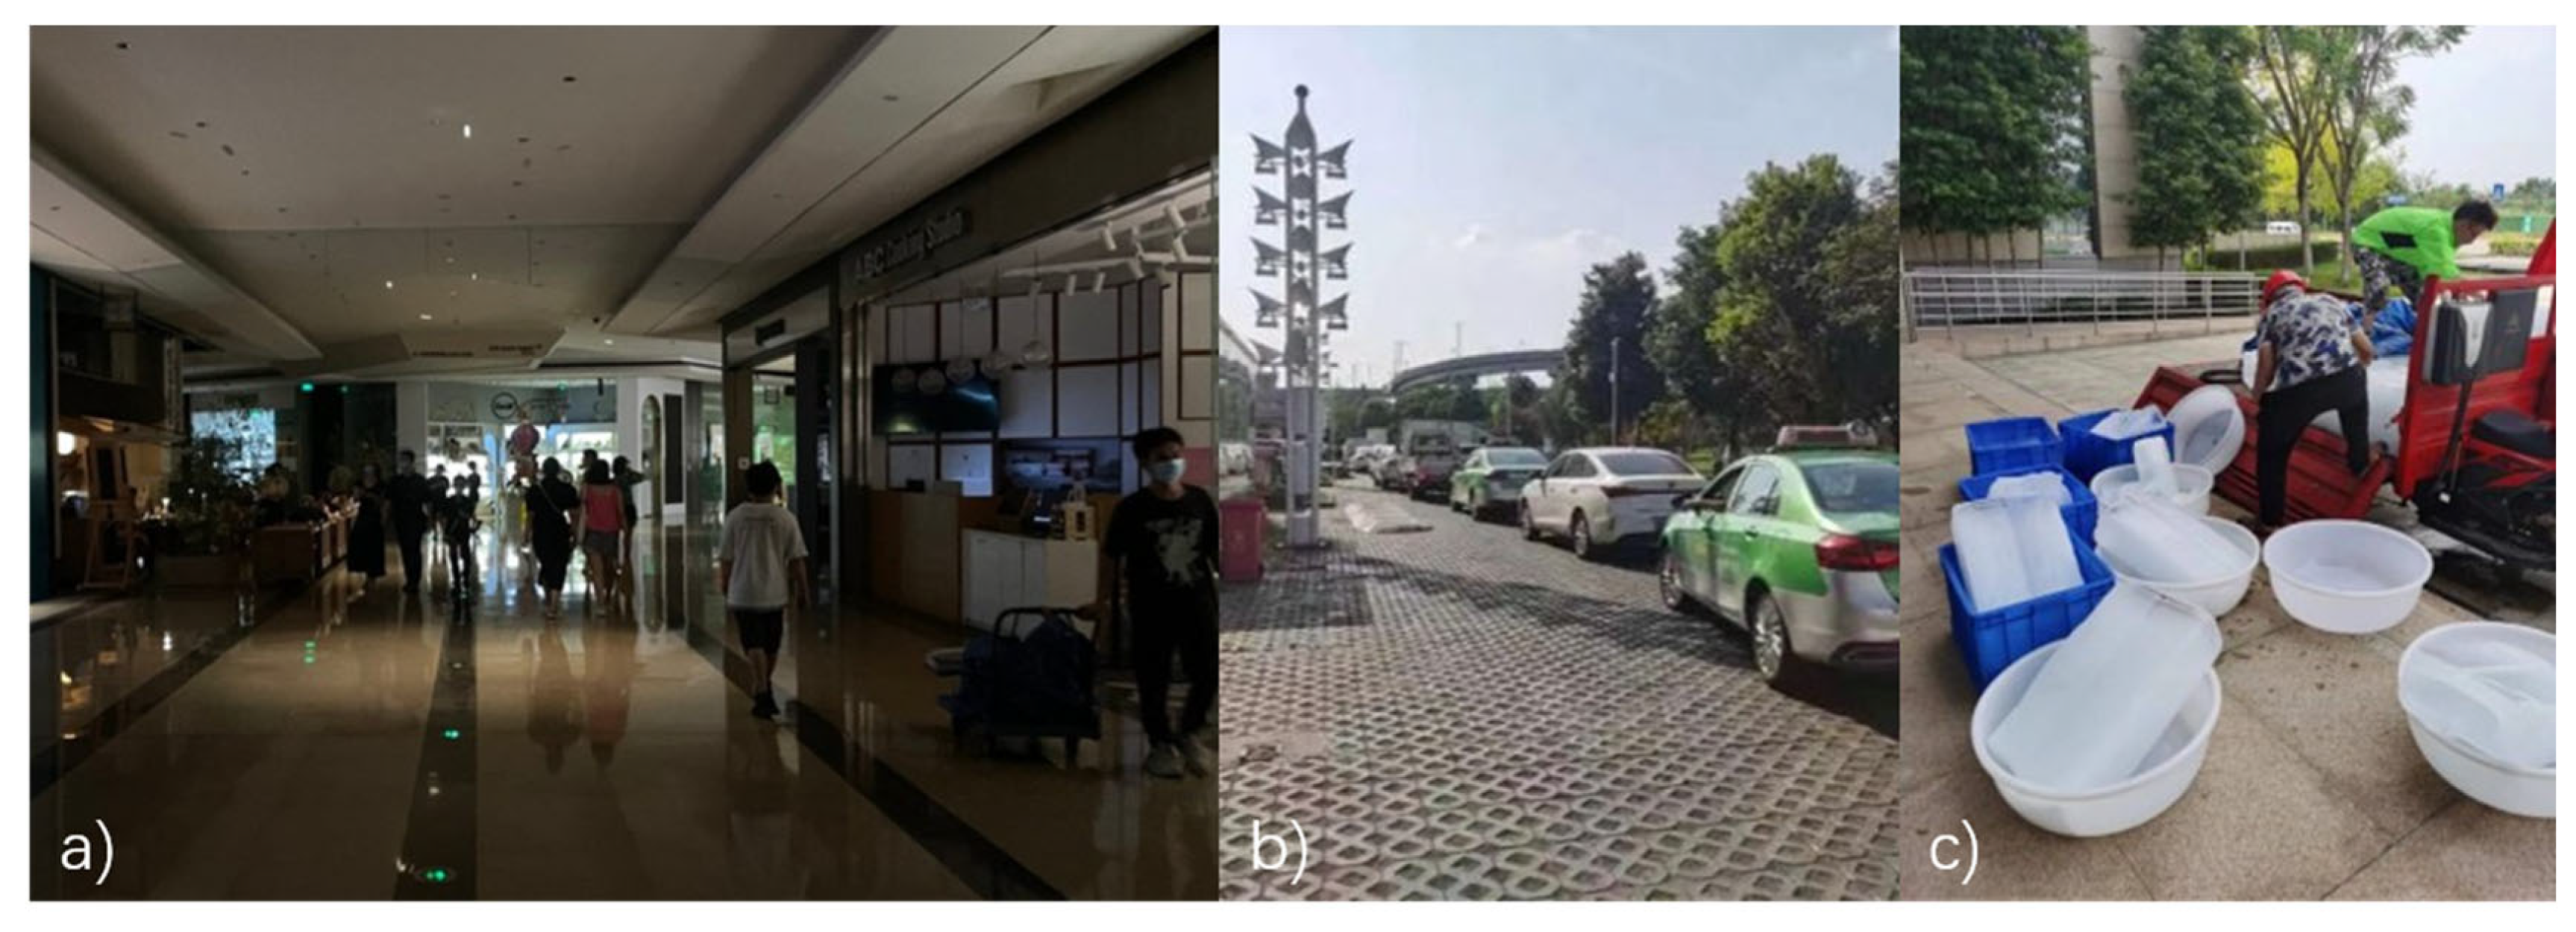
1.3. Residents’ Sentiments During Heat Waves

Previous studies on urban resilience considering the impacts of heat waves have mainly focused on aspects such as temperature control, energy disruptions, and material flows [10,11]. Recently, however, research on the influence of urban heat waves on sentiments has received increasing attention. For example, Huang et al. [12] constructed the VI-level assessment standard for emotional health risk using data from satellite images, meteorological sites, questionnaire surveys, and statistical yearbooks to assess the effect of high temperatures on negative sentiments in Hangzhou. By combining meteorological conditions with 400 million social media posts, Wang et al. [13] found that, in China, the temperature is correlated with an increase in sentimental expressions. The same results were found by Baylis [14] in the U.S., with sustained, statistically significant decreases in sentiments throughout the hot weather. Huang et al. [15] demonstrated that the distribution pattern of the irritable sentiments of residents in Beijing during heat waves has an obvious circular structure, showing a pattern of higher values in the center and lower values in the periphery. Although it is widely recognized that urban heat waves have detrimental effects on health, leading to an increase in mortality and morbidity rates, the relationship between urban heat waves and sentiments is complex and is still lacking at different spatial scales, such as at street level.

1.4. Urban Functional Layout and Residents’ Sentiments

The sentimental state within the urban environment is closely linked to the internal spatial structure of the city and its attributes [16]. As a specific geographical space where natural and social resources are concentrated, the layout of different functional categories in a city directly affects the thermal environment of the urban geographical space, which in turn has an impact on the sentiments of the residents. Previous studies mostly took a certain functional category as the main subject to explore the relationship between it and the sentiments of the residents. For example, temperature demonstrated a significant effect on sentiments at different NDVI (normalized difference vegetation index) values [17]. In addition, the environmental quality, social security, and social interactions in urban residential areas will have different effects on the sentiments of residents [18]. However, it has been overlooked that, when there are multiple regions within the same urban scale, the spatial distribution pattern of sentiments is influenced by the land, with different percentages of functional categories in each region, which is crucial for revealing the diversity of the interaction between sentiments and functional categories at the internal scale of the city.
Therefore, paying attention to sentiments, in combination with urban functional categories, could help to address urban social spatial inequality and improve residents’ well-being. Nevertheless, against the backdrop of an extreme climate, more efforts are still needed to explore the relationship between residents’ sentiments and different urban functional categories at the internal scale of a city during heat waves.

1.5. The Validity of Techniques and the Purpose of Study
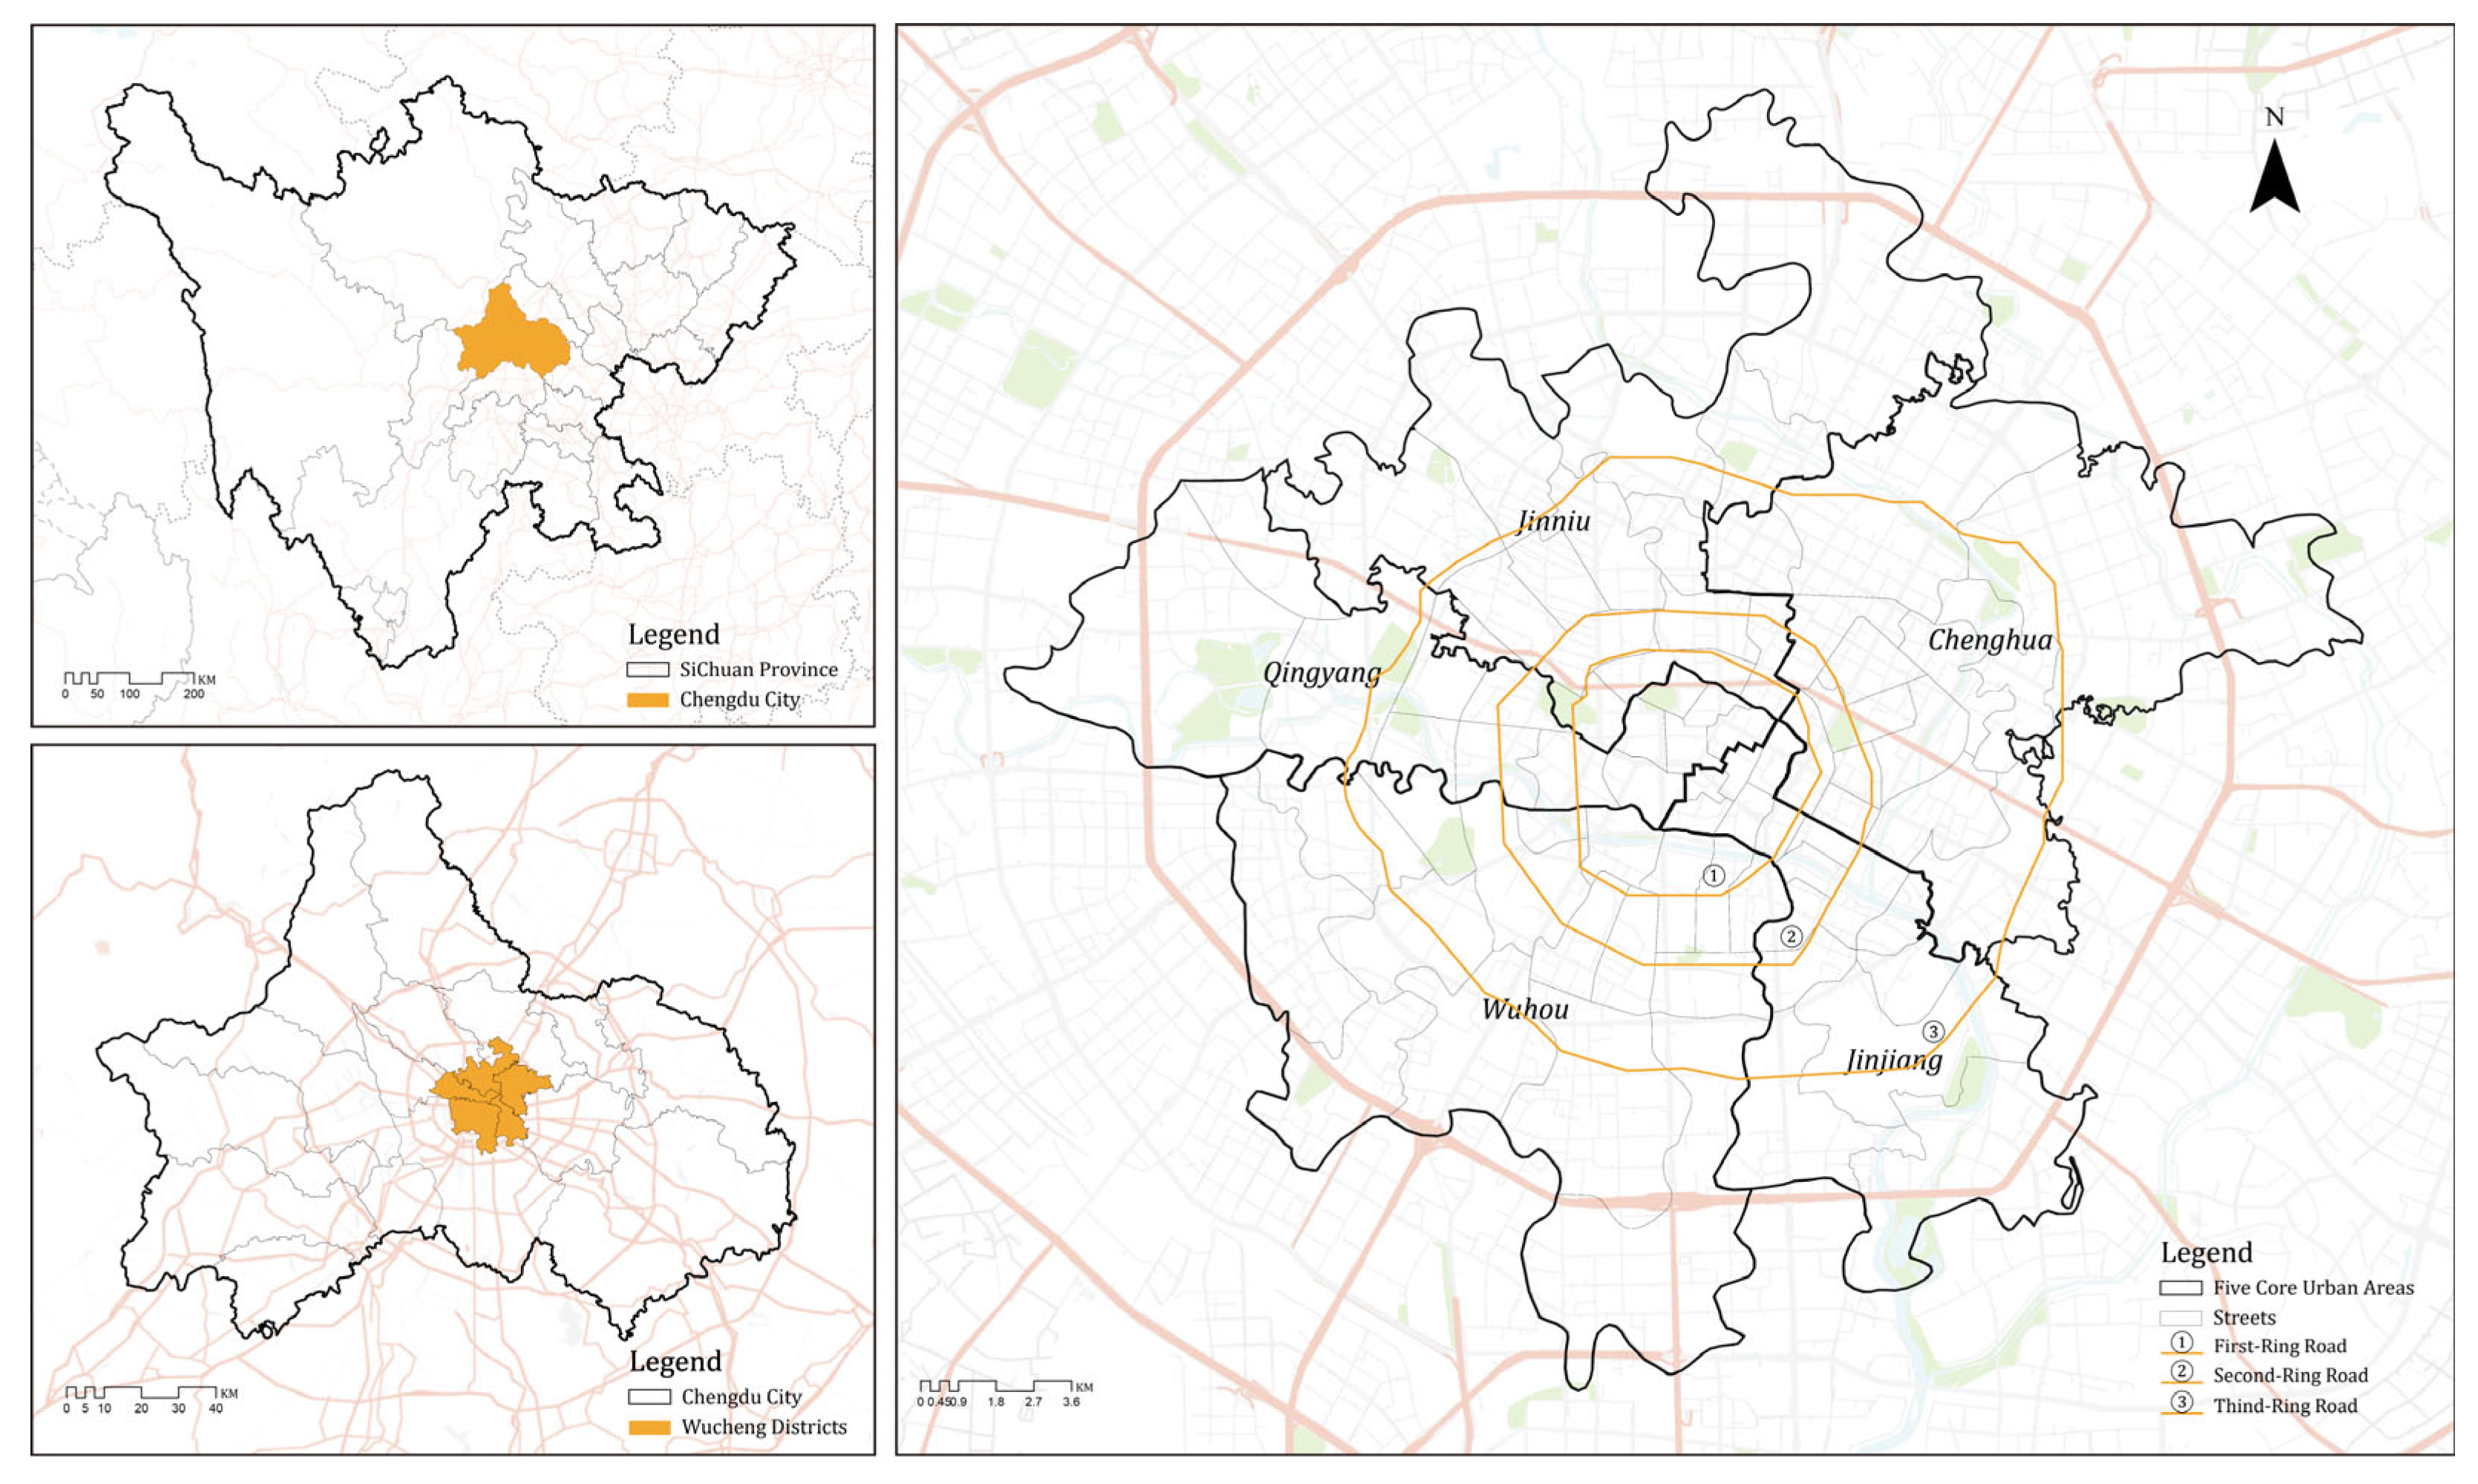
Previous studies have typically utilized medical data and questionnaire data to investigate the comfortable temperature range and the issue of how high temperatures affect sentimental health [12]. However, these data do not objectively reflect the overall perception of high temperatures among the urban population at a macro-scale, leading to problems such as limited survey representativeness, sample validity, and diversity. In recent years, social media has gradually become an important tool for public health monitoring, containing a wealth of real-time group sentiments and perceptions of the geographical environment due to its openness, interactivity, and high level of public participation [19,20]. This enables research on sentimental health to break through limitations and provides a more timely and comprehensive interpretation of residents’ sentimental health.
In sum, taking the five core urban areas of Chengdu as an example, this study focuses on the urban heat wave event in Chengdu in August 2022, aiming to achieve the following four aims:
(1) To conduct sentiment analysis on social media text data (Sina Weibo) during the heat wave event;
(2) To use spatialization methods to explore the spatial pattern of residents’ sentiments during the period;
(3) To classify the functional categories of streets (FCS) within the five core urban areas of Chengdu based on the Point of Interest (POI) data, and use the Spearman correlation coefficient and Sankey diagram to analyze the correlation between their distribution and the residential sentiments during the heat waves (SDHW);
(4) To put forward relevant strategic suggestions.

2. Study Area

Chengdu, located in the central part of Sichuan Province and the western part of the Sichuan Basin, is not only a national central city integrating ancient civilization and modern civilization in southwest China, but also the center and window of The Land of Abundance (tianfu zhi guo). By the end of 2021, the city had a landmass of 14,335 km2 (5535 m2), a permanent population of 21.19 million, and an urbanization rate of 79.48% [21]. It has a subtropical monsoon humid climate, characterized by a mild climate with an annual average temperature ranging from 14 °C to 22 °C. In recent years, under the combined effects of global warming, the subtropical high pressure in the western Pacific Ocean, and the urban heat island effect, heat wave events have occurred frequently in Chengdu. In the summer of 2022, Chengdu became an area that was severely affected by heat wave events.
Data released by the Chengdu Meteorological Observatory (http://sc.cma.gov.cn/ds/cd/) (accessed on 1 March 2025) show that, on 23 August 2022, the highest temperature in the Eastern New District of Chengdu reached 43.6 °C, breaking the city’s historical highest temperature record. The highest daily temperature in August 2022 increased significantly compared to that observed in August 2021. Among them, the highest temperature on day 25 was higher than that in the same period of 2021, and the highest temperature on day 8 was more than 10 °C higher than that in the same period of 2021, with the maximum temperature difference reaching 12 °C. According to the standards set by the China Meteorological Administration, a day with the highest temperature reaching or exceeding 35 °C can be defined as a high-temperature day, and high-temperature weather lasting for more than three consecutive days is considered a heat wave. During August, the number of days with a daily highest temperature greater than 40 °C in the Jinniu District reached 16, far exceeding the city’s average (9 days), and the average daily duration of the perceived temperature greater than 35 °C exceeded 8 hours.
In addition, on August 15, Sichuan announced that all production of industrial power must be fully stopped (except security load). The next day, Chengdu required the closure of all of the city’s landscape lighting, light shows, image displays, and non-security lighting facilities, including LED displays of all outdoor advertising lighting. During the same period, subways, shopping malls, office buildings, and residential neighborhoods took various types of power-saving measures to reduce the city’s power load and cope with the city’s high temperature and heat waves (Figure 3).
Studies on urban heat waves generally focus on the area most significantly affected, that is, the central urban area. Considering the availability of detailed demographic data, and alignment with existing studies, this study employs the street as the basic spatial analysis unit; moreover, since it is the smallest internal constituent unit of Chinese cities, this scale has been widely applied in relevant extreme climate research [19]. This study finally determines the study area as the five core urban areas of Chengdu (Figure 4), namely the Wuhou District, Qingyang District, Chenghua District, Jinjiang District, and Jinniu District. We take the streets as units (a total of 77), including 17 streets in the Wuhou District, 14 streets in the Qingyang District, 14 streets in the Chenghua District, 16 streets in the Jinjiang District, and 16 streets in the Jinniu District.

3. Research Data and Methods

3.1. Research Data

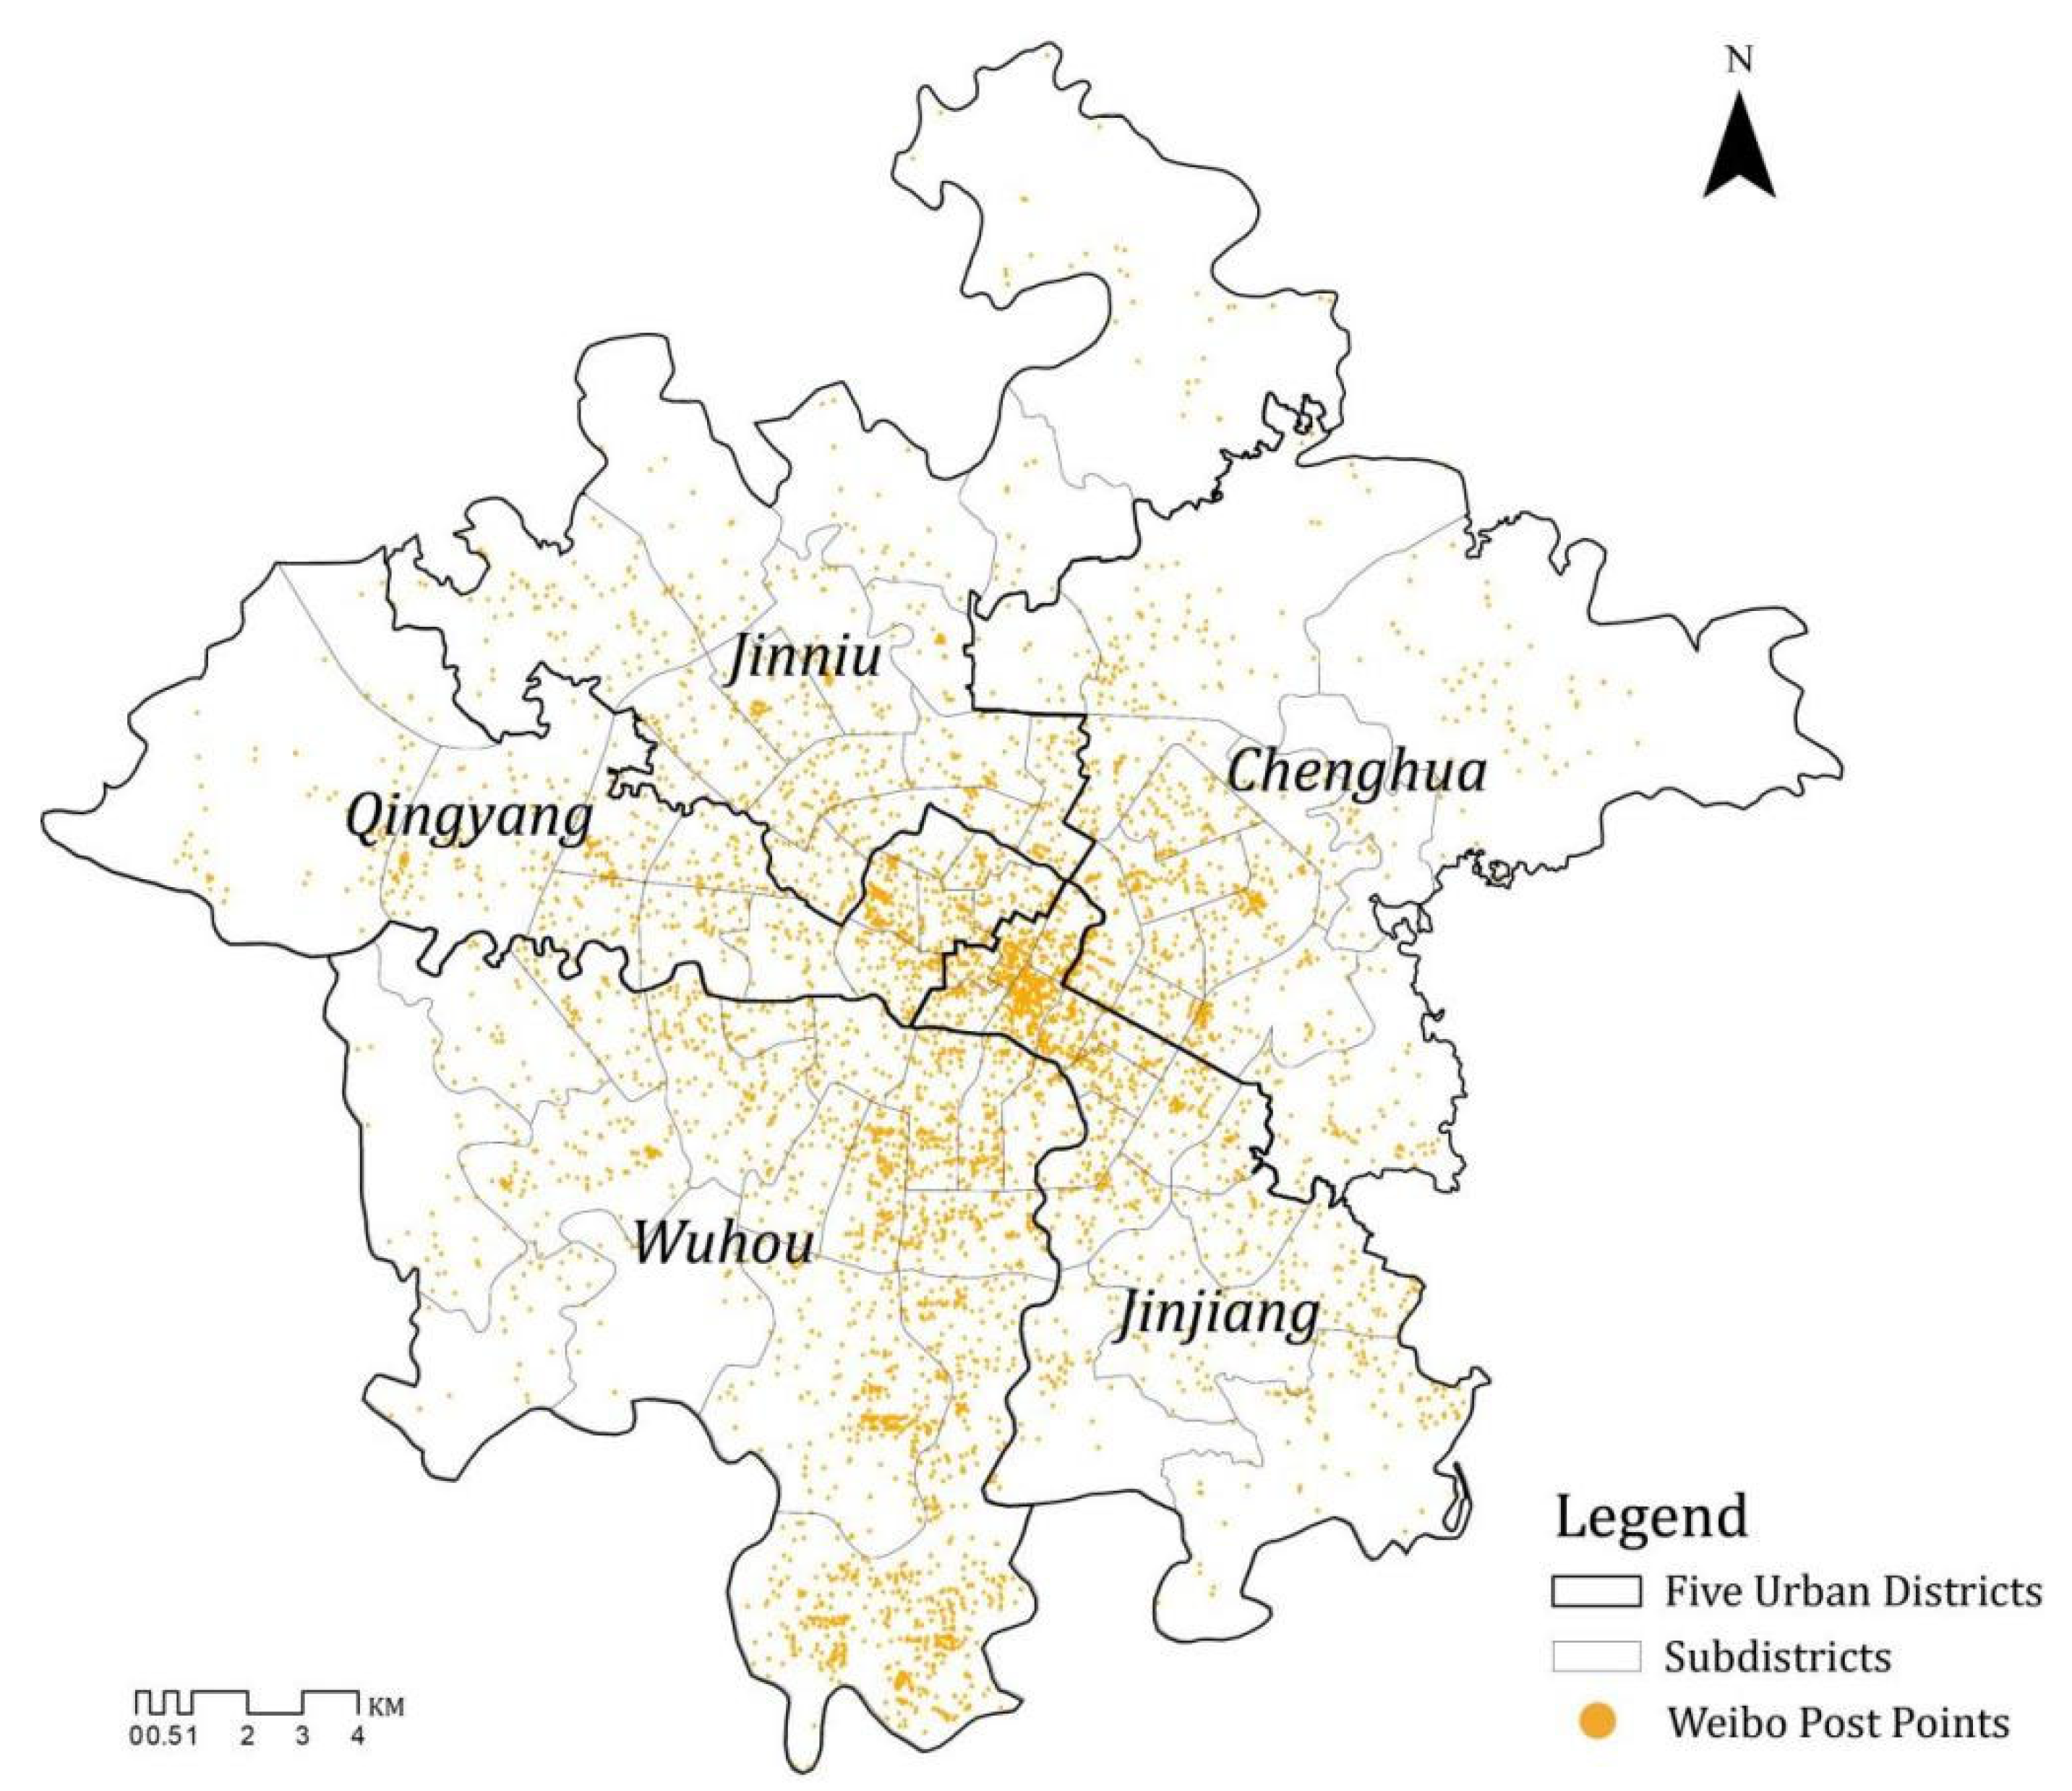
3.1.1. Social Media Weibo Data

Sina Weibo (https://passport.weibo.com/) (accessed on 1 February 2025) is one of the largest and most influential blogging websites in China. In this study, Weibo posts in the Chengdu area in August 2022 were selected. By using web scraping technology, a total of 32,695 posts were obtained from the platform, including the ID, text content, time, latitude, and longitude.

3.1.2. POI Data

For a city, the spatial distribution of various functional activities shows differences at the street scale, forming different spatial functional categories, such as residential, commercial, and industrial. Existing studies have shown that POI data can provide accurate information on urban functional land use and can accurately reflect the spatial distribution of different urban functional categories [22].
The POI data used in this study are sourced from AutoNavi Map (https://mobile.amap.com/) (accessed on 1 February 2025) and contain 309,826 POIs within the study area. The attributes of each POI include the name, latitude and longitude, address, category, and administrative division. The initial POI data categories are complex, with a total of 23 major categories, including catering and food, tourist attractions, science, education, and culture, etc., which are difficult to process. Therefore, in this study, they are integrated and reclassified into 14 categories of POI data, such as catering and food, tourist attractions, medical care, science, education and culture, commercial and residential, transportation facilities, and life services.

3.1.3. Basic Geographical Data

All administrative division and street boundary data were obtained from the National Earth System Science Data Center of China (http://www.geodata.cn/) (accessed on 1 February 2025), and they were used to divide the study area for subsequent geographical spatial data analysis.
In summary, although social media data have the advantage of real-time information and high capacity, they have also long been criticized for their lack of content richness if used as an independent data source [23]; therefore, this study fuses social media data with traditional data (such as POI data and city street data), aiming to provide more information for heat wave research.

3.2. Method

3.2.1. Calculating SDHW Based on Weibo Data

The Weibo posts obtained through web scraping needed to be screened to improve the data accuracy. Firstly, ArcGIS was used to remove the posts checked in outside of the five core urban areas of Chengdu. Following this, for post cleaning, a Python (ver 3.11) code was used to remove advertising posts, blank posts, and Weibo posts without text information; in addition, we removed content such as “@user”, “#talk hashtag#”, and “http: URL link” in the Weibo texts. Finally, 19,388 valid posts were retained, as shown in Figure 5. The yellow dots in the figure represent the geographical locations of the Weibo posts with check-in information. Figure 6 shows the spatial differences in the number of Weibo posts in different areas through kernel density analysis.
In this study, the uer/roberta-base-finetuned-jd-binary-chinese pre-trained model was adopted to complete the sentiment analysis of Weibo. RoBERTa (Robustly Optimized BERT Approach) is a pre-trained model provided by the natural language processing (NLP) library transformers, developed by Hugging Face. Based on RoBERTa, the uer/roberta-base-finetuned-jd-binary-chinese model is an improvement that increases training data and performance, specifically for Chinese sentiment analysis tasks. It was fine-tuned during large-scale pre-training using the UER-py framework and combined with Chinese datasets from various fields. During the pre-training stage, the model used JD.com review data as training data, which included review content, reviewer nicknames or IDs, review time, review ratings (such as positive, neutral, negative reviews, etc.) and other information. By learning the emotional patterns in JD.com reviews to achieve emotional analysis and judge whether the reviews express positive or negative emotions, this model can become more adaptable to the unique characteristics of Chinese texts and better simulate the Chinese social media context.
Unlike traditional NLP that requires manual word segmentation using tools like jieba before sentiment analysis, the uer/roberta-base-finetuned-jd-binary-chinese model incorporates subword tokenization during the pre-training phase. When loading the model, BertTokenizer is automatically invoked to split Chinese text into subword units, where rare words are decomposed into multiple subwords, while common words remain intact. Additionally, due to the exposure to extensive raw text (including stopwords, numbers, special symbols, and other expressions) during pre-training, the model learned semantic patterns and associations in the presence of stopwords, such as price “100 yuan” and price “one hundred yuan.” As a result, operations like stopword removal and text normalization are unnecessary by using the uer/roberta-base-finetuned-jd-binary-chinese model. Regarding the above, it is considered an ideal choice for the sentiment analysis of Chinese social media in our study.
During the sentiment analysis process, the roberta-base-finetuned-jd-binary-chinese corpus model was used to conduct sentiment analysis on the cleaned Weibo texts and obtain the final sentiment score for each Weibo post. The score ranged from 0 to 1, where, the closer to 1, the more positive it was; or, closer to 0, the more negative it was. For example, the score was 0.02 with the comment 大热天在外面找了半个小时的咖啡店,热出一身汗 (I spent half an hour looking for a coffee shop outside in the heat and worked up a sweat). Finally, 17,388 Weibo posts obtained sentiment scores ranging from 0.02 to 0.98 by the model, and another 2000 were selected as the validation set for manual verification. The accuracy rate reached 87%, indicating that the results are highly reliable.
After dividing the Weibo posts by each street according to the administrative divisions, the mean value of the sentiment scores within each street was calculated and used as the sentiment value of each street. These sentiment values were then transformed into categorical data and classified into five categories: “the worst,” “bad,” “medium,” “good,” and “the best” according to the principle of the Jenks natural breaks classification method.

3.2.2. Calculating the Distribution of Urban Functional Categories Based on POI Data

The urban functional category classification refers to the method of Wang et al. [24] and Zhang [25], and in accordance with the principle of universality and consistency of POI classification. The POI data were further categorized into six major categories: residential, public, commercial, industrial, green space and parks, and traffic, based on the reclassification above (Figure 7).
By weighting the POI data, the distribution of urban functional categories is determined by the percentage of the total scores of POIs representing different urban functions at the street scale, so as to carry out a quantitative study of urban functions. Some POI data with insignificant functional categories, such as public restrooms and newsstands, are first excluded. In addition, considering the differences in the area of each street unit, the direct calculation of the percentage of the number of POIs in each unit cannot accurately reflect the actual functional attributes of the situation, so the frequency density index is introduced.
On the other hand, the POI data is a point without any area information on the geographic entity, and there are differences in the scope of influence of the geographic entity of different functional categories. If only the frequency density index is considered, it will make the calculation results biased towards the categories of POIs with a larger number in the region, such as shopping services and catering services, and it is difficult to reflect the differences in the functional categories of different regions.
Therefore, our study introduced buffer zone area indicators with different radii according to POI public awareness and carried out further weighting and reconciliation of various categories of POIs, including 200 m for commercial, 250 m for residential, 300 m for public, 350 m for industrial, 400 m for transportation, and 150 m for green space and parks [26]. The weight of the buffer zone area of a certain category of POI within a single research unit (a street) over the area of all buffer zones within the research unit is taken as the weight of that category within the unit.
Based on the above, this study proposed a quantitative identification method for the distribution of urban functional categories, with the following calculation formula:
H i k = S i S k   ×   n i i   =   1 n   =   6   S i S k   ×   n i
where k denotes the kth street unit; i denotes the ith category of POI; Sk denotes the kth street area; Si denotes the area of the buffer zone of the ith category of POI; and ni denotes the number of the ith category of POI within that street. The weight of the buffer area of a category of POI within a single street over the area of all buffers within that street is used as the weight of that category of POI within that street. Moreover, H ( i k ) represents the ratio of the frequency density of the ith category of POI over the frequency density of all categories of POIs within the kth street. The proportion of POIs in the six major categories is finally calculated, and the distribution of urban functional categories is mapped at the street scale. In addition, as in the case of the Weibo data mentioned above, all of the functional category shares were transformed into a five-category hierarchy, categorized as lowest, lower, medium, higher, and highest.

3.2.3. Correlation Analysis

The Spearman correlation coefficient was used to analyze whether the degree of correlation between the streets’ sentiment scores and the percentage of FCS was significant, and Sankey diagrams were used to show how the percentage of FCS affects the sentiment rating. A Sankey diagram is a graphical tool used to visualize processes, resource allocation, and inter-relationships, and its distinctive feature is that the line categories of different thicknesses represent flows, effectively showing the connections and interactions between multiple objects through changes in the shape and thickness of the connecting lines. Figure 8 shows the entire methodological framework of this study.

4. Results

4.1. Spatial Distribution Patterns of SDHW

As shown in Figure 9 (left), during the heat waves, there were obvious spatial differences in the distribution of sentiment values of the residents in Chengdu City; in addition, the proportion of the five categories of the sentiment values of the streets in each district was also counted (Figure 9, right). Overall, for positive sentiment values (better and best categories), the streets within the Second Ring Road are larger than the streets outside of the Second Ring Road, and the streets in the western districts are larger than the streets in the eastern districts. The main western districts are Wuhou, Qingyang, and Jinniu. Of them, 57% of streets in the Qingyang District have positive sentiment values, and 47% of streets in the Wuhou District have positive sentiment values. Negative sentiment values (worse and worst categories), on the other hand, are dominated by the eastern districts, for example, 71% of the streets in the Chenghua District have negative sentiment values, with Shahe Street, Shishishan Street, and Chenglong Road Street all having negative sentiment values.

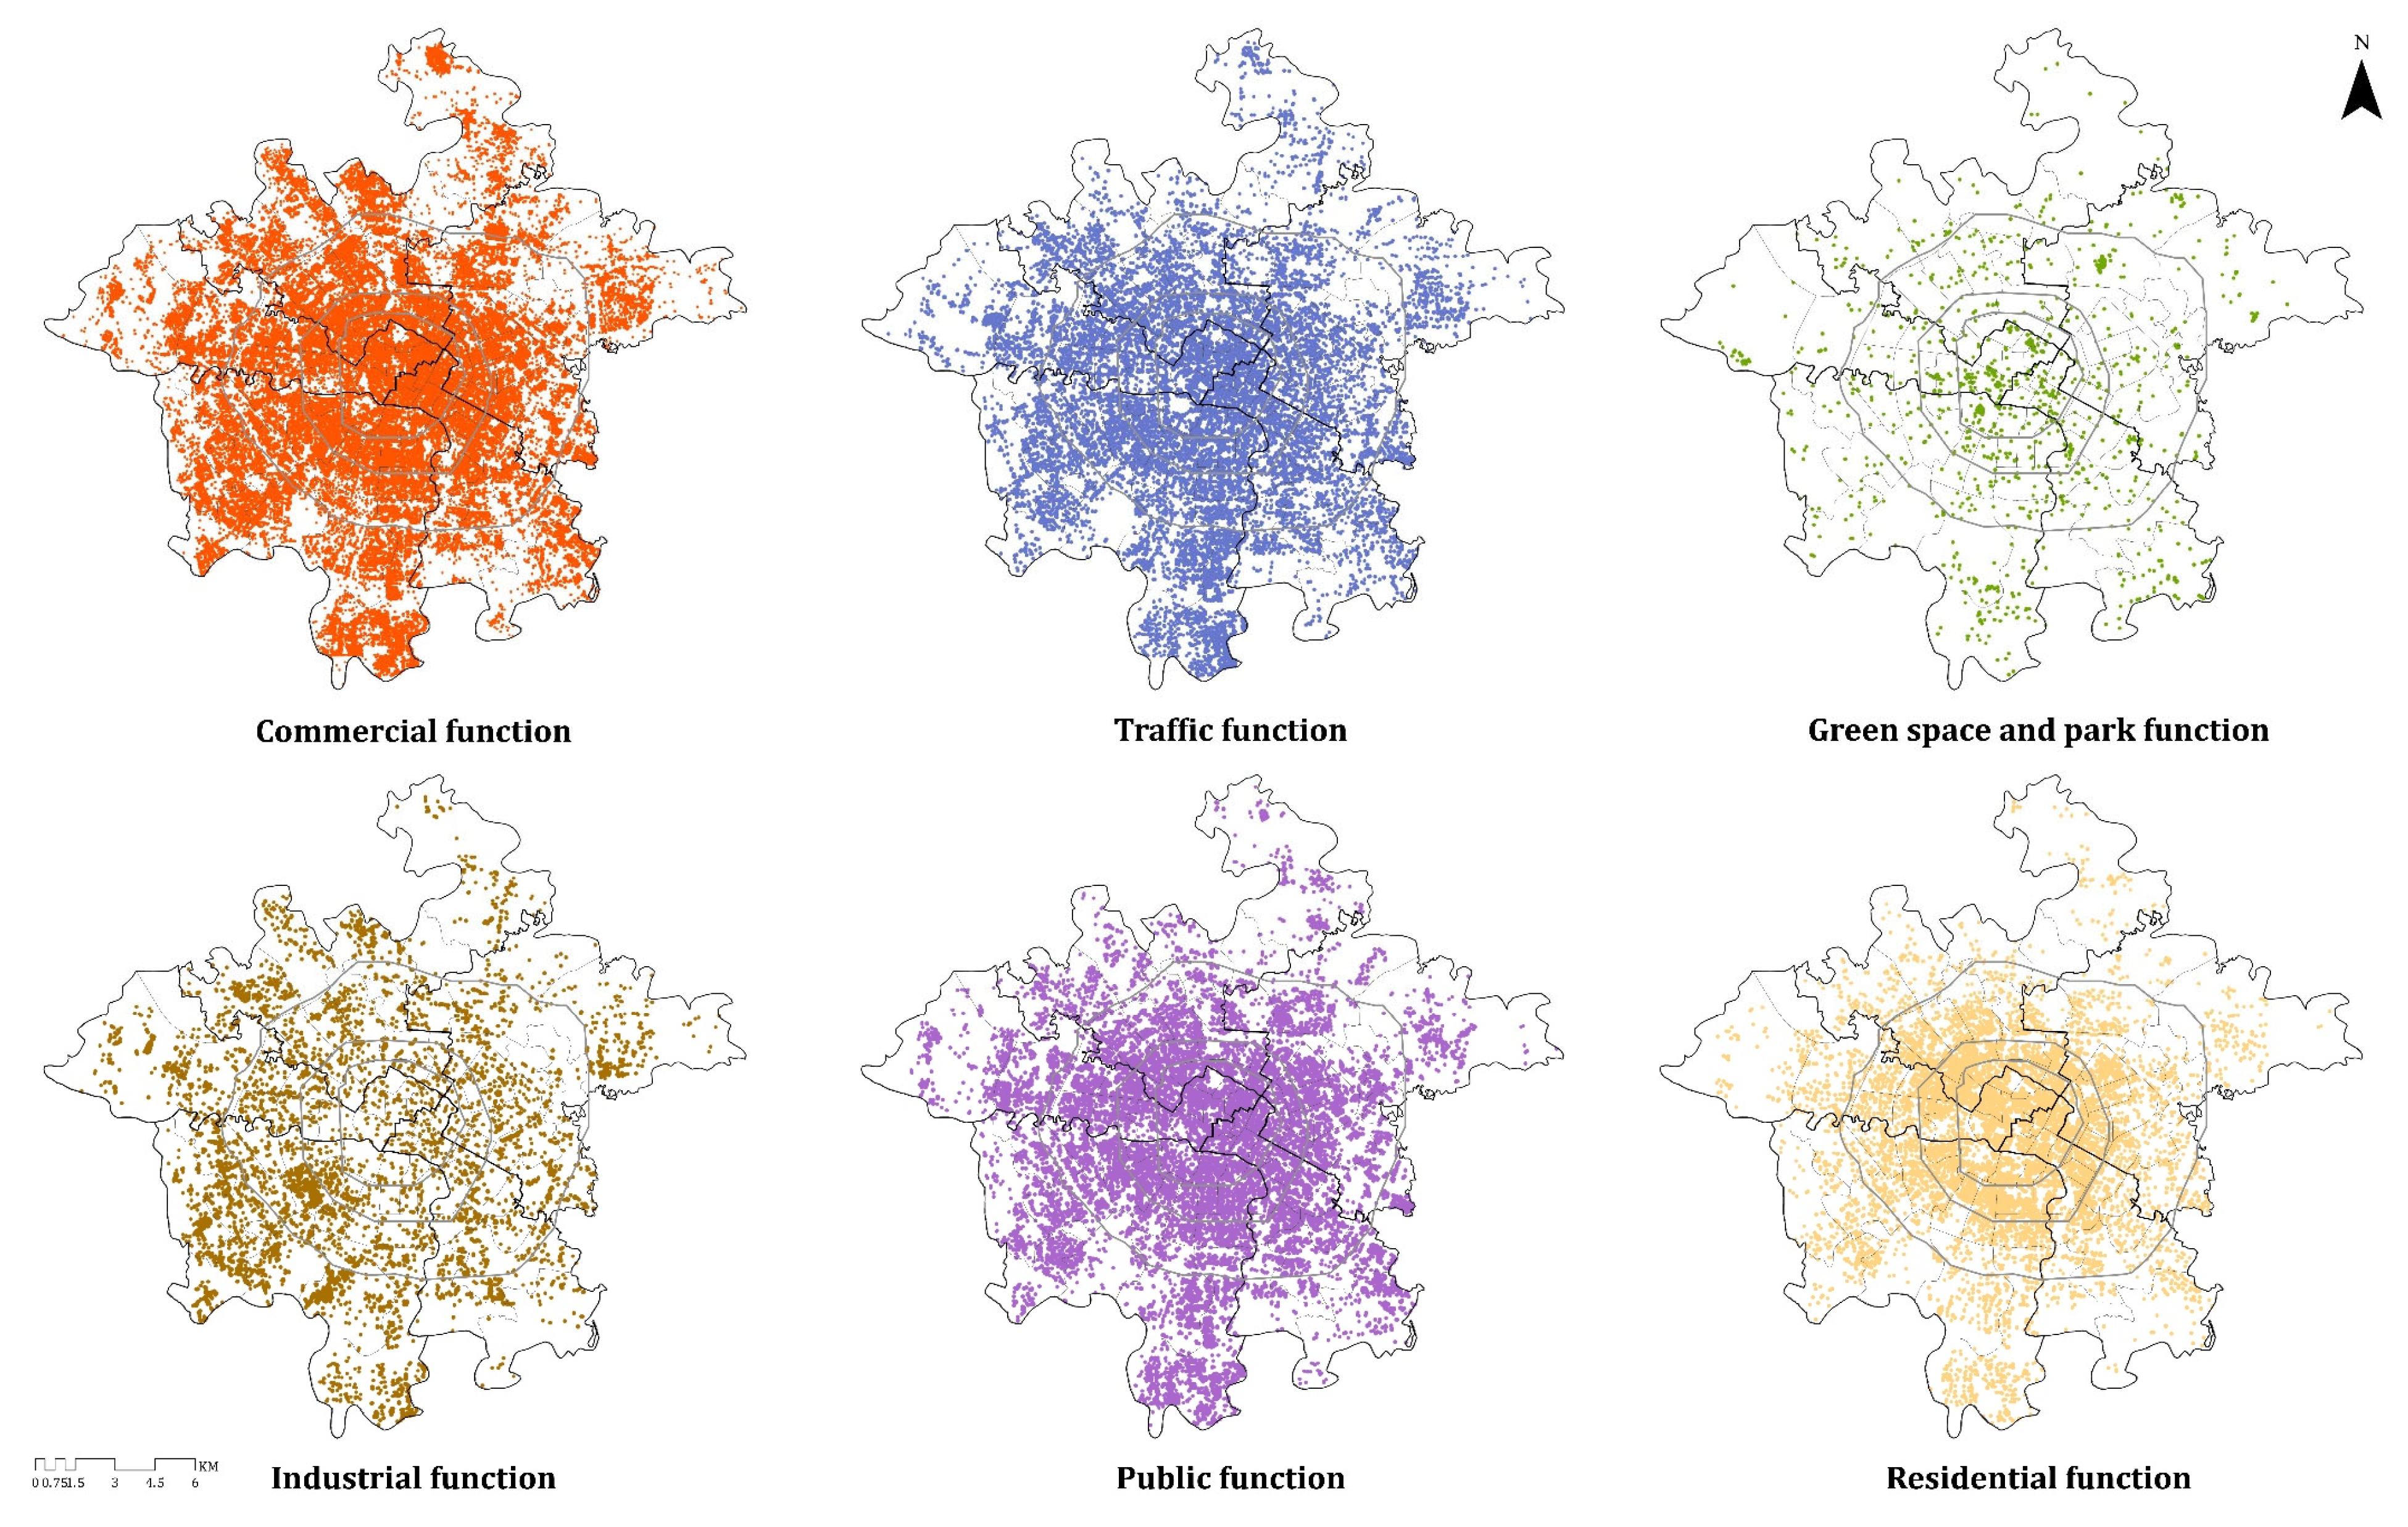
4.2. Spatial Distribution Patterns of FCS

Based on the functional category division of the POI data, we obtained the share of the six functional categories of 77 streets (Figure 10). The spatial pattern of the six urban functional categories is clear, with the overall commercial function in the five core urban areas of Chengdu City accounting for a large proportion, and the overall proportion in the northeast and southwest being slightly higher. The industrial function shows a much higher distribution outside of the Third Ring Road than inside the Third Ring Road, while the pattern of the residential function is completely the opposite. The spatial pattern of green space and parks is relatively uniform, with both high and low values in each district. The traffic and public function show similar spatial patterns.

4.3. Associations Between SDHW and FCS

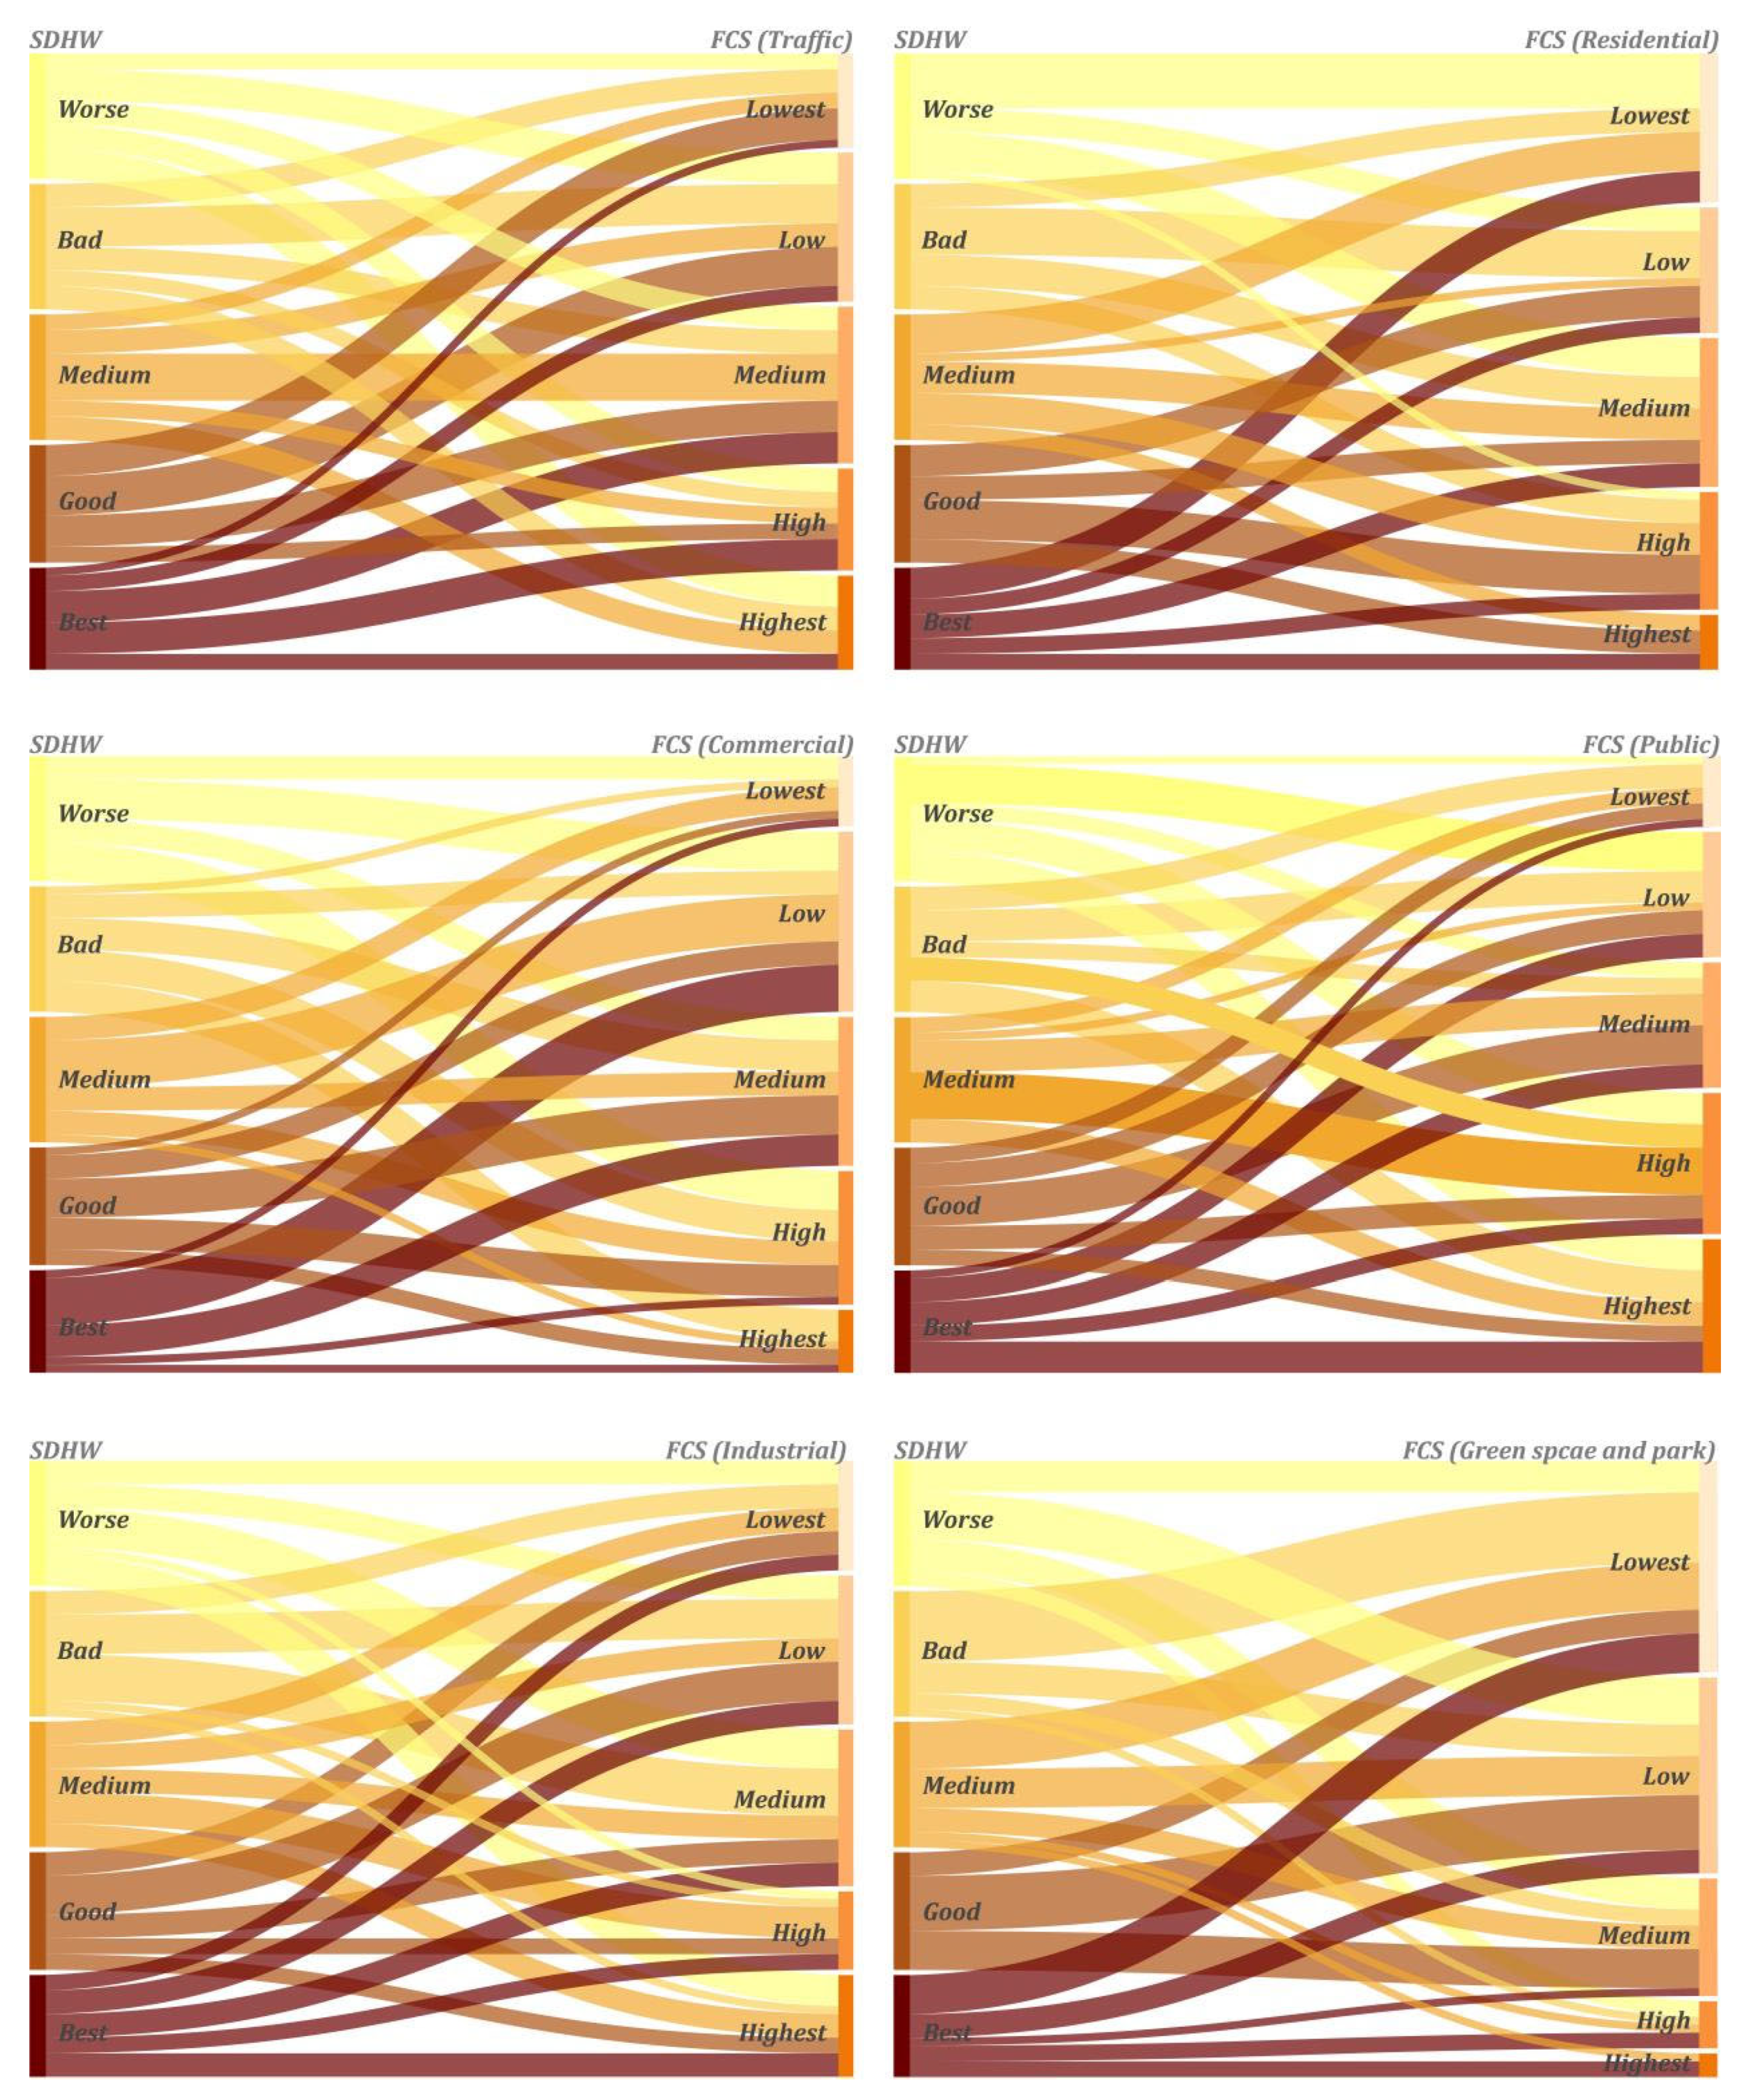
4.3.1. Associations Between SDHW and One Single FCS

The extent to which a single function category affects sentiment values on different streets demonstrates different results. We measured the effect of each of the six functional categories on the sentiment values, as shown in Figure 11, where the left side represents five different levels of sentiment and the right side represents five different degrees of urban functional category share. The width of the connecting line represents the correlation between the two, where the wider the connecting line is, the stronger the correlation.
Specifically, the green space and parks function has a greater impact on positive sentiments, and streets with a higher percentage of them are more often connected to relatively positive sentiment values. In addition, residents living on streets with a higher percentage of the public function are more likely to show positive sentiments, i.e., the relatively positive sentiments in the figure tend to flow to streets with a higher percentage of the public function. Moreover, when the percentage of the commercial function is low, the residents’ sentiments are more positive.
On the other hand, residents living in streets with a high proportion of industrial function show more negative sentiments; a low proportion of the green space and parks function and residential function may lead to negative sentiments; and residents in streets with a low proportion of residential categories show more negative sentiments. In addition, the effect of the traffic function on sentiments is more complicated. The best sentiment flow lines in the figure tend to flow to the higher proportion of traffic function, while the better sentiment flow to the lower proportion or even the lowest proportion of the traffic function.

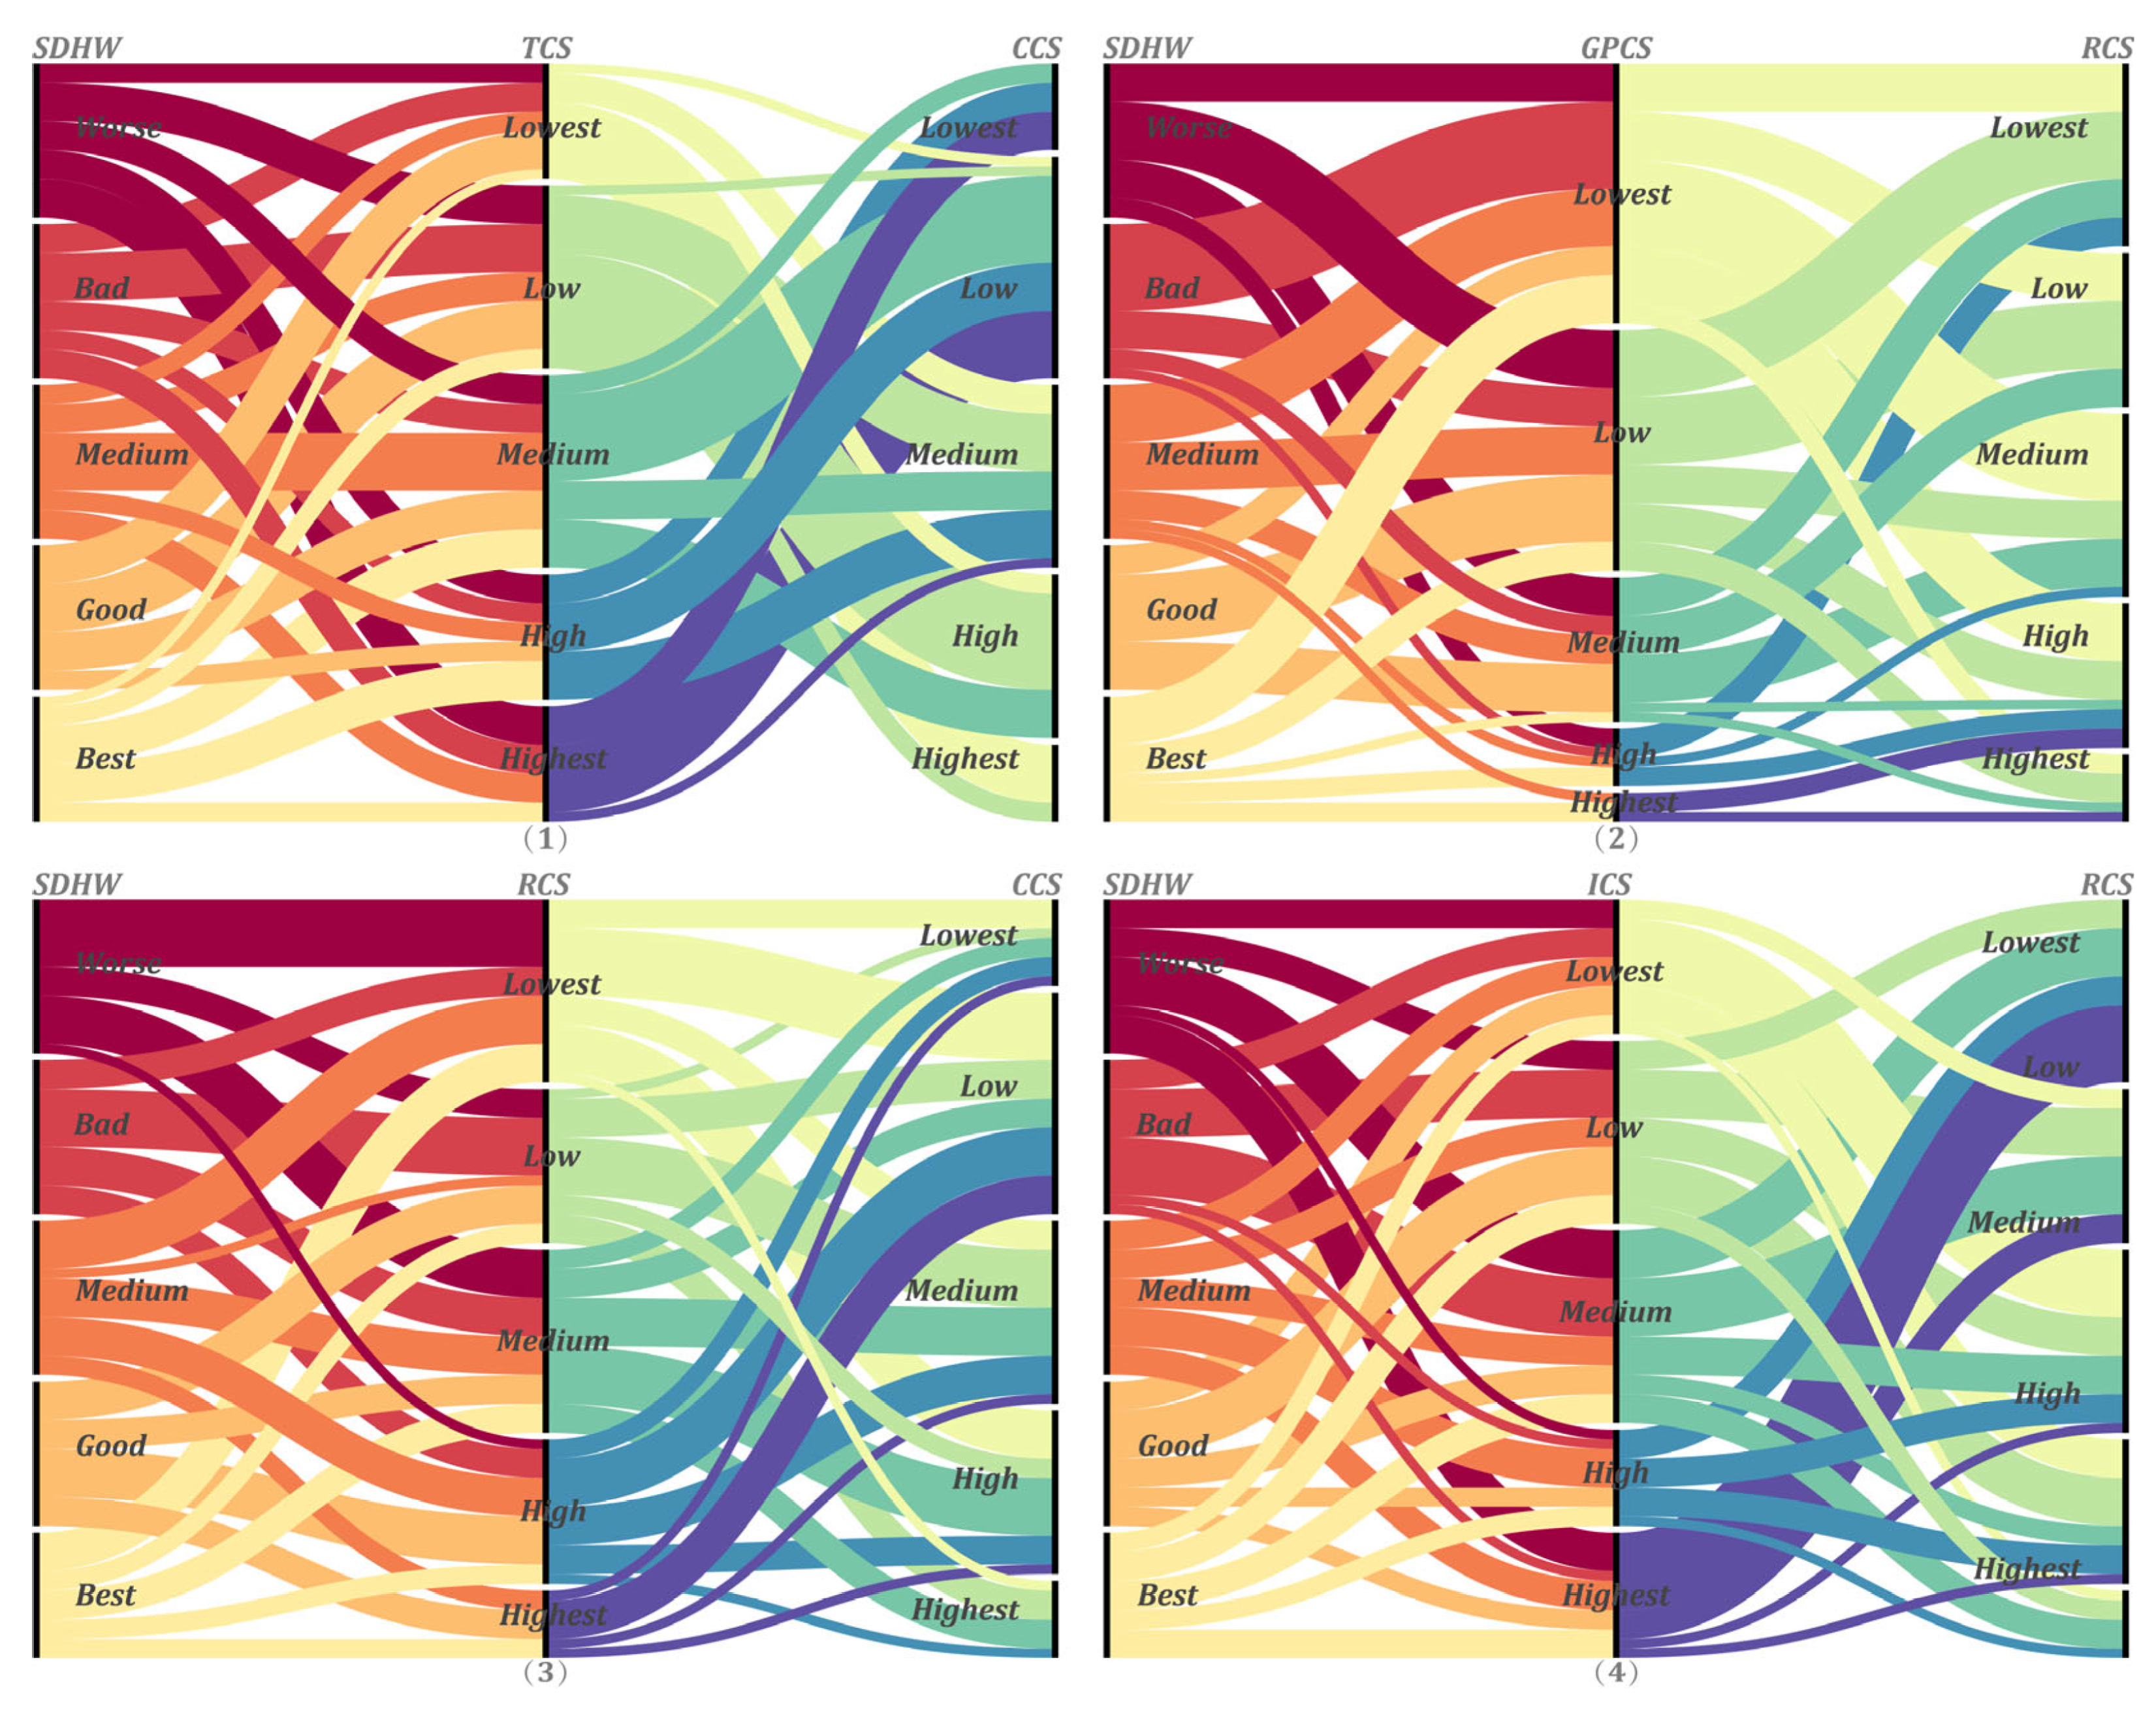
4.3.2. Associations Between SDHW and Combined FCS

This section focuses on the effects of combinations of two or three urban functional types on SDHW. Table 1 lists the association rules at p-values of less than 0.1 and 0.05, which show which FCS combinations have a more significant positive or negative effect on SDHW. From the table, whether or not an FCS combination is significantly associated with SDHW is mainly influenced by the share of high residential function, with the green space and parks and public functions also appearing more frequently in each rule.
Figure 12 and Figure 13 show the mechanisms by which each combination of FCS in the significant association rule affects SDHW. Specifically, among the two combinations of FCSs, good SDHW is more likely to be found on streets with a lower proportion of the commercial category (CCS) and a higher proportion of the traffic category (TCS) (e.g., Figure 12-1, whose Sankey diagram shapes tend to be dominated by upward-bending curves). Residential streets with a high proportion of green spaces and parks (GPCS) (as in Figure 12-2, where the shape of the Sankey diagram tends to be a smooth, straight line) mainly show positive SDHW in streets with a high proportion of the residential category (RCS), and also tend to have positive SDHW in streets with a low proportion of the commercial function or a low proportion of the industrial category (ICS) (as in Figure 12-3,4, where the shape of the Sankey diagram tends to be an upward-bending curve). On the contrary, when the proportion of both the residential category and the green space and parks category is low, the street tends to produce poorer SDHW.
Furthermore, among the three types of combinations, the correlation rules between the functional category and the level of sentiment are more complex. When combinations of lower GPCS, higher CCS, and lower RCS occur together in a street, they are more likely to result in poorer SDHW (e.g., Figure 13-1). Also, consistent with the results of the two functional combinations described above, higher GPCS, PCS, and RCS correlate more with a better SDHW.

5. Discussion

5.1. Summary of Key Findings

The purpose of this study was to explore the effects of different urban function categories on the residents’ sentiments during heat waves at the street scale in the five core urban areas of Chengdu, as well as the spatial distribution pattern of these effects. By studying 77 streets in Chengdu, we found that the distribution of sentiments within the five core urban areas is similar to the circular ring structure of Chengdu, with relatively large positive impacts within the Second Ring Road and large negative impacts in the eastern part of the city. The green space and parks category and public category are effective at promoting positive sentiments, the industrial category has more significant impacts on sentiments, and the commercial and traffic category has more varied impacts. Different functional categories in each region lead to different emotional feelings, which is similar to the results of previous studies on other regions. Huang [27] points out that, during the heat waves in Chongqing, the temperature is differentiated by the influence of urban spatial elements, which in turn affects the crowd’s thermal comfort level. Shan [28] demonstrates that the spatial distribution of sentiments of Wuhan residents has a more significant agglomeration through his study, and that the majority of built environment elements have a more robust impact on the sentiments.

5.2. The Exploration of the Association Between SDHW and FCS

5.2.1. SDHW

The existing studies on the analysis of urban resilience during heat waves have mainly focused on the heat itself or urban infrastructure. However, previous studies have paid little attention to the spatial distribution characteristics of positive and negative public sentiments. Assessing urban resilience from a public psychology perspective measure facilitates urban planners and government officials to revisit relevant plans and policies, combining multiple dimensions to achieve optimal solutions for resilient cities.
As mentioned earlier, the sentiment values of residents during heat waves in the five core urban areas of Chengdu have certain spatial distribution characteristics, and the central city (within the Second Ring Road) is relatively more positive in terms of sentiments in the face of high-temperature weather. This is consistent with many studies that suggest that downtown areas typically have more services and critical resources that are conducive to helping residents to cope with extreme heat and promote emotional stability [29]. Prior research suggests that positive mood is strongly correlated with economic indicators, and that residents of higher-income areas, such as downtowns, are likely to be happier [30]; however, it has also been noted that residents of higher-income areas are typically more sensitive to summer heat [31].

5.2.2. The Association Between SDHW and FCS

Streets have different combinations of functions and spatial layouts, so the correlation between street sentiments during heat waves and major function categories varies from site to site. Generally speaking, the industrial function has a negative impact on sentiments, and this study draws similar conclusions. The Chenghua District, as an old industrial area in transition, still retains high-density housing and legacy factories in some areas, with many hard surfaces and an uneven distribution of green space, which may exacerbate the local heat island effect [32]. However, it is worth noting that the overall sentiments of the residents in the five core urban areas are not very significantly affected by the industrial function. This may be due to the fact that, in the study area, as the main central city of Chengdu, the industrial category is mainly composed of scattered service types such as automobile maintenance and building material markets, which bring relatively small direct impacts on the surrounding sentiments, unlike the large-scale industrial zones that are centrally located on the outskirts of the city (as shown in previous studies), which are prone to noise, pollution, traffic congestion, and other problems [32].
The higher proportion of commercial function in the Jinjiang District may exacerbate the negative sentiments of the residents during heat waves; moreover, the positive sentiments in the Qingyang and Wuhou Districts are also related to the lower proportion of commercial function. These results seem to indicate that people have more negative sentiments in areas with a higher density of the commercial function. From the perspective of urban planning and design, areas with a lower proportion of the commercial function tend to give residents a sense of relaxation and tranquility, while, conversely, the spatial environment tends to be noisy and busy, which is more likely to generate feelings of stress and anxiety. However, some studies have also shown that positive sentiments cluster around commercial areas [33], so there is disagreement about the effect of the commercial function on sentiments.
From the results of the current study, it is clear that positive sentiments during heat waves are associated with a high percentage of public areas. The public function usually consists of healthcare, sports and fitness, etc., which usually have a positive impact on sentiments. Streets with convenient healthcare resources may promote positive sentiments, as residents have fainted from heatstroke in many places during the heat waves. For example, a high percentage of the public function around Dongpo and Caotang streets had a higher correlation with positive sentiments. In addition, although temperatures remain high during heat waves, exercise and fitness may remain a common lifestyle for residents to alleviate negative sentiments and release stress.
In addition, according to the results, it is known that a high percentage of the traffic function is associated more with positive sentiments. Previous research has found that the traffic function tends to play a positive role in influencing residents’ sentiments [28], and residents living in areas with good access to transportation may have a better emotional experience. However, at the same time, the results also show that, although the best emotional flow lines tend to flow to a higher proportion of the traffic function, the better emotions flow to a lower proportion, or even the lowest proportion, of the traffic function. This is mentioned in the relevant research on the impact of a high proportion of traffic on residents’ emotions and mental health. Robust evidence shows traffic congestion and delays, especially the high density and low speeds common in urban areas, negatively impact mental health and well-being assessments [34]. The low proportion of green space and parks during the heat waves also led to negative sentiments, but the high proportion of green spaces and parks did not have a very significant improvement in sentiments. This was probably because of the extreme high temperatures during the heat waves, which made people reluctant to go outdoors even when living around green spaces, and also exacerbated the reluctance to go outside due to the electricity restrictions in public areas caused by the heat waves. A study in Japan found that high temperatures affect the number of people using urban green spaces. The number of people using green spaces decreased significantly during temperatures above 28 °C, and green spaces with water for playing and indoor facilities were more highly utilized at high temperatures [35]. In addition, in line with the results of the previous analysis, the limited impact of green spaces on sentiments may make the provision of healthcare services and building energy efficiency more significant, discussions that still need more work to be validated.
All of this suggests that the effect of the functional category on residents’ sentiment is not absolute, but that there are spatial differences, and that different environmental changes and their potential impact on residents should be taken into account in order to develop urban planning programs that are more responsive to residents’ needs (Figure 14).

5.3. Implications

In response to the extreme high temperatures occurring in non-extreme climate regions, previous studies have generally started from the perspective of mitigation measures focusing on a reduction in greenhouse gas emissions and adaptation measures focusing on the overall improvement of climate risk resilience. This study focuses on the spatial characteristics of street sentiment distribution in the five core urban areas of Chengdu and proposes planning response strategies during heat waves from the perspective of prevention and adaptation for different functions (Figure 15).

5.3.1. Improvement of Green Coverage and Building Efficiency

This section focuses on streets where residents are predominantly negatively emotional and where the functional category of green space and parks is scarce, mainly including Fuqin Street, Mengzhuiwan Street, and Simaqiao Street. For these streets, green space coverage should be increased, and city park construction should be promoted in order to reduce the exposure of street space during high-temperature heat waves and reduce the impact of thermal radiation on it. At the street level, there are many old neighborhoods in these areas with small green areas, weak openness, low space utilization, and a single type of plant community. In this regard, based on the local microclimate conditions, we can create interactive green spaces that the residents can widely participate in and maintain [36]. At the same time, through the introduction of diversified plant species, we can build a multi-level plant community system, combining trees, shrubs, and grasses to improve the stability of the ecosystem and landscape diversity. In addition, the green space coverage area of old communities can be increased through roof gardens and vertical greening, etc. Meanwhile, designs such as low-carbon buildings and energy-saving buildings should be promoted to reduce building heat dissipation from the source.

5.3.2. Improvement of Public Facilities

This section focuses on streets where residents are predominantly negative and where the category of public function is scarce, mainly including Longtan Street, Hehuachi Street, Shaheyuan Street, and so on. For these streets, the focus should be on upgrading the public facilities and public spaces in order to improve the adaptive capacity of street spaces during high-temperature heat waves. At the street level, these areas are most affected by the impact of heat wave events due to old facilities and the lack of services. In this regard, it is possible to improve medical service resources and extend the opening hours of public buildings to provide people with timely access to medical care and nearby places to avoid the heat and cool off, and, at the same time, increase the number of resting chairs, cool huts, and other public support facilities to create a cool space. In addition, taking into account the low-income characteristics of the region’s residents, in the event of a sudden heat wave, the residents can be guided to large sports stadiums, subway stations, and other public spaces to ‘centralized cooling’ [37]. This model can not only provide the residents with emergency places to avoid the heat, but also alleviate the pressure on the city’s power supply.

5.3.3. Focus on Aging-Friendly Areas

This section focuses on streets with rich residential function but with negative resident sentiments, such as Fuqin Street, Shuyuanjie Street, Xi’an Road Street, etc. For these types of streets, considerations should start from the perspective of social services for the residential population. At the street level, these areas have a large number of highly sensitive groups, such as the elderly. In this regard, factors such as noise levels and commercial activities should be taken into account when planning the commercial function in order to create a quiet and livable street environment. At the same time, a sudden extreme heat response group can be set up to register the elderly people living alone in neighborhoods with large elderly populations and those in hot areas, and to track the physical condition of highly sensitive groups during sudden extreme heat waves by means of regular phone calls and home health monitoring. In addition, the risk of discomfort for the elderly due to overheating from exercise can be reduced by adding elevators in older communities and installing handrails in stairwells, etc. This can also be achieved by providing shade and cooling equipment for outdoor activities for the elderly by installing additional awnings around buildings and providing shared umbrellas or shared fans that are easy for the elderly to use. At the same time, parking spaces for emergency vehicles can be reserved near buildings to facilitate the transportation and treatment of elderly people in emergencies due to high temperatures. (More strategies can be found from http://sh.people.com.cn/n2/2024/0816/c138654-40946222.html) (accessed on 1 April 2025).

5.4. Limitations and Future Research

It should be noted that this study has some limitations and uncertainties. In terms of the study area, the scope could be further expanded to include different types of urban environments—including, but not limited to, large cities, medium-sized cities, and cities with different geographical and climatic conditions—to facilitate further comparative research and analysis. Within Chengdu, based on the representative street cases identified in this study, further exploration of the correlation between sentiments and street functions could be conducted, with corresponding strategies being implemented on a small scale to monitor the changes in the residents’ sentiments before and after the renovations.
The method of our study still has some limitations and needs more research in the future. First, although sentimental expressions in social media texts can reflect group emotional tendencies, the data users were predominantly from the youth group, with insufficient sample coverage from the elderly and children’s groups. Given that the latter two groups are more emotionally vulnerable in extreme weather, the findings have limitations on the overall representativeness of the urban residents’ sentiments and may underestimate the negative emotional impact of heat waves on specific groups. Future studies could first consider individual characteristics such as the occupation, income, and age of the residents to more deeply analyze how the emotional health of different populations is affected by high temperatures. Second, the deep-learning-based sentiment classification model only achieves a binary division of positive and negative sentiments, failing to refine specific sentiment dimensions such as anger and sadness, and the accuracy of sentiment measurement needs to be improved [29]. Future studies can introduce a more refined sentiment classification system to deepen the research on sentiment cognition under high temperatures and heat waves. In addition, considering that the functions of different streets have different influential scopes and public awareness, the buffer zone indicators used in the street function scoring formula in this study can only provide approximate street function information. Further research should be conducted in the future on POI, such as street function category calculations.
With the selection of relevant traditional geographic information, future studies can also explore the impact of more urban environmental factors on residents’ sentiments during heat waves, such as road network density, air quality, noise level, and other factors to explore their short-term and long-term impacts on residents’ sentiments. At the same time, since the sentiment-enhancing effect of the green space functions is inconsistent with the findings of some previous studies, we will analyze the effect of green spaces on residents’ sentiments under normal temperature conditions to compare the changes during different periods. In future research, we will also collaborate with community hospitals to obtain medical information in order to corroborate the findings of this study showing that the medical-function-oriented public category of streets helps to promote positive emotions among the residents during heat waves.
These comprehensive studies will help to provide a more nuanced understanding that will enable urban planners and policy makers to effectively optimize urban environments and enhance residents’ emotional experiences during heat waves.

6. Conclusions

Based on Sina Weibo social media data, this study explores the spatial distribution of residents’ sentiments in five core urban areas of Chengdu by NLP under high temperatures and heat waves in August 2022. We found that positive emotions within the Second Ring Road exhibit a higher proportion than those found in peripheral areas, and that negative sentiments are more often gathered in the eastern area. In addition, we analyze the association with different functional categories at the street scale and reveal which functional category is associated with such sentiments in different streets. We found that the street categories of green space and public show a significant promoting impact on residents’ positive sentiments, but the industrial and commercial categories often correlate with negative sentiments. The combination of the residential category and other functional categories has a strong correlation with sentiments, indicating that a reasonable functional combination within residential areas plays a crucial role in promoting residents’ positive sentiments. The results of this study help us to understand the spatial distribution pattern of residents’ emotional health and improve the planning and governance of neighborhoods in a heat-wave-prone environment, providing a reference for identifying urban spatial problems, strengthening urban emergency management, and building a healthy city. Future research should aim to improve the accuracy of emotional studies and provide more insights into the correlations with urban functional categories and more urban environmental factors.

Author Contributions

Conceptualization, T.H. and S.L.; Data curation, T.H.; Formal analysis, T.H.; Investigation, T.H.; Methodology, T.H., Y.R. and S.L.; Resources, T.H.; Software, T.H., Y.R. and S.Z.; Supervision, S.L.; Validation, T.H., Y.R. and S.Z.; Visualization, T.H., Y.R. and S.Z.; Writing—original draft, T.H.; Writing—review and editing, T.H., Y.R., S.Z. and S.L. All authors have read and agreed to the published version of the manuscript.

Funding

This research was funded by the Central Universities Basic Research Operating Expenses—Science and Technology Innovation Project, grant number XJ2023009801.

Data Availability Statement

The raw data supporting the conclusions of this article will be made available by the authors upon request.

Conflicts of Interest

The authors declare no conflicts of interest.

Abbreviations

The following abbreviations are used in this manuscript:
SDHWSentiments during heat waves
FCSFunctional categories of streets
TCSTraffic category of streets
CCSCommercial category of streets
GPCSGreen spaces and parks category of streets
RCSResidential category of streets
ICSIndustrial category of streets
PCSPublic category of streets

References

  1. Almendra, R.; Loureiro, A.; Silva, G.; Vasconcelos, J.; Santana, P. Short-term impacts of air temperature on hospitalizations for mental disorders in Lisbon. Sci. Total Environ. 2019, 647, 127–133. [Google Scholar] [CrossRef] [PubMed]
  2. Linchuan, Y.; Haosen, Y.; Qiangxue, F.; Guilin, Z.; Bingjie, Y. Vulnerability assessment and planning response to high-temperature wave in large cities: The case of Chengdu. Planner 2023, 39, 38–45. [Google Scholar]
  3. Shui, W.; Chen, Z.; Deng, J.; Li, Y.; Wang, Q.; Wang, W.; Chen, Y. Evaluation of urban high temperature vulnerability of coupling adaptability in Fuzhou, China. Acta Geogr. Sin. 2017, 72, 830–849. [Google Scholar]
  4. Huang, X.J.; Qi, M.Y.; Zhao, K.X.; Zheng, D.Y.; Liu, M.M. Assessment of population vulnerability to heat stress and spatial differentiation in Xi’an. Geogr. Res. 2021, 40, 1684–1700. [Google Scholar]
  5. UNISDR. Terminology on Disaster Risk Reduction; UNISDR: Geneva, Switzerland, 2009; Available online: https://www.undrr.org/publication/2009-unisdr-terminology-disaster-risk-reduction (accessed on 1 January 2025).
  6. Arup. City Resilience Index; Arup: London, UK, 2014; Available online: https://www.arup.com/insights/city-resilience-index/ (accessed on 1 January 2025).
  7. Li, Y.; Zhai, G.; Gu, F. Review on methods of quantification of urban infrastructure resilience. Urban Dev. Stud. 2016, 23, 113–122. [Google Scholar]
  8. Wang, L. Exploring a knowledge map for urban resilience to climate change. Cities 2022, 131, 104048. [Google Scholar] [CrossRef]
  9. Wang, B.; Loo, B.P.; Zhen, F.; Xi, G. Urban resilience from the lens of social media data: Responses to urban flooding in Nanjing, China. Cities 2020, 106, 102884. [Google Scholar] [CrossRef]
  10. Ramakrishnan, S.; Wang, X.; Sanjayan, J.; Wilson, J. Thermal performance of buildings integrated with phase change materials to reduce heat stress risks during extreme heatwave events. Appl. Energy 2017, 194, 410–421. [Google Scholar] [CrossRef]
  11. Xia, Y.; Li, Y.; Guan, D.; Tinoco, D.M.; Xia, J.; Yan, Z.; Yang, J.; Liu, Q.; Huo, H. Assessment of the economic impacts of heat waves: A case study of Nanjing, China. J. Clean. Prod. 2018, 171, 811–819. [Google Scholar] [CrossRef]
  12. Huang, H.; Zhang, S.; Xiong, S.; Shi, C. Health risk assessment and influencing factors analysis of high temperatures on negative emotions. Buildings 2022, 12, 1040. [Google Scholar] [CrossRef]
  13. Wang, J.; Obradovich, N.; Zheng, S. A 43-million-person investigation into weather and expressed sentiment in a changing climate. One Earth 2020, 2, 568–577. [Google Scholar] [CrossRef]
  14. Baylis, P. Temperature and temperament: Evidence from Twitter. J. Public Econ. 2020, 184, 104161. [Google Scholar] [CrossRef]
  15. Huang, H.; Liu, X.; Ren, L. Analysis of the spatiotemporal mechanism of high temperature on residents’ irritability in Beijing based on multiscale geographically weighted regression model. Front. Ecol. Evol. 2022, 10, 973365. [Google Scholar] [CrossRef]
  16. Shoval, N.; Schvimer, Y.; Tamir, M. Tracking technologies and urban analysis: Adding the emotional dimension. Cities 2018, 72, 34–42. [Google Scholar] [CrossRef]
  17. He, H.; Sun, R. Sentiment variations affected by urban temperature and landscape across China. Cities 2024, 149, 104933. [Google Scholar] [CrossRef]
  18. Zhong, W.; Suo, J.; Ren, X.; Li, G. The influence of emotional health on the activity characteristics of the elderly and the selection of environmental quality factors in residential areas. Int. J. Environ. Res. Public Health 2021, 18, 12618. [Google Scholar] [CrossRef]
  19. Su, X.; Wang, F.; Zhou, D.; Zhang, H. Heat health risk and adaptability assessments at the subdistrict scale in Metropolitan Beijing. Int. J. Disaster Risk Sci. 2022, 13, 987–1003. [Google Scholar] [CrossRef]
  20. Zheng, S.; Wang, J.; Sun, C.; Zhang, X.; Kahn, M.E. Air pollution lowers Chinese urbanites’ expressed happiness on social media. Nat. Hum. Behav. 2019, 3, 237–243. [Google Scholar] [CrossRef]
  21. Yang, L.; Liang, Y.; He, B.; Yang, H.; Lin, D. COVID-19 moderates the association between to-metro and by-metro accessibility and house prices. Transp. Res. Part D Transp. Environ. 2023, 114, 103571. [Google Scholar] [CrossRef]
  22. Weishan, C.; Lin, L.; Yutian, L. Retail center recognition and spatial aggregating feature analysis of retail formats in Guangzhou based on POI data. Geogr. Res. 2016, 35, 703–716. [Google Scholar]
  23. Sun, D.; Li, S.; Zheng, W.; Croitoru, A.; Stefanidis, A.; Goldberg, M. Mapping floods due to Hurricane Sandy using NPP VIIRS and ATMS data and geotagged Flickr imagery. Int. J. Digit. Earth 2016, 9, 427–441. [Google Scholar] [CrossRef]
  24. Wang, K.; Xu, Y. Questions and Answers to the Code for Classification of Urban Land Use and Planning standards of Development Land(GB 50137–2011)(I). City Plan. Rev. 2012, 4, 69–70. [Google Scholar]
  25. Zhang, L. Research on POI Classification Standard. Bull. Surv. Mapp. 2012, 10, 82–84. [Google Scholar]
  26. Xie, M.; Cheng, Y.; Fan, S. Identification of Urban Functional Areas in Fuzhou Based on POI data. Agric. Technol. 2023, 43, 107–112. [Google Scholar]
  27. Huang, H.; Jie, P. Research on the characteristics of high-temperature heat waves and outdoor thermal comfort: A typical space in Chongqing Yuzhong District as an example. Buildings 2022, 12, 625. [Google Scholar] [CrossRef]
  28. Shan, Z.; An, Y.; Yuan, M.; Huang, Y. Study on Spatial and Temporal Distribution Characteristics and Influencing Factors of Urban Residents’ Sentiment Based on Weibo Data: A Case Study of the Main Urban Area of Wuhan. Urban Dev. Stud. 2022, 29, 69–76+2. [Google Scholar]
  29. Zhu, Y.; Wang, J.; Yuan, Y.; Meng, B.; Luo, M.; Shi, C.; Ji, H. Spatial heterogeneities of residents’ sentiments and their associations with urban functional areas during heat waves—A case study in Beijing. Comput. Urban Sci. 2024, 4, 7. [Google Scholar] [CrossRef]
  30. Xing, Z. A study of the relationship between income and subjective well-being in China. Sociol. Stud. 2011, 1, 196–219. [Google Scholar]
  31. Cheng, Y.; Yu, Z.; Xu, C.; Manoli, G.; Ren, X.; Zhang, J.; Liu, Y.; Yin, R.; Zhao, B.; Vejre, H. Climatic and economic background determine the disparities in urbanites’ expressed happiness during the summer heat. Environ. Sci. Technol. 2023, 57, 10951–10961. [Google Scholar] [CrossRef]
  32. Ying, X. Thermal environment effects of urban human settlements and influencing factors based on multi-source data: A case study of Changsha city. Acta Geograph. Sin. 2021, 75, 2443. [Google Scholar]
  33. Gao, Y.; Chen, Y.; Mu, L.; Gong, S.; Zhang, P.; Liu, Y. Measuring urban sentiments from social media data: A dual-polarity metric approach. J. Geogr. Syst. 2022, 24, 199–221. [Google Scholar] [CrossRef]
  34. Conceição, M.A.; Monteiro, M.M.; Kasraian, D.; van den Berg, P.; Haustein, S.; Alves, I.; Azevedo, C.L.; Miranda, B. The effect of transport infrastructure, congestion and reliability on mental wellbeing: A systematic review of empirical studies. Transp. Rev. 2023, 43, 264–302. [Google Scholar] [CrossRef]
  35. Wakayama, M.; Mameno, K.; Owake, T.; Aikoh, T.; Shoji, Y. Climate change-induced heat reduces urban green space use: Insights from mobile phone location big data. Urban For. Urban Green. 2025, 107, 128771. [Google Scholar] [CrossRef]
  36. Salih, K.; Báthoryné Nagy, I.R. Review of the Role of Urban Green Infrastructure on Climate Resiliency: A Focus on Heat Mitigation Modelling Scenario on the Microclimate and Building Scale. Urban Sci. 2024, 8, 220. [Google Scholar] [CrossRef]
  37. Guo, F.; Dong, J.; Guo, R. A New Evaluation Method for Heat Exposure Risk Integrated With Outdoor Spatial Behaviour. World Archit. 2022, 9, 9296. [Google Scholar]
Figure 1. Comparison of the highest daily temperatures in Chengdu in August 2022 and August 2021.
Land 14 01377 g001
Figure 2. City Resilience Index by Arup.
Land 14 01377 g002
Figure 3. (a) Scene of power restriction in a shopping mall; (b) long queues outside a charging station due to power restriction; (c) some companies choose to purchase ice bricks to cool their office areas. (Source: https://finance.sina.cn/2022-08-26/detail-imizirav9860467.d.html) (accessed on 1 March 2025).
Land 14 01377 g003
Figure 4. The study area, including the five core urban areas of Chengdu city.
Land 14 01377 g004
Figure 5. Distribution of the Weibo points in the five core urban areas of Chengdu.
Land 14 01377 g005
Figure 6. Spatial differences in the number of Weibo posts in the five core urban areas of Chengdu.
Land 14 01377 g006
Figure 7. Six functional categories of POIs in the five core urban areas of Chengdu.
Land 14 01377 g007
Figure 8. Methodological framework of this study.
Land 14 01377 g008
Figure 9. Left side, spatial distribution of sentiment values of streets in the five areas; right side, proportion of each level of sentiment value in the five areas.
Land 14 01377 g009
Figure 10. Distribution of the six urban functional categories of streets in the five urban areas.
Land 14 01377 g010
Figure 11. Correlations between single FCS and SDHW.
Land 14 01377 g011
Figure 12. Correlations between two combinations of FCSs and SDHW; Numbers (1)–(4) respectively represent the correlation between different FCSs and SDHW; TCS, traffic category of streets; CCS, commercial category of streets; GPCS, green spaces and park category of streets; RCS, residential category of streets; ICS, industrial category of streets.
Land 14 01377 g012
Figure 13. Correlations between three combinations of FCSs and SDHW; Numbers (1)–(6) respectively represent the correlation between different FCSs and SDHW; TCS, traffic category of streets; CCS, commercial category of streets; GPCS, green spaces and park category of streets; RCS, residential category of streets; ICS, industrial category of streets; PCS, public category of streets.
Land 14 01377 g013
Figure 14. (a) The hard surfaces and uneven distribution of green space in an old industrial area in transition; (b) a busy commercial street in Jinjiang District; (c) a healthcare service at the roadside in Qinyang District (Source: by author).
Land 14 01377 g014
Figure 15. Response strategies for different functional streets.
Land 14 01377 g015
Table 1. Correlation between SDHW and multiple urban FCS.
VariableCorrelation with SDHW
IDMultiple Urban FCSCoefficientp-Values
1TCS, CCS−0.110.03 **
2GPCS, RCS0.260.02 **
3RCS, CCS0.190.09 *
4ICS, RCS0.280.01 **
5GPCS, CCS, RCS0.200.08 *
6GPCS, ICS, RCS0.230.05 *
7GPCS, PCS, RCS0.200.08 *
8CCS, ICS, RCS0.310.01 **
9ICS, PCS, RCS0.230.04 **
10CCS, PCS, TCS−0.170.03 **
* Significant at the 90% level (p < 0.1); ** Significant at the 95% level (p < 0.05). Note: TCS, traffic category of streets; CCS, commercial category of streets; GPCS, green spaces and park category of streets; RCS, residential category of streets; ICS, industrial category of streets; PCS, public category of streets.
Disclaimer/Publisher’s Note: The statements, opinions and data contained in all publications are solely those of the individual author(s) and contributor(s) and not of MDPI and/or the editor(s). MDPI and/or the editor(s) disclaim responsibility for any injury to people or property resulting from any ideas, methods, instructions or products referred to in the content.

