Article

Comparison of Flood Resilience Between Low-Carbon and Traditional Communities: A Case Study of Kunming, China

1
Institute of International Rivers and ECO-Security, Yunnan University, Kunming 650500, China
2
Surveying and Mapping Engineering Institute of Yunnan Province, No. 39, Hongshan West Road, Kunming 650033, China
3
School of Earth Sciences, Yunnan University, South Road, East Outer Ring Road, Chenggong District, Kunming 650500, China
4
Kunming Engineering Corporation Limited, Kunming 650051, China
5
Yunnan Institute of Water & Hydropower Engineering Investigation, Design and Research, Kunming 650021, China
6
Kunming Drainage Facility Management Co., Ltd., Kunming 650118, China
*
Authors to whom correspondence should be addressed.
Land 2025, 14(7), 1368; https://doi.org/10.3390/land14071368
Submission received: 12 May 2025 / Revised: 21 June 2025 / Accepted: 25 June 2025 / Published: 28 June 2025

Abstract

Under China’s dual carbon strategy, low-carbon city construction is expected to help reduce urban flood risks. However, the flood resilience of low-carbon communities remains unclear, limiting effective disaster prevention. This study examines traditional and newly built low-carbon communities in Kunming, establishing indices for community flood resilience and low-carbon development according to current national and local standards. Flood resilience (UFR) and low-carbon development level (ULC) were measured using the critic–entropy weight and TOPSIS methods, and a coupling coordination analysis model was used to analyze their correlation and coordination. The results are as follows: (1) The two communities exhibit marked spatial heterogeneity in both UFR and ULC. On average, the UFR in traditional communities is 21.53% higher than in low-carbon communities, while the ULCs are 4.33% higher in low-carbon communities compared to traditional ones. (2) UFR and ULC showed a high coupling level in both communities (over 98%), indicating a strong correlation. (3) The Moran’s I index of 0.664 for coupling coordination indicates notable spatial dependence. These results suggest that, initially, low-carbon communities in Kunming may not exhibit stronger flood resilience, but low-carbon development can significantly improve flood resilience over time. This paper also provides recommendations for enhancing flood resilience in urban low-carbon communities.

1. Introduction

Currently, global climate change is accelerating, and extreme climate disasters are becoming more frequent. Against a backdrop of rising carbon emissions, the climate crisis is worsening. The IPCC’s Fifth Assessment Report (AR5) from 2014 highlighted that climate change-driven disaster risks are concentrated in urban areas [1]. Although climate change is a gradual process, the intensity of extreme weather events has surged in recent years. As the world’s largest emitter of carbon dioxide and its greatest energy consumer, China is among the developing nations most affected by climate change, with various extreme weather events and natural disasters increasingly linked to climate change [2,3]. In July 2021, prolonged heavy rainfall and extreme weather affected much of Henan Province, bringing severe storms to 10 cities, including Zhengzhou, Jiaozuo, and Xinxiang. This event led to 380 deaths and missing persons in Zhengzhou alone [4]. In August 2023, under the combined effects of Typhoon Doksuri and cold and warm air fronts, heavy rains struck most of Hebei Province. This disaster affected 3.89 million people, causing the collapse of 40,900 houses and extensive damage to transportation, power, communication, and water infrastructure, with direct economic losses reaching CNY 95.8 billion in Hebei [5]. In July 2024, severe rainstorms struck the Pingjiang River area in Hunan Province, impacting over 360,000 residents. The storm destroyed 2685 bridges and roads, caused the collapse of 867 houses, damaged 2415 homes, and affected more than 210,000 mu of crops [6]. The rise in flood disasters has led to a greater focus on long-term flood resilience [7]. Strengthening urban resilience to storms and floods is now a key global urbanization objective [8], while creating green, low-carbon, and disaster-resistant communities is an urgent issue for China’s urban planning and renewal process [9].
In the context of urbanization, urban flood risks are increasingly frequent due to factors such as intense rainfall, sea level rise, and extreme events like typhoons and tsunamis [10]. These recurring disasters call for a new risk management paradigm in urban development to strengthen cities’ capacity to adapt to natural disaster risks and climate change pressures. Urban flood resilience refers to the socio-economic system’s ability to resist, absorb, and recover from floods, adapting effectively in both the short and long term [11,12]. The level of urban flood resilience depends not only on the socio-economic system’s structure and function but also on the urban ecosystem. A well-functioning natural ecosystem can regulate urban water systems, support ecological diversity, promote economic and infrastructure development, and reduce vulnerability to climate change and disaster risks [13,14]. Oladokun et al. [15] used fuzzy logic to model flood resilience systems, identifying key parameters and variables to establish a flood resilience index based on internal resilience, supporting facilities, and resident capacity. Karamouz et al. [16] developed a unified resilience framework emphasizing agility, robustness, redundancy, and resource availability, quantifying urban infrastructure resilience to floods to improve targeted flood response. Simonovic et al. [17] created the Flood Resilience Simulation Tool (FRST) to quantify, compare, and visualize dynamic flood resilience, addressing the limitations in existing resilience assessments. Miguez et al. [18] introduced a comprehensive flood resilience index (FResI) based on a flood risk index (FRI), comparing urban flood prevention strategies. Bertilsson et al. [19] proposed a spatial urban flood resilience index (S-FRESI) to assess how various flood control measures impact urban flood resistance. Singh et al. [20] developed a framework for assessing the vulnerability of urban road networks to flooding, identifying network vulnerabilities, simulating rainfall events, mapping flood impacts, and evaluating spatial vulnerability. Moghadas et al. [21] constructed a comprehensive community resilience index based on factors like community capital and environmental elasticity, using a mixed multi-criteria decision-making approach. Currently, flood resilience assessment frameworks are typically developed to evaluate the flood resilience index of study areas [22,23]. This study follows a similar approach, selecting indices based on national resilient city construction standards and adapting them to the small-scale community research scope to enable a more scientific and reasonable comparison of flood resilience across different communities.
In the context of rapid global climate change, the Fourth Assessment Report of the Intergovernmental Panel on Climate Change (IPCC, 2007) highlights the importance of addressing climate change through two primary strategies: mitigation and adaptation [24]. Mitigation measures include not only the direct reduction of greenhouse gas emissions but also the enhancement of greenhouse gas carbon sinks [25,26]. This dual approach suggests that urban flood risk adaptation should integrate greenhouse gas reduction and carbon sink expansion to promote both climate adaptation and mitigation, ultimately supporting cities in achieving resilience and low-carbon objectives. Li et al. [27] used GIS spatial analysis and the analytic hierarchy process to examine the flood risk in the Haihe River Basin under various land-use patterns, finding that a low-carbon land-use model effectively enhances flood control in the basin. K. Nakamichi et al. [28] developed a comprehensive model to assess carbon dioxide (CO2) emissions, evaluating the impact of various urban land use and energy scenarios on CO2 reduction. The results indicated that climate change mitigation and adaptation can produce synergistic effects. Yang et al. [29] combined hydrological modeling with future climate and urbanization scenarios from representative centralized pathways and shared socioeconomic pathways (SSP) to evaluate flood risk and mitigation strategies at the city scale, finding that the effectiveness of green infrastructure in reducing flood risk declines as carbon emissions increase. Guo et al. [30] introduced a low-carbon development indicator system to assess urban resilience, showing that the coupling coordination between urban resilience and low-carbon development follows a fluctuating upward trend. Numerous studies have demonstrated a potential synergistic relationship between urban flood resilience and the level of low-carbon development [31,32,33,34,35,36]. This synergy offers dual benefits for addressing climate change. It not only helps reduce carbon emissions but also enhances the capacity of cities to adapt to extreme weather events. Such a dual role is of practical significance for achieving the “dual carbon” strategic goals and provides critical pathway support for sustainable urban development [37,38]. In the construction of low-carbon communities, design strategies such as green infrastructure, permeable pavement, sustainable transportation, and decentralized rainwater management are commonly emphasized. These measures not only contribute to emission reductions but also improve a city’s ability to manage meteorological hazards, such as heavy rainfall and flooding. However, despite the theoretical synergy between low-carbon development and urban flood control, empirical research on the actual effects of low-carbon community construction or development levels on urban flood resilience remains limited. There is a lack of systematic analysis and direct evidence. Therefore, it is essential to investigate the coupling mechanisms between the two in greater depth and to provide quantitative validation through real-world case studies.
In summary, urban low-carbon development and flood resilience are essential strategies to mitigate and adapt to climate change. Exploring their synergistic impact and correlation is, therefore, of high research value. However, these areas have yet to be effectively studied in combination. Questions such as the degree of impact and underlying mechanisms remain underexplored. This study selects the traditional old city (TC) and the low-carbon demonstration zone (LC) in Kunming, China, as research sites. Using national and local Chinese standards for resilient cities and low-carbon communities, we developed evaluation frameworks for urban flood resilience and low-carbon development levels. Flood resilience (UFR) and low-carbon development (ULC) were calculated through the critic–entropy weight and TOPSIS methods, while the coupling coordination analysis model assessed their correlation and coordination. This paper measures and compares the flood resilience and low-carbon development levels of Kunming’s traditional and low-carbon communities, analyzing reasons for disparities and evaluating the influence of low-carbon development on flood resilience. The findings provide a scientific basis for building low-carbon resilient communities, managing urban flood risks, and developing disaster prevention and control strategies [39,40].

2. Study Area and Data Sources
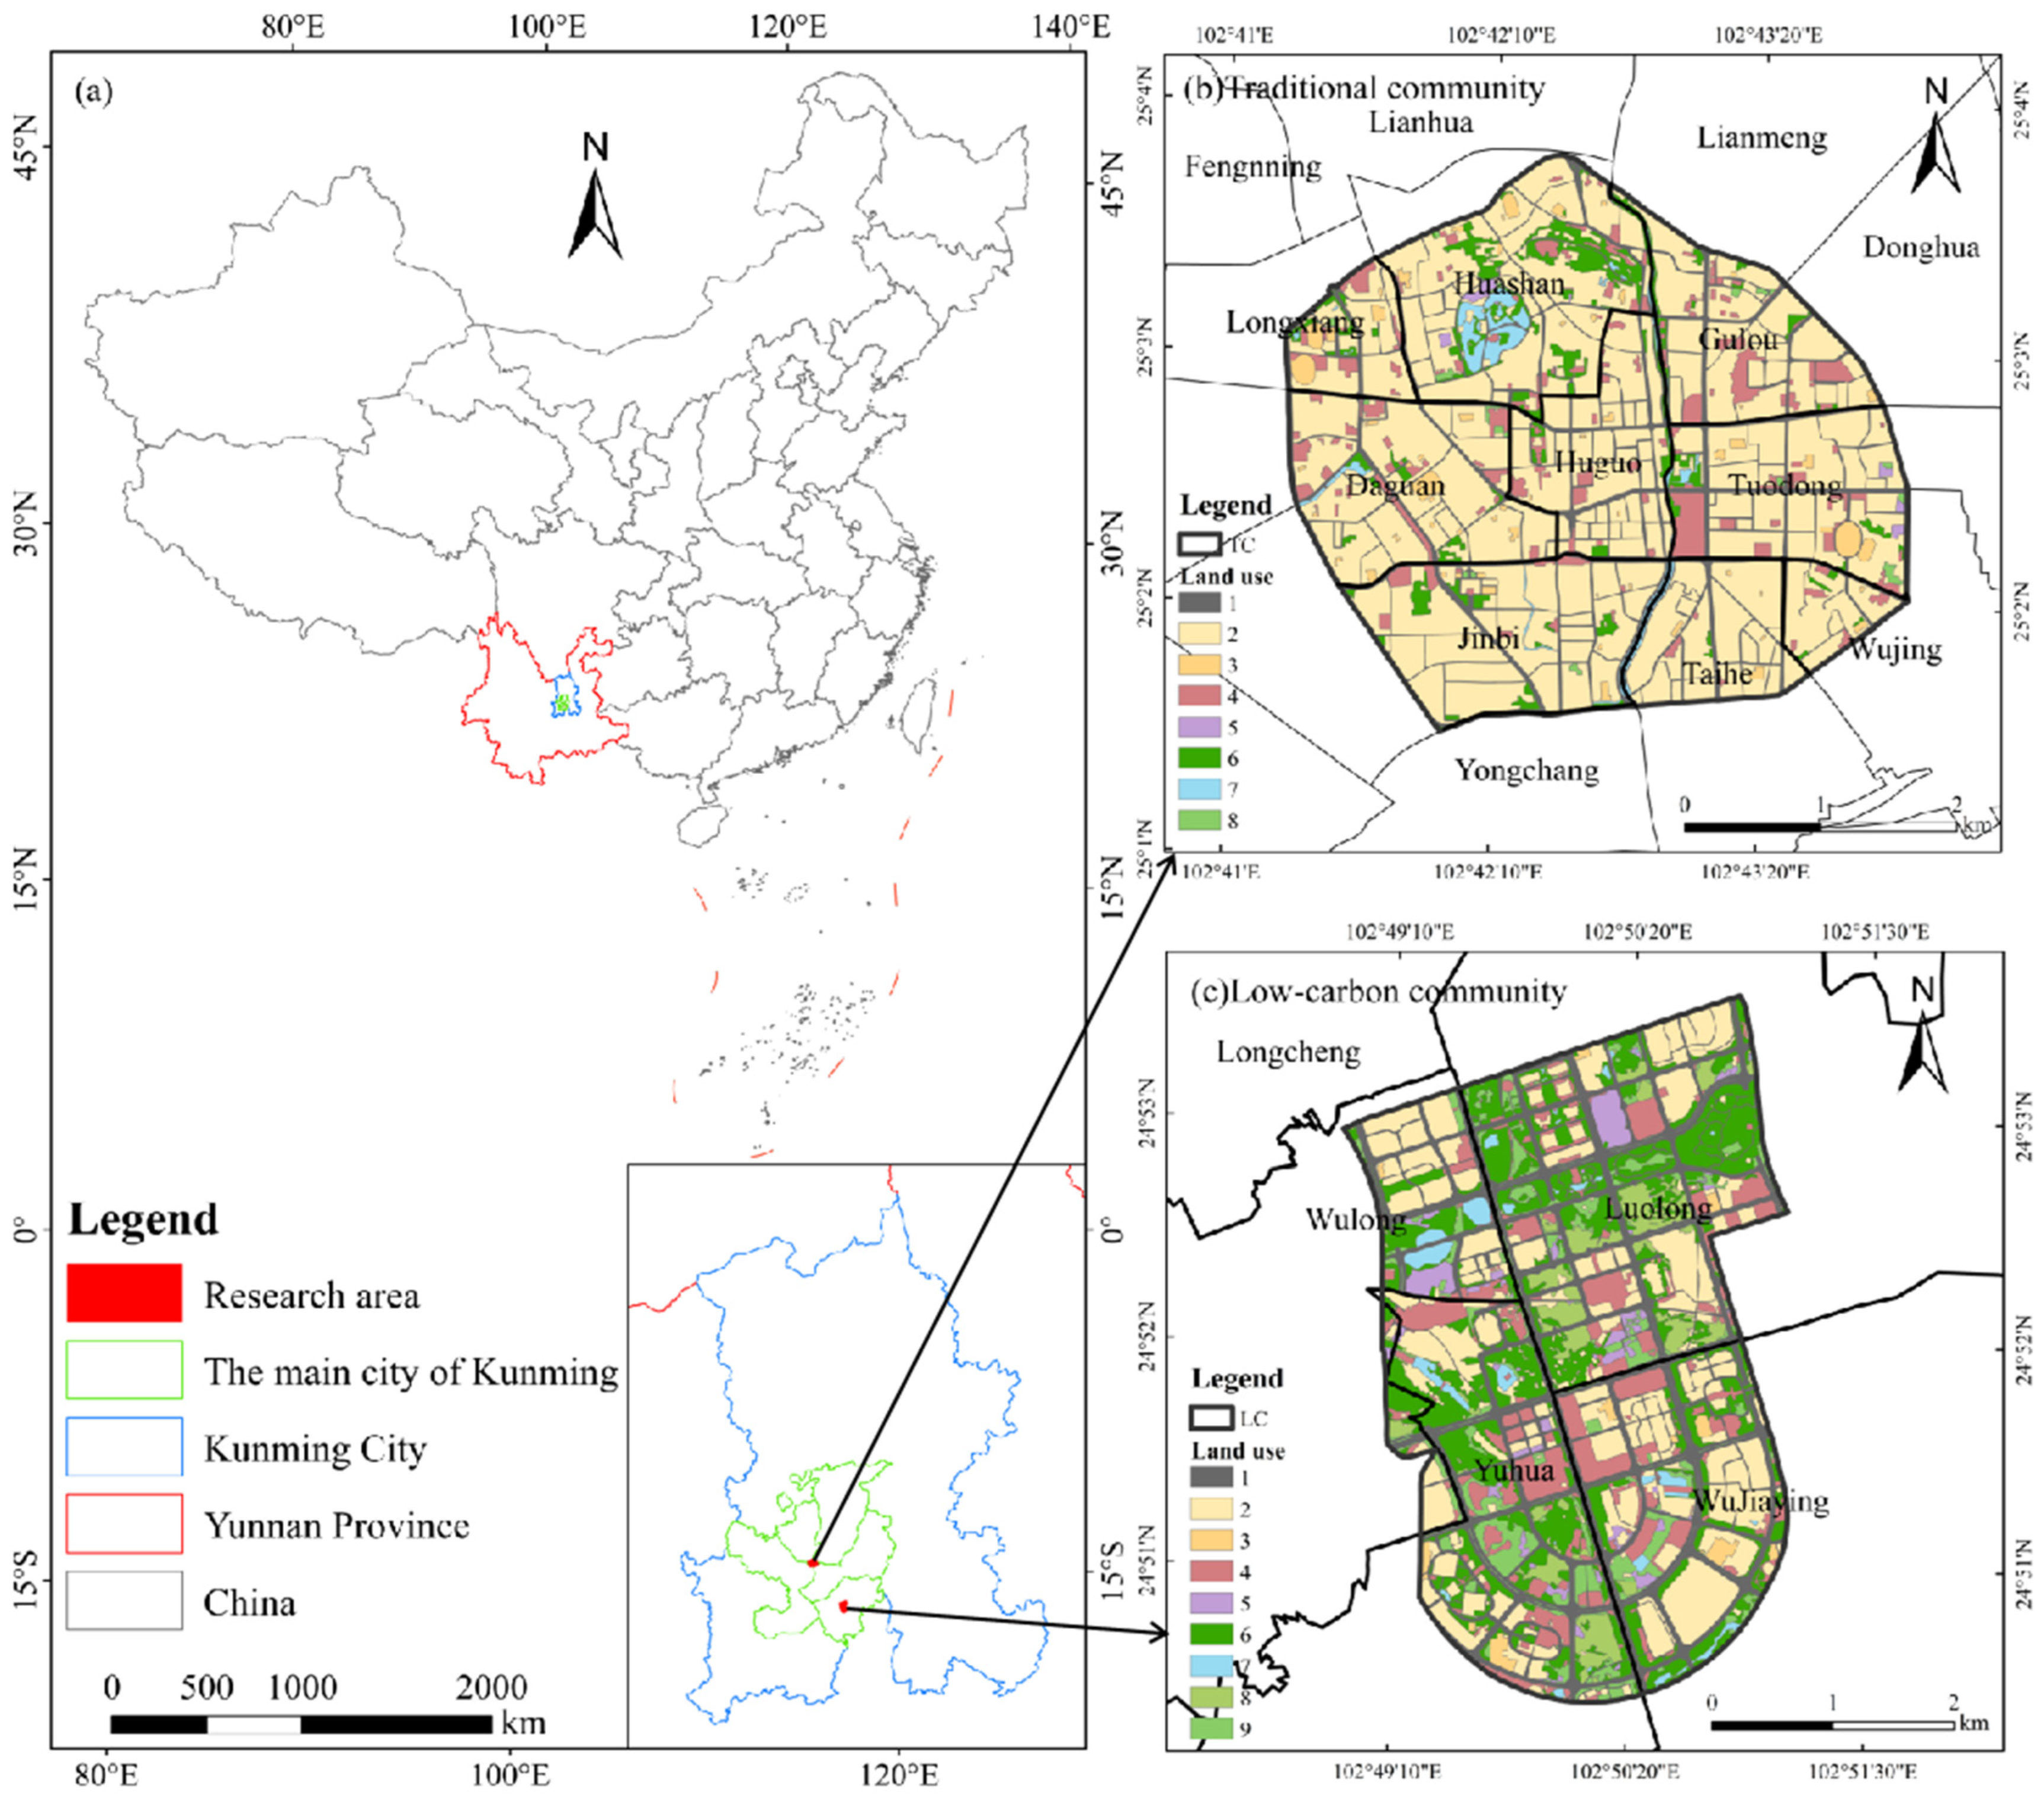
2.1. Study Area

Kunming City is the capital of Yunnan Province and the central city of the Central Yunnan urban agglomeration. It is one of the important central cities in Western China approved by the State Council. It is the political, economic, and cultural center of the province and plays an important role as a transportation and communication hub. Kunming City is located in the southwest of China, in the middle of the Yunnan–Guizhou Plateau, 102°10′ E~103°40′ E, 24°23′ N~26°22′ N, and belongs to the mountain terrain. The annual average temperature of 15 °C, under normal conditions, and the average annual rainfall typically amounts to approximately 1000 mm, with more than 85% of the precipitation concentrated in the wet season, which spans from May to October. The climate type is the north subtropical low latitude plateau monsoonal climate. The overall terrain is high in the north and low in the south, and gradually decreases in a ladder shape from north to south [41,42,43]. In this paper, the traditional old city within the first ring road of the main city of Kunming is taken as the traditional community, and part of the Chenggong low-carbon demonstration zone, one of the first low-carbon demonstration zones in China, is taken as the low-carbon community. The traditional community covers an area of about 14.02 square kilometers, and the low-carbon community covers an area of about 15.48 square kilometers. The schematic diagram of the research area is shown in Figure 1.
Kunming’s primary urban area, a rapidly developing region in China, has faced recurrent heavy rains and floods in recent years, exacerbated by climate change and rapid urbanization. While excessive rainfall surpassing drainage capacity often appears to be the direct cause of urban waterlogging, the underlying factors include local climate variability, outdated flood risk management practices, aging drainage infrastructure, population growth, and increased impermeable surfaces—all of which collectively limit flood prevention capabilities [44]. Newly built low-carbon communities are predominantly situated in the Chenggong Low-Carbon Demonstration Zone, where development planning emphasizes streets, public facilities, non-motorized lanes, and pedestrian infrastructure. Designed to align with the sponge city standards, this zone integrates flood control and low-carbon development considerations from inception. Consequently, municipal authorities generally attribute a higher flood resilience to communities within this zone.

2.2. Data Sources

Data on administrative divisions, population density, and GDP were sourced from the Data Center for Resources Science and Environment, Chinese Academy of Sciences (https://www.resdc.cn/). Elevation data were obtained from the Geospatial Data Cloud (https://www.gscloud.cn/), while land-use information was derived from Kunming’s Third National Land Survey. Using Amap Web Service API (V4.2.0) data acquisition technology, points of interest (POI) data on Kunming’s infrastructure, including sports, healthcare, charging stations, financial services, and public transport facilities, were extracted and preliminarily cleaned. Additionally, road network, drainage pipeline, building contour, and regulating reservoir data were provided by the Kunming Municipal Survey and Mapping Research Institute. Rail transit data were derived from open-source maps. For detailed data specifications, please refer to Table 1.

3. Methods and Models

This study is structured into three primary components: assessing community low-carbon development levels, measuring community flood impact and resilience, and analyzing the coupling and coordination characteristics between low-carbon development and flood resilience. The overview of the research frame is presented in Figure 2.

3.1. Evaluation System Construction

Low-carbon development encompasses the integration of low-carbon economic practices and industries within urban spaces, promoting the use of zero- and low-carbon technologies, enhancing energy efficiency, implementing green buildings and transportation, and shifting consumer behaviors to reduce carbon emissions effectively. Urban flood resilience, on the other hand, is the capacity of urban “blue, green, and gray” infrastructure to resist, absorb, and adapt to extreme rainfall events that exceed standard flood prevention thresholds. This resilience ensures that critical municipal systems, such as urban lifelines, remain operational and enables rapid recovery to normal functions. This study utilizes China’s national standards for low-carbon communities, including the Safe and Resilient City Evaluation Guide (GB/T 40947-2021 [45]) and Low-carbon Community Evaluation Guide (SZDB/Z 310-2018 [46]), and incorporates insights from both domestic and international frameworks on flood resilience and low-carbon development [47,48]. By analyzing highly cited papers from the Web of Science and CSCD over the past decade, we employed frequency statistics to determine the occurrence rate of each fundamental evaluation indicator. Subsequently, adhering to principles of representativeness, scientific rigor, rationality, and data availability, we constructed a flood disaster resilience evaluation index system encompassing three dimensions: natural environment, community vulnerability and services, and infrastructure (Table 2). Similarly, an evaluation index system for low-carbon development was established, based on the dimensions of carbon emissions and absorption, sustainable transportation, and socio-economic factors (Table 3).

3.2. Determine the Indicator Weights Based on the Critic–Entropy Weight Combination Weighting Method

To minimize the impact of subjective factors, this study employs an objective weighting approach. The entropy weighting method assesses indicator dispersion using information entropy, though it overlooks indicator correlation. By contrast, the CRITIC method introduces two measures: comparison intensity and conflict level. Here, the standard deviation reflects contrast strength, where greater data deviation yields a higher weight. The correlation coefficient represents conflict, assigning a smaller weight as the correlation increases. This approach compensates effectively for the limitations of the entropy weighting method [49,58]. Accordingly, this study combines the two weighting methods to determine the weights of the factors affecting urban flood resilience and low-carbon development levels; the obtained weighting results are shown in Table 4 and Table 5. The specific steps are as follows:
Step 1: First of all, the original data of the selected indicators and the calculated indicator data are standardized.
Positive indicators:   X i j = X i j m i n X i j m a x X i j m i n X i j
Negative indicator:   X i j = m a x X i j X i j m a x X i j m i n X i j
Step 2: Based on the CRITIC method, construct the weight calculation formula, as shown in (3). In this formula, W j ( 1 ) represents the weight of indicators j by the critic method, r i j represents the correlation coefficient between indicators i and j , and σ j represents the standard deviation of indicator j .
W j ( 1 ) = σ j i = 1 n 1 r i j j = 1 n σ j i = 1 n 1 r i j     ( j = 1 , 2 , 3 , , n )
Step 3: Based on the calculation principle of the entropy weight method, W j ( 2 ) represents the weight of the j index obtained by the entropy weight method.
P i j = 1 + X i j j = 1 n 1 + X i j
e j = 1 l n n i m P i j l n   P i j
W j ( 2 ) = 1 e j j = 1 n 1 e j
Step 4: Assuming the equal importance of the two weighting methods, we combined the CRITIC and entropy weight methods to leverage their complementary strengths in objective weighting. Based on this approach, the following formula is established:
W j = W j ( 1 ) + W j ( 2 ) 2
Table 4. Weight distribution table of factors of flood resilience.
NumberCritic Method WeightEntropy Method WeightCritic–Entropy Weight
C10.0928 0.0704 0.0816
C20.0383 0.0009 0.0196
C30.0319 0.1204 0.0762
C40.1007 0.0599 0.0803
C50.0375 0.0692 0.0534
C60.0516 0.0017 0.0267
C70.1471 0.0689 0.1080
C80.1436 0.0689 0.1063
C90.0202 0.0822 0.0512
C100.0484 0.0477 0.0481
C110.0458 0.0773 0.0616
C120.1479 0.0758 0.1119
C130.0714 0.1622 0.1168
C140.0229 0.0944 0.0587
Table 5. Weight distribution table of factors of low-carbon development level.
NumberCritic Method WeightEntropy Method WeightCritic–Entropy Weight
C150.0661 0.0062 0.0362
C160.0971 0.0209 0.0590
C170.1296 0.1301 0.1299
C180.0665 0.0883 0.0774
C190.0861 0.2811 0.1836
C200.1823 0.1693 0.1758
C210.0768 0.1269 0.1019
C220.2004 0.0486 0.1245
C230.0590 0.1279 0.0935
C240.0361 0.0007 0.0184

3.3. Calculation of Evaluation Results Based on TOPSIS Method

The TOPSIS method effectively leverages original data, allowing the results to accurately reflect differences across evaluation schemes [51,59,60]. In this study, the TOPSIS method is employed to calculate both the Urban Flood Resilience Index (UFR) and the Urban Low-Carbon Development Level Index (ULC). The detailed steps are as follows:
Step 1: Construct a standardized decision matrix. The normalization formula is used to standardize the original sample data matrix.
X i j = a i j / i = 1 m   a i j 2     i = 1 , 2 , , m ; j = 1 , 2 , , n
Step 2: Determine the index ranking weight ω;
Step 3: Construct the weighted standardized decision matrix Y i j = ω X i j . Integrate the weights into the normalized matrix;
Step 4: Determine the positive ideal solution Y+ and the negative ideal solution Y. The positive and negative ideal solutions are:
Y + = { ( m a x i X i j   | j Q 1 ) ,   ( m i n i X i j   | j Q 2 ) }
Y = { ( m i n i X i j   | j Q 1 ) ,   ( m a x i X i j   | j Q 2 ) }
Here, m a x i X i j and m i n i X i j denote the maximum and minimum values of the j index across the i ideal solutions, respectively;
Step 5: The geometric distances d j + and d j from the positive and negative ideal solutions were calculated, typically employing Euclidean distance, i.e.,
d j + = i = 1 n ( X i j y j + ) 2
d j = i = 1 n ( X i j y j ) 2
Here, y j + and y j denote the ideal positive and negative solutions for the j index, respectively;
Step 6: Compute the fit degree c j + between the evaluation object and the positive ideal solution.
c j + = d j d j + + d j
A higher fit degree c j + indicates a greater proximity to the positive ideal solution, whereas a lower fit degree suggests closer alignment with the negative ideal solution.
The assessment of urban flood resilience and low-carbon development is represented by a fit degree ranging from 0 to 1. Values approaching 1 indicate proximity to an ideal positive solution, reflecting higher levels of both urban flood resilience and low-carbon development. Conversely, values closer to 0 approach the negative ideal solution, signifying lower levels of flood resilience and low-carbon development.

3.4. Geographic Detector

The geographic detector is a statistical tool composed of four modules: factor detection, interaction detection, risk detection, and ecological detection, which is used to detect the spatial heterogeneity of a certain geographical phenomenon and reveal the driving factors behind it [61]. This article mainly uses the factor detection module of the geographic detector. The 14 factors in the flood resilience evaluation index system and the 10 factors in the low-carbon development evaluation index system are, respectively, taken as independent variables, and the flood resilience index and the low-carbon development index are taken as dependent variables. Explore the dominant influencing factors behind spatial differentiation and the relationship between mutual enhancement or weakening among different indicators. Before use, numerical variables need to be converted into type variables first. In this paper, the natural break point classification method (Jenks) is adopted to stratify each factor, and they are successively imported into the geographic detector for analysis [62]. The influence of each factor on the flood resilience index and the low-carbon development index is obtained, respectively. The calculation formula is as follows:
q = 1 h = 1 H N h σ h 2 N σ 2
In the formula, q is the influence of a certain index factor on the dependent variable; h = 1, 2, … n, where h is the stratification number of the index factor; N σ 2 is equal to the total number of sample grids; N h is equal to the number of grids that a certain index factor has at layer h; σ 2 represents the variance of the dependent variable in the study area; and σ h 2 represents the variance of the dependent variable in layer h. The value range of q is between [0, 1]. The larger the value of q, the stronger the influence of this factor on the dependent variable.

3.5. Coupling Coordination Analysis Model

The coupling coordination analysis model is extensively applied to quantify the interaction intensity between multiple systems. While the coupling degree indicates the level of interaction between systems, it does not capture the synergy present. In contrast, the coupling coordination degree effectively describes the coordination and alignment between distinct systems. Accordingly, this study employs a coupling coordination degree model to assess the synergy between urban flood resilience and low-carbon development levels [63,64]. The model equation is presented as follows:
C = 2 × U L C × U F R ( U L C + U F R ) 2
T = α × U L C + β × U F R
D = C × T
In the formula, UFR denotes the assessment value of urban flood resilience, while ULC signifies the assessment value of urban low-carbon development. The coupling degree between urban flood resilience and low-carbon development is represented by C. T denotes the comprehensive evaluation index for both urban flood resilience and low-carbon development, with equal importance attributed to each. Thus, the weights α and β of both are 0.5. D indicates the degree of coupling coordination between urban flood resilience and low-carbon development. Based on prior studies, the coupling degree and the coupling coordination degree are classified into defined grades, as outlined in Table 6 and Table 7.

3.6. Spatial Autocorrelation Model

To assess the global and local clustering characteristics of the coupling coordination between urban flood resilience and low-carbon development, both Global Moran’s I and Local Moran’s I indices were applied [65,66]. The Global Moran’s I index is calculated using the following formula:
I = n i = 1 n j = 1 n W i j ( x i x ¯ ) ( x j x ¯ ) i = 1 n ( x i x ¯ ) 2 i = 1 n j = 1 n W y ¯
where x i and x j are the coupling coordination degree of cells i and j, respectively, n is equal to the total number of sample cells, W i j is the spatial weight between cells i and j, and x ¯ is the average value of x.
The local Moran’s I index is calculated as follows:
I i = ( x i x ¯ ) j = 1 n W i j ( x j x ¯ ) i = 1 n ( x i x ¯ ) 2
The symbols in this formula retain the same definitions as provided in Formula (18). For research indices aggregated at unit i, there may exist four aggregation types: high–high (HH), low–low (LL), high–low (HL), and low–high (LH). HH and LL represent highly concentrated areas, while HL and LH represent discrete areas.
The standardized Z-value, within the range of I [−1, 1], enables the testing of significant spatial autocorrelation. The calculation formula is as follows:
Z ( I ) = I E ( I ) V A R ( I )
The standard normal distribution provides critical thresholds for interpreting spatial autocorrelation through Z-scores, with values of ±1.96 and ±2.54 corresponding to significance levels of 0.05 and 0.01, respectively. A Z-score greater than 1.96 indicates statistically significant positive spatial autocorrelation at the 95% confidence level, while a Z-score exceeding 2.54 denotes a highly significant result at the 99% confidence level. Conversely, Z-scores less than −1.96 or −2.54 indicate significant or highly significant negative spatial autocorrelation, reflecting spatial dispersion. Z-scores falling within the range of −1.96 to 1.96 suggest that the spatial distribution of the variable is random and lacks statistically significant autocorrelation.

4. Results and Discussion

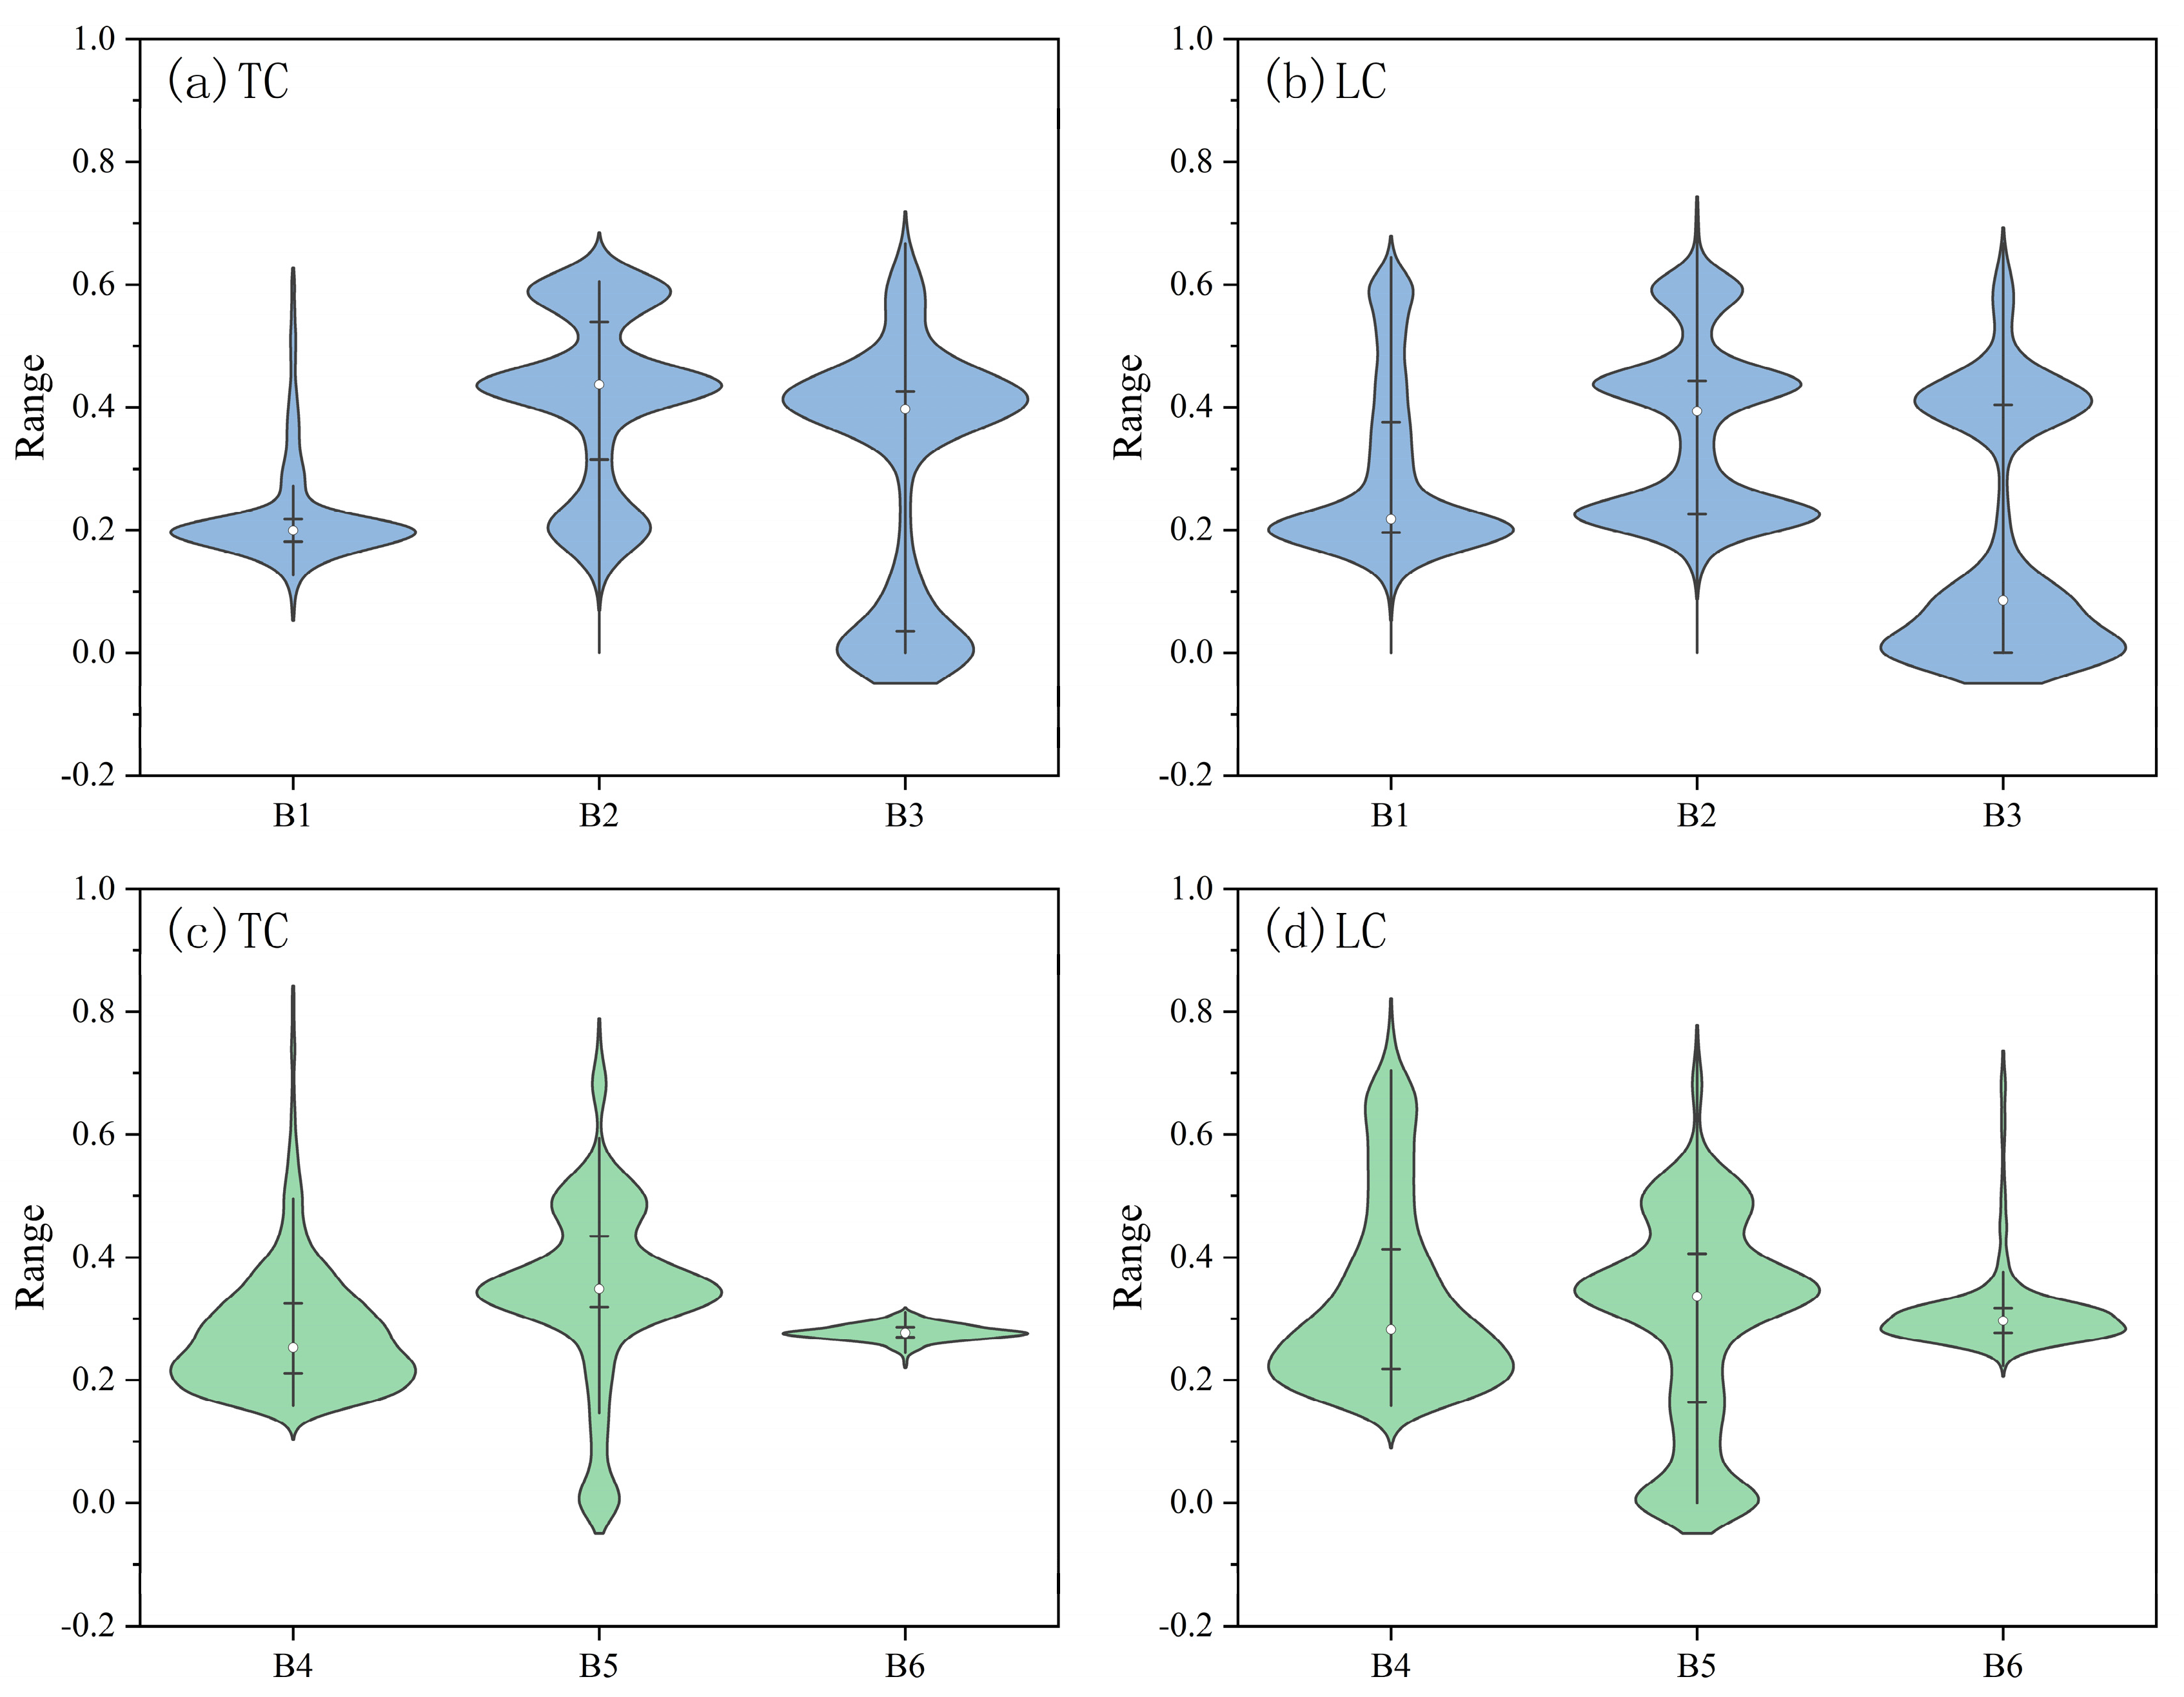
4.1. Evaluating Flood Resilience in Traditional and Low-Carbon Communities

Using the calculated evaluation index weights, the TOPSIS model was applied to derive the final urban flood resilience index, yielding resilience values for each grid within the study area and allowing for the spatial distribution mapping of flood resilience in traditional communities (TC) and low-carbon communities (LC) (Figure 3a,b). The spatial heterogeneity of flood resilience between the two community types is evident in the distribution maps. The overall flood resilience of traditional communities is notably higher than that of low-carbon communities, with an average resilience index 21.53% greater. High-resilience areas in traditional communities are primarily concentrated in the northeastern part of the Jinbi sub-district and the southern part of the Taihe sub-district, whereas low-resilience areas are mainly located in the Central Huashan sub-district, the Southeastern Tuodong sub-district, and the Central-to-Southern Gulou Sub-district. In low-carbon communities, high-resilience areas are mainly found in the Central Yuhua Sub-district and the northern and southwestern parts of the Luolong sub-district. Conversely, low-resilience areas are predominantly distributed in the central, southern, and southeastern parts of the Luolong sub-district, as well as the northern and southeastern parts of the Wujiaying sub-district. A comparative violin plot of flood resilience indices for traditional and low-carbon communities (Figure 4) further illustrates these trends. Traditional community resilience indices are concentrated within the 0.35–0.4 range, with significantly more data points exceeding 0.4 than in low-carbon communities, whose resilience indices primarily range from 0.15 to 0.2 and 0.3 to 0.35, indicating a generally lower overall resilience.
An analysis of resilience based on the dimensions for each community (Figure 5a,b) indicates that the natural environment of the low-carbon community surpasses that of the traditional community, largely due to reduced impervious surfaces and higher green coverage rates. Enhanced water permeability and green cover enable the low-carbon community to absorb and permeate rainwater more effectively, bolstering its overall flood resilience. Conversely, high-resilience zones within traditional communities are primarily water-covered areas, which provide natural water storage and contribute to carbon reduction, thus enhancing resilience in these areas. This suggests that natural environmental criteria are critical for flood resilience in low-carbon communities. While social and economic resilience in the low-carbon community (LC) is moderate, the resilience levels are relatively balanced. Given that the low-carbon community is a recently developed area (within the last decade), regional planning and infrastructure are well-integrated, with evenly distributed populations and ample access to cultural, financial, and healthcare facilities. However, these services remain less established compared to traditional communities, resulting in a slightly lower overall resilience level in the low-carbon community. The traditional community (TC) is centrally located within the city and benefits from a developed economy, high urbanization, and comprehensive infrastructure, contributing to a higher overall resilience in the region. However, population density, building layout, and economic activities are heavily concentrated, leading to significant variations in the resilience levels within the community. In contrast, low-carbon communities exhibit substantially lower resilience in infrastructure-related criteria. This discrepancy arises primarily for two reasons. First, the critical flood control infrastructure, such as storage ponds, is concentrated near traditional communities, whereas low-carbon communities lack such facilities. Storage ponds are essential during extreme rainfall events, as they redistribute rainwater spatially, preserve road conditions, stabilize traffic operations, and enhance traditional communities’ absorption capacity under storm conditions. Second, key resilience measures, including rainwater pipes and rainwater–pollution diversion systems, account for substantial weight in resilience assessments. The substantial gap between traditional and low-carbon communities in these areas underscores a marked disparity in resilience capacity.
From the results of factor detection by the geographic detector, the explanatory power of each factor for flood resilience is shown in Table 8. The rain and sewage diversion ratio (C12) showed the strongest explanatory power (q = 0.415) in both communities, which is closely related to the characteristics of concentrated precipitation during the rainy season and high urban drainage pressure in Kunming. The aging of traditional community pipe networks and the mixed flow of rain and sewage are rather serious problems. However, low-carbon communities have significantly improved their drainage efficiency by combining green infrastructure with grey infrastructure. The explanatory power of medical service capacity (C7, q = 0.360) and rainwater pipe density (C11, q = 0.358) is also strong, indicating that medical emergency response and pipe network coverage are the core supports for flood resilience. Low-carbon communities have rationally laid out medical facilities and rain gardens, while traditional communities rely on government-led pipe network renovations. The two paths are different, but both have remarkable effects. Financial service capacity (C8, q = 0.253) has a more prominent impact in traditional communities, as post-disaster reconstruction relies on government subsidies and commercial insurance, while low-carbon communities may enhance resilience through community funds. The per capita road area (C10, q = 0.213) has a limited effect in traditional communities (where some roads are narrow and have a high hardening rate), but low-carbon communities can not only alleviate waterlogging but also enhance connectivity through the design of permeable pavement and slow traffic systems. Emergency shelter service capacity (C14, q = 0.171) varies significantly between the two types of communities. Traditional communities rely on public spaces, such as schools and squares, while low-carbon communities combine green space systems (such as community parks) to achieve multi-functional refuge. Population density (C6, q = 0.130) may have dual effects. While high-density areas tend to face greater evacuation pressure, communities with a strong social organization can demonstrate more effective emergency mobilization through grid-based management, thereby reducing disaster-related losses. The explanatory power of GDP per capita (C5, q = 0.050) and service ability of large sports venues (C9, q = 0.120) is limited, reflecting that the economic level is not the determining factor of resilience, and the emergency function of cultural and sports venues has not been fully activated. The regulating reservoir service capacity (C13, q = 0.099) has a relatively low impact on the resilience of the study area due to reasons such as uneven spatial distribution, insufficient operation and maintenance, and single function. Natural factors such as green coverage rate (C1, q = 0.026), slope (C2, q = 0.027), and water area (C3, q = 0.027) exert relatively weak influence, indicating that, in rapidly urbanizing regions, human interventions have overtaken natural conditions as the dominant drivers of flood resilience. Nevertheless, it is important to note that the significance of these factors may increase considerably under extreme rainfall conditions. The negative impact of the impervious ground area ratio (C4, q = 0.024) is more significant in traditional communities, while low-carbon communities can alleviate runoff through permeable materials and sunken green spaces.

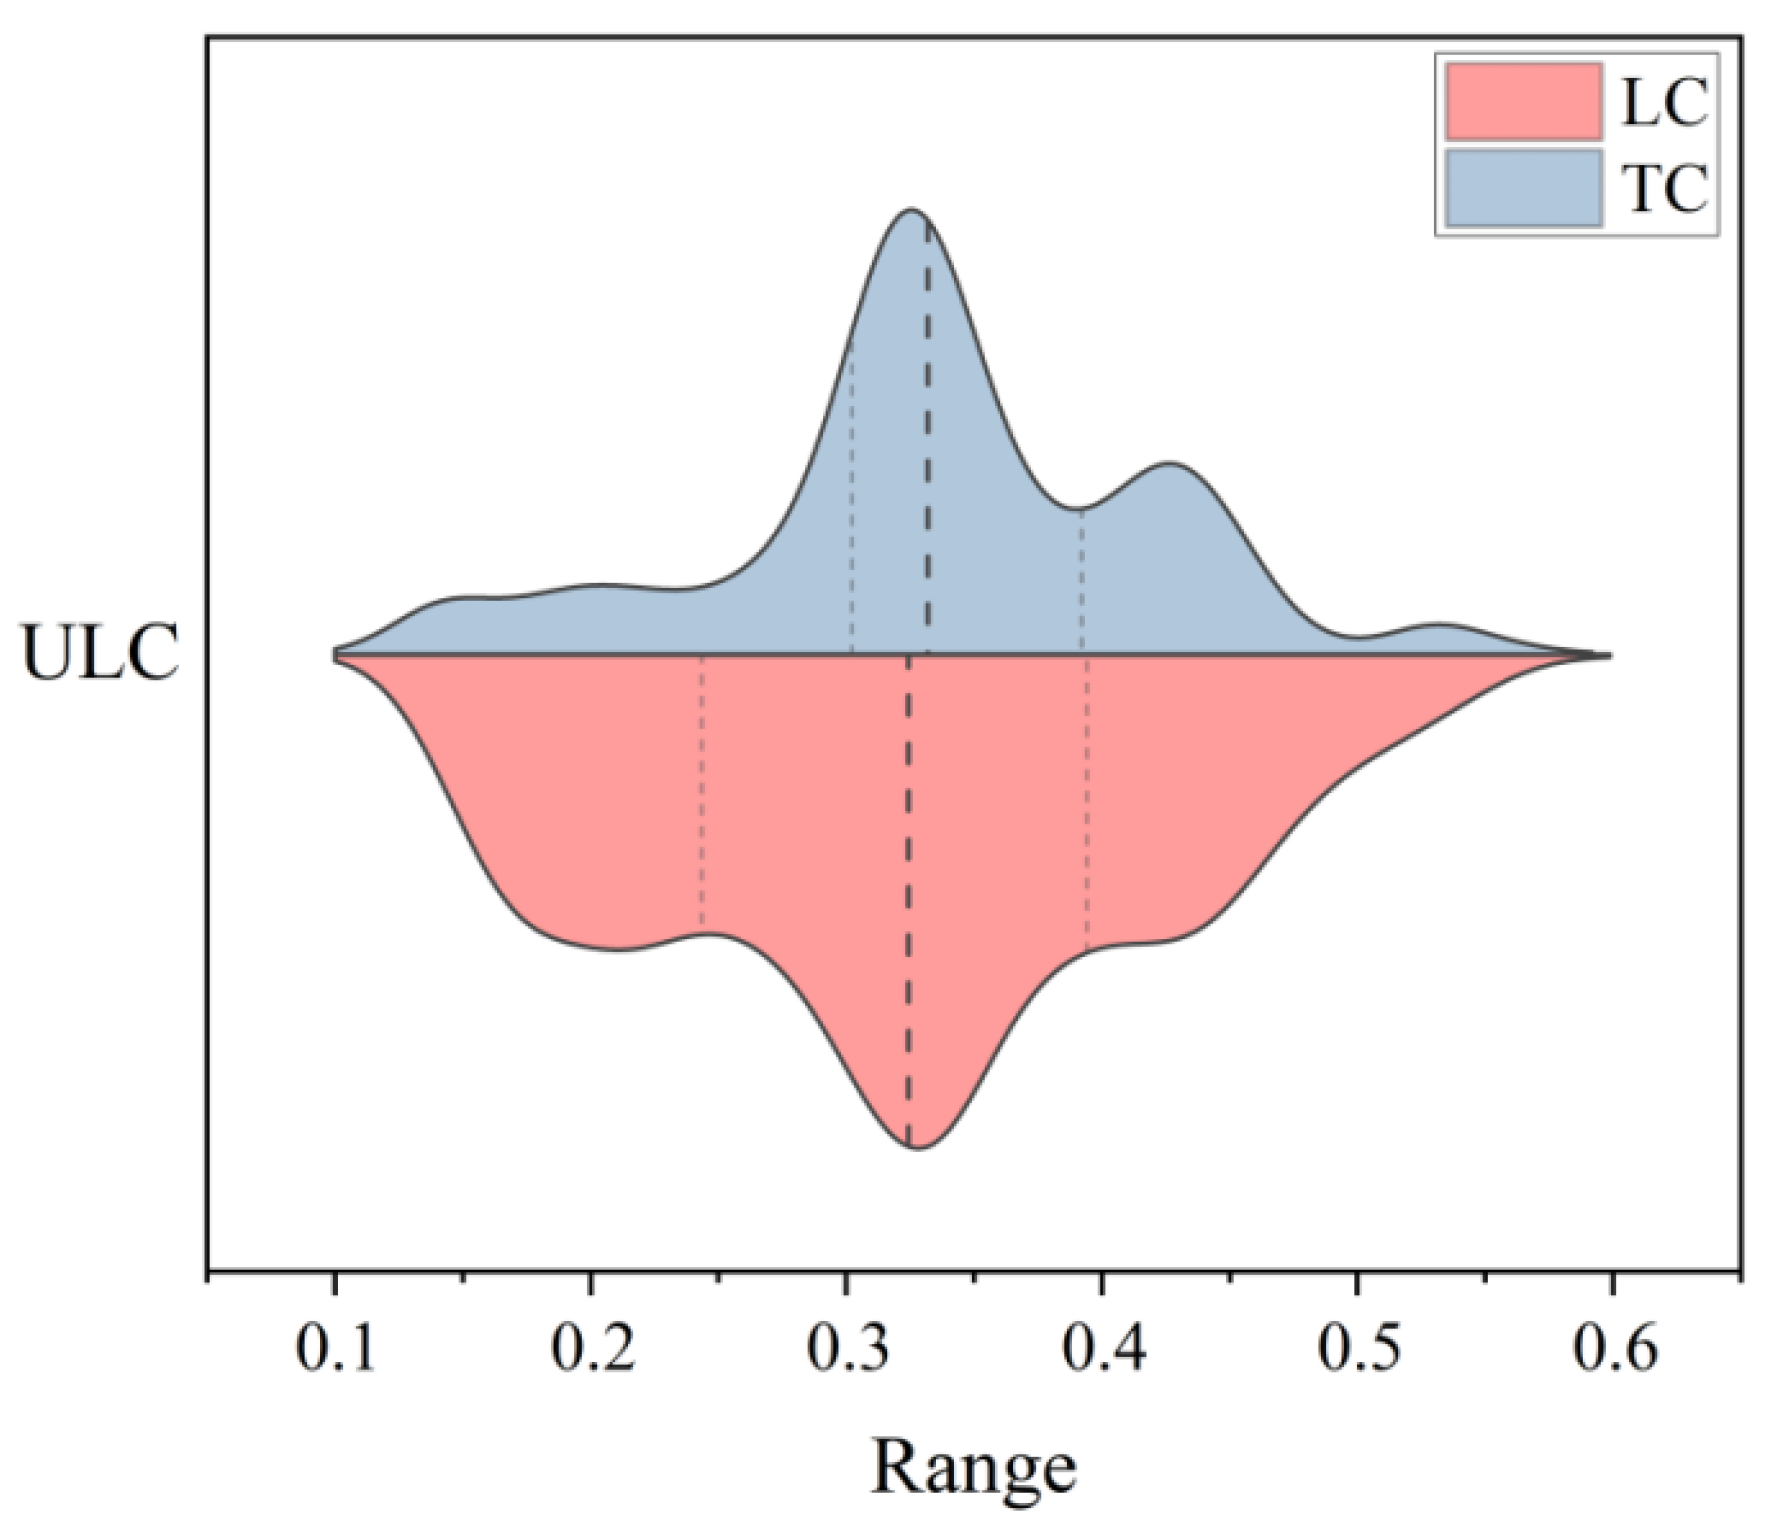
4.2. Evaluating Low-Carbon Development Level in Traditional and Low-Carbon Communities

Based on calculated indicator weights, the TOPSIS model was applied to generate the urban low-carbon development index, producing a low-carbon development index for each grid in the study area and enabling a spatial analysis of traditional and low-carbon communities (Figure 6a,b). Figure 6 illustrates a clear spatial heterogeneity in low-carbon development levels between the two communities. Traditional communities exhibit generally higher average low-carbon development levels, outperforming low-carbon communities by 4.33%. However, they have fewer cells with very high levels of low-carbon development compared to low-carbon communities. High-index areas of low-carbon development in traditional communities are primarily concentrated in the northeastern and southwestern parts of the Tuodong sub-district, the northwestern part of the Gulou sub-district, and the central and southeastern parts of the Taihe sub-district. Low-value areas are mainly distributed across most of the Wujing sub-district, the southeastern part of the Tuodong sub-district, and the central part of the Gulou sub-district. Notable disparities in low-carbon development levels are observed in areas surrounding the Tuodong sub-district. In low-carbon communities, relatively high levels of low-carbon development are mainly concentrated in the eastern part of the Wulong sub-district and the western part of the Luolong sub-district. Areas with lower levels of low-carbon development are relatively evenly distributed across the four sub-districts, and each occupies a relatively small area. Figure 7 provides a violin plot comparison of the low-carbon development indices across community types, showing a concentration of traditional community indices between 0.3 and 0.4, while the low-carbon community indices range from 0.25 to 0.4, with a significant amount of data between 0.1 and 0.25. This distribution lowers the overall low-carbon development level in low-carbon communities.
An analysis of each dimension development level in the two communities (Figure 5c,d) indicates that low-carbon communities outperform traditional ones in carbon emissions and absorption. This reflects a distinct advantage, as increased green coverage enhances the regional capacity for carbon reduction and absorption, effectively lowering the net emissions. However, regarding sustainable transport, low-carbon communities exhibit only a slight disadvantage relative to traditional ones. Located in Chenggong’s low-carbon demonstration zone, the low-carbon community’s road network design aligns with low-carbon planning and construction standards, incorporating non-motorized lanes and pedestrian greenways to promote sustainable mobility. Nonetheless, traditional communities have undergone extensive traffic network evolution over the decades, gradually addressing road network limitations. Early inconsistent planning in traditional communities also led to dense, smaller road networks that now provide increased accessibility for sustainable transport initiatives. Additionally, traditional communities benefit from a more established and centralized public transport infrastructure, including robust bus and rail systems, compared to low-carbon communities. As a result, low-carbon communities do not display distinct advantages in sustainable transport. Socioeconomic conditions across both community types reveal no significant differences overall.
From the results of factor detection by the geographic detector, the explanatory power of each factor for low-carbon development is shown in Table 9. The charging station service capability (C20, q = 0.444) has the strongest explanatory power among all factors and significantly affects the level of low-carbon development. This indicates that the completeness of the electric vehicle infrastructure is directly related to the effectiveness of the community’s low-carbon transformation. The public transport station service capacity (C22, q = 0.433) also shows strong explanatory power, reflecting the key role of convenient public transportation in reducing the use of private cars. Low-carbon communities usually adopt a connection system design of “public transportation and slow traffic”, while traditional communities mainly increase the density of stops. Although the strategies of the two are different, they both effectively promote low-carbon travel. The influence of road network density (C18, q = 0.292) is relatively significant. A reasonable road network design can optimize traffic flow lines and reduce congestion emissions. Low-carbon communities have achieved higher emission-reduction benefits through the planning concept of “small blocks and dense road networks”, combined with the design of giving priority to slow traffic. Traditional communities have limited room for improvement due to the rigid road network structure. The non-motorized lane network density (C21, q = 0.233) shows moderate explanatory power, highlighting the importance of slow traffic. Low-carbon communities generally have continuous bicycle lanes and pedestrian systems, while the non-motorized vehicle lanes in traditional communities are often occupied or interrupted, greatly reducing their effectiveness. The explanatory power of rail transit density (C19, q = 0.111) is lower than expected, possibly due to (1) the rail transit network in Kunming still being improved and having insufficient coverage; and (2) low-carbon communities relying more on medium-capacity public transportation (such as BRT) for connection. (3) Traditional community residents still prefer motorized travel methods. The explanatory power of the green coverage rate (C17, q = 0.041) and land attribute carbon emission (C15, q = 0.034) is relatively weak. Although theoretically, green spaces and mixed land use can promote low-carbon development in practice, (1) traditional community greening is mainly for ornamental purposes, and its carbon sequestration benefits are limited. (2) The three-dimensional greening of low-carbon communities has not yet achieved a scale effect. (3) The degree of mixing of land-use functions in both types of communities has not reached the ideal state. Per capita carbon emissions (C16, q = 0.032) are regarded as an outcome indicator. Its low q value indicates that it is more suitable to be used as an evaluation indicator rather than a driving factor. GDP per capita (C23, q = 0.031) has a weak impact, breaking the conventional perception that “ the more developed the economy, the lower the carbon emissions”, indicating that (1) low-carbon development relies more on specific measures rather than economic levels; (2) some high-income groups still maintain a high-carbon lifestyle; and (3) the sharing economy model of low-carbon communities reduces the impact of income on carbon emissions. Building density (C24, q = 0.010) has the weakest influence, possibly because (1) the energy-saving benefits of high-density buildings are offset by the increase in energy demand, and (2) the popularization rate of low-carbon technology applications (such as building-integrated photovoltaics) is not high.

4.3. Analyzing the Coupling Coordination Degree Between Flood Resilience and Low-Carbon Development in Traditional and Low-Carbon Communities

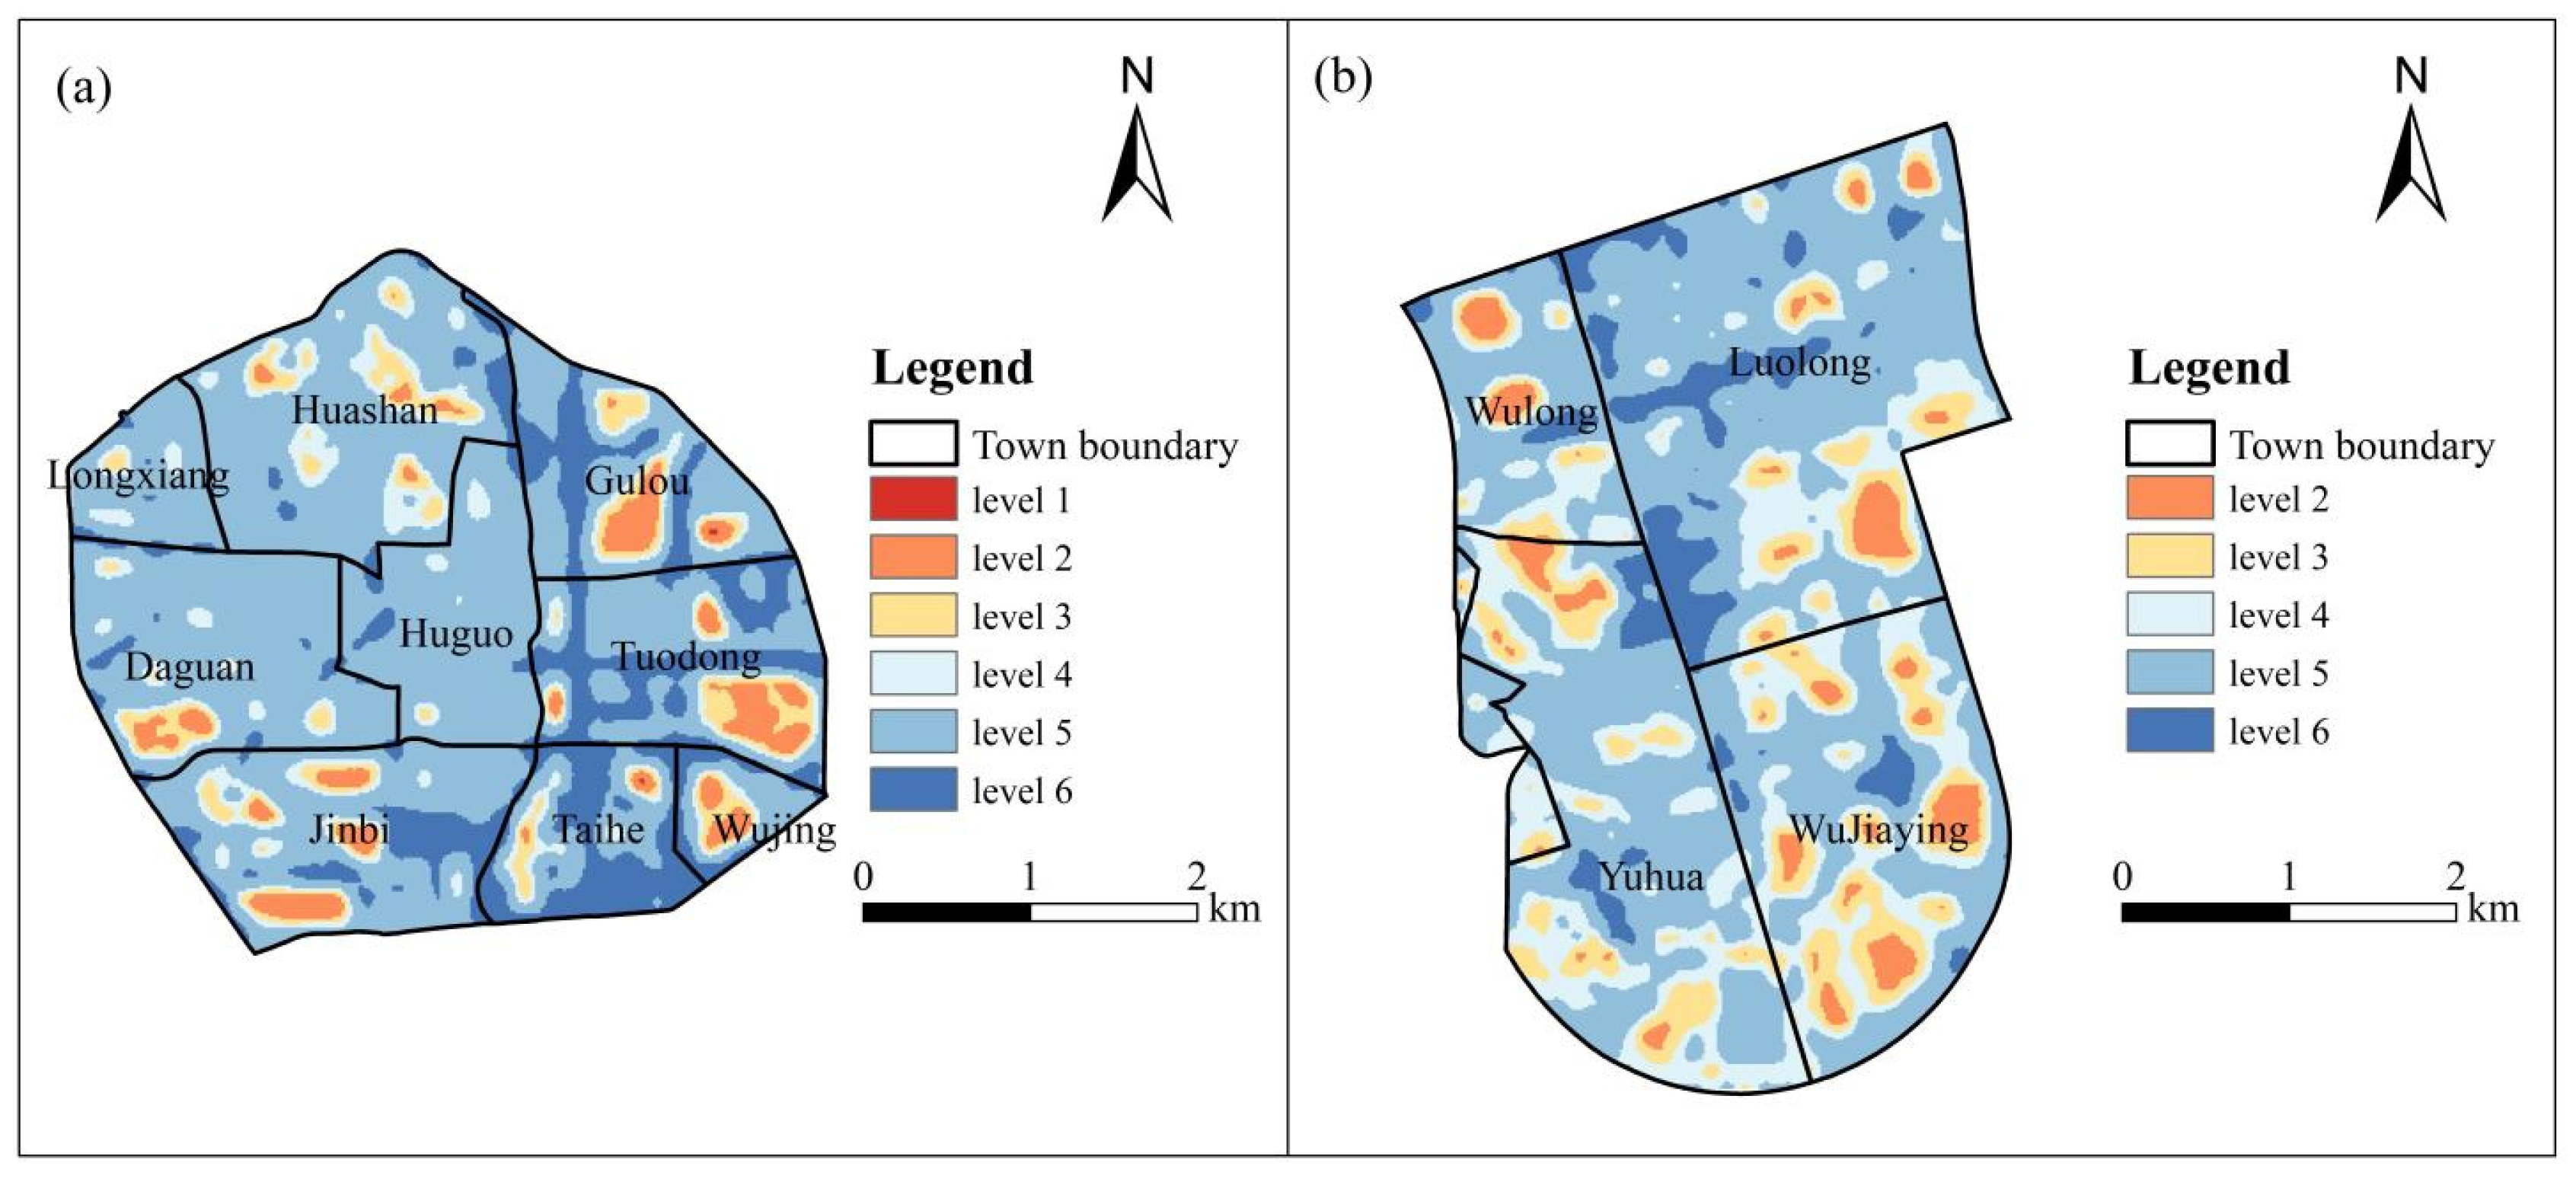
4.3.1. Spatial Differentiation Characteristics of Coupling Coordination Degree

To examine the spatial differentiation in coupling coordination between flood resilience and low-carbon development in traditional and low-carbon communities, we determined the coupling degree grade distribution based on calculation outcomes and classification criteria (Table 10). The spatial distribution of coupling coordination between these communities is illustrated in Figure 8, and a comparative analysis of the coordination levels appears in Figure 9. Table 5 indicates that, as of 2022, flood resilience and low-carbon development coupling in both community types is generally high, with 98.47% of cells achieving high coupling levels, including 12.76% of the cells displaying benign resonance coupling. Low-carbon communities exhibited slightly higher coupling degrees overall, with all cells at or above the run-in stage, though several cells in traditional communities remained at the antagonistic stage. Figure 8 and Figure 9 further show that traditional communities, on average, display higher coordination levels than low-carbon communities, with 65% and 54% of cells, respectively, at an intermediate coordination level. Highly coordinated traditional communities (18%) are primarily located in Taihe, Tuodong, and Gulou streets, whereas 9% of low-carbon communities are highly coordinated, concentrated in Luolong and Yuhua streets. Mildly and moderately dysfunctional cells comprise 10% and 17% of each community type, respectively, with no extreme dysfunction noted in low-carbon communities and only two cells exhibiting this in traditional communities. Overall, the coupling coordination of flood resilience and low-carbon development demonstrates a “high coupling, low coordination” trend, suggesting that, while low-carbon development enhances urban resilience to flood risks, reciprocal benefits to low-carbon objectives can also arise from improved resilience measures. The findings underscore the potential for achieving synergistic outcomes for urban sustainability and resilience goals by integrating flood resilience with low-carbon development, though further coordination improvements remain necessary in both community types to reach ideal levels.

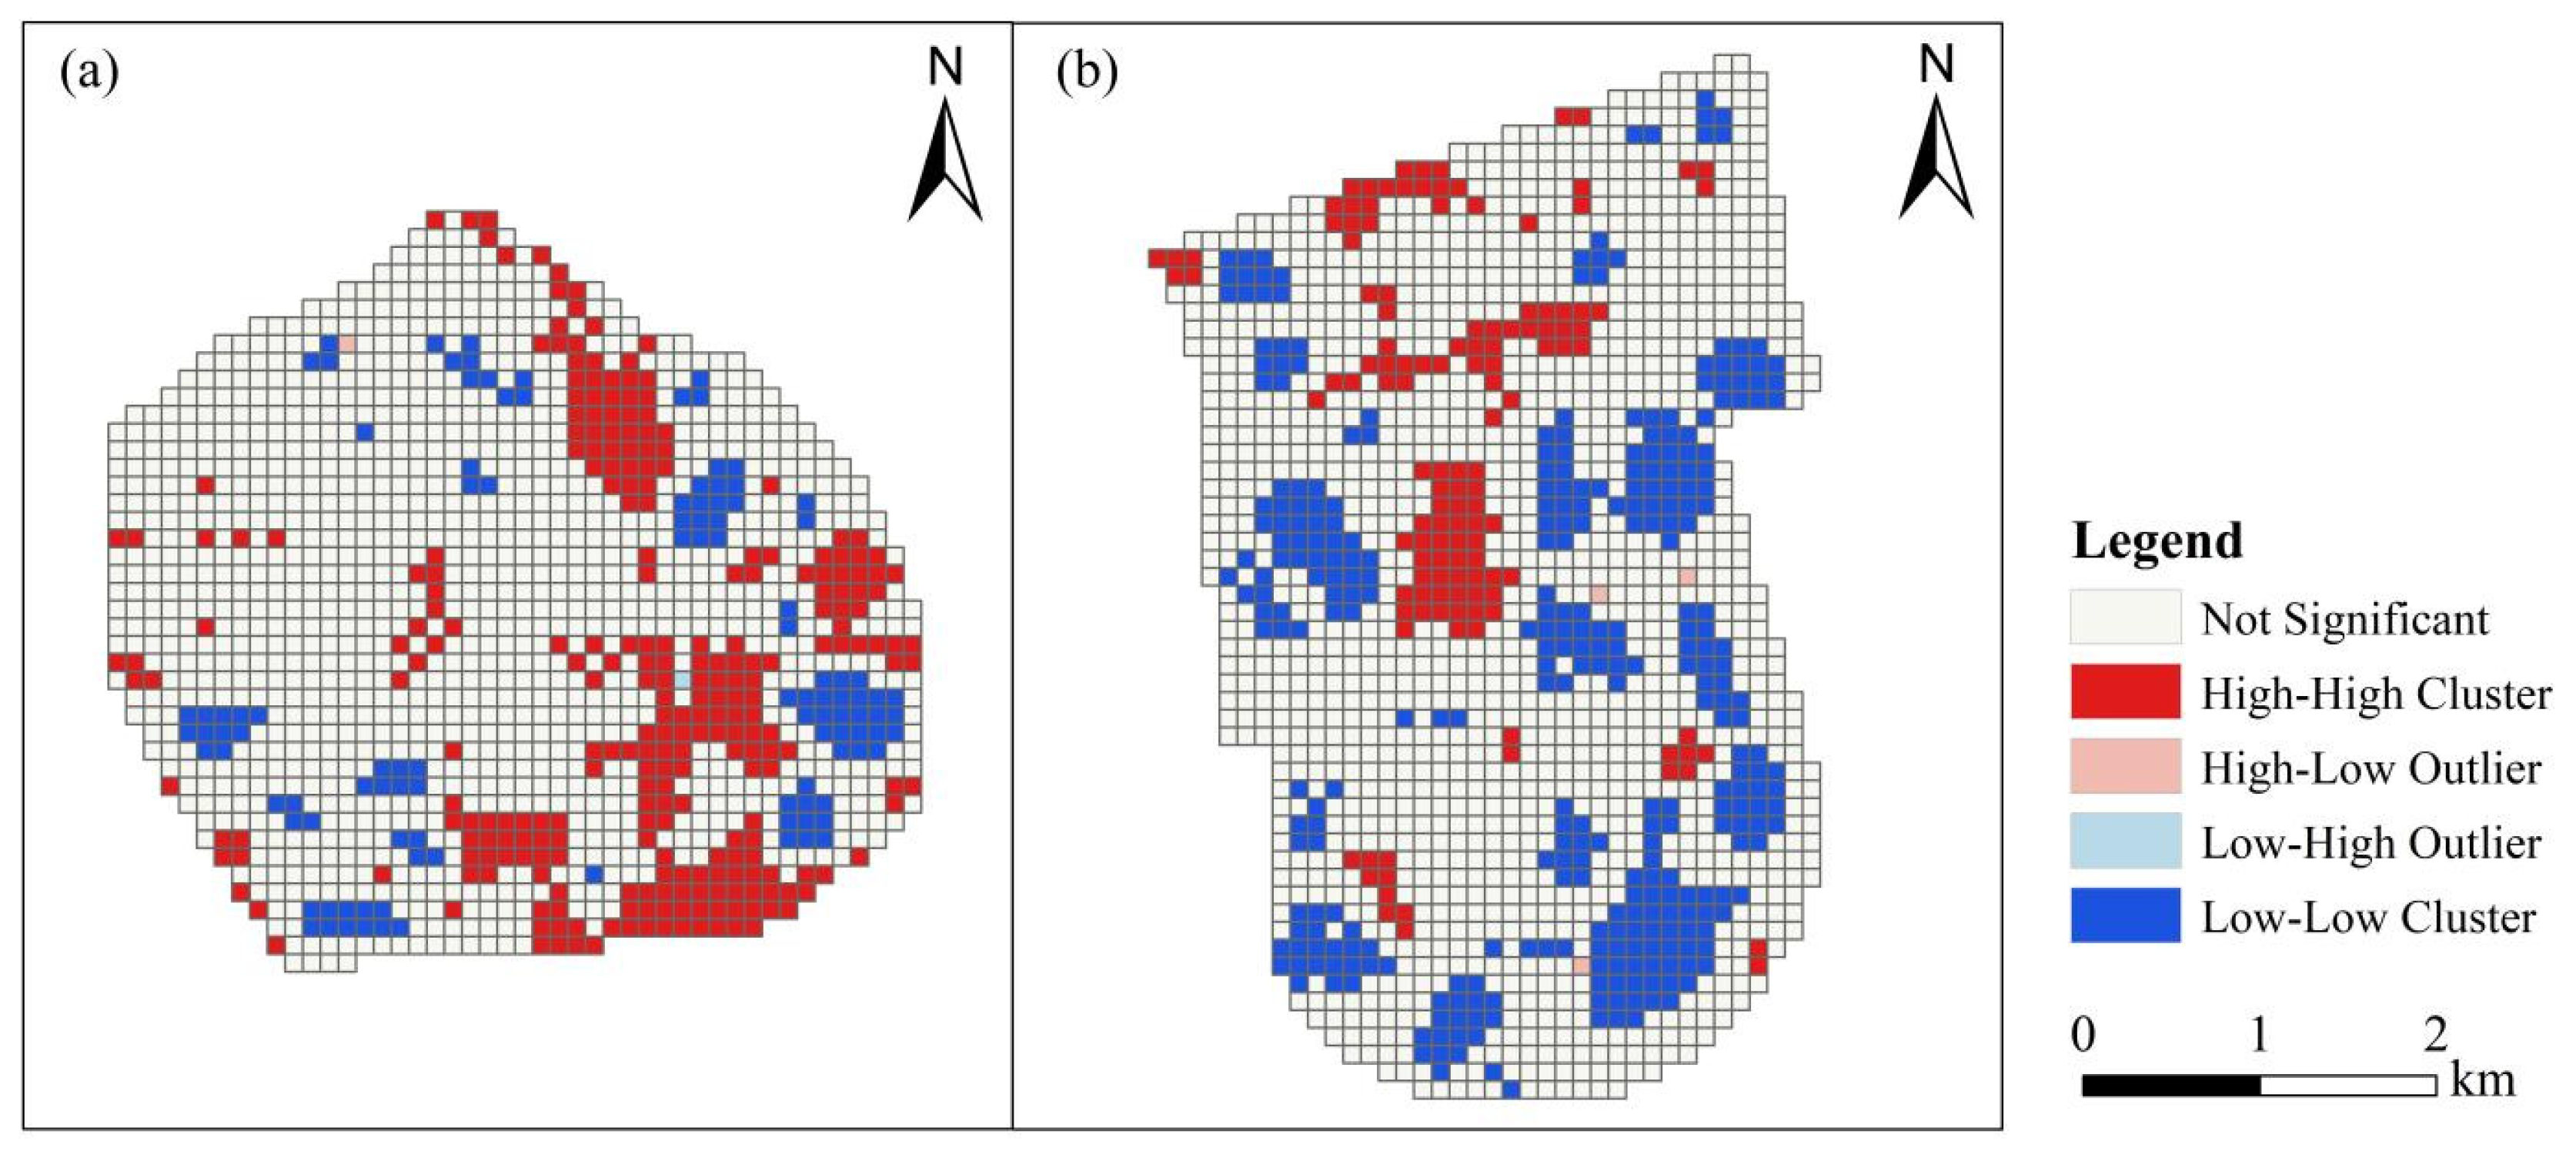
4.3.2. Analysis of Spatial Correlation Characteristics of Coupling Coordination Degree

The Global Moran’s I index, measuring the coupling coordination between flood resilience and low-carbon development, is 0.664, achieving significance at the 0.01 level. This result indicates a significant spatial dependence between flood resilience and low-carbon development in both traditional and low-carbon communities in Kunming, underscoring the spatial interdependence of these variables. ArcGIS10.7 software was used to generate a LISA cluster map depicting the coupled coordination between flood resilience and low-carbon development across the study area (Figure 10). As illustrated, the spatial clustering pattern can be categorized primarily into high–high and low–low clusters. High–high clusters represent areas where both the region and its neighboring areas exhibit high coupling coordination, forming spatially concentrated high-coupling clusters that act as growth poles for the coordinated development of both indicators. Traditional communities in high–high clusters are mainly located in Tuodong street, Gulou street, Taihe street, and Jinbi street, while low-carbon communities are concentrated in Wulong and Yuhua streets. Low-low clusters, on the other hand, indicate both regional and surrounding areas with low coupling coordination, exhibiting strong spatial autocorrelation at low values. Here, traditional communities are primarily distributed in Tuodong, Gulou, and Jinbi streets, whereas low-carbon communities are located mainly in Wulong, Wujiaying, and Luolong streets.

5. Conclusions and Suggestions

Urban low-carbon development and flood resilience are critical strategies for mitigating and adapting to climate change impacts. This study examines both traditional communities (TC) and low-carbon communities (LC) in Kunming, China, constructing separate evaluation frameworks for urban flood resilience and low-carbon development levels. Using these frameworks, we conduct a comparative analysis of flood resilience (UFR) and low-carbon development (ULC) across both community types. Additionally, a coupling coordination model is applied to assess the correlation between flood resilience and low-carbon development, revealing a coupling coordination mechanism between these two dimensions. The main findings are as follows:
First, flood resilience in Kunming’s traditional and low-carbon communities exhibits distinct spatial heterogeneity. While traditional communities show stronger overall flood resilience than low-carbon communities, resilience remains relatively low across both types. Traditional community resilience indices are predominantly within the 0.35–0.4 range, whereas low-carbon communities cluster between 0.15 and 0.2 and 0.3 and 0.35, suggesting a significant potential for resilience enhancement. The strengths and vulnerabilities in resilience differ. Low-carbon communities excel in natural environmental factors but lag behind traditional communities in socioeconomic development and infrastructure. Notably, the most influential factors contributing to flood resilience are the proportion of the rain and sewage diversion ratio, the medical service capability, and the rainwater pipe density. These findings underscore the need for tailored resilience strategies to address inter-community disparities and offer valuable insights for advancing resilient urban development.
Second, the low-carbon development levels of traditional and low-carbon communities exhibit distinct spatial heterogeneity. While traditional communities show a generally higher level of low-carbon development, low-carbon communities display fewer areas with very high low-carbon indices. The low-carbon development index in traditional communities is concentrated between 0.3 and 0.4, whereas in low-carbon communities, the index ranges mostly from 0.25 to 0.4, with a notable cluster between 0.1 and 0.25. This skewed distribution contributes to a lower overall low-carbon development level, indicating significant disparities within low-carbon communities. Although low-carbon communities demonstrate clear strengths in carbon emission reduction and sequestration, they lag behind traditional communities in sustainable transportation, as well as socio-economic development, highlighting the need for a more balanced approach to low-carbon strategies within these communities. Notably, the most influential factors driving low-carbon development are the charging pile service capability and the public transport station service capacity.
Third, both traditional and low-carbon communities exhibit “high coupling yet low coordination” between flood resilience and low-carbon development, underscoring a strong correlation and spatial dependence. While urban low-carbon initiatives and infrastructure development can significantly enhance resilience to flood risks and strengthen cities’ adaptive capacities, they also serve as drivers for sustainable, low-carbon urban progress. Nevertheless, the current low coordination level highlights that flood resilience and low-carbon advancement in Kunming communities—both traditional and low-carbon—have not yet achieved optimal integration. Considerable potential remains to further advance low-carbon, resilient urban systems in Kunming. This finding suggests that urban policymakers should strengthen the integrated planning and coordinated management of low-carbon development and flood resilience. Efforts should be made to shift their relationship from passive coupling to proactive synergy, thereby promoting higher-quality, sustainable urban development.
According to the research conclusions, this study puts forward the following countermeasures and suggestions.
First, the concept of resilience should be integrated into urban flood control planning by continuously enhancing the public safety infrastructure, establishing and refining a comprehensive emergency management system, and promoting overall urban flood resilience. Traditional and low-carbon communities should each develop targeted improvement strategies. Traditional communities often face challenges such as aging drainage systems, high impervious surface coverage, and inadequate emergency infrastructure. Efforts should focus on promoting the separation of rainwater and sewage systems, systematically renovating and maintaining underground drainage networks, and improving flood discharge capacity during the rainy season. Additionally, the layout of public spaces should be optimized, and emergency shelters and rainwater storage facilities should be added based on local conditions. Government-led mechanisms for emergency response and resource allocation should also be strengthened. In contrast, although low-carbon communities benefit from ecological advantages, they often lack strong social organization and adequate infrastructure. Emphasis should be placed on developing community-based risk identification and response mechanisms, promoting the integration of green infrastructure (e.g., sunken green spaces, rain gardens, and ecological reservoirs) with conventional drainage systems and enhancing their capacity for autonomous disaster prevention and rapid recovery.
Second, based on each community’s development stage and existing conditions, tailored guidance and phased improvements should be implemented to increase investment in low-carbon community development and to optimize development models. In traditional communities, efforts should focus on promoting energy-efficient building renovations, upgrading lighting and equipment to low-carbon systems, introducing clean energy sources, and constructing distributed energy stations. Simultaneously, improvements should be made to green public service systems, such as waste-sorting facilities and green transport networks, to facilitate the green transformation of old communities. For low-carbon communities, building on existing ecological advantages, the social and economic structure should be optimized, employment density and service support levels should be increased, and low-carbon synergy efficiency should be improved. Additionally, targeted efforts should address the relatively low levels of low-carbon development in certain areas of low-carbon communities, improve public resource allocation efficiency in vulnerable zones, and promote balanced and inclusive low-carbon development across the region.
Finally, a supportive policy and practical framework for the coupling and coordination of the two community types should be established and improved to promote the transformation of urban management from a single-objective approach to one characterized by integrated and collaborative governance. In traditional communities, priority should be given to promoting pilot projects that integrate low-carbon development and flood control, and the construction of sponge city infrastructure and energy-saving, emission-reduction initiatives should be advanced in a coordinated manner. A resource integration mechanism based on the principle of “promoting construction through transformation” may also be explored. In the development of low-carbon communities, a collaborative governance system combining low-carbon strategies with disaster prevention should be established, along with a linkage mechanism encompassing carbon emission monitoring, early warning of urban flooding risks, and emergency response. Moreover, it is recommended to establish a comprehensive evaluation index system tailored to different community types to dynamically assess their performance in low-carbon development and resilience enhancement, thereby guiding targeted resource allocation and policy support. Additionally, public participation and community collaboration mechanisms should be strengthened to enhance residents’ awareness and acceptance of the concept of “low-carbon resilient communities,” foster positive interactions between resident behavior and community governance, and support a shift in governance philosophy from external promotion to internal motivation.

6. Limitations

This study recognizes certain limitations in developing the evaluation index system, as data availability constrained indicator selection, leading to the omission of some relevant metrics. Future research should aim to expand the data sources to improve the comprehensiveness of the evaluation index, thereby enhancing the measurement accuracy for urban flood resilience, low-carbon development, and their integrated advancement. This study employs only an objective weighting method. While this approach reduces subjective bias, it may overlook important subjective factors, such as expert judgment and policy orientation, which could influence the explanatory power of the results. In future research, a comprehensive weighting method that integrates both subjective and objective factors could be adopted to improve the scientific rigor and practical applicability of the indicator system. Furthermore, as this study focuses solely on two communities in Kunming, broader investigations are necessary to determine the generalizability of these findings across diverse urban contexts. The convergence of low-carbon development and flood resilience is increasingly crucial for synergistic climate change mitigation and adaptation. Continued research is needed to identify strategies that effectively align these domains for optimized urban sustainability outcomes.

Author Contributions

All authors contributed to the study conception and design. Z.Z.: Writing—original, Formal analysis, Conceptualization, Methodology, Validation, Software, Data Curation, Visualization, Investigation. D.Z.: Supervision, Methodology, Funding acquisition. L.Z.: Methodology. Z.X.: Conceptualization, Supervision, Methodology, Funding acquisition, Writing—review and editing. W.C.: Investigation. Q.Y.: Investigation. J.W.: Data Curation. Z.Y.: Methodology. Y.L. (Yifei Liu): Methodology. Y.L. (Yufei Li): Data Curation. P.W.: Resources. S.B.: Resources. S.Z.: Resources. All authors have read and agreed to the published version of the manuscript.

Funding

This research was made possible through the generous support of several grants: Yunnan Fundamental Research Projects (Grant No. 202401BF070001-026), National Natural Science Foundation of China (Grant No. 72361035), Yunnan Graduate Tutor Team project (2024), Yunnan Province Industry Education Integration Postgraduate Joint Training Base Project (2022), Science and Technology Plan Project of Yunnan Provincial Department of Housing and Urban–Rural Development (Grant No. K00000135), and The Key Project of Educational and Teaching Reform Research of Yunnan University (2024).

Data Availability Statement

The data presented in this study are available upon request from the corresponding author because some of the datasets used in this article are state secrets and cannot be made public.

Acknowledgments

We would like to express our gratitude to Kunming Engineering Corporation Limited and the Surveying and Mapping Engineering Institute of Yunnan Province for their support during the writing of this paper. During the preparation of this work, the author(s) used ChatGPT4.0 in order to improve the language and readability. After using this tool/service, the author(s) reviewed and edited the content as needed and take(s) full responsibility for the content of the published article.

Conflicts of Interest

Author Ping Wen was employed by the company Kunming Engineering Corporation Limited, author Sidong Zhao was employed by the company Kunming Drainage Facility Management Co., Ltd. The remaining authors declare that the research was conducted in the absence of any commercial or financial relationships that could be construed as a potential conflict of interest.

References

  1. IPCC. Climate Change 2014: Mitigation of Climate Change; Cambridge University Press: Cambridge, UK, 2014. [Google Scholar]
  2. Allen, M.R.; Ingram, W.J. Constraints on future changes in climate and the hydrologic cycle. Nature 2002, 419, 228–232. [Google Scholar] [CrossRef] [PubMed]
  3. Fischer, E.M.; Knutti, R. Anthropogenic contribution to global occurrence of heavy-precipitation and high-temperature extremes. Nat. Clim. Change 2015, 5, 560–564. [Google Scholar] [CrossRef]
  4. Luo, Y.H.; Du, Y. The roles of low-level jets in “21·7” Henan extremely persistent heavy rainfall event. Adv. Atmos. Sci. 2023, 40, 350–373. [Google Scholar] [CrossRef]
  5. Yang, X.L.; Jin, X.Q.; Sun, Y.; Chen, B.; Liang, T.; Yang, M.; Yan, X.; Li, J. Characteristics and causes of the “23·7” rare heavy rain at the eastern foot of Taihang Mountain in Hebei province. Meteorol. J. 2023, 49, 1451–1467. [Google Scholar]
  6. Ma, H. One More Degree of News|Urban Flooding, Factory Shutdowns. How Serious Is the Flood Situation in Pingjiang? The Beijing News, 3 July 2023. Available online: https://www.bjnews.com.cn/detail/1719999024129733.html (accessed on 4 May 2024).
  7. Deng, Z.; Gao, W.; Liao, Y.; Wang, Z.-L. Research progress on the impact of climate change on urban rainstorms and floods. J. North China Univ. Water Resour. Electr. Power (Nat. Sci. Ed.) 2024, 45, 1–14. [Google Scholar]
  8. Qin, J. Study on flood adaptation Strategy of national spatial planning in response to climate change. Planners 2023, 39, 30–37. [Google Scholar]
  9. Wu, Y.J.; Ma, B. City of wisdom and resilience: Foreign experience and reference. Strategy Manag. 2016. Available online: https://www.cssm.org.cn/view.php?id=33200 (accessed on 24 June 2025).
  10. UNISDR. Global Assessment Report on Disaster Risk Reduction 2019; United Nations: New York, NY, USA, 2019. [Google Scholar]
  11. Zhang, J.; Luo, Q.; Wang, B.; Li, R. Research progress and prospect on causes and countermeasures of urban extreme rainstorm floods. Water Resour. Prot. 2024, 40, 6–15. [Google Scholar]
  12. Wang, K.; Zhang, H.; Li, G.; Zhang, C.; Wang, H.; Mu, J.; Wang, G. Review on research progress and key supporting technologies of urban flood resilience. Water Resour. Hydropower Technol. (Engl. Chin.) 2023, 54, 77–88. [Google Scholar]
  13. Zhang, J.; Wang, Y.; He, R.; Hu, Q.; Song, X. Urban flooding and its causes in China. Adv. Water Sci. 2016, 27, 485–491. [Google Scholar]
  14. Zhang, D.; Yan, D.; Wang, Y.; Lu, F.; Liu, S. Research progress of urban waterlogging disaster risk assessment and comprehensive response. Catastrophology 2014, 29, 144–149. [Google Scholar]
  15. Oladokun, V.O.; Proverbs, D.G.; Lamond, J. Measuring flood resilience: A fuzzy logic approach. Int. J. Build. Pathol. Adapt. 2017, 35, 470–487. [Google Scholar] [CrossRef]
  16. Karamouz, M.; Taheri, M.; Khalili, P.; Chen, X. Building infrastructure resilience in coastal flood risk management. J. Water Resour. Plan. Manag. 2019, 145, 04019004. [Google Scholar] [CrossRef]
  17. Simonovic, S.P.; Peck, A. Resilience to climate change-caused flooding—Metro vancouver case study. River 2022, 1, 47–59. [Google Scholar] [CrossRef]
  18. Miguez, M.G.; Verl, A.P. A catchment scale Integrated Flood Resilience Index to support decision making in urban flood control. Environ. Plan. B Urban Anal. City Sci. 2017, 44, 925–946. [Google Scholar] [CrossRef]
  19. Bertilsson, L.; Wiklund, K.; De Tebaldi, I.M.; Rezende, O.M.; Veról, A.P.; Miguez, M.G. Urban flood resilience: A multicriteria index to integrate flood resilience into urban planning. J. Hydrol. 2019, 573, 970–982. [Google Scholar] [CrossRef]
  20. Singh, P.; Sinha, V.; Vijhani, A.; Pahuja, N. Vulnerability Assessment of urban road network from urban flood. Int. J. Disaster Risk Reduct. 2018, 28, 237–250. [Google Scholar] [CrossRef]
  21. Moghadas, M.; Asadzadeh, A.; Vafeidis, A.; Fekete, A.; Kötter, T. A multi-criteria approach for assessing urban flood resilience in Tehran, Iran. Int. J. Disaster Risk Reduct. 2019, 35, 101069. [Google Scholar] [CrossRef]
  22. Cutter, S.L.; Burton, C.G.; Emrch, C.T. Disaster resilience indicators for benchmarking baseline conditions. J. Homel. Secur. Emerg. Manag. 2010, 7, 1–22. [Google Scholar] [CrossRef]
  23. Liu, C.; Shang, S.; Zhao, Q.; Xie, H. Evaluation of resilience after flood disaster in Hunan Province based on GIS and TOPSIS-PSR. Hydropower Energy Sci. 2018, 36, 70–73. [Google Scholar]
  24. The Compilation Committee of the Fourth National Assessment Report on Climate Change. The Fourth National Assessment Report on Climate Change; Science Press: Beijing, China, 2022; pp. 3–435.
  25. Zhou, Q.; Leng, G.; Huang, M. Impacts of future climate change on urban flood volumes in Hohhot in northern china: Benefits of climate change mitigation and adaptations. Hydrol. Earth Syst. Sci. 2018, 22, 305–316. [Google Scholar] [CrossRef]
  26. Hurlimann, A.; Moosavi, S.; Browne, G.R. Urban planning policy must do more to integrate climate change adaptation and mitigation actions. Land Use Policy 2021, 101, 105188. [Google Scholar] [CrossRef]
  27. Li, F.; Wang, L.; Zhao, Y. Evolvement rules of basin flood risk under low-carbon mode. Part II: Risk assessment of flood disaster under different land use patterns in the Haihe basin. Environ. Monit. Assess 2017, 189, 397. [Google Scholar] [CrossRef]
  28. Nakamichi, K.; Yamagata, Y.; Seya, H. An Integrated Model for Assessing Carbon Dioxide Emissions Considering Climate Change Mitigation and Flood Risk Adaptation Interaction. In Monitoring and Modeling of Global Changes: A Geomatics Perspective. Springer Remote Sensing/Photogrammetry; Li, J., Yang, X., Eds.; Springer: Dordrecht, The Netherlands, 2015. [Google Scholar]
  29. Yang, W.; Zhang, J.; Krebs, P. Investigating flood exposure induced socioeconomic risk and mitigation strategy under climate change and urbanization at a city scale. J. Clean. Prod. 2023, 387, 135929. [Google Scholar] [CrossRef]
  30. Guo, X.; Li, J.; Wu, X.; Liu, H. Study on coupling coordination and influencing factors between urban resilience and low-carbon development in Henan Province. Yellow River 2019, 46, 1–6, 37. [Google Scholar]
  31. Vorobyev, S.N.; Kolesnichenko, Y.; Karlsson, J.; Pokrovsky, O.S. Carbon emission from the Lower Ob River floodplain during spring flood. Sci. Total Environ. 2024, 954, 176294. [Google Scholar] [CrossRef]
  32. Wang, T.; Deng, Z.; Zhang, C.; Zou, Y.; Xie, Y.; Li, F.; Xiao, F.; Peng, C. Vegetation types and flood water level are dominant factors controlling the carbon sequestration potential in Dongting Lake floodplain, China. Sci. Total Environ. 2024, 921, 171146. [Google Scholar] [CrossRef]
  33. Zhang, Z.; Zhu, J.; Yang, L.; Chen, L. Booster or inhibitor: Diagnosing effects of low-carbon pilot city policies on urban resilience from the perspectives of heterogeneity, mechanisms and spillover. J. Clean. Prod. 2024, 474, 143587. [Google Scholar] [CrossRef]
  34. Younesi, A.; Wang, Z.; Siano, P. Enhancing the resilience of zero-carbon energy communities: Leveraging network reconfiguration and effective load carrying capability quantification. J. Clean. Prod. 2024, 434, 139794. [Google Scholar] [CrossRef]
  35. Xu, C.; Huo, X.; Hong, Y.; Yu, C.; de Jong, M.; Cheng, B. How urban greening policy affects urban ecological resilience: Quasi-natural experimental evidence from three megacity clusters in China. J. Clean. Prod. 2024, 452, 142223. [Google Scholar] [CrossRef]
  36. Zhao, L.; Zhang, C.; Wang, Q.; Yang, C.; Suo, X.; Zhang, Q. Climate extremes and land use carbon emissions: Insight from the perspective of sustainable land use in the eastern coast of China. J. Clean. Prod. 2024, 452, 142219. [Google Scholar] [CrossRef]
  37. Marta, B.G.; Maria, D.B.; Maria, J.R. Sustainability on the urban scale: Proposal of astructure of indicators for the Spanish context. Environ. Impact Assess. Rev. 2015, 53, 16–30. [Google Scholar]
  38. Tan, S.; Yang, J.; Yan, J.Y.; Lee, C.; Hashim, H.; Chen, B. A holisticlow carbon cityindicator framework forsustainable development. Appl. Energy 2016, 185, 1919–1930. [Google Scholar] [CrossRef]
  39. Lu, Y.; Zhai, G. International experience and implications of low-carbon resilient city construction under the dual carbon goal. Sci. Technol. Rev. 2022, 40, 56–66. [Google Scholar]
  40. Zheng, Y.; Wang, W.; Pan, J. Low-carbon Resilient City: Concept, Approach and Policy Choice. Urban Dev. Res. 2013, 20, 10–14. [Google Scholar]
  41. Wu, Y.; Yan, H.; Shi, Z.; Shu, K. Research on the Response of Heavy Precipitation in Kunming to Urbanization and Thermal Environment Changes. Prog. Clim. Change Res. 2023, 19, 723–737. [Google Scholar]
  42. He, Y.; Lu, Z. Analysis of Climate Change Characteristics in Kunming City in the Past 60 Years. Sci. Geogr. Sin. 2012, 32, 1119–1124. [Google Scholar]
  43. Fu, Y. Research on the Optimization of Flood Prevention and Control System in Kunming from the Perspective of Resilient Cities. Master’s Thesis, Yunnan Normal University, Kunming, China, 2020. [Google Scholar]
  44. Zou, J.; Liu, Z. Analysis of rainstorm flood characteristics in Kunming. Hydropower Energy Sci. 2013, 31, 42–45+187. [Google Scholar]
  45. GB/T40947-2021; Guide for Safety Resilient City Evaluation. The State Administration for Market Regulation and the Standardization Administration of China: Beijing, China, 2021.
  46. SZDB/Z 310-2018; Evaluation Guide for Low-Carbon Communities. Shenzhen Market Supervision and Administration Bureau: Shenzhen, China, 2018.
  47. Wang, P.; Li, Y.; Zhang, Y. An urban system perspective on urban flood resilience using SEM: Evidence from Nanjing city, China. Nat. Hazards 2021, 109, 2575–2599. [Google Scholar] [CrossRef]
  48. Yan, X. Comprehensive Evaluation and Influencing Factors of Low-Carbon Development Level in the Hohhot-Baotou-Erdos-Yulin Urban Agglomeration. Master’s Thesis, Inner Mongolia University of Science and Technology, Baotou, China, 2023. [Google Scholar]
  49. Chen, Z.; Wan, S.; Li, X.; Dong, Y.; Li, G. Spatial and temporal evolution and driving factors of urban flood resilience in Hubei Province. China Rural. Water Resour. Hydropower 2024, 6, 21–30. [Google Scholar]
  50. Fu, X.; Liu, Y.; Xie, Z.; Jiang, F.; Xu, J.; Yang, Z.; Deng, Z.; Wang, Q.; Liao, M.; Wu, X.; et al. A coupled PSR-based framework for holistic modeling and flood resilience assessment: A case study of the 2022 flood events in five southern provinces of China. J. Hydrol. 2024, 636, 131255. [Google Scholar] [CrossRef]
  51. Meng, X.; Chen, X.; Chen, J.; Yang, H. Application of combinatorial empowerment-TOPSIS in urban regional resilience assessment under flood disaster. J. Saf. Environ. 2023, 23, 1465–1473. [Google Scholar]
  52. Xu, W.; Yu, Q.; Proverbs, D. Evaluation of Factors Found to Influence Urban Flood Resilience in China. Water 2023, 15, 1887. [Google Scholar] [CrossRef]
  53. Jiang, F.; Xie, Z.; Xu, J.; Yang, S.; Zheng, D.; Liang, Y.; Hou, Z.; Wang, J. Spatial and component analysis of urban flood Resiliency of kunming city in China. Int. J. Disaster Risk Reduct. 2023, 93, 103759. [Google Scholar] [CrossRef]
  54. Zhang, L.; Wang, P. Analysis on the Change Characteristics of the Correlation between Land Use Structure and Energy Consumption and Carbon Emissions in Kunming from 1997 to 2017. J. Geosci. Environ. Prot. 2021, 9, 155–166. [Google Scholar] [CrossRef]
  55. T/GDDTJS 06-2022; Guidance on Zero-Carbon Community Construciton and Evaluation. Guangdong Low-Carbon Industry Technology Association: Guangzhou, China, 2022.
  56. Zhu, J.; Liu, X.; Zhang, Y. Construction of evaluation index system for low-carbon city construction in China. Ecol. Econ. 2017, 33, 52–56. [Google Scholar]
  57. Sun, Q.; Wu, Q.; Li, S.; Li, X. Estimation of urban low-carbon development performance index. Stat. Decis. 2021, 37, 75–79. [Google Scholar]
  58. Chen, J.; Gao, C.; Zhou, H.; Wang, Q.; She, L.; Qing, D.; Cao, C. Urban Flood Risk Assessment Based on a Combination of Subjective and Objective Multi-Weight Methods. Appl. Sci. 2024, 14, 3694. [Google Scholar] [CrossRef]
  59. Zhang, Z.; Zhang, J.; Zhang, Y.; Chen, Y.; Yan, J. Urban Flood Resilience Evaluation Based on GIS and Multi-Source Data: A Case Study of Changchun City. Remote Sens. 2023, 15, 1872. [Google Scholar] [CrossRef]
  60. Song, J.Y.; Chung, E.S. Robustness, Uncertainty and Sensitivity Analyses of the TOPSIS Method for Quantitative Climate Change Vulnerability: A Case Study of Flood Damage. Water Resour. Manag. 2016, 30, 4751–4771. [Google Scholar] [CrossRef]
  61. Wang, J.F.; Xu, C.D. Geographic Detector: Principle and prospective. Acta Geogr. Sin. 2017, 72, 116–134. [Google Scholar]
  62. Li, N.Q.; Xu, G.Y. Grid analysis of land use based on natural breaks (jenks) classification. Bull. Surv. Mapp. 2020, 4, 106–110+156. [Google Scholar]
  63. Lei, D.; Xu, X.; Zhang, Y. Analysis of the dynamic characteristics of the coupling relationship between urbanization and environment in Kunming City, Southwest China. Clean. Environ. Syst. 2021, 2, 100018. [Google Scholar] [CrossRef]
  64. Han, S.; Wang, B.; Ao, Y.; Bahmani, H.; Chai, B. The coupling and coordination degree of urban resilience system: A case study of the Chengdu–Chongqing urban agglomeration. Environ. Impact Assess. Rev. 2023, 101, 107145. [Google Scholar] [CrossRef]
  65. Ding, Y.; Wang, H.; Liu, Y.; Chai, B.; Bin, C. The spatial overlay effect of urban waterlogging risk and land use value. Sci. Total Environ. 2024, 947, 174290. [Google Scholar] [CrossRef]
  66. Zhang, Z.; Dai, X.; Xie, Z.; Yu, C.; Liao, Z.; Li, J.; Jiang, F.; Liu, Y.; Liu, Z.; Zhang, Q.; et al. Spatiotemporal Variation Characteristics and Influencing Factors of Air Quality in Sichuan-Chongqing Region, China, 2016–2020. Environ. Earth Sci. 2025, 84, 115. [Google Scholar] [CrossRef]
Figure 1. (a) Location of the area region; (b) traditional community; (c) low-carbon community. (1: transportation land; 2: residential areas; 3: public service land; 4: developed construction land; 5: unused land; 6: forested areas; 7: water bodies; 8: agricultural land; 9 grassland).
Land 14 01368 g001
Figure 2. Overview of research frame.
Land 14 01368 g002
Figure 3. Spatial distribution of flood resilience index in traditional community (a) and low-carbon community (b).
Land 14 01368 g003
Figure 4. Flood resilience index of traditional community and low-carbon community.
Land 14 01368 g004
Figure 5. Flood resilience (a,b) and low-carbon development level (c,d) index of each dimension in traditional community and low-carbon community.
Land 14 01368 g005
Figure 6. Spatial distribution of low-carbon development index in traditional community (a) and low-carbon community (b).
Land 14 01368 g006
Figure 7. Low-carbon development level index of traditional community and low-carbon community.
Land 14 01368 g007
Figure 8. Spatial distribution of coupling coordination degree between flood resilience and low-carbon development in traditional community (a) and low-carbon community (b).
Land 14 01368 g008
Figure 9. Comparison of coupling coordination levels of community flood resilience and low-carbon development.
Land 14 01368 g009
Figure 10. LISA cluster diagram of coupling coordination between traditional community (a) and low-carbon community (b).
Land 14 01368 g010
Table 1. List of data required for this study.
DataSpatial ResolutionYearScope or QuantitySources
Administrative division-2022Kunming CityResource and
Environment Science
and Data Center
GDP1 km2020Yunnan Province
Population density100 m2020Yunnan ProvinceWorld population
DEM30 m2009Kunming CityASTER GDEM 30M
Land use type-2022Kunming CityThe Third National Land Survey
POI dataCharging pile-202354Amap Data collection technology
Bus stop-2023258
Hospital-202325
Financial services-2023225
Cultural and sports venues-202385
Emergency shelter-202330
Carbon emission-2021Kunming CityCarbon emission data of each prefecture-level city in China
Road network-2021Kunming CityKunming Institute of Surveying and Mapping
Drainage pipeline-2021Kunming City
Architectural outline-2021Kunming City
Regulating reservoir-2021Kunming City
Rail transit lines-2023Kunming CityOpen-source maps
Table 2. Evaluation index system of flood resilience.
DimensionIndicator LayerDescriptionAttributeSource
Natural environment
B1
Green coverage rate C1Vegetation can trap rainwater, promote infiltration, reduce surface runoff, and lower the risk of urban flooding.Positive[47]
Slope C2Steep slopes accelerate the accumulation of rainwater in low-lying areas, which can easily lead to overloading of the downstream drainage system.Negative[49]
Water area C3Lakes and rivers can store floodwater and alleviate the impact of heavy rain.Positive[23]
Impervious ground area ratio C4Hardening the ground hinders rainwater infiltration and increases surface runoff.Negative[50]
Community vulnerability and services
B2
GDP per capita C5Cities with a high economic level are more capable of investing in flood control facilities.Positive[50,51]
Population density C6High-density areas are prone to waterlogging due to overloading of the drainage system, and post-disaster evacuation is difficult.Negative[49]
Medical service capability C7The higher the coverage rate of hospitals and clinics is, the stronger the post-disaster medical rescue capacity will be.Positive[52]
Financial services capability C8Banks and insurance institutions can provide post-disaster financial support to accelerate recovery.Positive[45,53]
Service ability of large sports venues C9Stadiums and the like can be used as temporary shelters to enhance emergency response capabilities.Positive[45]
Infrastructure
B3
Per capita road area C10The road network affects the drainage efficiency and rescue passage capacity.Positive[51,52]
Rainwater pipe density C11The denser the pipe network is, the stronger the drainage capacity will be.Positive[47]
Rain and sewage diversion ratio C12The diversion system can prevent overflow pollution and drainage blockage in the combined sewer system.PositiveNew indicator
Regulating reservoir service capacity C13The reservoir can temporarily store rainwater and reduce the peak flood flow.Positive[23,53]
Emergency shelter service capacity C14Shelters can reduce casualties during disasters.Positive[45]
Table 3. Evaluation index system of low-carbon development level.
DimensionIndicator LayerDescriptionAttributeSource
Carbon emissions and absorption
B4
Land attribute carbon emission C15The carbon emission intensities of different land-use types vary significantly.Negative[54]
Carbon emissions per capita C16It directly reflects the carbon footprint of residents’ lives and economic activities.Negative[46,55]
Green coverage C17Vegetation sequesters carbon through photosynthesis and is an important natural carbon sink.Positive[56,57]
Sustainable transportation
B5
Road network density C18It affects traffic efficiency and the choice of travel methods.Positive[55]
Rail transit density C19High-capacity public transportation can significantly reduce per capita transportation carbon emissions.Positive[56]
Charging station service capability C20Support the popularization of new energy vehicles and replace fuel vehicles.Positive[46,55]
Non-motorized lane network density C21Promote zero-carbon travel, such as walking and cycling.Positive[55]
Public transport station service capacity C22Improve public transportation accessibility and reduce reliance on private cars.Positive[46]
Socio-economic conditions
B6
GDP per capita C23The economic level affects the ability to apply low-carbon technologies.Positive[48]
Building density C24It affects energy utilization efficiency and the heat island effect.Negative[57]
Table 6. Coupling coordination degree grade division standard.
Coupling Coordination
Degree D
Coordination
Level
Type of Coupling Coordination
0–0.2level 1Extreme dysregulation
0.2–0.4level 2Moderate dysregulation
0.4–0.5level 3Mild dysregulation
0.5–0.6level 4Elementary Coordination
0.6–0.8level 5Intermediate Coordination
0.8–1.0level 6High Coordination
Table 7. Coupling degree grade division standard.
Coupling Degree CCoupling GradeType of Coupling
0level 1No coupling
0–0.3level 2Low-level coupling
0.3–0.5level 3Antagonistic stage
0.5–0.8level 4Run-in stage
0.8–1.0level 5High-level coupling
1level 6Benign resonant coupling
Table 8. Factor detector results of flood resilience.
NumberTypeFactorq Statisticp Value
C1Natural environmentGreen coverage rate0.026 0.000
C2Slope0.027 0.000
C3Water area0.027 0.120
C4Impervious ground area ratio0.024 0.000
C5Socio-economic conditionsGDP per capita0.050 0.000
C6Population density0.130 0.000
C7Medical service capability0.360 0.000
C8Financial services capability0.253 0.000
C9Service ability of large sports venues0.120 0.000
C10InfrastructurePer capita road area0.213 0.000
C11Rainwater pipe density0.358 0.000
C12Rain and sewage diversion ratio0.415 0.000
C13Regulating reservoir service capacity0.099 0.000
C14Emergency shelter service capacity0.171 0.000
Table 9. Factor detector results of low-carbon development level.
NumberTypeFactorq Statisticp Value
C15Carbon emissions and absorptionLand attribute carbon emission0.034 0.000
C16Carbon emissions per capita0.032 0.000
C17Green coverage0.041 0.000
C18Sustainable transportationRoad network density0.292 0.000
C19Rail transit density0.111 0.000
C20Charging pile service capability0.444 0.000
C21Non-motorized lane network density0.233 0.000
C22Public transport station service capacity0.433 0.000
C23Socio-economic conditionsGDP per capita0.031 0.000
C24Building density0.010 0.025
Table 10. Analysis of coupling degree between flood resilience and low-carbon development.
Coupling LevelLevel 1Level 2Level 3Level 4Level 5Level 6
TC003261243210
LC000191438189
proportion0.00%0.00%0.10%1.44%85.71%12.76%
Disclaimer/Publisher’s Note: The statements, opinions and data contained in all publications are solely those of the individual author(s) and contributor(s) and not of MDPI and/or the editor(s). MDPI and/or the editor(s) disclaim responsibility for any injury to people or property resulting from any ideas, methods, instructions or products referred to in the content.

